Article

Estimation of Glacier Outline and Volume Changes in the Vilcanota Range Snow-Capped Mountains, Peru, Using Temporal Series of Landsat and a Combination of Satellite Radar and Aerial LIDAR Images

by
Nilton Montoya-Jara
1,
Hildo Loayza
2,3,*,
Raymundo Oscar Gutiérrez-Rosales
4,
Marcelo Bueno
1 and
Roberto Quiroz
5
1
Facultad de Agronomía y Zootecnia, Escuela Profesional de Agronomía, Universidad Nacional San Antonio Abad del Cusco (UNSAAC), Cusco 08003, Peru
2
International Potato Center (CIP), Headquarters P.O. Box 1558, Lima 15024, Peru
3
Programa Académico de Ingeniería Ambiental, Facultad de Ingeniería, Universidad de Huánuco, Huánuco 10001, Peru
4
Facultad de Ingeniería Agrícola, Universidad Nacional Agraria de La Molina, Lima 15012, Peru
5
Instituto de Innovación Agropecuaria de Panamá (IDIAP), Estación Experimental de Cerro Punta—Chiriquí, Panama y Sistema Nacional de Investigación (SNI-SENACYT) Ciudad del Saber, Edificio 161, Clayton, Panama
*
Author to whom correspondence should be addressed.
Remote Sens. 2024, 16(20), 3901; https://doi.org/10.3390/rs16203901
Submission received: 23 August 2024 / Revised: 13 October 2024 / Accepted: 16 October 2024 / Published: 20 October 2024
(This article belongs to the Section Remote Sensing for Geospatial Science)

Abstract

:
The Vilcanota is the second-largest snow-capped mountain range in Peru, featuring 380 individual glaciers, each with its own unique characteristics that must be studied independently. However, few studies have been conducted in the Vilcanota range to monitor and track the area and volume changes of the Suyuparina and Quisoquipina glaciers. Notably, there are only a few studies that have approached this issue using LIDAR technology. Our methodology is based on a combination of optical, radar and LIDAR data sources, which allowed for constructing coherent temporal series for the both the perimeter and volume changes of the Suyuparina and Quisoquipina glaciers while accounting for the uncertainty in the perimeter detection procedure. Our results indicated that, from 1990 to 2013, there was a reduction in snow cover of 12,694.35 m2 per year for Quisoquipina and 16,599.2 m2 per year for Suyuparina. This represents a loss of 12.18% for Quisoquipina and 22.45% for Suyuparina. From 2006 to 2013, the volume of the Quisoquipina glacier decreased from 11.73 km3 in 2006 to 11.04 km3 in 2010, while the Suyuparina glacier decreased from 6.26 km3 to 5.93 km3. Likewise, when analyzing the correlation between glacier area and precipitation, a moderate inverse correlation (R = −0.52, p < 0.05) was found for Quisoquipina. In contrast, the correlation for Suyuparina was low and nonsignificant, showing inconsistency in the effect of precipitation. Additionally, the correlation between the snow cover area and the annual mean air temperature (R = −0.34, p > 0.05) and annual minimum air temperature (R = −0.36, p > 0.05) was low, inverse, and not significant for Quisoquipina. Meanwhile, snow cover on Suyuparina had a low nonsignificant correlation (R = −0.31, p > 0.05) with the annual maximum air temperature, indicating a minimal influence of the measured climatic variables near this glacier on its retreat. In general, it was possible to establish a reduction in both the area and volume of the Suyuparina and Quisoquipina glaciers based on freely accessible remote sensing data.

1. Introduction

About 70% of all tropical glaciers are located in the Peruvian Andes. The Vilcanota mountain range is the second largest in area, consisting of 380 snow-capped mountains, according to the latest census conducted in 2023 [1]; and all of them are very sensitive to climate change [2]. In the absence of rain, the water regulation process during the dry season allows farmers in rural communities near mountainous areas to have a flow of water for irrigation [3]. The internal temperature of glaciers and permafrost has increased over the last 30 years, which is manifested in intensified glacier melting [4].
In the Tianshan Mountains of the glacial region in eastern China, from 1959 to 2018, extreme warming events have been a growing trend over the past six decades, intensifying since the 1990s. Additionally, there has been an increase in extreme cold events. Similarly, since the 1990s, extreme precipitation events have also increased. These facts summarize a correlation between glacier mass balance, extreme warming, and extreme cold events [5]. The tropical glaciers of Peru are not immune to the previously mentioned events, and they are experiencing a retreat in area and volume. These processes are mainly due to an interaction with local and global climatic conditions, such as the El Niño-Southern Oscillation (ENSO) index, which causes a reduction in glacier mass [6,7].
The volume of glaciers is only known for a handful of the 160,000 glaciers that exist in the world [8]. In this sense, mass conservation equations and the relationships between glacier width, slope, lateral drag, and mass balance help predict glacier volume [9]. Thus, over an area of 2440 km2, two simulation models of climate change were compared to predict surface temperature increases for more than 200 glaciers in the Himalayas. The scenarios of these models for 2050 and 2090 projected a temperature increase of 2.2 °C to 2.9 °C in 4.5 Representative Concentration Pathways (RCP), and from 4.3 °C to 6.0 °C in 8.5 RCP. Due to the increasing temperature effect, between 33% and 42% of the volume of glacial mass would be lost by 2050. Meanwhile, the loss would be from 57% to 71% in 2090 [10]. However, these climate prediction models are coarse-scale, with spatial resolutions of 25 km2 at best.
The manual delineation of glacier extents is laborious, time-consuming, and subjective; i.e., glacier delineation may not be straightforward in high mountain regions with steep terrain and cloudy conditions [11,12]. However, several methods have been developed to map glacier outlines based on remote sensing tools [13], including the following: (i) aerial imaging, which offers high resolution but is expensive and limited by weather conditions; (ii) optical satellite remote sensing, which is widely used but affected by cloud cover and shadows from medium and high-resolution satellites; (iii) microwave and LIDAR, which are effective in all weathers but face processing challenges. The most widely used and robust approach is the application of a threshold value to differentiate between on- and off-glacier areas (GLIMS algorithm working group [12]) and the computation of the normalized difference snow index (NDSI) [14].
The NDSI takes advantage of the high contrast between snow and ice in the visible region of the incident electromagnetic spectrum, which contrasts with soil, rocks, or vegetation present [15]. NDSI is a relative magnitude of the difference in reflectance between the green and shortwave infrared (SWIR) bands, and is a numerical indicator of snow cover on land areas. Snow absorbs most of the incident radiation in the SWIR, while clouds are transparent, allowing NDSI to distinguish snow from clouds. This formula is commonly applied to map snow and ice cover and glacier monitoring [16,17]. Several studies have used satellite images to detect snow cover. Images from the ASTER sensor on board the Terra satellite were used to calculate the NDSI and the Normalized Difference Water Index (NDWI). This information allowed the area and glacial volume of the Champara snow-capped mountain in Ancash to be estimated, from 2000 to 2010. It was found that the glacier area was reduced by 50%, while the glacier volume varied at a rate of 0.0159 km3/year [18]. NDSI values can range from 0.25 to 1.0 [16]. While a value of 0.5 is typical for glacier mapping [19], variations can exist among sites.
Notwithstanding, computing the error of the glacier outline estimates is not a common practice, despite the importance of estimating the uncertainty of melting rates. A measure of the error or uncertainty of such prediction must accompany the glacier outline maps or other features estimated from remote sensing. Several ways have been proposed to estimate the uncertainty of the glacier area using medium-resolution satellite imagery. We summarize the main methods as follows [12]. Firstly, a manually digitized ice area in a high-resolution image is compared with the area estimation based on NDSI from a nearly contemporaneous Landsat scene, which was used to calculate the NDSI threshold. Assuming there are no significant changes in the area during the days between image acquisition, any difference in area estimates can be attributed to the inability of the NDSI threshold approach to accurately distinguish between pixels with and without ice/snow. In earlier studies, a similar approach has been used to quantify uncertainty in glacier area estimates derived from NDSI. Secondly, assuming that the misclassification of pixels is due to uncertainty in the NDSI threshold, the NDSI threshold is changed by 5% to account for the error cited in the digital number values of Landsat satellites. It is assumed that the uncertainty in the NDSI threshold value entails an uncertainty in the total glacier area. Thirdly, misclassification of pixels at the periphery of the glacier, where uncertainty in the NDSI threshold will have a more significant impact on pixel classification due to the presence of mixed pixels (i.e., pixels containing both snow-covered and non-snow-covered area due to the spatial resolution of the images used), is assumed. Assuming all pixels on the perimeter were misclassified, peripheral pixels are summed and multiplied by the pixel area (i.e., 900 m2, in the case of Landsat) to obtain an estimate of the misclassified area (typically ranging from 1% to 5%, according to reviewed studies).
Glacier outlines were generated [20] using NDSI thresholds derived from Landsat 5 (1986, 1994) and Landsat 7 (2004) multispectral optical satellite images. The thresholds, ranging from between 0.55 and 0.65, were iteratively assessed to obtain more precise outlines. Furthermore, ref. [21] delineated the glacier area of the main tropical mountain ranges using imagery from Landsat-5 Tier 1 Top of Atmosphere (1984–2012) and Landsat-8 Tier 1 Top of Atmosphere (2013–2020) datasets using the NDSI in Google Earth Engine. To estimate glacier outline uncertainty, they assumed that all glacier perimeter pixels were misclassified and calculated the total area of these pixels, representing an error of 11%. They also found that the Vilcanota Cordillera shrunk from a regional total of 540.6 ± 59.4 km2 in 1975 to 246.8 ± 12.3 km2 in 2020. Additionally, the Quelccaya ice cap, included within the Cordillera Vilcanota area, shrunk from 57.4 ± 5.4 km2 in 1975 to 41.6 ± 2.1 km2 in 2020, representing a loss of 27.5%.
Following the methodology used by [21], ref. [22] estimated the Coropuna glacier’s surface area, obtaining similar uncertainty estimates (11%). They constructed a time series of the Coropuna ice area using the NDSI applied to the Landsat scenes in the ESRI ArcGIS model builder application. Subsequently, they applied a methodology to estimate uncertainty in the glacier area by comparing it with a delineation using a nearly contemporaneous high-resolution (1.5 m panchromatic) SPOT image. The minimum NDSI value to identify glacierized regions was 0.5567. Since this method could generate a possible underestimation of the error, they used an alternative approach, assuming that pixel misclassification is restricted to the ice periphery. Thus, they arrived at the following results for the Coropuna snow peak: the area uncertainty was approximately 8.9% on average for Landsat 4, 5, and 7 scenes; and 11% for the Landsat 2 scene. A study on tropical glacier dynamics [2] used an NDSI threshold value of 0.8, which is higher than the thresholds of 0.5–0.6 applied by other studies in this region (e.g., [13,17]).
Moreover, ref. [12] suggested that when this method is applied over predominantly clean ice, the associated error was 2–5%. Therefore, a conservative estimation of 5% as the uncertainty value for the glacier area was suggested. As the Southern Peruvian Andes are mostly clean-ice, ref. [21] applied a manual correction procedure using high-resolution imagery from Google Earth; however, they did not apply an explicit method for analyzing the error in delineating ice areas.
The Cordillera Blanca was also studied [23], using time series from Sentinel 2 and Landsat 8. For Sentinel Multispectral Instrument-derived NDSI, a threshold value of 0.2 was used. They used the following approach to determine the uncertainty in the estimated glacier area: a ±1-pixel error was assumed for glacier boundaries. They calculated glacier areas in 1975, 1994, and 2016 with estimated errors of 726 ± 20.3 km2, 576.9 ± 15.1 km2, and 482.8 ± 7.4 km2, respectively, meaning errors of around 1.5% and 3% [23].
In addition to multispectral sensors, other remote sensing technologies have recently been introduced to study lands and covers. Light detection and ranging (LIDAR) systems have been reported as handy remote sensing tools for obtaining tree metrics for forest management [24,25]. Likewise, the Japan Aerospace Exploration Agency (JAXA) Advanced Land Observing Satellite (ALOS) radar was developed to assist in mapping research, cartographic precision, and environmental monitoring. One of its sensors, the PALSAR—an advanced synthetic aperture radar system in the L band that captures images through microwaves—is ideal for detecting topographic and geological changes from signals reflected on the Earth’s surface [26]. These images are digital terrain models (DTM) with a native resolution of 30 m, resampled to 12.5 m at a global scale, with a periodicity of 46 days in a historical mapping period between 2006 and 2011 [27].
Furthermore, ref. [21] generated 631 high-resolution (30 m) elevation change products using the ASTER archive and the Ames Stereo Pipeline (ASP) to study glacier mass dynamics in the Cordilleras Vilcanota, Vilcabamba, and Urubamba. For the Vilcanota Cordillera, they found that the median elevation at Cordilleras Vilcabamba and Urubamba rose at the fastest rates across the complete 1975–2020 time series (3.28 m yr−1 and 3.27 m yr−1 respectively), from 4966 m above sea level (m.a.s.l.) to 5110 m.a.s.l. for the Cordillera Vilcabamba and 4930 m.a.s.l. to 5077 m.a.s.l. for the Cordillera Urubamba. Synthetic-aperture radar (SAR) interferometry was used by [2] to calculate elevation change in the main Peruvian tropical mountain ranges. According to these authors, the change in mean elevation in the period 2000–2013 for the Vilcanota Cordillera (which includes the Suyuparina and Quisoquipina glaciers) ranged between −4 and 4 m per year.
The mass balance of tropical glaciers in Peru has been decreasing due to the increase in air temperature and the reduction in snow height on the snow-capped mountains [28,29]. This fact is due to a reduction in snow accumulation and an increase in ablation energy caused by a decrease in albedo [30]. Likewise, in the study by [31], field measurements were conducted by installing stakes between 2014 and 2016 that allowed elevation change to be measured at specific points on the Suyuparina glacier. This study revealed an elevation change of between 4 and 5 m per year from 2013 to 2014, and from 4 to 2 m between 2015 and 2016.
Regression analyses between glacier surface change and climatic data have been conducted previously. The authors of the study [21] performed regression analyses using historical climatic data generated through the Weather Research and Forecasting (WRF) simulation model. This study analyzed the correlation between glacier area change, precipitation, and mean annual temperature from 1984 (the first year of overlap between the Landsat record and their climate dataset) to 2018 for every glacier within the Cordilleras Vilcanota, Vilcabamba, and Urubamba, respectively. They found mixed results that vary depending on the mountain range and the variable. For example, they found significant negative correlations (i.e., p values < 0.05) between maximum annual air temperature, mean annual air temperature, and glacier area change in Vilcanota, respectively. Furthermore, significant positive correlations between glacier change and yearly precipitation were also reported.
Many efforts are being made to study the deglaciation of the Vilcanota mountain range. However, these investigations are complex because of the numerous snow-capped peaks that comprise it, each with unique characteristics regarding location and interaction with the environment. In this study, we focus on two glaciers in the Vilcanota range: Quisoquipina and Suyuparina. Very few studies have been conducted to examine the area and volume changes of these glaciers. Additionally, due to challenging access conditions, collecting in situ ground data from these regions remains difficult. Consequently, airborne LIDAR data, satellite imagery, and regional-scale climate-gridded datasets are commonly used for studying glacier mass change. In this work, we focus on remote sensing observations to construct a multi-decadal interannual time series of glacier outlines and volumes of the Suyuparina and Quisoquipina using multispectral satellite imagery, radar data, and an airborne LIDAR sensor to propose a simple methodology for making predictions of the complete disappearance of both glaciers. Additionally, we assessed the error of the estimated outlines and performed statistical analysis of glacier retreatment using a regional-scale climate gridded dataset.

2. Materials and Methods

2.1. Study Area

Our work area was located in the south of Peru, in the Cusco region of the Canchis province, 130 km from the city of Cusco in the Sallca river basin, with the following geographic coordinates at its central point: latitude −13.8° and longitude −70.74°; at a height of 5500 m.a.s.l. The work focused on the Suyuparina and Quisoquipina glaciers. The areas of the glaciers were preliminarily defined with surfaces of 1526 and 2461 m2, respectively (see Figure 1).

2.2. Data Sources

We have used the following datasets:
  • LANDSAT
Landsat 5 Thematic Mapper (TM) imagery from 1990 to 1999, and Landsat 7 Enhanced Thematic Mapper Plus (ETM+) imagery from 2000 to 2013, resulting in 23 years of evaluations. The images were downloaded from the Landsat Archives Collection 2 repository, which presents the latest efforts in image analysis, processing, and corrections [32,33]. The image processing level was L1TP, which is the highest pixel-level time series analysis quality.
  • ALOS PALSAR
PALSAR synthetic aperture radar of the Advanced Land Observation Satellite (ALOS) of the JAXA Agency from 2006 to 2010.
  • LIDAR POINT CLOUD
An airborne laser scanning system (ALS 60 MPIA, Leica, Heerbrugg, Switzerland) capable of obtaining 200,000 laser points per second flew over the study area on 5 April 2013. Airborne LIDAR data were acquired in the Quisoquipina and Suyuparina glacier basins at a flight altitude that allowed obtaining a point cloud with an average distance of 3.6 m.
  • PISCO GRIDDED DATASET
PISCO is a historical gridded precipitation and temperature dataset derived at the Peruvian National Meteorology and Hydrology Service (SENAMHI) [34,35] from ground stations and satellite precipitation missions, using geo-statistics.

2.3. Methods

2.3.1. Glacier Outline Estimation

Landsat Image Processing

The images were radiometrically calibrated and orthorectified using ground control points (GCPs) and DTM data to correct relief displacement. Images were selected considering a cloud cover percentage of less than 10%. The banding of Landsat 7 images acquired after 31 May 2003 was corrected using the Landsat gap fill extension of ENVI 5.3 (Exelis Visual Information Solutions, Boulder, Colorado) [36]. Finally, considering the availability of DTM images used in this study, Landsat images were restricted until 2013.
Landsat images were radiometrically calibrated and normalized to top-of-atmosphere (TOA) reflectance according to [37]. Atmospheric correction of the images was introduced using the ENVI 5.3 Fast Line Atmospheric Analysis of Spectral Hypercubes (Flaash) library, a MODTRAN-based atmospheric correction software [38]. For atmospheric corrections, the metadata of each image, an atmospheric model based on the latitudinal seasonal dependence of surface temperature, and a rural-type aerosol model were considered.

Glacier Outline Detection

Bands 2 and 5, hereafter B2 and B5, respectively, of the Landsat 5 and 7 platforms, corresponding to the green and shortwave infrared bands, respectively, were used to calculate the NDSI in a free and open-source software Geographic Information System (GIS) QGIS 3.16.8 [39], according to the following equation:
NDSI (Landsat 4–7) = (B2 − B5)/(B2 + B5)
The resulting images were segmented, considering the border of each glacier outlines preliminarily defined by an expert criterion [40] (see Figure 2). Then, an NDSI threshold of 0.4 was found experimentally. Values greater than 0.4 were discriminated as snow and labeled as one, while values lower than 0.4 were labeled as zero. This criterion was applied to all images. A binary mask of zeros and ones was obtained for each pair of images corresponding to the Quisoquipina and Suyuparina glaciers.
The effective area of the glacier outline was calculated using the Matlab image processing package [41], which allowed the manipulation of images as binary data matrices located according to their position (x, y) on a Cartesian plane. The glacier outline was computed as the sum of the binary values of the columns corresponding to the matrix of each image, multiplied by the dimensions of the pixel area of a Landsat image (900 m2).
G l a c i e r   A r e a ( K m 2 ) = N D S I b i n a r y m a s k × 30 × 30 / 10 6
The misclassification of pixels at the glacier’s periphery was assessed, assuming all pixels on the perimeter were incorrectly classified. We implemented a custom R script [41] that summed the number of perimeter pixels and multiplied by the pixel area (900 m2) to estimate the maximum misclassified snow area.
M i s c l a s s i f i e d   g l a c i e r   a r e a     ( K m 2 ) = ( p e r i m e t e r   p i x e l s × 900 ) / 10 6
This provides both the glacier area and its associated uncertainty, expressed as a percentage of the total area:
E r r o r   p e r c e n t a g e = M i s c l a s s i f i e d   g l a c i e r   a r e a / G l a c i e r   A r e a  
The final output is a summary of the glacier areas, areas errors, and their respective percentages.

2.3.2. Estimating Snow Volume Changes

Processing ALOS PALSAR Images

The volumes of the Quisoquipina and Suyuparina glaciers were estimated using DTM images acquired by the PALSAR synthetic aperture radar of the Advanced Land Observation Satellite (ALOS) of the JAXA Agency, from 2006 to 2010.
The DTM images were restricted using expert-defined shapefiles for each glacier [40]. They were then resampled to the spatial resolution of the Landsat images (30 m × 30 m) and, following the procedure described in Section 2.2, binary masks were applied to the NDSI images calculated from Landsat 7 images acquired in periods similar to the date of acquisition of the respective DTM images.

Processing Airborne LIDAR Data

An airborne laser scanning system (ALS 60 MPIA, Leica, Heerbrugg, Switzerland) capable of obtaining 200,000 laser points per second flew over the study area on 5 April 2013. Airborne LIDAR data were acquired in the Quisoquipina and Suyuparina glacier basins at a flight altitude that allowed obtaining a point cloud with an average distance of 3.6 m (see Figure 1).
The sequence of steps that allowed obtaining DTM from the LIDAR information was, (1) raw data with coordinates and elevations for the point cloud were first obtained, previously filtered, and corrected. (2) This file was then transformed into vector format using a custom script in R and then transformed to ESRI shapefile (SHP) format [42]. (3) The point cloud was then rasterized using TIN (Triangulated Irregular Network) interpolation algorithm, which has been used in previous studies as a way to derive elevation models based on three-dimensional point clouds obtained through LIDAR [43]. Finally (4), we applied binary masks of NDSI images acquired in periods close to the LIDAR data to only analyze snow-covered pixels.

Volume Changes in Glaciers

The elevation changes were calculated using the DTM data derived from ALOS from 2006 to 2010, and LIDAR for 2013. The DTM images resulting from applying the binary filter of NDSI images were processed in Matlab to recover the number of pixels and the height data per pixel, which were used to calculate the volume of the snow-covered area of the Quisoquipina and Suyuparina glaciers. Our approach is similar to [21], which used decadal intervals, and [44] which used a 5-year interval analysis. Finally, volume changes were calculated against the baseline volume of the year 2006, using the follow equation:
T S V   Y E A R   I ( K m 3 ) = D T M Y e a r   I × N D S I b i n a r y m a s k Y E A R   I × 30 × 30 / 10 6
G V C   K m 3 = T S V   2006   T S V Y E A R   I + 1
where TSV stands for total snow volume, GVC is glacier volume change and YEAR I ranges from 2006 to 2012. This methodology does not calculate the actual snow volume of the snow-capped mountains. However, it allows for estimating the rate of change in the volume of the glaciers, which would mainly correspond to changes in the snow mass balance. A similar methodology was used by [18] in the Cordillera Blanca. In this regard, it is known that the dispersion of ablation as a function of elevation is affected by the irregular surface of a glacier, reducing the precision for estimating the annual mass balance [31].
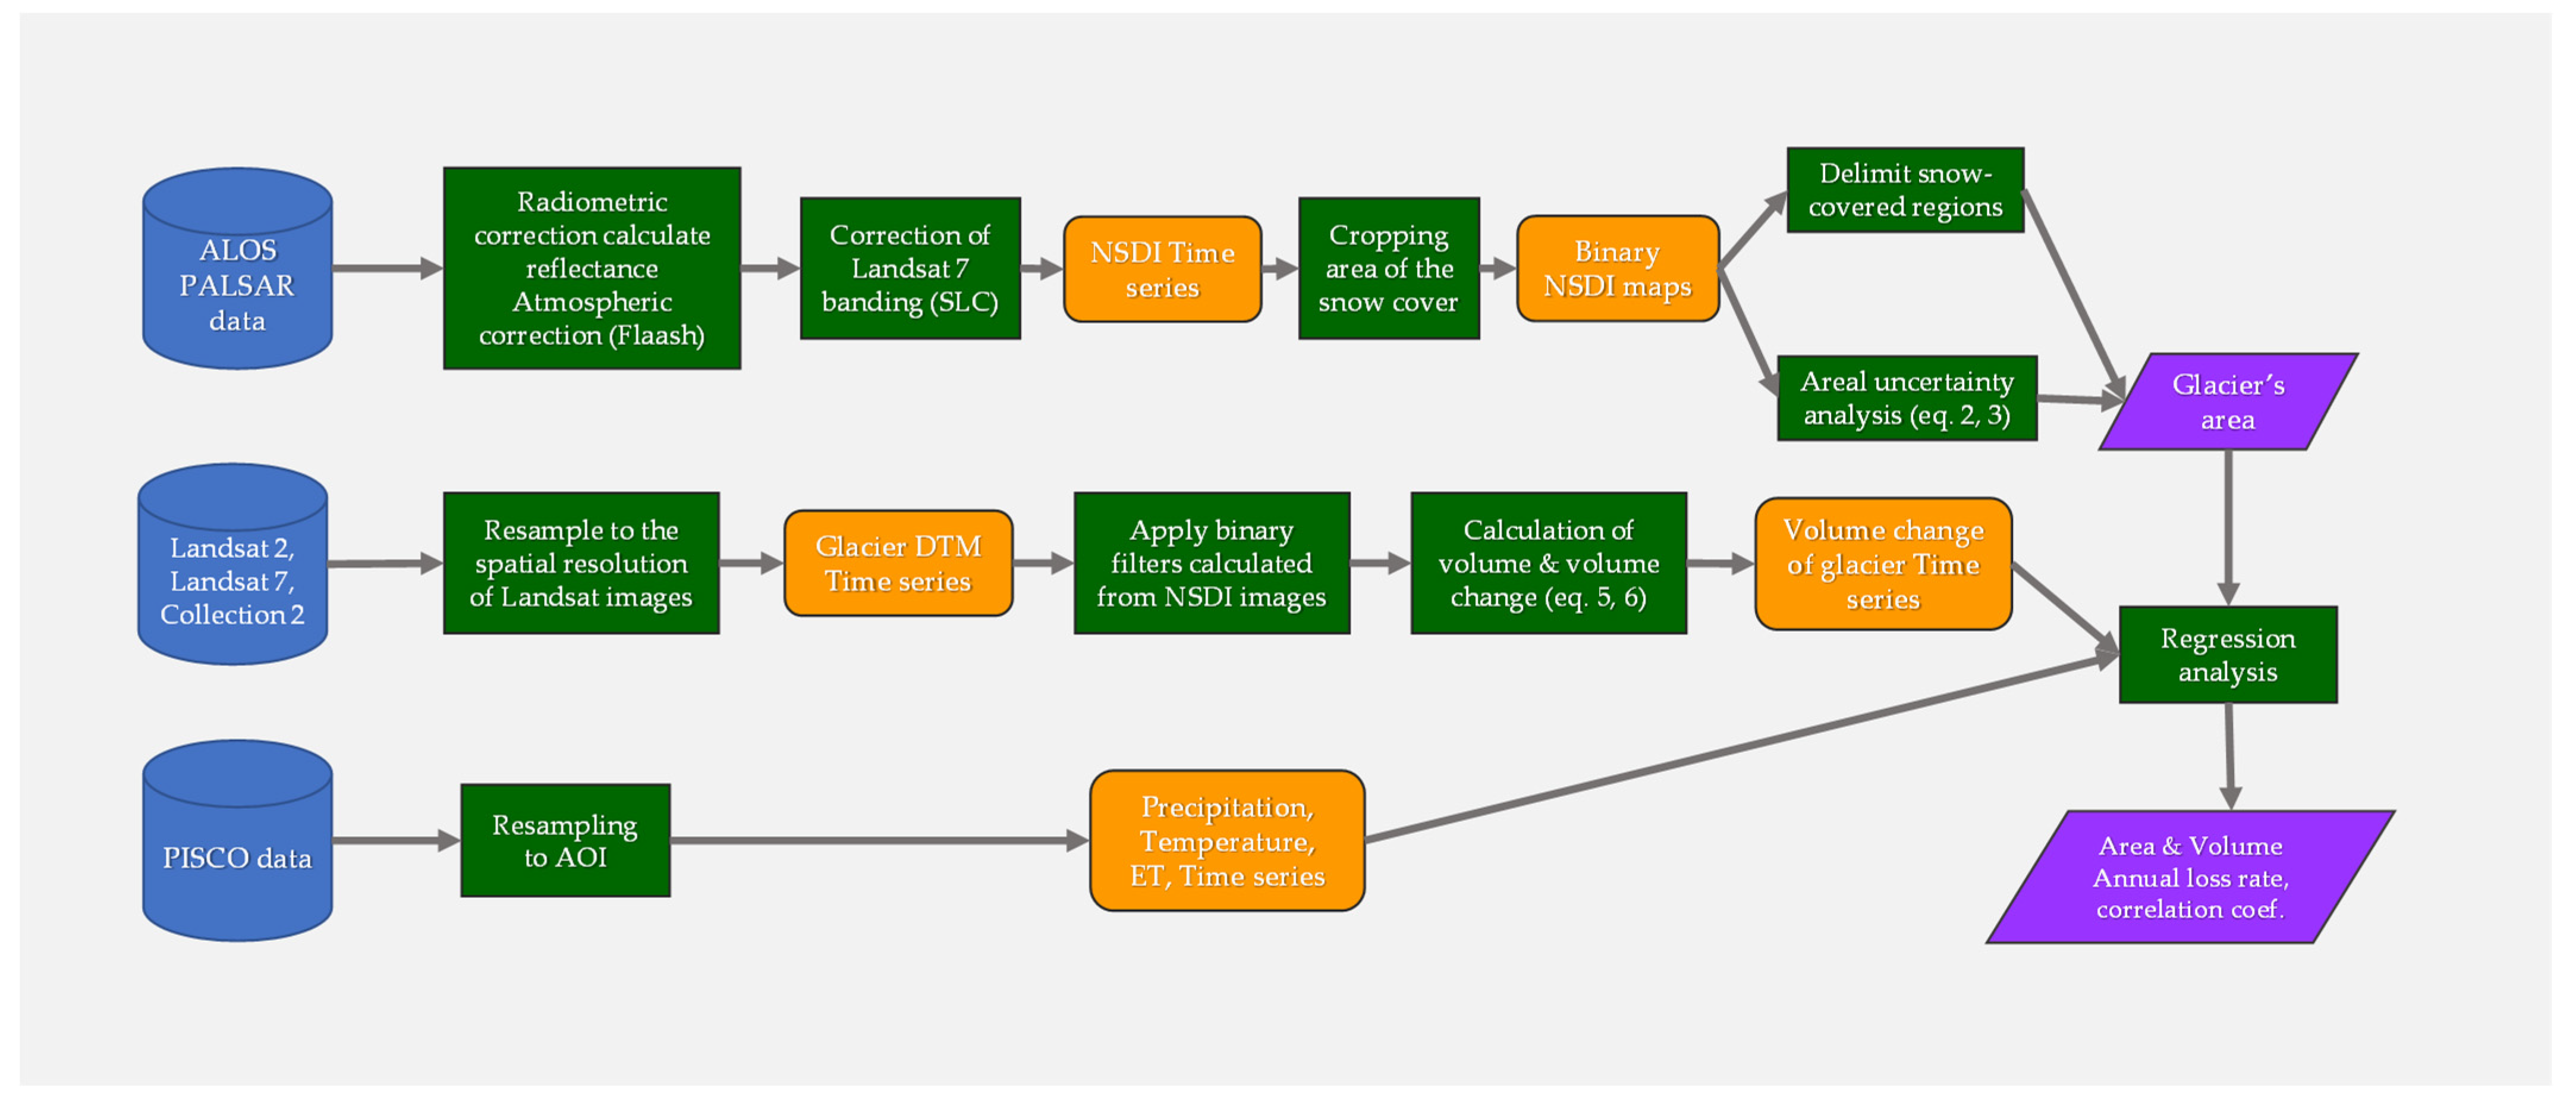
The procedure for calculating the area covered by snow and its respective change in volume of the Quisoquipina and Suyuparina snow-capped mountains is summarized in the Figure 3.

2.4. Snow Cover and Climate Data

To identify the most significant variables in snow loss on each glacier, a correlation analysis was conducted between area loss and historical climate data derived from the gridded precipitation and temperature product (PISCO) from the Peruvian National Meteorology and Hydrology Service (SENAMHI) [34,35]. Precipitation, potential evapotranspiration, and maximum and minimum temperature records for the coinciding years of glacier area loss data were used, averaged, and extracted over the shapefiles of each glacier for each year under analysis using the Average Nearest Neighbor method. Subsequently, the climatic data were correlated with the annual change for each glacier using a linear function in R [42].

3. Results

3.1. Glacier Outline Detection

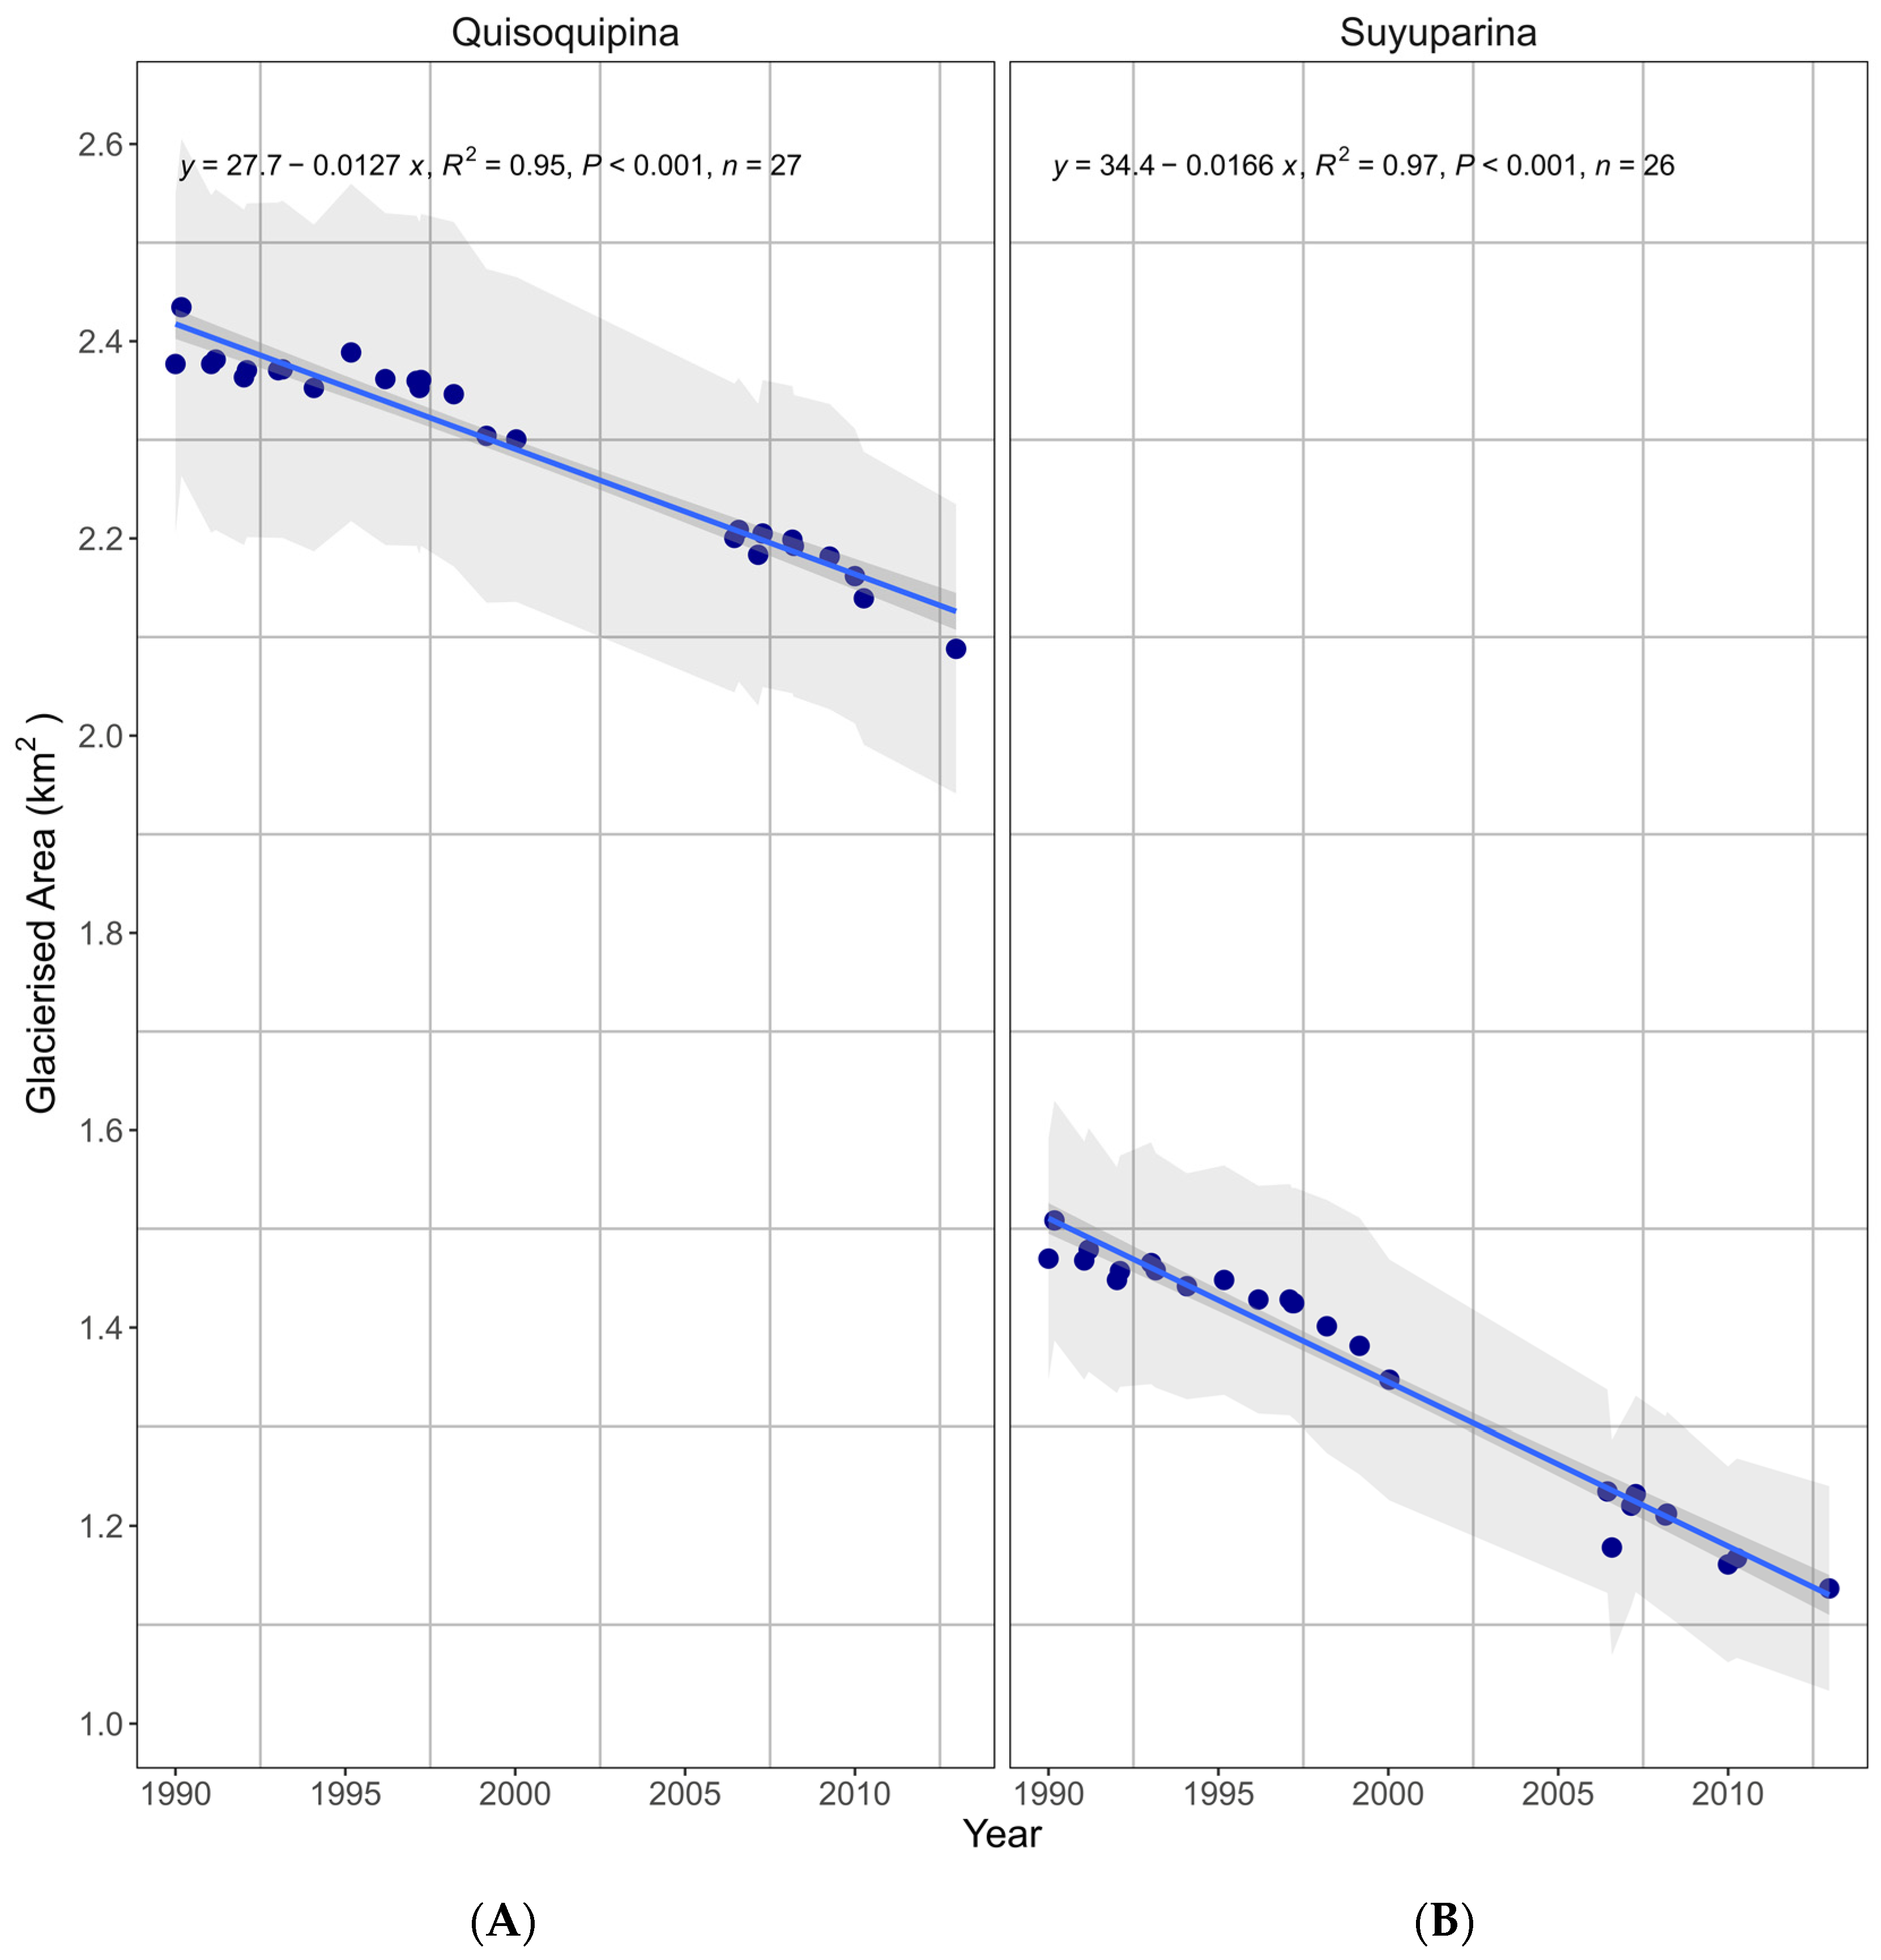
The 1990 to 2013 snow cover of the Quisoquipina glacier fits a linear regression with a coefficient of determination (R2) of 0.95 (***, p < 0.001). A negative slope indicated a reduction of 34.8 m2 per day, representing a yearly reduction of 12,694.35 m2. Meanwhile, the Suyuparina showed an R2 of 0.97 (***), with a daily reduction of 45.48 m2, corresponding to a yearly contraction of 16,599.2 m2. Overall, the region has had a consistent and steady snow recession during this period. The Quisoquipina glacier shrank from an initial area of 2.38 ± 0.35 km2 in 1990 to 2.09 ± 0.15 km2 in 2013 (Figure 4), with a total loss of 12.18% over 23 years. The Suyuparina glacier, also part of the Cordillera Vilcanota, shrank from 1.47 ± 0.12 km2 in 1990 to 1.14 ± 0.11 km2 in 2013, representing a loss of 22.45% over 23 years. The loss rate at Suyuparina has been 54.3% higher than Quisoquipina.
The uncertainty analysis using the methodology described in the methods section allowed us to obtain percentage areal errors of approximately 8% for Suyuparina and 7% for Quisoquipina (see Figure 4 and Figure 5).
Now, if we consider different periods for analyzing changes in glacial area, from 1990 to 1999, and from 2000 to 2013 (Figure 5), we find the following: for Quisoquipina, the rate of change in glacial area was −0.00632 km2 per year for the earlier period, and −0.0155 km2 per year for the latter. Similarly, for Suyuparina, the rate of change in glacial area ranged from −0.00947 km2 per year to −0.0163 km2 per year.
Based on a linear regression analysis conducted over two consecutive periods, the trend in the rate of glacial area reduction (p-value < 0.01; see Table 1) for both glaciers indicates that the period from 2000 to 2013 has intensified compared to the period from 1990 to 1999.

3.2. Volume Changes in Glacier

There is a noticeable linear reduction in volume, decreasing from 11.73 km3 to 11.04 km3 for Quisoquipina, while Suyuparina decreases from 6.26 km3 to 5.93 km3 (see Table 2). Notably, the aerial LIDAR reconstruction of the elevation model on both glaciers agreed with the ALOS PALSAR elevation data changes, showing the same trend. This is given the intrinsic difference between the two modes of measurement and the associated errors in the DEM generation process by ALOS PALSAR images.
The volume changes in Quisoquipina and Suyuparina glaciers were computed using as reference the snow volume of glaciers in 2006 (see Figure 6). The changes in snow volume on the Quisoquipina glacier showed an R2 of 0.88 (***). The slope is −0.102 km3 per year. Similarly, the Suyuparina glacier showed an R2 of 0.54 (*), with a negative rate of change at 0.0617 km3 per year, indicating a slower volume reduction rate than Quisoquipina.
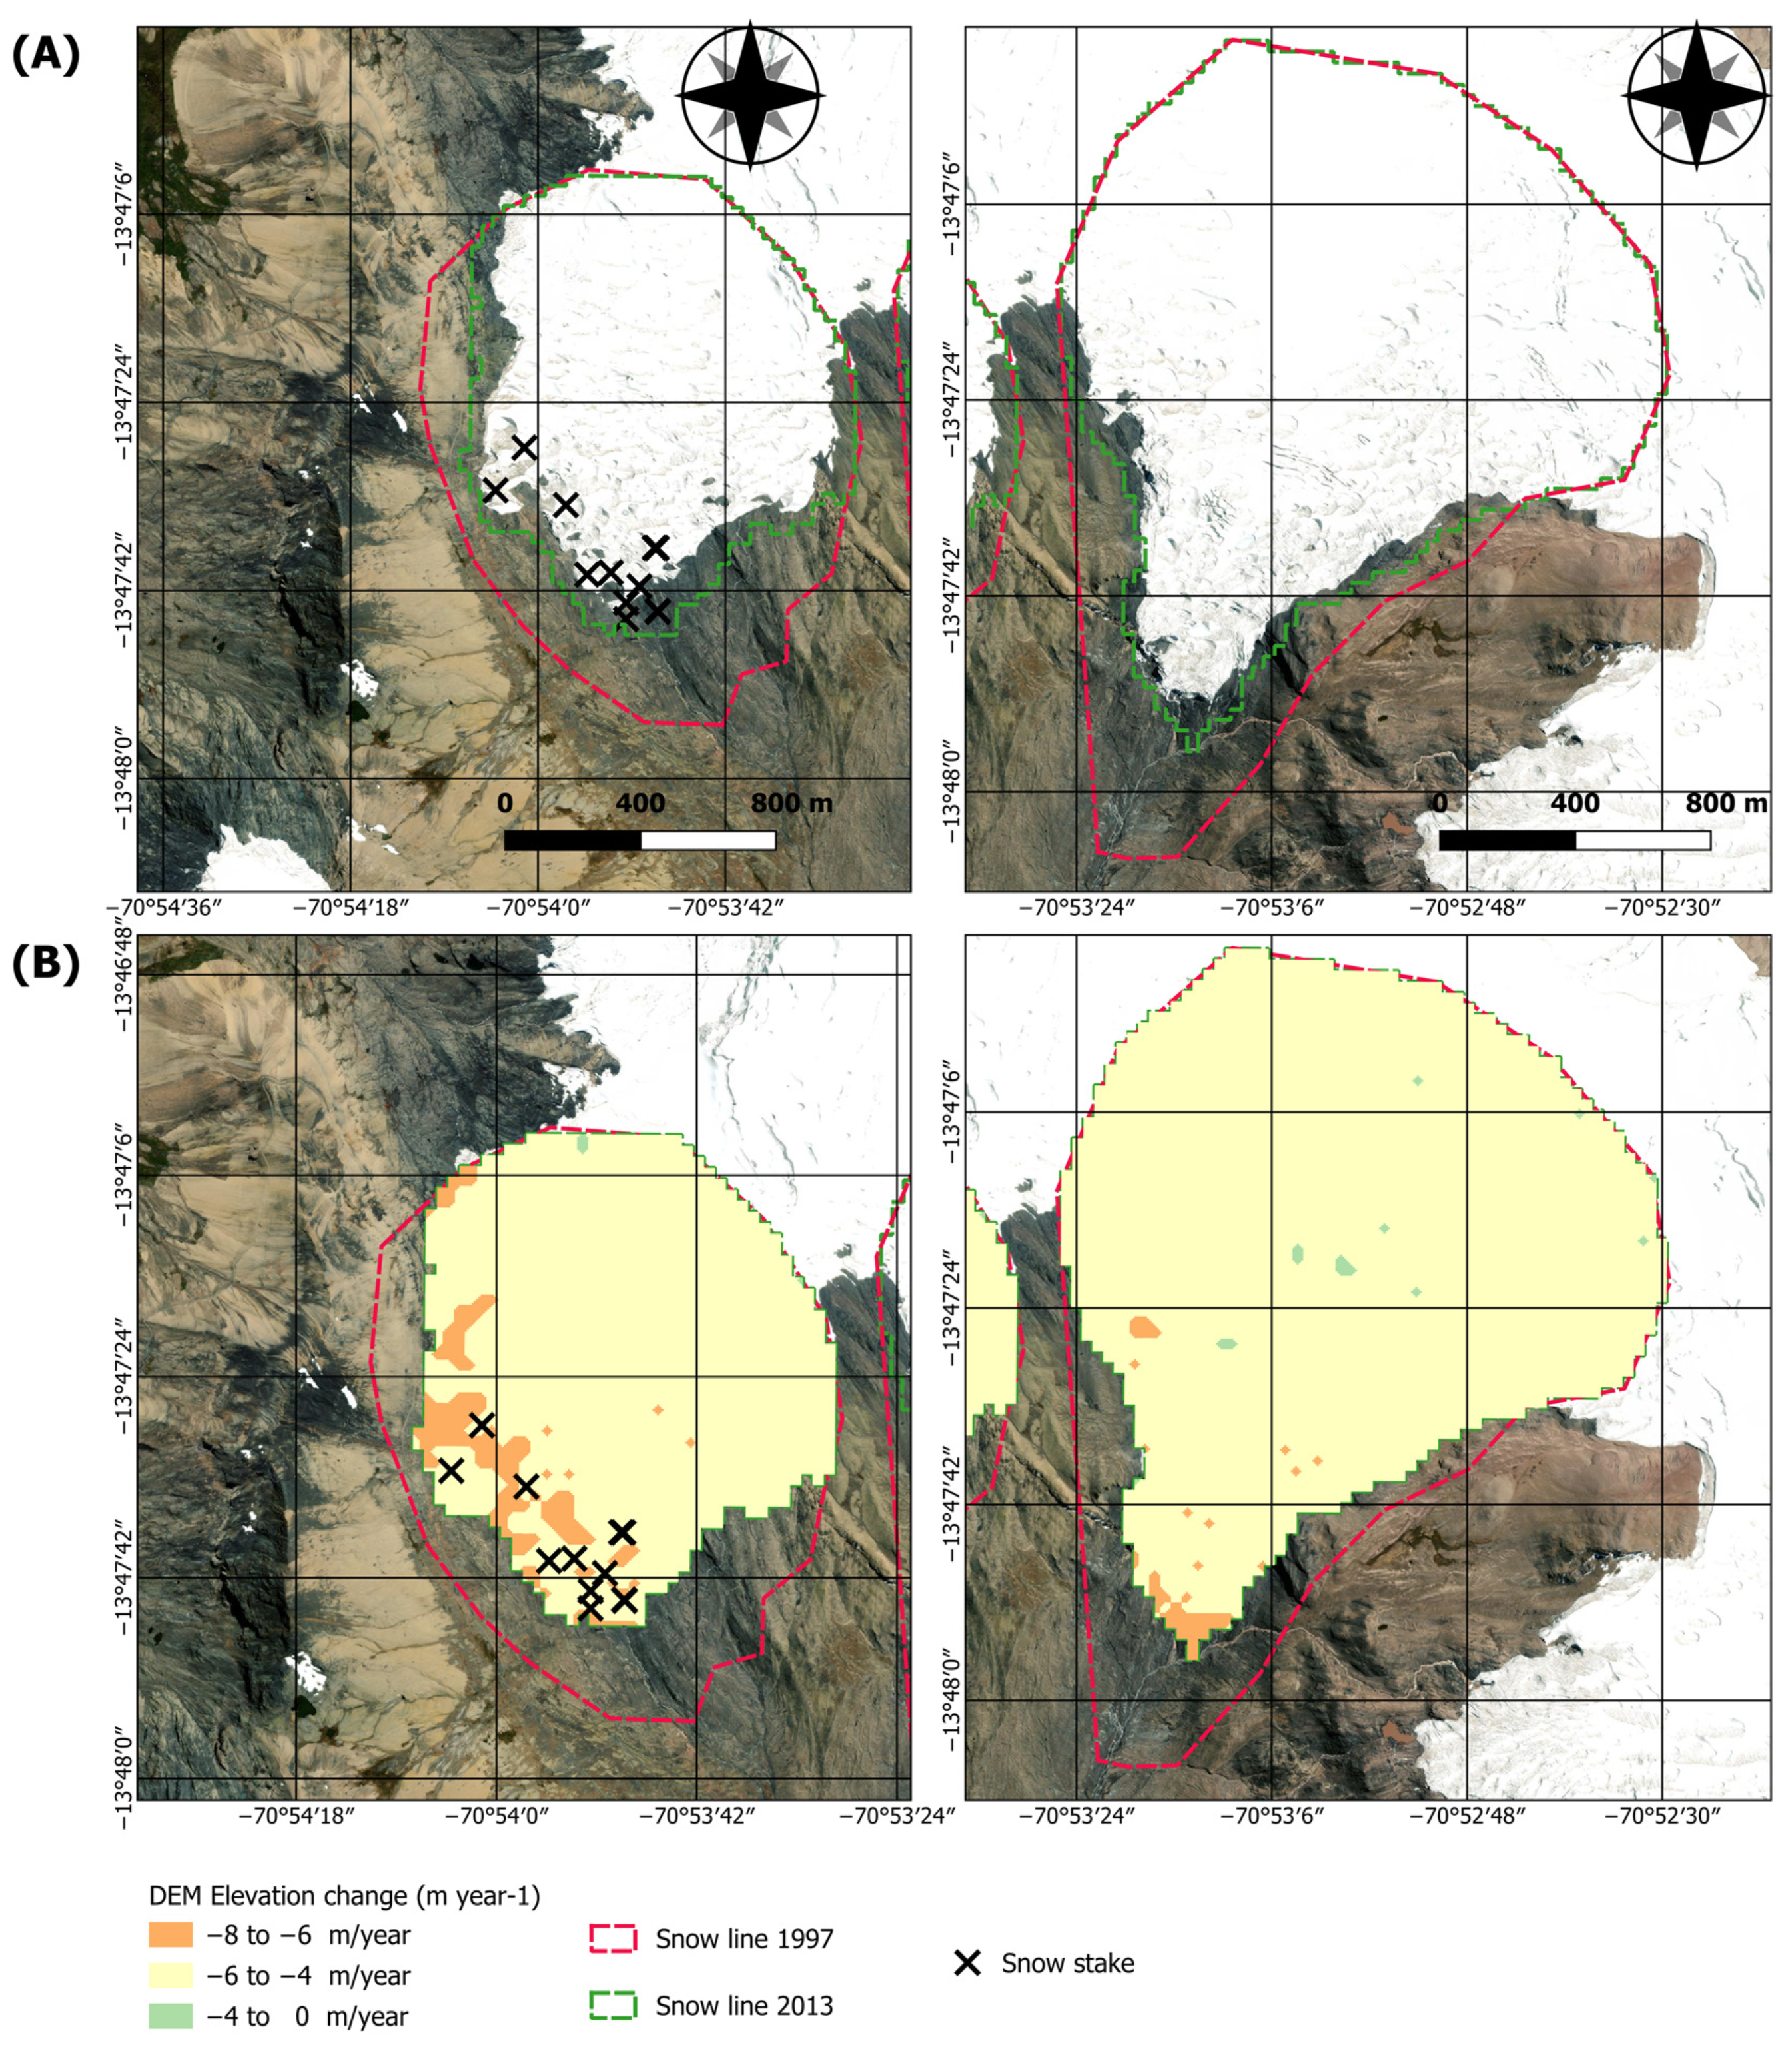
Figure 7 shows spatial patterns of deglaciation of the two glaciers analyzed between 2006 and 2013. These changes in the elevation, which predominantly affect lower-lying zones, are mainly distributed in the southwest areas of Suyuparina glacier and mainly in the south region of Quisoquipina glacier, respectively (Figure 7).
It is notable that in the two glaciers, snow has decreased by approximately 6 m per year, with a peak decrease of about 8 m per year in the ablation zone of each glacier; but this estimate is subjected mainly to errors in the DEM generation process from the ALOS PALSAR data and intrinsic errors related to the reconstruction of the elevation model itself [21] in the zone (i.e., about five meters per year in the ablation zone). We present it Figure 7 here for completeness, but do not analyze it further, given the extent to which the uncertainty could exceed the signal in the data.

3.3. The Climate Effect on Snow Cover

Scatterplots of climatic and glacier surface changes are shown in Figure 8, and linear regression analysis results are shown in Table 3. Across the Quisoquipina glacier, there is a moderate correlation between mean annual precipitation and the rate of snow area change (R = −0.5236, p < 0.05) (Figure 8; Table 3). No statistically significant relationship (p > 0.05) exists between snow area change and min. and max. annual air temperatures; likewise, there is no statistically significant relationship (p > 0.05) between snow area change and min. yearly air temperature (which has risen by ∼0.2 °C per decade from 1980 to 2020 [21]). For the Suyuparina glacier, no significant relationship (p < 0.05) was observed. Overall, a mainly negative slope can be observed in all plots.
The only moderate correlation between area changes over the 20 years and precipitation (R = −0.5236, p < 0.05) suggests that high annual precipitation patterns could be a glacier loss driver in Quisoquipina, the easternmost glacier.

4. Discussion

4.1. Glacier Outline

Our results confirm [31] findings indicating that Suyuparina is undergoing active retreat and is vulnerable to climate change, potentially disappearing within a few decades. Furthermore, the glacier retreat observed in Suyuparina is corroborated by the loss of snow-covered areas reported by [45], where a 7% decrease was noted from 2009 to 2013. On the other hand, based on an analysis of the periods 1990–1999 and 2000–2013, there is evidence of an intensification of the reduction of glacial area in both snow-capped mountains. Similar results were reported by [46].
Projecting the snow cover of the Quisoquipina glacier up to 2090, its snow cover would be approximately 1.15 km2 and 0 km2 by 2180. Meanwhile, the snow cover of Suyuparina would have disappeared by 2081. According to [47], using LIDAR terrestrial scanning, Quisoquipina had a reduction rate of 12,929.92 m2 per year over six years (April 2013–July 2019), similar to the rate estimated in this study. Both loss rates are below the regional Vilcanota Cordillera average percentage loss estimated by [21], which is 54%.
Concerning uncertainty analysis, previous studies reported that this methodology generally generates errors of around 5%. Other works, such as [21] reported percentage errors of approximately 11% in the estimation of snow-covered areas. A similar study [22] estimated the Coropuna glacier’s snow surface area and calculated an uncertainty of around 11%. Our results are thus comparable with similar studies in the region.

4.2. Changes in Snow Volume in the Glaciers

It can be observed (see Table 2) that the balance of snow volume in the glaciers changes positively or negatively from one year to another, or within the same year. This can be explained by the interannual variability in the snow balance of tropical glaciers due to the dry season and the rainy season being influenced by the El Niño or La Niña phenomena [48,49,50]. However, when evaluating more extended periods, the retreat of glacier volume is evident (Figure 6). The reduction of tropical glaciers is due to various causes. The increase in temperature and the reduction of air humidity [51,52] affect the melting rate and sublimation within the fluctuations that occur in a glacier [48]. Consequently, the dynamics of glacier mass have a predominantly negative trend pattern in most tropical glaciers, such as the Cordillera Blanca [49], which affects the population and agriculture in the surrounding areas [4,50,53,54].
The elevation change estimates in the main Peruvian tropical mountain ranges using SAR interferometry [2], are similar to our mean change elevation estimates for 2006–2013, which ranged between −4 to 4 meters per year. However, our results suggest an overall negative balance trend. Ref. [31] indicated an annual negative change between 5 and 7 meters in 12 monitored stakes on the Suyuparina glacier from 2013 to 2014, and 4 to 2 m between 2015 and 2016.
The map in Figure 7 shows a trend that is consistent with the mean values; however, we believe there might be biases in the elevation estimation, mainly due to the use of ALOS data. DEMs derived from ALOS could have a vertical error ranging from 10 to 15 meters [55], whereas the DEM derived from LIDAR likely has much greater precision. Nonetheless, the spatial pattern of ablation or elevation loss indicates a loss near the glacier’s ablation zone.

4.3. Climate Data and Glacier Surface Changes Correlations

Finally, concerning the relationship between climate trends and glacier surface change, the relatively short climatic record (i.e., 20 years) limits our ability to analyze whether decadal climatic changes affect glacier area change (Figure 4). Only a modest correlation between changes in the area over the 20-year timeframe and precipitation implies that elevated annual precipitation patterns might be a potent factor driving glacier loss in Quisoquipina, while all other correlations were non-significant. Similar results were reported by [21]. Although these results are contradictory, ref. [56] reported similar findings in a study conducted on glacier surfaces and caves in the southeastern mountains of Europe. They presented that extreme summer rainfall was the main driver of glacier area reduction. This allows us to understand better the overall snow loss patterns and their relationship with climate patterns.

5. Conclusions

This study presents a straightforward methodology to estimate glacier area and elevation change, and the uncertainty of these estimates in the Quisoquipina and Suyuparina glaciers in the Vilcanota mountain range, mainly using freely accessible remote sensing data acquired from satellites. Based on the hypotheses proposed in this work, it is possible to establish evidence of a reduction in the area and volume of these glaciers. With current trends, there is a risk that the snow cover of the Quisoquipina glacier will be approximately 1.15 km2 by 2090, with the complete disappearance of the glacier by 2180. Meanwhile, in the Suyuparina glacier, the trend of glacier reduction is faster, as evidenced by the data and analysis conducted. It is estimated that, by 2081, the snow-covered area of the glacier will have disappeared. Additionally, we found a moderate correlation between glacier area change and precipitation over the 20 years (R = −0.5236, *) in Quisoquipina. No such correlation, however, was found for the Suyuparina glacier.
This study suggests that a forward-looking approach to actions must be taken in these important areas to mitigate the effects of the disappearance of these water sources and address the accelerated reduction of glaciers catalyzed by climate change.

Author Contributions

Conceptualization, N.M.-J., H.L. and R.O.G.-R.; methodology, H.L. and M.B.; software, H.L. and M.B.; validation, H.L., M.B. and R.O.G.-R.; formal analysis, H.L., M.B. and R.O.G.-R.; investigation, N.M.-J., H.L. and R.O.G.-R.; resources, N.M.-J.; data curation, H.L. and M.B.; writing—original draft preparation, H.L., M.B., R.O.G.-R. and R.Q.; writing—review and editing, H.L., M.B., R.O.G.-R. and R.Q.; visualization, H.L. and M.B.; supervision, N.M.-J.; project administration, N.M.-J.; funding acquisition, N.M.-J. All authors have read and agreed to the published version of the manuscript.

Funding

This work was supported, in whole or in part, by the Bill and Melinda Gates Foundation (BMGF) with grant number OPP1070785, and the project “Evaluación hidrológica y climática de las cuencas de los glaciares Quisoquipina y Suyuparina en la cordillera del Vilcanota frente al cambio climático” with contract Nº 020-2018 CONCYTEC-UNSAAC. Under the grant conditions of BMGF, a Creative Commons Attribution 4.0 Generic License has already been assigned to the Author Accepted Manuscript version that might arise from this submission.

Data Availability Statement

The data presented in this study are openly available in Dataverse at https://doi.org/10.21223/6UWFPN.

Conflicts of Interest

The authors declare no conflicts of interest.

References

  1. Instituto Nacional de Investigación en Glaciares y Ecosistemas de Montaña. Inventario Nacional de Glaciares y Lagunas de Origen Glaciar 2023; Instituto Nacional de Investigación en Glaciares y Ecosistemas de Montaña: Huaraz, Peru, 2023. [Google Scholar]
  2. Seehaus, T.; Malz, P.; Sommer, C.; Lippl, S.; Cochachin, A.; Braun, M. Changes of the Tropical Glaciers throughout Peru between 2000 and 2016—Mass Balance and Area Fluctuations. Cryosphere 2019, 13, 2537–2556. [Google Scholar] [CrossRef]
  3. Rybak, O.O.; Rybak, E.A. Model-Based Calculations of Surface Mass Balance of Mountain Glaciers for the Purpose of Water Consumption Planning: Focus on Djankuat Glacier (Central Caucasus). IOP Conf. Ser. Earth Environ. Sci. 2018, 107, 012041. [Google Scholar] [CrossRef]
  4. Ding, Y.; Zhang, S.; Zhao, L.; Li, Z.; Kang, S. Global Warming Weakening the Inherent Stability of Glaciers and Permafrost. Sci. Bull. 2019, 64, 245–253. [Google Scholar] [CrossRef] [PubMed]
  5. Zhang, H.; Wang, F.-T.; Zhou, P. Changes in Climate Extremes in a Typical Glacierized Region in Central Eastern Tianshan Mountains and Their Relationship with Observed Glacier Mass Balance. Adv. Clim. Change Res. 2022, 13, 909–922. [Google Scholar] [CrossRef]
  6. Vuille, M.; Kaser, G.; Juen, I. Glacier Mass Balance Variability in the Cordillera Blanca, Peru and Its Relationship with Climate and the Large-Scale Circulation. Glob. Planet. Change 2008, 62, 14–28. [Google Scholar] [CrossRef]
  7. Vuille, M.; Francou, B.; Wagnon, P.; Juen, I.; Kaser, G.; Mark, B.G.; Bradley, R.S. Climate Change and Tropical Andean Glaciers: Past, Present and Future. Earth-Sci. Rev. 2008, 89, 79–96. [Google Scholar] [CrossRef]
  8. Colbeck, S.C. Glaciers, Ice Sheets and Volcanoes: A Tribute to Mark F. Meier; U.S. Army Cold Regions Research and Engineering Laboratory: Hanover, NH, USA, 1996. [Google Scholar]
  9. Bahr, D.B.; Meier, M.F.; Peckham, S.D. The Physical Basis of Glacier Volume-Area Scaling. J. Geophys. Res. Solid Earth 1997, 102, 20355–20362. [Google Scholar] [CrossRef]
  10. Tawde, S.A.; Kulkarni, A.V.; Bala, G. An Assessment of Climate Change Impacts on Glacier Mass Balance and Geometry in the Chandra Basin, Western Himalaya for the 21st Century. Environ. Res. Commun. 2019, 1, 041003. [Google Scholar] [CrossRef]
  11. Bolch, T.; Kamp, U. Glacier Mapping in High Mountains Using DEMs, Landsat and ASTER Data. In Proceedings of the 8th International Symposium on High Mountain Remote Sensing Cartography (HMRSC), La Paz, Bolivia, 21–27 March 2005; Volume 41, pp. 37–48. [Google Scholar]
  12. Paul, F.; Barrand, N.E.; Baumann, S.; Berthier, E.; Bolch, T.; Casey, K.; Frey, H.; Joshi, S.P.; Konovalov, V.; Bris, R.L.; et al. On the Accuracy of Glacier Outlines Derived from Remote-Sensing Data. Ann. Glaciol. 2013, 54, 171–182. [Google Scholar] [CrossRef]
  13. Veettil, B.K.; Kamp, U. Remote Sensing of Glaciers in the Tropical Andes: A Review. Int. J. Remote Sens. 2017, 38, 7101–7137. [Google Scholar] [CrossRef]
  14. Shafique, M.; Faiz, B.; Bacha, A.S.; Ullah, S. Evaluating Glacier Dynamics Using Temporal Remote Sensing Images: A Case Study of Hunza Valley, Northern Pakistan. Environ. Earth Sci. 2018, 77, 162. [Google Scholar] [CrossRef]
  15. Hall, D.K.; Riggs, G.A.; Salomonson, V.V. Development of Methods for Mapping Global Snow Cover Using Moderate Resolution Imaging Spectroradiometer Data. Remote Sens. Environ. 1995, 54, 127–140. [Google Scholar] [CrossRef]
  16. Hall, D.K.; Riggs, G.A. Normalized-Difference Snow Index (NDSI). In Encyclopedia of Snow, Ice and Glaciers; Singh, V.P., Singh, P., Haritashya, U.K., Eds.; Springer: Dordrecht, The Netherlands, 2011; pp. 779–780. ISBN 978-90-481-2642-2. [Google Scholar]
  17. Silverio, W.; Jaquet, J.-M. Glacial Cover Mapping (1987–1996) of the Cordillera Blanca (Peru) Using Satellite Imagery. Remote Sens. Environ. 2005, 95, 342–350. [Google Scholar] [CrossRef]
  18. Acuña, J.R.; Puchuc, J.T. Estimación Del Área de La Superficie y El Cambio de Volumen Del Glaciar Del Nevado Champará (Cordillera Blanca, Perú) a Partir de Las Imágenes y Los Modelos de Elevación Digital Del Sensor ASTER/Terra (2000–2010). In Revista de Glaciares y Ecosistemas de Montaña; ResearchGate: Lima, Peru, 2018; p. 20. [Google Scholar]
  19. Albert, T.H. Evaluation of Remote Sensing Techniques for Ice-Area Classification Applied to the Tropical Quelccaya Ice Cap, Peru. Polar Geogr. 2002, 26, 210–226. [Google Scholar] [CrossRef]
  20. Muñoz, R.; Huggel, C.; Drenkhan, F.; Vis, M.; Viviroli, D. Comparing Model Complexity for Glacio-Hydrological Simulation in the Data-Scarce Peruvian Andes. J. Hydrol. Reg. Stud. 2021, 37, 100932. [Google Scholar] [CrossRef]
  21. Taylor, L.S.; Quincey, D.J.; Smith, M.W.; Potter, E.R.; Castro, J.; Fyffe, C.L. Multi-Decadal Glacier Area and Mass Balance Change in the Southern Peruvian Andes. Front. Earth Sci. 2022, 10, 863933. [Google Scholar] [CrossRef]
  22. Kochtitzky, W.H.; Edwards, B.R.; Enderlin, E.M.; Marino, J.; Marinque, N. Improved Estimates of Glacier Change Rates at Nevado Coropuna Ice Cap, Peru. J. Glaciol. 2018, 64, 175–184. [Google Scholar] [CrossRef]
  23. Veettil, B.K. Glacier Mapping in the Cordillera Blanca, Peru, Tropical Andes, Using Sentinel-2 and Landsat Data. Singap. J. Trop. Geogr. 2018, 39, 351–363. [Google Scholar] [CrossRef]
  24. Koch, B.; Heyder, U.; Weinacker, H. Detection of Individual Tree Crowns in Airborne Lidar Data. Photogramm. Eng. Remote Sens. 2006, 72, 357–363. [Google Scholar] [CrossRef]
  25. Hudak, A.T.; Crookston, N.L.; Evans, J.S.; Falkowski, M.J.; Smith, A.M.S.; Gessler, P.E.; Morgan, P. Regression Modeling and Mapping of Coniferous Forest Basal Area and Tree Density from Discrete-Return Lidar and Multispectral Satellite Data. Can. J. Remote Sens. 2006, 32, 126–138. [Google Scholar] [CrossRef]
  26. Yan, S.; Guo, H.; Liu, G.; Ruan, Z. Mountain Glacier Displacement Estimation Using a DEM-Assisted Offset Tracking Method with ALOS/PALSAR Data. Remote Sens. Lett. 2013, 4, 494–503. [Google Scholar] [CrossRef]
  27. Rosenqvist, A.; Shimada, M.; Ito, N.; Watanabe, M. ALOS PALSAR: A Pathfinder Mission for Global-Scale Monitoring of the Environment. IEEE Trans. Geosci. Remote Sens. 2007, 45, 3307–3316. [Google Scholar] [CrossRef]
  28. Soruco, A.; Vincent, C.; Francou, B.; Ribstein, P.; Berger, T.; Sicart, J.E.; Wagnon, P.; Arnaud, Y.; Favier, V.; Lejeune, Y. Mass Balance of Glaciar Zongo, Bolivia, between 1956 and 2006, Using Glaciological, Hydrological and Geodetic Methods. Ann. Glaciol. 2009, 50, 1–8. [Google Scholar] [CrossRef]
  29. Soruco, Á.; Vincent, C.; Francou, B.; Rabatel, A. Comparación de métodos para estimar el balance de masa del glaciar de Zongo, Bolivia (16o S, 68o O). Geoacta 2014, 39, 154–164. [Google Scholar]
  30. Schauwecker, S.; Rohrer, M.; Huggel, C.; Endries, J.; Montoya, N.; Neukom, R.; Perry, B.; Salzmann, N.; Schwarb, M.; Suarez, W. The Freezing Level in the Tropical Andes, Peru: An Indicator for Present and Future Glacier Extents. J. Geophys. Res. Atmos. 2017, 122, 5172–5189. [Google Scholar] [CrossRef]
  31. Molina, E.; Schauwecker, S.; Huggel, C.; Haeberli, W.; Cochachin Rapre, A.; Condom, T.; Drenkhan, F.; Giráldez, C.; Salzmann, N.; Jiménez, L.; et al. Iniciación de un Monitoreo del Balance de Masa en el Glaciar Suyuparina, Cordillera Vilcanota, Perú; Autoridad Nacional del Agua: Lima, Peru, 2015. [Google Scholar]
  32. Franks, S.; Storey, J.; Rengarajan, R. The New Landsat Collection-2 Digital Elevation Model. Remote Sens. 2020, 12, 3909. [Google Scholar] [CrossRef]
  33. Rengarajan, R.; Choate, M.; Storey, J.; Franks, S.; Micijevic, E. Landsat Collection-2 Geometric Calibration Updates. In Proceedings of the Earth Observing Systems XXV; SPIE: Bellingham, WA, USA, 2020; Volume 11501, pp. 85–95. [Google Scholar]
  34. Aybar, C.; Fernández, C.; Huerta, A.; Lavado, W.; Vega, F.; Felipe-Obando, O. Construction of a High-Resolution Gridded Rainfall Dataset for Peru from 1981 to the Present Day. Hydrol. Sci. J. 2020, 65, 770–785. [Google Scholar] [CrossRef]
  35. Llauca, H.; Lavado-Casimiro, W.; Montesinos, C.; Santini, W.; Rau, P. PISCO_HyM_GR2M: A Model of Monthly Water Balance in Peru (1981–2020). Water 2021, 13, 1048. [Google Scholar] [CrossRef]
  36. Alawamy, J.S.; Balasundram, S.K.; Mohd. Hanif, A.H.; Boon Sung, C.T. Detecting and Analyzing Land Use and Land Cover Changes in the Region of Al-Jabal Al-Akhdar, Libya Using Time-Series Landsat Data from 1985 to 2017. Sustainability 2020, 12, 4490. [Google Scholar] [CrossRef]
  37. Chander, G.; Markham, B.L.; Helder, D.L. Summary of Current Radiometric Calibration Coefficients for Landsat MSS, TM, ETM+, and EO-1 ALI Sensors. Remote Sens. Environ. 2009, 113, 893–903. [Google Scholar] [CrossRef]
  38. Berk, A.; Bernstein, L.S.; Anderson, G.P.; Acharya, P.K.; Robertson, D.C.; Chetwynd, J.H.; Adler-Golden, S.M. MODTRAN Cloud and Multiple Scattering Upgrades with Application to AVIRIS. Remote Sens. Environ. 1998, 65, 367–375. [Google Scholar] [CrossRef]
  39. QGIS Development Team QGIS Geographic Information System. Available online: http://www.qgis.org/ (accessed on 10 March 2024).
  40. Autoridad Nacional del Agua; Dirección de Conservación y Planeamiento de Recursos Hídricos; Unidad de Glaciología y Recursos Hídricos. Inventario Nacional de Glaciares y Lagunas; Autoridad Nacional del Agua: Lima, Peru, 2014. [Google Scholar]
  41. The MathWorks Inc. MATLAB Version: 9.2 (R2017a) 2017; The MathWorks Inc.: Natick, MA, USA, 2017. [Google Scholar]
  42. R Core Team. The R Project for Statistical Computing. Available online: https://www.r-project.org/ (accessed on 2 May 2024).
  43. Stereńczak, K.; Ciesielski, M.; Balazy, R.; Zawiła-Niedźwiecki, T. Comparison of Various Algorithms for DTM Interpolation from LIDAR Data in Dense Mountain Forests. Eur. J. Remote Sens. 2016, 49, 599–621. [Google Scholar] [CrossRef]
  44. Hugonnet, R.; McNabb, R.; Berthier, E.; Menounos, B.; Nuth, C.; Girod, L.; Farinotti, D.; Huss, M.; Dussaillant, I.; Brun, F.; et al. Accelerated Global Glacier Mass Loss in the Early Twenty-First Century. Nature 2021, 592, 726–731. [Google Scholar] [CrossRef] [PubMed]
  45. Sikos, F.; Giráldez, C.; Schauwecker, S.; Molina, E.; Haeberli, W.; Drenkhan, F.; Salzmann, N.; Rado, M.; Chaparro, N.; Samata, J.; et al. Glacier Mass Balance in the Cordillera Vilcanota, Glacier Suyuparina, Cusco-Peru. In 19th EGU General Assembly, EGU2017, Conference Abstracts; Frontiers: Vienna, Austria, 2017; p. 7543. [Google Scholar]
  46. Garreaud, R.D.; Alvarez-Garreton, C.; Barichivich, J.; Boisier, J.P.; Christie, D.; Galleguillos, M.; LeQuesne, C.; McPhee, J.; Zambrano-Bigiarini, M. The 2010–2015 Megadrought in Central Chile: Impacts on Regional Hydroclimate and Vegetation. Hydrol. Earth Syst. Sci. 2017, 21, 6307–6327. [Google Scholar] [CrossRef]
  47. Montoya, N. Application of Terrestrial Scanning LIDAR to Study the Evolution of Surface Change of Quisoquipina and Suyuparina Glaciers in the Cordillera Vilcanota, Cusco-Peru. In AGU Fall Meeting 2019, General Assembly Conference Abstracts; American Geosciences Union: San Francisco, CA, USA, 2019; Volume 2019, p. C31B-1521. [Google Scholar]
  48. Kaser, G. Glacier-Climate Interaction at Low Latitudes. J. Glaciol. 2001, 47, 195–204. [Google Scholar] [CrossRef]
  49. Kaser, G.; Juen, I.; Georges, C.; Gómez, J.; Tamayo, W. The Impact of Glaciers on the Runoff and the Reconstruction of Mass Balance History from Hydrological Data in the Tropical Cordillera Blanca, Perú. J. Hydrol. 2003, 282, 130–144. [Google Scholar] [CrossRef]
  50. Perry, L.B.; Seimon, A.; Andrade-Flores, M.F.; Endries, J.L.; Yuter, S.E.; Velarde, F.; Arias, S.; Bonshoms, M.; Burton, E.J.; Winkelmann, I.R.; et al. Characteristics of Precipitating Storms in Glacierized Tropical Andean Cordilleras of Peru and Bolivia. Ann. Am. Assoc. Geogr. 2017, 107, 309–322. [Google Scholar] [CrossRef]
  51. Kaser, G. A Review of the Modern Fluctuations of Tropical Glaciers. Glob. Planet. Change 1999, 22, 93–103. [Google Scholar] [CrossRef]
  52. Mark, B.G.; Seltzer, G.O. Evaluation of Recent Glacier Recession in the Cordillera Blanca, Peru (AD 1962–1999): Spatial Distribution of Mass Loss and Climatic Forcing. Quat. Sci. Rev. 2005, 24, 2265–2280. [Google Scholar] [CrossRef]
  53. Pritchard, H.D. Asia’s Shrinking Glaciers Protect Large Populations from Drought Stress. Nature 2019, 569, 649–654. [Google Scholar] [CrossRef]
  54. Veettil, B.K.; Kamp, U. Global Disappearance of Tropical Mountain Glaciers: Observations, Causes, and Challenges. Geosciences 2019, 9, 196. [Google Scholar] [CrossRef]
  55. Ferreira, Z.A.; Cabral, P. A Comparative Study about Vertical Accuracy of Four Freely Available Digital Elevation Models: A Case Study in the Balsas River Watershed, Brazil. ISPRS Int. J. Geo-Inf. 2022, 11, 106. [Google Scholar] [CrossRef]
  56. Persoiu, A.; Buzjak, N.; Onaca, A.; Pennos, C.; Sotiriadis, Y.; Ionita, M.; Zachariadis, S.; Styllas, M.; Kosutnik, J.; Hegyi, A.; et al. Record Summer Rains in 2019 Led to Massive Loss of Surface and Cave Ice in SE Europe. Cryosphere 2021, 15, 2383–2399. [Google Scholar] [CrossRef]
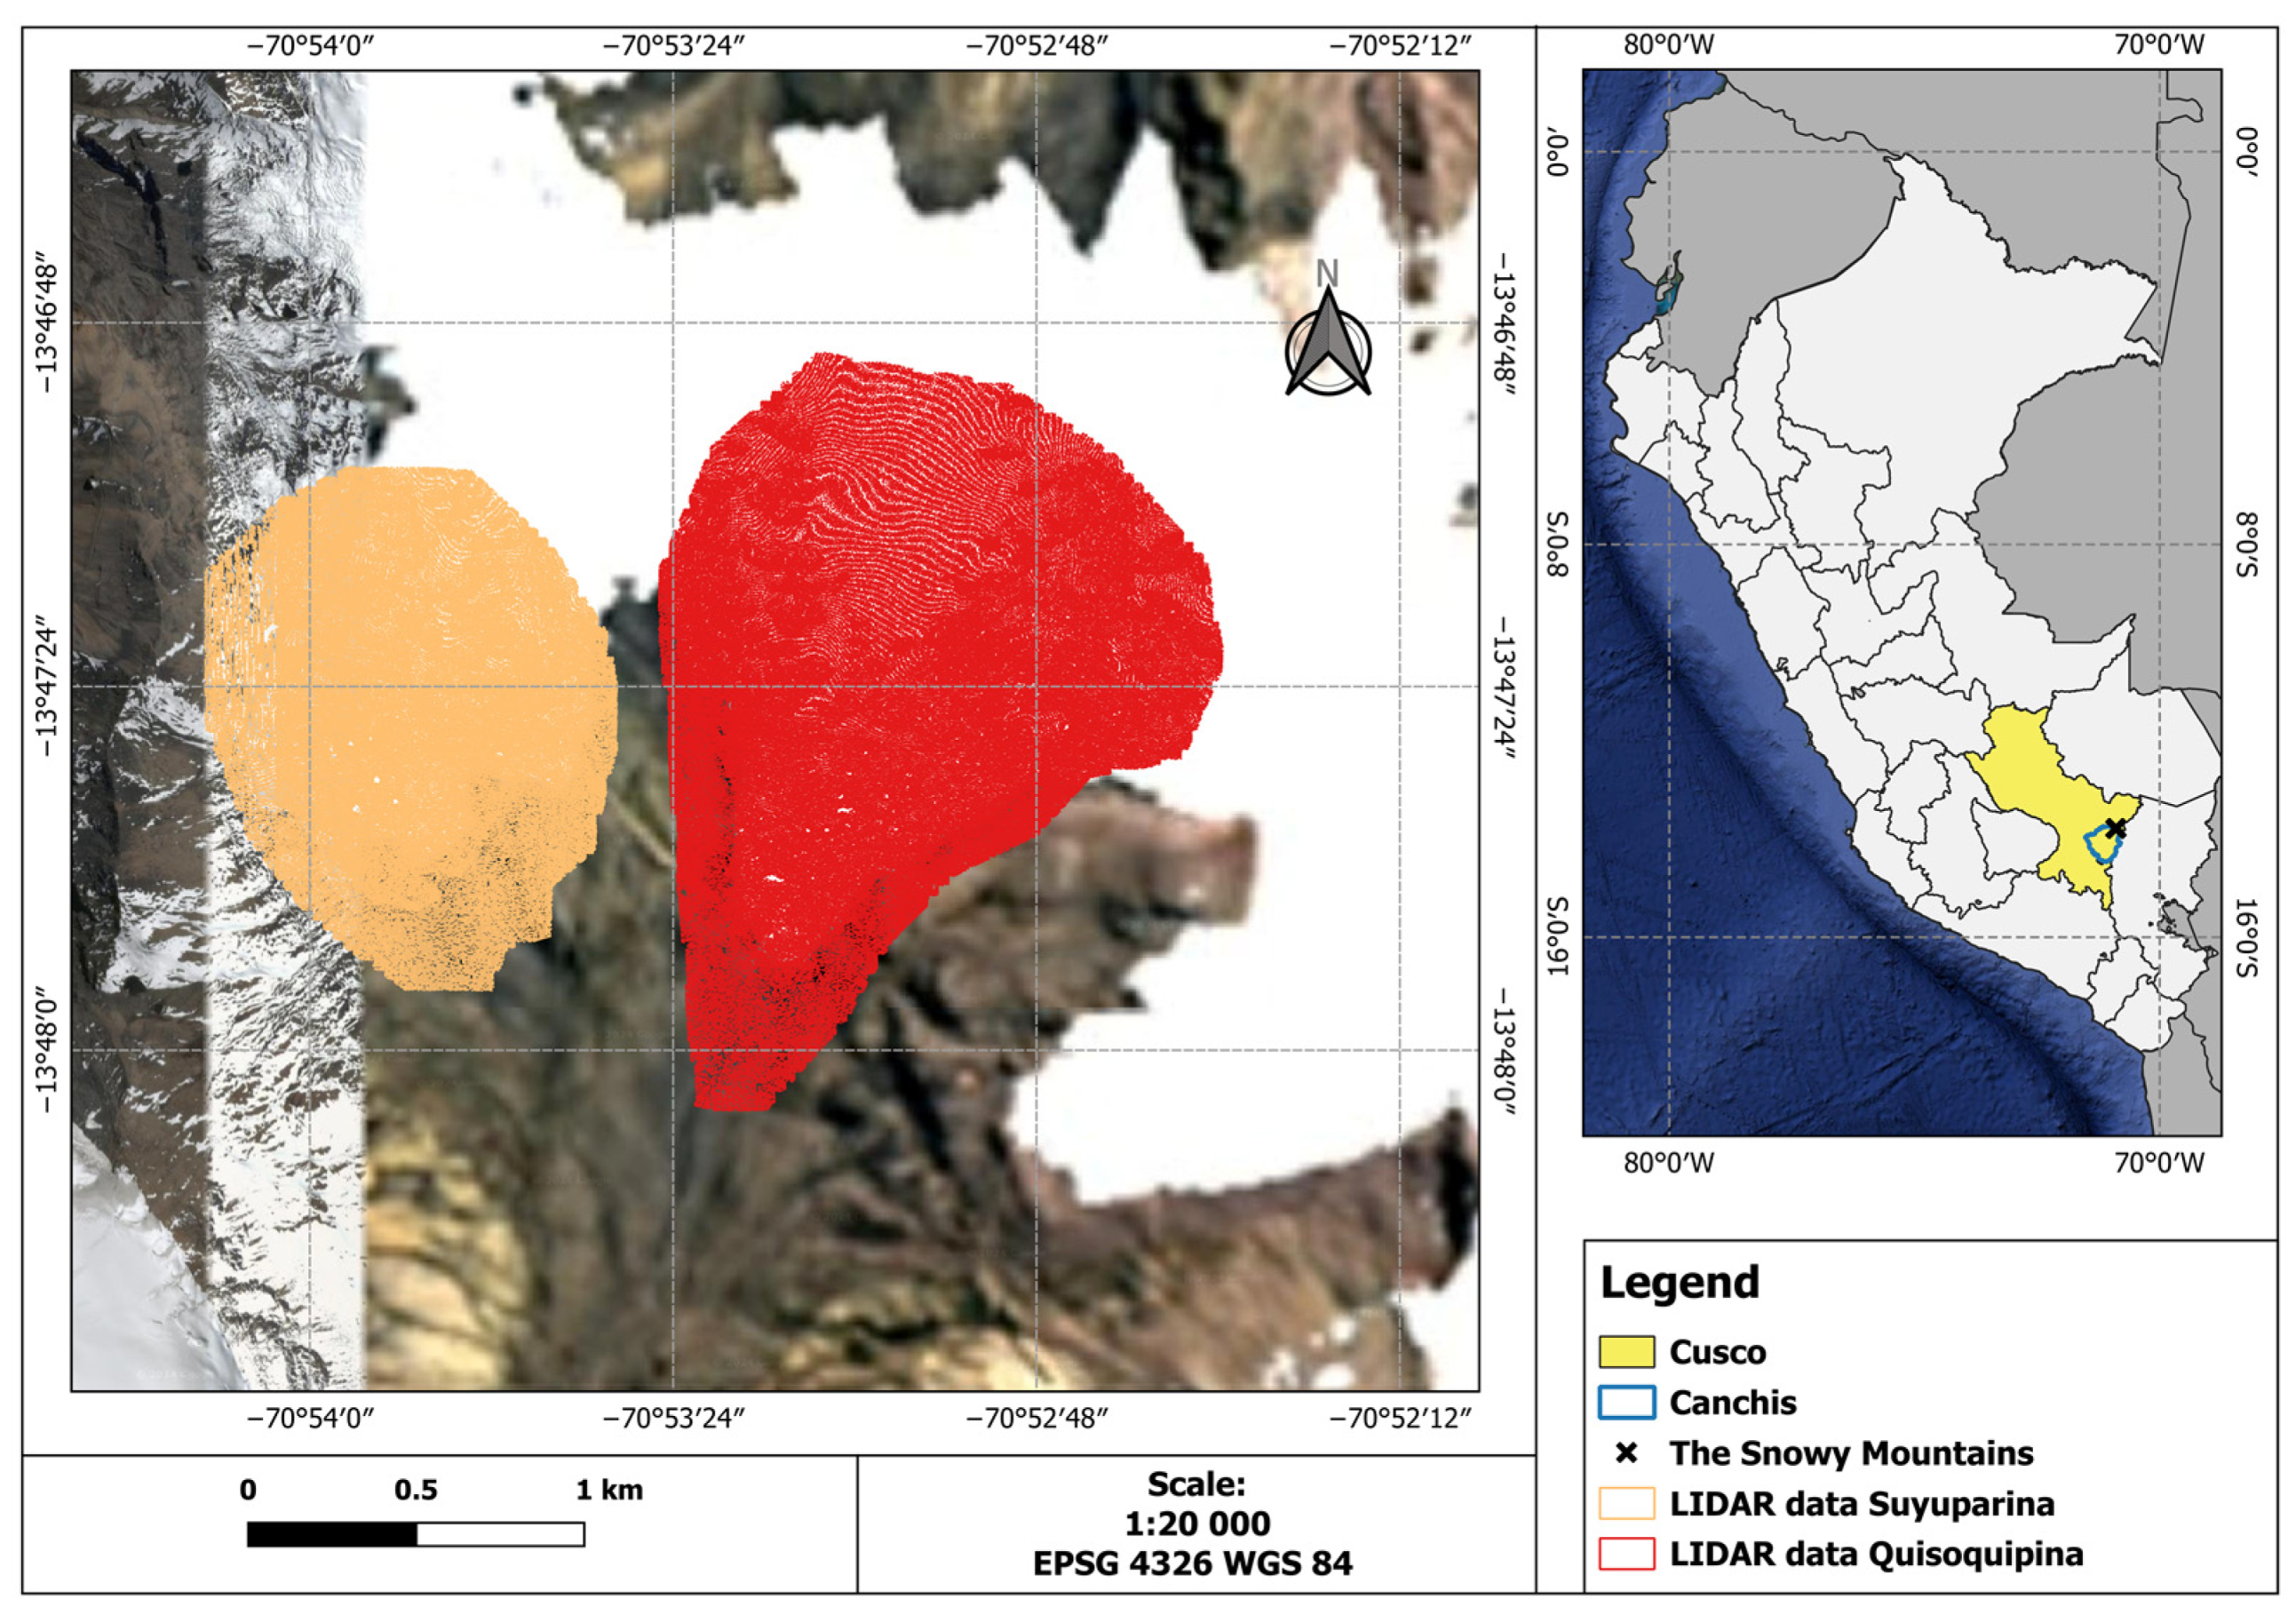
Figure 1. An Airborne LIDAR point cloud of 3.2 m spatial resolution was acquired on the Suyuparina and Quisoquipina glaciers in the province of Canchis, Cusco.
Remotesensing 16 03901 g001
Figure 2. Binarized NDSI images recovered from Landsat 5 images from May 1990 (A) and Landsat 7 from April 2013 (B) for the Suyuparina and Quisoquipina glaciers. In orange and red, the shapefiles of the Suyuparina and Quisoquipina glaciers are delimited by expert criteria.
Remotesensing 16 03901 g002
Figure 3. Processing scheme. Blue represents inputs, green represents processing, yellow represents intermedium processing, and purple represents outputs.
Remotesensing 16 03901 g003
Figure 4. (A) Glacierized area of Quisoquipina, and (B) Suyuparina glaciers. In gray is the uncertainty band of the estimated glacier area.
Remotesensing 16 03901 g004
Figure 5. (Up) Glaciated area of Quisoquipina, and Suyuparina glaciers (Down) analyzed from 1990 to 1999 and from 2000 to 2013.
Remotesensing 16 03901 g005
Figure 6. (A) Volume changes of the Quisoquipina and (B) Suyuparina glaciers. Confidence intervales to the linear fitted model, shown in gray.
Remotesensing 16 03901 g006
Figure 7. (A) Glacierized outlines of Suyuparina and Quisoquipina glaciers. (B) Elevation change based on ALOS and LIDAR DEM analysis. Snow glaciological stakes installed between 2014 to 2016 are shown as reference. The background image corresponds to Google Earth 2019.
Remotesensing 16 03901 g007
Figure 8. Scatterplots of climatic and glacier surface changes. MeanAPE: Mean annual potential evapotranspiration (mm/day), MeanAP: Annual mean precipitation (mm/day), MaxAAT: Max. annual air temperature (°C), MinAAT: Min. annual air temperature (°C), MeanAMAT: Mean annual mean air temperature (°C).
Remotesensing 16 03901 g008
Table 1. Change rates of glaciers area from 1990 to 1999 and from 2000 to 2013. Significance (p) denoted as ** = p < 0.01, *** = p < 0.001.
GlacierPeriodRate (Km2/year)Confidence Interval (Km2/year)R2
Quisoquipina1990–1999−0.00632[−0.00286, −0.00978]0.52 (**)
Quisoquipina2000–2013−0.0155[−0.01252, −0.01848]0.94 (***)
Suyuparina1990–1999−0.00947[−0.00720, −0.01173]0.85 (***)
Suyuparina2000–2013−0.0163[−0.01164, −0.02102]0.89 (***)
Table 2. Volume of glacier mass (km3) of the Quisoquipina and Suyuparina glaciers.
PlatformDEMLandsat 7Quisoquipina (km3)Suyuparina (km3)
ALOS16 October 200615 October 200611.73006.2571
ALOS26 November 20062 December 200611.77326.2062
ALOS10 June 200728 June 200711.64306.4272
ALOS26 July 200715 August 200711.75526.4872
ALOS12 June 200830 June 200811.67366.3754
ALOS28 July 200816 July 200811.68996.3852
ALOS31 July 20094 August 200911.63336.3615
ALOS3 May 20103 May 201011.53226.1190
ALOS3 August 20107 August 201011.41486.1506
Aerial LIDAR5 April 20135 April 201311.03985.9313
Table 3. Correlation coefficients for drivers of snow area change. Significance (p) denoted as * = p < 0.05.
Climate variablesQuisoquipina RSuyuparina R
Mean annual potential evapotranspiration−0.1395
(0.6063)
0.1484
(0.6126)
Mean annual precipitation−0.5236
(0.0374) *
−0.0610
(0.8358)
Max. annual air temperature−0.2298
(0.3918)
−0.3107
(0.2796)
Mean. annual air temperature−0.3405
(0.1969)
−0.2642
(0.3614)
Min. annual air temperature−0.3634
(0.1665)
−0.1229
(0.6754)
Disclaimer/Publisher’s Note: The statements, opinions and data contained in all publications are solely those of the individual author(s) and contributor(s) and not of MDPI and/or the editor(s). MDPI and/or the editor(s) disclaim responsibility for any injury to people or property resulting from any ideas, methods, instructions or products referred to in the content.