Article

Three-Dimensional Geometric-Physical Modeling of an Environment with an In-House-Developed Multi-Sensor Robotic System

1
Key Laboratory for Information Science of Electromagnetic Waves (MoE), Fudan University, Shanghai 200433, China
2
Huawei Technologies Co., Ltd., Shenzhen 518129, China
*
Author to whom correspondence should be addressed.
Remote Sens. 2024, 16(20), 3897; https://doi.org/10.3390/rs16203897
Submission received: 6 August 2024 / Revised: 17 October 2024 / Accepted: 17 October 2024 / Published: 20 October 2024

Abstract

:
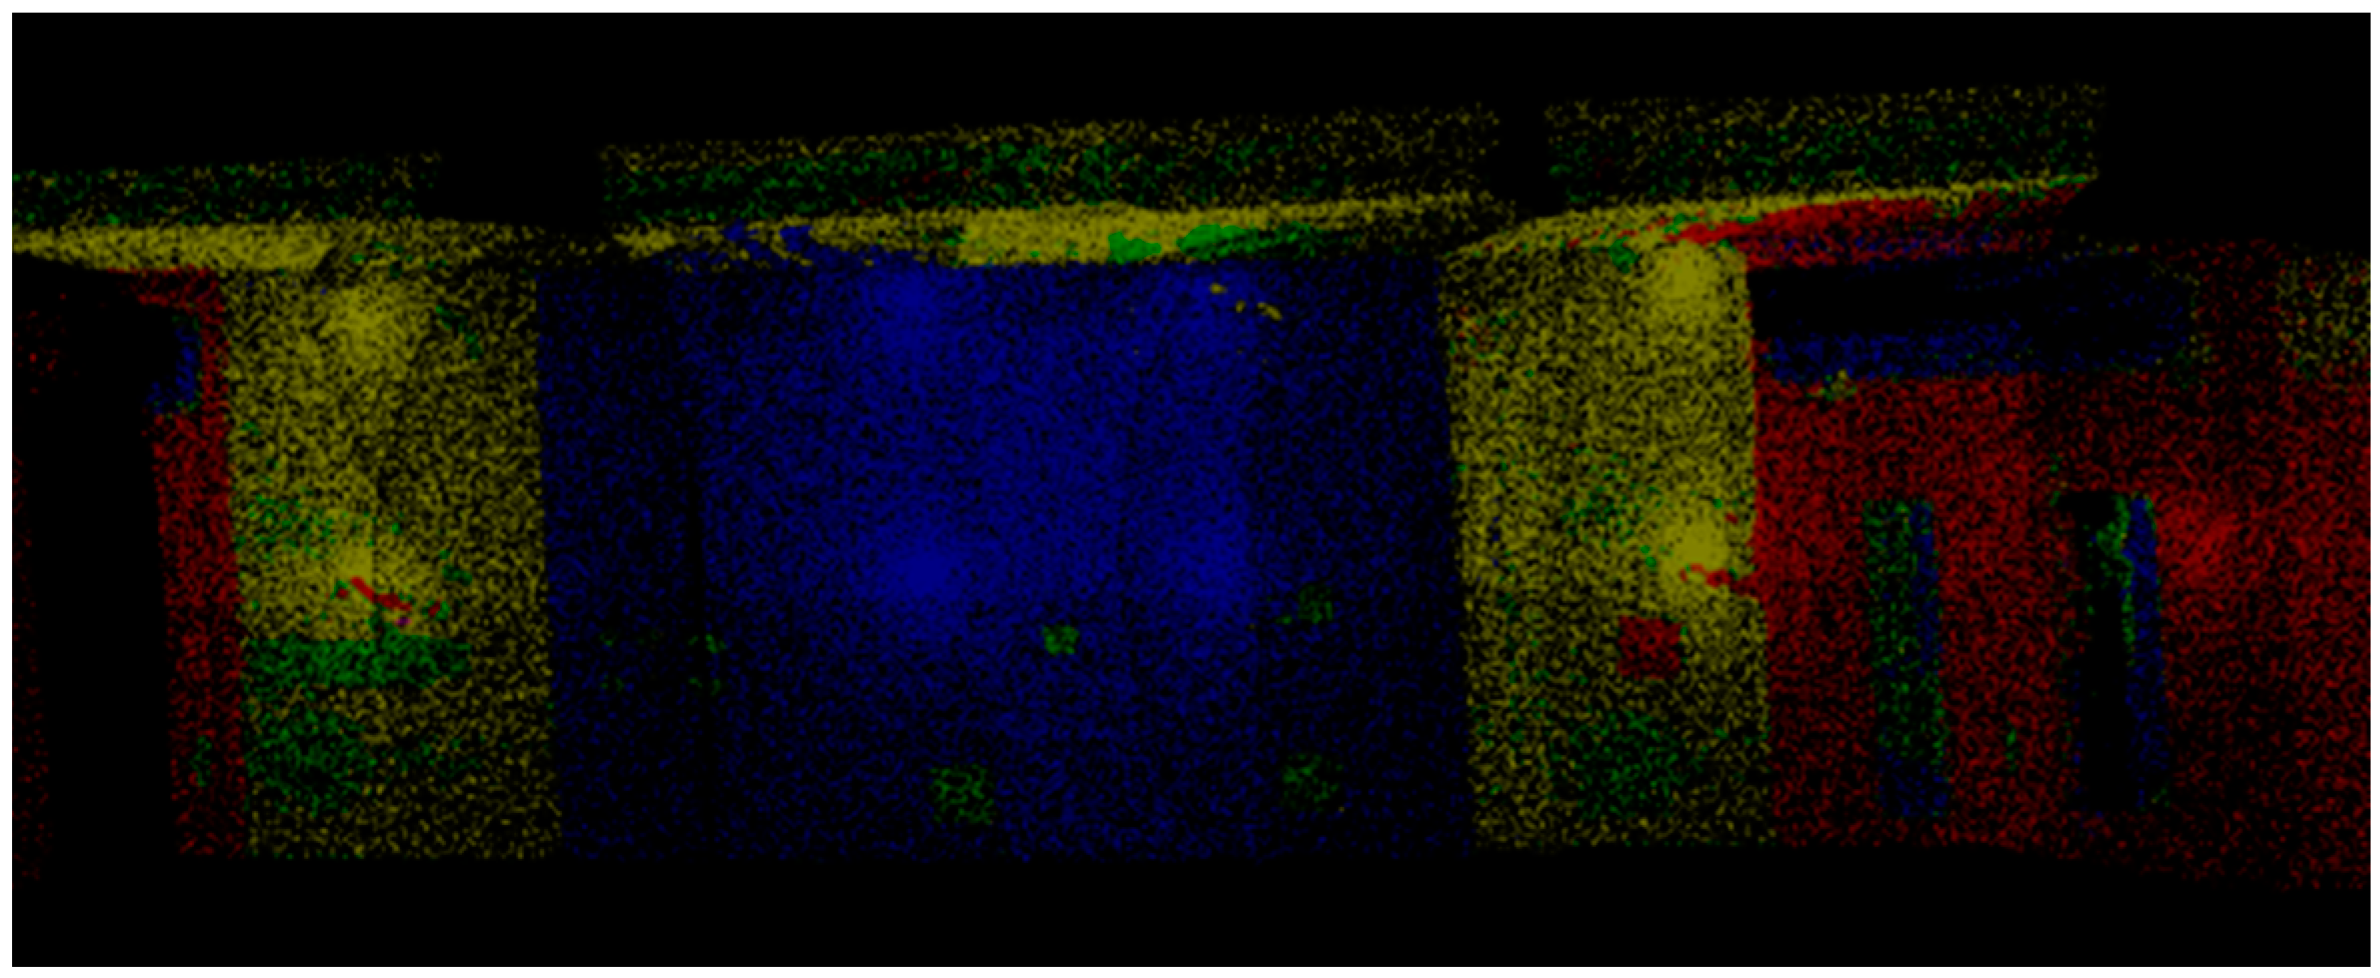
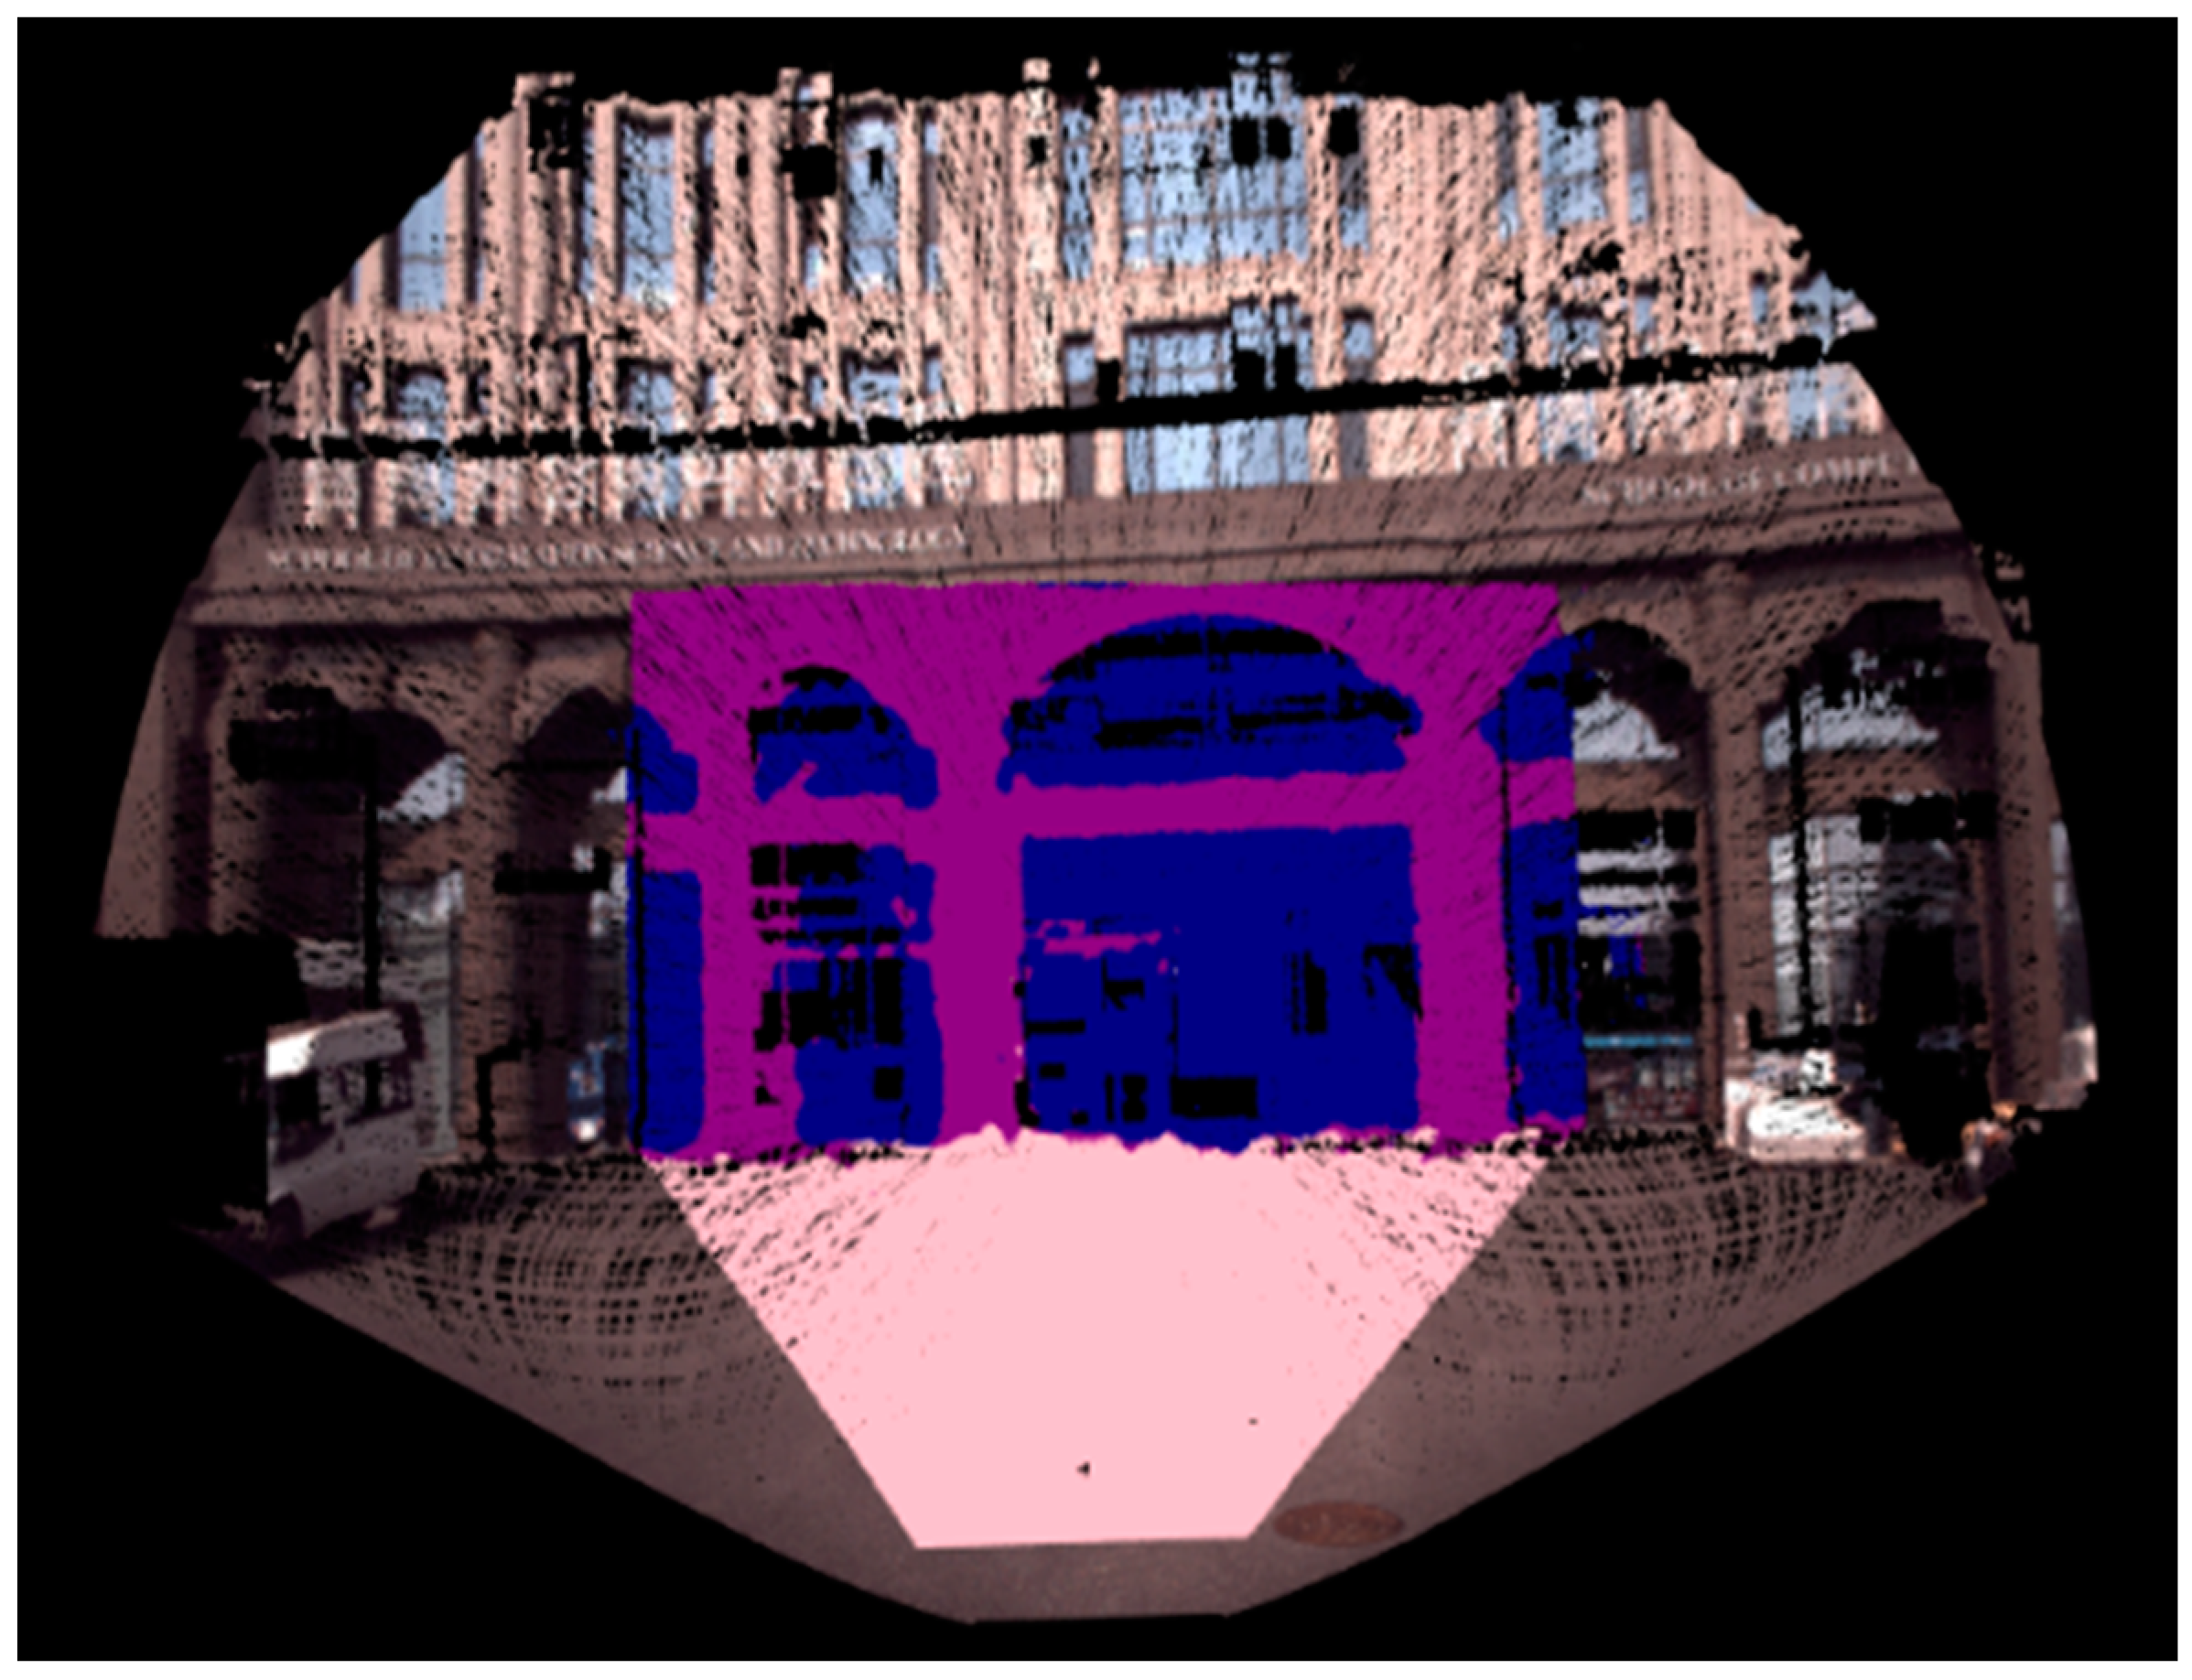
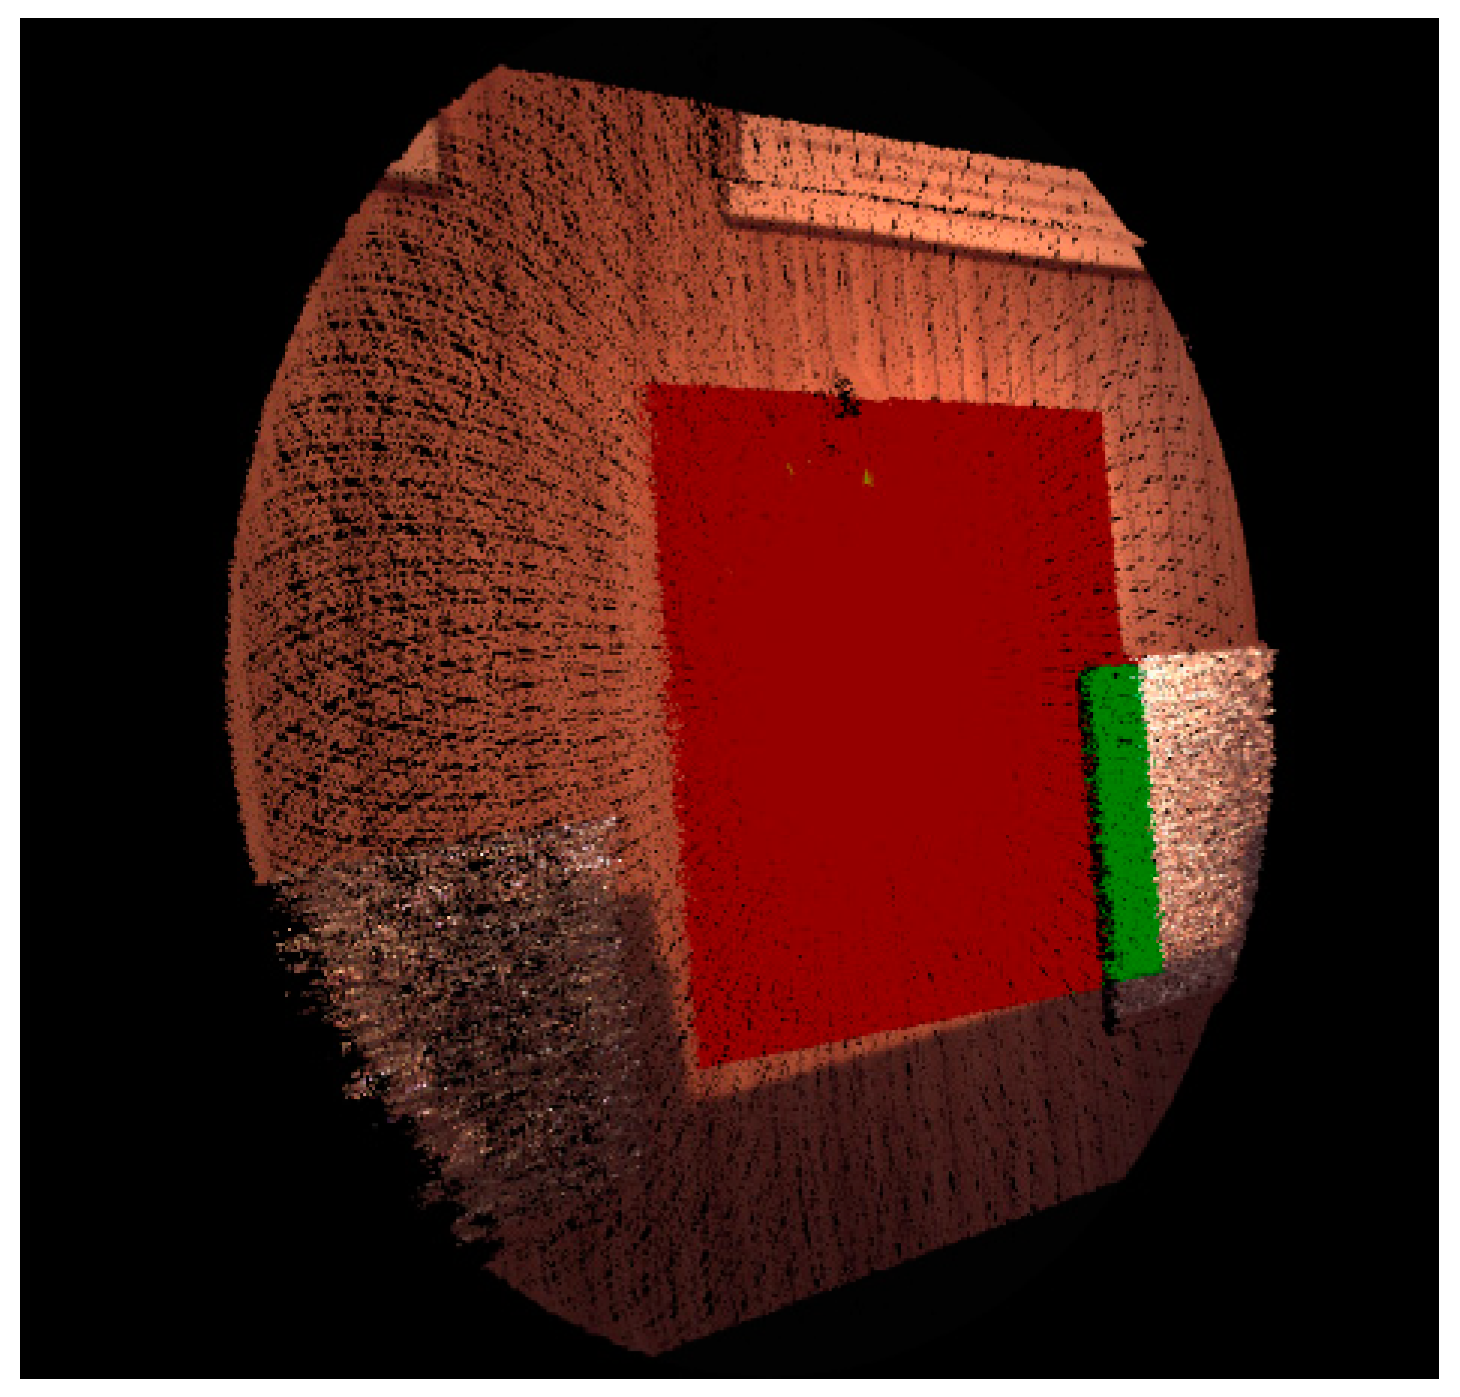
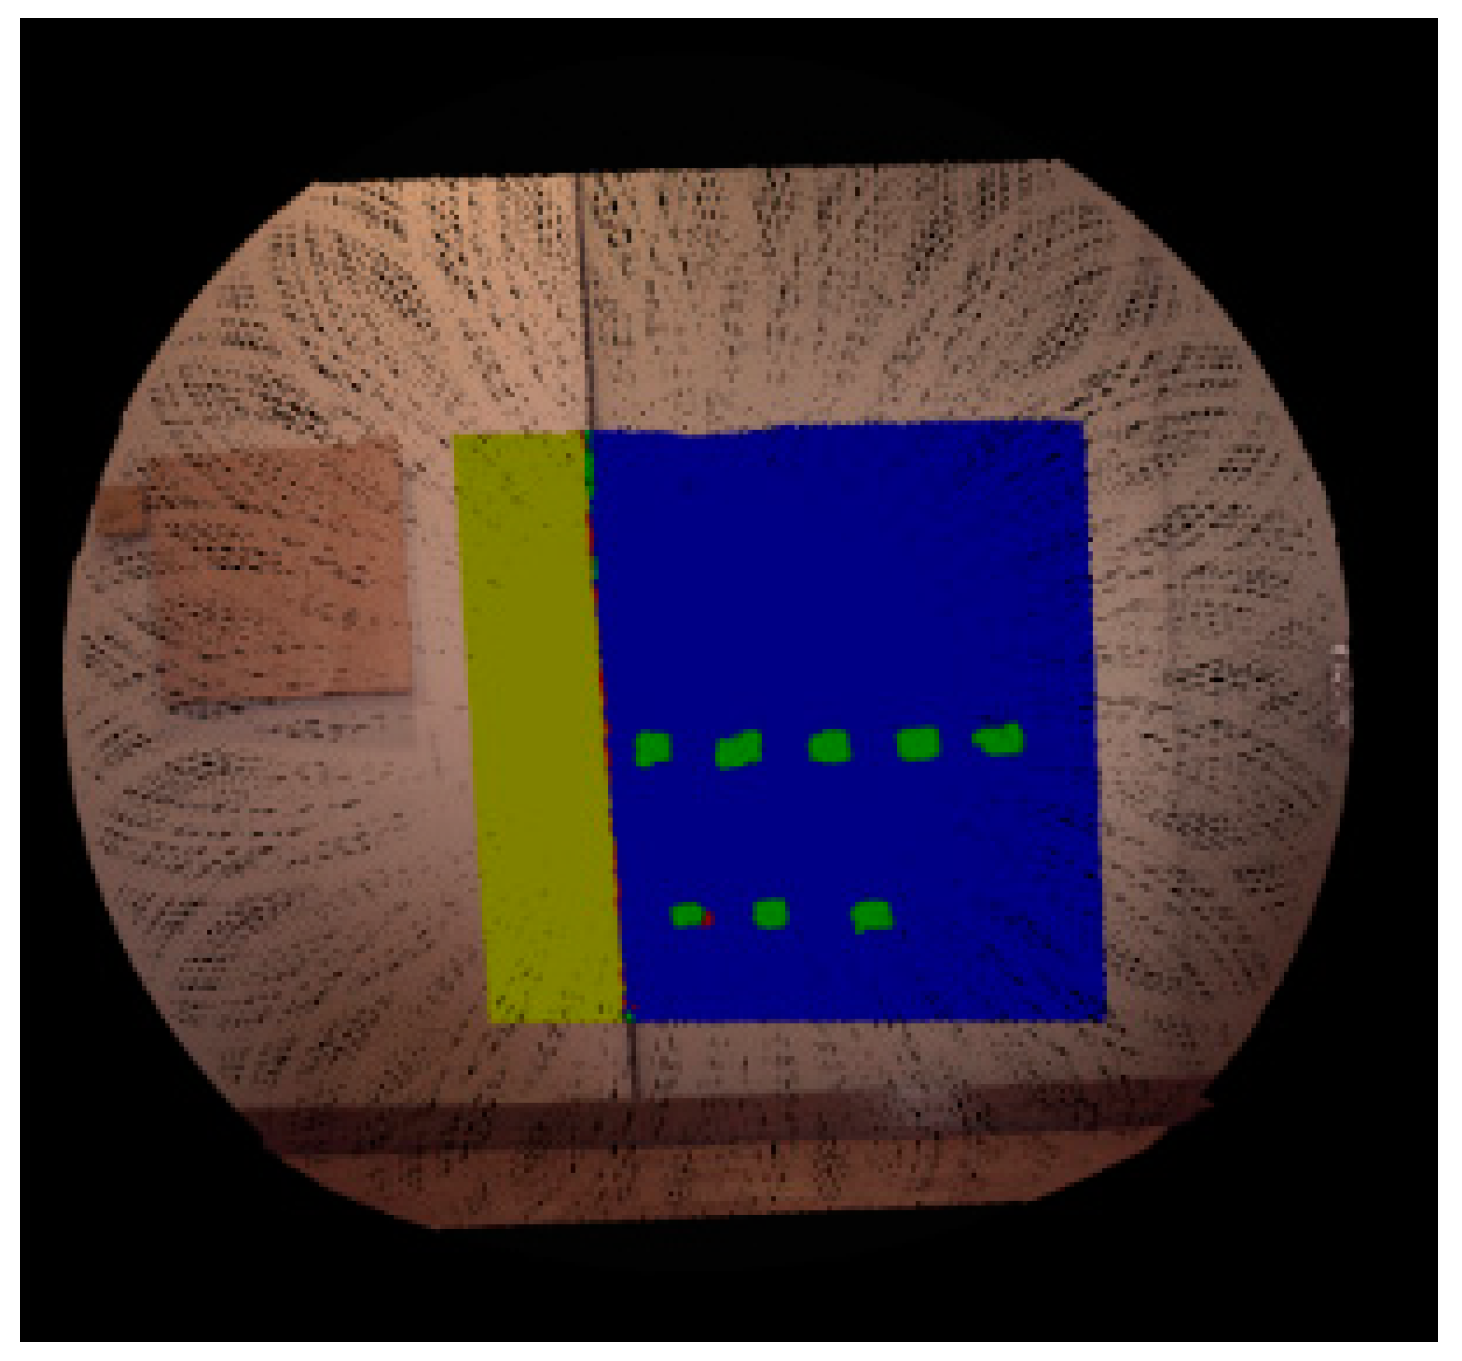
Environment 3D modeling is critical for the development of future intelligent unmanned systems. This paper proposes a multi-sensor robotic system for environmental geometric-physical modeling and the corresponding data processing methods. The system is primarily equipped with a millimeter-wave cascaded radar and a multispectral camera to acquire the electromagnetic characteristics and material categories of the target environment and simultaneously employs light detection and ranging (LiDAR) and an optical camera to achieve a three-dimensional spatial reconstruction of the environment. Specifically, the millimeter-wave radar sensor adopts a multiple input multiple output (MIMO) array and obtains 3D synthetic aperture radar images through 1D mechanical scanning perpendicular to the array, thereby capturing the electromagnetic properties of the environment. The multispectral camera, equipped with nine channels, provides rich spectral information for material identification and clustering. Additionally, LiDAR is used to obtain a 3D point cloud, combined with the RGB images captured by the optical camera, enabling the construction of a three-dimensional geometric model. By fusing the data from four sensors, a comprehensive geometric-physical model of the environment can be constructed. Experiments conducted in indoor environments demonstrated excellent spatial-geometric-physical reconstruction results. This system can play an important role in various applications, such as environment modeling and planning.

Graphical Abstract

1. Introduction

Intelligent unmanned system technologies, which integrate artificial intelligence, computer science, and numerous other cutting-edge disciplines, hold significant potential for applications across various fields and represent an inevitable trend in the advancement of human technology [1,2,3]. These systems often need to perceive their surrounding environment to achieve objectives such as target searching, path planning, and navigation. Moreover, one of the essential tasks of many intelligent unmanned systems is to perform geometric reconstruction and acquire physical properties of the environments [4,5]. And through algorithmic design or the use of advanced equipment to construct indoor geometric models and identify the internal surface materials of buildings, it is helpful to construct an indoor electromagnetic environment conducive to the construction of communication base stations, unmanned operations, and other applications.
To simultaneously capture multi-source information such as geometric details, electromagnetic properties, and color data of the environment, this paper introduces a geometric-physical 3D collaborative modeling method underpinned by multi-sensor information fusion. This method incorporates a multi-sensor system architecture and employs a distributed algorithm for multi-sensor information fusion processing. The sensor suite includes millimeter-wave cascaded radars, multispectral cameras, LiDAR, and RGB cameras, all operating in a decentralized manner. The millimeter-wave cascaded radars and multispectral cameras utilize imaging techniques to capture high spatial resolution physical attributes of the environment.
Specifically, the system’s millimeter-wave radar employs a one-dimensional MIMO array configuration, consisting of 12 transmit antennas and 16 receive antennas operating through time-division multiplexing. By performing mechanical scanning perpendicular to the array, it can acquire 3D synthetic aperture radar images, thereby capturing the electromagnetic property of the environment. The system’s multispectral camera features 9 channels, which not only capture spatial dimensions of the target but also gather rich spectral information for material identification and clustering. Additionally, the LiDAR system obtains three-dimensional point clouds, the optical camera captures optical images, and a detailed three-dimensional geometric model of the environment is constructed using a method of hand–eye calibration combined with edge feature extraction. The four sensors initially perform data analysis, followed by sensor registration to align and unify coordinate systems. Fusion of multispectral images with the three-dimensional geometric model enriches the target environment’s point clouds with material information attributes. Furthermore, clustering results from the multispectral camera are integrated into the three-dimensional geometric model. The fusion of millimeter-wave radar imaging results and the three-dimensional geometric model appends scattering information to each resolution cell of the target environment. Moreover, clustering outcomes from the multispectral camera and scattering information from the millimeter-wave radar are fused through the geometric model, yielding scattering characteristic curves for the same material under various incidence angles, which is of great usage in special applications such as wireless planning.
The primary contributions of this study are outlined as follows:
1. An integrated multi-sensor detection scheme is proposed, facilitating simultaneous 3D geometric-physical modeling of the environment. Great potential for broad applications is demonstrated by this scheme.
2. A novel high-resolution millimeter-wave imaging technology for material detection is introduced, employing a large MIMO array in one dimension and a synthetic aperture by moving in another. This technology is designed to capture electromagnetic scattering curves of the environmental materials at various incidence angles.
3. A method based on multi-sensor information intercommunication is proposed to obtain electromagnetic characteristics of any material in the target environment.
The system uses the point cloud as a base to describe the three-dimensional space and then attaches information such as the material type captured to the point cloud, with each point having its own physical characteristics. Benefiting from the multiple pose adjustment devices and mobile devices in the system, the system can be used normally in slightly crowded or wide actual scenes.
The remainder is organized as follows: Section 2 introduces the design of the multi-sensor environmental perception system, encompassing both the hardware configuration and the overall workflow. Section 3 describes the methods used by the sensors to obtain the physical characteristics of the target, including millimeter-wave imaging and multispectral material recognition techniques. Section 4 details the process of geometric modeling implemented by the system. Section 5 discusses the geometric-physical modeling achieved through the fusion of multi-sensor data. Section 6 presents the experimental measurements conducted by the system, showcasing both the methodology and results.

2. Related Work

To achieve environmental perception and modeling, intelligent unmanned systems utilize various sensors to collect data and employ algorithms to reconstruct the perceived spatial environment and its physical properties. The following is an explanation of the existing work from three perspectives: geometric modeling, physical modeling, and information fusion.

2.1. Geometric Modeling

The construction of geometric models of targets necessitates the capture of three-dimensional information, primarily through sensors such as visual cameras and LiDAR [6,7]. Visual sensors, which rely on configurations such as monocular and binocular cameras, capture environmental color information, are cost-effective, and produce high-quality images. These sensors, by estimating changes in their pose through multiple frames and accumulating these changes, can calculate distances to objects and perform tasks such as localization and map construction [8,9]. However, despite their benefits, visual sensors lack the capability to directly acquire depth information, limiting their accuracy in 3D reconstruction. LiDAR, which captures high-resolution distance information through the mechanical scanning of multiple laser beams, serves as a primary tool for obtaining 3D geometric information but fails to capture the color/texture details of the scene [10,11]. Consequently, to accurately reconstruct the geometric structure of target scenes, a fusion of visual and LiDAR sensors is the most often used approach.

2.2. Physical Modeling

For more advanced or specialized applications, it is necessary to obtain physical or material property of the environment or targets, which involves identifying information such as the types of materials involved. Existing methods for material identification include X-ray technology, ultrasonic technology, infrared technology, and multispectral technology, among others [12,13,14]. X-ray technology produces radiation that is harmful to humans; ultrasonic technology is unsuitable for long-range detection; and infrared technology has relatively low identification accuracy. Multispectral technology not only captures the spatial dimensions of objects like traditional RGB imaging but also acquires spectral information, better reflecting the spectral absorption and reflection characteristics of materials. This technology can effectively distinguish between different materials, playing a significant role in the field of material identification. However, multispectral technology cannot penetrate surface coatings to detect the underneath materials, whereas microwave radar technology has the capability to penetrate and detect materials below coatings and even deeper. Microwave radar operates in all-weather and all-time and has certain penetration capabilities [15]. Millimeter-wave technology, which lies between microwaves and far-infrared waves, combines penetration ability with high imaging resolution, giving it a unique advantage in high-resolution material identification [16]. Traditional material inversion techniques based on millimeter or microwave waves rely on the principle that different frequencies of signals lose different amounts of energy when passing through various materials, allowing for the identification of different materials. However, traditional methods, which require fixed test benches, cannot be flexibly applied to real-world operation scenarios, and the thickness of the materials also needs to be strictly controlled. Therefore, millimeter-wave imaging radar, which provides in-situ detection of environmental materials, is more suitable for the sensing technology of intelligent unmanned systems.

2.3. Information Fusion of Sensors

Note that the aforementioned sensors often have limited functionality when operating independently. To address this issue, cooperative use of sensors, known as Multi-sensor Information Fusion (MSIF), is required [17]. This approach, akin to the human brain’s process of integrating information, involves a multi-level and multi-spatial strategy for complementing and optimally combining data from various sensors. Such integration not only produces a consistent interpretation of the observed environment but also significantly enhances the system’s redundancy and fault tolerance, thereby ensuring rapid and accurate decision-making that typically surpasses the capabilities achievable by any single sensor. The operational modes of multi-sensor information fusion systems include centralized, decentralized, and hybrid approaches, among others [18]. Decentralized systems primarily handle the raw data obtained from individual sensors locally, then combine the results for optimization to achieve the final objectives. This architecture benefits from low communication bandwidth requirements, enhanced reliability, and faster processing speeds, making it a popular choice in current multi-sensor systems.
In summary, the proposed system chooses millimeter-wave radar, multispectral camera, LiDAR, and RGB camera as the main sensors, and multi-sensor decentralized operation and information fusion as the means to achieve geometric-physical modeling of the target environment.

3. FUSEN: The Multi-Sensor Robotic System for Enhanced Environmental Perception

3.1. FUSEN System Architecture

This section primarily details the hardware design of the in-house developed multi-sensor robotic system named FUSEN. The physical layout of the system is illustrated in Figure 1a. To facilitate geometric-physical collaborative modeling, the system incorporates multiple sensors and auxiliary sensor working structures. An architectural diagram of the system is depicted in Figure 1b. Functionally, the system is segmented into four subsystems: the acquisition subsystem, the attitude control subsystem, the mobility subsystem, and the control subsystem. This description will cover the operational tasks and components of each subsystem, as well as the system’s operating mode and key sensor characteristics.

3.1.1. Subsystem Composition

The acquisition subsystem comprises four sensors: 1. millimeter-wave radar; 2. multispectral camera; 3. RGB camera; 4. LiDAR. Among these, the millimeter-wave radar and the laser radar are active sensors that transmit and receive signals. Conversely, the multispectral camera and RGB camera function as passive sensors, collecting data directly from the target scene.
The attitude control subsystem includes the following: 5. electric translation stage; 6. ranging radar; 7. turntable; and 8. pitch stage. Specifically, adjusts the attitude of the millimeter-wave radar to provide scanning space. Figure 2(a1–c1) show the positions of the electric translation stage at 0cm, 10cm and 20cm, respectively. The ranging radar (6) is utilized to precisely measure the displacement of the electric translation stage. The turntable (8) manages the horizontal rotation of all systems, except for the mobile subsystem, within a range of −180 to 180 degrees, as shown in Figure 2(a2–c2) at rotations of 0°, 45° and 90°, respectively. The pitch stage (7) regulates the pitch state of the acquisition subsystem and also adjusts the electric translation table, capable of reaching a maximum elevation angle of 60 degrees. The respective pitch angles of 30°, 45°, and 60° are demonstrated in Figure 2(a3), Figure 2(b3) and Figure 2(c3), respectively.
The mobile subsystem comprises a crawler trolley (9), which is responsible for the movement of the entire system. This trolley enables flexible data collection over large scales and extensive areas. It features a low center of gravity and stable travel capabilities, achieving a travel speed of approximately 0.4 m/s.
The control subsystem includes a microcomputer (10) and a remote machine integrated within the system. The microcomputer manages the control programs for all subsystems. Additionally, the remote functionality enhances the system’s operability in larger scenes and provides convenience for extensive measurements.

3.1.2. Sensor Installation

The devices labeled multispectral camera (2), RGB camera (3), and laser radar (4) in Figure 1a are positioned at the highest part of the structure and are arranged in a row. This configuration aligns the sensors at a similar elevation, facilitating the fusion of collected data. It is worth noting that when targeting measurements, calculations for distance and range should use the sensor with the narrowest field of view (FOV)—the multispectral camera (2).
Additionally, the origin of the coordinates for the laser radar (4) is strategically placed at the center of the turntable’s rotating axis, which aids in quickly reconstructing the three-dimensional scene during data processing. The electric translation stage (5) serves to move the millimeter-wave radar (1) for data collection, facilitating three-dimensional imaging and enhancing vertical resolution. The four sensors, millimeter-wave radar (1), multispectral camera (2), RGB camera (3), and LiDAR (4), are oriented in the same direction, allowing simultaneous data collection, and are mounted on rigid brackets.

3.1.3. Sensor Parameters

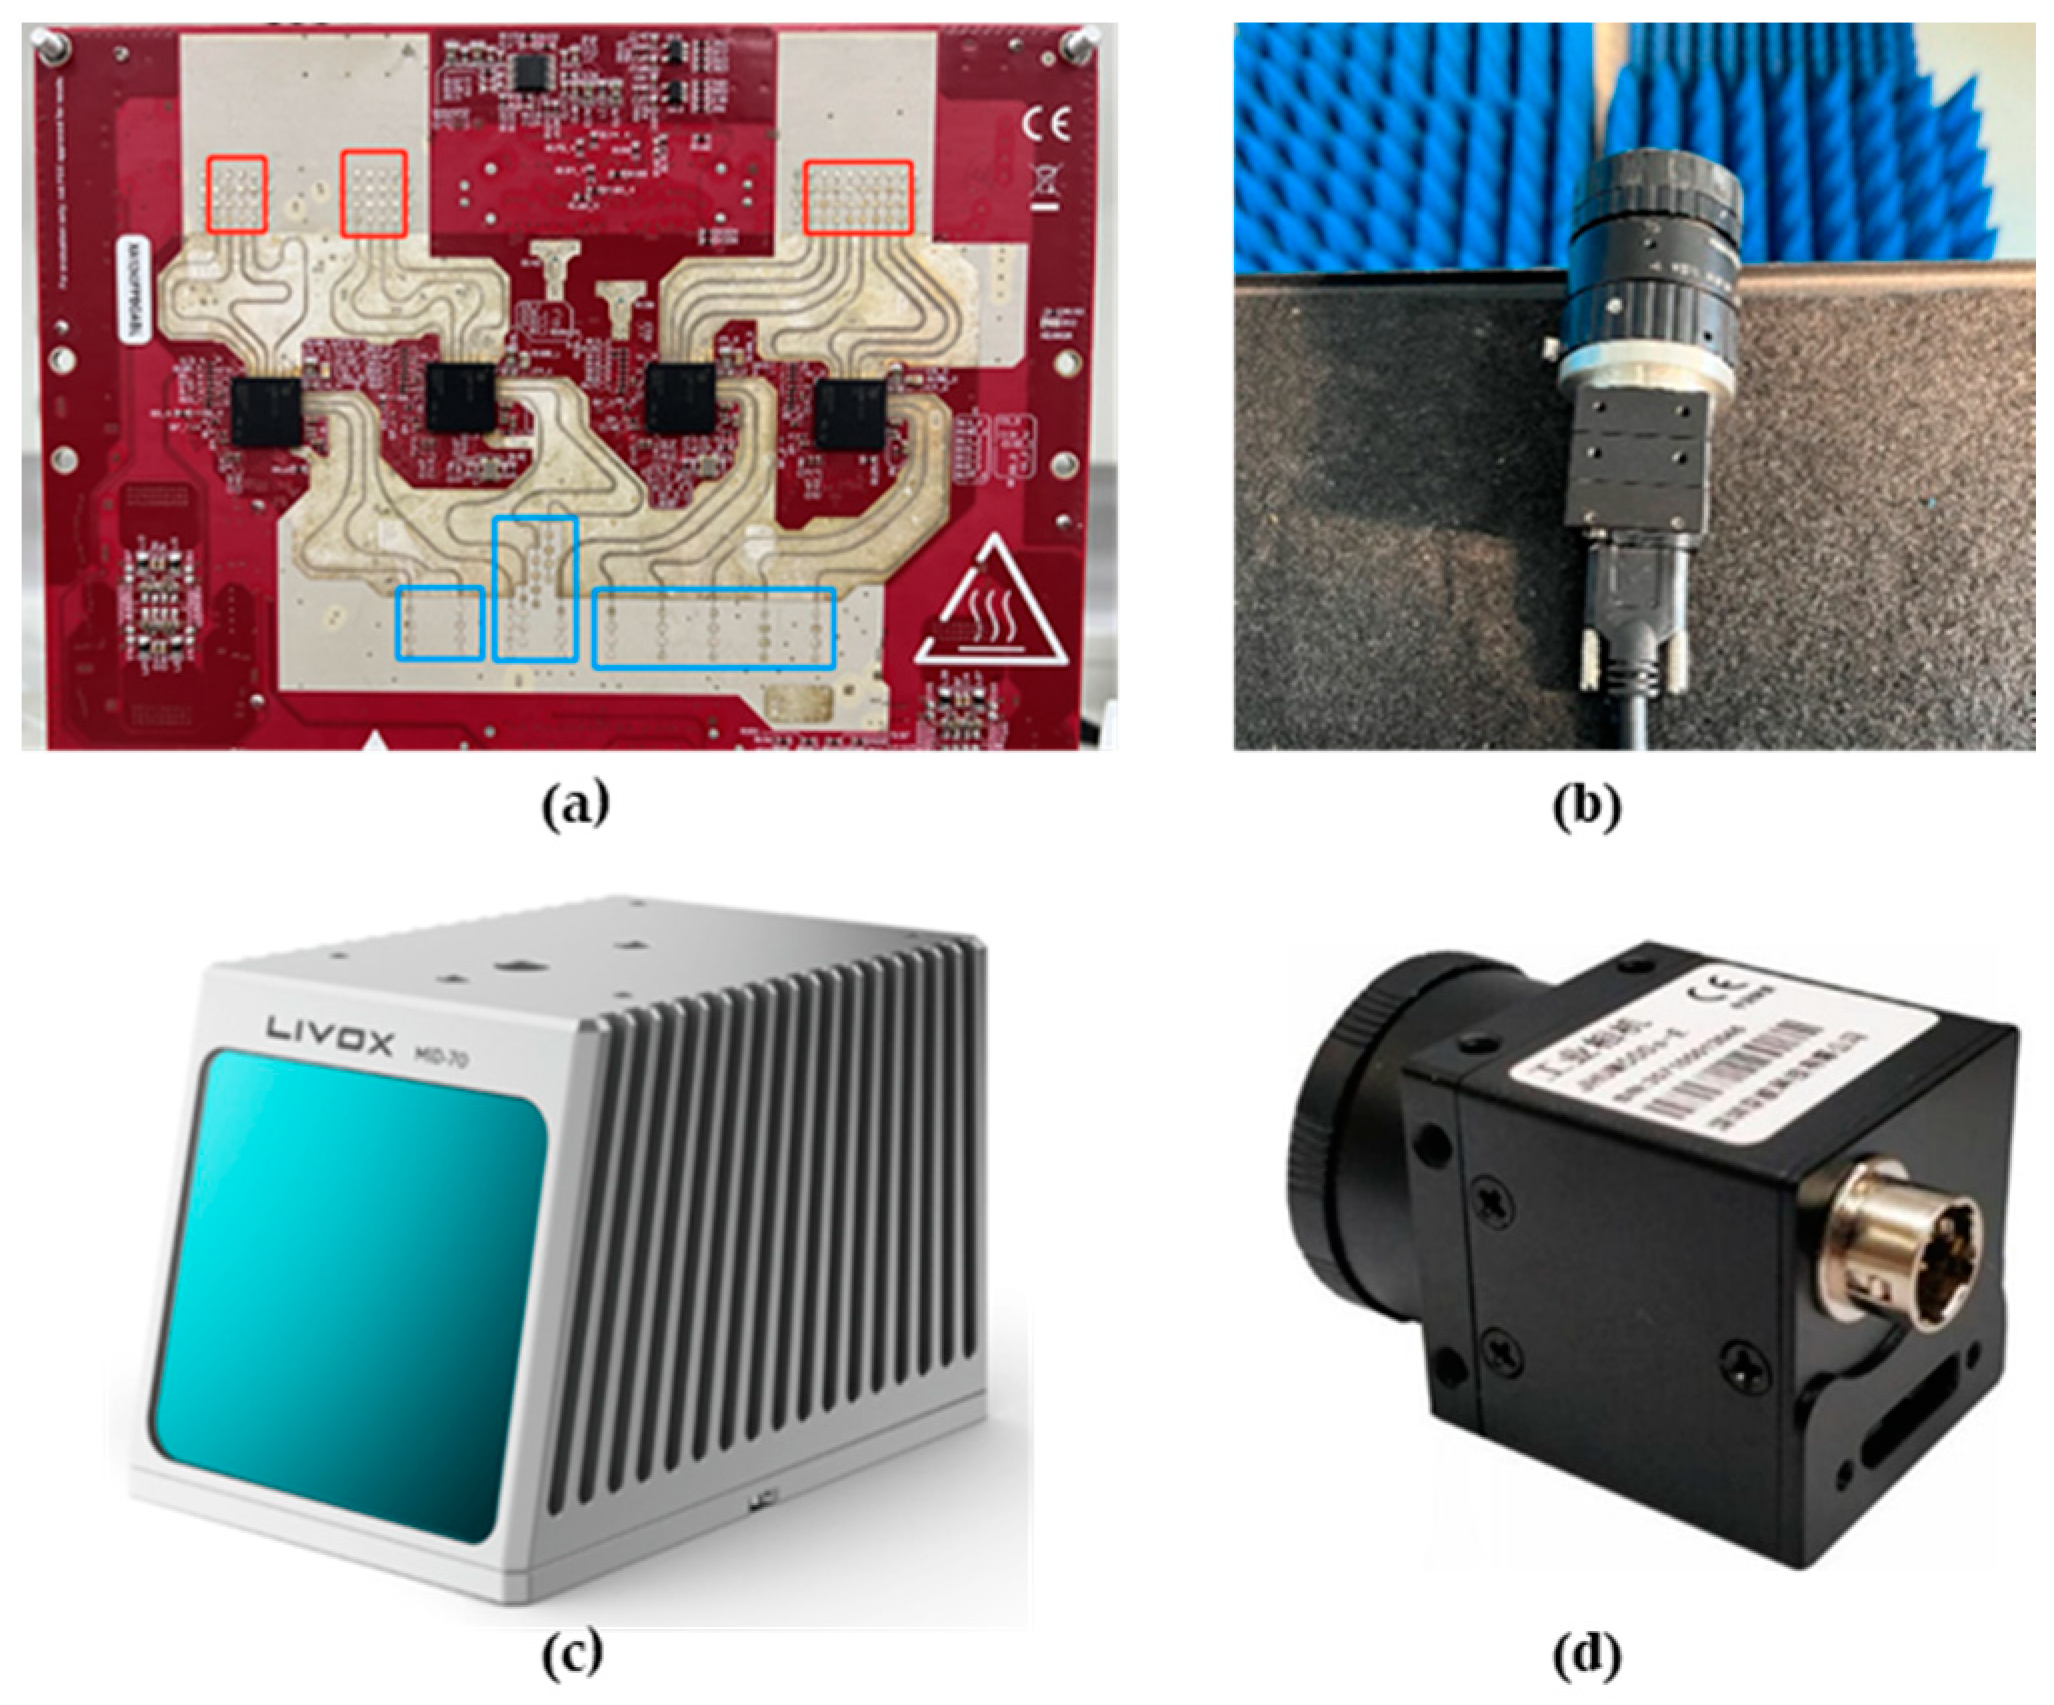
The selected millimeter-wave radar consists of four 3-transmit and 4-receive RF chips cascaded, forming a 12-transmit and 16-receive TDMA antenna array. Figure 3a shows a physical image of the 77 GHz millimeter-wave cascade RF chip. The red box in the figure highlights the 16 receiving antennas of the cascade radar, while the blue box indicates the 12 transmitting antennas. This millimeter-wave radar is utilized to perform high-resolution three-dimensional imaging of the target, effectively extracting the spatial position, geometric characteristics, and scattering properties of the target. Additionally, the direction of the transmitted signal can be controlled by digital beamforming (DBF) technology, enabling a scanning area significantly larger than that of conventional radars, with a horizontal field of view (FOV) of [−60°, 60°].
The multispectral camera selected is the Vision Star pixel-level mosaic imaging spectrometer, shown in Figure 3b. It operates on the principle of multispectral filter array (MSFA) imaging technology, capturing multispectral images in a single exposure. This camera offers advantages such as fast imaging speed, compact size, and low cost. It features 9 channels, covers a wavelength range of 620–800 nm, and weighs only 38 g.
The LIVOX Mid-70 is a cost-effective, safe, and reliable laser detection and ranging sensor. Its physical image is shown in Figure 3c. The device operates at a laser wavelength of 905 nm, with a point cloud output rate of up to 100,000 points per second.
The RGB camera used is the JHUMs series USB3.0 industrial camera with a maximum resolution of 2048 × 1536. Its field of view overlaps with those of the laser radar and multispectral camera and includes a conveniently callable dynamic library, as shown in Figure 3d.

3.2. FUSEN Workflow

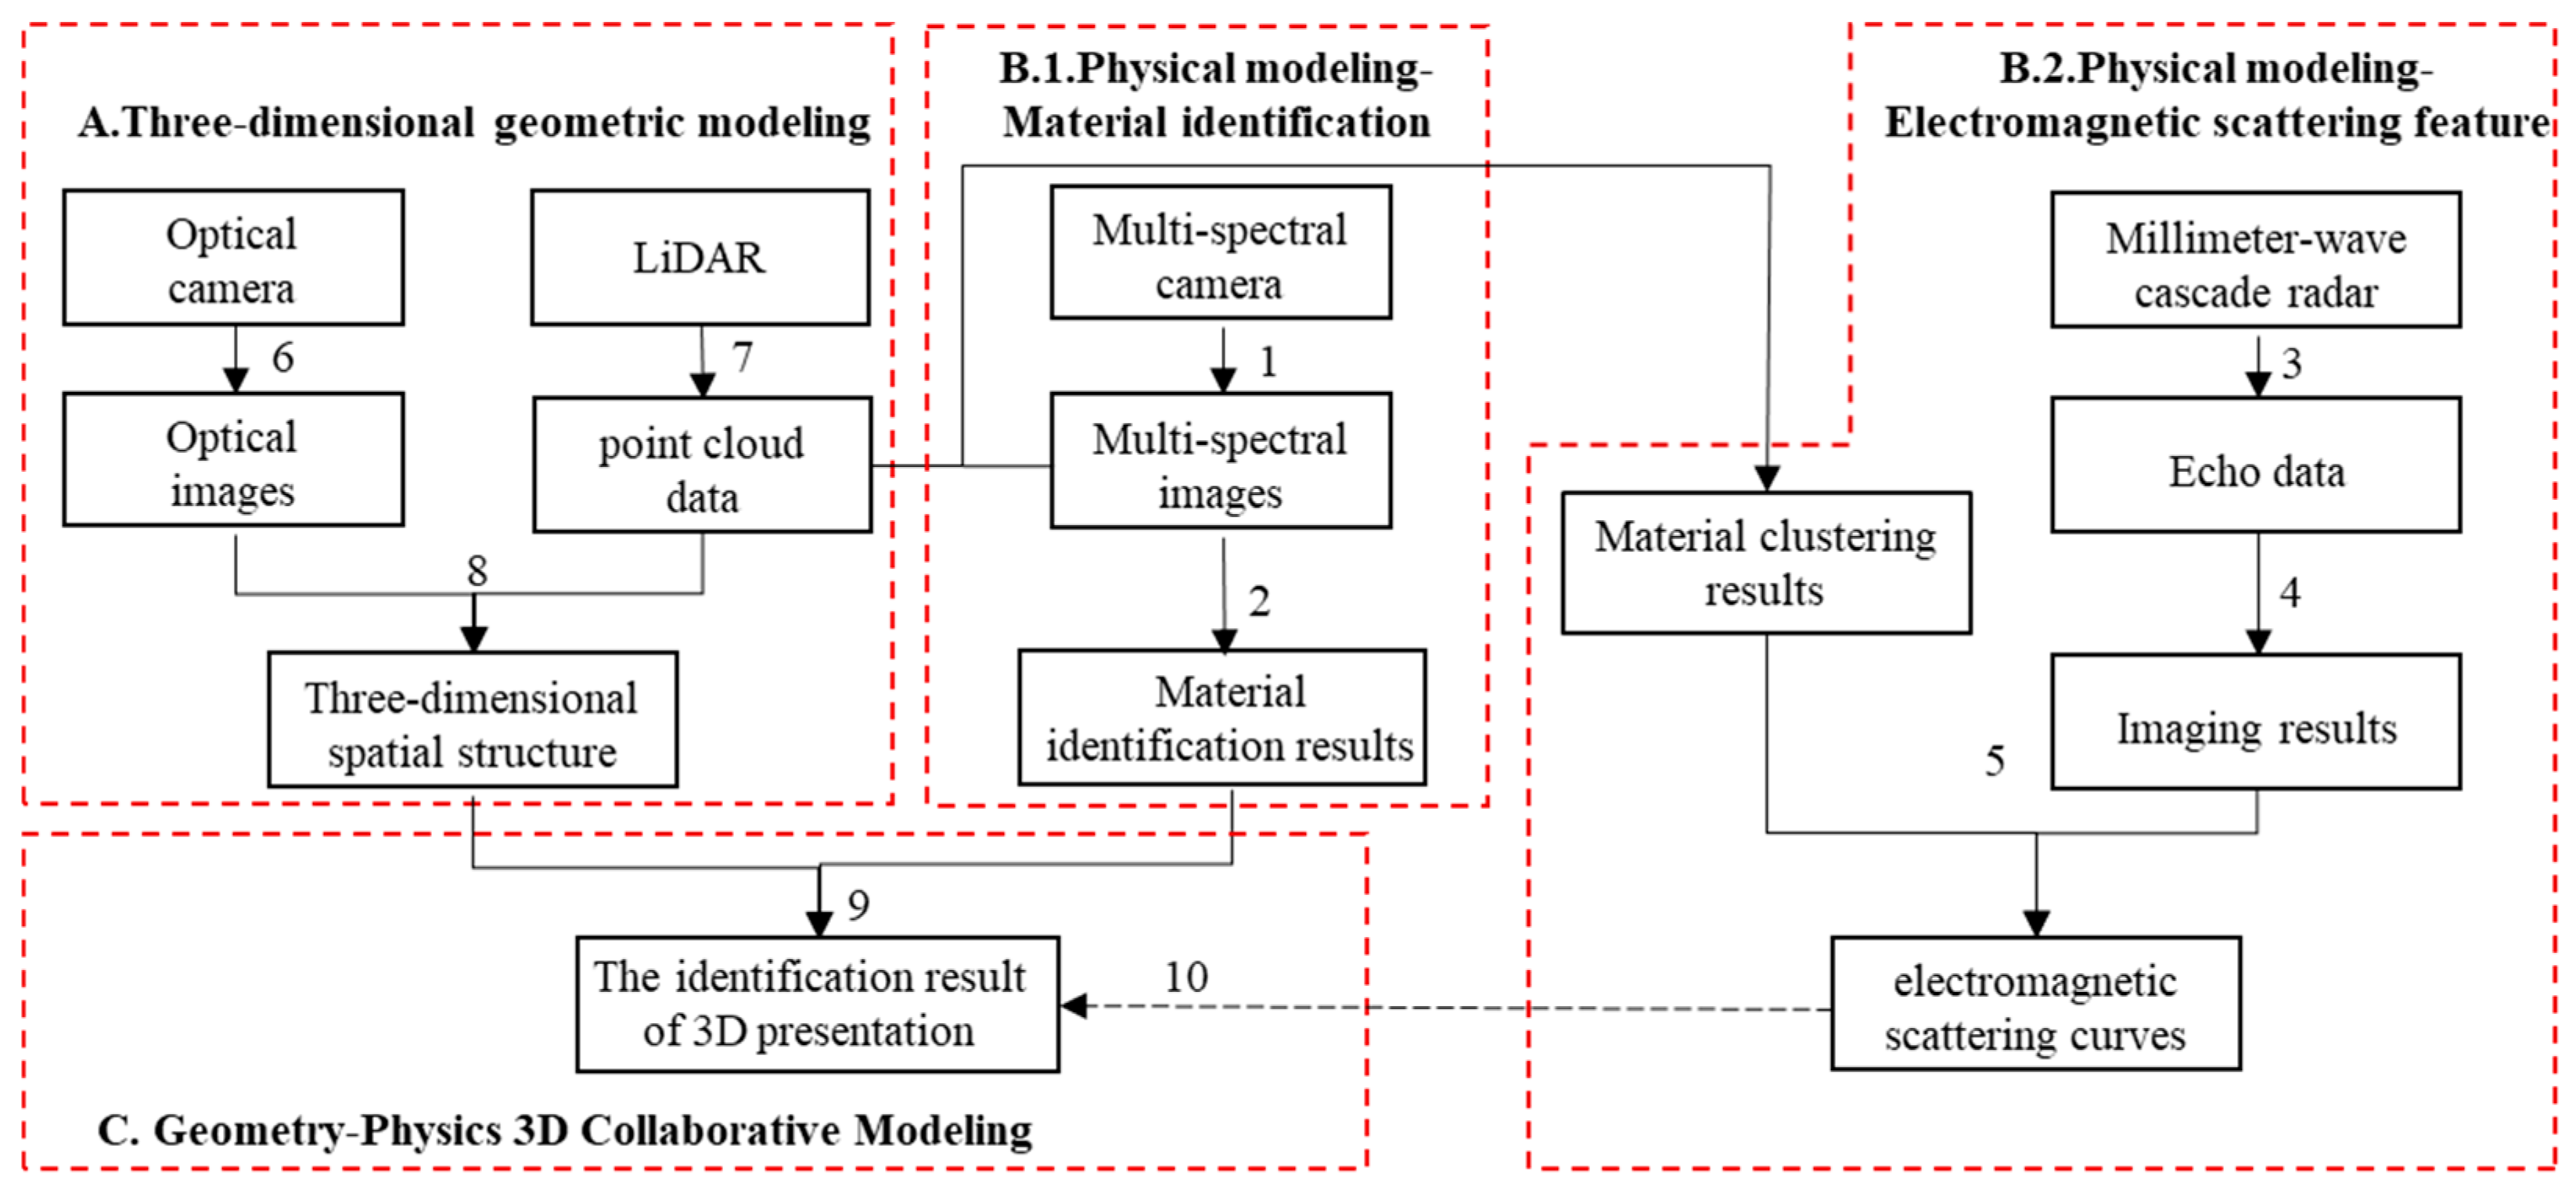
The overall workflow of the FUSEN system, composed of the aforementioned multi-sensors, can be divided into three parts: (A) three-dimensional geometric modeling, (B) physical modeling, and (C) geometric-physical three-dimensional collaborative modeling. The process of (B) physical modeling includes (B.1) material identification of the target and (B.2) electromagnetic scattering feature acquisition. The overall flowchart is shown in Figure 4. The main sensors of the system operate in a distributed manner, and the workflow can be organized into 10 steps.
(B.1) Material identification of the target is achieved by steps 1–2. In step 1, the multispectral camera captures the target optical image. In step 2, through the decision maker, the obtained multi-channel spectral information is analyzed to identify materials based on the multispectral data, resulting in the clustering of the target area by material type.
(B.2) Electromagnetic scattering feature acquisition is achieved by steps 3–5. In step 3, the millimeter-wave radar collects echo data. Step 4 involves imaging processing of the millimeter-wave radar echo data. In step 5, the material clustering information is added to the point cloud using the recognition results from the multispectral camera and the fusion of the laser radar point cloud. The clustering result from the multispectral camera is then passed to the millimeter-wave radar. Through the fusion of millimeter-wave radar imaging results and the laser point cloud, part of the data classified as a specific material is selected to calculate the scattering intensity of the material at various incident angles, obtaining the electromagnetic scattering curve.
(A) Three-dimensional geometric modeling is implemented by steps 6–8. Steps 6 and 7 involve the use of the optical camera and laser radar, respectively, to obtain optical image and point cloud data, which are then used to construct the three-dimensional space.
(C) Geometric-physical 3D collaborative modeling is implemented by steps 9–10. In step 9, the multispectral material recognition results from step 2 are fused with the laser radar data, achieving a one-to-one correspondence between physical information and the three-dimensional geometric space, thereby intuitively presenting the material recognition results. In step 10, the same method as step 9 is used to select a specific area in the three-dimensional space and invert the electromagnetic scattering characteristics of that area.

4. Multi-Sensor Acquisition of Environmental Physical Properties

This section primarily introduces the sensor data processing algorithms for physical property acquisition in the FUSEN system. It includes millimeter-wave radar imaging processing to reflect the electromagnetic characteristics of the target and the use of a multispectral camera to capture rich spectral information for target material identification.

4.1. Millimeter-Wave Radar Imaging

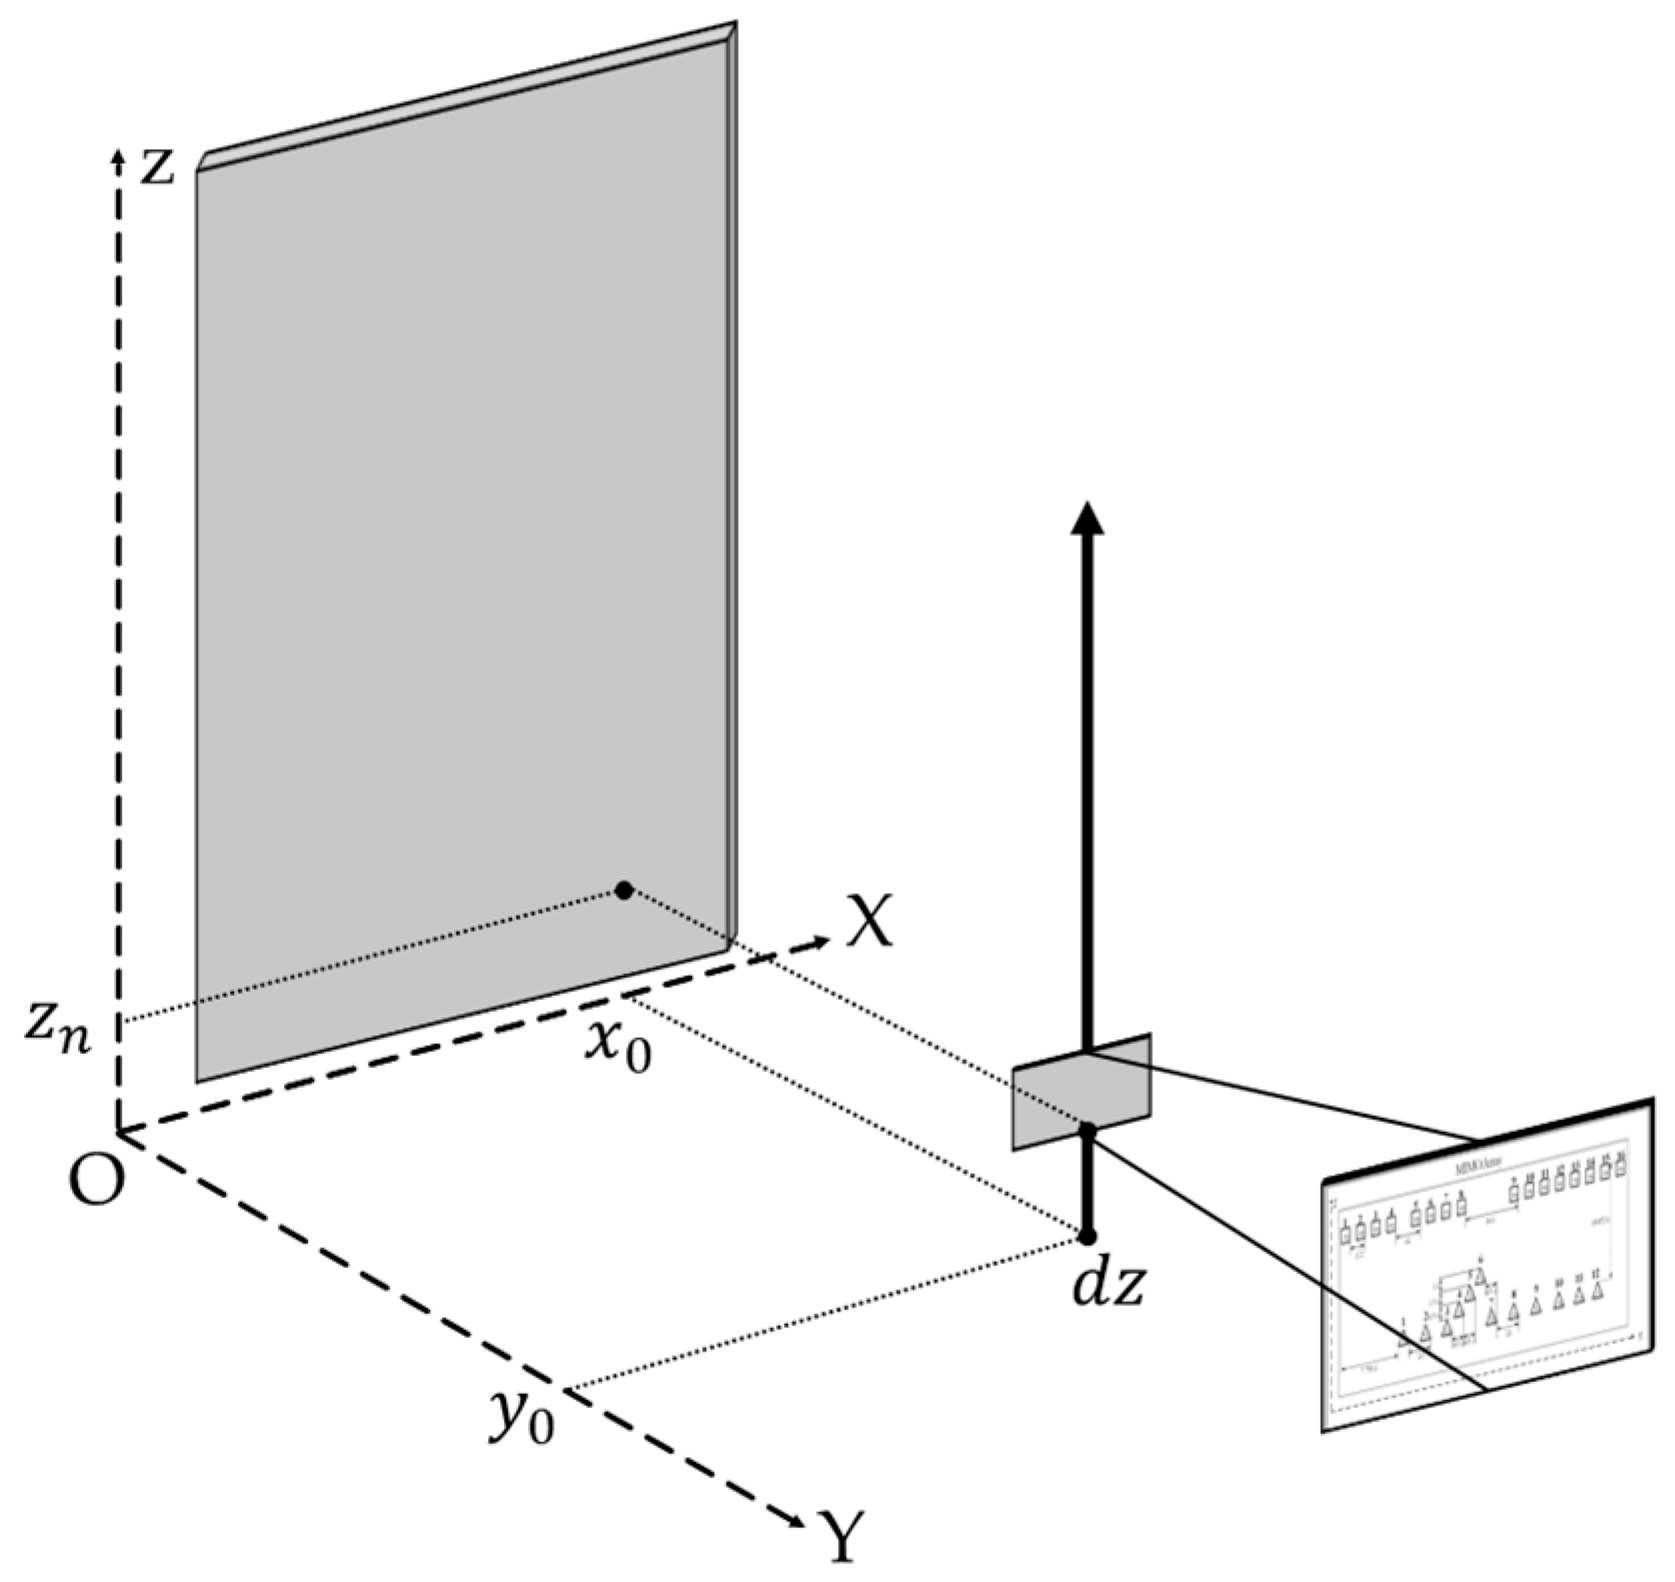
The millimeter-wave cascade radar antenna array selected by the system has an extended distribution in the horizontal direction (X), providing high horizontal resolution. To achieve similar imaging resolution in the vertical direction (Z), the electric translation stage in the system (Figure 1) needs to be displaced in the Z direction, as illustrated in Figure 5.
The three-dimensional spatial coordinate system is defined as shown in Figure 5. The wall targets are distributed on the XOZ plane. The millimeter-wave radar is positioned perpendicular to the imaging target along the Y direction and is placed parallel to the wall target. Assume that the center of the millimeter-wave radar is at a distance y 0 from the imaging wall and at x 0 from the YOZ plane. The initial center coordinate in the Z direction is z 0 . After moving a length d z , the center coordinate of the cascade radar becomes ( x 0 , y 0 , z n ) , where z n = z 0 + d z .
The signal transmitted by the millimeter-wave radar is a frequency-modulated continuous wave (FMCW), characterized by a frequency that varies over time according to a triangular wave pattern. This modulation provides high resolution and low transmission power advantages [19]. Assume that the FMCW signal transmitted by a single antenna is as follows:
S ( t ) = A ( t ) · e x p ( j 2 π f 0 t + j π K S t 2 )
where A ( t ) represents the amplitude of the transmitted signal, f 0 represents the start frequency of the frequency modulation, and K S is the frequency modulation slope. The echo signal of the p th point target can then be expressed as follows:
S p t , τ p = A s , p r e c t t T S τ p · e x p j 2 π f 0 t τ p · e x p j π K S t τ p 2
where T S   represents the frequency modulation period; A s , p denotes the amplitude of the echo signal of the p th target; r e c t · is the rectangular window function; t represents the fast time; and τ p is the echo delay of the p th point target, which depends on the distance from the p th point target to the transceiver antenna and the speed of light. Specifically, let the spatial three-dimensional coordinates of the m th transmitting antenna of the millimeter-wave radar be t m x , t m y , t m z , where m = 1,12 . The coordinates of the n th receiving antenna of the millimeter-wave radar are r n x , r n y , r n z , where n = 1,16 . Since the millimeter-wave radar moves in the Z direction, the coordinates of the transceiver antennas will change. Given the movement distance in the Z direction is d z , the corresponding antenna coordinates can be expressed as t m x , t m y , t m z + d z and r n x , r n y , r n z + d z . Assume that the coordinates of the p th scattering point in the target area are x p x , x p y , x p z . The distance from the m th transmitting antenna and the n th receiving antenna of the cascade radar to the p th scattering point of the target is given by the following:
R m p = t m x x p x 2 + t m y x p y 2 + t m z + d z x p z 2 R n p = t n x x p x 2 + t n y x p y 2 + t n z + d z x p z 2
by substituting Equation (2) into the echo delay τ p = R m p + R n p / c in Equation (1), the echo signal received by the cascade radar is stored as the data matrix D a t a N r , M × N , P , representing the echo expression of the scattering points within the beam illumination range of the transceiver antenna at each corresponding position of the Z-axis cascade radar.
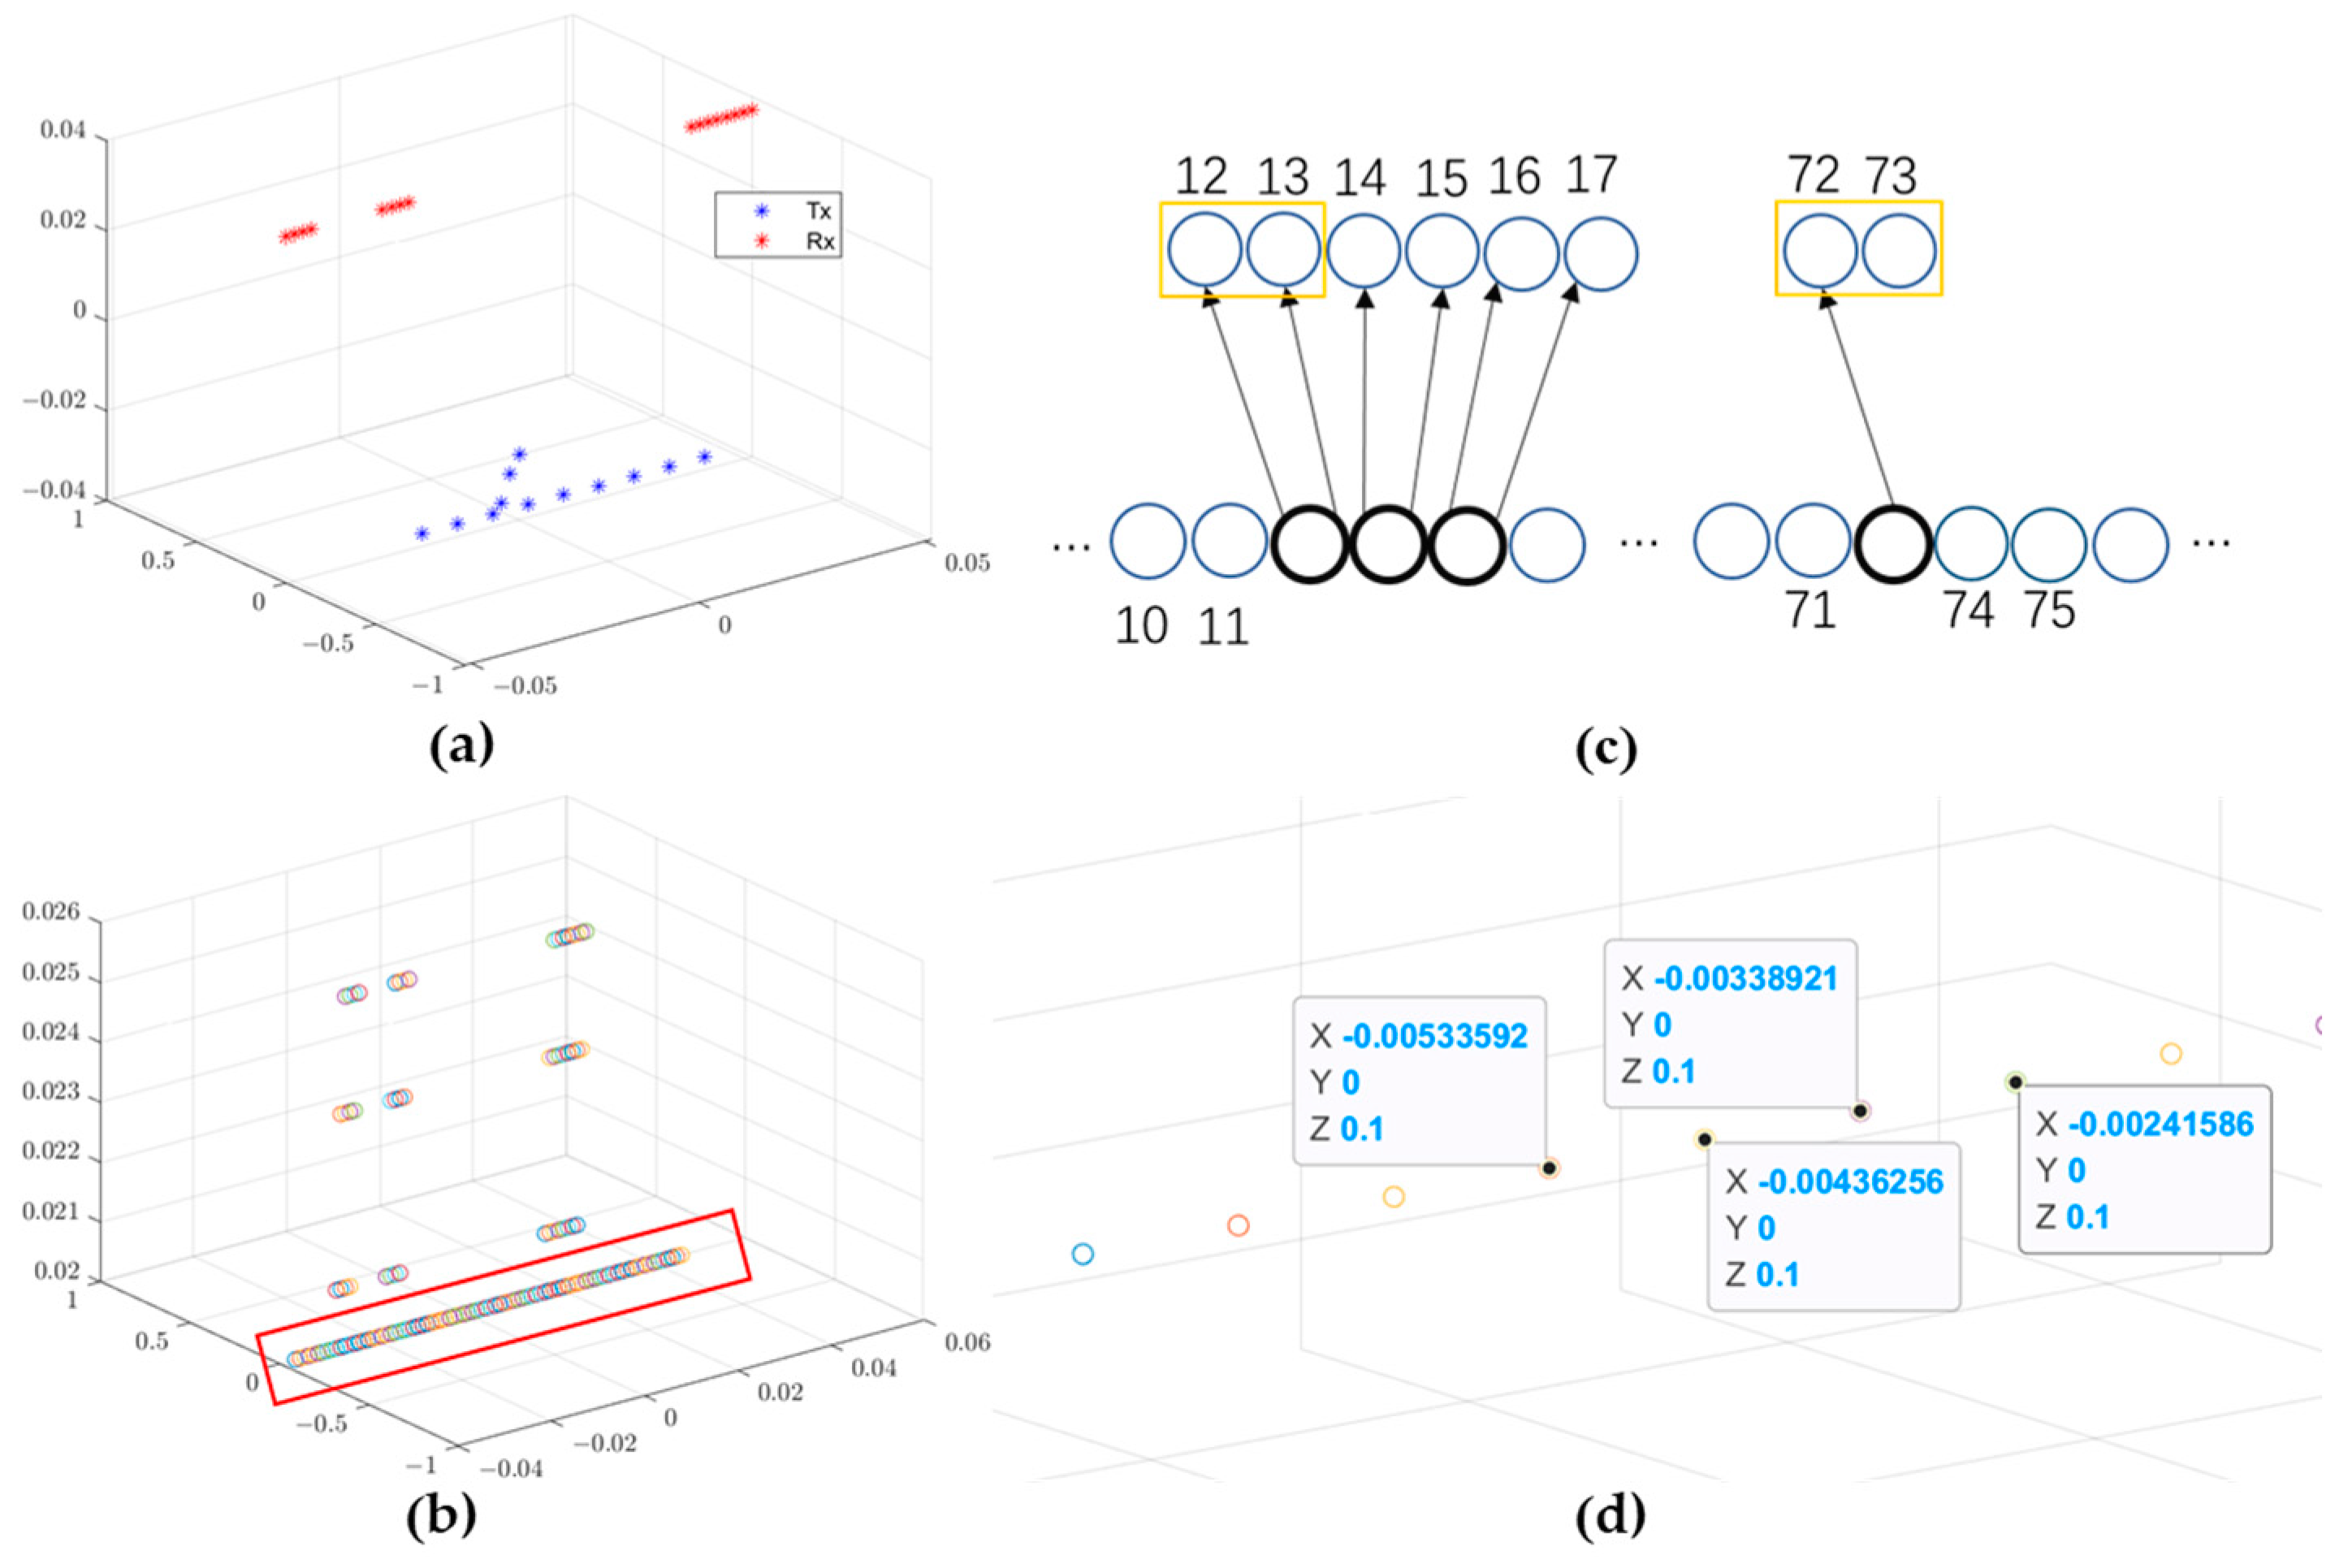
The received echo originates from 12 transmitting antennas and 16 receiving antenna channels, forming a real aperture, as shown in Figure 6a. This configuration results in 192 equivalent apertures, depicted in Figure 6b. However, due to the overlap of the aperture positions, there are actually only 134 unique spatial positions of the apertures. The overlapping schematic is illustrated in Figure 6c, which is a larger representation of the red box in Figure 6b. More importantly, as shown in Figure 6d, the interval of equivalent aperture at the same height is 1/4 of the wavelength.
For the apertures at overlapping positions, the data can be processed through spatial equalization of equivalent aperture [20]. The processing steps are as follows:
Let   A x = z e r o s ( M * N , 2 ) ,   M = 12 ;   N = 16
W T R = z e r o s ( M , N )
        for   n t x = 1 : M                 for   n r x   = 1 : N                         W T R ( n t x , n r x ) = length ( find ( abs ( A x ( : , 1 ) T x ( n t x , 1 ) R x ( r x , 1 ) ) > 1 × 10 12 ) )                         D a t a ( : , n t x , n r x , : ) = D a t a ( : , n t x , n r x , : ) / W T R ( n t x , n r x )
        end
     end
where A x represents the 192 equivalent aperture coordinates; n t x and n r x represent the indexes of the transmitting antenna and the receiving antenna, respectively; T x and R x represent the coordinates of the transmitting antenna and the receiving antenna, respectively; W T R represents the weight matrix. This process enables the equivalent channel equalization of the echo data. Subsequently, the proposed system employs a typical time-domain imaging algorithm, the improved back projection (BP) algorithm for imaging [21]. In the radar imaging process, the BP algorithm utilizes the “Delay-and-Sum” approach. Initially, the echo information received by the radar antenna is matched filtered in the range direction. This process can be achieved through the Fourier transform, expressed as follows:
S p f , τ p = F F T S p t , τ p
To obtain the phase and amplitude information contained in the echo data, an inverse Fourier transform (IFFT) is performed to convert the data into the time domain. This step helps determine the delay of the transmitting and receiving antenna combination. Finally, the coherent addition of the signals is accumulated to derive the target function. This process can be expressed as:
I ( x , y ) = I F F T S p f , τ p · e x p [ j K S ( R p ( τ p ) ) ] d τ p
where R p ( τ p ) represents the pixel division of the target imaging area. The delay for different combinations of transmitting and receiving antennas relative to each pixel is then calculated sequentially. Finally, the MIMO channel is calibrated for both amplitude and phase, and compensations for distance and antenna pattern are applied to obtain the scattering intensity of the target.

4.2. Material Recognition through Multispectral Data

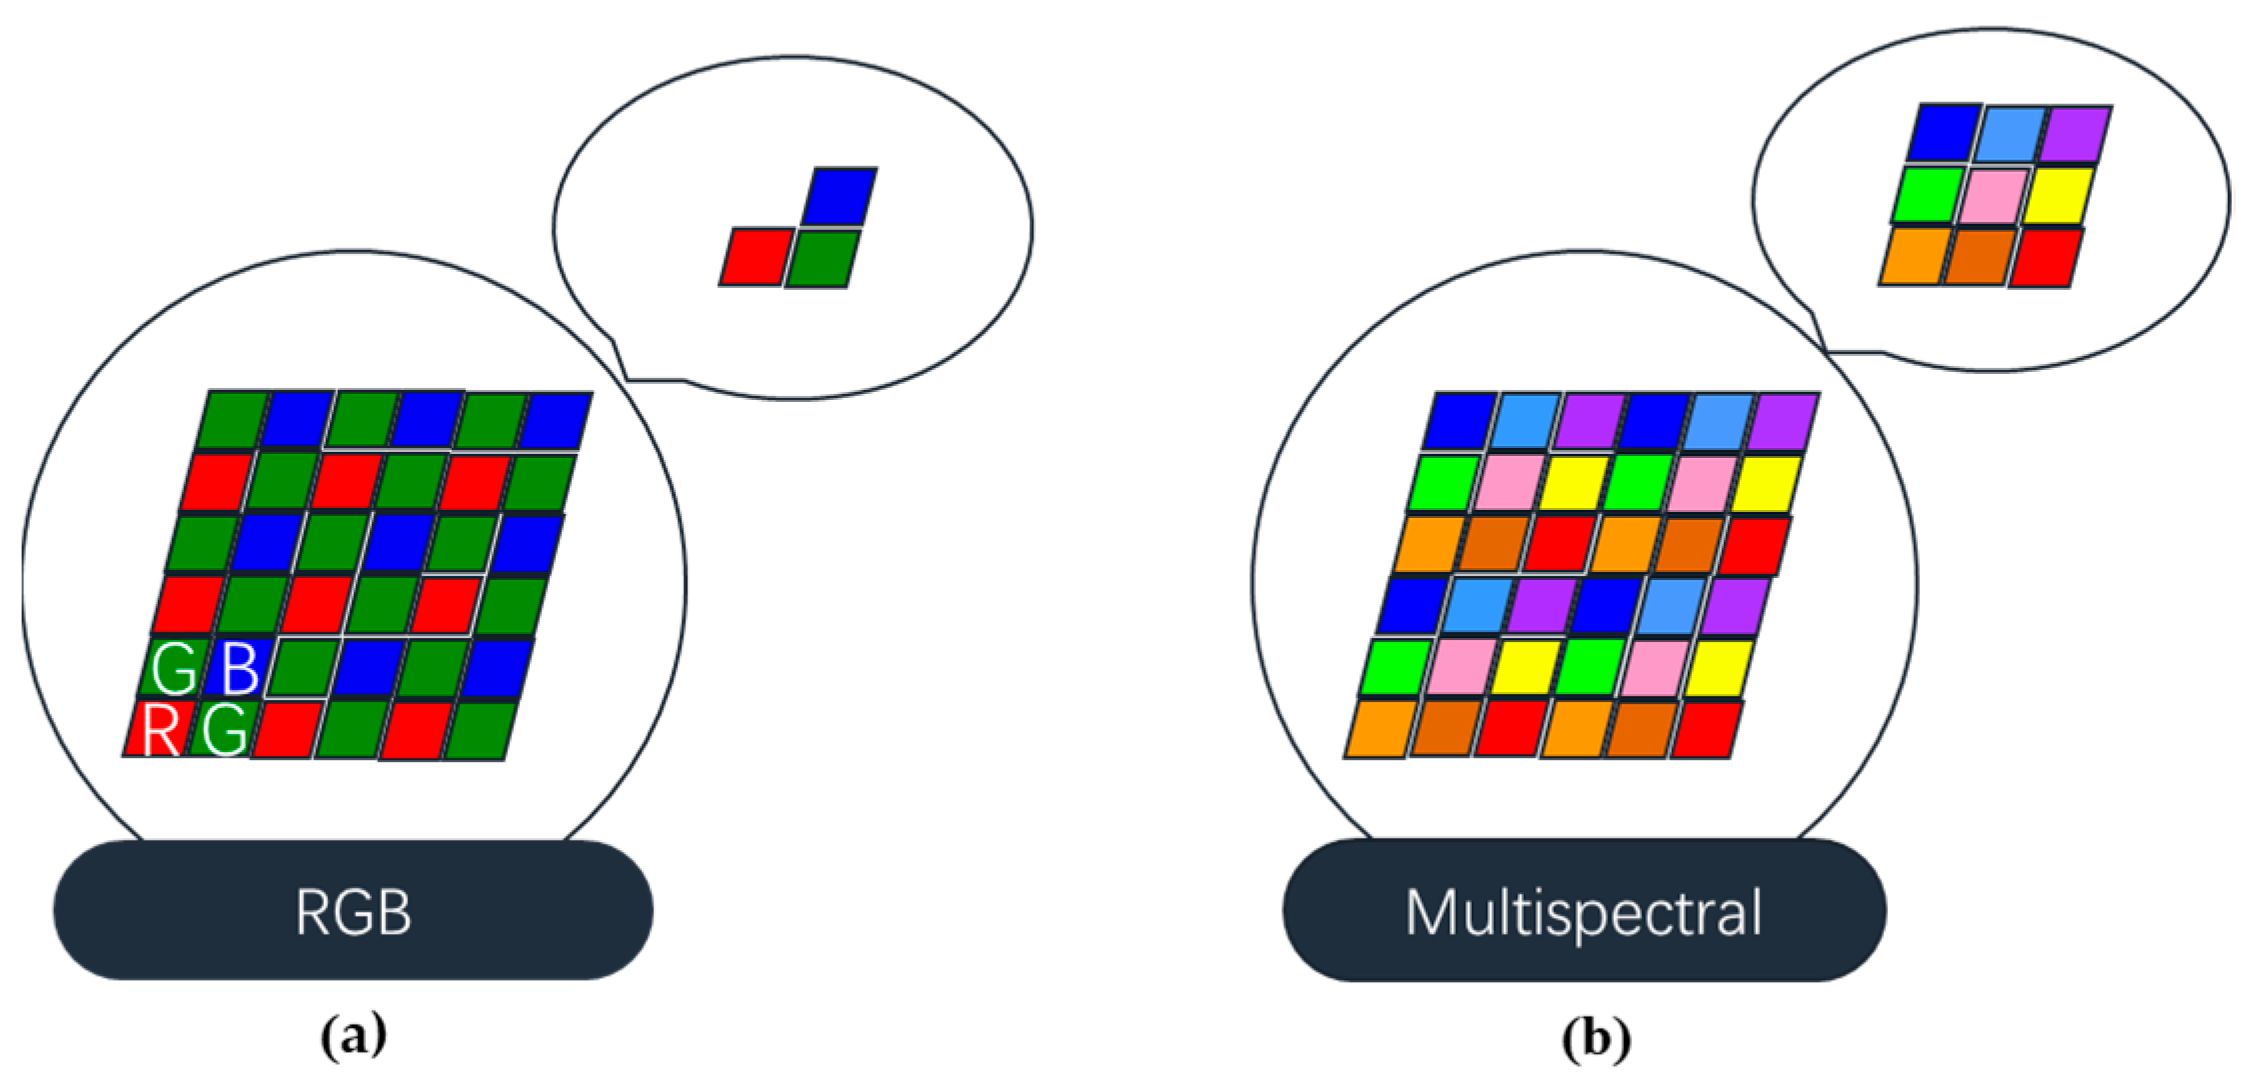
Compared to ordinary optical cameras, multispectral cameras can capture a wider range of spectral information, enabling the distinction of targets made from different materials [22]. As shown in Figure 7, the filters of ordinary RGB cameras and multispectral cameras differ significantly. For example, the multispectral camera in Figure 3b features 9 channels spanning 620–800 nm, with intermediate frequency bands at 633 nm, 653 nm, 674 nm, 690 nm, 712 nm, 732 nm, 745 nm, 764 nm, and 781 nm. In contrast, ordinary RGB cameras filter three bands: red light (615–620 nm), green light (530–540 nm), and blue light (460–470 nm). Multispectral cameras obtain reflection information from different materials by illuminating the target with light sources of various wavelengths. By analyzing the results across these wavelengths, the unique spectral characteristic curve of each material can be determined.
The multispectral camera can capture the original spectral response of the target under any lighting conditions as F r a w f , which varies with wavelength. To obtain the true spectral response F r e a l f of the target material, reflectance calibration must first be performed. This step compensates for any distortions in the target’s spectral curve caused by imbalances in the light source. The relationship can be expressed as
F r e a l f = F r a w f F b l a c k f F w h i t e f F b l a c k f
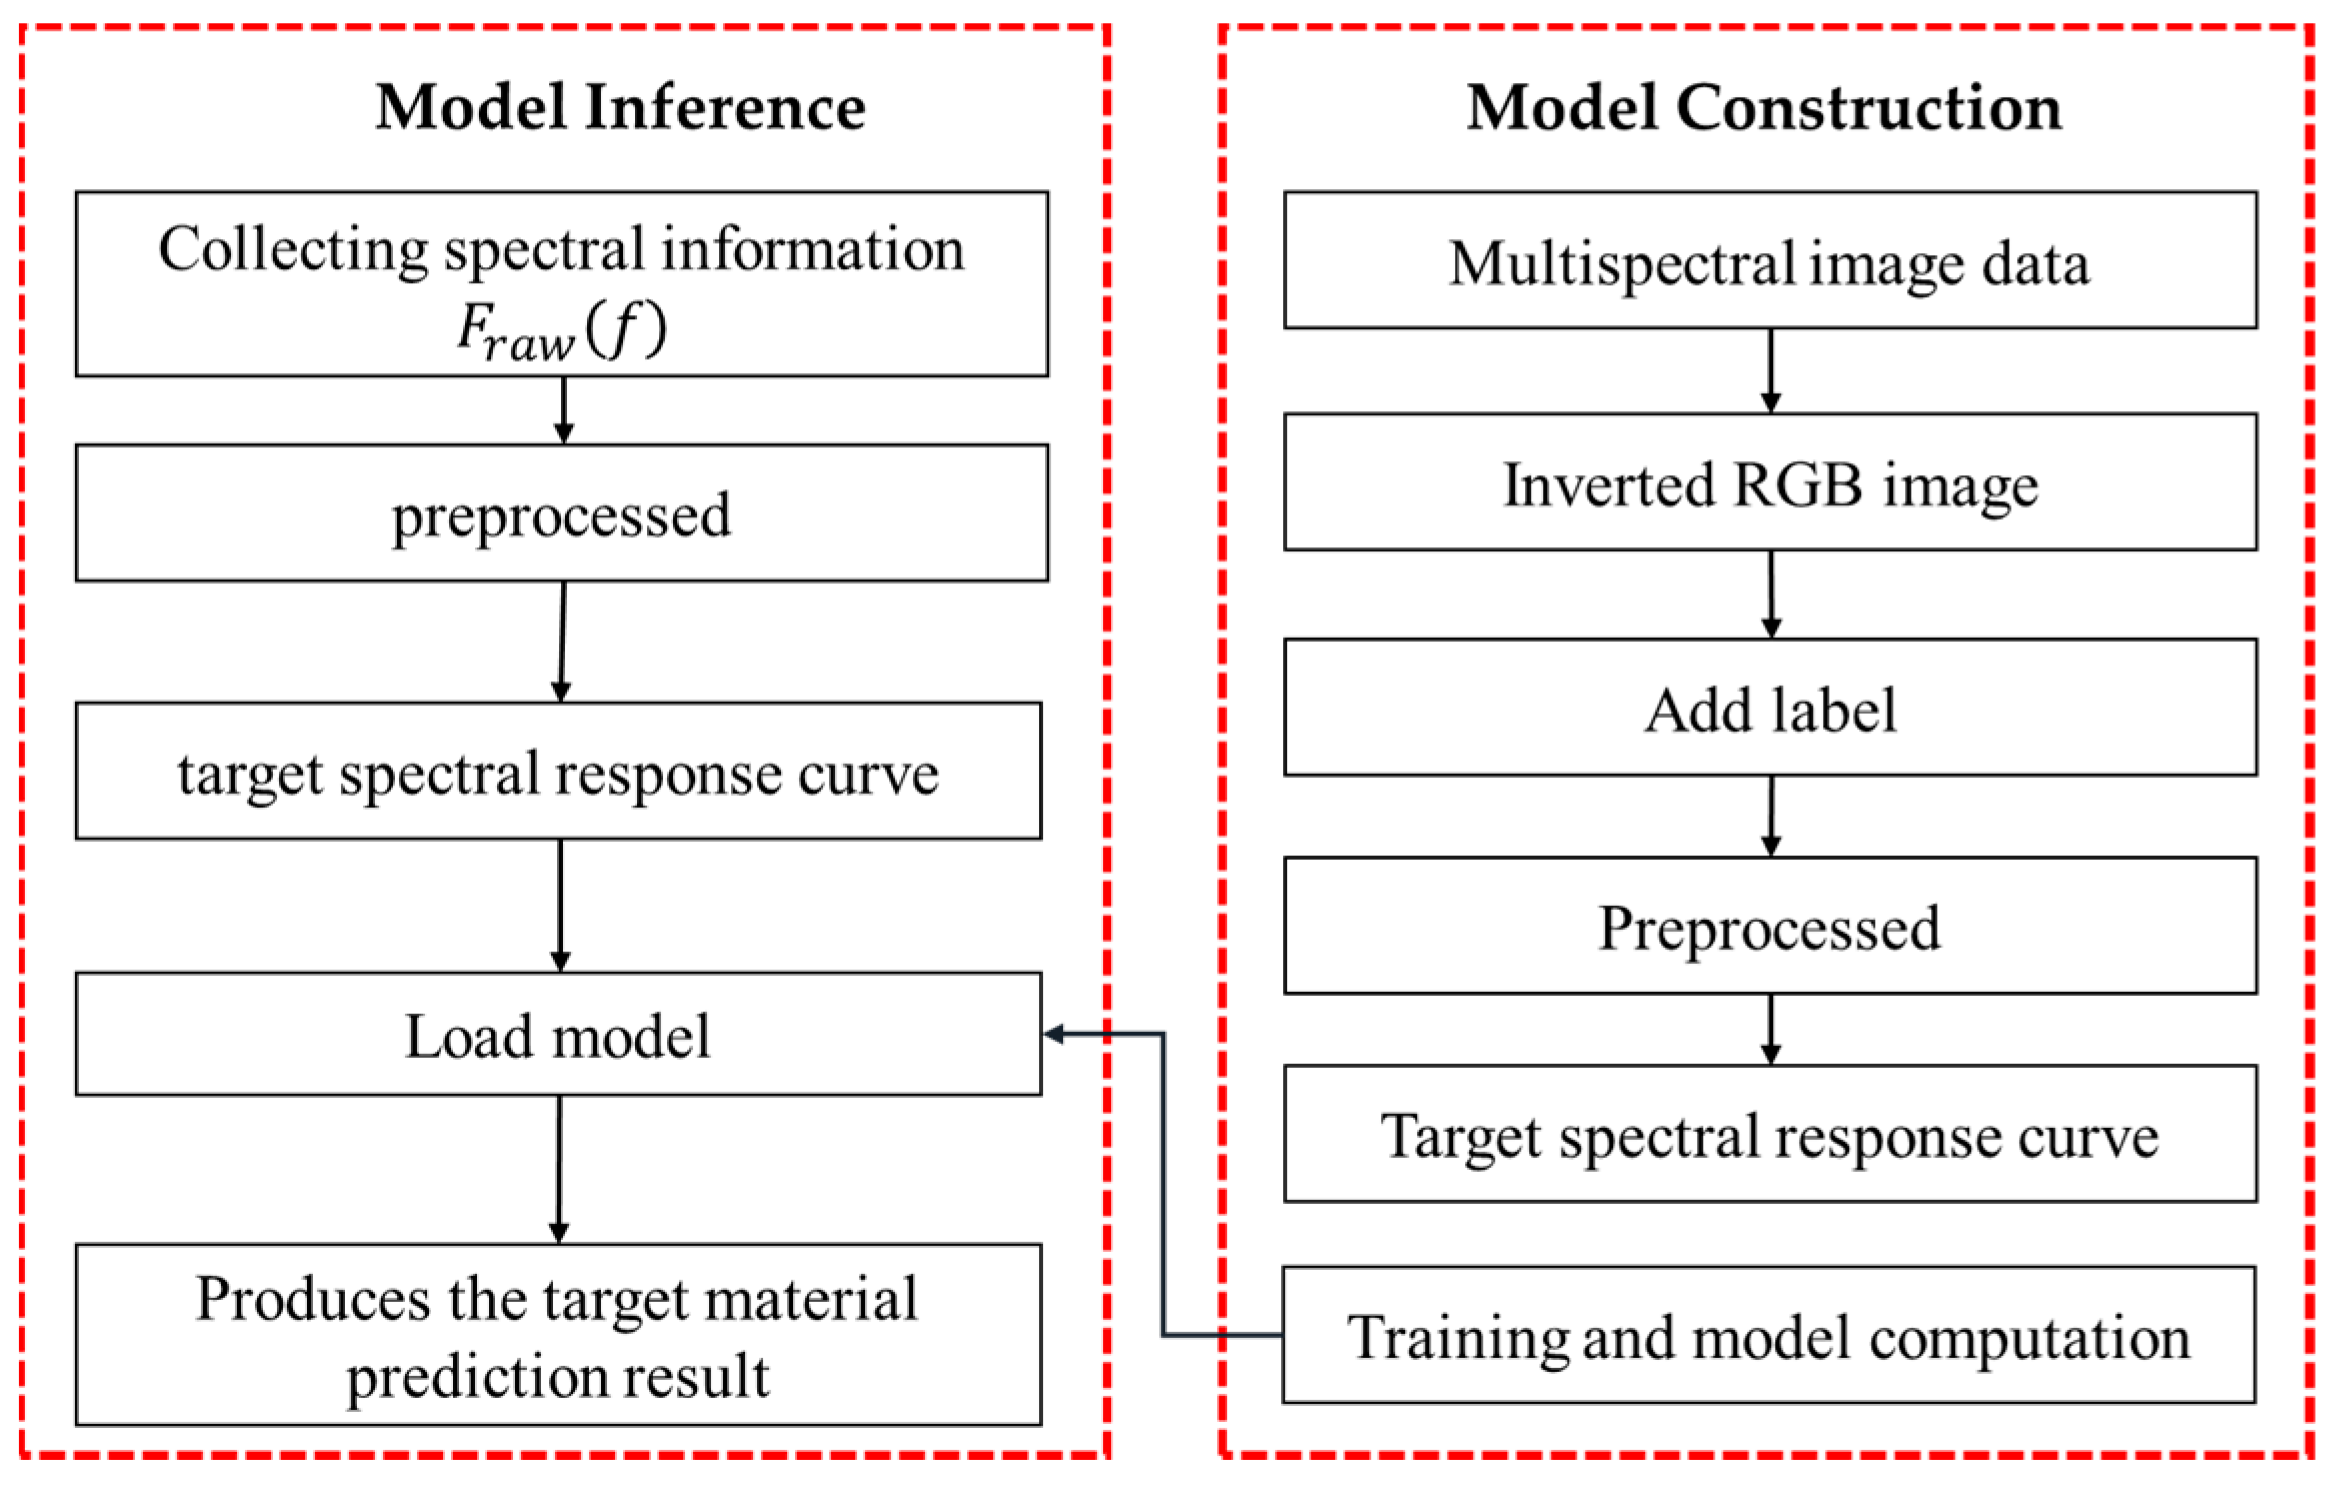
where F b l a c k f represents the response of the system itself, and F w h i t e f represents the spectral response reflected from a whiteboard under the current light source. The raw data F r a w f directly obtained from the same material will vary under different lighting conditions. The spectral response characteristics of the target material can be calculated using the above formula, which is obtained after correcting the reflection results of the whiteboard under the current illumination conditions and can be considered as the true spectrum of the target itself. Therefore, the target material can be identified, and the process is shown in Figure 8.
The process of model construction begins with the use of the inverted RGB image from the multispectral image data for annotating different materials using LabelMe. Next, the multispectral image data are read and segmented. The data are then preprocessed, where the reflectance of each pixel is calibrated to minimize the impact of varying lighting conditions on the spectral trend, thereby obtaining the target spectral response curve. Finally, a certain proportion of data for each material is randomly extracted and fed into a random forest classifier for training and model computation. In the model inference phase, after the system collects the target multispectral data, the data are standardized and preprocessed, then input into the trained model. The model then produces the target material prediction result.

5. Geometric Modeling of an Environment Based on Multi-Sensor Integration

The construction of the target’s 3D geometric model relies on the fusion of optical cameras and LiDAR, which can quickly capture high-precision, high-density point clouds with color and texture information to complete the 3D geometric modeling of the target scene. However, since each sensor has a different coordinate center, it is necessary to perform coordinate registration between sensors to align the results captured by different sensors within the same coordinate system.

5.1. Registration of Optical Camera and LiDAR

The proposed system uses an improved point cloud and RGB fusion method to align the optical camera and the LiDAR, which simultaneously utilizes hand–eye calibration [23] and edge feature extraction [24].
First, a calibration object similar to a chessboard is used for internal calibration of the optical camera. As shown in Figure 9a, the camera captures images of the chessboard from multiple angles to obtain the camera’s internal parameter matrix P C , which can be expressed as follows:
P C = f c u 0 P u 0 0 f c v P v 0 0 0 1
where f c u and f c v represent the camera’s longitudinal and lateral stretching/compression parameters, respectively; P u 0 and P v 0 represent the center point coordinates of the camera’s captured image. Next, the relative external parameter matrix P L C of the LiDAR and RGB camera is obtained. P C u and P C v are defined to represent the horizontal and vertical pixel positions of the image obtained by the RGB camera in the two-dimensional coordinate system, while P L x , P L y , and P L z are defined to represent the positions of the LiDAR point cloud in its three-dimensional coordinate system. Then we obtain the following:
P C u P C v 1 = f c u 0 P u 0 0 f c v P v 0 0 0 1 R L C t L C T 0 1 P L x P L y P L z 1
where R L C (3* × 3) and t L C (3* × 1) represent the rotation matrix and translation matrix of the LiDAR coordinate system relative to the optical coordinate system, respectively. They constitute the relative external parameter matrix P L C . Assume again the following:
A = f c u 0 P u 0 0 f c v P v 0 0 0 1 R L C t L C T 0 1
then the above two formulas can be expressed as follows:
P C u P C v 1 = A P L x P L y P L z 1 = a 11 a 12 a 13 a 14 a 21 a 22 a 23 a 24 a 31 a 32 a 33 a 34 P L x P L y P L z 1
where A represents the parameter matrix influenced by the external parameters of the LiDAR and RGB camera, as well as the RGB internal parameter matrix. After matrix transformation, it can be calculated as follows:
P C u = a 11 P L x + a 12 P L y + a 13 P L z + a 14 a 31 P L x + a 32 P L y + a 33 P L z + a 34 P C v = a 21 P L x + a 22 P L y + a 23 P L z + a 24 a 31 P L x + a 32 P L y + a 33 P L z + a 34
From the above formula, it is evident that to determine the element values of A , at least four independent sets of corresponding positions on the RGB image and the LiDAR point cloud data need to be selected. By leveraging the linear relationship of the formula, the rotation matrix R L C and translation vector t L C of the LiDAR coordinate system relative to the RGB camera coordinate system can be calculated as follows:
R L C t L C T 0 1 = f p C u 0 P u 0 0 0 f v C v P v 0 0 0 0 0 1 1 A
After obtaining the internal reference matrix of the RGB camera and the external parameter matrix is calculated according to the above formula process, and the registration results are shown in Figure 9b.
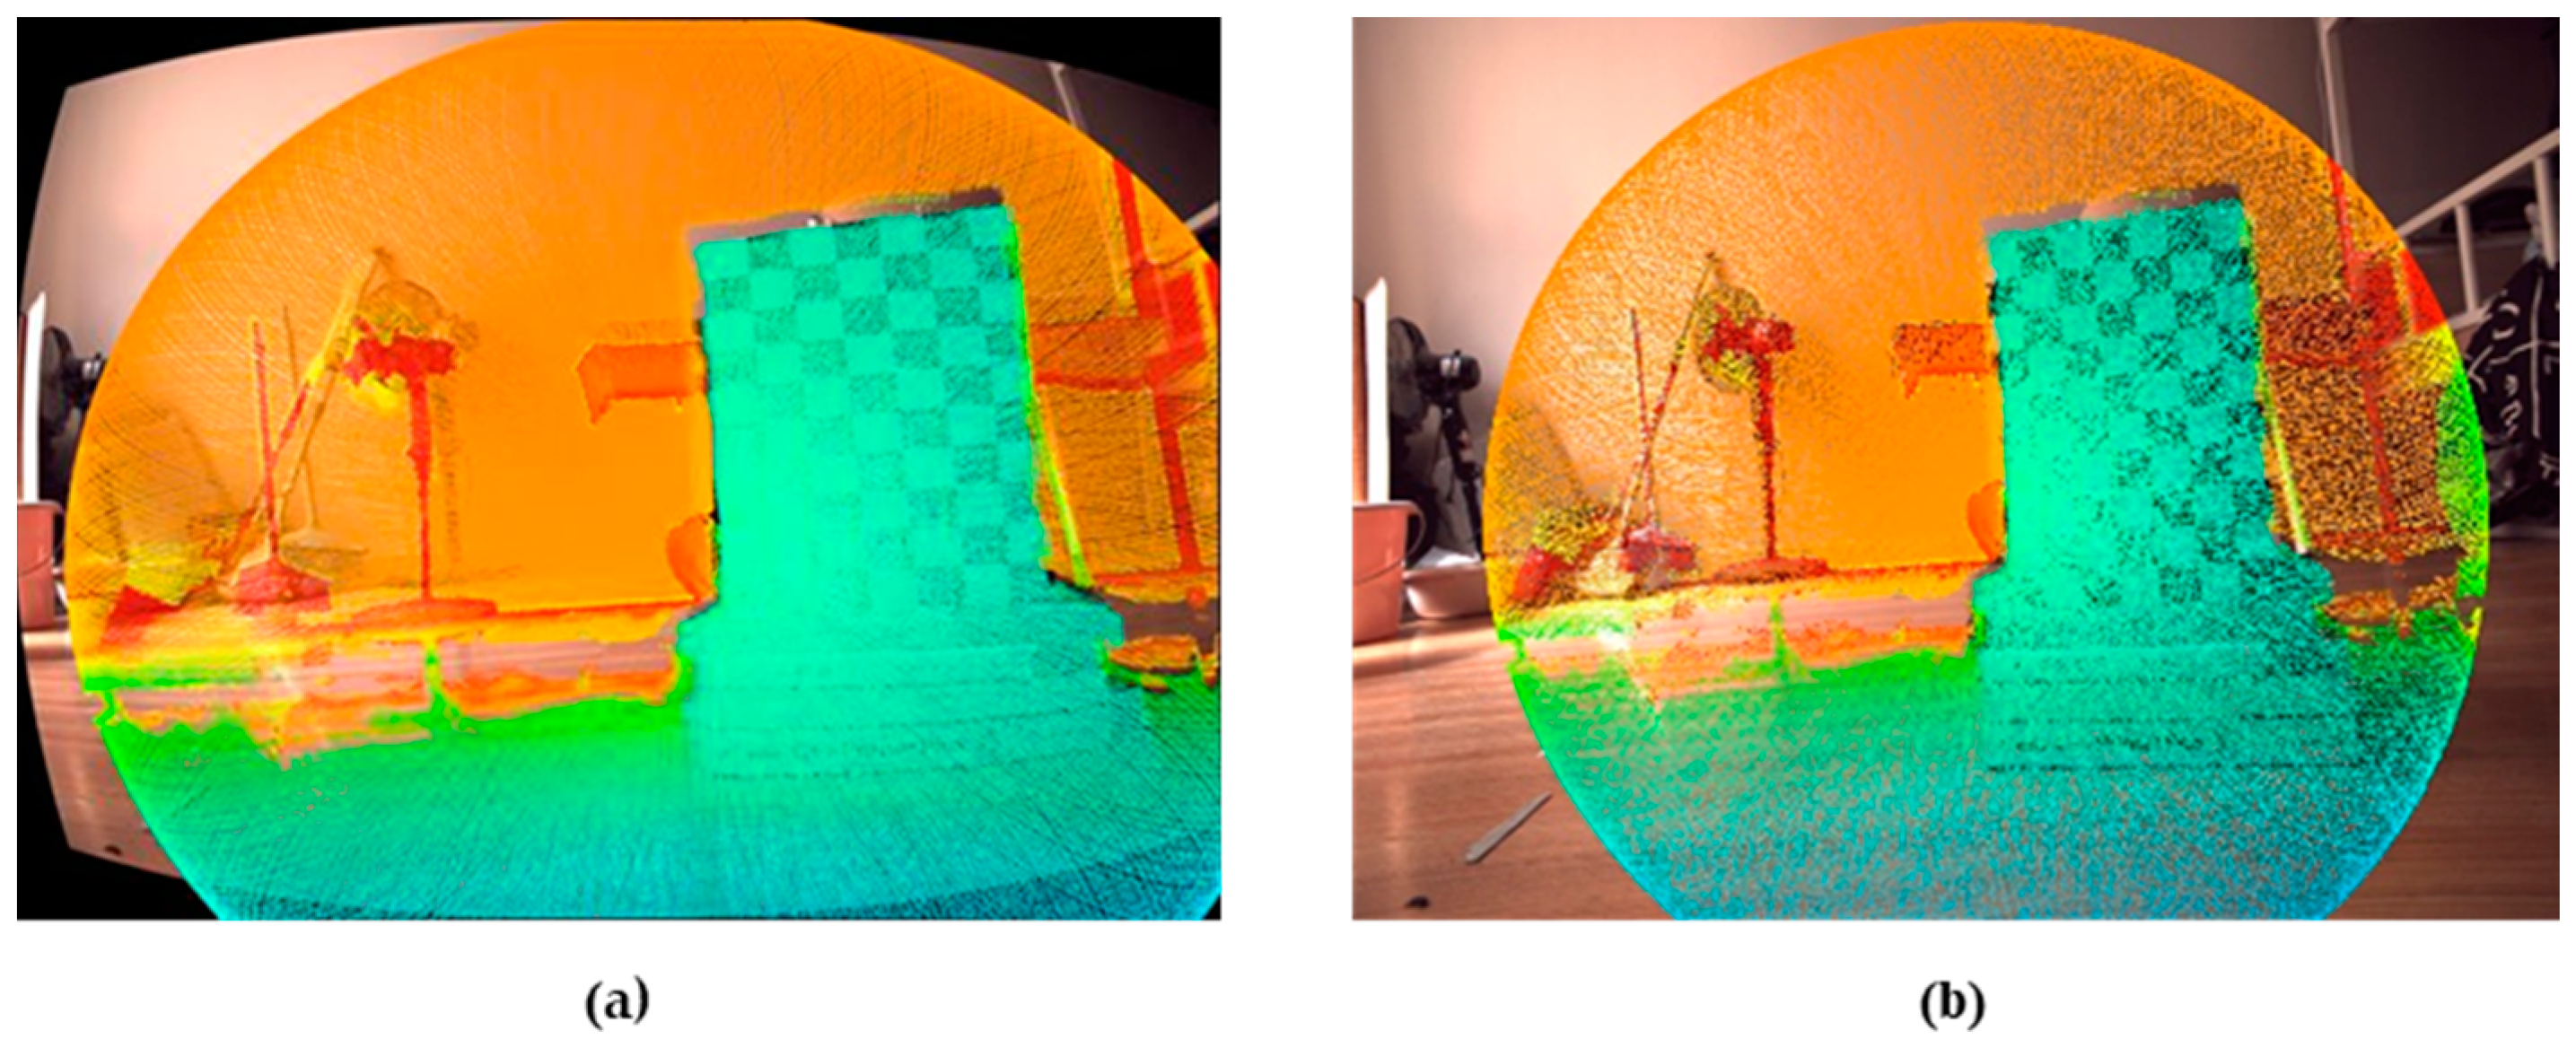
As shown in Figure 9b, the hand–eye calibration can achieve relatively accurate alignment, but in addition to the checkerboard, such as mop and fan targets have obvious position deviation. In order to quantitatively describe this error, 24 groups of points are manually selected, and the statistical theoretical pixel value and the error of calculated pixel value are shown in Table 1.
To solve the above question, we propose a new idea to improve the accuracy and applicability of registration, which combines the hand–eye calibration method with the edge feature point matching method, shown in Figure 10. By using the obtained feature points and the initial external parameter matrix, the method realizes the high-precision registration between the RGB camera and the LiDAR without considering the distortion of the internal parameter matrix of the camera. The specific algorithm flow is as follows:
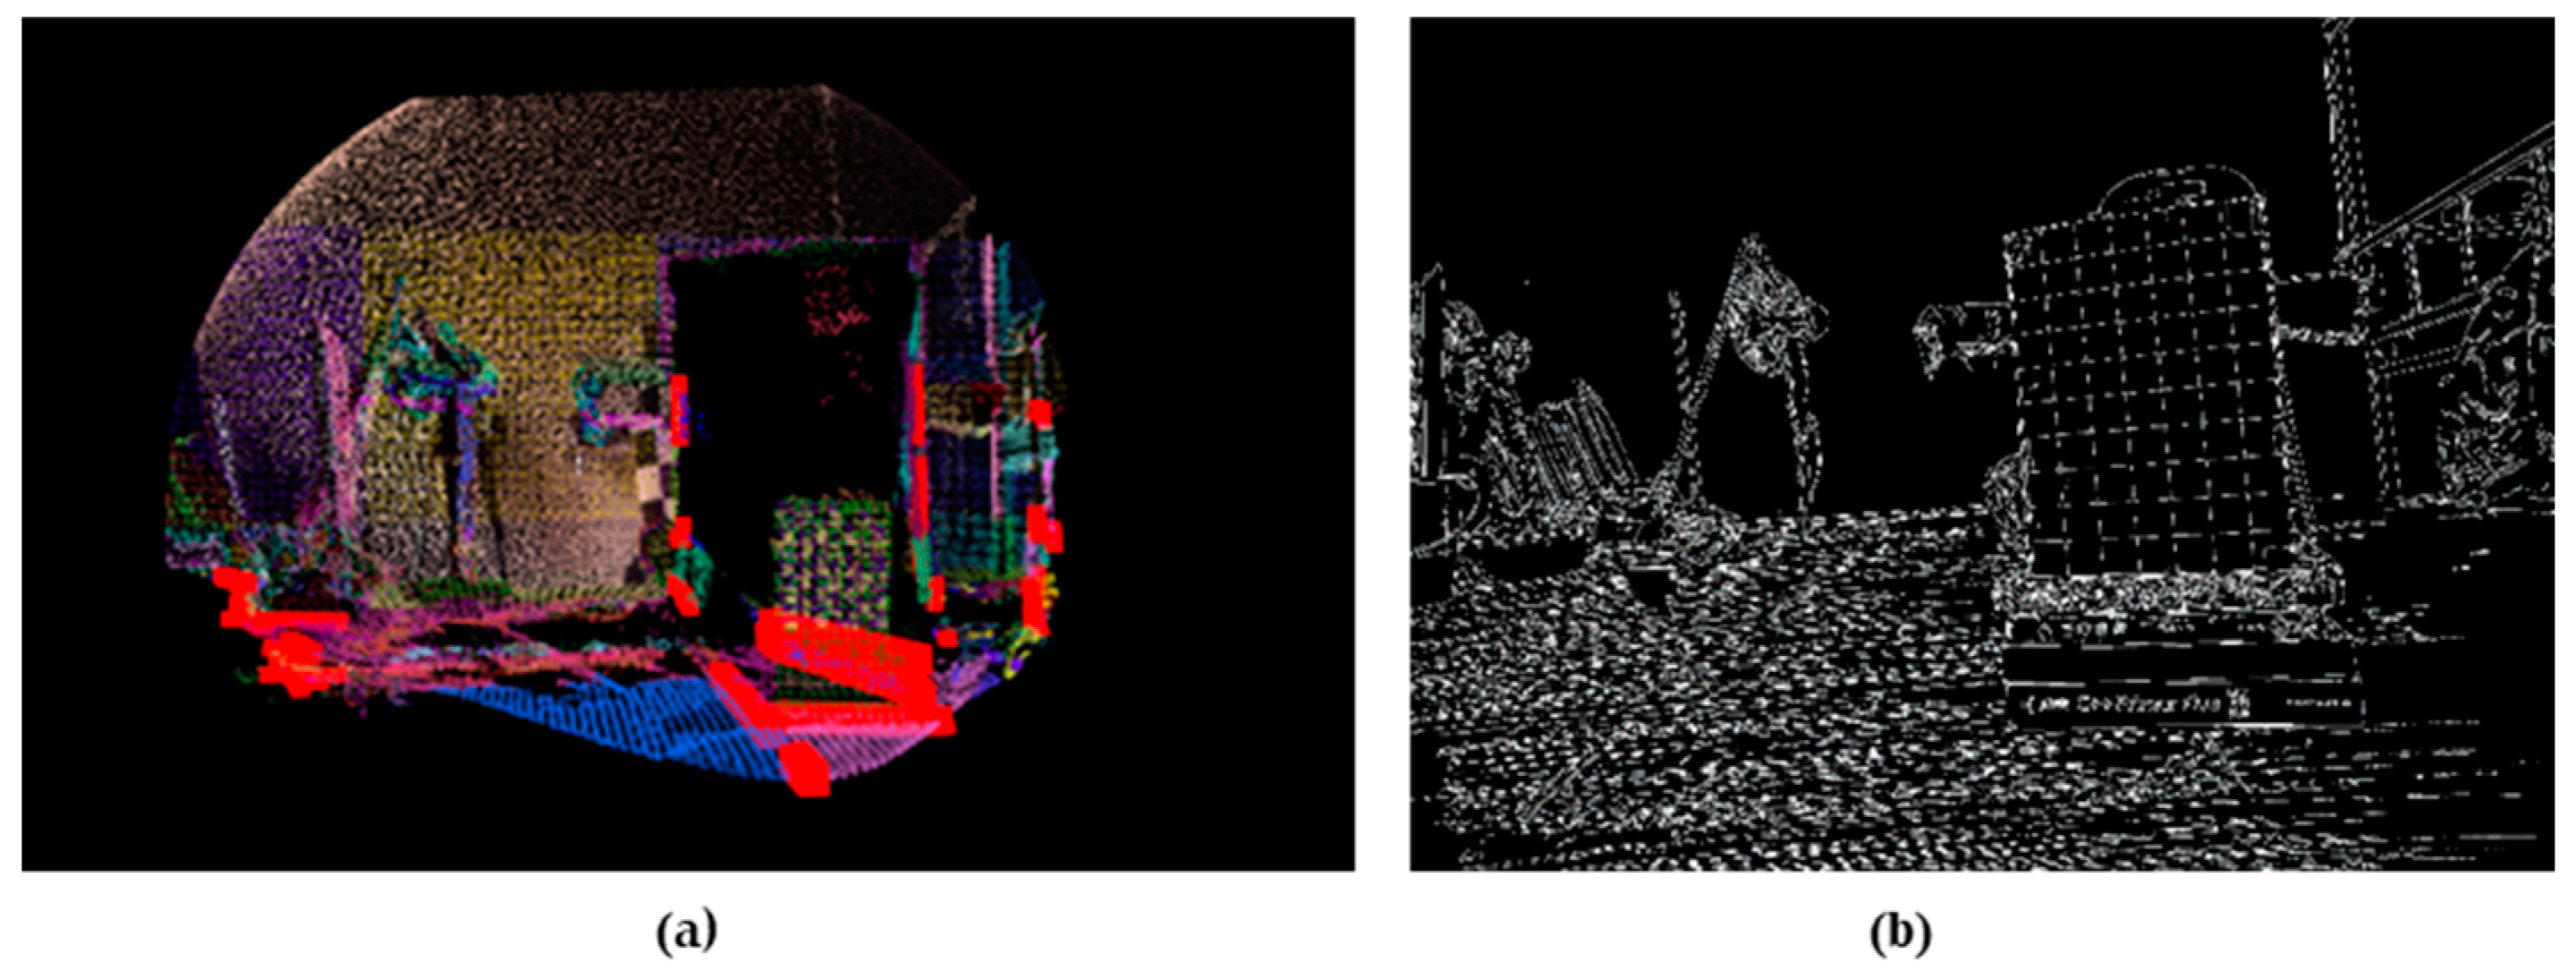
  • Edge feature extraction: The point cloud should be divided into 0.1 m × 0.1 m voxels. For each voxel, the RANSAC algorithm is repeatedly used to fit and extract the planes contained within the voxel. Plane pairs of angles within a certain range are formed, and plane intersection lines are solved, as shown in Figure 11a. The squares with the same color are set voxels;
  • Edge matching: The extracted LiDAR point cloud edge needs to be matched with the corresponding edge in the RGB image. For each extracted LiDAR edge, as shown in Figure 11b, we sample multiple points on the edge. Each sampling point is converted to the camera coordinate system using the preliminary external parameter matrix obtained earlier;
  • Error matching elimination: In addition to projecting the extracted LiDAR edge sampling points, the edge direction is projected onto the image plane, and its perpendicularity with the edge features is verified. This can effectively eliminate the false matching near two non-parallel lines on the image plane;
  • Calculate the exact external parameter matrix.
After we obtain the exact external parameter matrix, the registration result of the proposed method can be obtained as shown in Figure 12b. According to the comparison in Figure 12, it can be intuitively seen that the registration result of Figure 12b is better than that of Figure 12a, and all parts except the calibration object are matched.
The estimated errors of 24 groups of points are shown in Table 2. And the comparison between Table 1 and Table 2 shows that the average error in the U and V directions of image pixels is reduced, which further proves the improvement of registration accuracy.

5.2. Construction of 3D Geometric Model

Using the intrinsic parameter matrix and the extrinsic parameter matrix obtained through the process described in Section 4.1, the optical camera coordinate system can be converted to the LiDAR coordinate system. This allows the scene color information captured by the optical camera to be mapped onto the point cloud, resulting in a colored point cloud. The colored point cloud data are then preprocessed to complete the three-dimensional geometric scene reconstruction. The preprocessing steps include:
  • Voxel-grid filtering [25], which regularizes and orders the point cloud more effectively than the original data;
  • Statistical outlier removal, which eliminates outliers by setting an outlier threshold;
  • The greedy algorithm [26] makes the optimal choice in the current situation, selects the points to be connected according to certain topological and geometric constraints, and realizes the three-dimensional reconstruction of the filtered point cloud.

6. Multi-Sensor Data Fusion

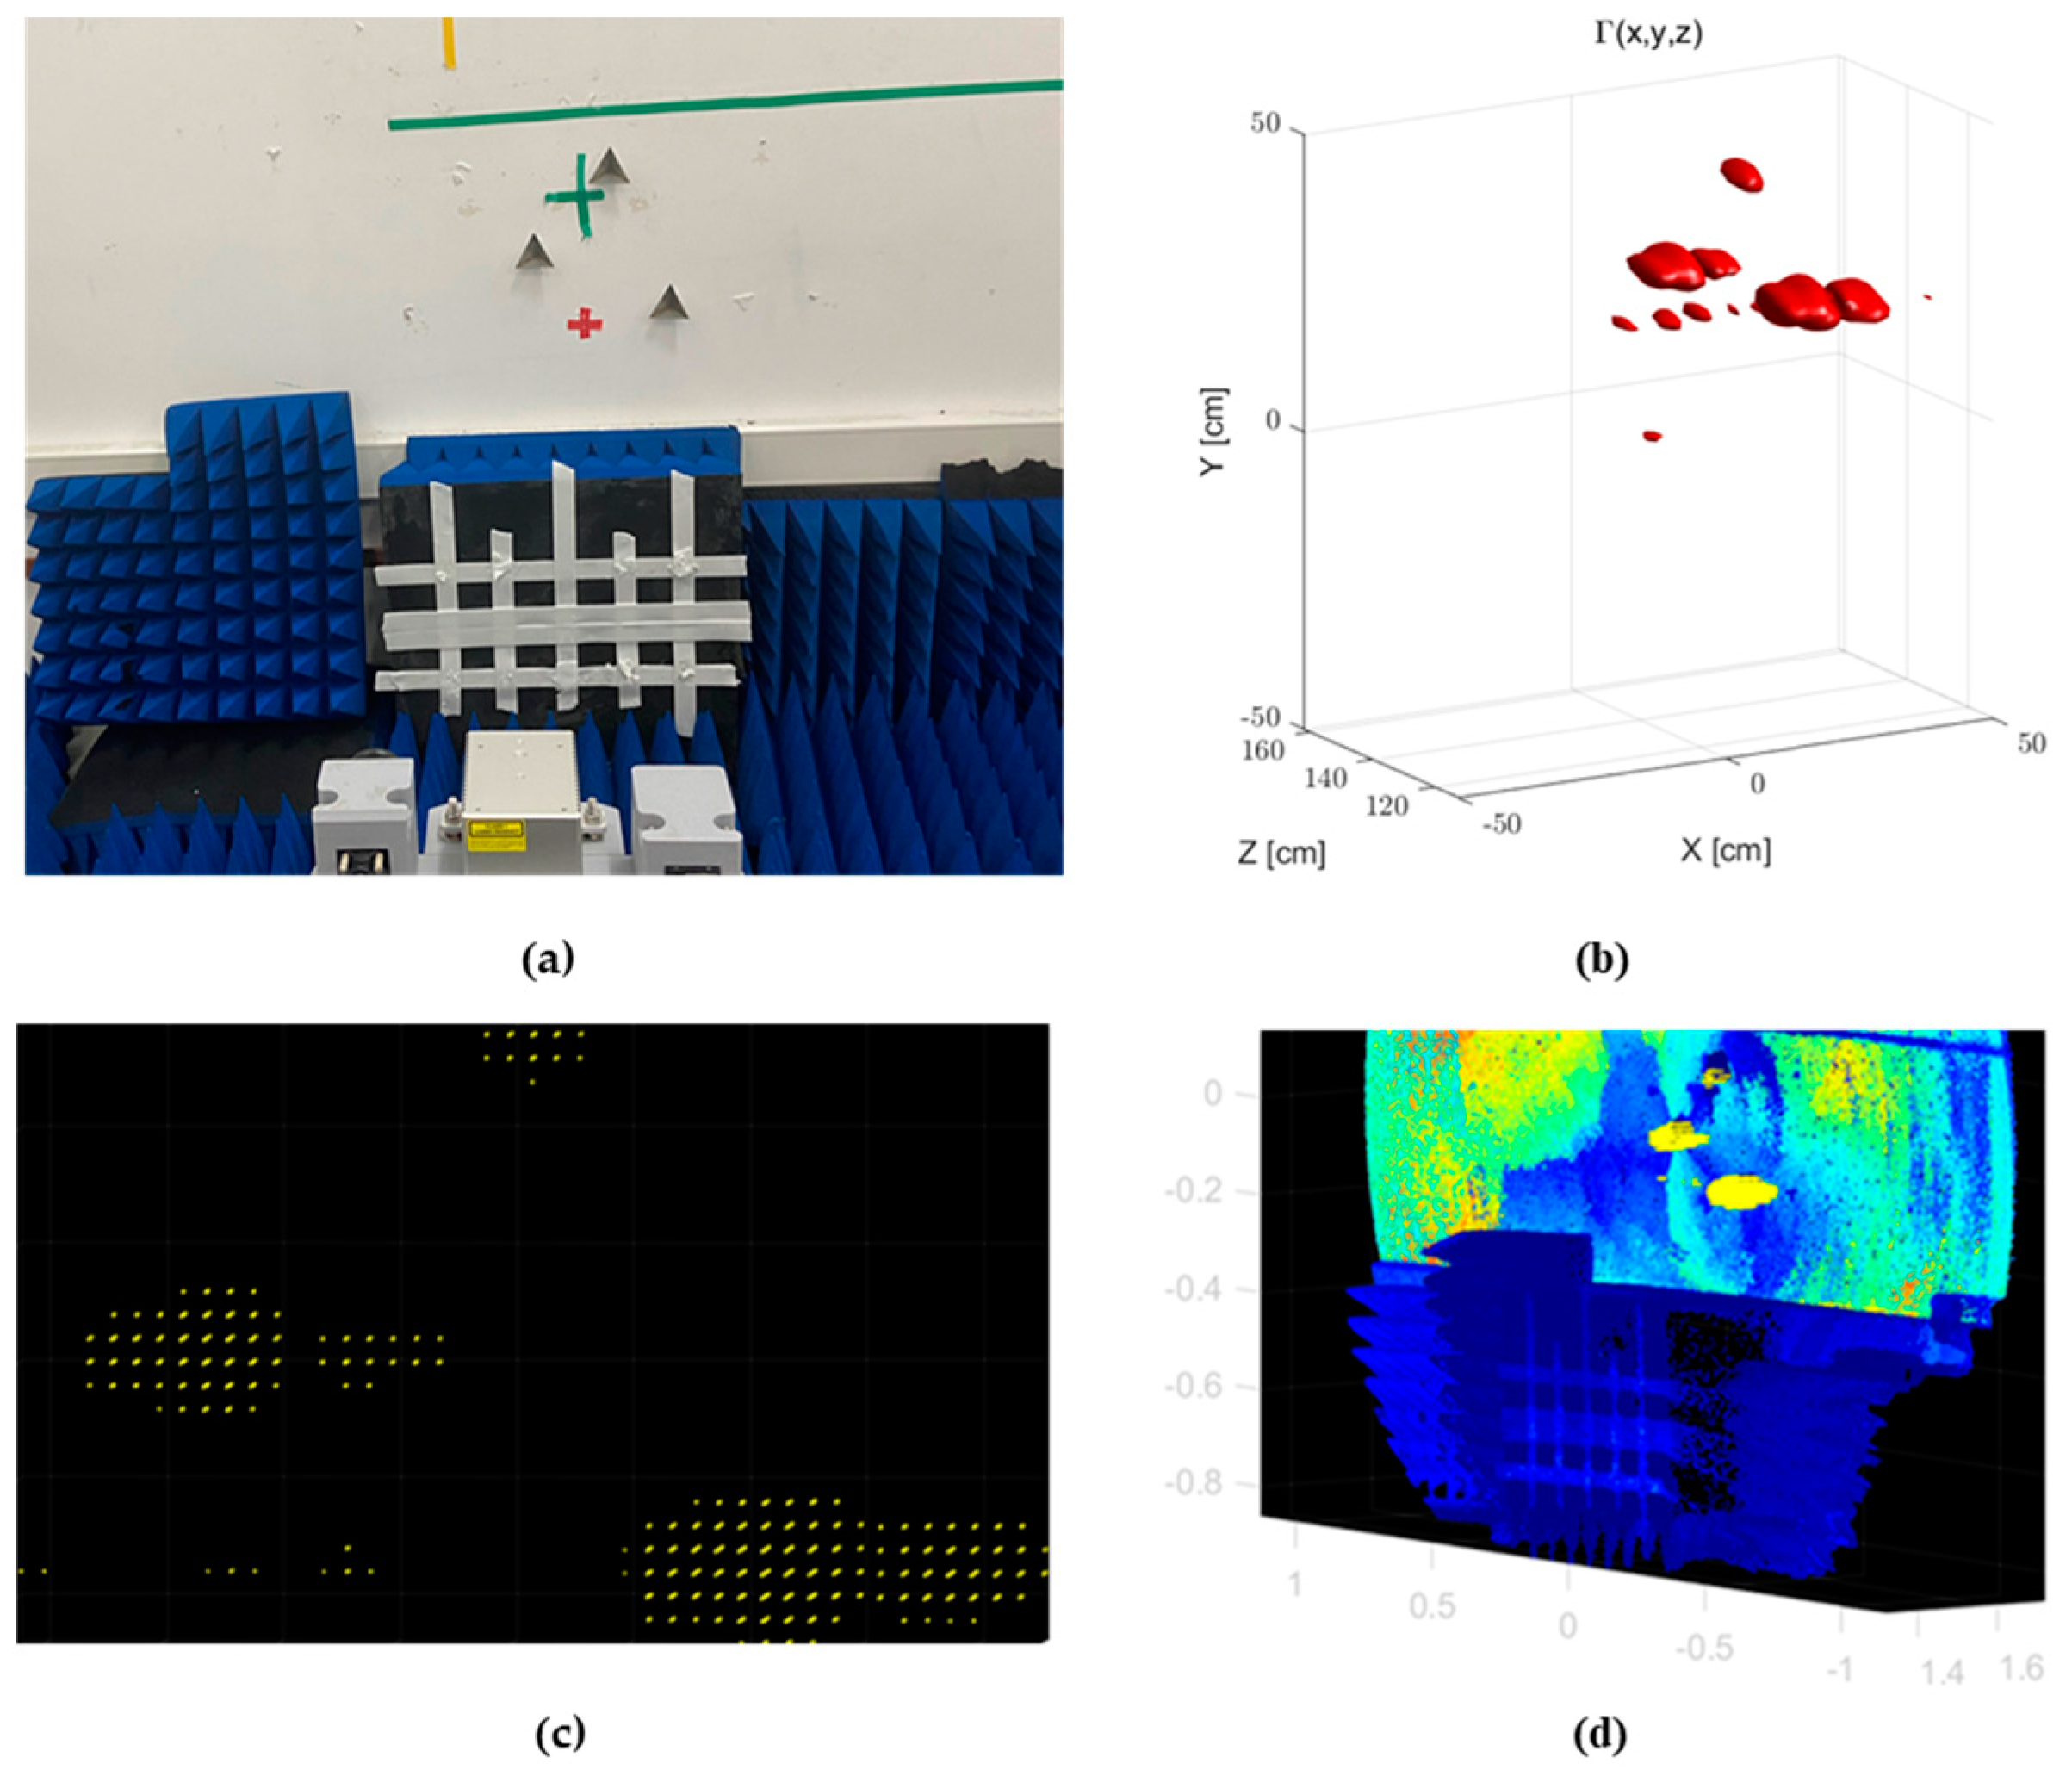
To fuse the geometric model and the physical model, the millimeter-wave radar sensor and the LiDAR sensor need to be registered, and then the results from the two sensors can be fused together more accurately. First, the scene containing a prominent point is imaged. A 5 cm corner reflector is selected as the prominent point, and millimeter-wave radar and LiDAR data are collected for the scene shown in Figure 13a. Then, the millimeter-wave radar imaging algorithm described in Section 3.1 is used to perform three-dimensional imaging of the target scene, and the imaging result is converted into a millimeter-wave three-dimensional point cloud, as shown in Figure 13b. To fuse the millimeter-wave point cloud with the LiDAR point cloud, the millimeter-wave point cloud needs to be formatted in PCB, as shown in Figure 13c. Finally, the point cloud in Figure 13c is matched with the three-dimensional point cloud of the corner reflector obtained from the LiDAR scan using the hand–eye calibration method. The fusion result is shown in Figure 13d. By calculating the relative coordinates of the two point clouds, the external parameter matrix of the millimeter-wave radar and LiDAR point clouds can be generated, which can also be referred to as the registration matrix P L M between the two sensors.
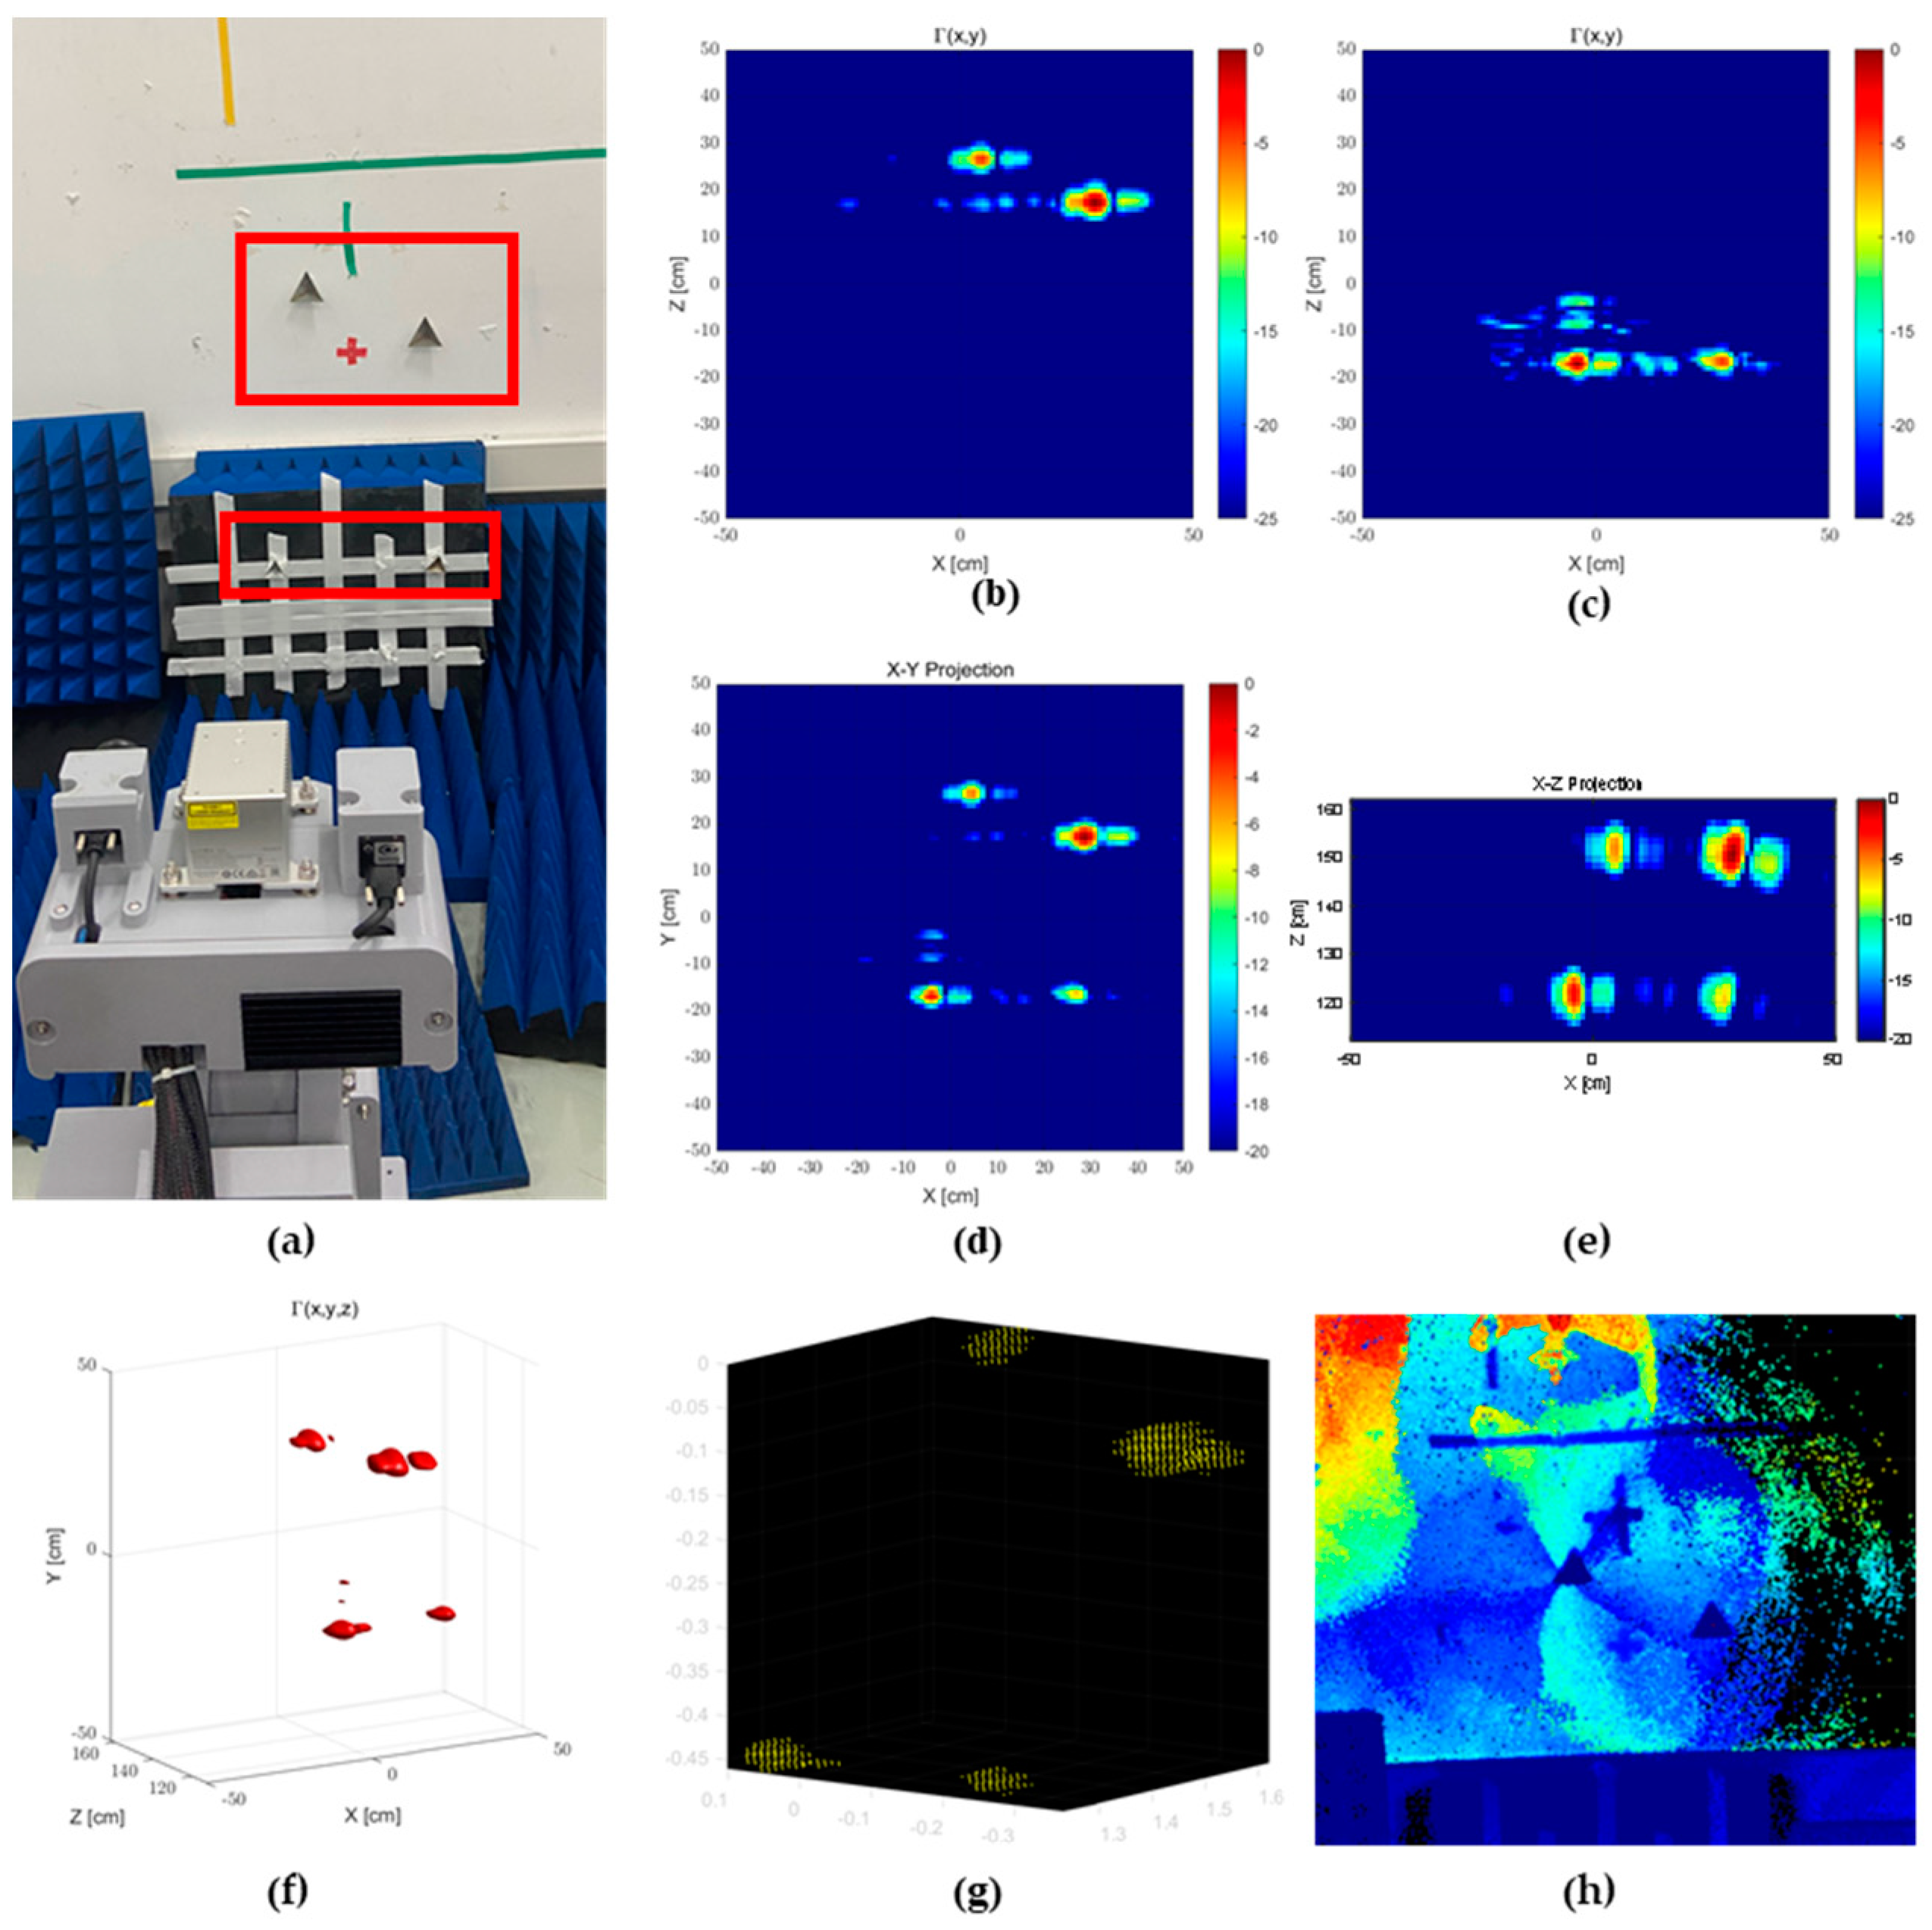
To verify the accuracy of the registration matrix and the generalization capability of the experimental setup, it is necessary to validate it with another scene. The new scene is shown in Figure 14a. This scene features four corner reflectors as prominent points: two 5 cm corner reflectors located on the wall farther from the system, and two 3 cm corner reflectors located 30 cm closer to the wall. First, millimeter-wave radar and LiDAR data are collected. The millimeter-wave data are then used to create three-dimensional images, with the imaging results (at different distances in the radar line of sight) shown in Figure 14b–e. The results demonstrate that the imaging of the four corner reflectors is consistent with the actual scene. Next, the millimeter-wave imaging results are converted into three-dimensional point clouds, as shown in Figure 14f. The millimeter-wave point cloud is then formatted in PCD, with the results shown in Figure 14g. Finally, the point cloud results from the LiDAR scan are shown in Figure 14h.
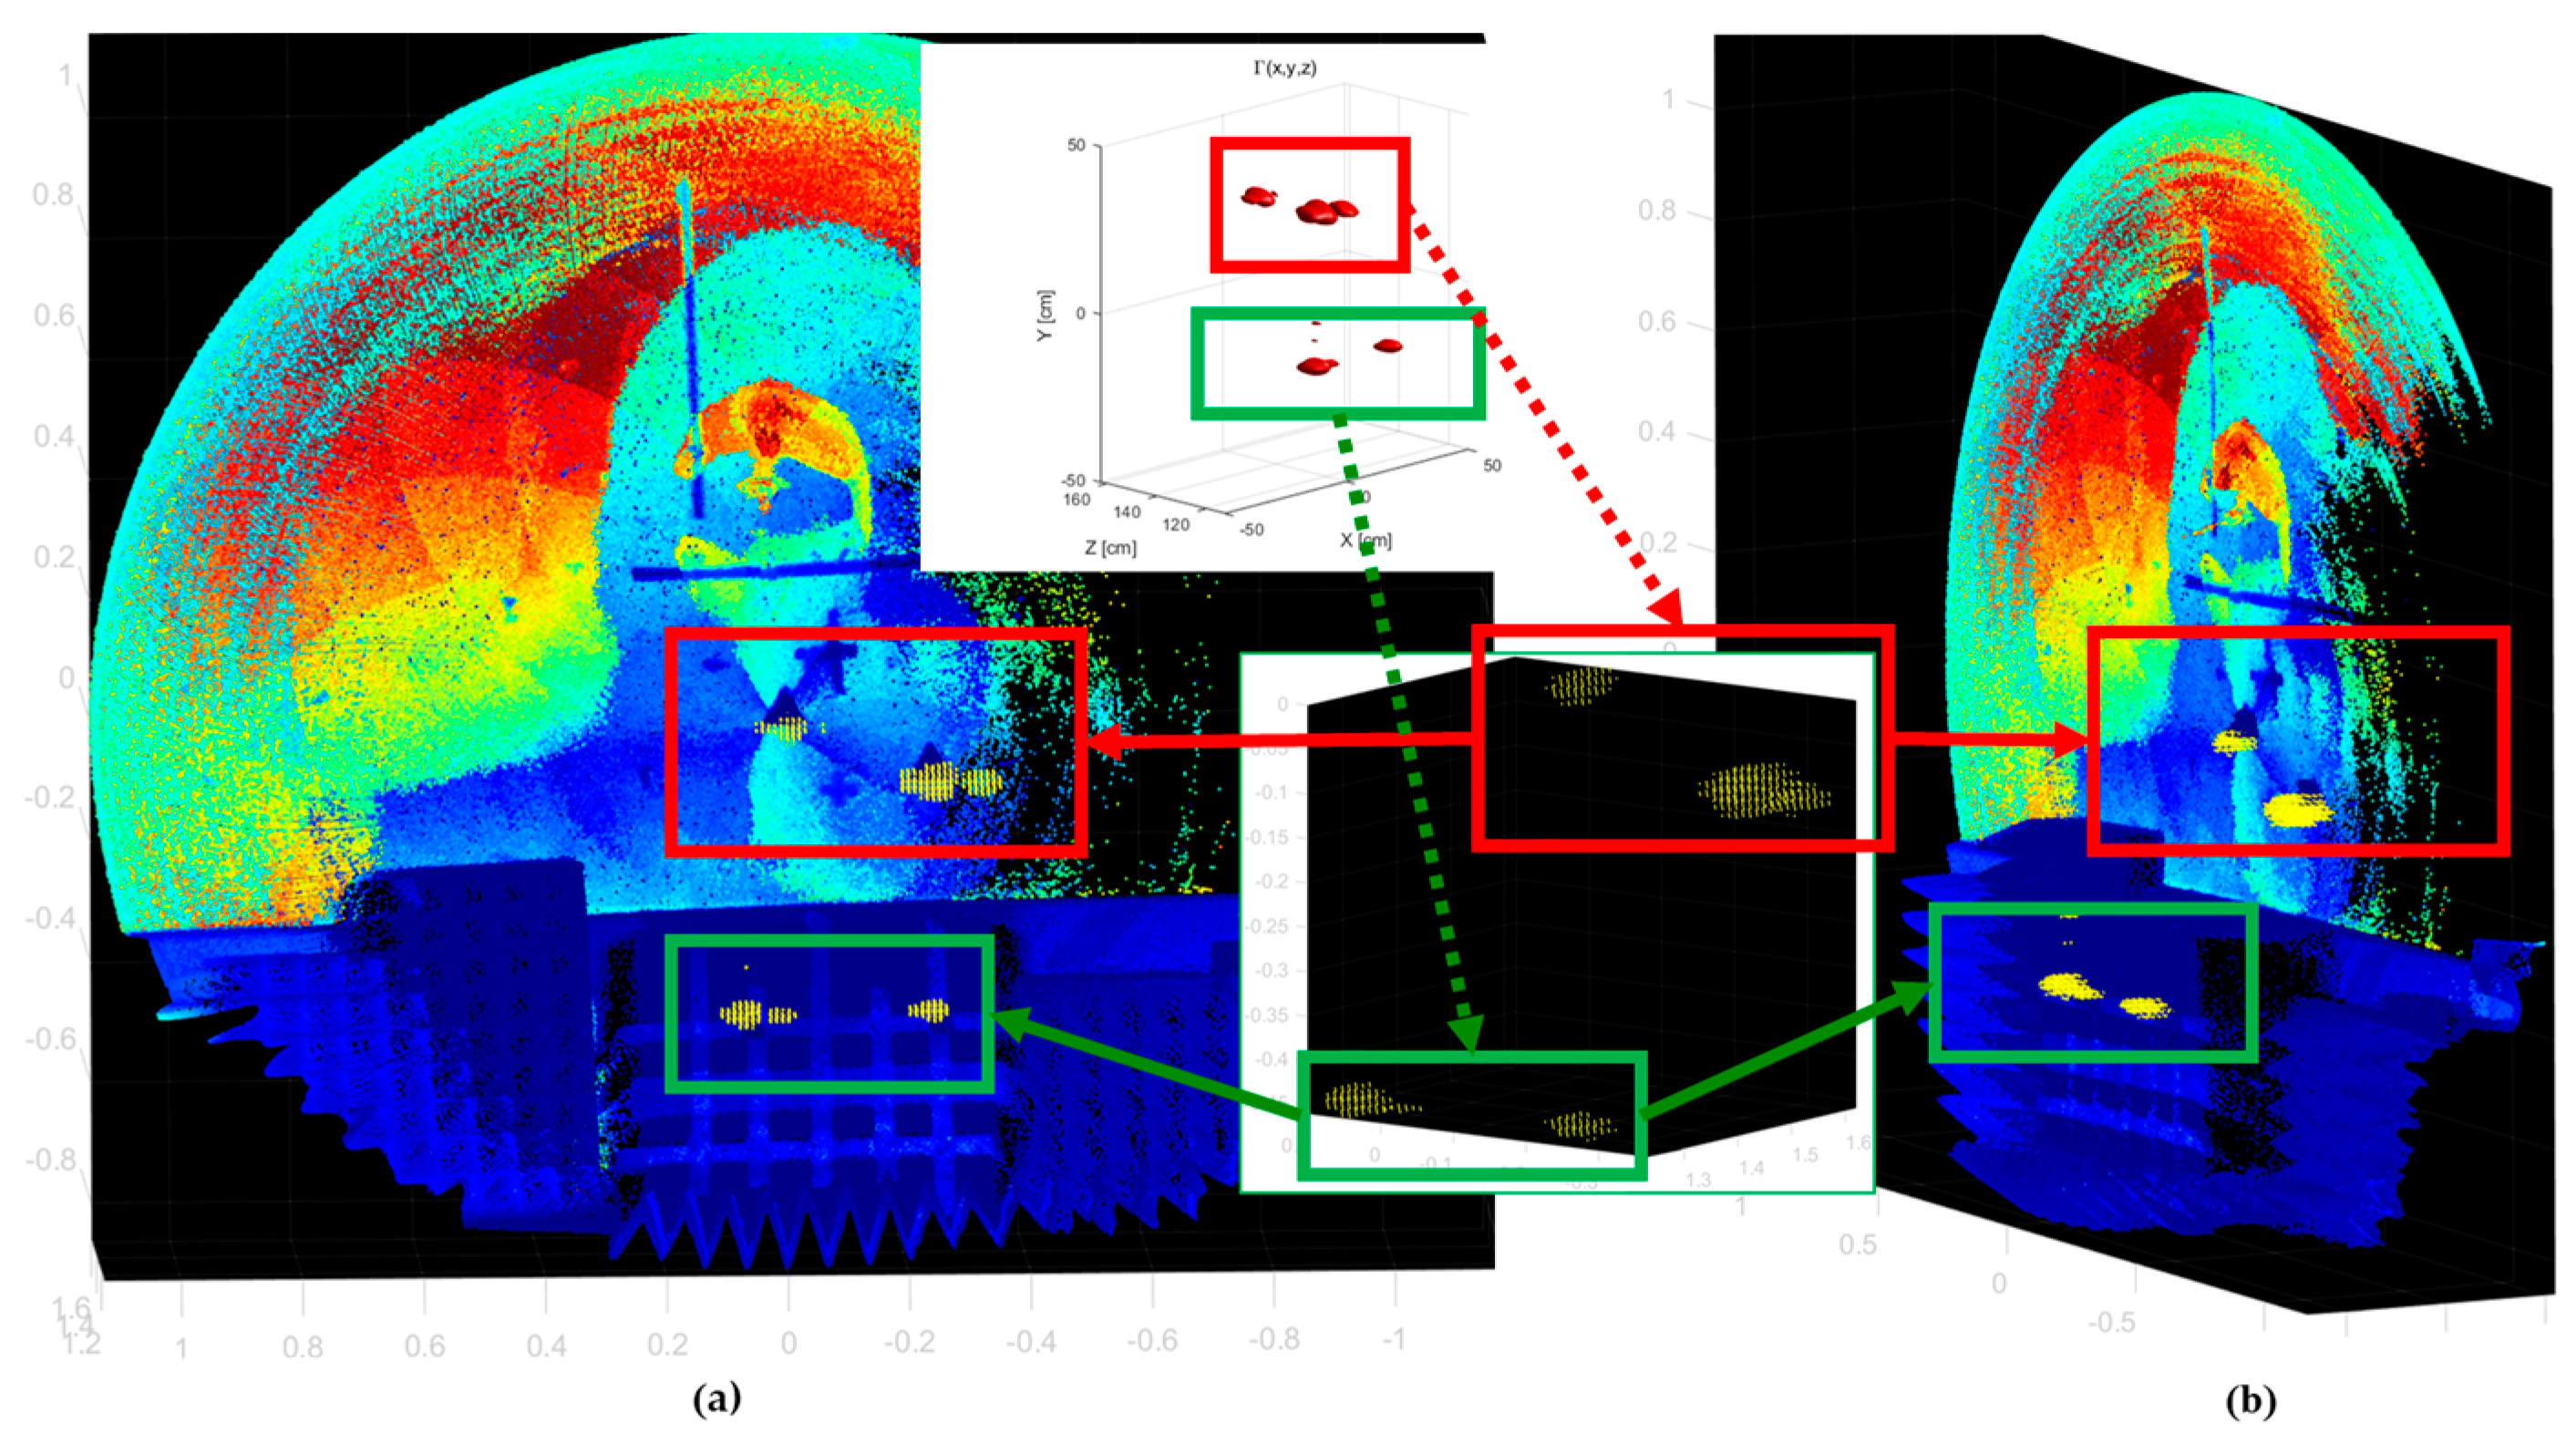
Finally, the registration matrix obtained through the process shown in Figure 14 is used to fuse the millimeter-wave point cloud and the LiDAR point cloud. The fusion result is displayed in Figure 15. It can be observed that the distinctive points, with varying distributions in three-dimensional space relative to the test system, have all been registered with high accuracy. The positions of the distinctive points correspond one-to-one. The test experimental results indicate that the obtained registration matrix is correct and effective and can be applied to other scene experiments.
The registration method for the multispectral camera and LiDAR is identical to the registration method for the optical camera and LiDAR. It is worth noting that the sensor bracket structure in the system shown in Figure 1 is rigid. Therefore, if the system bracket changes, the relative positions between the sensors will also change. Otherwise, multiple registrations between the sensors are unnecessary.

7. Experimental Results

To verify the ability of the proposed FUSEN system to construct geometric-physical modeling and its applicability in actual scenarios, an actual measurement experiment was conducted in a typical conference room environment. The scene includes materials such as glass, cement, and metal.

7.1. Electromagnetic Characteristic Sample Imaging Experiment

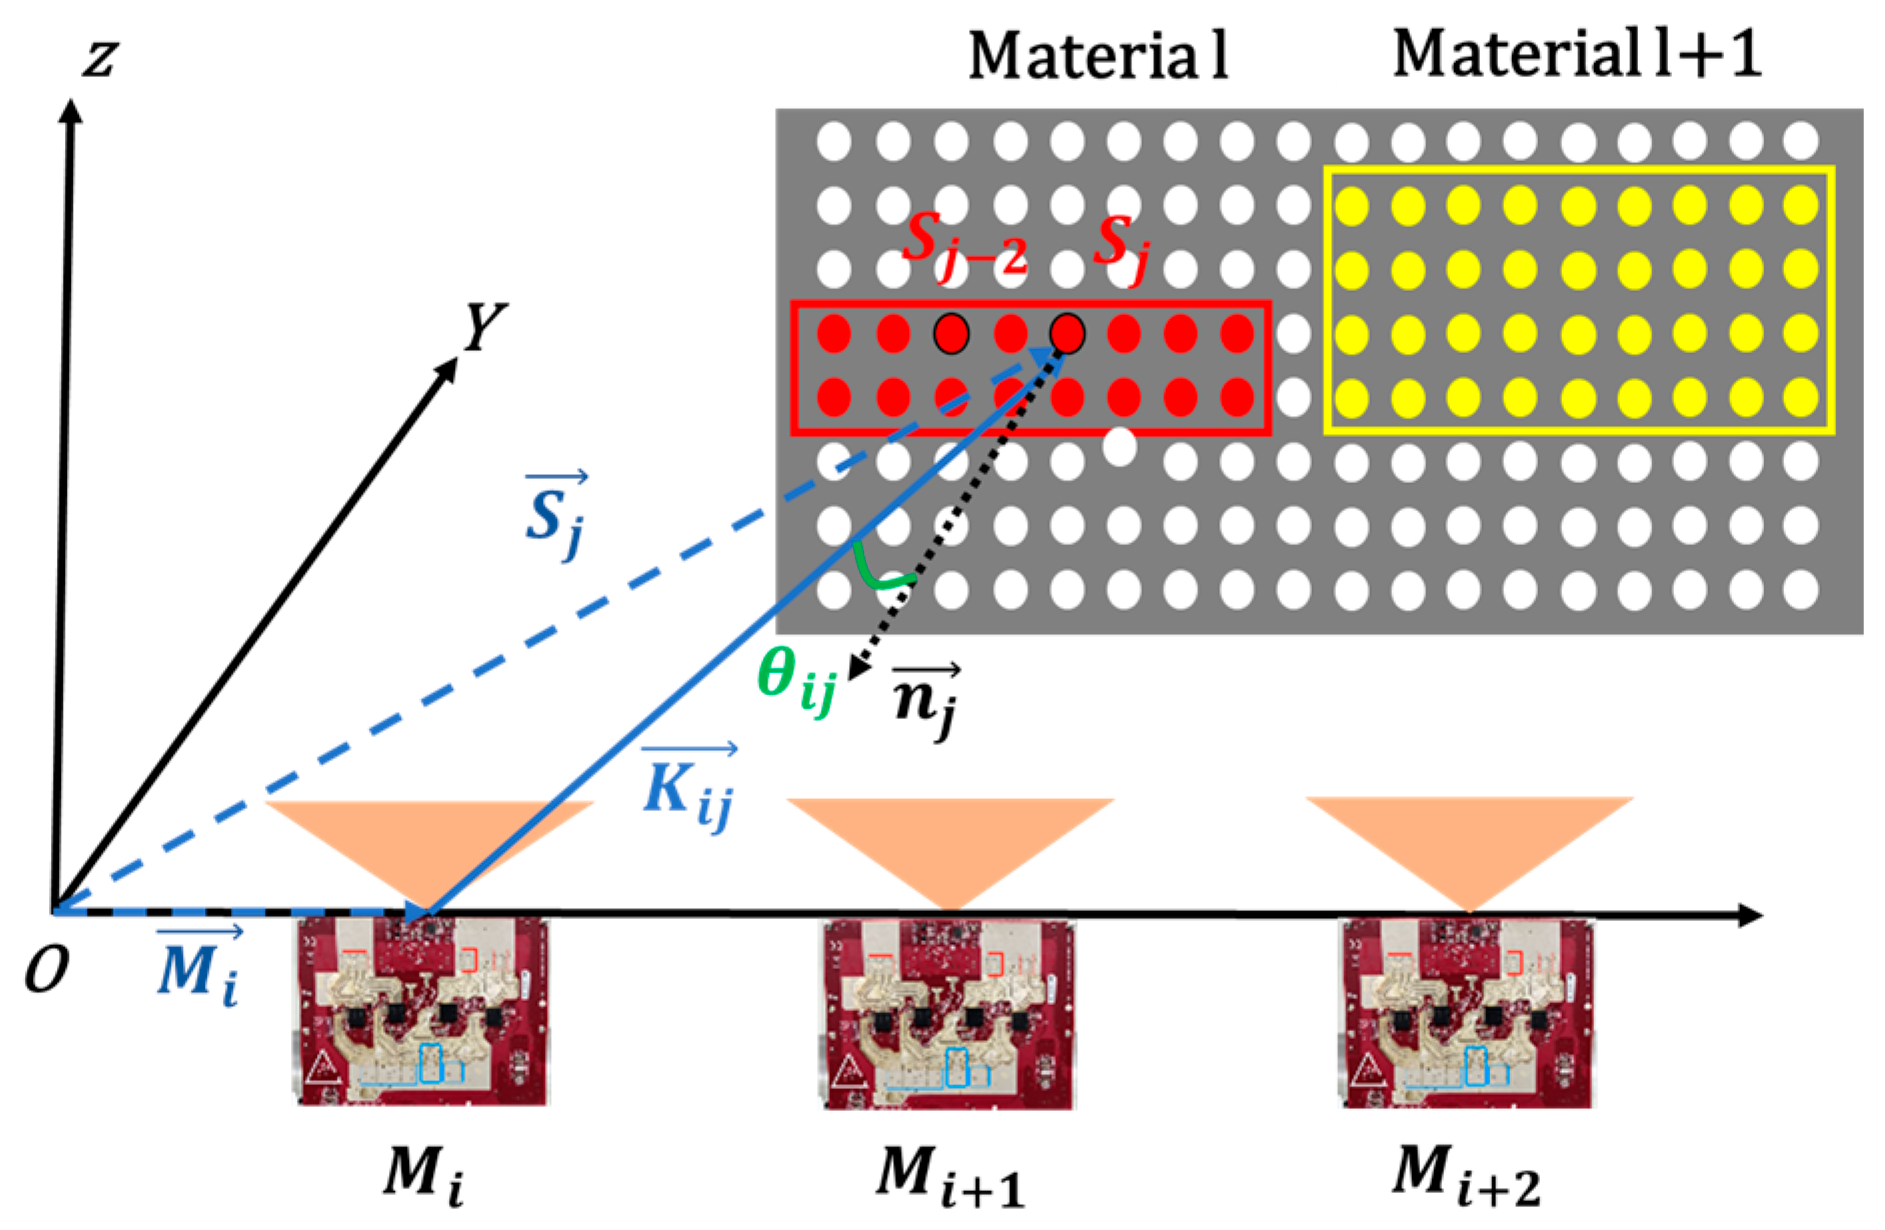
The millimeter-wave radar is used to extract the physical characteristics of the target and complete the collection of the electromagnetic scattering characteristic curve sample library. Through millimeter-wave radar three-dimensional imaging, the three-dimensional coordinates of each resolution unit in the target scene relative to the radar can be obtained. By converting these coordinates into polar coordinates, the incident angle θ i j of each resolution unit can be calculated. The specific process is illustrated in Figure 16. In the figure, l represents the number of materials, j represents the number of scattering points, and S represents the scattering point. The system is placed in different positions ( M i , M i + 1 , ), which need to be determined according to the FOV of the millimeter-wave radar. The calculation expression for the incident angle θ i j of the scattering point S j in material θ i j is as follows:
θ i j = arccos K i j · n j K i j
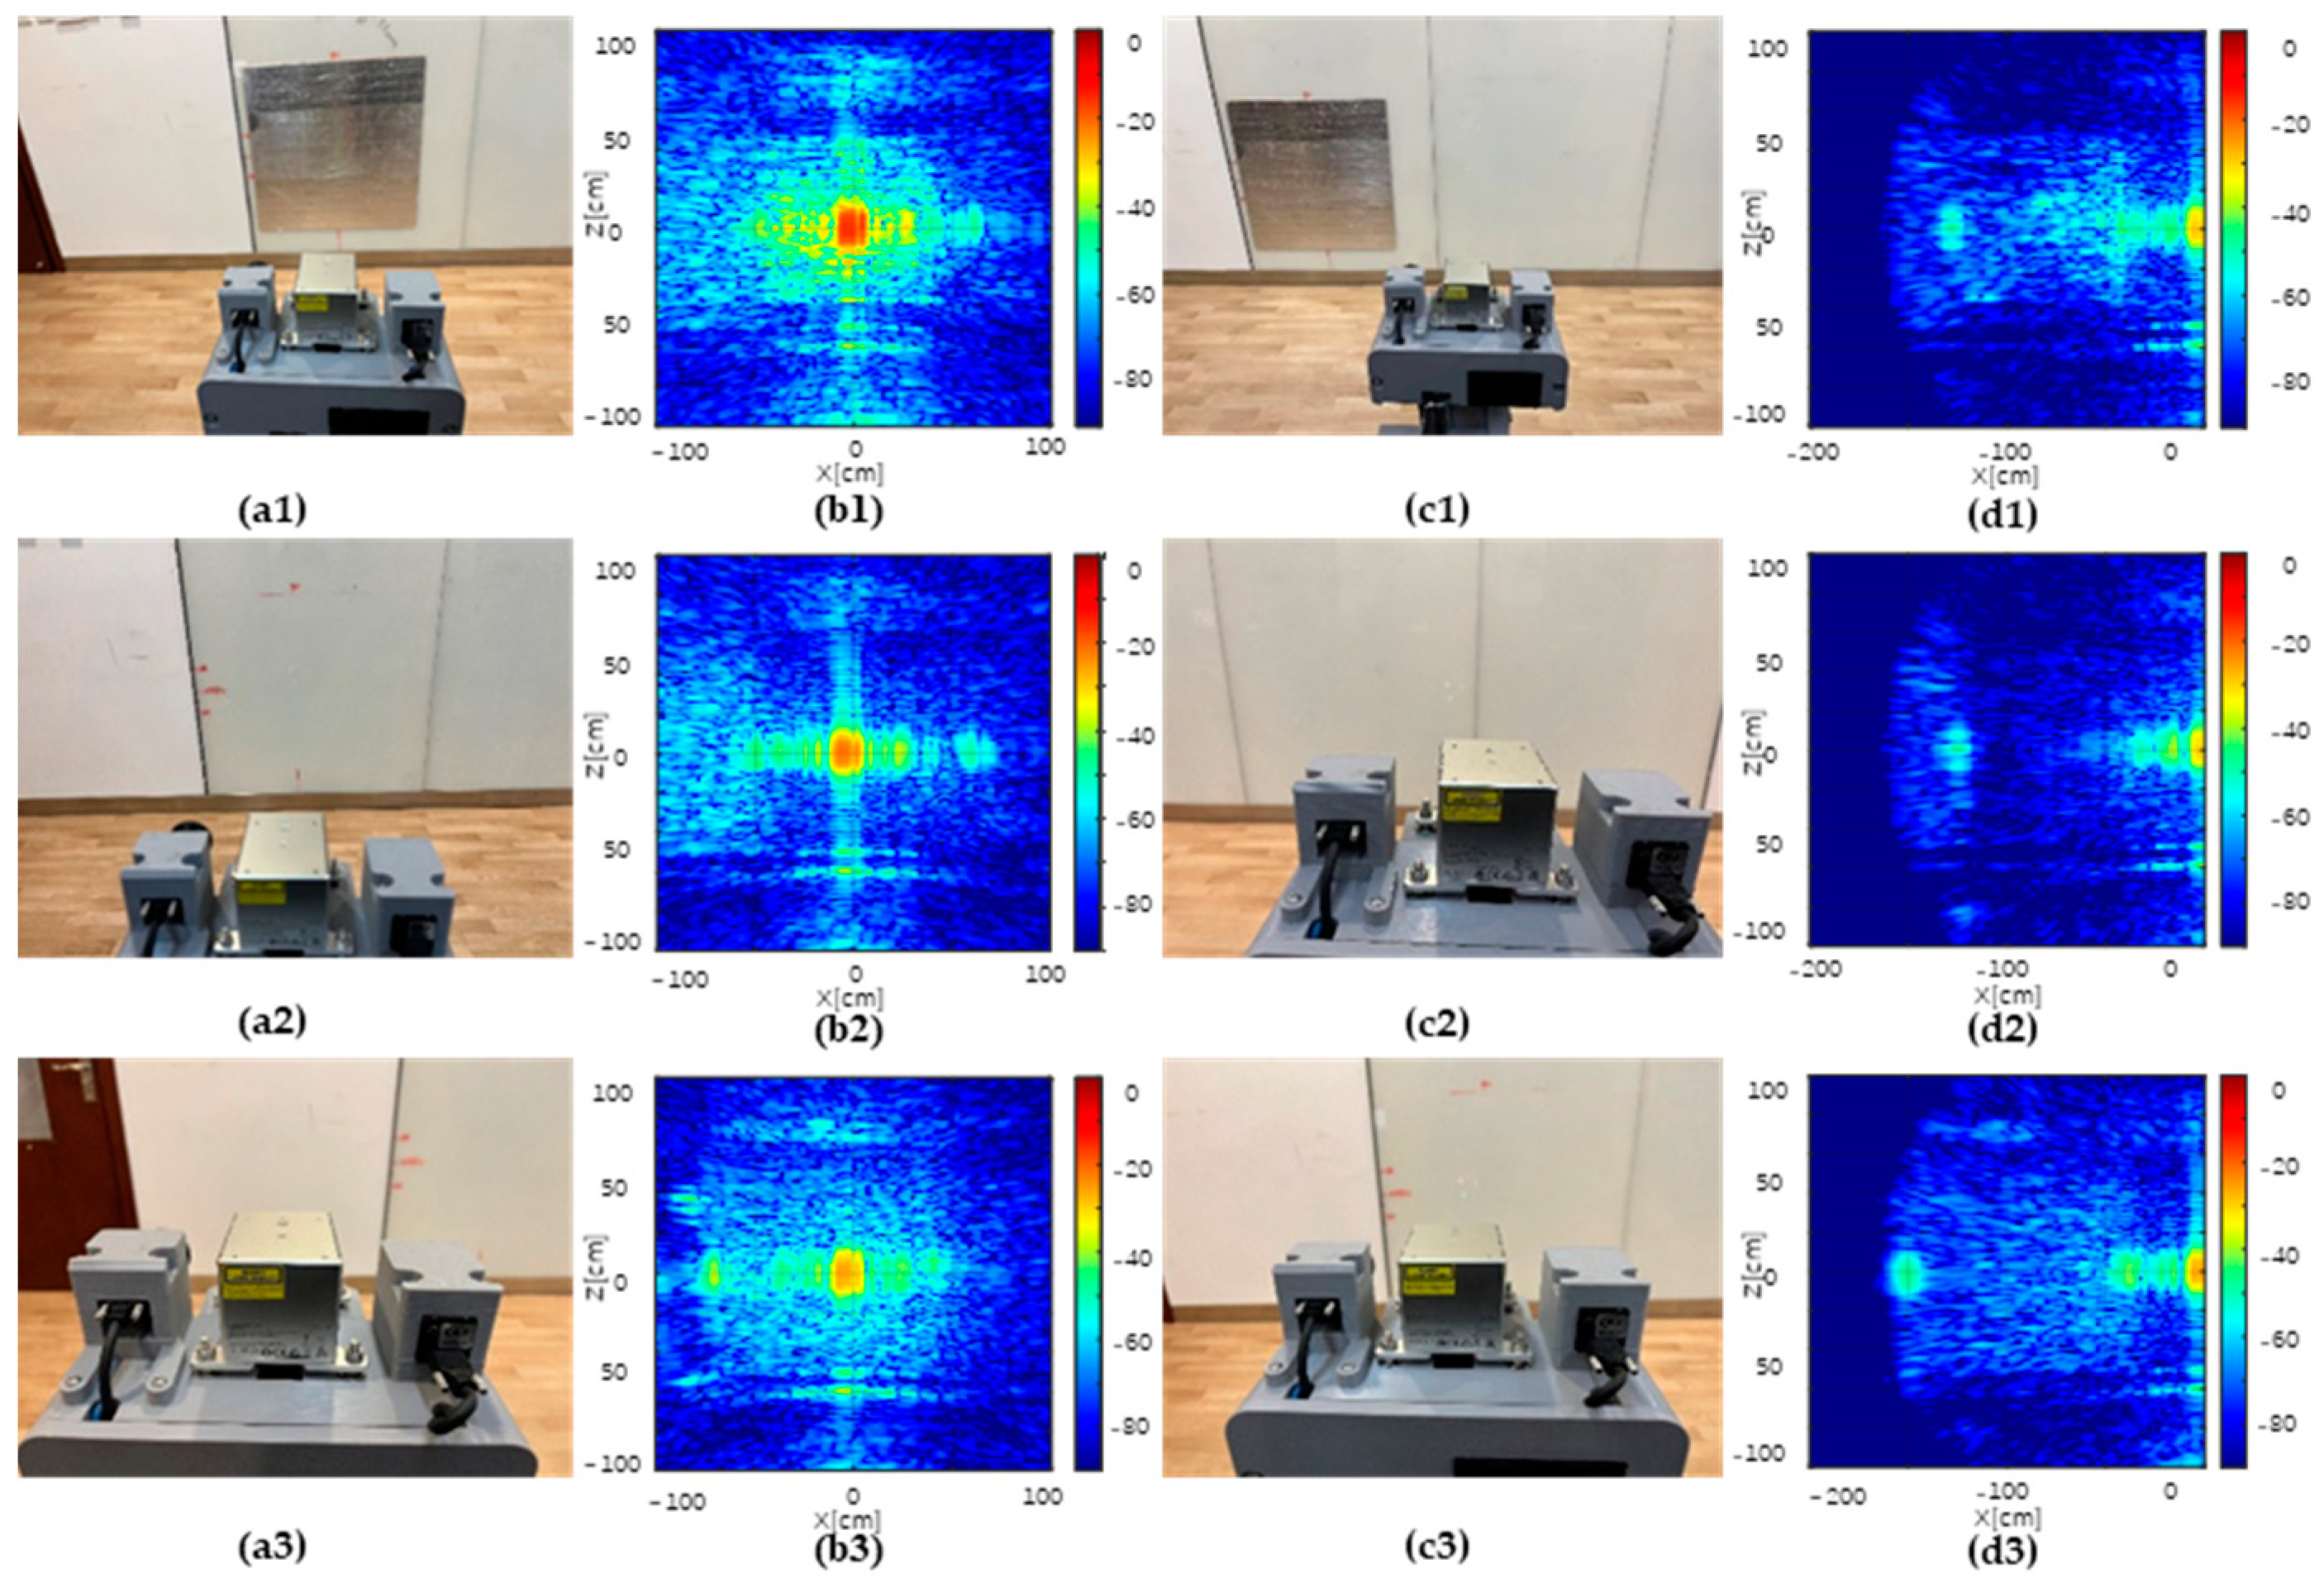
and by fusing multiple millimeter-wave radar imaging results, the scattering values of the same material at different incident angles can be obtained. It should be noted that at the same M i test position, the number of resolution units at different incident angles is different, so the data at the same angle can be averaged to obtain the target electromagnetic scattering intensity distribution diagram that changes with the angle. Data collection at different angles is carried out here, and the experimental scene and the corresponding imaging results are shown in Figure 17. Among them, data collection is carried out facing the metal foil, glass, and cement wall, respectively. The size of the metal foil plate is 80 cm × 80 cm, so the same range is also taken for the glass and cement wall for analysis.
Based on the radial distance of the millimeter-wave relative to the scene, angle 1 (shown in Figure 17(a1–a3)) provides the target electromagnetic scattering characteristics for the range (0°, 15°), and angle 2 (shown in Figure 17(c1–c3)) provides the scattering characteristics for the range (15°, 30°). The scattering intensity curves of the three materials as a function of angle are shown in Figure 16, which are obtained from the imaging results in Figure 17. In Figure 18, the red curve represents the scattering characteristics of the metal foil plate, while the black and green curves represent the scattering characteristics of the glass and cement wall, respectively. From the distribution of the three curves, it is observed that the scattering intensity of the metal is relatively large compared to the glass and cement wall. The echo energy for the metal is also relatively high but decays faster with an increasing incident angle, similar to the glass. In contrast, because the surface of the cement wall is rougher, the intensity of the received signal decreases with the change in angle more slowly than the other two materials.
The electromagnetic scattering characteristics of these three materials are quite different, which can be used as the basis for material identification. Specifically, the scattering characteristic curve library of the target of interest can be collected first, and then the measurement results can be matched with the sample. The structural similarity of the scattering characteristic curve or the Euclidean distance between points can be used as the identification basis. The scattering characteristic curve with the highest structural similarity or the lowest Euclidean distance is determined to be the corresponding material identification result.

7.2. Small-Area Environment Experiment

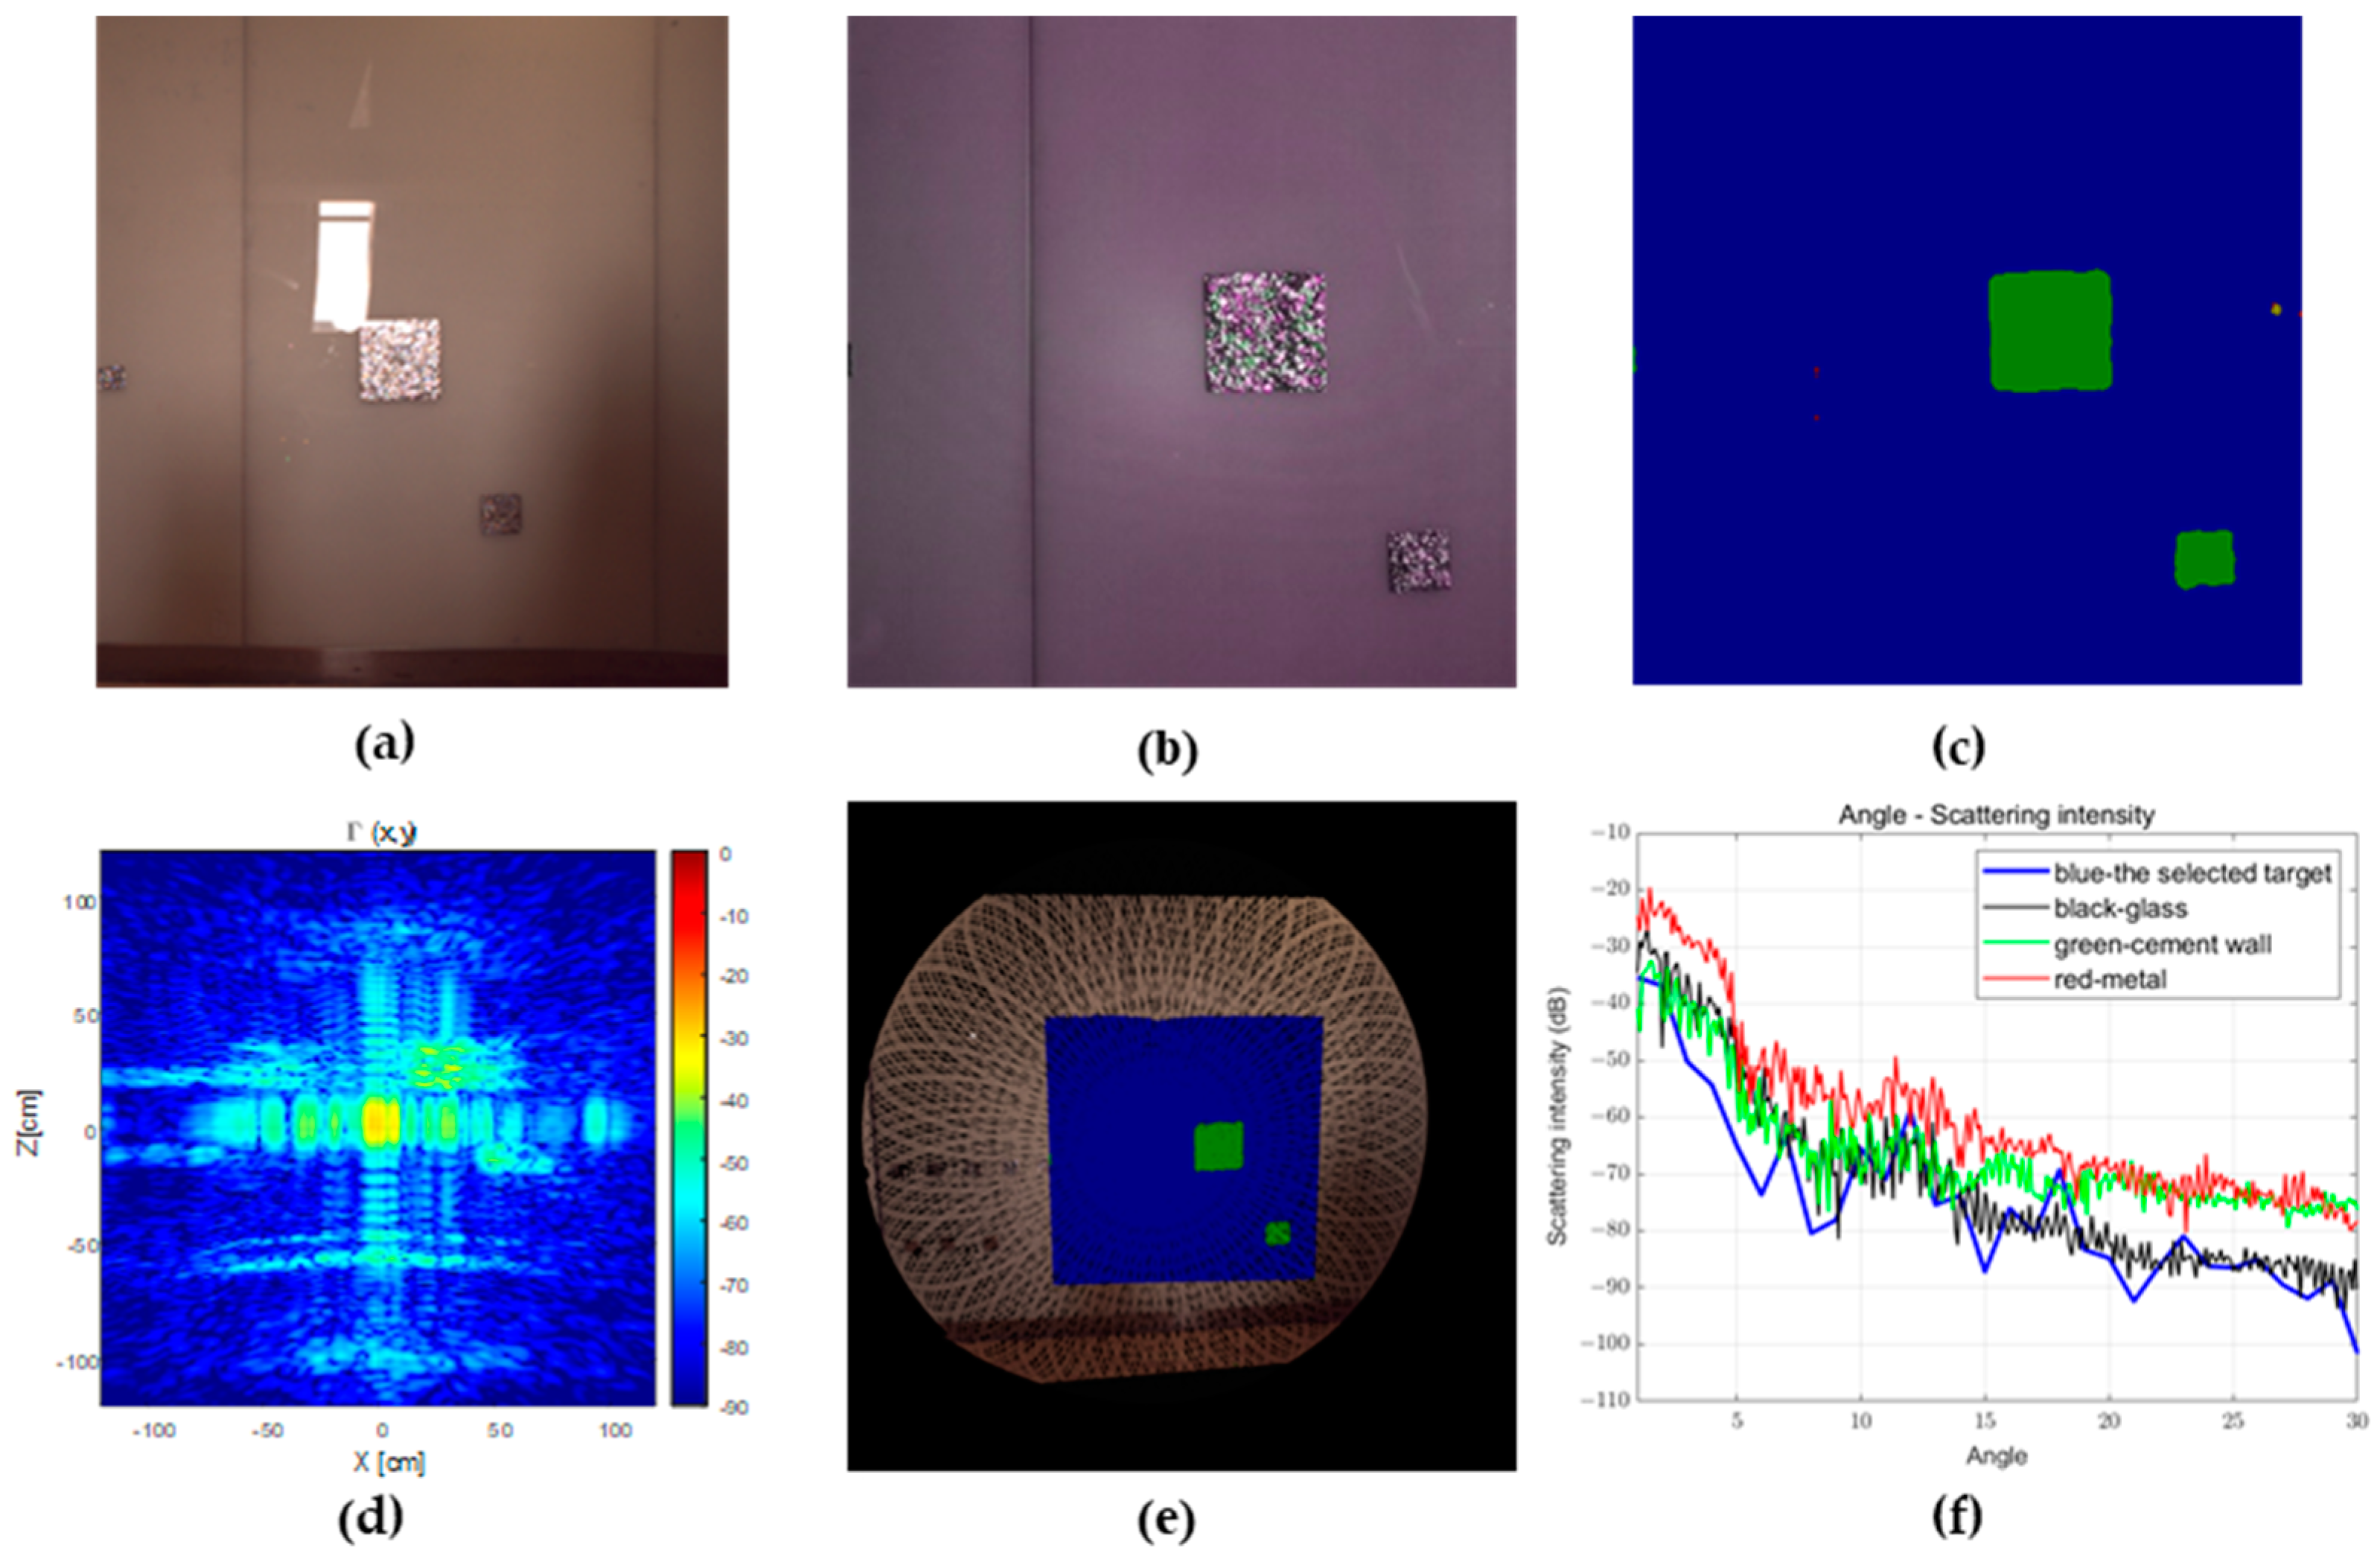
Experiments on small-scale local scenes are conducted. The experimental scenes can be reflected by the images captured by the RGB camera, as shown in Figure 19a. Figure 19b shows the pseudo-color results of the inversion of the nine-channel data collected by the multispectral image. Due to the small field of view, the target range captured is smaller than that of other sensors. Figure 19c shows the material recognition results obtained through model inference of the multispectral image. Green indicates metal, and blue indicates glass. Although there are some misjudged pixels in the figure, the overall recognition results are quite impressive. The imaging results of the millimeter-wave are shown in Figure 19d, where the location of the metal foil is clearly visible. Figure 19e shows the geometric-physical reconstruction results of the scene. This whole result takes nearly 268 s, and the three-dimensional imaging of millimeter-wave radar takes about 180 s (experiment platform: Inter (R) Xeon (R) W-10855M CPU with 32G RAM). Based on the LiDAR point cloud, RGB color information is attached to the point cloud, and the multispectral material recognition results are also reflected in the point cloud. The material identified as “glass” by multispectral analysis was selected to calculate the electromagnetic scattering characteristic curve and compared with the electromagnetic scattering characteristic sample library. The result is shown in Figure 19f. The blue curve represents the calculated electromagnetic scattering curve. After qualitative and quantitative analysis, it is determined that the area is indeed glass. This result demonstrates that millimeter-waves can also be used to identify target materials.

7.3. Whole-Room Experiment

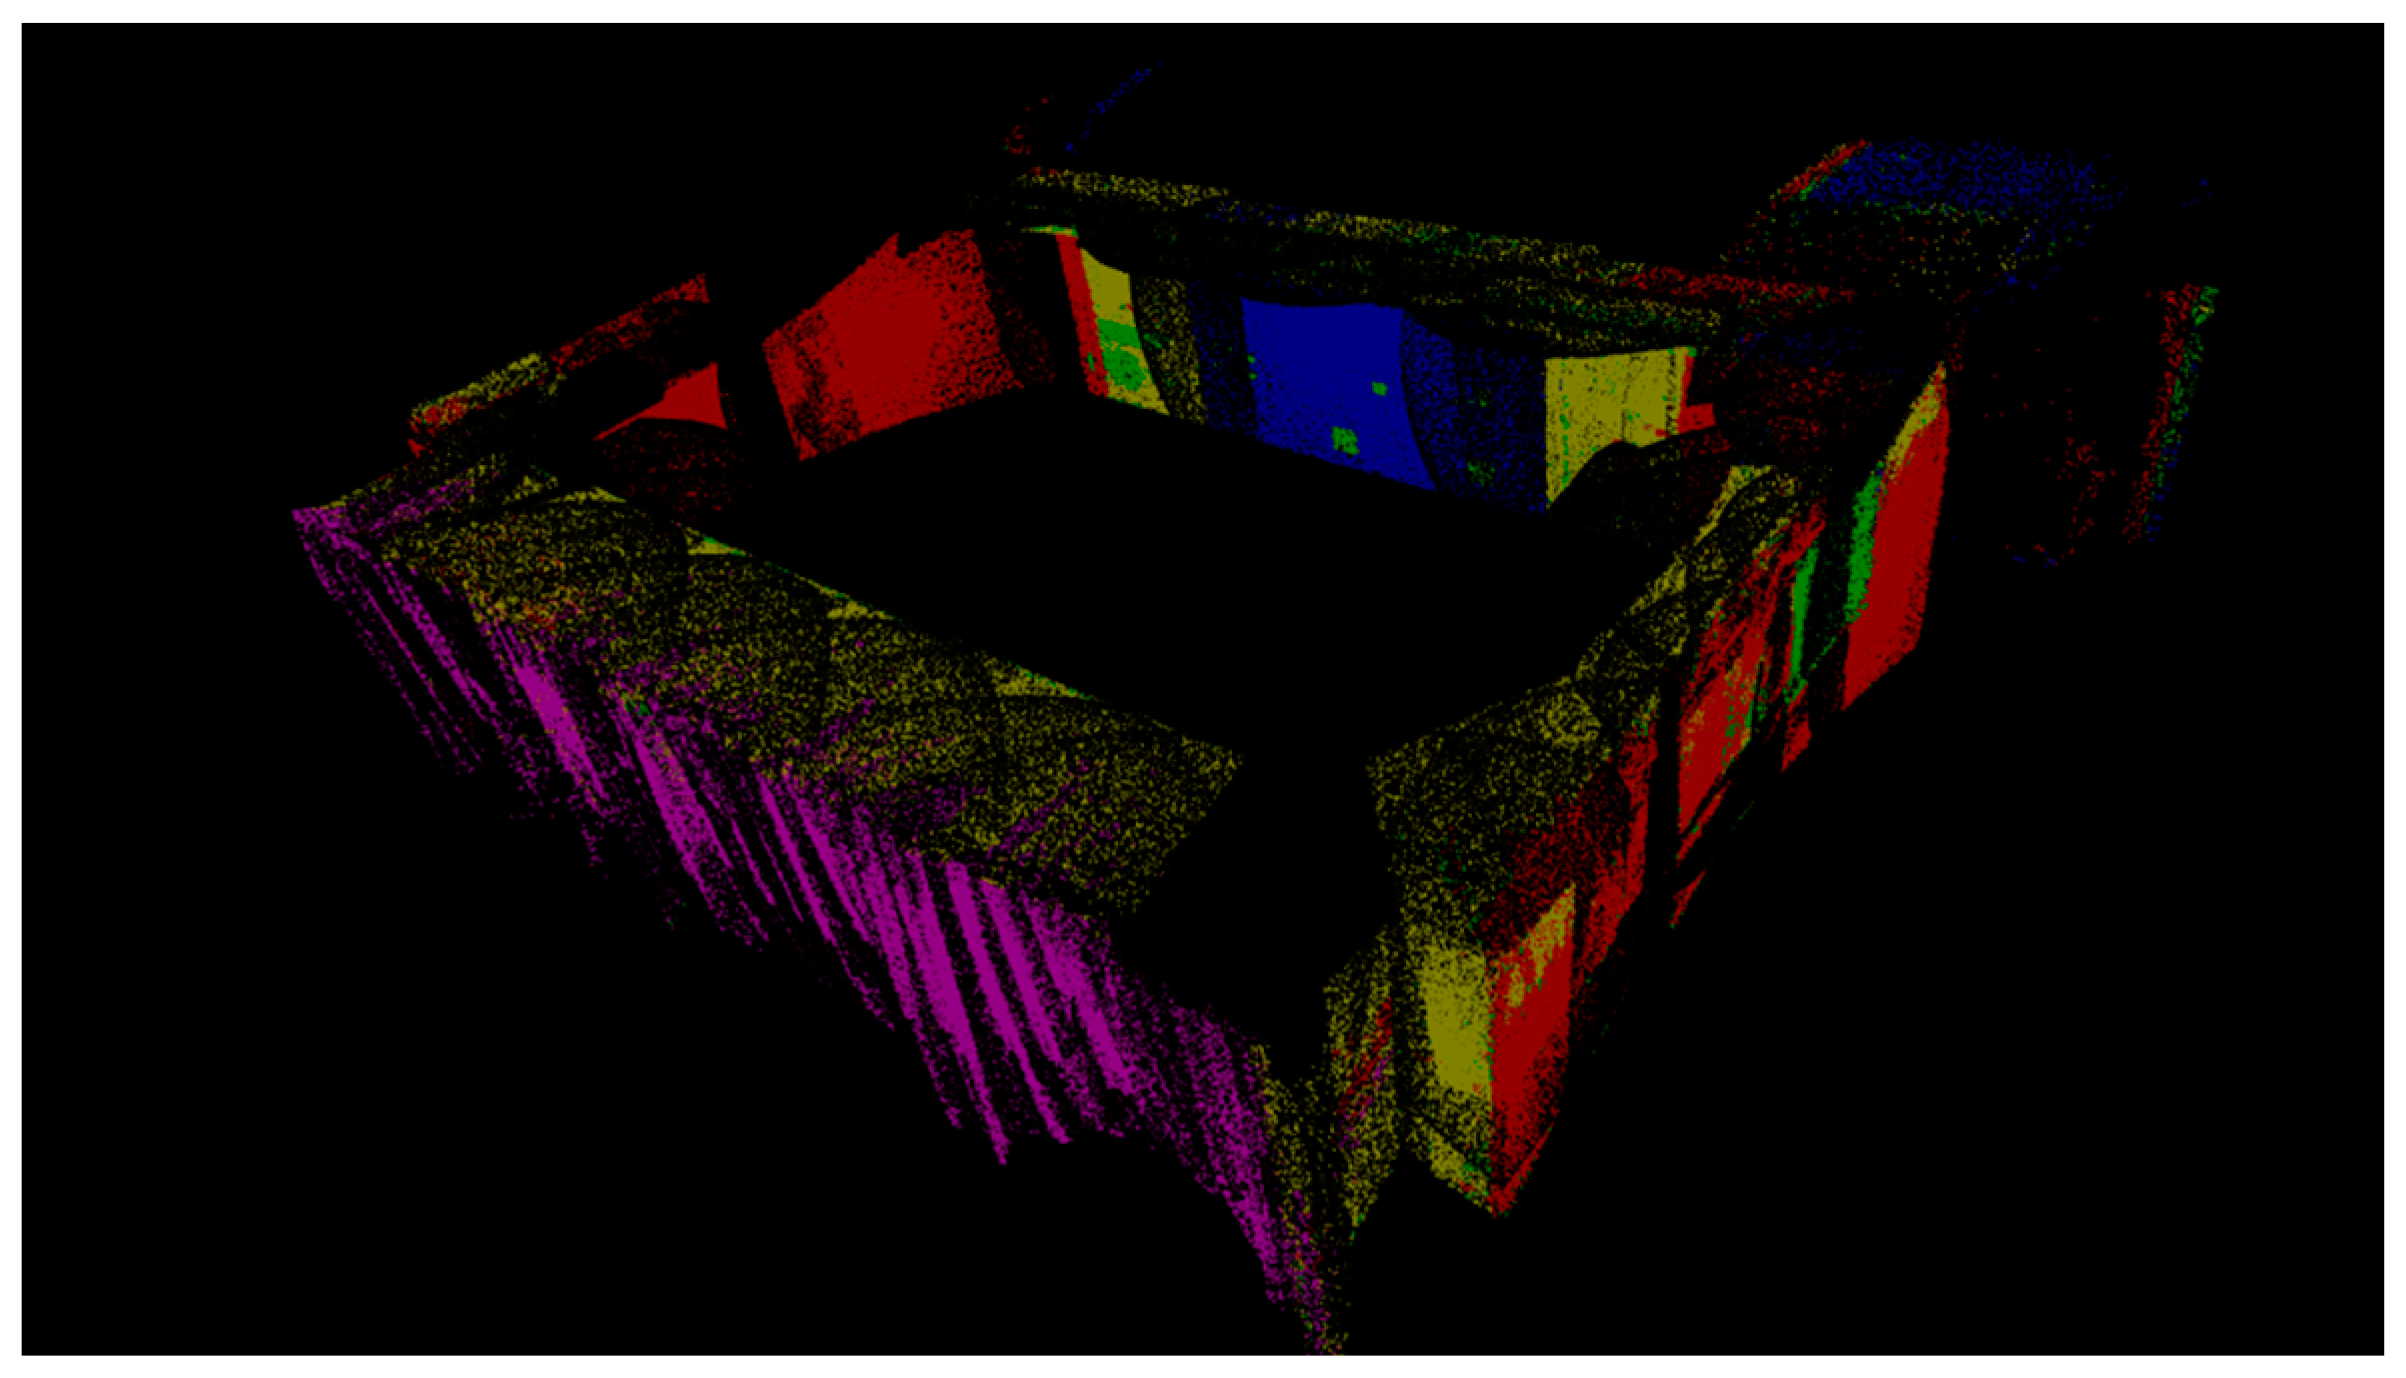
To verify the applicability of the proposed system for large-scale, wide-area environments, a FUSEN-based measurement of an entire conference room is conducted, shown in Figure 20. The number of point clouds is 12,689,270, and the file size is 157.37 MB. The results of the scene’s geometric-physical 3D reconstruction are as follows:
From the above results, it can be concluded that the proposed system can perform collaborative reconstruction of the geometric and physical three-dimensional model of the target environment. Compared to physical model construction systems that can only be used on test benches, this system offers greater measurement flexibility and can meet the reconstruction needs of wide-area scenes. There are also some experiments with different size scenarios, which can be found in Appendix A.

7.4. Material Recognition Accuracy Experiment

To verify the proposed FUSEN system in capturing the physical characteristics of the target environment, the accuracy of scene material recognition is analyzed. The scene information of the walls of different scenes is extracted at a distance of 1 m, 1.2 m, and 1.5 m from the wall, and the area of each material and the corresponding test distance are statistically calculated as shown in Table 3.
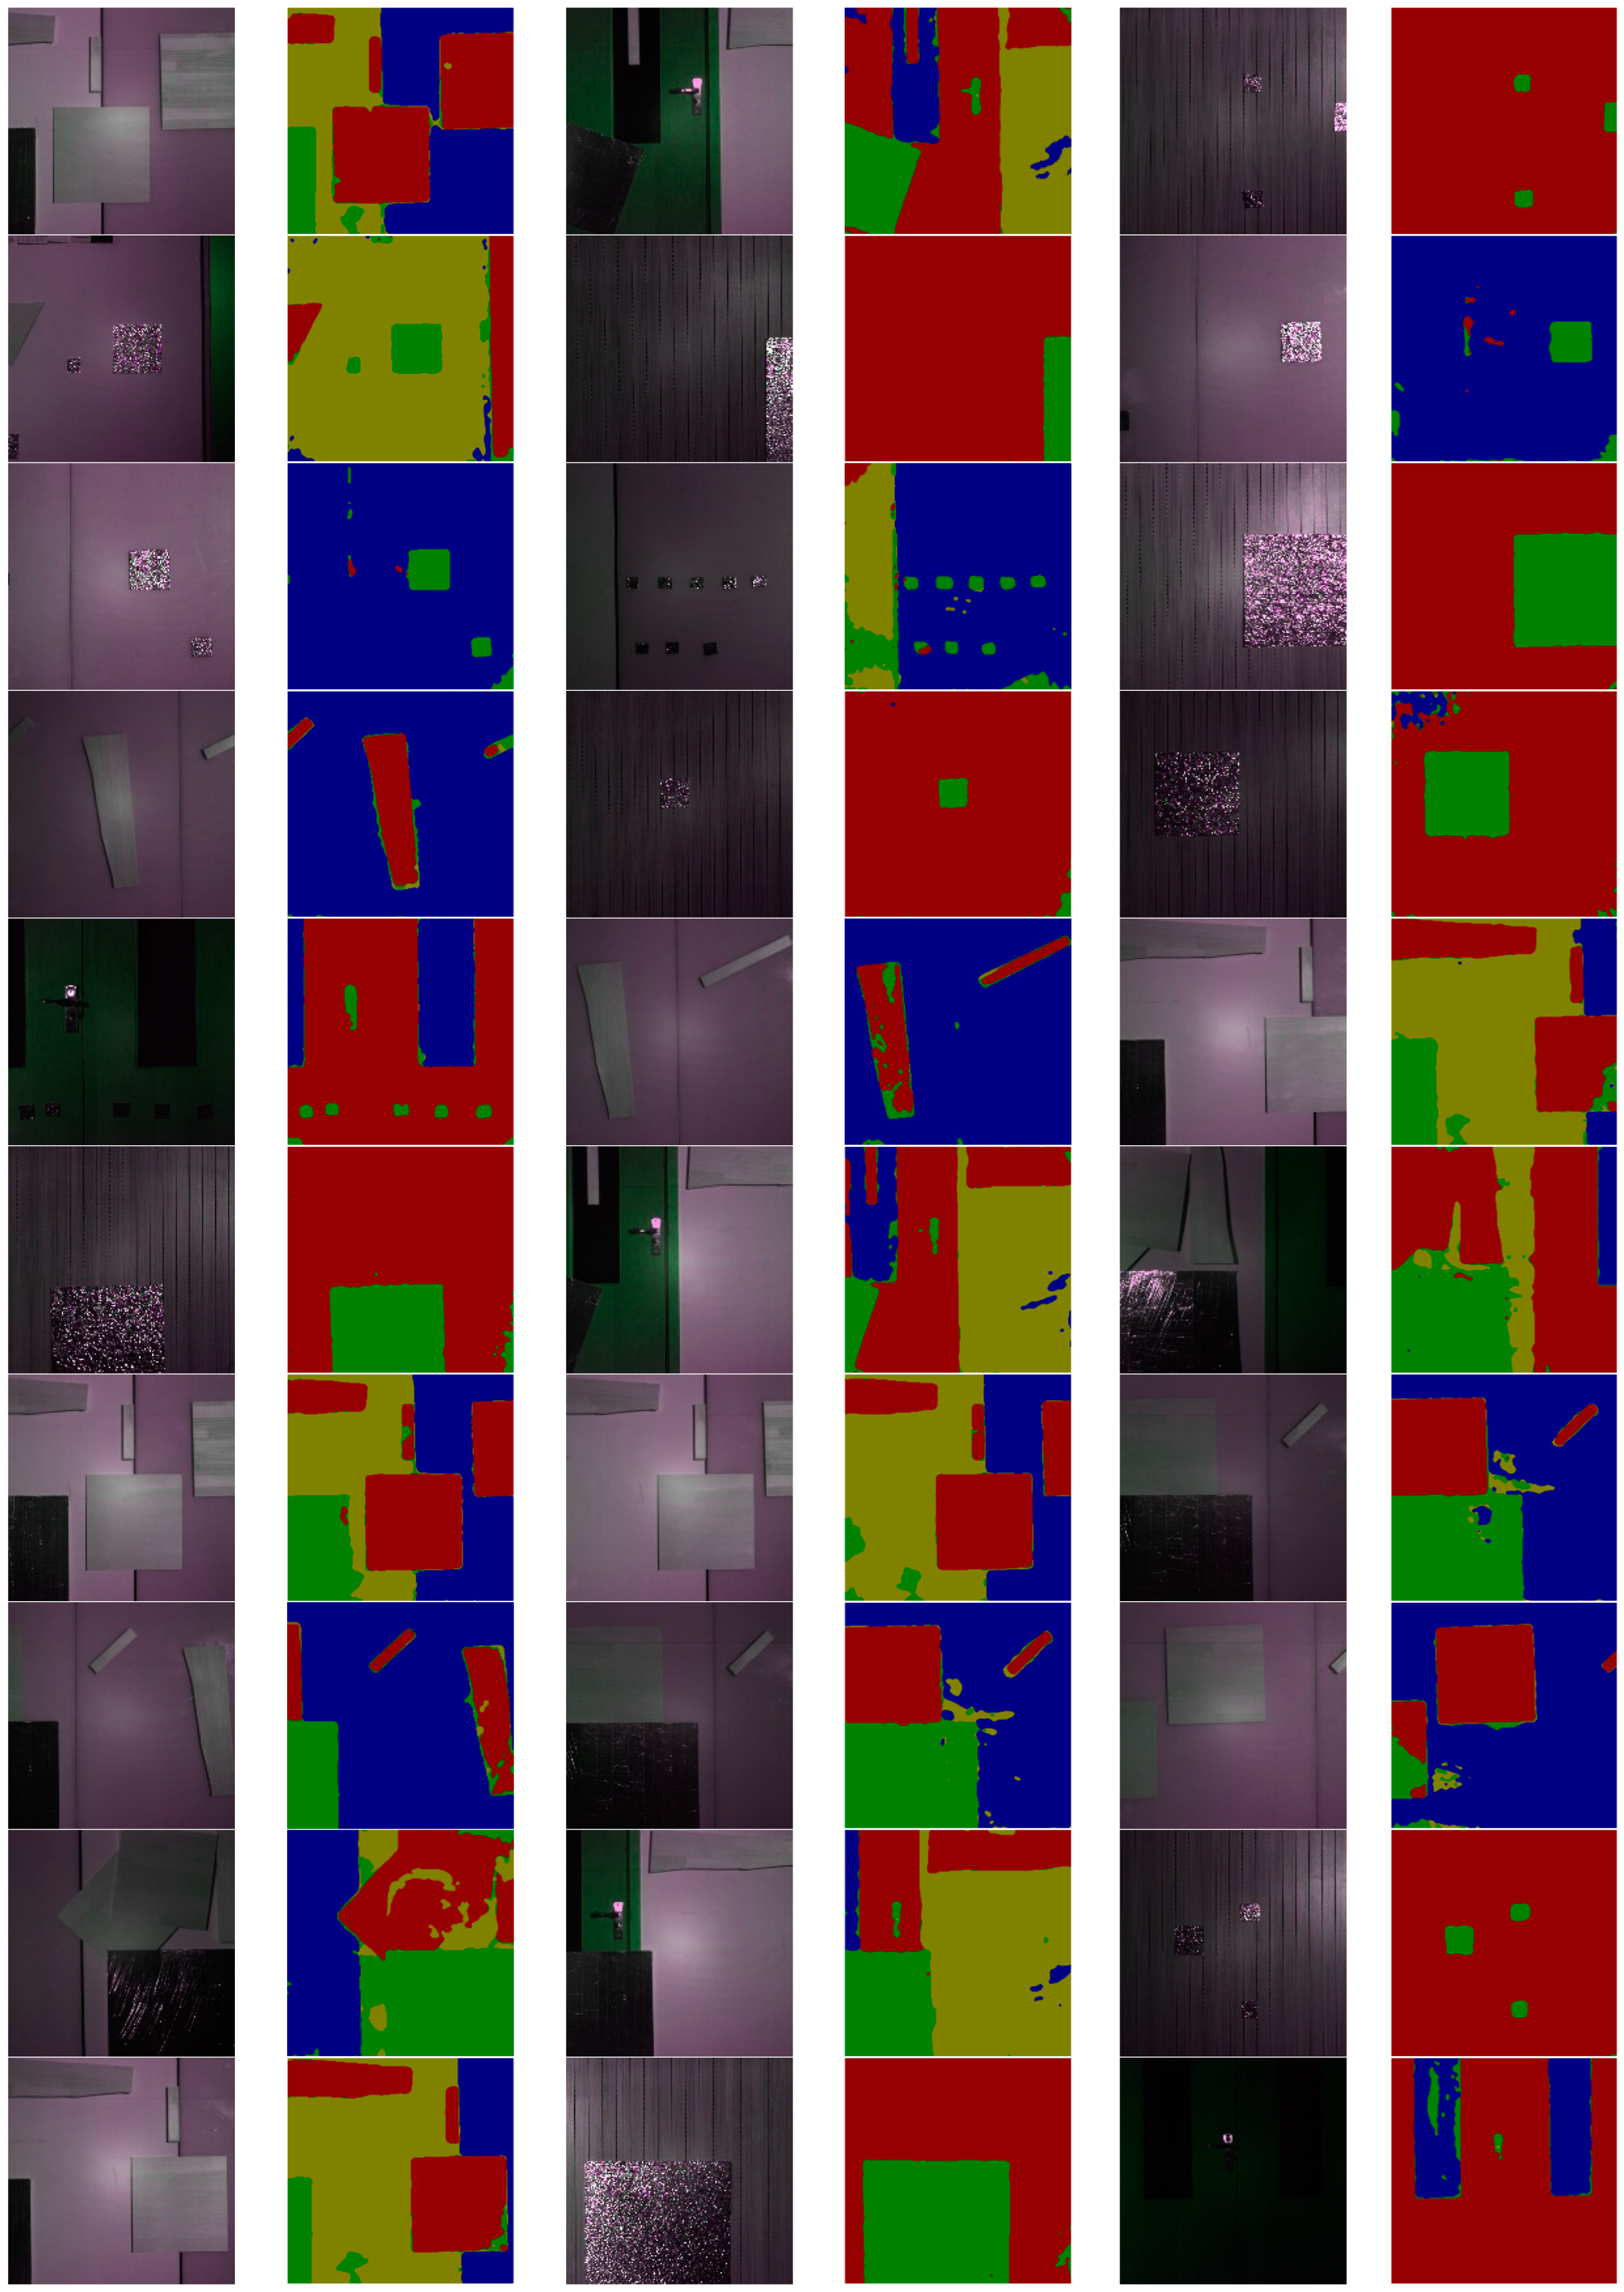
The obtained material recognition results and the comparison results of the multispectral pseudo-color image are shown in Figure 21:
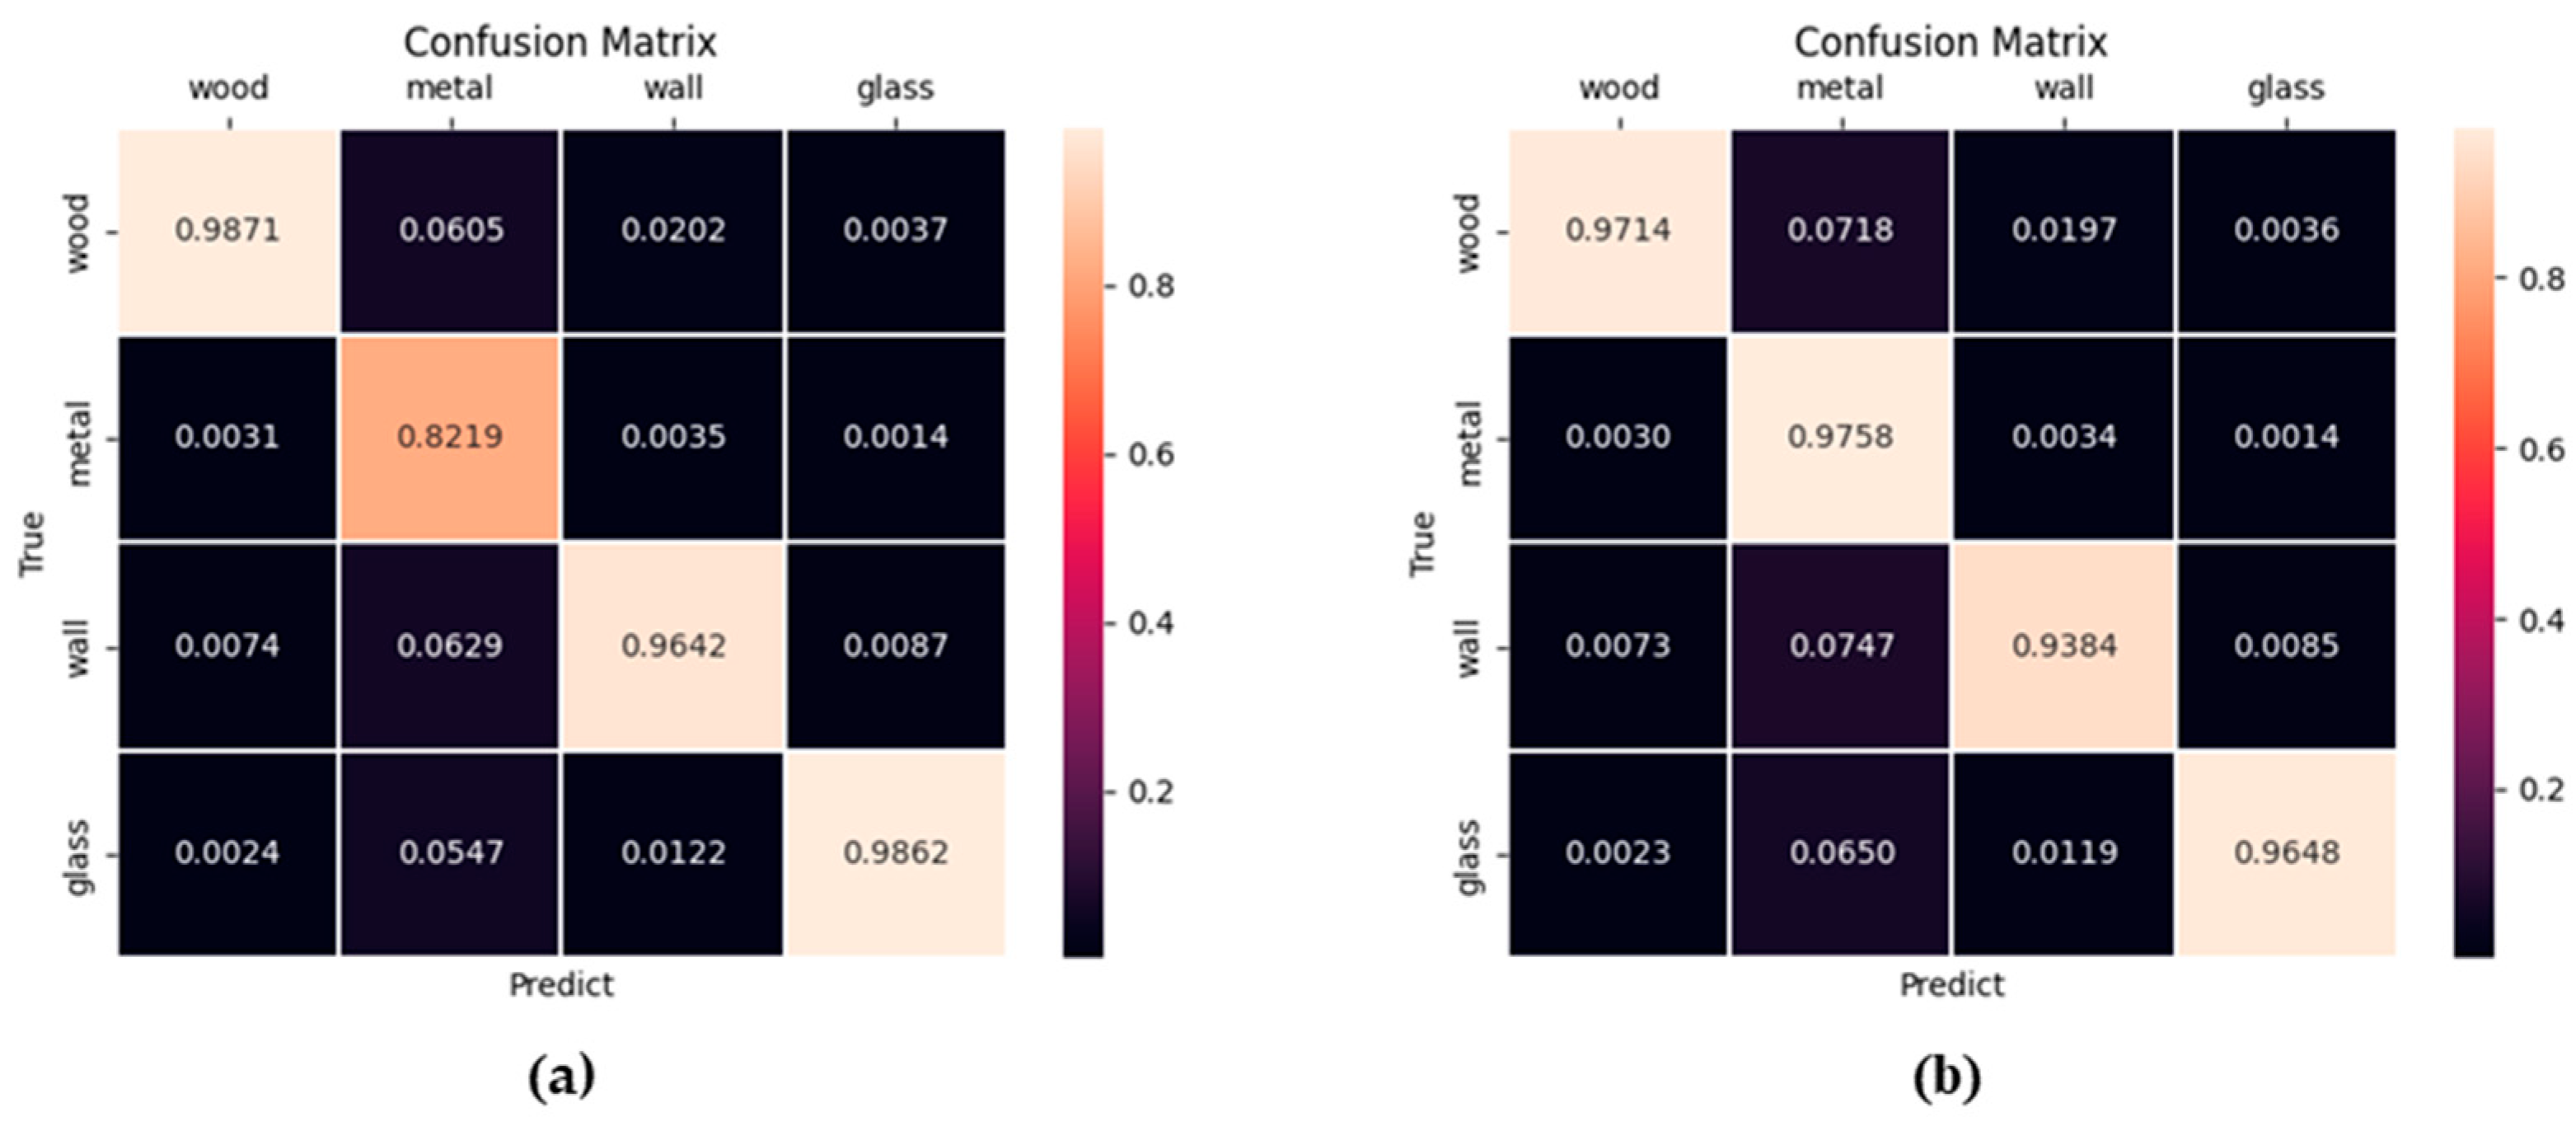
Here, let TP (true positive) represent instances correctly identified as the positive class; FN (false negative) represent instances of the positive class incorrectly identified as the negative class; FP (false positive) represent instances of the negative class incorrectly identified as the positive class; and TN (true negative) represent instances correctly identified as the negative class. Using the calculation formulas for precision and recall, and the results for each sample are summarized in the following Figure 22:
From the perspective of a single sample or from the average perspective, the recognition precision and recall rates are both greater than 82%, and even the average values are greater than 96%.

8. Conclusions

This paper introduces FUSEN, a target environment geometric-physical modeling system developed by us, detailing its hardware structure and data processing algorithms. The proposed system employs millimeter-wave cascaded radar to present the electromagnetic characteristics of the target through imaging and a multispectral camera to obtain multi-channel spectral information for target material recognition. Together, these components characterize environmental physical information. The system uses optical cameras and LiDAR to construct a three-dimensional geometric model of the target environment and then realizes the geometric-physical model reconstruction process through multi-sensor data fusion. Additionally, the multi-sensor setup is built on a rigid architecture that allows flexible movement and multiple posture adjustments, enabling the proposed system to operate beyond a test bench and be applied in various scenarios. Extensive real-world test experiments have verified the system’s capability in geometric-physical modeling, demonstrating its value for the development of intelligent unmanned systems. Moreover, the system can be further combined with the localization function to make it more intelligent.

Author Contributions

Conceptualization, S.Z. and F.X.; methodology, S.Z., H.C., M.Z., K.T. and F.X.; software, S.Z., H.C. and M.Z.; validation, S.Z., H.C., M.Z. and K.T.; investigation, S.Z., H.C. and M.Z.; resources, M.Y., X.C. and F.X.; data curation, S.Z., H.C. and M.Z.; writing—original draft preparation, S.Z. and F.X.; writing—review and editing, S.Z., H.W. and F.X.; visualization, S.Z., H.C. and M.Z.; supervision, M.Y., X.C. and F.X.; project administration, S.Z., M.Y., K.T., X.C. and F.X. All authors have read and agreed to the published version of the manuscript.

Funding

This research received no external funding.

Data Availability Statement

The measured data mentioned in the article mainly cover daily life scenes; further inquiries can be directed at the author.

Conflicts of Interest

Authors Minglang Yu and Xufeng Chen were employed by the company Huawei Technologies Co., Ltd. The remaining authors declare that the research was conducted in the absence of any commercial or financial relationships that could be construed as a potential conflict of interest.

Appendix A

Other experimental scenarios.
1. Scenario 1
This is an entire wall on one side of an office, and the area of the wall is relatively large, so it is necessary to adjust the test distance, attitude, and position of the system and then carry out point cloud splicing. Different colors in the image represent different material categories. The number of point clouds is 2,043,168, and the total file size is 25.33 MB.
Figure A1. Reconstruction result of an entire wall of the office.
Remotesensing 16 03897 g0a1
2. Scenario 2
This is a test of the corridor, and the result shown in Figure 8 is also obtained by combining the results of multiple measurement points. The number of point clouds is 4,283,136, and the total file size is 53.12 MB.
Figure A2. Reconstruction result of an entire wall of the corridor.
Remotesensing 16 03897 g0a2
3. Scenario 3
The experiment scenario is conducted outdoors, targeting the surface of a building. The number of point clouds is 1,238,400, and the file size is 12.28 MB.
Figure A3. Reconstruction result of an entire wall of the building.
Remotesensing 16 03897 g0a3
4. Scenario 4
This scene is smaller, a wall containing a variety of materials, but the angle shown is different from the above results. It should be noted that in addition to the RGB color, the part of the color with material classification is very small, which is because, as mentioned in the text (3.1.2), the FOV of the four sensors of the system are different, which is caused by the minimum of the multispectral camera. The number of point clouds is 388,032, and the file size is 4.81 MB.
Figure A4. Reconstruction result of a small wall.
Remotesensing 16 03897 g0a4
5. Scenario 5
This is a wall containing a variety of materials. The number of point clouds is 394,464, and the file size is 4.98 MB.
Figure A5. Reconstruction result of a small wall.
Remotesensing 16 03897 g0a5

References

  1. Herrera, D.; Escudero-Villa, P.; Cárdenas, E.; Ortiz, M.; Varela-Aldás, J. Combining Image Classification and Unmanned Aerial Vehicles to Estimate the State of Explorer Roses. AgriEngineering 2024, 6, 1008–1021. [Google Scholar] [CrossRef]
  2. Hercog, D.; Lerher, T.; Truntič, M.; Težak, O. Design and Implementation of ESP32-Based IoT Devices. Sensors 2023, 23, 6739. [Google Scholar] [CrossRef] [PubMed]
  3. Bae, I.; Hong, J. Survey on the Developments of Unmanned Marine Vehicles: Intelligence and Cooperation. Sensors 2023, 23, 4643. [Google Scholar] [CrossRef] [PubMed]
  4. Zhang, Z.; Fu, M. Research on Unmanned System Environment Perception System Methodology. In International Workshop on Advances in Civil Aviation Systems Development; Springer Nature: Cham, Switzerland, 2023; pp. 219–233. [Google Scholar]
  5. Zhang, Z.; Wu, Z.; Ge, R. Generative-Model-Based Autonomous Intelligent Unmanned Systems. In Proceedings of the 2023 International Annual Conference on Complex Systems and Intelligent Science (CSIS-IAC), Shenzhen, China, 20–22 October 2023; pp. 766–772. [Google Scholar]
  6. Qiu, L.; Liu, C.; Dong, H.; Li, W.; Hu, B. Tightly-coupled LiDAR-Visual-Inertial SLAM Considering 3D-2D Line Feature Correspondences. IEEE Trans. Robot. 2022, 38, 1580–1596. [Google Scholar]
  7. Gao, Y.; Xu, L.; Zhou, W.; Li, Z.; Wang, Z. D3VIL-SLAM: 3D Visual Inertial LiDAR SLAM for Outdoor Environments. IEEE Trans. Intell. Transp. Syst. 2022, 23, 4850–4861. [Google Scholar]
  8. Gao, T.; Xu, P.; Zhao, Q.; Wu, H. LMVI-SLAM: Robust Low-Light Monocular Visual-Inertial Simultaneous Localization and Mapping. IEEE Robot. Autom. Lett. 2021, 6, 2204–2211. [Google Scholar]
  9. Wang, Y.; Chen, L.; Zhang, J.; Yu, F. BVT-SLAM: A Binocular Visible-Thermal Sensors SLAM System in Low-Light Conditions. IEEE Sens. J. 2023, 23, 1078–1086. [Google Scholar]
  10. Ye, Q.; Shen, S.; Zeng, Q.; Wu, F.; Yang, Y. Vehicle Detection and Localization using 3D LIDAR Point Cloud and Image Data Fusion. IEEE Sens. J. 2021, 21, 17444–17455. [Google Scholar]
  11. Zhang, T.; Chen, S.; Hu, W.; Zhao, Y.; Wang, L. Environment Perception Technology for Intelligent Robots in Complex Environments. IEEE Robot. Autom. Mag. 2022, 29, 45–56. [Google Scholar]
  12. Uddin, M.J.; Qin, Y.; Ghazali, S.A.; Ma, W.; Islam, T.; Ghosh, R. Progress in Active Infrared Imaging for Defect Detection in the Renewable and Electronic Industries. Electronics 2023, 12, 334. [Google Scholar]
  13. Felton, M.; Wilson, C.; Retief, C.; Schwartz, A.; Eismann, M. Target Detection over the Diurnal Cycle Using a Multispectral Infrared Sensor. Sensors 2023, 23, 10234. [Google Scholar]
  14. Mendoza, F.; Lu, R.; Cen, H.; Ariana, D.; McClendon, R.; Li, W. Fruit Quality Evaluation Using Spectroscopy Technology: A Review. Foods 2023, 12, 812. [Google Scholar]
  15. Soumya, A.; Mohan, C.K.; Cenkeramaddi, L.R. Recent Advances in mmWave-Radar-Based Sensing, Its Applications, and Machine Learning Techniques: A Review. Sensors 2023, 23, 8901. [Google Scholar] [CrossRef]
  16. Zhang, F.; Luo, C.; Fu, Y.; Zhang, W.; Yang, W.; Yu, R.; Yan, S. Frequency Domain Imaging Algorithms for Short-Range Synthetic Aperture Radar. Remote Sens. 2023, 15, 5684. [Google Scholar] [CrossRef]
  17. Xie, H.; Lv, M.; Chen, G.; Xie, Q.; Zhang, J. Survey of Multi-Sensor Information Fusion Filtering and Control. IEEE Trans. Ind. Inform. 2021, 17, 3412–3426. [Google Scholar]
  18. Ren, B.; Yang, L.T.; Zhang, Q.; Feng, J.; Nie, X. Modern Computing: Vision and Challenges. Telemat. Inform. Rep. 2024, 13, 2772–5030. [Google Scholar]
  19. Gao, S.; Zhu, X.; Wang, Y.; Li, L. Through Fog High-Resolution Imaging Using Millimeter Wave Radar. IEEE Trans. Veh. Technol. 2022, 71, 4484–4496. [Google Scholar]
  20. Tan, K.; Wu, S.; Wang, Y. Two-dimensional sparse MIMO array topologies for UWB high-resolution imaging. Chin. J. Radio Sci. 2016, 31, 779–785. [Google Scholar]
  21. Ulander, L.M.H.; Hellsten, H.; Stenstrom, G. Synthetic Aperture Radar Processing Using Fast Factorized Back-Projection. IEEE Trans. Aerosp. Electron. Syst. 2003, 39, 760–776. [Google Scholar] [CrossRef]
  22. Lad, L.E.; Tinkham, W.T.; Sparks, A.M.; Smith, A.M.S. Evaluating Predictive Models of Tree Foliar Moisture Content for Application to Multispectral UAS Data: A Laboratory Study. Remote Sens. 2023, 15, 5703. [Google Scholar] [CrossRef]
  23. Park, Y.; Yun, S.; Won, C.S.; Cho, K.; Um, K.; Sim, S. Calibration between Color Camera and 3D LiDAR Instruments with a Polygonal Planar Board. Sensors 2014, 14, 5333–5353. [Google Scholar] [CrossRef] [PubMed]
  24. Yuan, C.; Liu, X.; Hong, X.; Zhang, F. Pixel-Level Extrinsic Self Calibration of High Resolution LiDAR and Camera in Targetless Environments. IEEE Robot. Autom. Lett. 2021, 6, 7517–7524. [Google Scholar] [CrossRef]
  25. Miknis, M.; Davies, R.; Plassmann, P.; Ware, A. Efficient point cloud pre-processing using the point cloud library. Int. J. Image Process. 2016, 10, 63–72. [Google Scholar]
  26. Maurya, S.R.; Magar, G.M. Performance of greedy triangulation algorithm on reconstruction of coastal dune surface. In Proceedings of the 2018 3rd International Conference for Convergence in Technology (I2CT), Pune, India, 6–8 April 2018; pp. 1–6. [Google Scholar]
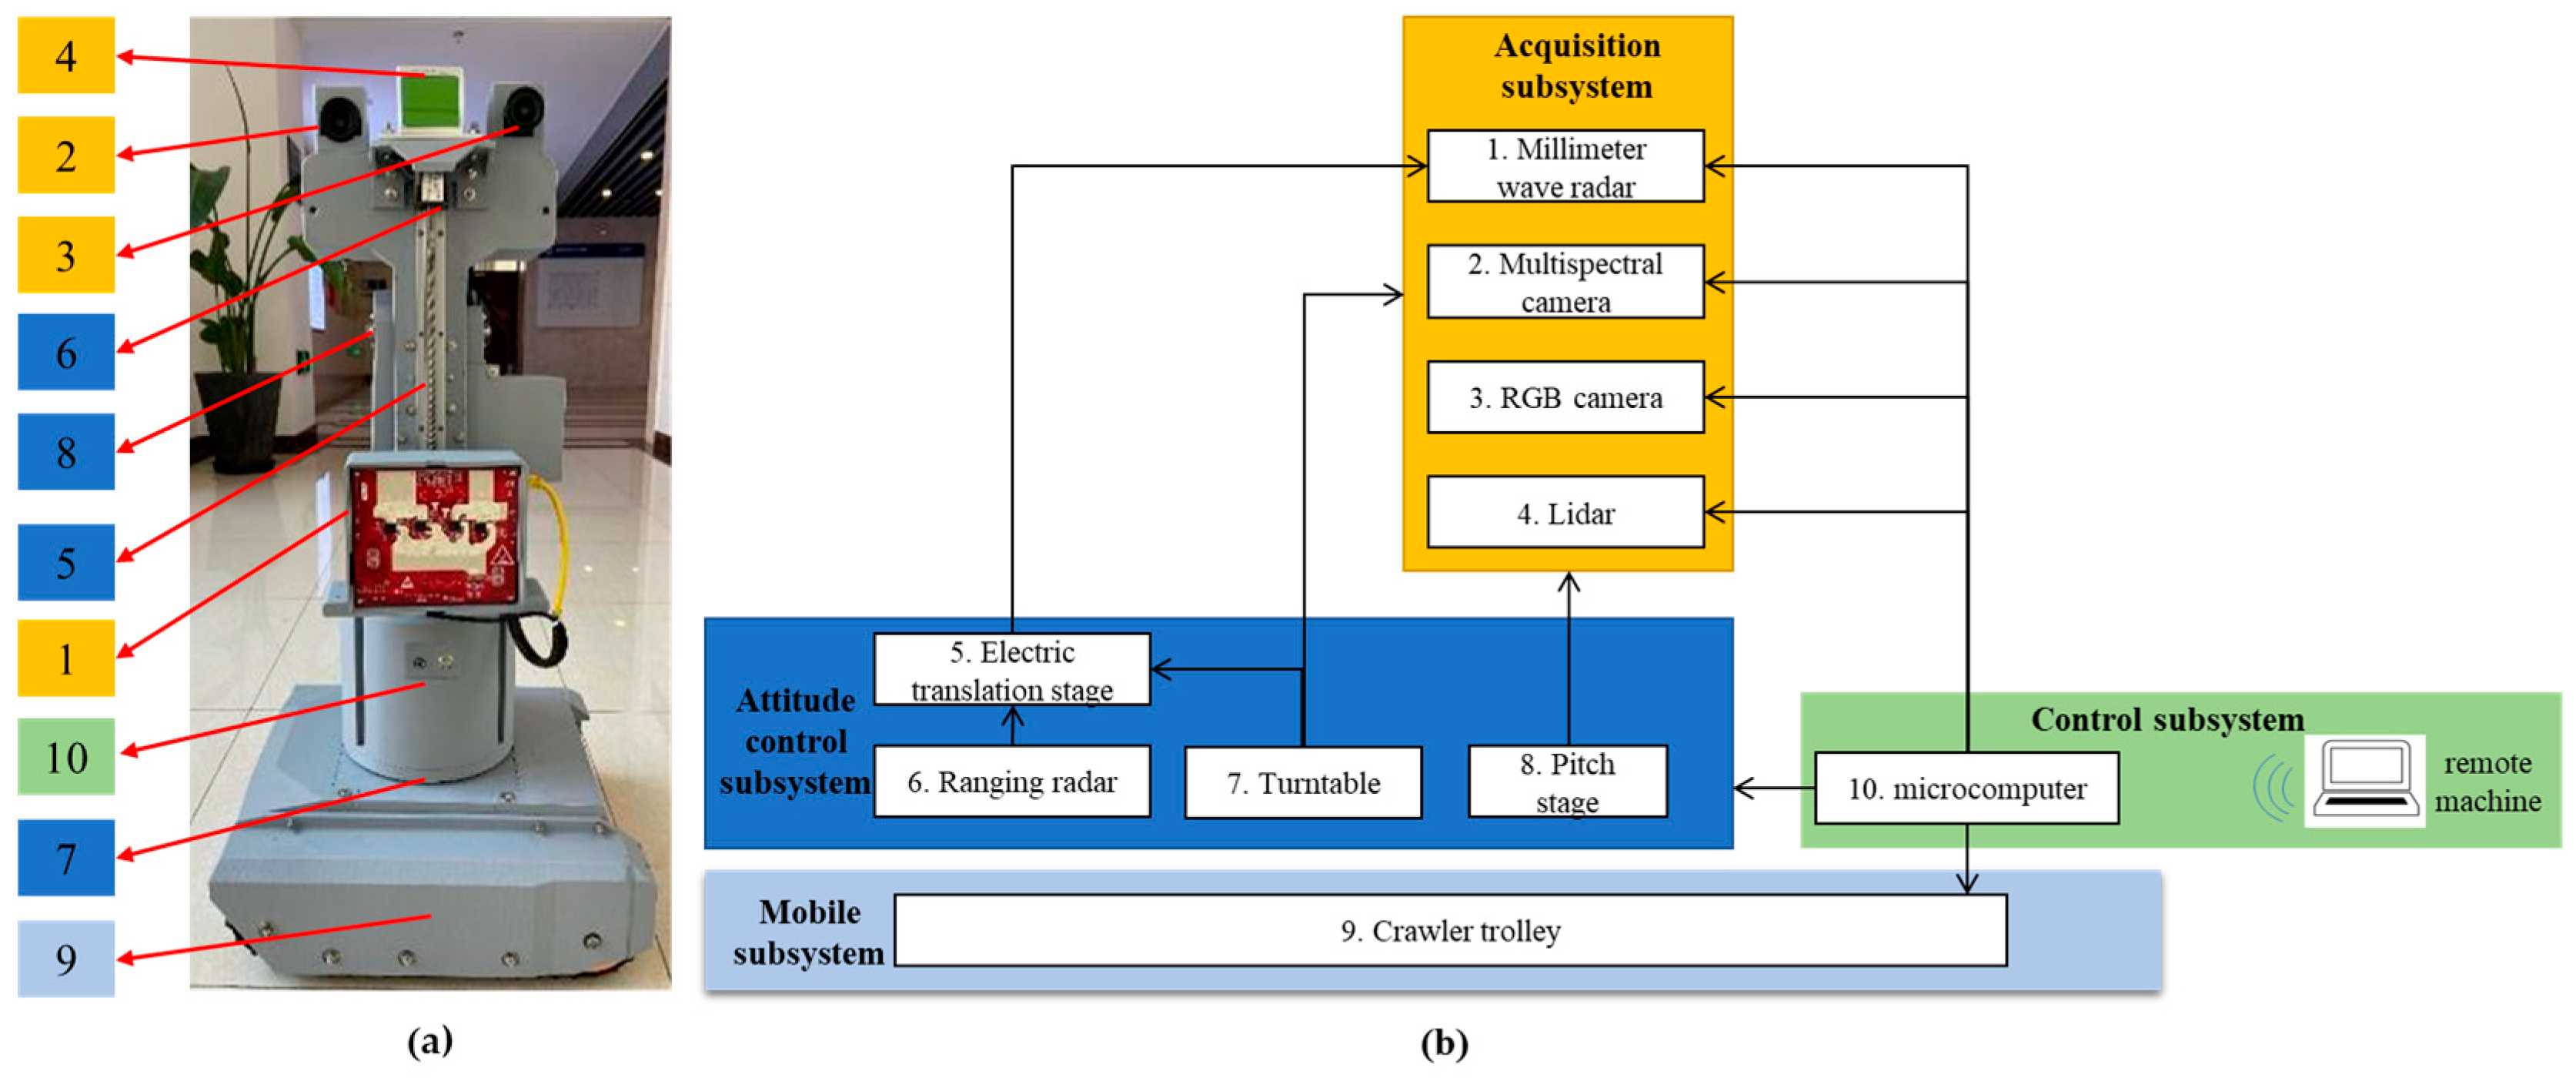
Figure 1. In-house-developed FUSEN system hardware configuration. (a) System physical diagram; (b) System architecture diagram.
Remotesensing 16 03897 g001
Figure 2. System attitude control. (a1,b1,c1) Electric translation stage moves 0 cm, 10 cm, and 20 cm; (a2,b2,c2) Turntable rotates 0°, 45°, and 90°; (a3,b3,c3) Pitch stage tilt 30°, 45°, and 60°.
Remotesensing 16 03897 g002
Figure 3. Sensor selection. (a) 77G Millimeter-wave Cascade RF Board; (b) Vision Star pixel-level mosaic imaging spectrometer; (c) Mid-70 LiDAR; (d) JHUMs series USB3.0 industrial camera.
Remotesensing 16 03897 g003
Figure 4. FUSEN workflow diagram.
Remotesensing 16 03897 g004
Figure 5. Millimeter-wave cascaded radar antenna array measurement scheme.
Remotesensing 16 03897 g005
Figure 6. Schematic diagram of antenna array equivalent channel. (a) Schematic diagram of real aperture size distribution; (b) Schematic diagram of equivalent aperture size; (c) Schematic diagram of overlapping equivalent aperture size; (d) Interval of equivalent aperture (in m).
Remotesensing 16 03897 g006
Figure 7. Comparison of the 9-channel multispectral camera with camera. (a) RGB 3-band filters; (b) Multispectral camera 9-band filters.
Remotesensing 16 03897 g007
Figure 8. Multispectral inversion flowchart.
Remotesensing 16 03897 g008
Figure 9. The preliminary registration of RGB camera and LiDAR. (a) Experimental scene of RGB camera and LiDAR registration; (b) Preliminary registration results of RGB camera and LiDAR.
Remotesensing 16 03897 g009
Figure 10. Lidar and RGB camera data fusion flow diagram.
Remotesensing 16 03897 g010
Figure 11. The accurate registration of RGB camera and LiDAR by proposed method. (a) Point clouds pixelated; (b) Image edge extraction.
Remotesensing 16 03897 g011
Figure 12. Comparison of results. (a) The registration by hand–eye calibration method; (b) The accurate registration by proposed method.
Remotesensing 16 03897 g012
Figure 13. Experiment on obtaining registration matrix of millimeter-wave radar and LiDAR. (a) Horizontal–vertical imaging results; (b) 3D point cloud results; (c) Millimeter-wave point cloud (pcd); (d) Point cloud fusion results.
Remotesensing 16 03897 g013
Figure 14. Experiment on verifying registration matrix of millimeter-wave radar and LiDAR. (a) Experimental results; (b) Horizontal–vertical plane (1.52 m); (c) Horizontal–vertical plane (1.22 m); (d) Horizontal–vertical plane projection; (e) Horizontal-range plane imaging results; (f) Corner reflector millimeter-wave point cloud; (g) Millimeter-wave point cloud (pcd); (h) LiDAR point cloud.
Remotesensing 16 03897 g014
Figure 15. Millimeter-wave radar and LiDAR fusion results. (a) Front view of fusion result; (b) Side view of fusion result.
Remotesensing 16 03897 g015
Figure 16. Schematic diagram of data collection at different locations.
Remotesensing 16 03897 g016
Figure 17. Millimeter-wave imaging results of targets of different materials. (a1) Optical picture of metal plate at angle 1; (b1) Millimeter-wave imaging result of metal plate at angle 1; (c1) Optical picture of metal plate at angle 2; (d1) Millimeter-wave imaging result of metal plate at angle 2; The meaning of (a2,b2,c2,d2) and (a3,b3,c3,d3) are the same as above, facing glass and cement, respectively.
Remotesensing 16 03897 g017
Figure 18. Scattering intensity as a function of view angle.
Remotesensing 16 03897 g018
Figure 19. Geometric-physical reconstruction result for small scene. (a) RGB image; (b) Multispectral image inversion pseudo-color image; (c) Multispectral recognition results; (d) Millimeter-wave imaging results; (e) Geometric-physical reconstruction results; (f) Electromagnetic scattering characteristic curve matching results.
Remotesensing 16 03897 g019
Figure 20. Geometric-physical reconstruction result for large scene.
Remotesensing 16 03897 g020
Figure 21. Material recognition results. The single column represents the optical scene, and the double column represents the recognition result.
Remotesensing 16 03897 g021
Figure 22. Confusion matrix. (a) Precision confusion matrix; (b) Recall confusion matrix.
Remotesensing 16 03897 g022
Table 1. The error calculation and analysis of the hand–eye calibration method (24 group points).
NumX(m)Y(m)Z(m)U Error (Pixel)V Error (Pixel)NumX(m)Y(m)Z(m)U Error (Pixel)V Error (Pixel)
10.630.1970.164.211374.21285130.7390.2840.14212.382210.7165
20.629−0.1850.03311.7319.74915140.847−0.0740.02315.13894.91434
30.597−0.056−0.3529.539269.21146150.7810.035−0.3521.389274.52074
40.6080.334−0.23328.39477.5767160.6910.408−0.23123.8374.14517
51.2880.0180.14915.00488.87346170.85100.16213.46547.22812
61.254−0.340.03113.25372.12468180.786−0.3710.03316.38141.67815
71.251−0.225−0.3345.2448823.9537190.77−0.242−0.3488.373661.0941
81.3070.144−0.21720.337513.714200.8360.129−0.22117.78536.703
90.8410.0840.15315.43767.5648210.6670.0130.1618.84640.440737
100.815−0.2870.02919.00262.73421220.609−0.3530.0324.639243.27094
110.79−0.161−0.341.1858114.203230.623−0.233−0.3589.1408312.0381
120.8180.208−0.21814.76139.14319240.6930.148−0.22512.143.8012
U Average error (pixel)12.9843V Average error (pixel)7.31718
Table 2. The error calculation and analysis of the proposed method (24 group points).
NumX(m)Y(m)Z(m)U Error (Pixel)V Error (Pixel)NumX(m)Y(m)Z(m)U Error (Pixel)V Error (Pixel)
10.630.1970.162.729560.865458130.7390.2840.1420.443511.2433
20.629−0.1850.0338.600927.93531140.847−0.0740.02317.66985.11057
30.597−0.056−0.35214.72968.89681150.7810.035−0.3526.764522.28919
40.6080.334−0.2332.124151.12118160.6910.408−0.23110.99126.25845
51.2880.0180.1491.780961.63105170.85100.1626.848061.74991
61.254−0.340.0313.44075.33538180.786−0.3710.0333.320460.698927
71.251−0.225−0.3343.552623.77052190.77−0.242−0.3488.381598.65486
81.3070.144−0.2173.070980.330994200.8360.129−0.2218.203252.83447
90.8410.0840.1534.254110.69731210.6670.0130.1616.91571.65777
100.815−0.2870.0296.382521.13283220.609−0.3530.0325.797653.16712
110.79−0.161−0.340.8771784.06908230.623−0.233−0.3580.9114113.21334
120.8180.208−0.2185.258180.528076240.6930.148−0.22511.62631.33696
U Average error (pixel)6.44479V Average error (pixel)3.52204
Table 3. Conference room wall measurement parameters.
MaterialMeasuring
Distance
(R = 1 m)
Measuring
Distance
(R = 1.2 m)
Measuring
Distance
(R = 1.5 m)
Total Area
cement0 m21.927 m211.377 m213.304 m2
glass0 m20.448 m212.942 m213.390 m2
metal0.682 m20.065 m24.288 m25.035 m2
wood8.641 m20.146 m29.874 m218.661 m2
total9.323 m22.586 m238.481 m250.390 m2
Disclaimer/Publisher’s Note: The statements, opinions and data contained in all publications are solely those of the individual author(s) and contributor(s) and not of MDPI and/or the editor(s). MDPI and/or the editor(s) disclaim responsibility for any injury to people or property resulting from any ideas, methods, instructions or products referred to in the content.