1. Introduction
Caves have been significant landmarks for humans since the dawn of humanity [
1]. Whether as places of refuge or ritual spaces, these cavities have always exerted a powerful attraction on human communities. In many cases, these communities left traces of their presence in the form of rock art, painted or engraved within the cavernous spaces. Nowadays, these rock art manifestations are a major draw for cultural tourism, with over 2,000,000 people visiting sites that preserve the paintings and engravings of prehistoric societies, just in Europe.
The Maltravieso Cave is one of the key sites for Paleolithic rock art, notable not only for its exceptional collection of rock art but also for the chronological context in which it began to be created [
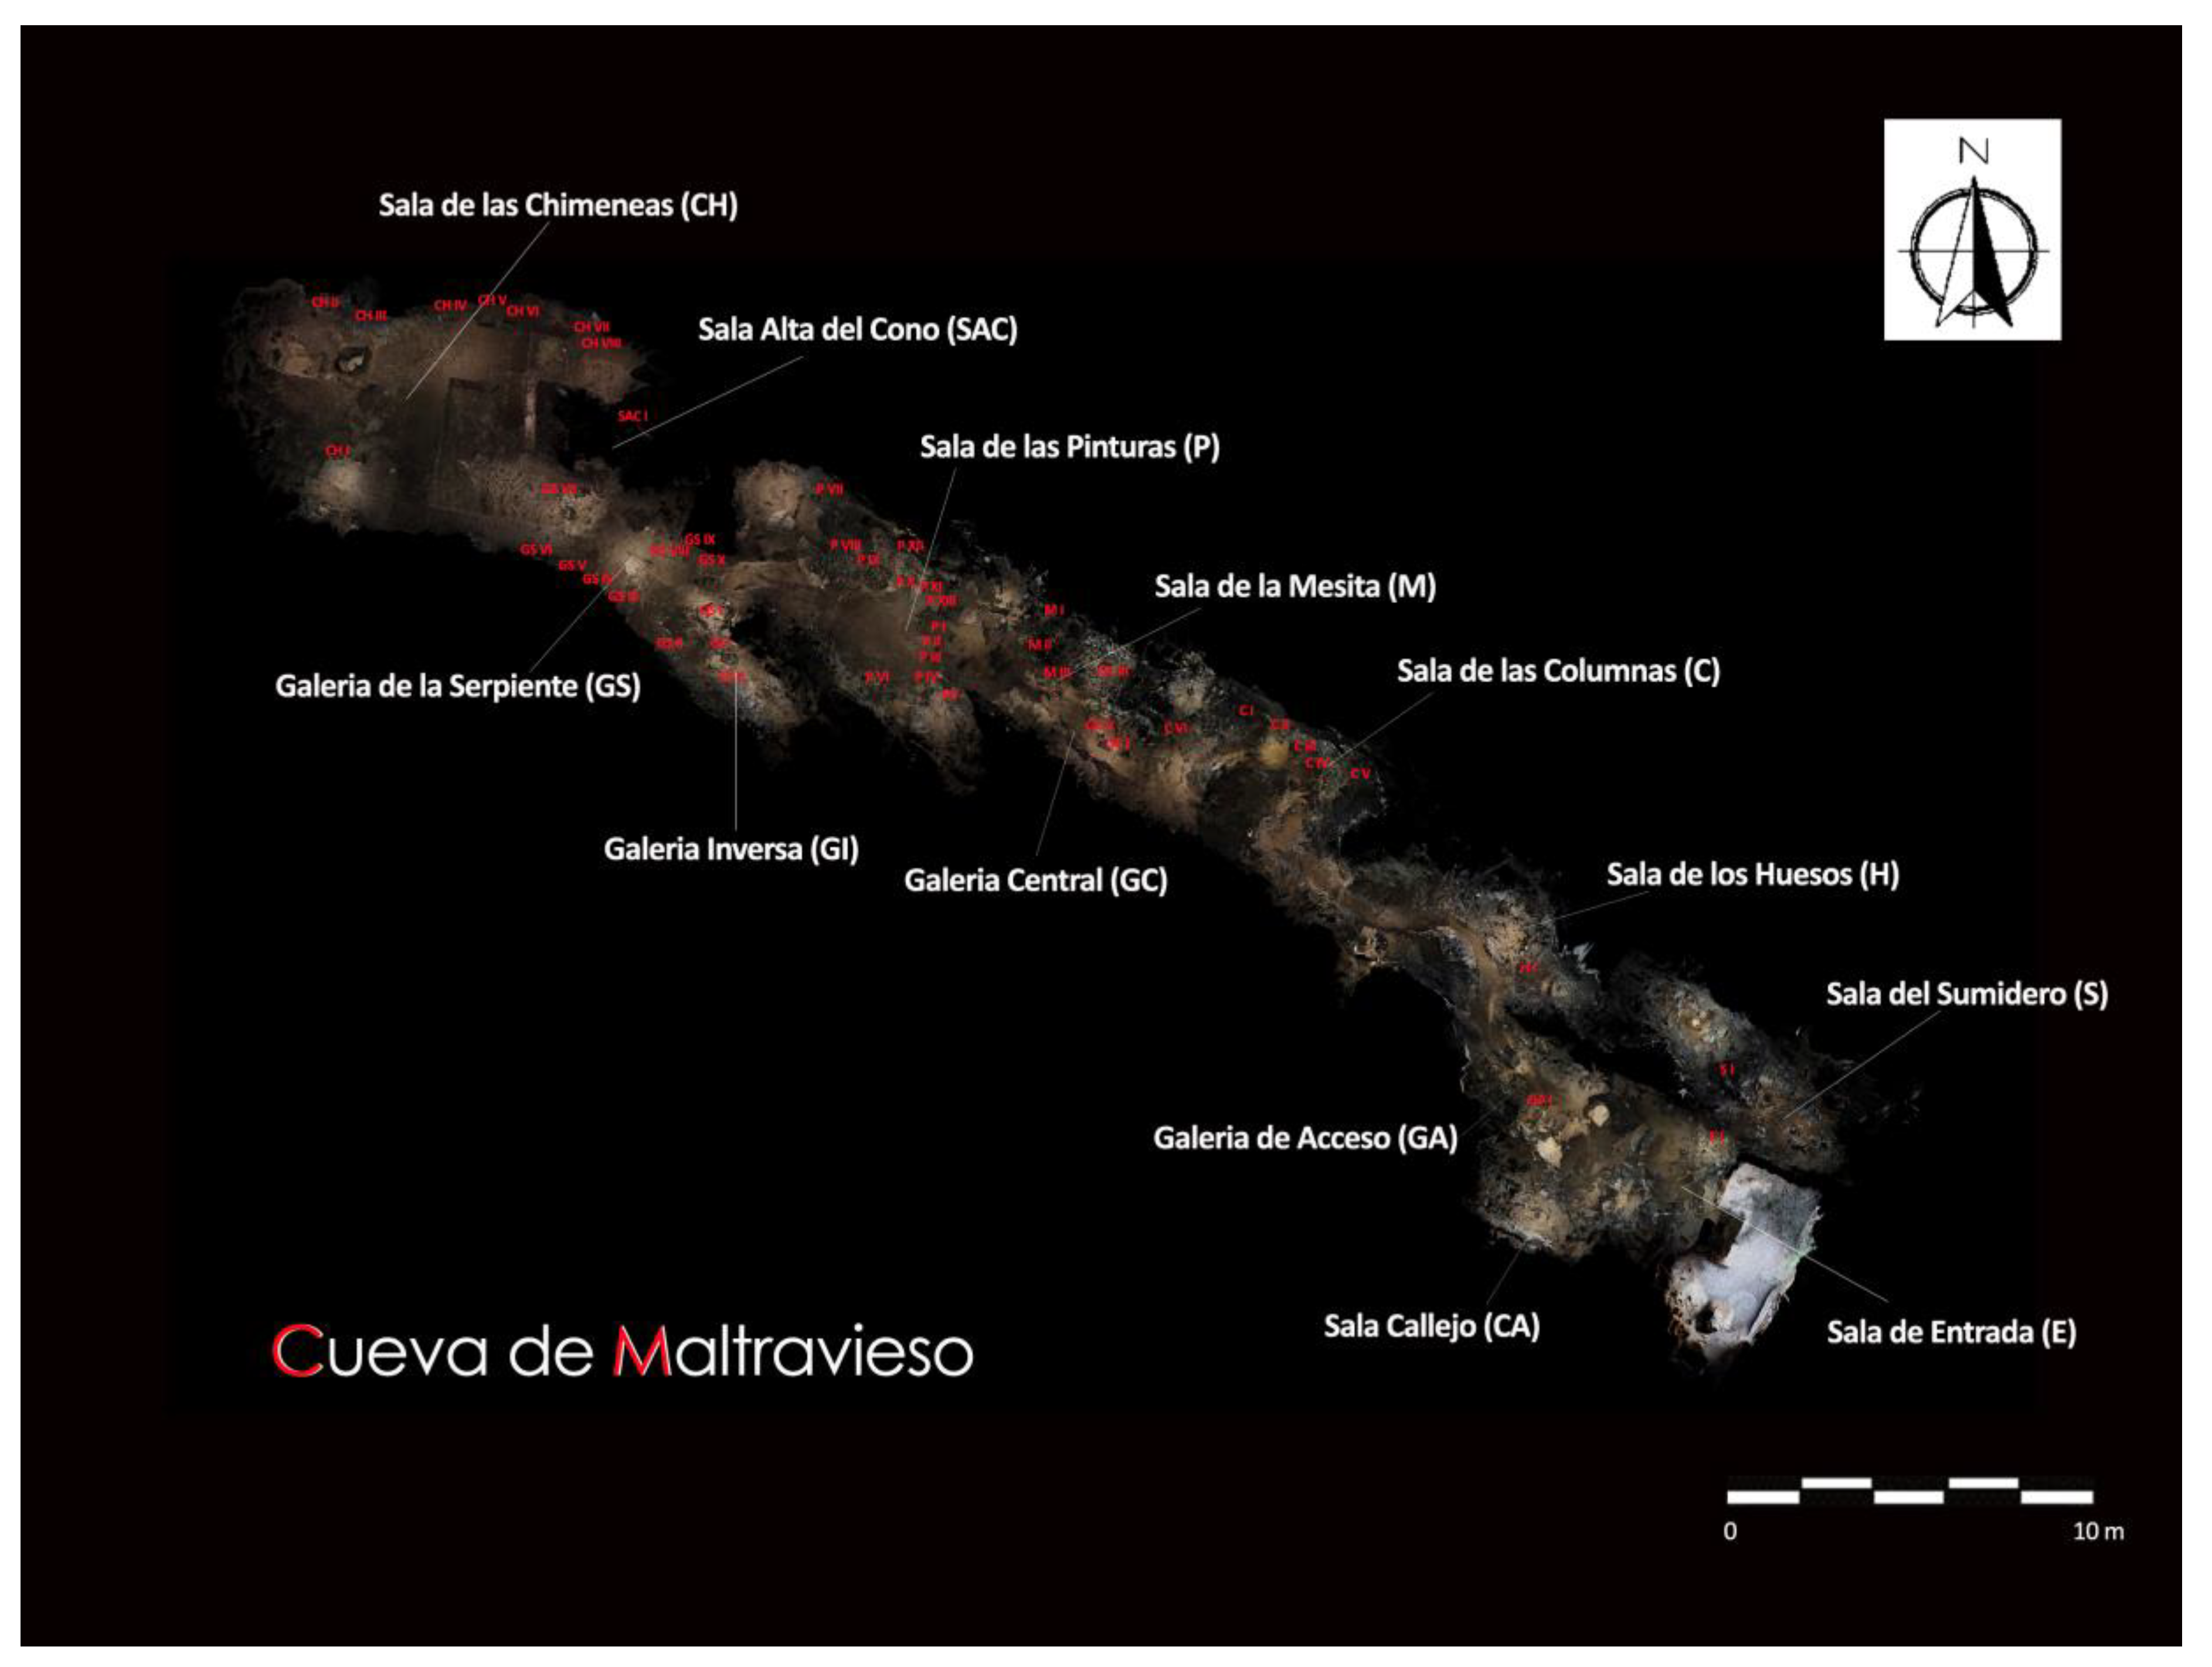
2]. It is located in an abandoned quarry in the urban area of the city of Cáceres, in the southwest of the Iberian Peninsula. It is a small karst conduit oriented N130°E, carved into the contact zone between limestone and slate, with a primarily linear passage of approximately 90 m, extending to 135 m when including all accessible conduits. This very senile cavern system is structured into three levels or strata: the upper level, which is almost completely dismantled, preserving only a broad oval-shaped space accessible from within the cavity; the intermediate level, where the main visit currently takes place and which houses all the rock art manifestations; and the lower level, which is very narrow and nearly filled, accessed from the intermediate level through an opening located between the Sala de la Mesita and the Sala de las Pinturas
Figure 1.
In the mentioned intermediate level, along its course, there are a series of expansions of varying widths known as “chambers,” which are connected by various conduits or galleries, most of which have been artificially excavated to make them passable. It is in this succession of spaces that 49 decorated panels have been documented, containing a total of 514 representations, both painted and engraved, categorized into three main iconographic groups: symbols (series of dots, triangles, paired lines, blown discs, grids, linear strokes, color spots and cupules), animal figures (horses, male and female deer, bovines, goats and some figures of uncertain attribution) and handprints. Possibly the most notable features of Maltravieso are its 61 negative handprints, the majority of which show intentional concealment of one or more fingers, especially the pinky. This collection is one of the most significant of its kind in Europe; additionally, some of these handprints have been attributed to Neanderthal groups based on the dating of the calcite crusts that formed over them [
3].
Despite the archaeological importance of the cavity and considering that an experimental visitation program is currently underway, the authors did not find other studies evaluating its stability from an engineering perspective.
The stability of caves and subterranean spaces can be initially assessed using rock mass classification that considers rock properties, local geology and geometry [
1,
4]. One of the first and most widely used methods to investigate the stability of caves is empirical analysis through geomechanical classifications such as the Q index and Bieniawaski’s Rock Mass Rating (RMR) [
5]. This approach has been employed worldwide to assess the stability of subterranean engineering constructions since the 1970s. The methods are deemed suitable for evaluating the stability of underground caves [
1] and have undergone minor modifications over the years [
1,
6,
7]. Meanwhile, a recent significant achievement took place in 2021 with the publication of the first cave-specific geomechanical rock mass classification, “Cave Geomechanical Index” (CGI), formulated by Brandi and his team in the iron caves of Brazil [
8].
Geomechanical stations and structural data collection play an essential role in calculating the Q, RMR and CGI [
1]. These techniques consist of in situ observations and a set of numerical values assigned to the rock mass, which is seen from an engineering point of view, either by traditional measurements in the field or using photogrammetry techniques like Structure from Motion (SfM) [
9,
10,
11], which has demonstrated a significant potential to complete the data, especially to identify families of discontinuities in higher zones not physically accessible or where there is a risk of falling rock blocks [
10,
11].
Geomechanical classifications in tunnels are a mature methodology with a huge database of countries, cases and lithologies. The main innovation of this article is the application of these classifications to tourist caves. Empirical studies of caves are much less abundant, and the existing database is small, so any contribution serves to enrich it both at the lithological and geographical levels. In addition, it should be noted that cave projects have a relatively low budget, and this type of “rapid and low cost” methodology is very useful at the beginning of the study and reinforcement processes of caves to know whether or not we are close to instability, where greater technical and economic efforts are required.
The objective of this study is to assess the stability of the cave by employing (i) an empirical approach based on geomechanical classifications Q Index, RMR and the CGI; (ii) utilizing a 3D point cloud generated through Structure from Motion (SfM), (iii) 2D numerical modeling analysis based on the generalized Hoek and Brown failure criterion and a 3D wedge analysis. It aims to be the first work focusing on improving the data on Maltravieso cave geomechanics, considering the lack of publications addressing this topic. Also, to validate, in a particular case, a simple methodology to analyze the stability of natural caves through field data and simple analysis.
2. Regional Framework
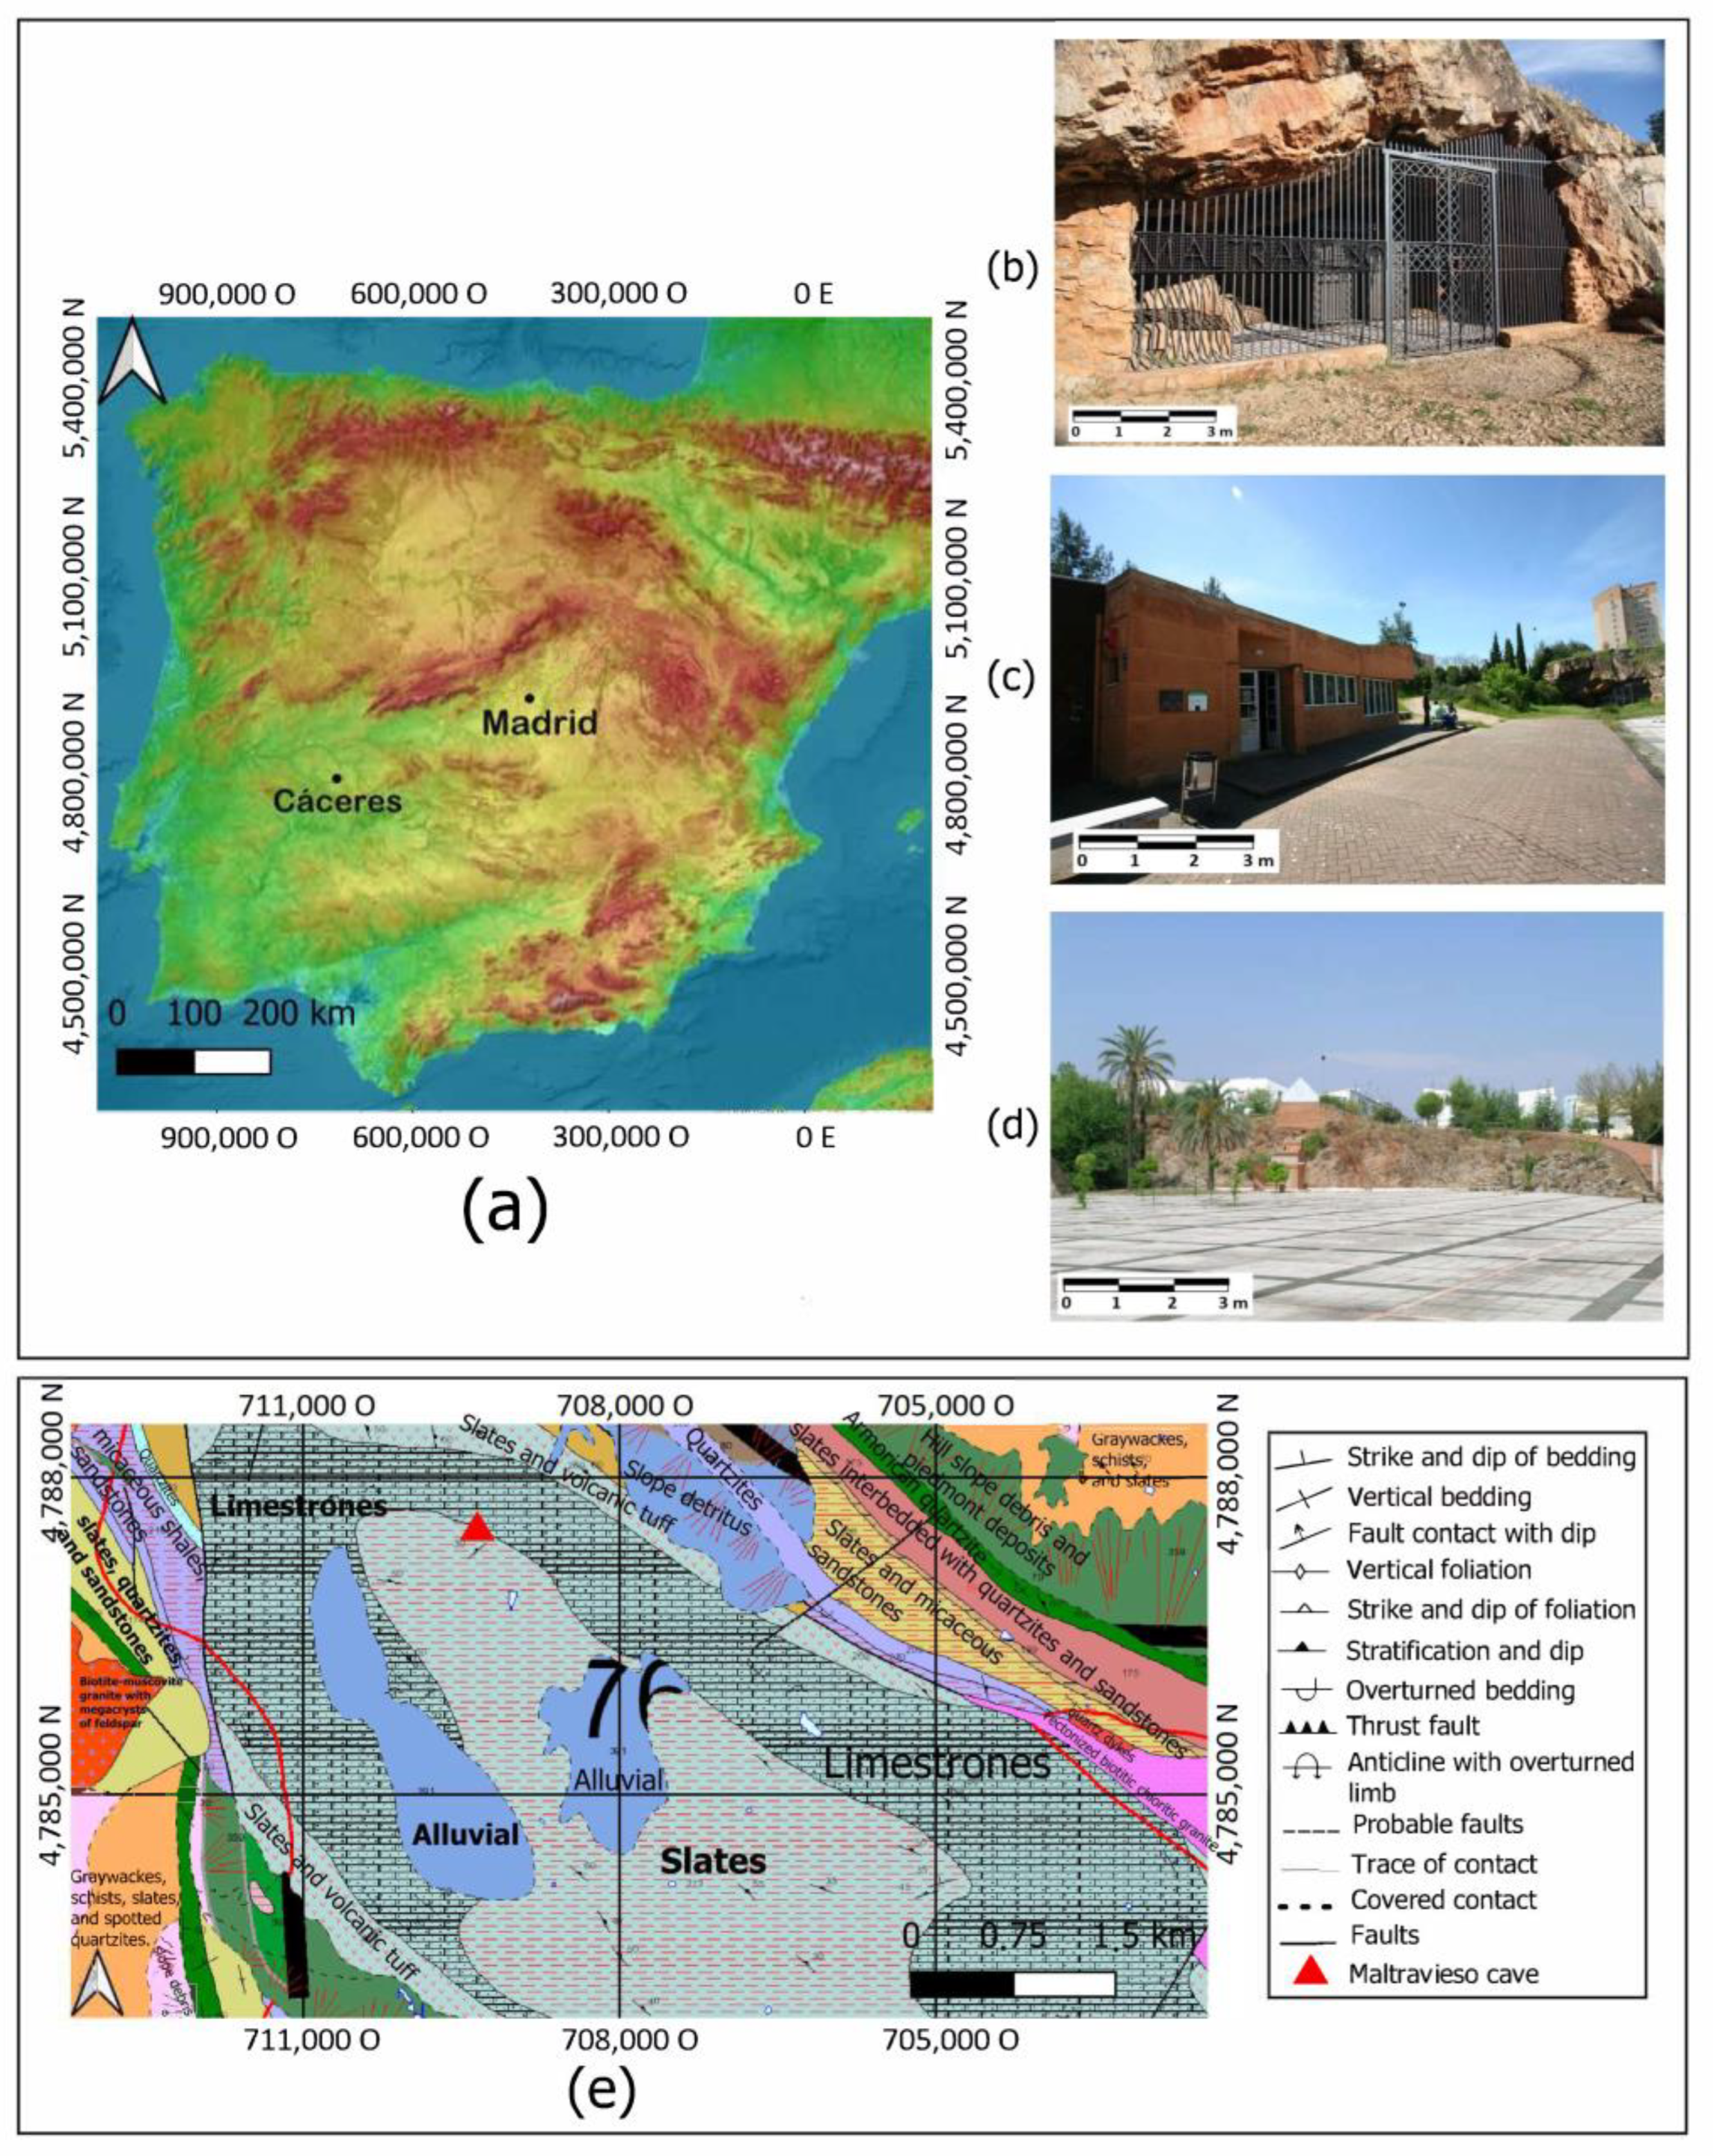
The Maltravieso Cave, located at 39.4753°N latitude and 6.3688°W longitude, covers an approximate area of 2000 m² within a horizon of carbonate materials known as the Calerizo of Cáceres, forming the core of a syncline that stands out over the Trujillo-Cáceres peneplain. These Paleozoic materials were deposited over the Precambrian materials of the peneplain, later folding and fracturing during the Variscan orogeny. The limestones that drive the karst processes were deposited during the Lower Carboniferous, intercalated with slates and volcanic tuff. This entire structure currently forms a kind of basin with irregular contours, where the described materials settle in irregular concentric layers, bordered by small elevations of Armorican quartzites, which give rise to the small mountain ranges (La Mosca, El Risco, La Aldihuela, La Señorina, La Sierrilla) that surround and shape the landscape of the capital city of Cáceres.
The complex geological process that created the Maltravieso Cave over time is driven by various factors—notably, the peculiar arrangement of limestones intercalated stratigraphically between layers of slate. This creates zones of weakness that facilitate the karstification process, which is further enhanced by the intense degree of fracturing of the materials. Inside the cavity, characteristic lithochemical reconstruction structures (stalactites and stalagmites) are visible, alternating with other dissolution traces that inform us about its genesis. Particularly notable are the pressure conduits, especially relevant in the area known as the Sala de las Chimeneas, the deepest part of the cavity. Additionally, two large sedimentary colluviums, which are very evident reflections of the senescence of the Maltravieso cave complex, are also significant in this area (
Figure 2).
The cave was discovered in 1951 as a result of a blasting in the limestone quarry that was being operated in this area in the mid-20th century. Initially, paleontological remains (Quaternary fossil fauna) and archaeological remains (human remains corresponding to a collective burial site dating between the Neolithic and the Bronze Age) were found [
12]. However, the rock paintings were not recognized until 5 years later, in 1956 [
13]. Consequently, after the initial excitement of the discovery had subsided, limestone quarrying continued, destroying approximately 35 m of the original cave’s entrance area.
The cave’s stability was assessed from an engineering perspective, utilizing internationally recognized methodologies for estimating the stability of subterranean voids [
1,
5,
14]. Due to the speleothems’ fragility, a visual inspection was deemed most advisable. Geotechnical observation points were strategically established in key sectors of the cave, notably at the entrance, chamber Sala de la Mesita and chamber Sala de las Chimeneas (
Figure 1). In these areas, structural measurements and characteristics of shear strength in discontinuities were recorded. Geomechanical mapping data was primarily acquired through the identification and characterization of the cave. A graphic representation and a scan of the cave’s geometry using Structure from Motion (SfM) were conducted. Additionally, information regarding the cave’s position, roof thickness, dimensions and fundamental rock mass properties (such as joint persistence, etc.) were documented. Subsequently, the geomechanics of the rocky material, including the determination of the physical–mechanical properties of the intact rock, were characterized.
Three geomechanical stations (GS) were established within the cave: GS1 in the Entrance Hall, GS2 in Sala de la Mesita and GS3 in Sala de las Chimeneas. These stations were instrumental in gathering data.
3. Materials and Methods
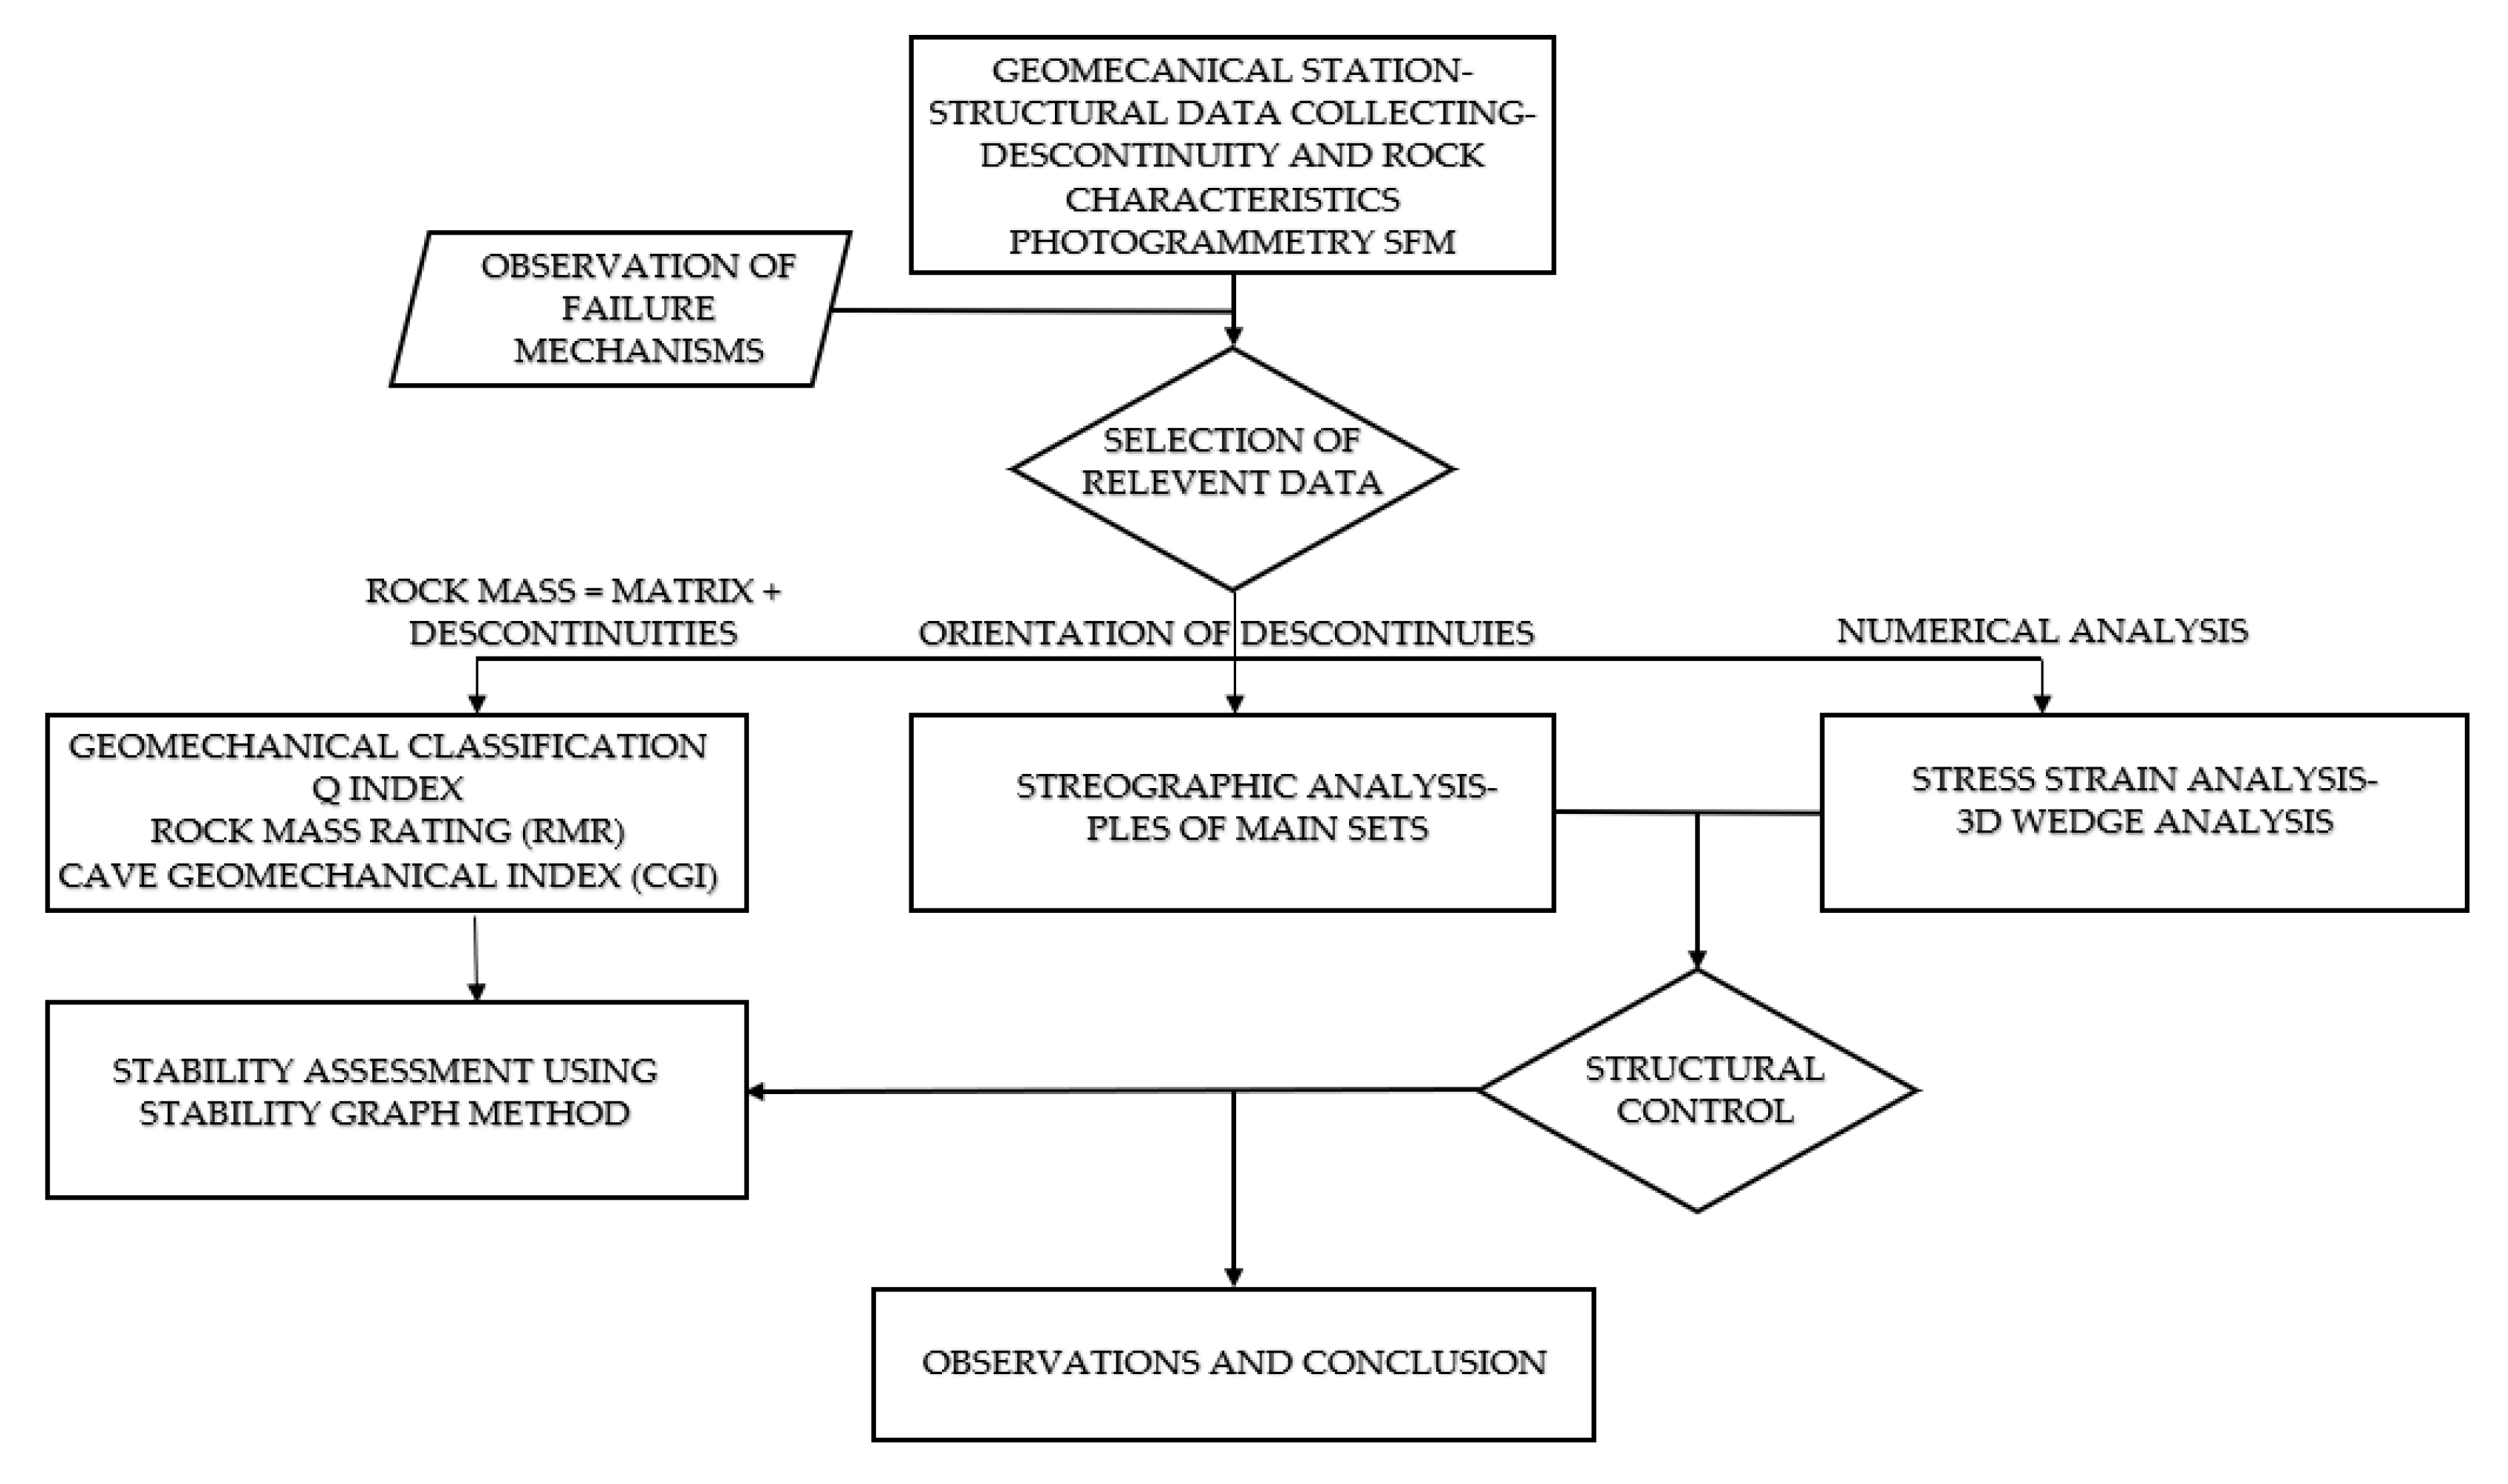
The method used to evaluate the cave’s stability involves engineering rock mass classifications, both empirical and numerical approaches, including remote techniques (
Figure 3). This is a globally accepted predesign criterion for underground excavations [
1,
5,
14]. The analysis proceeded through the following steps:
Gathering geometric data and establishing geomechanical stations for assessing rock compression, discontinuity properties, quality index and Geological Strength Index (GSI). Observing and collecting data on potential instabilities.
In this step, we used a Nikon Coolpix 2800 Tokyo, Japan, a low-cost camera, to take pictures for the SFM photogrammetry. A Freiberger geological compass was used to measure the discontinuity orientations, a Schmidt hammer to determine the uniaxial compressive strength and a laser meter for additional measurements
Generating a 3D point cloud model of the cave using the software Agisoft Metashape v1.6, extracting discontinuities using the open-source software CloudCompare v2.12.4 and determining massif properties as a continuous medium using the rocscience software RSdata v5.013, which applies the Hoek–Brown generalized criterion. Developing stress–strain models through numerical modeling using the boundary elements rocsience software Examine2D v8.005 and conducting 3D wedge analysis using the rocsience software Unwedge v5.016.
Analyzing and comparing the findings obtained through the outlined methodology.
3.1. Geomechanical Station and Rock Mass Classification
The stability of subterranean spaces can be initially assessed through rock mass classification systems [
1,
4,
10]. The two predominant methods utilized for this purpose are the Q index and the Rock Mass Rating (RMR). The Q index, developed at the Norwegian Geotechnical Institute in 1974, assigns a score to each rock mass domain, and its value increases with improved rock mass quality. Its variation is not linear; unlike the linear variation of the RMR, the Q index follows an exponential scale, ranging from Q = 0.001 for a very poor rock mass to Q = 1000 for an excellent rock mass [
15,
16], as shown in
Table 1. The Q index can be calculated using the following equation:
where RQD (in %) is the Rock Quality Designation index, Jn is the joint number coefficient, Jr is the joint roughness coefficient, Ja is the joint alteration number, Jw is the water reduction factor and SRF is the Stress Reduction Factor, which depends on the stress state of the rock surrounding the tunnel.
Rock Mass Rating (RMR), developed by Bieniawski in 1973, is a geomechanical classification system used to assess the stability and support requirements of underground excavations in rock masses. It was and is widely employed in engineering and geological practice [
14,
17]. The RMR system considers several parameters to evaluate the overall quality and behavior of a rock mass. And it is the sum of the values assigned to the following parameters: unconfined compressive strength of intact rock, RQD, spacing of discontinuities, condition of discontinuities, groundwater conditions and orientation of discontinuities. RMR ranges between RMR = 0 for very poor and RMR = 100 for very good rock quality, as shown in
Table 2. Various modifications of RMR have been applied to slopes and mining, but in this case, only the modification for caves will be analyzed.
Another new method to assess the risk of structural instability in caves is through CGI, a recent major factor developed by Brandi and collaborators (2021) in iron caves of Brazil [
8]. CGI is considered the first cave-specific geomechanical rock mass classification, and it was inspired by Bieniawski’s (1989) geomechanical classification methodology [
17]. The CGI formula is represented by the following equation:
where αRMR is the assigned value to the rock mass classification, β HR corresponds to the hydraulic radius, γ CS to the roof shape and δ CT to the roof thickness.
(i) RMR, the Bieniawski’s classification [
5,
14,
17], provides a means to appraise the quality of the rock mass. Numeric weights are attributed to the variables involved, which are outstanding in a comprehensive geomechanical assessment. This system categorizes rock mass quality into five classes, and these values are integral parameters within the geotechnical index for cavities, as mentioned in
Table 3.
(ii) Hydraulic radius, a parameter derived from the ratio of the cave’s area to its perimeter, is outlined in
Table 4. Originally applied in fluid dynamics, this parameter has been utilized in stability analyses of underground structures since 1977, as introduced by DH Laubscher [
18].
(iii) Ceiling shape (CS) is a qualitative variable designed to assess whether the roof geometry of cave openings is conducive or averse to the potential occurrence of blocks (due to joint intersections) and the descent of underground wedges. CS is classified into three distinct types—arch, planar and inverted arch—as illustrated in
Table 5.
(iv) Ceiling thickness (CT) is a geotechnical parameter signifying the vertical distance from the ground surface to the ceiling of the cave. The values allocated to this parameter can be categorized based on
Table 6.
The CGI ranges from 0, indicating the poorest rock quality, to 100, excellent rock quality. It proposes five categories based on the susceptibility to structural instability of the spans, as detailed in
Table 7.
3.2. Photogrammetry SfM and Discontinuities Extraction
3.2.1. Photogrammetry SfM
Photogrammetry, a remote-sensing technique, extracts 3D geometric properties from a pair or set of images depicting a scene. Strategies for obtaining this information involve principles of stereoscopic vision or modern 3D reconstruction using automatic correlation algorithms [
9,
10,
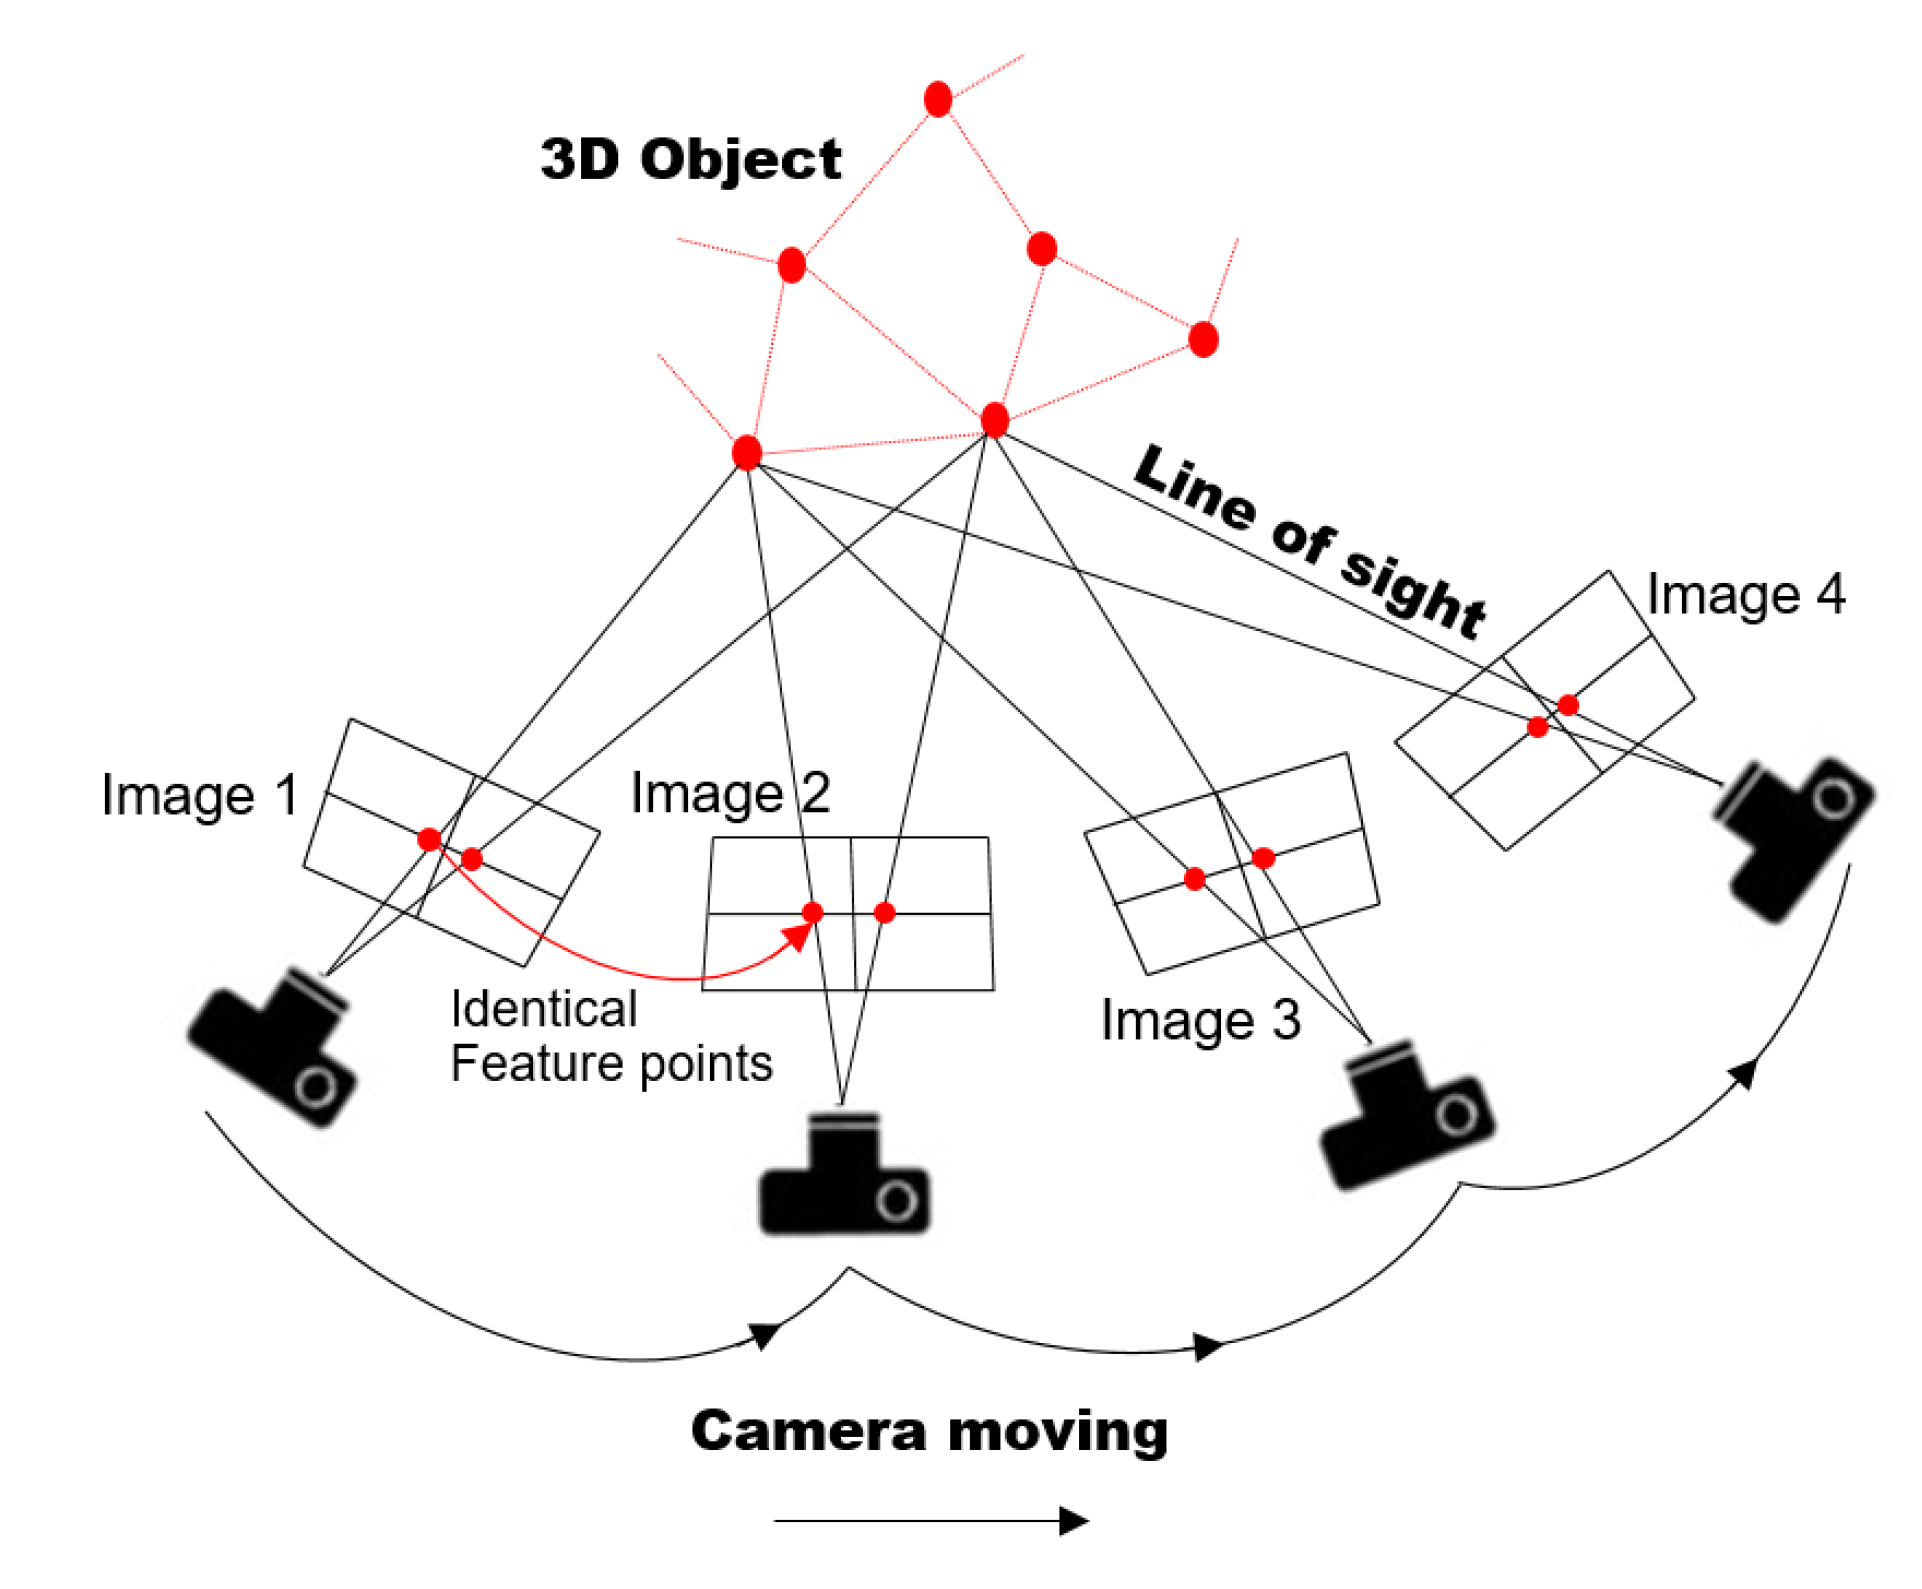
11]. Structure from Motion (SfM) technology, a highly efficient alternative, utilizes multiple overlapping photographs to determine camera orientation parameters without the need for calibration [
10] (see
Figure 4).
The SfM algorithm follows these steps: (i) detect key points in each 2D image; (ii) match these key points across overlapping images; (iii) employ an iterative bundle adjustment algorithm to estimate camera parameters, enabling computation of 3D positions and the initial creation of a scattered 3D point cloud; (iv) generate a dense 3D point cloud using Multi-View Stereo (MVS) techniques involving correspondence between points in more than two images and (v) scale and orient the point cloud within a reference system using a minimum of three ground control points (GCPs). These GCPs, identifiable in the photos, have known coordinates within the system [
10,
11].
Following the methodology presented in [
10], 200 photographs were taken with the maximum possible resolution (1 MP, 3:2; effective pixels 3888 × 2592; RAW-JPEG format) using a Nikon Coolpix 2800 “low-cost” camera with a constant focal distance (10.4 mm) and settings optimized for normal light conditions at the entrance hall (
Figure 4). This aimed to swiftly generate a 3D point cloud using the Structure from Motion (SfM) methodology. The varying number of photos is attributed to the geometric irregularities present in the study area. The software Agisoft Metashape v1.6 [
19] was employed to generate 3D models of the cave from the photographs. The computation level, influencing result quality, was set to high precision for visualizing discontinuity sets. The model took approximately 24 h for computation to ensure the required quality (see
Figure 5).
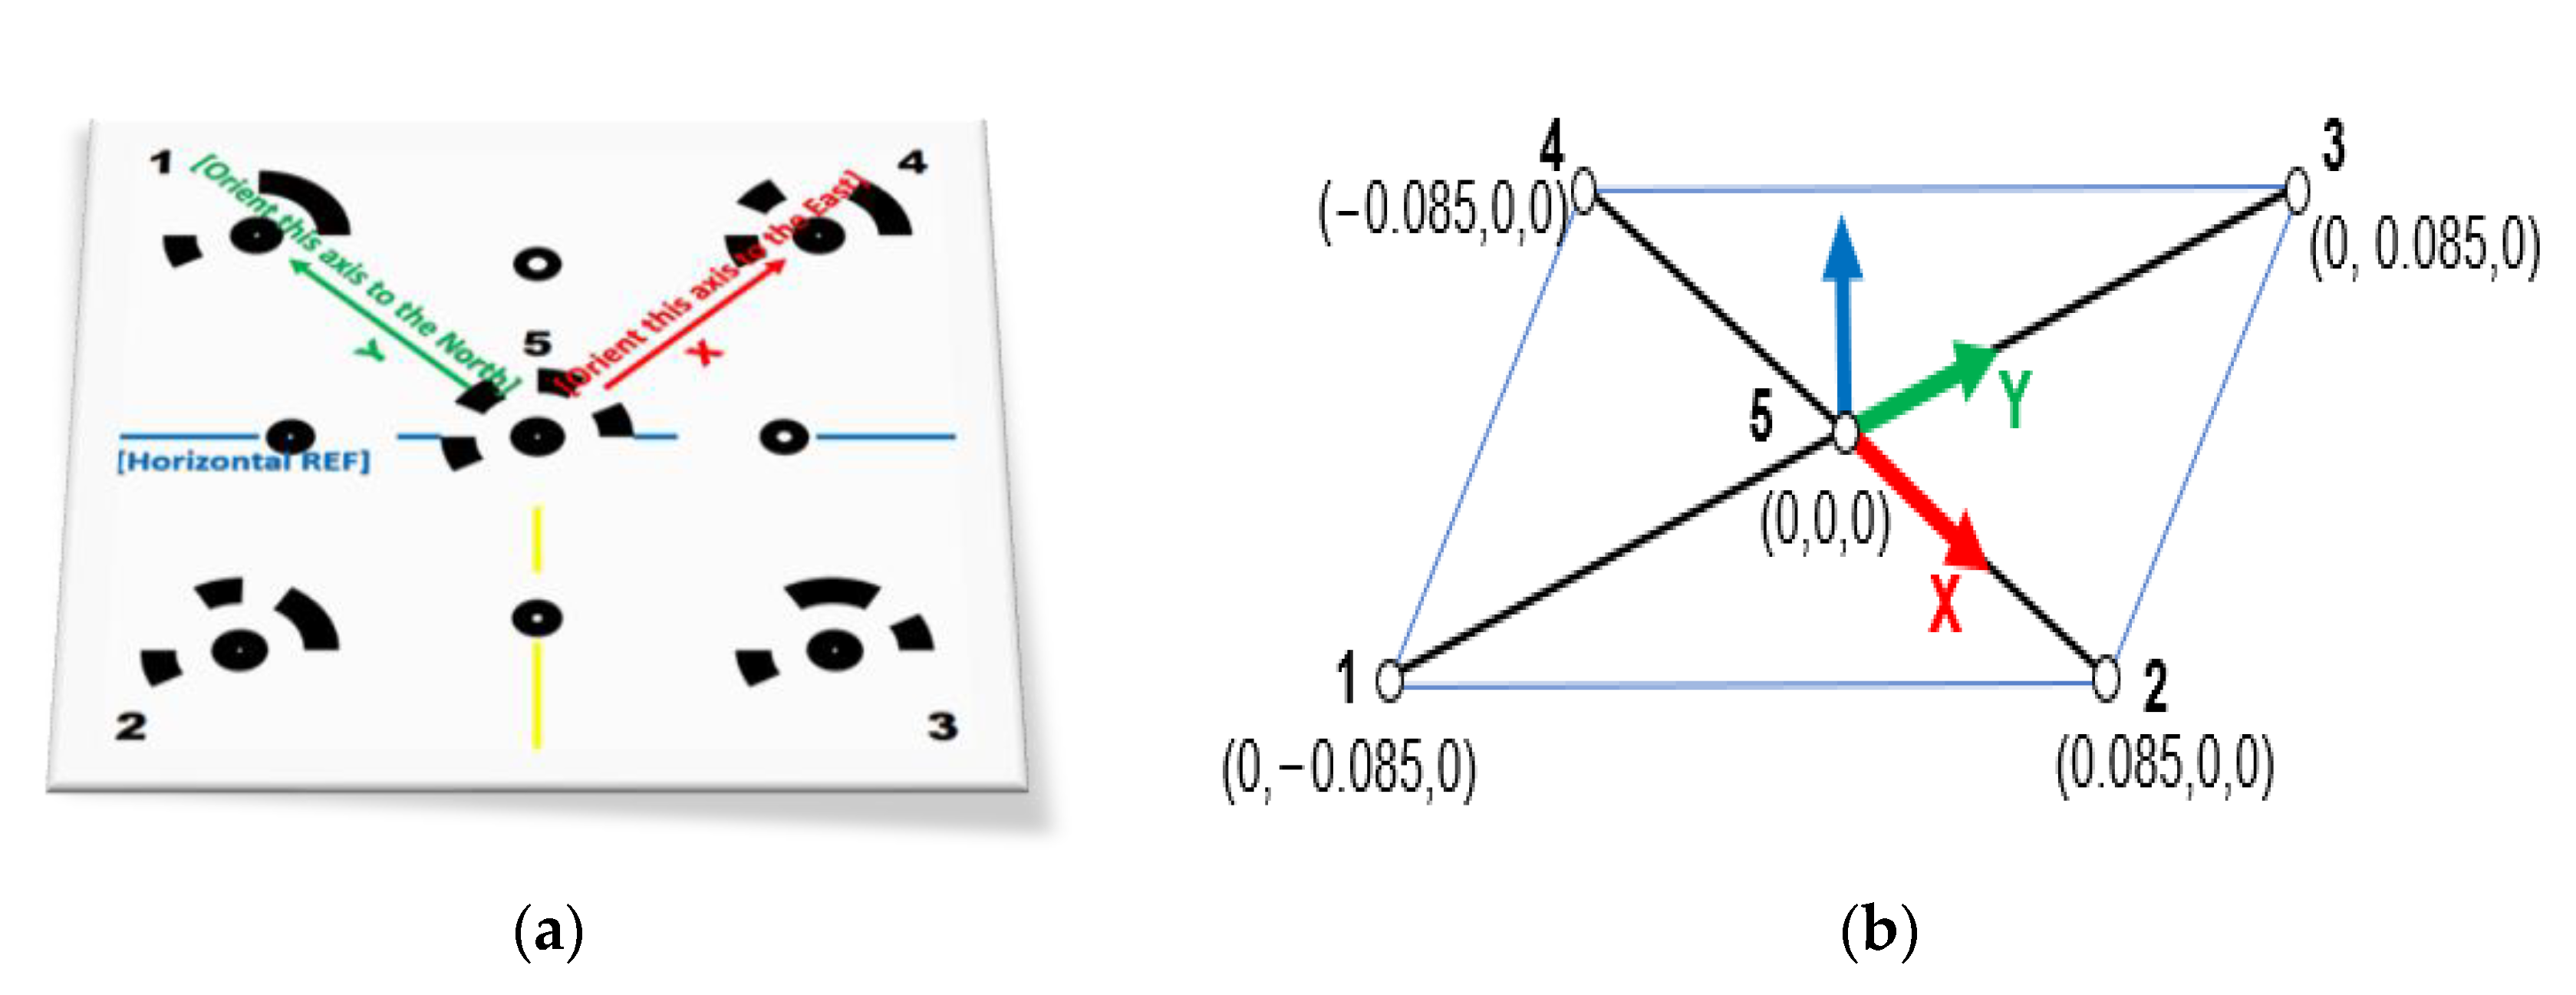
To ensure the correct orientation and scaling of the generated 3D point cloud without relying on a topographic control device, a cost-effective and efficient tool called the “portable orientation template” has been developed [
10,
11]. Resembling a traditional compass on a larger scale, the template incorporates five ground control points (GCPs) and three axes (x, y, z), with the y-axis alignable to the north using a compass and the spirit level to guarantee horizontal placement. With known GCP coordinates, the template acts as a local reference plane (see
Figure 6).
In our endeavor to thoroughly evaluate the quality of the 3D point cloud model, we carried out an assessment of its accuracy. This involved a detailed comparison between the known real-world coordinates of ground control points (GCPs) and the corresponding coordinates generated by the model.
Table 8 precisely outlines the deviations in the x, y and z axes for each GCP and the calculated root mean squared (RMS) error values derived from the point cloud models. These RMS error values offer valuable insights into the overall accuracy and reliability of the models, and these values are considered reasonable [
10,
11].
3.2.2. Analysis of the 3D Point Cloud and Extraction of Discontinuities
The stability of caves and underground excavations is influenced by diverse structural features, including stratification, faults and joints, along with rock properties and weathering. A thorough analysis of these features is essential for evaluating stability. In this study, the orientation of the discontinuities has been determined using two methods: manual measurements via a Freiberger geological compass in the field and remote-sensing techniques utilizing the open-source software CloudCompare v2.12.4 [
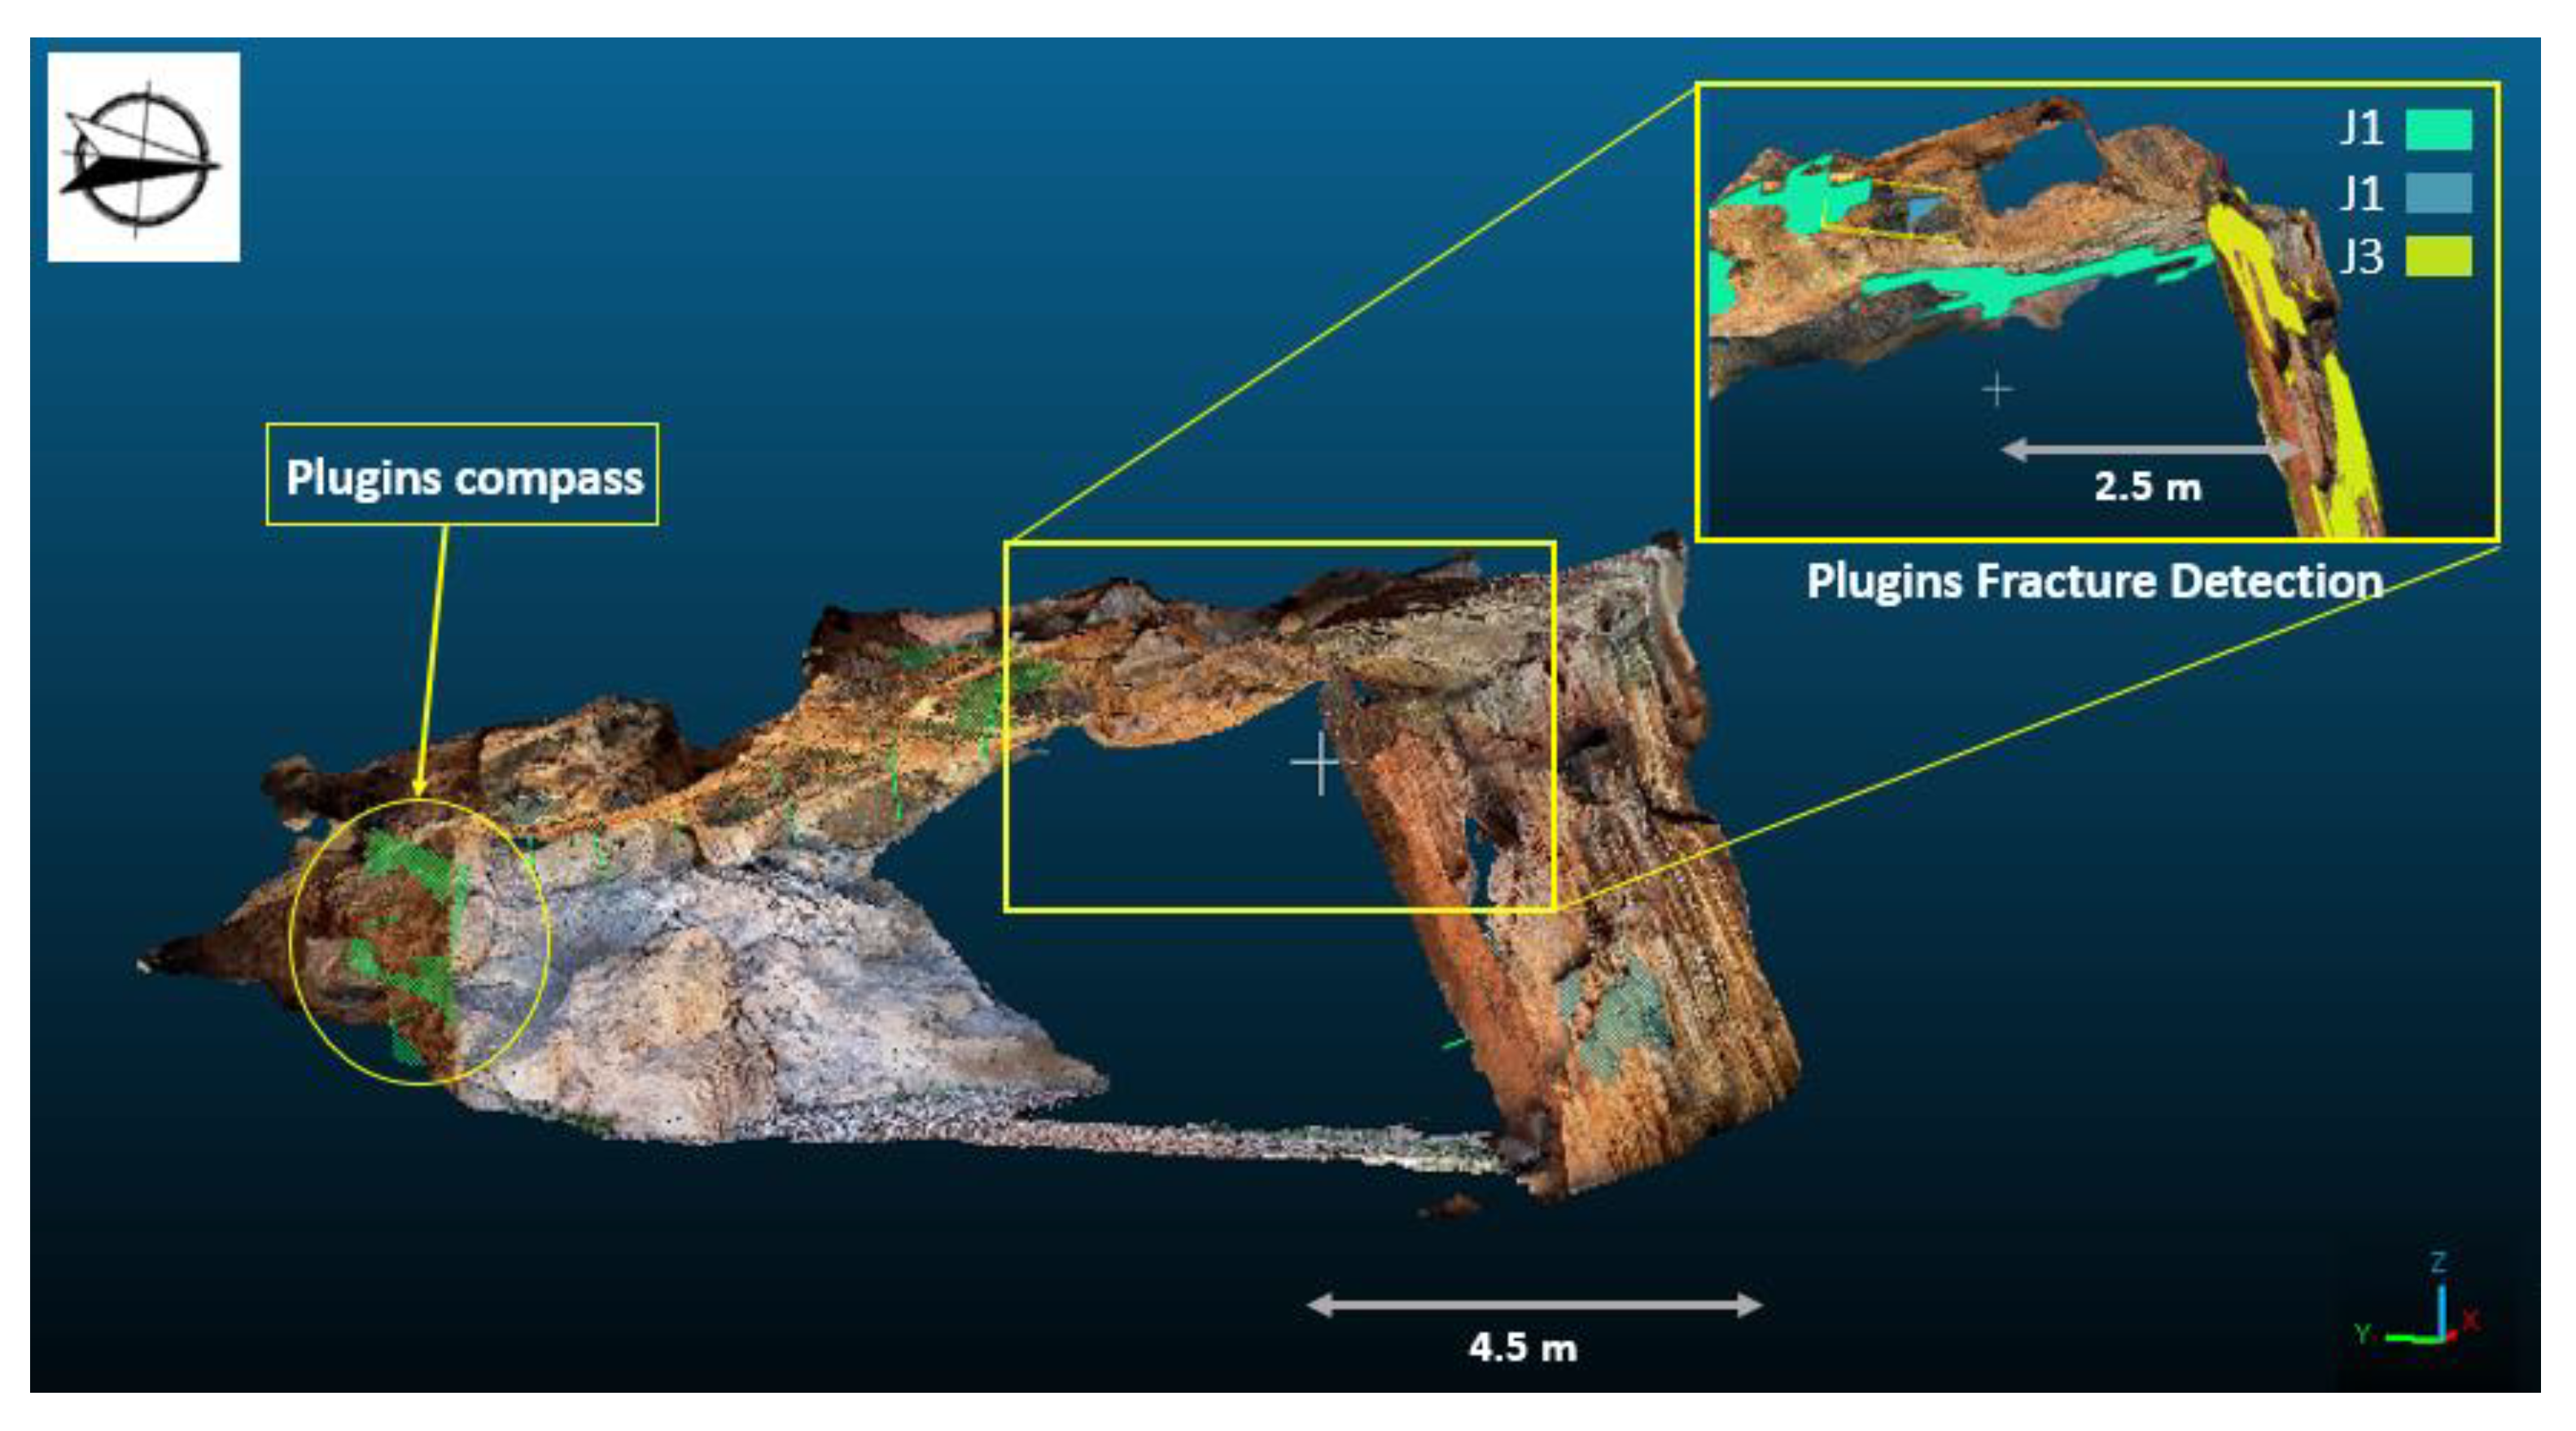
20]. Following a specific process, we analyzed and determined sets of discontinuities. Initially, a semi-automatic analysis was performed using the Facet/Fracture Detection plugin, enabling the observation of plan sets represented in various colors (see
Figure 7); each color signifies a family of discontinuities. Subsequently, the orientation of these discontinuities was measured using the compass tool through point selection (see
Figure 7). This technique facilitates obtaining orientation data in remote and inaccessible zones [
4,
10].
In the entrance of the cave and the Sala de la Mesita, we recorded 10 and 11 measurements in the field using a manual compass, respectively. Meanwhile, using the CloudCompare software, we obtained 30 and 29 measurements. The results from both methods were combined to generate the stereograms presented in the
Section 4.
3.3. Numerical Modeling and Wedge Analysis
3.3.1. Stress–Strain Analysis
Through the application of numerical stress–strain analysis, it becomes feasible to identify regions experiencing excessive loads and ground movements. Numerical simulations, implemented as computational algorithms, have the capability to emulate stress and strength interactions within rock masses and various subsurface structures like tunnels, mines and caves. The geomechanical responses of a rock mass can be accurately modeled under specific predefined initial in-situ stresses [
4,
21].
The numerical modeling conducted in this study involves stress–strain analysis, utilizing the boundary element software Examine2D, which is designed to simulate stress and strength interactions in rock masses. The primary objective is to derive a safety factor linked to the strength factor and determine maximum displacements. This data is then compared with the stability assessment obtained through rock mass classifications and empirical approaches [
4,
6,
21]. This analysis does not delve into supporting measures; instead, the strength factor is solely employed to ascertain the safety factor and identify the extent of overstressed rock mass.
Input rock mass data for the numerical analysis were derived from geomechanical stations. The cave’s geometry was obtained through Structure from Motion (SfM), while the initial stress conditions were determined based on the cave’s depth and rock density. Adhering to the Hoek and Brown failure criteria, the rock mass parameters used were obtained, as shown in
Table 9.
It is important to note a limitation in this boundary analysis: it assumes the material as a continuous medium, which is not accurate for fractured rock. Therefore, an additional analysis based on blocks theory has been carried out (wedge analysis).
3.3.2. Wedge Analysis
The stability assessment in rock masses in tunneling and underground excavations includes the evaluation of wedge stability using block theory. This methodology intricately examines the potential detachment of wedges or blocks within a rock mass, playing a critical role in ensuring the integrity of underground structures. Wedge analysis focuses on the assessment of the stability of discrete blocks within a rock mass, considering the orientation and resistance of major joint sets and fractures [
15,
16].
To apply these theories practically, we used the rocsience software tool Unwedge v5.016; this software helps to visualize wedges and their stability in three dimensions [
22]. Input data for the analysis were derived from geomechanical stations and following the Barton-Bandis methodology, which models the shear strength of rock joints based on the joint’s roughness (JRC), compressive strength (JCS) and the normal stress acting on the discontinuity, providing a widely used empirical approach in rock mechanics. [
23], the pertinent rock mass parameters are shown in
Table 10.
4. Results
4.1. Cave Model as 3D Point Cloud and Geomechanical Analysis
In this study, a 3D point cloud model has been generated using SfM. The main studied zones, as illustrated in
Figure 8, are the entrance, “sala de la Mesita” chamber and “sala de las Chimeneas” chamber. The accuracy and errors of this model are accepted according to [
10,
11].
Table 11 presents a comparison between manual and remote-sensing data collection methods.
4.2. Discontinuities Extraction
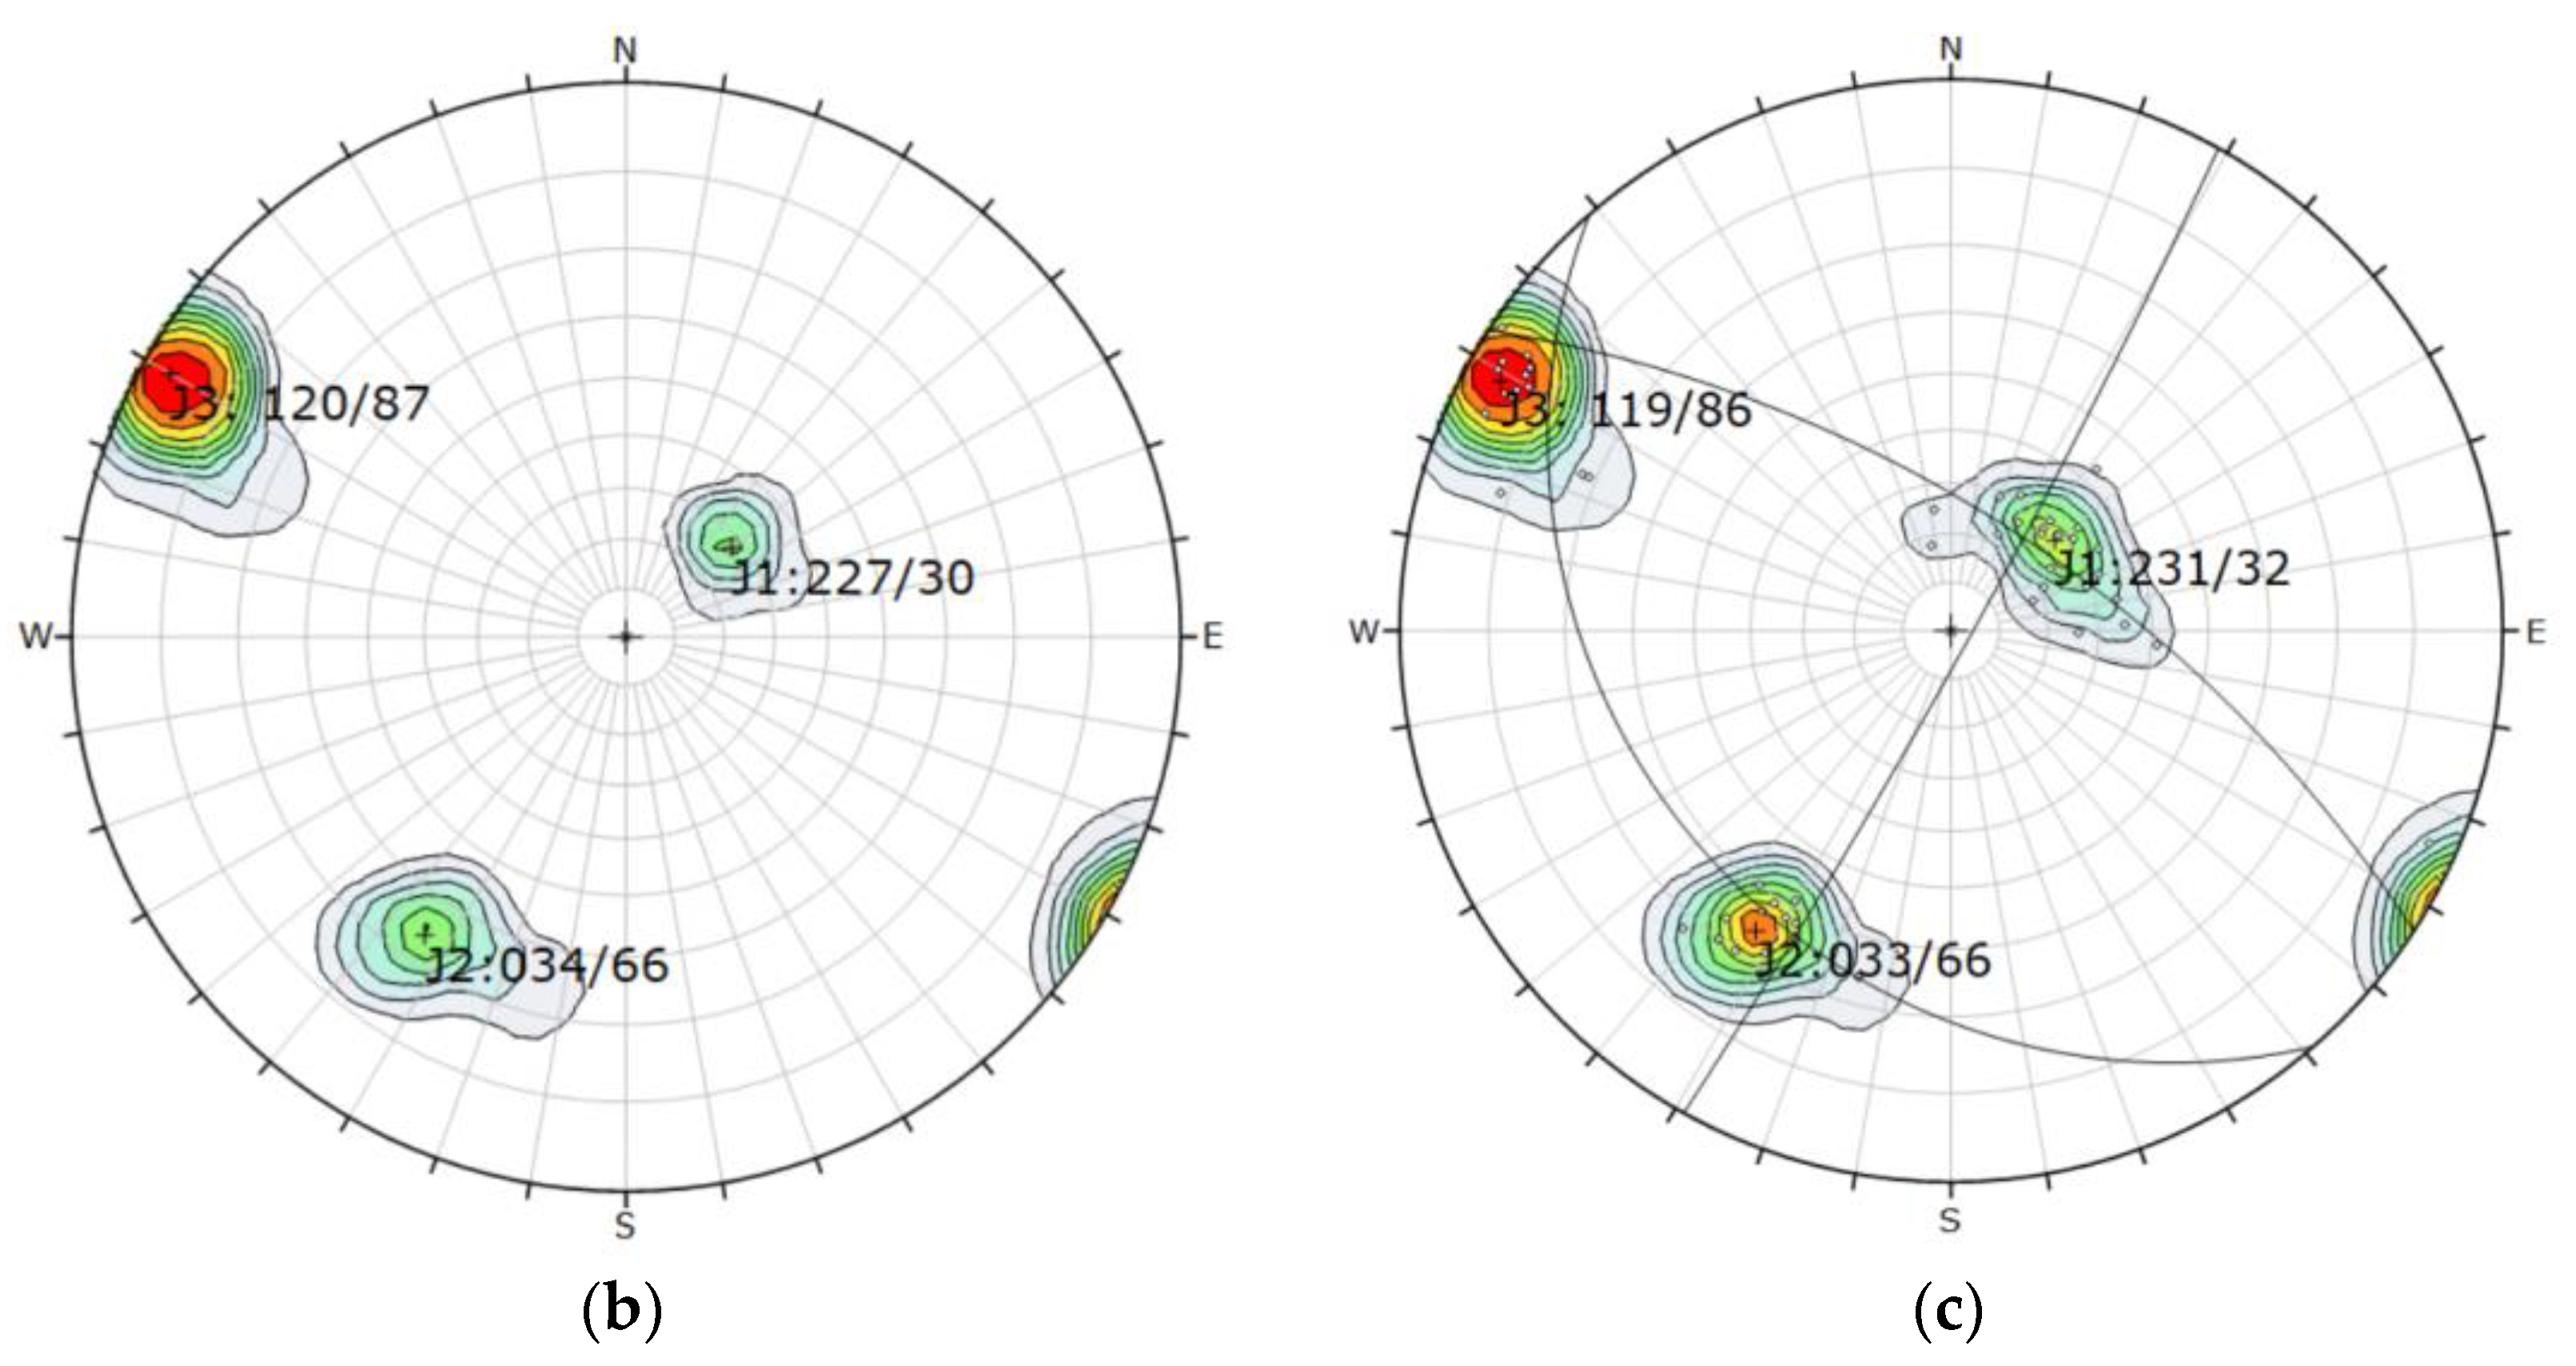
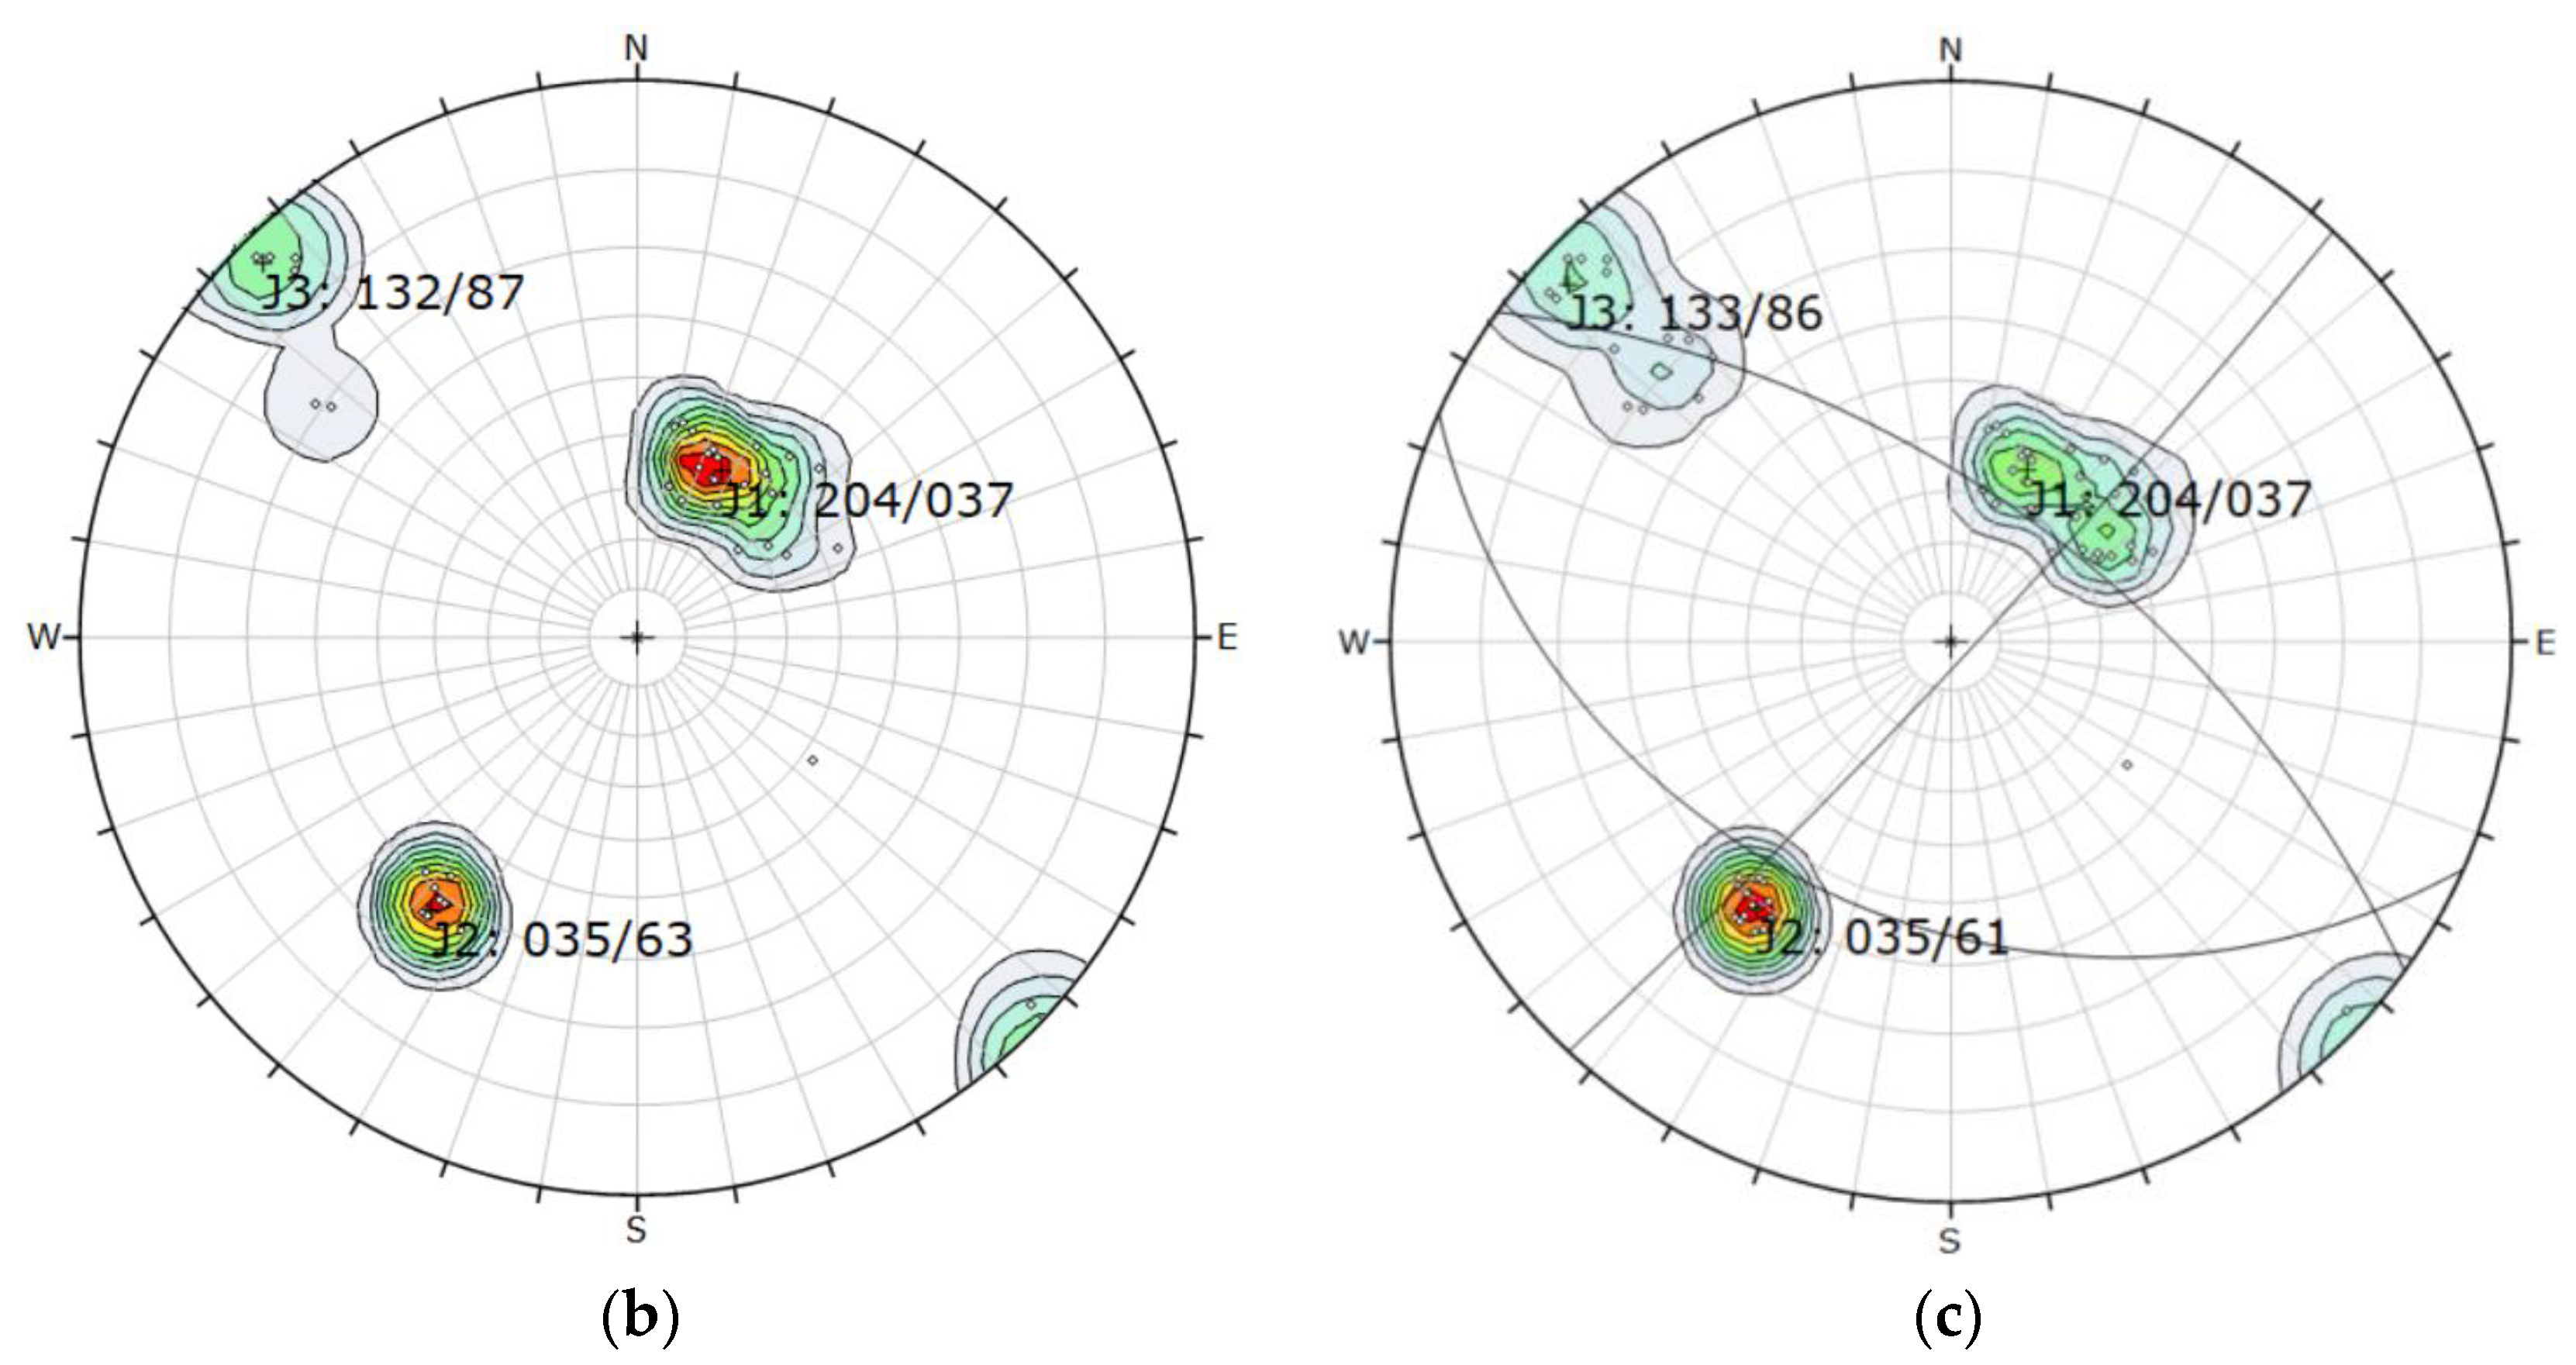
Discontinuity sets were identified using various methods: (i) manual compass measurements in the field and (ii) extraction from the 3D point cloud using CloudCompare software. The results are illustrated in
Figure 9 and
Figure 10.
Figure 9a illustrates the 11 poles obtained manually with a compass in an outcrop at the entrance of the cave and three main sets (J1, J2, J3) with their corresponding dip/dip direction. Therefore,
Figure 9b shows the results obtained from the 3D point cloud (39 poles). It is very clear that more values are shown for the joints.
Figure 9c shows a combination of poles acquired, with both the compass and the 3D point cloud shown. The red and yellow colors indicate areas with the highest concentration of joint poles. This combination significantly improves the original stereogram obtained solely via the compass. The additional contribution from the inaccessible upper part of the cave allows the observation of joint J1.
The results of discontinuities collection of the GS2 at the Sala de la Mesita are illustrated in
Figure 10, with the same observation as the previous.
Figure 10a shows poor data obtained manually with a compass in the field compared to
Figure 10b (data collected from 3D point cloud). The combination of data highly improved the original stereogram
Figure 10a, as shown in
Figure 10c.
4.3. Stability Assessment Using Geomechanical Classifications
Barton’s Q Index, Bieniawski’s RMR system,= and the CGI were utilized to assess the stability of the cave through Geomechanical Classifications. Three geomechanical stations were established to evaluate the quality of the rock mass at specific locations: (i) the entrance, (ii) the Sala de la Mesita chamber and (iii) the Sala de las Chimeneas chamber.
Table 12 summarizes the rock quality values and mapped observations for the Bieniawski RMR Index. Additionally,
Table 13 illustrates the values obtained for Barton’s Q Index, while
Table 14 provides the results of the CGI calculation.
4.4. Stability Analysis by Empirical Approach
Since the 1970s, a few authors, such as Barton [
15,
16] and Waltham [
24], have written on the topic and analyzed the stability of caves using the Q index. However, their proposition was not specific to caves, as it included the influence of support. Jorda-Bordehore introduced a graphical representation of caves outlining three potential stability conditions. This proposed approach for caves underwent calibration using data from over a hundred caves across different lithologies, revealing results that fall within the transition and stable zones [
1].
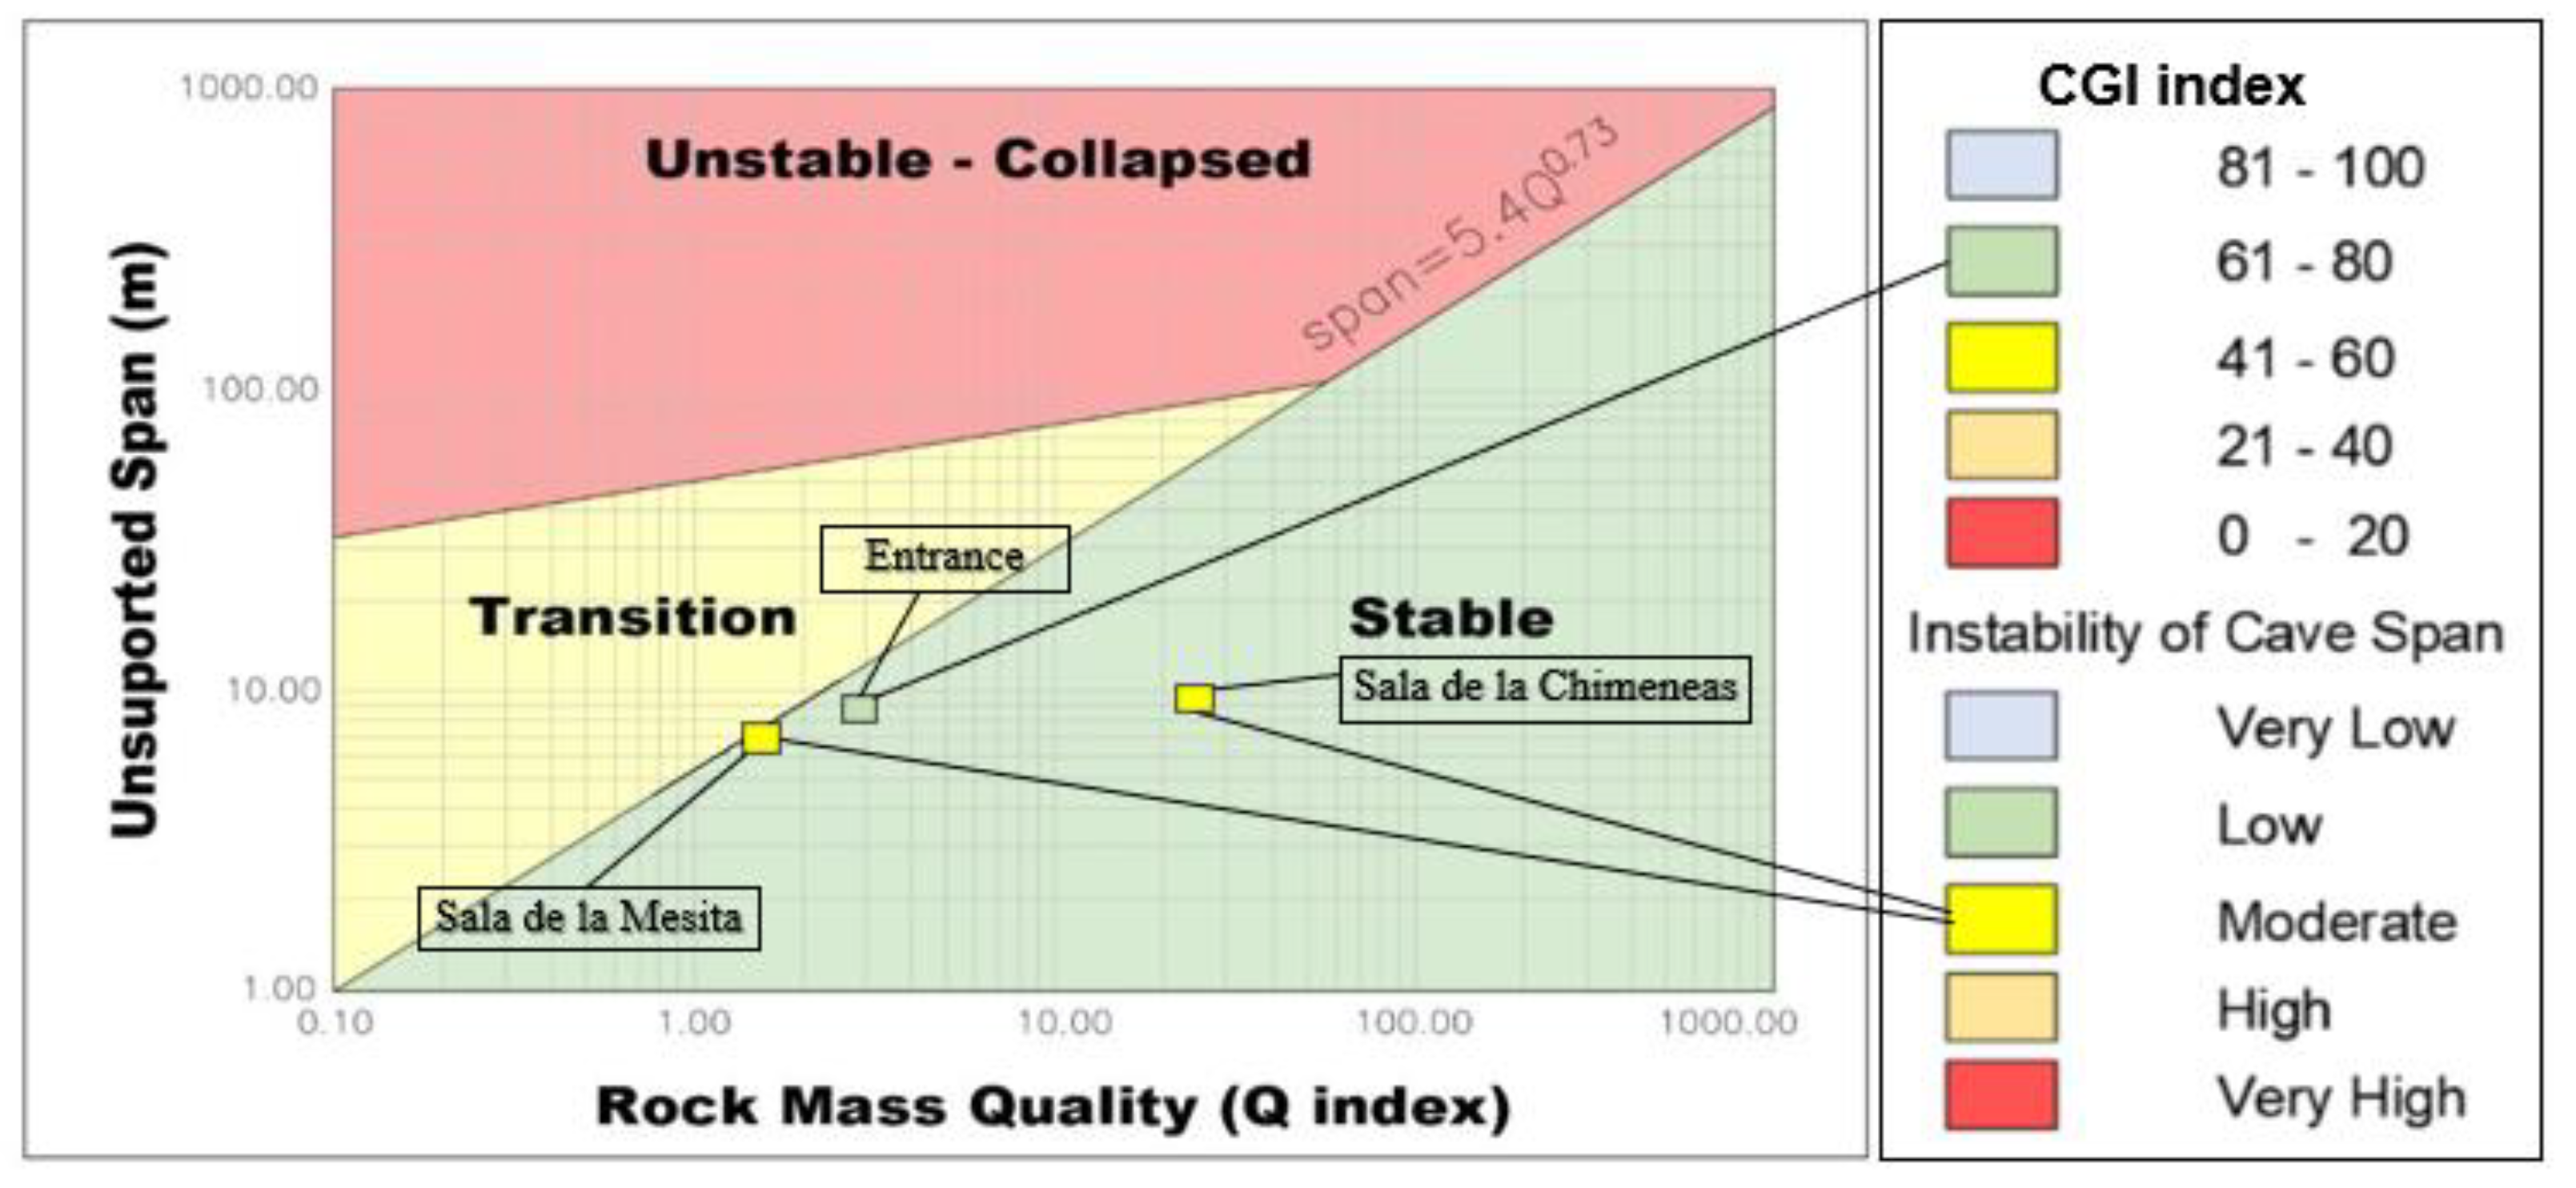
To evaluate the stability of the Maltravieso cave, the parameters obtained from geomechanical classification were graphically represented on the Q chart Jorda 2017 [
1], and the outcomes are illustrated in
Figure 11.
4.5. Numerical Analysis
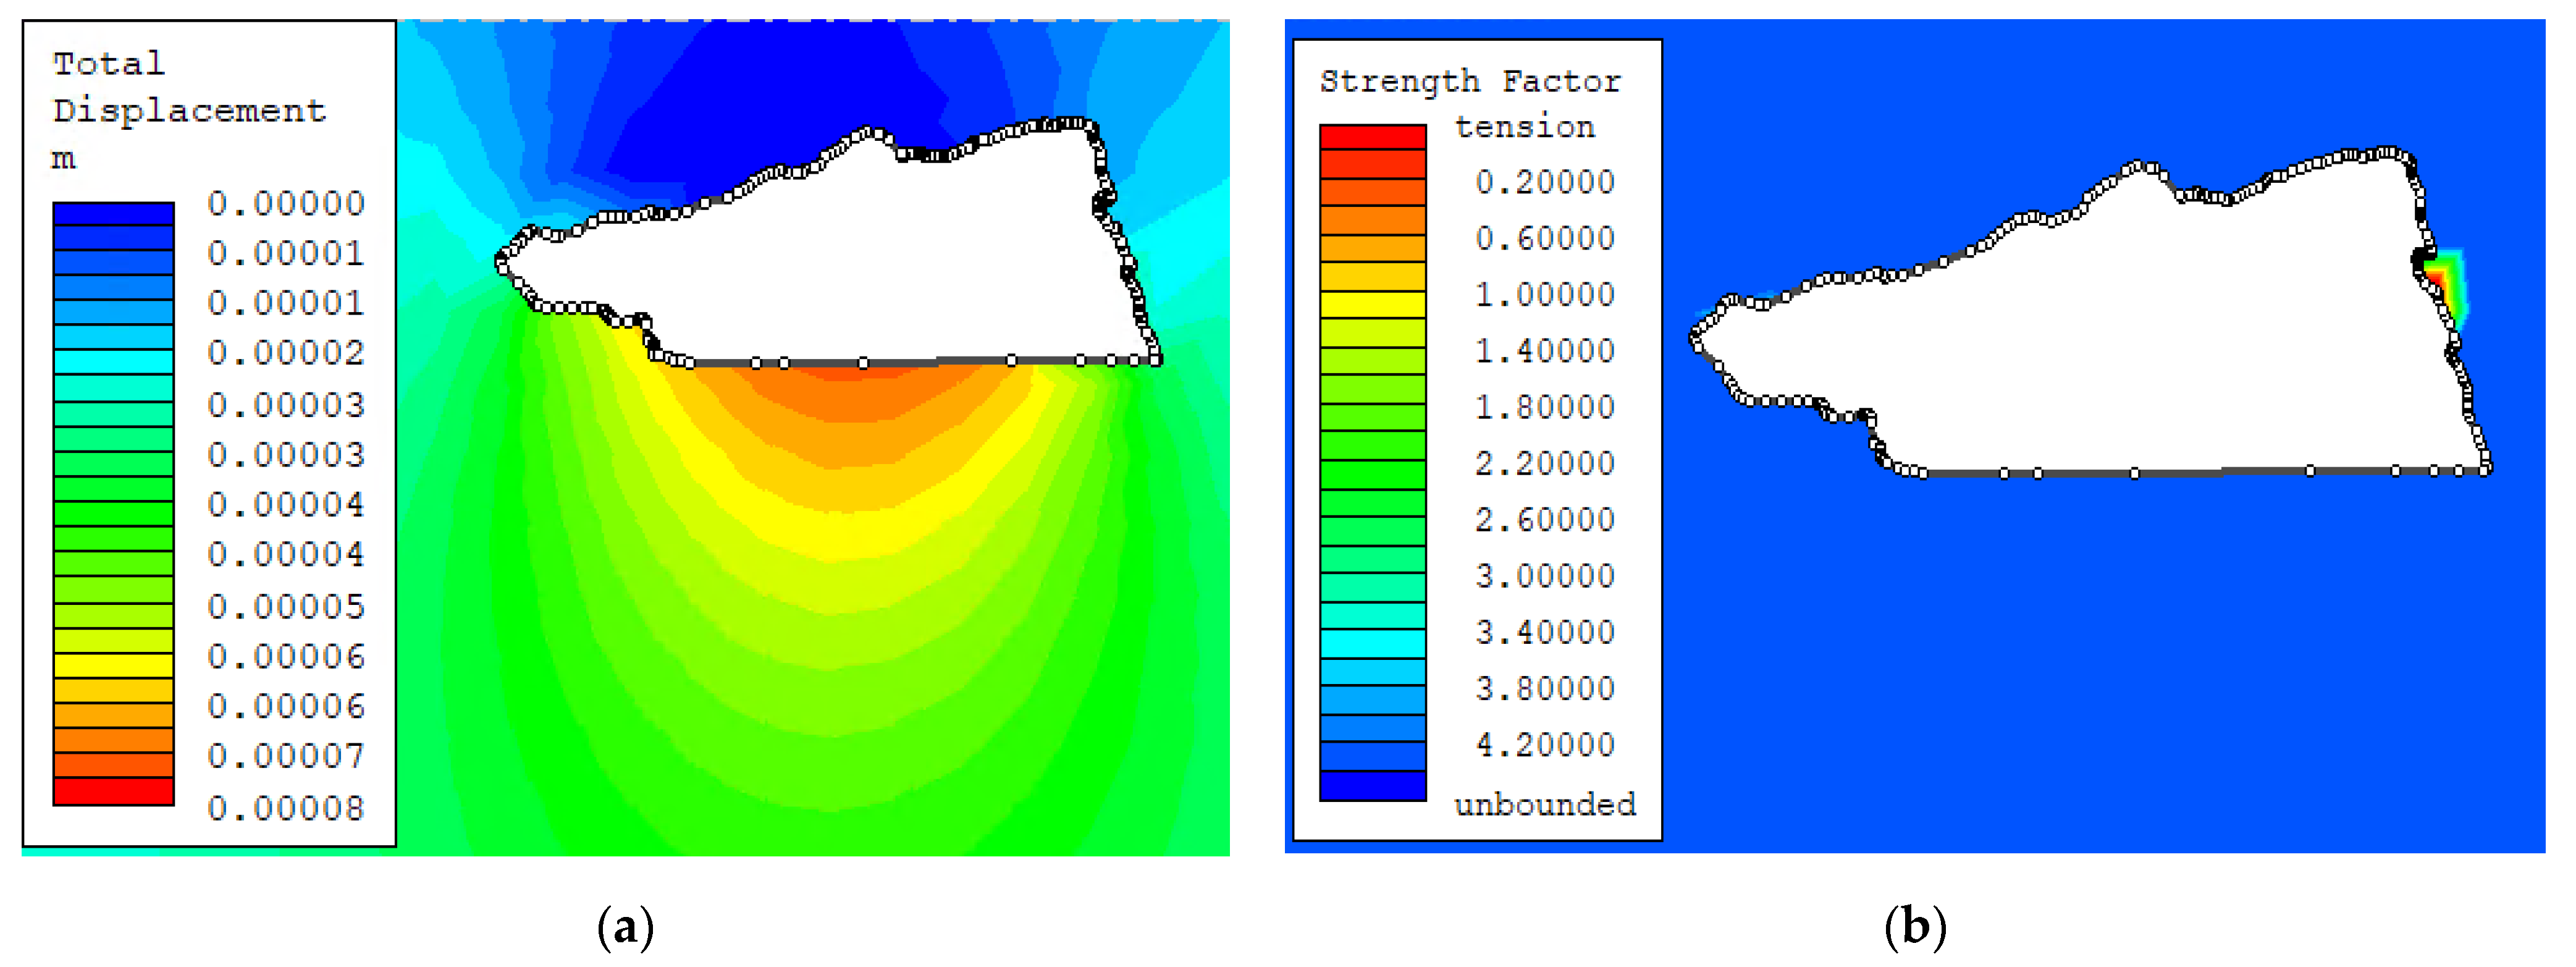
A numerical analysis was conducted employing the boundary element method. This study focused on three distinct sectors of the cave: the entrance, Sala de la Mesita chamber and Sala de las Chimeneas chamber. The purpose of this numerical analysis was to validate and substantiate the current state of the cave.
Figure 12 and
Figure 13 illustrate the modeling outcomes for the entrance, excluding considerations for surface overloads. The total displacements observed are negligible, indicating that the cavity is within an elastic regime and remains stable. There are only a few overstressed zones in some corners and sharp slabs.
4.6. Wedge Analysis
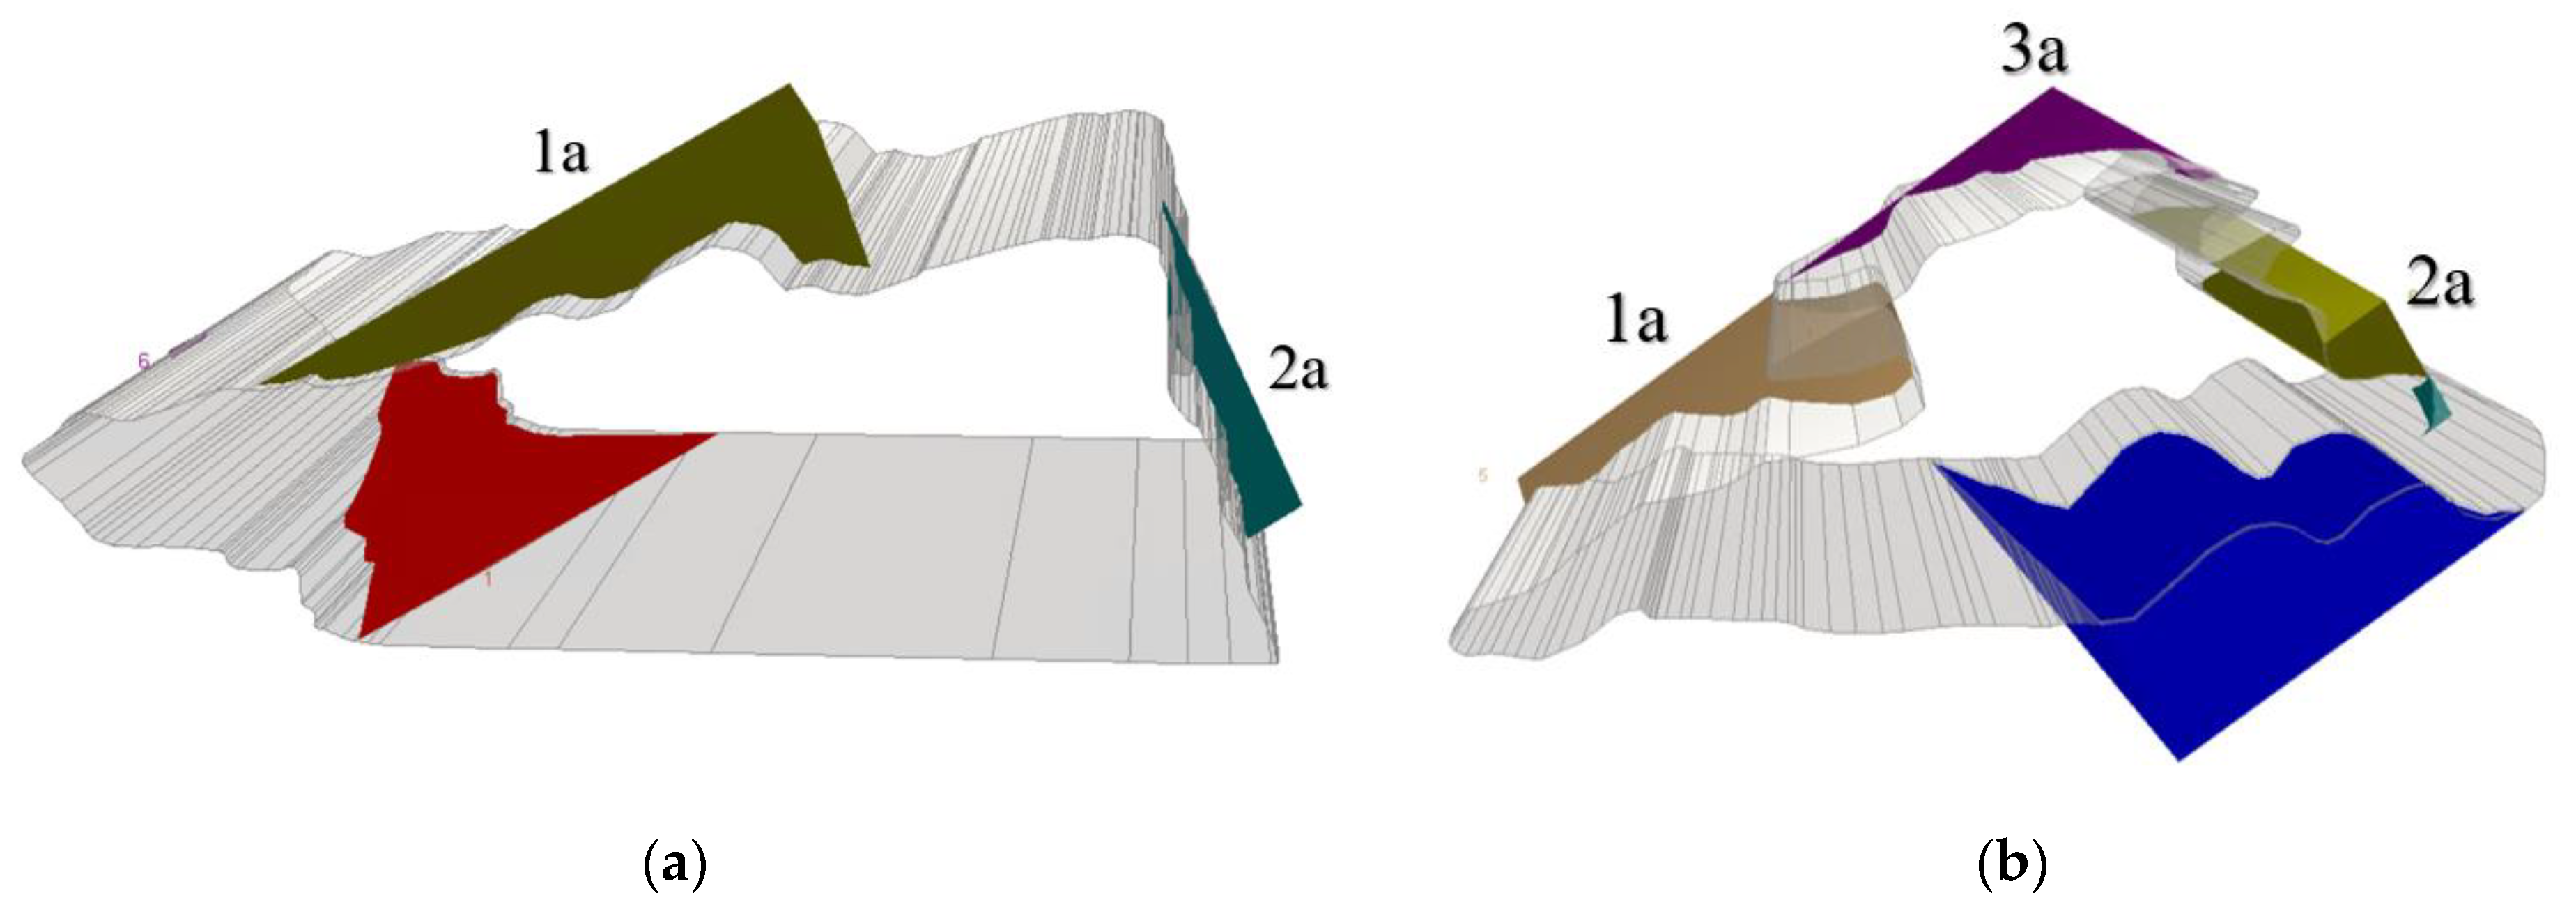
The 3D wedge analysis has been carried out using the software UNWEDGE v5.016 (Rocscience), and the results are illustrated in
Figure 14.
Figure 14a shows the results obtained from the entrance model. An important wedge is visible in the ceiling; however, this wedge is probably smaller and partially fallen, as could be seen during the field campaign. Another wedge is in the right wall, and it is stable.
Figure 14b shows the results obtained from the Sala de la Mesita chamber model: three important wedges in the ceiling with a realistic size.
A summary of the wedge analysis is presented in
Table 15, which offers a comprehensive overview of the study’s findings.
5. Discussion
The stability of Maltravieso cave has been analyzed using a combination of empirical, numerical and remote-sensing techniques, each providing complementary insights into the cave’s structural integrity. The results indicate that, while the cave is generally stable, specific areas exhibit potential instability, warranting further attention and monitoring.
Using the Q Index, RMR and CGI, we assessed the rock mass quality across different sectors of the cave, confirming varying degrees of stability. As shown in
Table 13, the entrance of the cave (Geomechanical Station 1) is classified as “Poor” in terms of rock mass quality. However, the CGI values place the entrance in the “Stable” category (CGI score of 64), as seen in
Table 14. In contrast, the Sala de la Mesita and Sala de las Chimeneas chambers (Geomechanical Stations 2 and 3) exhibit “Moderate” stability, with CGI scores of 42, indicating a need for close monitoring in these areas. This divergence between empirical classifications underscores the value of using multiple approaches to capture the complexities of cave stability.
The empirical methodologies also reveal differences in stability depending on the measurement method. For instance, the rock mass quality at the Sala de las Chimeneas, based on the Q Index and CGI, suggests moderate stability (
Figure 11). This shows that methods like the Q Index and CGI can provide important details that help identify areas at risk of instability.
Numerical simulations using boundary element methods (Examine2D) demonstrated that the cave structure remains within an elastic regime, with only minor total displacements observed in the stress–strain analysis.
Figure 12 and
Figure 13 illustrate that while the cave generally experiences low stress, specific regions, such as sharp corners at the entrance (Geomechanical Station 1) and Sala de la Mesita (Geomechanical Station 2) show localized stress concentrations. These zones are critical as they exhibit overstressed rock, potentially leading to failure under increased external loads or prolonged environmental changes. The presence of stress concentrations in these areas suggests a need for ongoing monitoring to avoid future structural failure, especially in light of visible cracks and partially detached rock blocks.
The 3D wedge analysis performed with the Unwedge software identified key areas of concern within the cave.
Figure 14 depicts the wedges formed at the entrance and Sala de la Mesita chamber, with one wedge at the entrance already showing signs of partial detachment. As noted in
Table 15, the safety factors for several of these wedges are less than 1, indicating that they are unstable and could collapse under certain conditions. The results align with visual field observations, which confirmed the presence of minor slab falls in both these areas. Importantly, this analysis confirms that the Unwedge method is effective in predicting potential collapse zones, offering a reliable tool for assessing wedge stability in subterranean environments.
One of the most significant contributions of this study is the use of Structure from Motion (SfM) photogrammetry for remote data collection. As illustrated in
Figure 9 and
Figure 10, the comparison between manual compass measurements and SfM-derived data shows a clear improvement in the stereographic analysis when combining both methods. Manual measurements, while accurate, are limited to accessible areas, whereas SfM allows for detailed geometric data capture from remote and higher elevations. The addition of data significantly enhanced the precision of the stereograms, especially in inaccessible zones, enabling the identification of joint sets that would otherwise have been missed.
The successful application of SfM, as demonstrated in this study, shows its value as a cost-effective tool for capturing high-resolution 3D models of natural caves. This technology is not only practical for improving structural analysis but also essential for monitoring ongoing changes in cave geometry due to natural or anthropogenic factors. The RMS errors reported in
Table 8 are within acceptable ranges, further validating the accuracy of the photogrammetric models.
The study’s findings suggest that while the Maltravieso cave is largely stable, certain regions—specifically at the entrance and in the Sala de la Mesita—exhibit stress concentrations and unstable wedge formations. The combination of empirical, numerical and remote-sensing techniques provides a comprehensive understanding of the cave’s stability. Moving forward, it is recommended that regular monitoring be implemented in these critical areas, with the installation of crackmeters and clinometers to detect any early signs of displacement or structural degradation. Periodic SfM scans should also be conducted to track changes in the cave’s geometry over time.
6. Conclusions
The objective of this study was to evaluate the stability of the Maltravieso cave from an engineering perspective using a combination of empirical, numerical and remote-sensing methods. The research relied on techniques such as the Q index, RMR and CGI, along with 3D modeling and wedge analysis, to provide a comprehensive understanding of the cave’s structural stability.
The overall stability of the Maltravieso cave was confirmed, with the entrance section showing “good” stability according to CGI, while the Sala de la Mesita and Sala de las Chimeneas exhibited moderate stability. These findings highlight areas where ongoing monitoring is necessary due to potential localized instabilities.
The numerical analysis, supported by Examine2D modeling, identified minor stress concentrations at the entrance and Sala de la Mesita, with limited displacements, suggesting that the cave remains in an elastic regime. Wedge analysis indicated the presence of unstable blocks with safety factors below 1 in certain areas, particularly at the entrance, where partial block detachment was observed.
The use of Structure from Motion (SfM) photogrammetry allowed for the accurate identification of discontinuities and improved stereographic analysis, especially in inaccessible areas. The combination of manual measurements and SfM provided a more comprehensive dataset for the geomechanical classification of the cave. The 3D model proved essential for analyzing remote and higher zones, which are critical for accurate stability assessments.
Given the identified potential instabilities, installing monitoring equipment, such as clinometers and crackmeters, at the cave entrance and Sala de la Mesita to detect any displacements over time is recommended. Periodic photogrammetry scans should also be conducted to capture changes in the cave’s geometry and ensure early detection of any structural movements.
This study demonstrates the effectiveness of combining empirical geomechanical classification with remote-sensing and numerical methods for assessing cave stability. The methodology employed here offers a robust framework for similar assessments in other natural caves, providing a blend of field data, sophisticated modeling and innovative remote-sensing techniques to evaluate cave stability.
Author Contributions
Conceptualization, L.J.B. and A.B.; methodology, A.B., S.S.D. and L.J.B.; software, A.B. and S.S.D.; validation, H.C.G.; formal analysis, C.C.R. and L.J.B.; investigation, A.B. and H.C.G.; resources, H.C.G., C.C.R. and L.J.B.; data curation, A.B. and L.J.B.; writing—original draft preparation, A.B. and L.J.B.; writing—review and editing, S.S.D. and C.C.R.; visualization, A.B.; supervision, C.C.R. and L.J.B.; project administration, H.C.G. and C.C.R. and L.J.B. All authors have read and agreed to the published version of the manuscript.
Funding
This research received no external funding.
Data Availability Statement
The original contributions presented in the study are included in the article, further inquiries can be directed to the corresponding author.
Acknowledgments
This research is part of a PhD thesis in the Engineering of Structures, Foundations, and Materials program at the Escuela de Ingeniería de Caminos, Canales y Puertos, Universidad Politécnica de Madrid. The authors would like to thank the Agustín de Betancourt Foundation for their support.
Conflicts of Interest
The authors declare no conflicts of interest.
References
- Jordà-Bordehore, L. Stability Assessment of Natural Caves Using Empirical Approaches and Rock Mass Classifications. Rock Mech. Rock Eng. 2017, 50, 2143–2154. [Google Scholar] [CrossRef]
- Hoffmann, D.L.; Standish, C.D.; García-Diez, M.; Pettitt, P.B.; Milton, J.A.; Zilhão, J.; Alcolea-González, J.J.; Cantalejo-Duarte, P.; Collado, H.; De Balbín, R.; et al. U-Th dating of carbonate crusts reveals Neandertal origin of Iberian cave art. Science 2018, 359, 912–915. [Google Scholar] [CrossRef]
- Collado, H.; García, J.J. Arte Rupestre Paleolítico en la Cueva de Maltravieso (Cáceres, España); Consejería de Cultura, Turismo y Deporte: Mérida, Spain, 2022. [Google Scholar]
- Benrabah, A.; Domínguez, S.S.; Bordehore, L.J.; Alonzo, D.A.; Herrero, A.D.; de Andrés Herrero, M. Preliminary Assessment of Badajo Cave (Segovia, Spain) Stability Using Empirical, Numerical and Remote Techniques. IOP Conf. Ser. Earth Environ. Sci. 2024, 1295, 012011. [Google Scholar] [CrossRef]
- Barton, N.; Bieniawski, Z. RMR and Q-setting records straight. Tunn. Tunn. Int. 2008, 2, 26–29. [Google Scholar]
- Bastidas, G.; Soria, O.; Mulas, M.; Loaiza, S.; Bordehore, L.J. Stability Analysis of Lava Tunnels on Santa Cruz Island (Galápagos Islands, Ecuador) Using Rock Mass Classifications: Empirical Approach and Numerical Modeling. Geosciences 2022, 12, 380. [Google Scholar] [CrossRef]
- Rodríguez, G.; Mulas, M.; Loaiza, S.; Echeverria, M.D.P.V.; Yanez Vinueza, A.A.; Larreta, E.; Jordá Bordehore, L. Stability Analysis of the Volcanic Cave El Mirador (Galápagos Islands, Ecuador) Combining Numerical, Empirical and Remote Techniques. Remote Sens. 2023, 15, 732. [Google Scholar] [CrossRef]
- Brandi, I.V.; Barbosa, M.R.; Barata, A.; de Paula, R.G.; Correa, T.; Mota, H.; Lima, D.; Osborne, R.A.; Vale, S.A.; Lima, N.; et al. Cave Geomechanical Index (CGI). Classification and Contribution to the Conservation of Natural Caves in the Iron Mines. Geoconserv. Res. 2021, 3, 134–161. [Google Scholar] [CrossRef]
- Jordá Bordehore, L.; Riquelme, A.; Tomás, R.; Cano, M. Análisis Estructural y Geomecánico En Zonas Inaccesibles de Cavernas Naturales Mediante Técnicas Fotogramétricas: Aplicación En La Entrada de La Cueva de Artá (Mallorca). El Karst Y El Hombre Las Cuevas Como Patrim. Mund. 2016, 528, 255–265. [Google Scholar]
- Benrabah, A.; Senent Domínguez, S.; Carrera-Ramírez, F.; Álvarez-Alonso, D.; de Andrés-Herrero, M.; Jorda Bordehore, L. Structural and Geomechanical Analysis of Natural Caves and Rock Shelters: Comparison between Manual and Remote Sensing Discontinuity Data Gathering. Remote Sens. 2024, 16, 72. [Google Scholar] [CrossRef]
- García-Luna, R.; Senent, S.; Jurado-Piña, R.; Jimenez, R. Structure from Motion photogrammetry to characterize underground rock masses: Experiences from two real tunnels. Tunn. Undergr. Space Technol. 2019, 83, 262–273. [Google Scholar] [CrossRef]
- Callejo Carbajo, A.; Aguilar, J.C.; García, J.J.; Collado, H. Historia de la Investigación. In Arte Rupestre Paleolítico en la Cueva de Maltravieso (Cáceres, España); Consejería de Cultura, Turismo y Deporte: Mérida, Spain, 2022; Volume I, pp. 31–45. [Google Scholar]
- Callejo Serrano, C. La Cueva Prehistórica de Maltravieso junto a Cáceres; Publicaciones de la Biblioteca Pública de Cáceres: Cáceres, Spain, 1958; p. 45. [Google Scholar]
- Bieniawski, Z. Errors in the Application of Geomechanical Classifications and Their Correction; Ingeopres: Madrid, Spain, 2011; Volume 208, pp. 10–21. [Google Scholar]
- Barton, N.; Lien, R.; Lunde, J. Enginnering Classification of Rock Masses for the Design of Tunnel Support. Rock Mech. Rock Eng. 1974, 6, 189–236. [Google Scholar] [CrossRef]
- Barton, N. Unsupported underground openings. In Proceedings of the Rock Mechanics Discussion Meeting, Befo, Swedish Rock Mechanics Research Foundation, Stockholm, Sweden, 10 February 1976; pp. 61–94. [Google Scholar]
- Bieniawski, Z.T. Engineering Classification of jointed rock Masses. Trans. S. Afr. Inst. Civ. Eng. 1973, 15, 335–344. [Google Scholar]
- Laubscher, D.H. Geomechanics classification of jointed rock masses: Mining applications. Inst. Min. Metall. Trans. Sect. 1977, 86, 1–8. [Google Scholar]
- Agisoft Metashape Software Manual, Professional Edition, Version 1.6; Agisoft LLC: Petersburg, Russia, 2018.
- Girardeau-Montaut, D; CloudCompare, Open Source Project. 2017. Available online: https://www.danielgm.net/cc/ (accessed on 14 July 2022).
- Jordà-Bordehore, L.; García, R.; Alonso-Zarza, A.; Romero, C. Stability assessment of shallow limestone caves through an empirical approach: Application of the stability graph method to the Castañar Cave study site (Spain). Bull. Eng. Geol. Environ. 2016, 75, 1469–1483. [Google Scholar] [CrossRef]
- Rocscience. UnWedge Software v5.016; Rocscience: Toronto, ON, Canada, 2019; Available online: https://www.rocscience.com/software/unwedge (accessed on 27 June 2022).
- Barton, N.R.; Bandis, S.C. Characterization and Modelling of the Shear Strength, Stiffness and Hydraulic Behaviour of Rock Joints for Engineering Purposes. In Rock Mechanics and Engineering; Feng, X.-T., Ed.; Taylor & Francis: Abingdon, UK, 2017; Volume 1, Chapter 1; pp. 3–40. [Google Scholar]
- Waltham, A.C.; Fookes, P.G. Engineering Classification of Karst Ground Conditions. Q. J. Eng. Geol. Hydrogeol. 2003, 36, 101–118. [Google Scholar] [CrossRef]
Figure 1.
General Plan of the Maltravieso Cave Indicating Chambers and Connecting Corridors.
Figure 1.
General Plan of the Maltravieso Cave Indicating Chambers and Connecting Corridors.
Figure 2.
Location and geological context of the Maltravieso cave and general views: (a) location of the study site; (b) view of the entrance to the cave; (c) Interpretation Center of Maltravieso Cave; (d) Maltravieso Park and (e) the geological setting of the study area.
Figure 2.
Location and geological context of the Maltravieso cave and general views: (a) location of the study site; (b) view of the entrance to the cave; (c) Interpretation Center of Maltravieso Cave; (d) Maltravieso Park and (e) the geological setting of the study area.
Figure 3.
Flow diagram for the method carried out at the Maltravieso Cave.
Figure 3.
Flow diagram for the method carried out at the Maltravieso Cave.
Figure 4.
Principle of SfM photogrammetry for 3D object modeling [
10].
Figure 4.
Principle of SfM photogrammetry for 3D object modeling [
10].
Figure 5.
Three-dimensional (3D) point cloud obtained with Agisoft metashape Professional. Blue rectangles represent the position of the photographs taken (view from outside the entrance).
Figure 5.
Three-dimensional (3D) point cloud obtained with Agisoft metashape Professional. Blue rectangles represent the position of the photographs taken (view from outside the entrance).
Figure 6.
Portable orientation template, adapted and modified from [
10]: (
a) the template used; (
b) GCPs coordinates in (m). (Axis with green coler should be oriented to the North, Axis with red coler should be oriented to the East, Blue is the horzonal reference and yellow is the maximum slope).
Figure 7.
Orientation measurements and discontinuities analysis of Maltravieso cave (using CloudCompare software v2.12.4.
Figure 7.
Orientation measurements and discontinuities analysis of Maltravieso cave (using CloudCompare software v2.12.4.
Figure 8.
Three-dimensional (3D) point cloud views (screenshot from the software Cloudcompare v2.12.4): (a) the entrance; (b) the Sala de la Mestita chamber and (c) the Sala de las Chimeneas chamber.
Figure 8.
Three-dimensional (3D) point cloud views (screenshot from the software Cloudcompare v2.12.4): (a) the entrance; (b) the Sala de la Mestita chamber and (c) the Sala de las Chimeneas chamber.
Figure 9.
Pole concentration diagram of the GS1 at entrance obtained from (a) manual measurements using a compass (N = 11 poles); (b) measurements acquired from 3D point cloud with Cloud Compare (39 poles); and (c) average orientations of the discontinuity sets derived from the combination of data presented in (a,b).
Figure 10.
Pole concentration diagram of the GS2 at Sala de la Mesita chamber obtained from (a) manual measurements using a compass (n = 10 poles); (b) measurements acquired from 3D point cloud with Cloud Compare (40 poles); and (c) average orientations of the discontinuity sets derived from the combination of data presented in (a,b).
Figure 11.
Empirical methodologies Barton’s Q Index and CGI graph. Adapted and modified from Jorda 2017 [
1].
Figure 11.
Empirical methodologies Barton’s Q Index and CGI graph. Adapted and modified from Jorda 2017 [
1].
Figure 12.
Analysis in Exmine2D (GS1 entrance): (a) Strength factor tension; (b) Total displacements.
Figure 12.
Analysis in Exmine2D (GS1 entrance): (a) Strength factor tension; (b) Total displacements.
Figure 13.
Analysis in Exmine2D (GS2 Sala de la Mesita chamber): (a) strength factor tension and (b) total displacements.
Figure 13.
Analysis in Exmine2D (GS2 Sala de la Mesita chamber): (a) strength factor tension and (b) total displacements.
Figure 14.
Wedge analysis wedges formed around the cave: (a) Entrance; (b) Sala de la Mesita chamber.
Figure 14.
Wedge analysis wedges formed around the cave: (a) Entrance; (b) Sala de la Mesita chamber.
Table 1.
Q-system rock mass classification description. Adapted from [
15,
16].
Table 1.
Q-system rock mass classification description. Adapted from [
15,
16].
| Q Index | Definition Q Rating |
|---|
| 0.001–0.01 | Exceptionally poor |
| 0.01–0.1 | Extremely poor |
| 0.1–1 | Very poor |
| 1–4 | Poor |
| 4–10 | Fair |
| 10–40 | Good |
| 40–100 | Very Good |
Table 2.
Rock mass rating (RMR) classification. Adapted from [
14,
17].
Table 2.
Rock mass rating (RMR) classification. Adapted from [
14,
17].
| RMR | 100–81 | 80–61 | 60–41 | 40–21 | <20 |
|---|
| Class | I | II | III | IV | V |
| Rock quality | Very good | Good | Fair | Poor | Very poor |
Table 3.
Values of αRMR assigned to Rock mass rating (RMR) used in the CGI. Adapted from [
8].
Table 3.
Values of αRMR assigned to Rock mass rating (RMR) used in the CGI. Adapted from [
8].
| RMR | 100–81 | 80–61 | 60–41 | 40–21 | <20 |
|---|
| Class | Very good | Good | Fair | Poor | Very poor |
| Rating (αRMR) | 60 | 45 | 30 | 15 | 0 |
Table 4.
Hydraulic radius from CGI. Adapted from [
8].
Table 4.
Hydraulic radius from CGI. Adapted from [
8].
| Hydraulic Radius | 0.00–0.91 m | 0.92–1.82 m | 1.83–3.0 m |
|---|
| Class | Small | Regular | Large |
| Rating (β HR) | 25 | 15 | 0 |
Table 5.
Type sections of the three classes of the ceiling shape. Adapted from [
8].
Table 6.
Ceiling thickness. Adapted from [
8].
Table 6.
Ceiling thickness. Adapted from [
8].
| Ceiling Thickness | 0.00–3.31 m | 3.32–7.64 m | 7.65–10 m |
|---|
| Class | Small | Regular | Large |
| Rating (δ CT) | 0 | 2 | 5 |
Table 7.
CGI types and their levels of susceptibility to structural instability. Adapted from [
8].
Table 7.
CGI types and their levels of susceptibility to structural instability. Adapted from [
8].
| CGI | Instability of Cave Span | Color |
|---|
| 81–100 | Very Low | |
| 61–80 | Low | |
| 41–60 | Moderate | |
| 21–40 | High | |
| 0–20 | Very High | |
Table 8.
Errors of (x, y, z) coordinates of GCPs within the 3D model and total RMS errors.
Table 8.
Errors of (x, y, z) coordinates of GCPs within the 3D model and total RMS errors.
| GCPs | x Error (mm) | y Error (mm) | z Error (mm) | Total (mm) |
|---|
| 1 | 0.721978 | 0.118777 | 0.988956 | 1.2302 |
| 2 | −0.202036 | 0.349822 | 0.000628 | 0.4039 |
| 3 | 1.39599 | 0.000549 | 0.995535 | 171,461 |
| 4 | −0.4557 | −0.315441 | −0.003490 | 0.5542 |
| 5 | 0.14955 | −0.22081 | −0.672444 | 0.7233 |
| Total | 0.740389 | 0.238639 | 0.695891 | 1.0473 |
Table 9.
Hoek-Brown failure envelope: parameters and corresponding values.
Table 9.
Hoek-Brown failure envelope: parameters and corresponding values.
| Parameter | Value |
|---|
| σc | 68 MPa |
| GSI | 65 |
| mi | 10 |
| D | 0 |
| γ | 0.2 MN/m3 |
| Erm | 27,416.62 MPa |
Table 10.
Shear strength of joints.
Table 10.
Shear strength of joints.
| Parameter | Value |
|---|
| C (joints) | 0 |
| φp | 44.45° |
Table 11.
Parameter used to characterize discontinuities.
Table 11.
Parameter used to characterize discontinuities.
| Parameters | Acquisition | Data Source |
|---|
| Strength of intact rock material | PLT, uniaxial compressive strength | Field, laboratory |
| RQD | geometric analysis | Field, SfM |
| Spacing | geometric analysis | Field, SfM |
| Persistence | Geometric analysis | Field, SfM |
| Opening | Geometric analysis | Field, SfM |
| Roughness | Geometric analysis | Field, SfM |
| Filling | Geometric analysis | Field, images |
| Alteration | Visual inspection | Field, images |
| Groundwater | Visual inspection | Field |
Table 12.
Geomechanical characteristic parameters and values of RMR.
Table 12.
Geomechanical characteristic parameters and values of RMR.
| Parameters | Entrance | GS
Sala de la Mesita Chamber | Sala de las Chemineas Chamber |
|---|
RMR1
RMR2
RMR3 | 7 | 7 | 7 |
| 20 | 15 | 20 |
| 10 | 10 | 10 |
| RMR4 | Persistence
Aperture
Roughness
Infilling
Weathering | 2 | 2 | 6 |
| 5 | 5 | 5 |
| 5 | 3 | 6 |
| 5 | 6 | 5 |
| 6 | 5 | 7 |
RMR5
RMR Basic
RM corrected | 15 | 7 | 7 |
| 75 | 60 | 68 |
| 65 | 50 | 58 |
| Quality | Good | Faire | Faire |
Table 13.
Geomechanical characteristic parameters and ratings of the Q index.
Table 13.
Geomechanical characteristic parameters and ratings of the Q index.
| Parameters | Entrance | GS
Sala de la Mesita Chamber | Sala de las Chemineas Chamber |
|---|
| RQD (%) | 90 | 75 | 100 |
| Jn | 9 | 9 | 1 |
| Jr | 3 | 3 | 1.5 |
| Ja | 2 | 2 | 0.75 |
| Jw | 1 | 0.66 | 0.66 |
| SRF | 5 | 5 | 5 |
| Q | 3 | 1.65 | 26.4 |
| Quality | Poor | Poor | Poor |
Table 14.
Determination of the CGI from the defined geomechanical stations.
Table 15.
Resume of the results of the wedge analysis.
Table 15.
Resume of the results of the wedge analysis.
| Wedge | Wedge | Safety Factor | Observation |
|---|
| Entrance | 1a | <1 | Partially fallen + Cracks |
| 2a | >1.5 | Stable |
| Sala de la Mesita chamber | 1b | <1 | Unstable block + Cracks |
| 2b | <1 | Partially fallen + Cracks |
| 3b | <1 | Partially fallen + Cracks |
| Disclaimer/Publisher’s Note: The statements, opinions and data contained in all publications are solely those of the individual author(s) and contributor(s) and not of MDPI and/or the editor(s). MDPI and/or the editor(s) disclaim responsibility for any injury to people or property resulting from any ideas, methods, instructions or products referred to in the content. |
© 2024 by the authors. Licensee MDPI, Basel, Switzerland. This article is an open access article distributed under the terms and conditions of the Creative Commons Attribution (CC BY) license (https://creativecommons.org/licenses/by/4.0/).
