Abstract
In the context of global warming, rising air temperatures are increasing evapotranspiration () in all agricultural crops, including rice, a staple food worldwide. Simultaneously, the occurrence of droughts is reducing water availability, affecting traditional irrigation methods for rice cultivation (flood irrigation). The objective of this study was to determine (water use) and yield performance in rice crop under different irrigation regimes: treatments with continuous flood irrigation (CF) and irrigations with alternating wetting and drying (, , and ) in an experimental area in INIA–Vista Florida. Water balance, rice physiological data, and yield were measured in the field, and local weather data and thermal and multispectral images were collected with a meteorological station and a UAV (a total of 13 flights). values obtained by applying the METRICTM (Mapping Evapotranspiration at High Resolution using Internalized Calibration) energy balance model ranged from 2.4 to 8.9 mm d−1 for the AWD and CF irrigation regimes. In addition, was estimated by a water balance using the AquaCrop model, previously parameterized with RGB image data and field weather data, soil, irrigation water, and crops, obtaining values between 4.3 and 7.1 mm d−1 for the AWD and CF irrigation regimes. The results indicated that AWD irrigation allows for water savings of 27 to 28%, although it entails a yield reduction of from 2 to 15%, which translates into an increase in water use efficiency (WUE) of from 18 to 36%, allowing for optimizing water use and improving irrigation management.
1. Introduction
Peru is one of the nations facing moderate-to-significant water scarcity, with a water extraction-to-availability ratio ranging from 20–40% [1]. Rice, which requires a lot of water for cultivation, stands as one of the most water-demanding crops [2]. In 2022, Peru produced 3 million tons of paddy rice, mainly in the regions of Lambayeque and La Libertad [3]. In these areas, 82% of rice farming uses flooded irrigation, while 18% depends on rainfall [4]. Flooded irrigation, which uses between 12,000 and 20,000 of water, leads to increased water tables and soil salinization [5], resulting in lower productivity and reduced agricultural land in coastal valleys.
To tackle these issues, adopting innovative agricultural technologies that improve irrigation efficiency and cut down water usage is crucial. Traditional continuous flooding (CF) uses large water volumes [6]. Alternative methods, like alternating wetting and drying (AWD), have shown that they can significantly reduce water use while maintaining crop yields and lessening environmental harm. Research from places such as Burkina Faso, Egypt, and Peru indicates that AWD can cut methane emissions by up to 80% and improve nitrogen efficiency in soils [7,8,9,10]. AWD not only decreases water input by up to 34% compared to conventional methods but also provides a cost-effective alternative for farmers in areas where advanced irrigation technologies, like drip irrigation, are impractical [8]. Moreover, AWD has been found to enhance soil health and reduce the build-up of harmful elements, like arsenic, in rice grains, making it an environmentally sustainable choice [11].
Other promising alternatives to conventional irrigation systems include aerobic rice systems, the system of rice intensification (SRI), saturated soil culture (SSC), direct seeding rice (DSR), drip irrigation, and automated surface gravity irrigation systems [12,13]. AWD, which involves intermittent and scheduled flooding, ensures adequate water supply during key growth phases while cutting overall water consumption, thus avoiding negative effects on yield and grain quality [2,14]. The main benefit of AWD is its capacity to reduce water usage by up to 34% while maintaining yields comparable to traditional methods [15]. Unlike drip irrigation, which might be less viable for large-scale farming due to high costs and complexity, AWD offers a more accessible and economical option for farmers. Additionally, AWD has been shown to boost soil health and decrease the accumulation of harmful substances like arsenic in rice grains, making it an eco-friendly approach [11].
Water scarcity is becoming an increasingly pressing challenge in rice farming [16]. The water needed for the crop depends on crop evapotranspiration (), which represents the water consumed by a cultivated area. ET is affected by climatic factors such as air temperature, wind speed, solar radiation, relative humidity, and sunshine hours, as well as crop characteristics like vegetation height, phenological stage, and planting density [17].
Traditional methods for obtaining ET include water balances with lysimeters, moisture sensors, and models like AquaCrop–FAO, which are parameterized with climate, soil, irrigation water, and crop data [18]. However, these methods are expensive and provide localized information for specific crops [17,19]. The use of remote sensors offers ongoing image data across the electromagnetic spectrum, enabling the characterization of crop phenology, soil, and water conditions [19]. Remote sensors and surface energy balance techniques allow for the estimation of .
Numerous studies have investigated , water use efficiency (WUE), and AWD in rice cultivation under various climatic conditions, irrigation systems, and estimation methods. values vary widely across regions, reflecting local climate and irrigation practices. For instance, in warm arid climates, drip irrigation studies in Peru reported values ranging from 1.65 to 7.48 using energy balance methods like METRIC [20], while similar conditions in Iran and Pakistan showed values between 2 and 8.51 using water balance methods [21,22]. Research in humid tropical climates, such as the Ivory Coast and Burkina Faso, revealed values of from 0 to 6.17 under flooded conditions using energy balance techniques [23,24]. Additionally, studies incorporating AWD in temperate arid regions, such as Peru, demonstrated values between 6.54 and 7.07 [25], highlighting AWD’s potential to improve WUE while reducing water consumption. AWD has proven particularly effective in arid and semi-arid climates, where water conservation is critical [8,9]. These findings, using methods from traditional water balances [26] to advanced machine learning models [27], offer valuable context for understanding AWD’s effectiveness in enhancing water efficiency and maintaining rice productivity under diverse environmental conditions.
The METRICTM method (Mapping Evapotranspiration at High Resolution using Internalized Calibration) is an algorithm that estimates as a residual of the energy balance using remotely sensed images [28]. METRICTM provides data in the visible, near-infrared, and thermal spectra at daily, monthly, or full-season scales and has been applied in ET estimation for various crops such as barley [29], wheat [30], and maize [31]. High-resolution images enhance surface classification (soil and plant) in heterogeneous fields, improving METRICTM model performance [32].
The aim of this study was to evaluate both and WUE in rice crops in northern Peru under different irrigation regimes, including AWD and CF, in an experimental area in northern Peru. This region faces limited water resources, making the optimization of water use in agriculture essential. By providing accurate data on and WUE, this research offers valuable insights for improving irrigation management and promoting more efficient water use in rice cultivation under arid conditions. This, in turn, supports sustainable agricultural development on the coast of Peru.
2. Materials and Methods
Figure 1 depicts the research methodology employed in this study, which took place during the rice growing season from December to June.
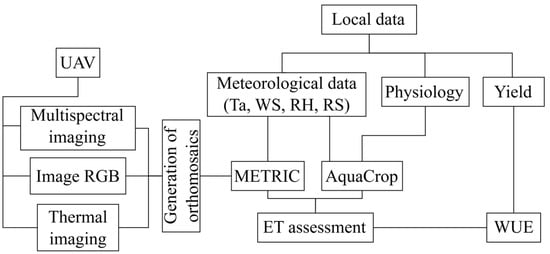
Figure 1.
Flow diagram of the methodology followed in this study.
2.1. Study Area
This research was carried out in the Lambayeque region, located on the northern coast of Peru at an altitude of 35 m above sea level. An experimental area was established to apply the AWD and CF irrigation systems. The experiment was carried out in the rice fields of the Experimental Agricultural Station (EEA) “Vista Florida”, belonging to the National Institute for Agrarian Innovation (INIA), located in the district of Picsi, province of Chiclayo (Figure 2).
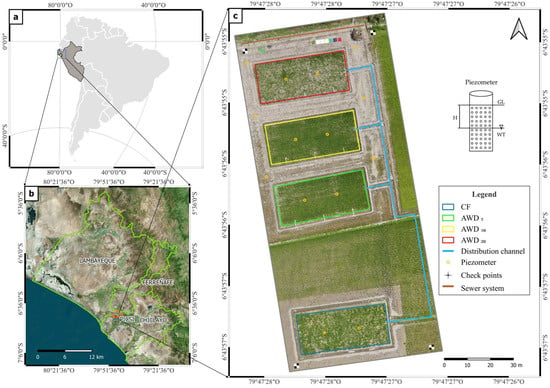
Figure 2.
Study area: (a) geographical location; (b) Lambayeque region; (c) Experimental Agricultural Station (EEA) “Vista Florida” with four plots of each, divided into three subplots of m, with two irrigation regimes of continuous flooding (CF) and alternating wetting and drying (AWD), the latter having water levels at 5 cm, 10 cm, and 20 cm below the soil surface level (, and ).
The experimental area at INIA–Vista Florida is characterized by a sandy loam soil with 26% sand, 39% clay, and 35% silt. The soil has a bulk density (da) of 1.41 g and a real density (dr) of 2.7 g, resulting in a porosity of 47.2%. The field capacity (FC) is 29.8%, and the permanent wilting point (PWP) is 16.3%. The soil has an electrical conductivity (EC) of 0.4 dS , with a hydrogen potential (pH) of 7.6. The cation exchange capacity (CEC) is 220 meq . Additionally, the soil contains 1.2% organic matter (OM), 0.1% total nitrogen (N), 4% calcium carbonate (), 12 ppm phosphorus (P), and 376 ppm potassium (K). These analyses were conducted at the Soil, Plant, Water, and Fertilizer Analysis Laboratory of the Faculty of Agronomy—UNALM. It is important to note that composite samples were collected from the four treatments in the experiment, ensuring that the soil properties were representative of the entire study area.
At the start of the experiment, the groundwater table depth was approximately 1 m across the entire study area. However, following irrigation events, a gradient was induced, leading to lateral flow. To manage this flow, the plots were divided into transverse zones specifically designed to mitigate lateral movement. Although the groundwater initially maintained a relatively uniform depth, variations were observed due to contributions and losses from percolation, largely influenced by soil texture. These factors led to localized fluctuations, but the overall groundwater depth remained within a consistent range across all plots.
2.2. Irrigation Management
The water supply for irrigation came from a canal supplied by the Tinajones reservoir, which is managed by the Capote irrigation commission. Throughout the different stages of plant growth (vegetative, reproductive, and maturation), a total of sixteen, three, and five irrigation cycles were carried out, respectively (Figure S1). The initial treatment consisted of continuous or traditional flood irrigation (CF), while the water-saving treatments used alternating wetting and drying (AWD) irrigation with water levels at a depth of 5 cm, 10 cm, and 20 cm below the soil surface (), with the water level monitored using piezometers [33]. The study design was as an observational experiment, with four plots of 24 × 11 m each.
The chemical characteristics of the irrigation water were as follows: pH 7.34, EC 0.31 dS , cations (1.91; 0.43; 0.59; 0.10) meq , and anions ( 1.00; 1.89; 0.29) meq . The irrigation water was classified as C2-S1, indicating a low sodium content and salinity. The sodium absorption ratio (SAR) was 0.55.
The INIA 515-Capoteña rice variety was planted on 2 January 2023, using the almacigo technique. Thirty days post sowing (DPS), two seedlings were transplanted per stroke, with a spacing of 0.25 cm × 0.25 cm (Table 1). The N-P-K fertilization dose was 250–106–60 in the form of urea, diammonium phosphate, and potassium sulfate, respectively. During transplanting, 100% P and K and 30% N were applied. The rest of the nitrogen fertilizer was distributed equally in the early tillering, panicle initiation, early flowering, and peak flowering stages [34].

Table 1.
Description of drone dates and days post sowing (DPS) in the experimental area.
The development of the crop was assessed using growing degree days (GDD) from planting, establishing a base temperature of 10 °C, which is a typical threshold for rice cultivation. This index has proven effective for monitoring rice growth and development, enabling better planning of agricultural management practices and optimizing water usage. Furthermore, the application of GDD in modeling rice growth, as detailed in the study by Porras-Jorge et al. [18], provides a valuable tool for predicting yield under various irrigation management conditions, such as alternating wetting and drying (AWD). This approach can contribute to improving water use efficiency and the sustainability of rice production in changing climatic contexts.
Insecticides were applied to control Chironomus sp. and Hydrellia wirthii, which caused problems during the vegetative stage (75 DPS) [35]. In addition, fungicides were applied at the milky grain stage (136 DPS) to prevent disease caused by the fungus Ustilaginoidea virens.
2.3. Estimation of Crop Evapotranspiration ()
Figure 3 illustrates the step-by-step process for estimating crop evapotranspiration (), adapted from the approach by Ramos-Fernández et al. [25], with modifications specific to this study. This estimation utilized remote sensing data and field measurements, incorporating UAV flights and climate data collection, as described below.
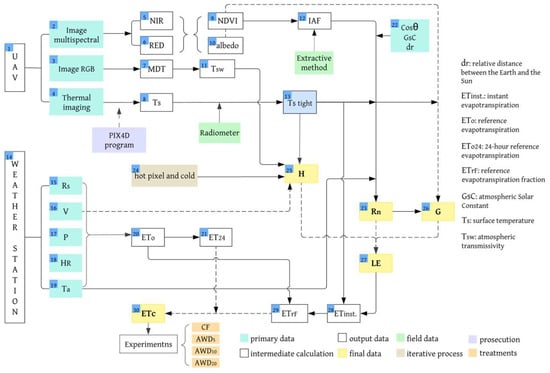
Figure 3.
Flow chart for the calculation of evapotranspiration.
Initially, UAV flights (1) were performed to gather multispectral (2), RGB (3), and thermal (4) images of the rice fields. From the NIR (5) and RED (6) bands, albedo (α) (10) and vegetation indices like the NDVI (9) and Leaf Area Index (LAI) (12) were calculated, with the LAI values refined using field data for enhanced accuracy. A Digital Terrain Model (DTM) (7) was also derived from the RGB orthomosaic (3), and atmospheric transmissivity (TSW) (11) was estimated based on the DTM (7).
Climate data (14) were collected using a portable automatic weather station (ATMOS 41), which recorded solar radiation (RS) (15), wind speed (V) (16), atmospheric pressure (P) (17), relative humidity (HR) (18), and air temperature (Ta) (19). These data facilitated the calculation of the reference evapotranspiration () (20) using the FAO Penman–Monteith method, from which the daily reference evapotranspiration () (21) was derived.
The surface temperature (Ts) (8) was extracted from the thermal imagery (4) and adjusted with field data from a radiometer to estimate the corrected surface temperature (TS adjusted) (13). Net radiation (Rn) (23) was computed using the solar zenith angle (Cosθ), solar constant (GsC), and inverse relative distance Earth–Sun (dr) (22), combined with the LAI (12), air temperature (Ta) (19), and adjusted surface temperature (TS adjusted) (13).
To estimate the sensible heat flux (H) (25), the hot and cold pixel method (24) was applied, along with the LAI (12), atmospheric transmissivity (TSW) (11), wind speed (V) (16), and adjusted surface temperature (Ts adjusted) (13). The instantaneous evapotranspiration () (28) was then determined based on the adjusted surface temperature (Ts adjusted) (13).
The soil heat flux (G) (26) was calculated using the net radiation (Rn) (23), albedo (10), adjusted surface temperature (Ts adjusted) (13), and NDVI (9). The latent heat flux (LE) (27) was derived by subtracting the soil heat flux (G) (26) and sensible heat flux (H) (25) from the net radiation (Rn) (23). The reference evapotranspiration fraction () (29) was determined using the reference evapotranspiration () (20) values. Finally, the crop evapotranspiration () (30) was estimated by multiplying the reference evapotranspiration fraction () (29) by the daily reference evapotranspiration () (21). All data processing was conducted using QGIS plugins, and the methods were validated with in-field measurements to ensure accuracy in estimating .
2.4. Field Measurements and Yield Data
2.4.1. Image Acquisition and Thermal Analysis for Crop Monitoring
Data were collected using a state-of-the-art Parrot Sequoia multispectral camera (Parrot S.A., Paris, France) and a high-performance Zenmuse H20T radiometric thermal camera (DJI, Shenzhen, China). The multispectral camera includes a 16 MP RGB camera and captures images in four multispectral bands: green (550 nm), red (660 nm), red edge (735 nm), and near-infrared (790 nm). It also features a 1.2 MP global shutter and a “Sunshine” sensor that measures sunlight intensity in these same spectral bands, which enhanced the accuracy of the data collected.
The thermal camera features an advanced uncooled VOx microbolometer sensor with a 40.6° DFOV lens, a 13.5 mm focal length, and a focus of 5 m at ∞. The camera can capture thermal and optical images in radiometric RGB and TIF formats, with a temperature measurement range of from 8 to 14 μm and a thermal resolution of 640 × 512 pixels. Its accuracy is ±2 °C, tested at 25 °C in a windless laboratory at 5 m from a blackbody. In addition, a laser rangefinder was used with an accuracy of ±(0.2 m + D × 0.15%), where D is the distance to a vertical surface, providing precise distance measurements necessary for accurate image acquisition.
Both cameras were mounted on highly capable Matrice 300 RTK remotely piloted aircraft (UAV) (DJI, Shenzhen, China). The UAV has a vertical and horizontal GPS displacement accuracy of ±0.1 m and ±0.3 m, respectively. The flights were conducted at an altitude of 45 m between 09:00 and 11:30 h on clear days. Thermal information was adjusted using temperature data measured on nine different canopy surfaces (e.g., aluminum, dry leaves, green leaves, expanded polystyrene) placed within a 1 × 1 m PVC frame. Temperature measurements of these surfaces were carried out with an Apogee MI-210 radiometer (MI-210; Apogee Instruments, Inc., Logan, UT, USA) at a height of 40 cm, with a total of 81 readings collected per flight between 11 February and 2 June 2023, [4].
2.4.2. Measurement of Normalized Difference Vegetation Index (NDVI) and Leaf Area Index (LAI)
Twenty-five plants were selected from areas adjacent to the continuous flooding (CF) field. For each of these plants, the Normalized Difference Vegetation Index (NDVI) was measured, and biomass was collected to calculate the Leaf Area Index (LAI) and establish a correlation equation.
The NDVI, which is an index related to the energy absorption of plant leaves [29], was measured using a portable Trimble GreenSeeker™ reflectometer. Readings were taken at a height of 60 cm above the plants, with three measurements per plant, yielding a total of 75 readings throughout the crop development stages. The methodology for recording NDVI measurements was similar to that used by Fan et al. [36].
The LAI, an indicator of the radiation absorbed by plants during photosynthesis, was estimated using an extractive method. First, the aerial parts of each plant were harvested, followed by the separation of the leaves, which were then placed on a 1 × 1 m expanded polystyrene sheet. The leaves were classified by size and photographed to determine their leaf area using the QGIS 3.32 software. Finally, the leaf area was normalized by dividing it by the reference area corresponding to a plant spacing of 0.2 × 0.2 . This procedure was consistently applied to the 25 plants used for NDVI measurement.
2.4.3. Meteorological Conditions
Meteorological information, including wind speed (WS, ), air temperature (Ta, °C), relative humidity (RH, %), and solar radiation (SR, ), were recorded using an ATMOS-41 portable automatic station (METER, Pullman, WA, USA). This station was linked to a ZL6 data logger and positioned 2 m above the ground at the center of the experimental field. Data collection occurred continuously every 5 min during the UAV flight days. The SDI-12 digital communication system enabled data transfer from the environmental sensors to the data logger, ensuring efficient and precise data recording.
To compute the reference evapotranspiration (ET0), the collected meteorological data were analyzed using the FAO Penman–Monteith method, which takes into account the air temperature, relative humidity, wind speed, solar radiation, and atmospheric pressure. The hourly ET0 values were aggregated to calculate the daily evapotranspiration (ET0-24) for each day.
2.4.4. Yield Performance Assessment of INIA 515-Capoteña
The yield of rice varieties in this study was measured manually between 154 and 156 days post sowing (DPS). Yield replicates were measured in each treatment to ensure reliability of the results. For yield estimation, the de-husked grains of the INIA 515-Capoteña variety were harvested when the moisture content was approximately 16%, ensuring that the final moisture content at weighing was around 14%. Grain moisture was measured using a WILE-55 device (WILE, Helsinki, Finland), which provides readings for rice grains within a moisture content range of from 8% to 30%, with an accuracy of ±0.5% over a temperature range of from 0 °C to 40 °C.
The hulled grain of the INIA 515-Capoteña variety is slender and transparent, yielding a higher proportion of whole hulled rice compared to the IR-43 variety, albeit slightly lower than that of the INIA 508-Tinajones variety. This variety has an intermediate growth cycle, requiring approximately 150 days from sowing to maturation. Its yield potential exceeds that of the IR-43 variety, with experimental plots in Chepén (La Libertad) achieving up to 14.0 t of paddy rice and 13.0 t being achieved in the Fala sector (Lambayeque). Additionally, commercial plots have reported yields exceeding 12.0 t of paddy rice [37,38].
To analyze the yield, tests for normality and homogeneity of variances were conducted, followed by an analysis of variance (ANOVA) to determine significant differences between treatments. The ANOVA results indicated that there were no significant differences in yield among the treatments (p > 0.05). The Tukey HSD test further confirmed the absence of significant differences in yield concerning the CF treatment. Figure 4 shows that there were no significant differences in yield among the treatments evaluated.
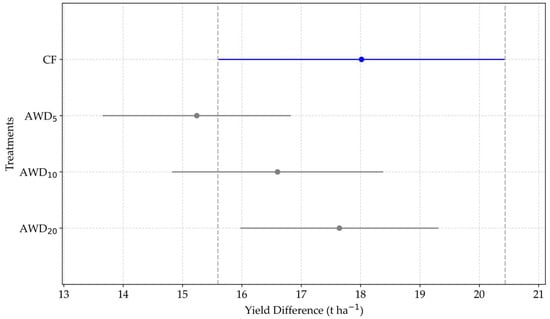
Figure 4.
Tukey’s HSD test: comparisons of treatments with CF.
2.5. Generation of Orthomosaics for Temperature, NDVI, LAI, and Albedo
Image preprocessing was carried out using the photogrammetric software Pix4Dmapper Pro (Pix4D S.A., Prilly, Switzerland) version 4.4.12. This process involved three standard procedures: photo alignment, point cloud generation, and orthomosaics with digital surface models (DSM) [25]. The software has a camera model registry that allows for recognizing and processing images in RGB, multispectral, thermal, and 3D model formats.
Orthomosaics were generated from both RGB and thermal images. Subsequently, the resolution was homogenized to 15 cm using the resampling method (resample). In addition, a supervised classification (maximum likelihood) of the images was performed using the QGIS 3.32 software to obtain the vegetation mask corresponding to each orthomosaic.
To correct the data from the thermal images, the information provided by the radiometer was used, since environmental humidity can affect these measurements. The Normalized Difference Vegetation Index (NDVI) was estimated by using the NIR and RED banks of the multispectral images, according to Equation (1).
The equation obtained from the relationship between the Leaf Area Index (LAI) and the Normalized Difference Vegetation Index (NDVI), based on the information collected in the field, was used to validate the NDVI generated by the UAV images. This allowed for estimating the spatial LAI, following the approach established by Fan et al. [36]. The albedo calculation was based on the average of the NIR and RED bands, according to the studies conducted by Quille-Mamani et al. [20] and Machaca-Pillaca et al. [39].
Previous studies exploring the correlation between the LAI and NDVI include research conducted on semi-arid grasslands in Inner Mongolia, China, by Fan et al. [36], who developed a general exponential correlation (, R = 0.77). Additionally, Quispe et al. [40] studied rice fields in the La Molina District, Lima, Peru, and derived an exponential correlation with the equation , which resulted in a coefficient of determination (R2) of 0.539 and a root mean square error (RMSE) of 0.35.
Figure 5 below presents a graphical summary of the field data collection process and the equipment used in the study area.
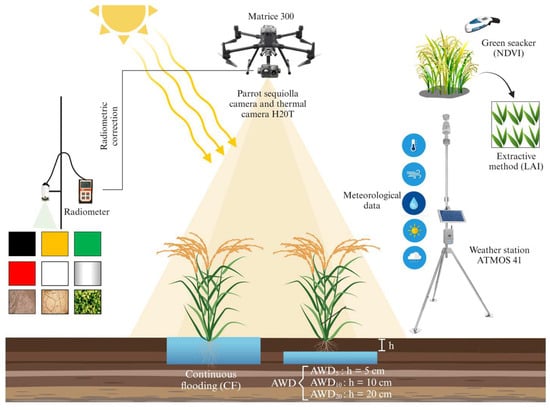
Figure 5.
Graphical summary with the irrigation techniques used: CF and AWD, the latter with water levels at a depth of 5 cm, 10 cm, and 20 cm below the soil surface level (, and ), and equipment used in the field data collection.
2.6. Energy and Water Use Efficiency Balance
METRICTM is a variant of the SEBAL (Surface Energy Balance Algorithm for Land) model that calculates crop evapotranspiration () by analyzing the surface energy balance using satellite information [41,42]. However, due to the lack of spatial resolution for plot-level studies and the scarcity of real-time data [17], it is necessary to employ high-resolution data, free of atmospheric errors and available in real time, provided by UAVs to improve the accuracy of estimation and facilitate uniform crop monitoring [43].
In this study, the METRIC model was used to estimate from multispectral images obtained by a UAV. The was determined as the remainder of the surface energy balance equation through the latent heat flux (LE) [17]. Equation (2) shows the formula used to calculate LE.
where LE is the latent heat flux , is the net radiation at the surface , G is the ground heat flux , and H is the sensible heat flux to air .
The calculation of Rn was carried out based on Equation (3), which consists of adding the incoming radiation and subtracting the outgoing radiation, based on internal variables described in the studies of Allen et al. [41] and Quille-Mamani et al. [20].
where ↓ is the incident shortwave radiation (), is the surface albedo, ↓ is the incident longwave radiation (), ↑ is the emitted longwave radiation (), and is the surface thermal emissivity (dimensionless).
G is a value representing the heat transfer to the ground. Its calculation is based on the value obtained from the LAI, the images captured by the UAV, and the value of Rn. This concept was applied to rice cultivation by Mzid et at. [44], as described in Equations (4) and (5) [45].
where G is the soil heat flux (), Rn is the net radiation (), LAI is the leaf area index, and is the surface temperature (°C).
The estimation of H was performed with the equations given by Allen et al. [41] and Quille-Mamani et al. [20], as per Equation (6).
where is the aerodynamic drag () between two surface heights, is the specific heat capacity of the air, and its value is equivalent to , and is the air density . The temperature gradient (dT) was calculated for each pixel based on the linear relationship between dT and the surface temperature () for the cold and hot anchor pixels [42], applying each result to Equation (7) [46].
where a and b are parameters empirically derived from the extreme hot and cold pixels, also known as “anchor” pixels.
For the selection of cold and hot pixels, boundary conditions for the energy balance were defined. These pixels were selected based on homogeneity with their neighboring pixels and distance to the weather station. Cold pixels were identified in an agricultural field by selecting a subset of pixels with temperature values within ±0.2 K of the average of the coldest 20%, extracted from the area corresponding to the 5% of the highest NDVI values. Finally, 2% of this 5% of the highest NDVI values was selected, with the final candidate pixel being the average of this 2%. On the other hand, hot pixels were identified in bare agricultural soils without vegetation by selecting a subset of pixels with temperature values within ±0.2 K of the average of the hottest 20%, extracted from the area corresponding to 10% of the lowest NDVI values. The selection of the final pixels was based on proximity to their average value and homogeneity with their neighboring pixels [47,48].
The METRIC model was fitted using high-resolution UAV data along with field measurements of the canopy temperature. Thermal images were calibrated for each monitoring date, and a general equation was established, i.e., , with a Pearson’s coefficient (R) of 0.959 and a root mean square error (RMSE) of 6.309 °C, incorporating solar radiation and wind speed. This process involved adjusting the sensible and latent heat fluxes from thermal images to match the crop evapotranspiration () estimates derived from energy balance methods. Error metrics such as the root mean square error (RMSE) and the Mean Bias Error (MBE) were computed to evaluate the model’s accuracy. The calibration resulted in RMSE values below 1.0 mm , demonstrating a strong agreement between the METRIC-estimated ET and the calculated values.
2.7. Water Balance with AquaCrop
The AquaCrop model has been widely used in the calculation of water balances due to its robustness and reliability, as highlighted in several studies [18,49]. This model is effective in assessing water balance and crop productivity under different climatic and water management conditions, proving to be especially useful in yield prediction and in the evaluation of water stress conditions.
To estimate crop evapotranspiration, the AquaCrop model [49], previously parameterized with field information related to climate, crops, irrigation, and soil [50], was used. AquaCrop simulated crop development and water balance components under flooded irrigation (CF) [51,52] and alternative wetting and drying (AWD) irrigation [18], from January to June 2023.
The information required for the AquaCrop model included daily meteorological data (maximum temperature (Tmax), minimum temperature (Tmin), wind speed (V), relative humidity (RH), and precipitation) from the Lambayeque (6°44′3.75″S and 79°54′35.4″W), Vista Florida (6°43′39.9″S and 79°46′51.16″W), and ATMOS-41 portable stations during crop development. The reference evapotranspiration (ETo) was estimated using the Penman–Monteith method, with information on Tmax, Tmin, V, RH, atmospheric pressure (Patm) and solar radiation.
Soil data incorporated into the model included porosity, field capacity (FC), and permanent wilting point (PWP). Irrigation water information incorporated into the model included electrical conductivity (EC) and irrigation rates applied according to treatments.
As for the crops, canopy cover (CC%) was estimated using data obtained from RGB images captured during the 13 flights performed. A supervised classification was used to extract the green area corresponding to the canopy. In addition, data on root depth, yield, and water table were incorporated into the model.
3. Results
3.1. Metric Inputs
3.1.1. Leaf Area Index (LAI)
The relationship between the Leaf Area Index (LAI), estimated by the extractive method, and the Normalized Difference Vegetation Index (NDVI) measured in the field at different dates during crop development was determined. This analysis made it possible to obtain the spatial variation in the LAI. The exponential equation was generated, yielding with an of 0.512 (Figure 6).
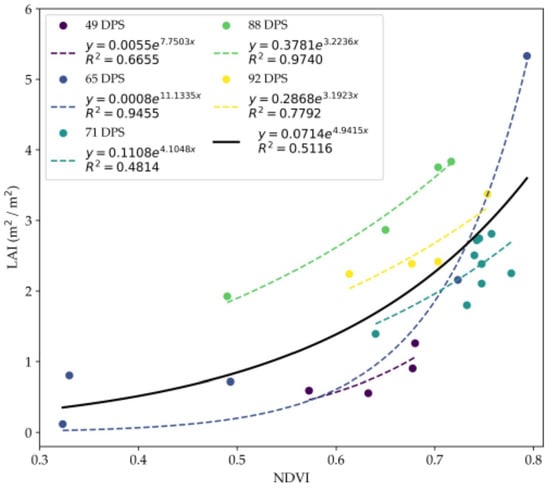
Figure 6.
Relationship between the NDVI measured with the GreenSeeker and the LAI estimated by the extractive method, both carried out in the field. Days post sowing (DPS) are indicated.
3.1.2. Reference Evapotranspiration () and In Situ Meteorological Data
Figure 7 presents the hourly variation in reference evapotranspiration (ET0) during the 24 h of the 13 flight days, calculated using the Penman–Monteith method with data from the ATMOS-41 portable weather station. The flight days are grouped according to crop stage: vegetative (38, 61, 65, 75, 79, 88, and 92 days after planting, DPS), reproductive (103, 107, 123, and 127 DPS), and ripening (147 and 149 DPS).
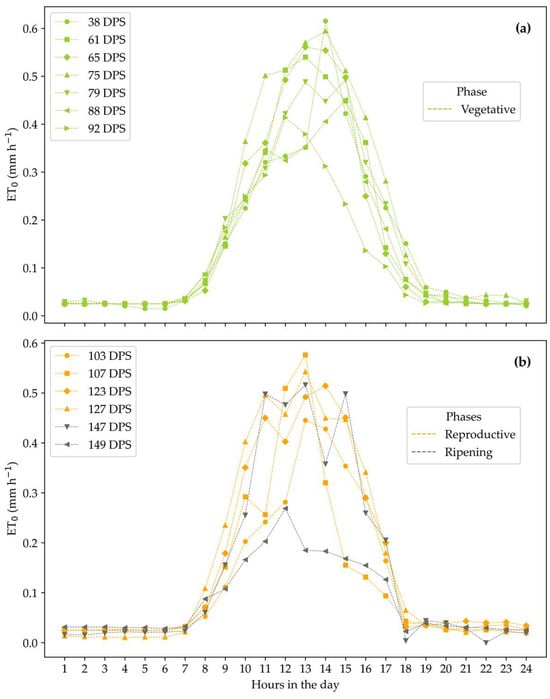
Figure 7.
Hourly variation in reference evapotranspiration () according to vegetative stage (a), reproductive stage, and crop maturity (b) according to the 13 flight dates.
Figure 8 shows the meteorological conditions during the monitoring period. The ambient temperature (Figure 8a) fluctuated between 25.4 °C and 30.5 °C. The relative humidity (Figure 8b) varied considerably, ranging from 61.1% to 90.5%. Wind speed (Figure 8c) ranged from 0.32 to 4.32 . Solar radiation (Figure 8d) ranged from 267 to 1051 . These data were collected during the time interval when the UAV flights were being conducted, specifically between 09:00 and 11:30 h.
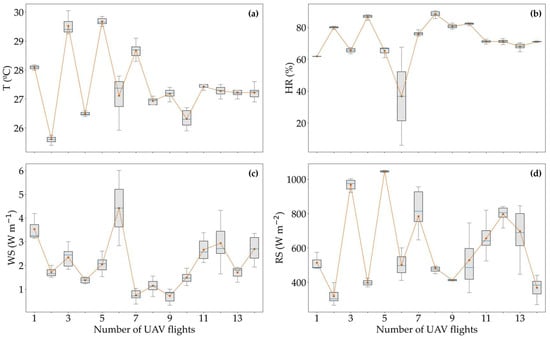
Figure 8.
Meteorological conditions according to UAV flights: (a) temperature (T, °C), (b) relative humidity (RH, %), (c) wind speed (WS, ), and (d) solar radiation (SR, ).
3.1.3. Cold and Hot Pixel
The selection of extreme pixels (Table 2) shows that the cold pixels corresponded to a surface temperature () minimum of 296.76 K and maximum values of the NDVI, LAI, and albedo of 0.93, 9.98, and 0.35, respectively. The hot pixels corresponded to a maximum surface temperature () of 321.88 K and minimum NDVI, LAI, and albedo values of 0.02, 0.05, and 0.15, respectively.

Table 2.
Selection of cold and hot pixels with values of NDVI, albedo, temperature, and calibration constants, i.e., a and b in equation [42].
3.1.4. Components of the Energy Balance
Figure 9 presents the boxplots of the temporal variation in the energy balance and evapotranspiration components for all monitored dates. This can be seen graphically in Figures S2–S5.
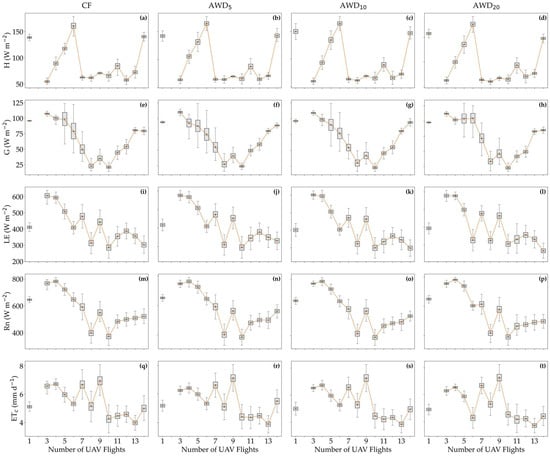
Figure 9.
Energy balance components and with CF (a,e,i,m,q), (b,f,j,n,r), (c,g,k,o,s), and (d,h,l,p,t), with water level depths at 5 cm, 10 cm, and 20 cm below the soil surface.
Figure 9 illustrates the seasonal variations in the latent heat flux (LE), sensible heat flux (H), soil heat flux (G), net radiation (Rn), and crop evapotranspiration () across the four irrigation treatments (CF, , and ). Notably, LE demonstrated a distinct decrease starting from flight 5, which coincided with the onset of prolonged dry periods due to the cessation of irrigation. This shift is most apparent in the AWD treatments, where water stress progressively increased. Prior to flight 5, LE remained elevated, particularly in the CF and treatments, as the water availability supported high transpiration rates. However, the impact of the Yaku phenomenon during flights 3 and 4 introduced variability in energy partitioning, with reduced net radiation (Rn) and fluctuations in LE. In flight 4, AWD irrigation was applied, which intensified the drought conditions, leading to a significant decrease in LE, while H and G increased, reflecting a redistribution of energy as the crop’s transpiration capacity diminished under water stress conditions. These trends highlight the direct influence of irrigation management and external climatic events on energy flux dynamics throughout the growing season.
Table S1 shows the results of the NDVI, LAI, and energy balance components according to the irrigation regime. For CF, there were average values of 552.08, 69.13, 114.33, and 422.18 for Rn, G, H, and LE, respectively. In the case of AWD, its average values were 565.06, 74.23, 129.63, and 411.48 for Rn, G, H and LE, respectively.
In , there were average values of 553.84, 70.45, 118.27, and 415.27 for Rn, G, H, and LE, respectively. Regarding , there were average values of 567.37, 71.52, 120.76, and 428.03 for Rn, G, H, and LE, respectively, and for , the average values were 565.06, 74.96, 130.69, and 401.56 for Rn, G, H, and LE, respectively.
3.1.5. Crop Evapotranspiration () by Energy Balance
Figure 10 shows the spatial variation in daily from 2.4 to 8.9 , according to crop stages: vegetative (38–92 DPS), reproductive (103–127 DPS), and ripening (147–149 DPS).
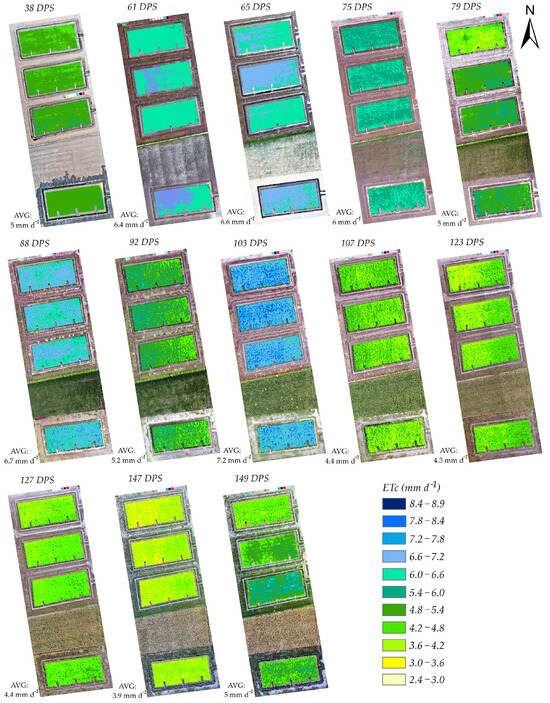
Figure 10.
Spatial variation in in vegetative (38 to 92 DPS), reproductive (103 to 127 DPS), and ripening (147 and 149 DPS) phases of the rice crop.
3.2. Crop Evapotranspiration () by Water Balance
The AquaCrop model was validated by comparing its simulated canopy cover (CC) and evapotranspiration () with actual field measurements. Statistical analysis showed strong validation outcomes, with Pearson’s correlation coefficients (R) being 0.96 for CF and 0.92, 0.92, and 0.97 for the , and treatments, respectively. The Nash–Sutcliffe efficiency (EF) index varied between 0.43 and 0.66, while the Willmott index (d) remained consistently above 0.88, indicating the model’s precision in simulating crop growth and water usage across the different irrigation regimes (Figure 11).
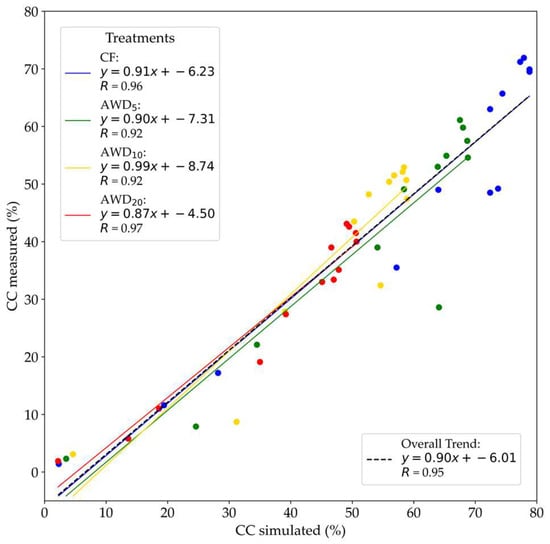
Figure 11.
Relationship between simulated vs. measured canopy cover (CC%) under irrigation management conditions and AWD, the latter with water levels below the soil surface of 5 cm, 10 cm, and 20 cm (, and ).
The efficiency of the fit was quantified using several statistical indices [53]: the Nash–Sutcliffe index (EF), the Willmott index (d), and the ratio of the RMSE to the standard deviation of the observations (RSR). In addition, Pearson’s coefficient (R) was calculated using Student’s t-test at a significance level of 5%.
Each of these statistical indicators (Table 3) has its limitations, but their use together reinforces the robustness of the calibration of the AquaCrop model. The value of EF ranges from negative infinity to 1, where values between 0 and 1 indicate acceptable performance. The values of d range from 0 to 1, with values closer to 1 indicating perfect agreement between observed and simulated data [53].

Table 3.
Statistical indicators for irrigation management: continuous flooding (CF) and alternating wetting and drying (, and ).
Table 4 shows the values of the calibrated parameters for the different types of irrigation management.

Table 4.
Calibrated parameters in the simulation of the variety INIA 515-Capoteña under irrigation management (CF, , and ).
From the calibration of the AquaCrop model, Table 5 shows the water balance components according to irrigation management (CF, , and ). Water consumption and water use efficiency (WUE) ranged from 14,428 to 19,970 and from 0.70 to 0.96 kg , respectively. As a result, the highest WUE corresponded to irrigation. This table shows the real components of precipitation, irrigation, and yield, since they are data collected in the field; the first two components with the SENAMHI records and the last one were selected at random for experimental data from the final stage. The simulated components were capillary rise, percolation, and ; these are the final data that AquaCrop generated.

Table 5.
Components of water balance and water use efficiency (WUE) according to irrigation management (CF and AWD).
Figure 12 shows the variation in the water balance components according to irrigation management. The greatest variability was observed in terms of percolation losses.


Figure 12.
Water balance components according to previously calibrated AquaCrop model: (a) total values during crop development according to CF and AWD irrigation management. Monthly values according to irrigation management for (b) CF, (c) , (d) , and (e) .
Figure 13 shows the values obtained through the water balance. For the CF irrigation management, the minimum value was 4.5 , with a 25th percentile (q25) at 5.6 , median (q50) at 6.6 , 75th percentile (q75) at 6.7 , and maximum value of 7.1 . For , the minimum value was 4.5 , with q25 at 5.5 , q50 at 6.6 , q75 at 6.7 , and a maximum value of 7.0 . In the minimum value was 4.5 , with q25 at 5.5 , q50 at 6.5 , q75 at 6.7 , and a maximum value of 7.1 . Finally, for , the minimum value was 4.3 , with q25 at 5.5 , q50 at 6.2 , q75 at 6.5 , and a maximum value of 6.8 .
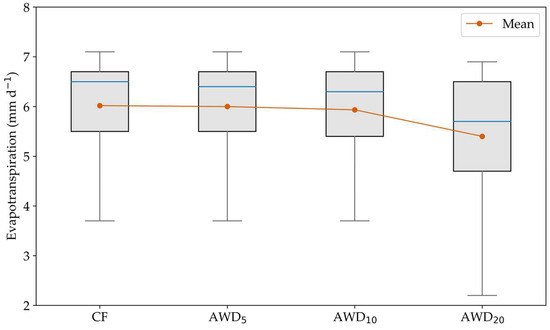
Figure 13.
Evapotranspiration from AquaCrop water balance model according to CF and AWD irrigation management.
The AquaCrop model allowed for obtaining the water balance, which was compared with the energy balance; as shown in Figure 14, a linear equation was generated, i.e., (), with a Pearson’s correlation coefficient of 0.783, which was significant for an alpha of 5%.
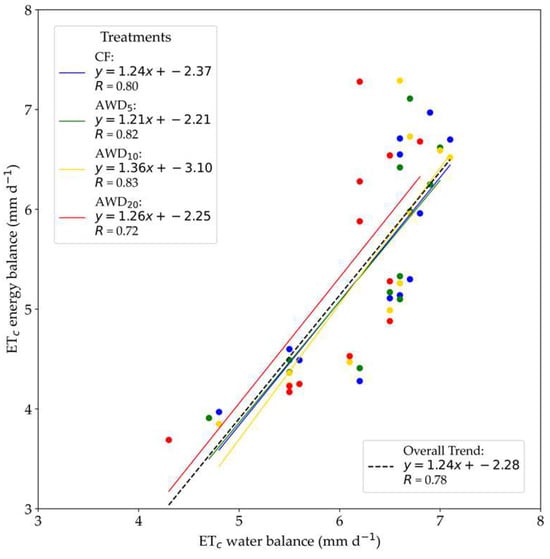
Figure 14.
Relationship between energy balance (METRIC model) and water balance (AquaCrop model) under CF and AWD irrigation management.
Figure 15 illustrates the dynamics of the cumulative and daily irrigation () under the different irrigation management strategies, comparing continuous flooding (CF) with alternate wetting and drying (AWD). As shown in Figure 15a, clear differences in cumulative water consumption were observed across the treatments, with CF exhibiting higher water use and the AWD treatments, particularly , showing greater water efficiency. Figure 15b represents the daily irrigation patterns throughout the crop phenological cycle and marks the days of UAV monitoring, which allowed for an accurate assessment of crop evapotranspiration () using the energy and water balance methods. These results highlight the advantages of AWD strategies in terms of reducing water consumption without compromising crop water status monitoring.
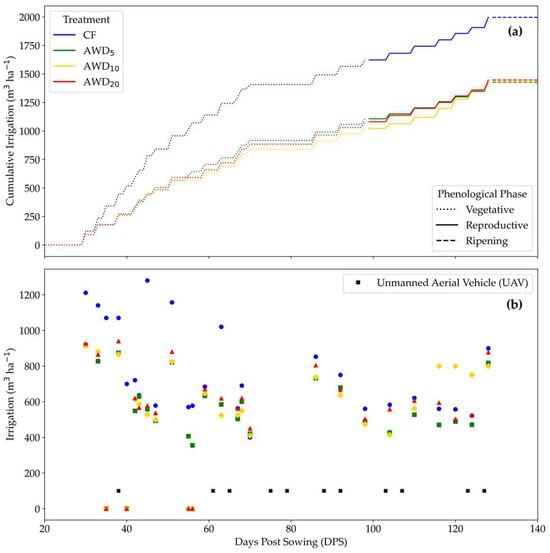
Figure 15.
(a) Cumulative irrigation applied days post-sowing (DPS) () throughout the growing season, and (b) Irrigation amounts () measured under different irrigation treatments: CF, , and ).
In Figure 16, the AquaCrop model decomposes crop evapotranspiration into evaporation and transpiration, revealing distinct patterns according to irrigation management. Under the AWD irrigation regime, higher evaporation was observed from transplanting to 33 DPS. In the case of CF management, an increase in transpiration and a decrease in evaporation was shown at 50 DPS, while by 66 DPS, both components reached similar values. In the treatment, higher values of transpiration were recorded up to 72 DPS. In and , a decrease in evaporation was observed between 50 DPS and 55 DPS.
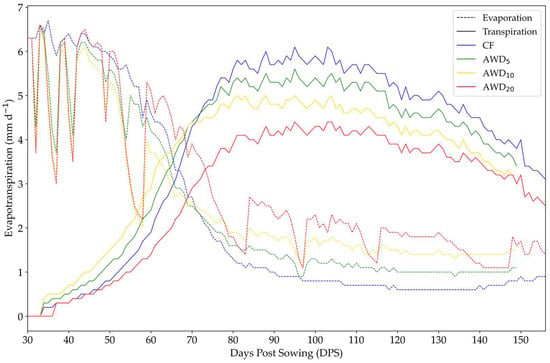
Figure 16.
Temporal variation in evapotranspiration obtained with the previously calibrated AquaCrop model under CF and AWD irrigation management.
3.2.1. Yield Comparison Measured vs. AquaCrop
The comparison between field-measured and AquaCrop-simulated yields revealed noticeable differences across the various treatments applied (Figure 17). For the CF treatment, the yield measured in the field was 14.01, while AquaCrop simulated a slightly higher yield of 14.14 . In the treatment, the field-measured yield was 11.85 , compared to a simulated yield of 12.47 by AquaCrop. Regarding the treatment, the field-measured yield was 13.72 , whereas the simulated yield was 12.284 . Finally, for the treatment, the field-measured yield was recorded at 12.91 , with AquaCrop simulating a significantly lower yield of 10.54 .
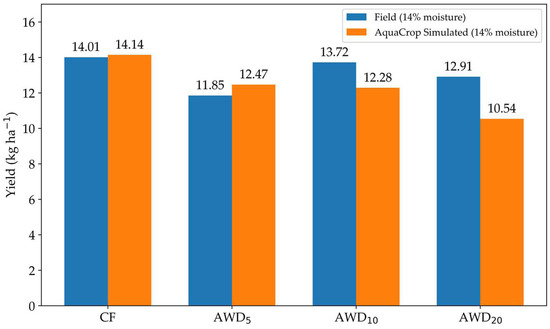
Figure 17.
Yield comparison between field measurements and AquaCrop simulations for CF, , , and treatments.
These variations might be due to the enhanced grain yield components seen under AWD management, like the number of panicles per square meter, panicle weight, and grain weight. The increased availability of irrigation water in the AWD treatments probably aided in more effective dry matter movement to panicles, leading to improved grain filling and yield.
Moreover, the difference between the observed and simulated yields could be linked to AquaCrop’s limitations in accurately reflecting the impacts of AWD irrigation practices, as well as unaccounted field condition variabilities during calibration. The gaps between the field-measured and AquaCrop-simulated yields could stem from multiple factors. Firstly, AquaCrop’s calibration for AWD irrigation might not fully capture the water availability dynamics, especially regarding soil moisture changes during wet and dry cycles. Additionally, field conditions like microclimate differences, soil variability, and potential unmeasured environmental stresses might have caused yield variations that the model could not simulate accurately.
This suggests a need for further refinement in AquaCrop’s calibration, specifically by tweaking parameters related to soil moisture retention and water stress limits for AWD systems.
3.2.2. Yield and Water Use Efficiency Under CF and AWD Irrigation Treatments
The analysis of crop yield versus cumulative irrigation under the various regimes revealed significant insights into water use efficiency (WUE). In the continuous flooding (CF) treatment, the highest cumulative irrigation of 19,971.17 yielded 14.01 but with the lowest WUE of 0.00070 , indicating that increased water use does not always correlate with a higher yield efficiency (Figure 18). Conversely, the alternate wetting and drying () treatment at a 5 cm depth with a lower cumulative irrigation of 14,268.09 achieved a yield of 11.85 but with a higher WUE of 0.00083 , demonstrating more efficient water use. The and treatments, with similar irrigation volumes of 14,340.80 and 14,468.56 , respectively, produced yields of 13.72 and 12.91 while improving WUE to 0.00096 and 0.00089 . The results indicate that managing water depth in AWD treatments enhances water use efficiency with minimal impact on yield.
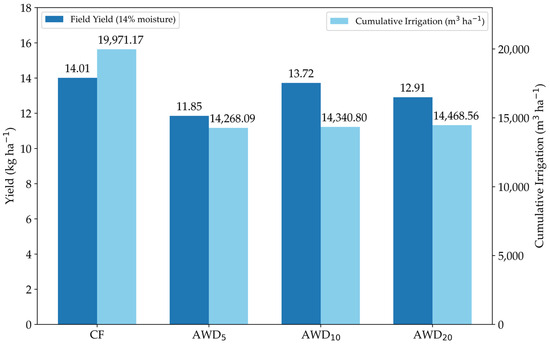
Figure 18.
Comparison of field yield and cumulative irrigation under different irrigation treatments (CF, , , and ).
The AquaCrop model was calculated using field-specific parameters, incorporating canopy cover data from UAV imagery and weather information from the ATMOS-41 station. Calibration was executed for each irrigation treatment (CF, , and ), concentrating on essential crop growth phases and water management strategies. The calibration parameters included normalized water productivity, harvest index, and effective rooting depth, adapted to the local soil and environmental conditions. Canopy growth coefficients and transpiration factors were adjusted based on field observations and compared with simulated outputs to ensure precision. The model’s performance was assessed using statistical indicators like the Nash–Sutcliffe efficiency (EF) and Pearson’s correlation coefficient (R), demonstrating strong alignment between the simulated and observed canopy cover and yield, with R values exceeding 0.92 for all treatments.
4. Discussions
The ATMOS-41 portable station was used to obtain accurate and representative meteorological data [54]. According to Chu et al. [55], the accuracy of measurements of environmental conditions is crucial for the accurate calculation of crop evapotranspiration, , since many studies use data from weather stations that may be far from the study area. The equation obtained for the Leaf Area Index (LAI) based on the NDVI, with a coefficient of determination R2 of 0.51, showed similarities with the results of Sisheber et al. [56], who found a linear relationship between the LAI measured with a ceptometer and a vegetation index estimated from LANDSAT images (R2 = 0.45). The maximum LAI values obtained in each mosaic reached up to 7.74, which is in agreement with findings reported by Ali et al. [57], Gong et al. [58], and Serrano et al. [59] in rice crops.
The selection process of the cold and hot pixels was carried out in separate areas: the cold pixels were selected in vegetation cover, while the hot pixels were selected in bare soils without vegetation, following the recommendations of Allen et al. [41] and Morton et al. [60]. Regarding the selection of the extreme pixels, throughout the 13 monitoring dates, it was observed that the cold pixels corresponded to maximum NDVI values of 0.93, while the hot pixels corresponded to a minimum NDVI value of 0.02, coinciding with the characteristics described by Allen et al. [45] and Morton et al. [60].
The results obtained for net radiation (Rn), which ranged from 100 to 800 , are in agreement with the findings reported by Nassar et al. [61] and Montibeller et al. [62]. On some specific days, higher Rn values were recorded, reaching between 423 and 851 , which coincides with the results obtained by Ramos-Fernández et al. [25] on the northern coast of Peru. These variations can be attributed to differences in the spatial distribution of albedo and climatic conditions, as indicated by Montibeller et al. [62].
Regarding soil heat flux (G), the results obtained are within the range reported by Nassar et al. [61], ranging from 0 to 180 . Regarding sensible heat flux (H) under CF irrigation, the values obtained are in agreement with those reported by Acharya et al. [46], ranging from 50 to 400 . Regarding latent heat flux (LE), the results agree with those found by Ramos-Fernández et al. [25], who reported values ranging from 63 to 1045 .
Nassar et al. [61] point out that the energy balance components reach their highest values at midday, with hourly variations depending on the season of the year (summer, spring, autumn, and winter), with the highest values occurring during the summer. In addition, Liu et al. [63] mention that at higher values of net radiation (Rn), an increase in crop evapotranspiration is observed.
The values (Figure 10) agree with Taherparvar et al. [21], ranging from 3.40 to 8.40 ( × k), Djaman et al. [26], ranging from 4.40 to 10.50 mm d−1 (water balance), Hussain et al. [39], ranging from 2 to 8.51 (Croptwat), Elsadek et al. [49], ranging from 0.3 to 5.5 (AquaCrop), Sawadogo et al. [24], ranging from 5.52 to 6.17 (SEBAL), and the average values of Lee et al. [64] of between 5.30 and 5.20 (SEBAL and eddy covariance, respectively), with respect to the average obtained (5.38 ). Other results obtained by energy balances include those from Ferreira et al. [65], ranging from 2.1 to 4.7 (METRIC), Kra et al. [23], ranging from 0 to 5.44 (SEBAL), Xie et al. [66], ranging from 5 to 5.26 (SEBAL), and Islam et al. [27], ranging from 3.6 to 5.45 (ML).
In addition, according to the results of studies carried out on the coast of Peru, the values are close to those obtained by an energy balance (METRIC) by Quille-Mamani et al. [20] in La Molina (1.65 to 7.48 ), as well as those obtained by Ramos-Fernández et al. [25] in Lambayeque (6.54 to 7.07 ) and the water balance of Neira et al. [67] in La Molina (1.75 to 5.16 ).
The evapotranspiration values obtained through the water balance (AquaCrop) and energy balance methods ranged from 4.31 to 7.1 and 2.4 to 8.9 , respectively. A significant discrepancy was observed in the water balance values during periods of severe water scarcity, particularly between 50 and 55 days post sowing (DPS) and from 71 to 86 DPS. This finding aligns with the report by Elsadek et al. [49], who noted that AquaCrop might not fully capture the impact of water stress on canopy development, potentially leading to an overestimation of .
In Figure 14, the values calculated by the water balance are shown to be 6.6 and 6.7 , while the values obtained through the energy balance ranged from 5.1 to 7.29 , indicating that they did not fully align with the evapotranspiration values under AWD irrigation management, particularly in . Pearson’s correlation coefficients of R = 0.818 and R = 0.829 were found for and , respectively, which were higher than the coefficient obtained for CF (R = 0.798). This result is consistent with the findings of Li et al. [68], who highlighted that certain depth ranges provide an optimal environment for crop growth, allowing for maximum yields or relatively stable performance.
As shown in Figure 16, transpiration peaked around 96 DPS, coinciding with the maximum tillering stage for CF. However, for , , and , this peak extended until approximately 103 DPS. This delay in development is related to the initial irrigation deficiency during the early tillering stage, which prolonged the flowering dates until 122 and 126 DPS.
Meanwhile, as shown in Figure 16, the observed increase in rice yield per hectare under the regime may be attributed to improved soil aeration. These findings align with the results reported by Elsadek et al. [49]. Conversely, the decrease in yield observed in the and treatments could be attributed to factors related to soil chemical conditions and irrigation management. In particular, soils with low organic carbon content and elevated pH may have promoted ammonia volatilization, reducing nitrogen availability for plants. This reduction in essential nitrogen uptake could have negatively affected rice productivity. Additionally, the water deficit associated with these irrigation regimes may have further contributed to a reduction in photosynthesis, ultimately impacting crop yield, as highlighted by Gao et al. [15] and Hirayama et al. [69].
The and irrigation management strategies, which used 1428 mm and 1434 mm of irrigation water, respectively, required less water compared to (1447 mm), as detailed in Table 5. This is attributed to the capillary effect, which helps maintain soil saturation by allowing water to rise toward the plant root zones. Additionally, the irrigation technique demonstrated higher water use efficiency (0.96 ) compared to the other AWD irrigation techniques.
Drawing from the work of Alauddin et al. [70] and Ishfaq et al. [71], the alternate wetting and drying (AWD) irrigation method has been shown to improve water use efficiency (WUE) while lowering overall water consumption. Although there may be minor reductions in yield with AWD, these are largely offset by significant economic savings and environmental advantages. Alauddin et al. [70] observed that AWD can cut water use by up to 30% and reduce irrigation costs by as much as 38%, presenting a feasible option for water-limited areas like Lambayeque. Moreover, AWD supports environmental sustainability by cutting methane emissions, a major benefit over continuous flooding methods [10,71]. These observations are consistent with this study’s results, where AWD led to a 27–28% reduction in water use and an increase in WUE by 18–36%. Therefore, implementing AWD not only ensures the economic viability of rice production but also fosters long-term sustainability in water-scarce regions.
The comparison between the METRIC energy balance model and the AquaCrop water balance model resulted a Pearson’s correlation coefficient of r = 0.783 with a significance level of p ≤ 0.05. This indicates a positive and significant relationship between the two methods for estimating , though it is slightly lower than findings from other studies, such as Quille-Mamani et al. [20], who reported an r = 0.97 using METRIC in rice. Despite these discrepancies, the results demonstrated high accuracy in the estimations, underscoring the effectiveness of UAVs in capturing thermal and multispectral images for efficient model calibration.
For calibrating the thermal images, a method similar to Machaca-Pillaca et al. [39] was employed, who developed a correction equation of , achieving a coefficient of determination of r = 0.98 and an RMSE of 7 °C. In this study, a similar correction equation, , was obtained, with r = 0.959 and an RMSE of 6.309, ensuring precise estimates of surface temperature and thus evapotranspiration. Although Quille-Mamani et al. [20] reported an RMSE of 0.51 , differences in irrigation practices and agricultural management in Lambayeque may have affected the results here, yet the adjustments made allow for robust estimates suitable for local conditions. This emphasizes the importance of using high-resolution imagery and energy balance models to enhance irrigation management efficiency.
The AWD irrigation method for rice in this study significantly improved water use efficiency (WUE), achieving increases of from 18 to 36% and saving from 27 to 28% of water. However, this method may lead to a yield reduction of from 2 to 15%. These findings align with previous research, such as Zhang et al. [72], who documented an average 6% yield decline under AWD. This reduction was likely due to decreased aerial biomass and Leaf Area Index (LAI), influenced by lower soil water potential during key growth phases. Nonetheless, recent research indicates that maintaining water potential above −15 kPa and optimizing soil properties like total organic carbon (TOC) and available potassium (AK) can reduce yield losses, even achieving 5–7% increases in nutrient-rich soils. Thus, AWD irrigation serves as an effective method to conserve water and, with proper agronomic practices, can enhance production, minimize yield reductions, and boost the sustainability of agricultural systems.
5. Conclusions
Thermal and multispectral imagery was collected through flights using a Matrice 300 drone, supplemented with field data to assess the spatial Leaf Area Index (LAI) and adjust the thermal bands. The crop evapotranspiration () of the rice variety INIA 515 was estimated under two irrigation methods: continuous flooding (CF) and alternating wetting and drying (AWD) at depths of 5, 10, and 20 cm below the soil surface.
CF irrigation showed consistent values for net radiation (Rn), soil heat flux (G), sensible heat flux (H), and latent heat flux (LE). In contrast, AWD irrigation directly influenced crop temperature, causing variations in these energy components.
The calculated using the energy balance averaged 5.45 and 5.24 for CF and AWD irrigation, respectively. Meanwhile, using the water balance, average values of 6.18 and 6.09 were obtained for these irrigation regimes. Calibration of the AquaCrop model to simulate the development of the INIA 515-Capoteña rice crop indicated that that the and irrigation management systems were more effective in terms of yield and water efficiency, highlighting them as the best strategies during the study year.
The model also exhibited acceptable performance in simulating water balance components, showing significant differences in percolation between CF and AWD. Although CF resulted in the highest yield, AWD achieved the best balance between yield and water use, underlining the potential of AWD strategies, especially at a 10 cm depth, to enhance water productivity. These results support the adoption of AWD as a viable option in water-scarce areas, similar to findings by authors such as Yang et al. [33] and Gao et al. [15], who also observed benefits in alternative irrigation practices.
Regarding the calibration of thermal images, similar outcomes were obtained to those reported by Quille-Mamani et al. [20], Machaca-Pillaca et al. [39], and Quispe-Tito et al. [40], who also utilized thermal imaging techniques in rice crops, achieving precise estimates of evapotranspiration.
Supplementary Materials
The following supporting information can be downloaded at: https://www.mdpi.com/article/10.3390/rs16203882/s1, Figure S1: (a) Flights that took place in the study area; (b) phenological stage of rice according to days after sowing (DPS); Figure S2: Spatial variation in net radiation (Rn) in the vegetative (38 to 92 DPS), reproductive (103 to 127 DPS), and maturation (147 and 149 DPS) phases of the rice crop; Figure S3: Spatial variation in the air heat flow (H) in the vegetative (38 to 92 DPS), reproductive (103 to 127 DPS), and maturation (147 and 149 DPS) phases of the rice crop; Figure S4: Spatial variation in soil heat flux (G) in vegetative (38 to 92 DPS), reproductive (103 to 127 DPS), and maturation (147 and 149 DPS) phases of rice cultivation; Figure S5: Spatial variation in latent heat (LE) in the vegetative (38 to 92 DPS), reproductive (103 to 127 DPS), and maturation (147 and 149 DPS) phases of the rice crop; Table S1: Summary of energy balance components, , and other results according to irrigation and crop phenological stages.
Author Contributions
Conceptualization, L.R.-F. and A.T.-R.; methodology, R.P.-A., J.H.-M., M.M.-H. and L.R.-F.; validation, D.Q.-T., A.T.-R. and J.Q.-M.; investigation, L.R.-F., E.H.-A. and L.F.d.P.; resources, D.Q.-T., E.P.-V., R.P.-A. and J.H.-M.; data curation, R.P.-A., J.H.-M., M.M.-H. and D.Q.-T.; writing—original draft preparation, R.P.-A., J.H.-M. and M.M.-H.; writing—review and editing, L.R.-F., E.H.-A., L.F.d.P., E.P.-V. and J.Q.-M.; supervision, L.R.-F. and A.T.-R. All authors have read and agreed to the published version of the manuscript.
Funding
This research was funded by National Scientific Research and Advanced Studies Program (PROCIENCIA) of PROCIENCIA-Peru, under the project “Implementation of technological tools in the development of a precision system with remote sensors to optimize the use of water and reduce the emission of greenhouse gases in rice fields for the benefit of farmers in the Lambayeque region” (contract No. PE501078113-2022).
Data Availability Statement
The data presented in this study are available upon request from the corresponding author.
Acknowledgments
This paper was written as a result of a collaboration that was initiated by contract No. PE501078113-2022.
Conflicts of Interest
The authors declare no conflicts of interest.
References
- Hussain, J.; Lee, C.C.; Chen, Y. Optimal Green Technology Investment and Emission Reduction in Emissions Generating Companies under the Support of Green Bond and Subsidy. Technol. Forecast Soc. Chang. 2022, 183, 121952. [Google Scholar] [CrossRef]
- Arouna, A.; Dzomeku, I.K.; Shaibu, A.G.; Nurudeen, A.R. Water Management for Sustainable Irrigation in Rice (Oryza sativa L.) Production: A Review. Agronomy 2023, 13, 1522. [Google Scholar] [CrossRef]
- Ministerio de Desarrollo Agrario y Riego. Productive and Competitive Profile of the Main Crops in the Sector. Available online: https://siea.midagri.gob.pe/portal/siea_bi/index.html (accessed on 8 October 2023).
- Ramos-Fernández, L.; Gonzales-Quiquia, M.; Huanuqueño-Murillo, J.; Tito-Quispe, D.; Heros-Aguilar, E.; Flores del Pino, L.; Torres-Rua, A. Water Stress Index and Stomatal Conductance under Different Irrigation Regimes with Thermal Sensors in Rice Fields on the Northern Coast of Peru. Remote Sens. 2024, 16, 796. [Google Scholar] [CrossRef]
- Heros Aguilar, E.C.; Lozano Isla, F.; Casas Díaz, A.V. Technologies for Rice Production: Recommendations for Peru Based on Scientific Research. South Sustain. 2023, 4, 1–5. [Google Scholar] [CrossRef]
- Surendran, U.; Raja, P.; Jayakumar, M.; Subramoniam, S.R. Use of Efficient Water Saving Techniques for Production of Rice in India under Climate Change Scenario: A Critical Review. J. Clean. Prod. 2021, 309, 127272. [Google Scholar] [CrossRef]
- Leavitt, M.; Moreno-García, B.; Reavis, C.W.; Reba, M.L.; Runkle, B.R.K. The Effect of Water Management and Ratoon Rice Cropping on Methane Emissions and Yield in Arkansas. Agric. Ecosyst. Environ. 2023, 356, 108652. [Google Scholar] [CrossRef]
- Johnson, J.M.; Becker, M.; Kaboré, J.E.P.; Dossou-Yovo, E.R.; Saito, K. Alternate Wetting and Drying: A Water-Saving Technology for Sustainable Rice Production in Burkina Faso? Nutr. Cycl. Agroecosyst. 2024, 129, 93–111. [Google Scholar] [CrossRef]
- Soliman, E.; Azam, R.; Hammad, S.A.; Mosa, A.A.; Mansour, M.M. Impacts of Alternate Wetting and Drying Technology on Water Use and Soil Nitrogen Transformations for Sustainable Rice Production: A Review. J. Soil Sci. Agric. Eng. 2024, 15, 151–163. [Google Scholar] [CrossRef]
- Echegaray-Cabrera, I.; Cruz-Villacorta, L.; Ramos-Fernández, L.; Bonilla-Cordova, M.; Heros-Aguilar, E.; Flores del Pino, L. Effect of Alternate Wetting and Drying on the Emission of Greenhouse Gases from Rice Fields on the Northern Coast of Peru. Agronomy 2024, 14, 248. [Google Scholar] [CrossRef]
- Bwire, D.; Saito, H.; Sidle, R.C.; Nishiwaki, J. Water Management and Hydrological Characteristics of Paddy-Rice Fields under Alternate Wetting and Drying Irrigation Practice as Climate Smart Practice: A Review. Agronomy 2024, 14, 1421. [Google Scholar] [CrossRef]
- Vijayakumar, S.; Nithya, N.; Saravanane, P.; Mariadoss, A.; Subramanian, E. Revolutionizing Rice Farming: Maximizing Yield with Minimal Water to Sustain the Hungry Planet; IntechOpen: London, UK, 2023. [Google Scholar] [CrossRef]
- Mallareddy, M.; Thirumalaikumar, R.; Balasubramanian, P.; Naseeruddin, R.; Nithya, N.; Mariadoss, A.; Eazhilkrishna, N.; Choudhary, A.K.; Deiveegan, M.; Subramanian, E.; et al. Maximizing Water Use Efficiency in Rice Farming: A Comprehensive Review of Innovative Irrigation Management Technologies. Water 2023, 15, 1802. [Google Scholar] [CrossRef]
- Price, A.H.; Norton, G.J.; Salt, D.E.; Ebenhoeh, O.; Meharg, A.A.; Meharg, C.; Islam, M.R.; Sarma, R.N.; Dasgupta, T.; Ismail, A.M.; et al. Alternate Wetting and Drying Irrigation for Rice in Bangladesh: Is It Sustainable and Has Plant Breeding Something to Offer? Food Energy Secur. 2013, 2, 120–129. [Google Scholar] [CrossRef]
- Gao, R.; Zhuo, L.; Duan, Y.; Yan, C.; Yue, Z.; Zhao, Z.; Wu, P. Effects of Alternate Wetting and Drying Irrigation on Yield, Water-Saving, and Emission Reduction in Rice Fields: A Global Meta-Analysis. Agric. For. Meteorol. 2024, 353, 110075. [Google Scholar] [CrossRef]
- Idso, S.B.; Jackson, R.D.; Pinter, P.J.; Reginato, R.J.; Hatfield, J.L. Normalizing the Stress-Degree-Day Parameter for Environmental Variability. Agric. Meteorol. 1981, 24, 45–55. [Google Scholar] [CrossRef]
- Niu, H.; Hollenbeck, D.; Zhao, T.; Wang, D.; Chen, Y. Evapotranspiration Estimation with Small UAVs in Precision Agriculture. Sensors 2020, 20, 6427. [Google Scholar] [CrossRef]
- Porras-Jorge, R.; Ramos-Fernández, L.; Ojeda-Bustamante, W.; Ontiveros-Capurata, R.E. Performance Assessment of the AquaCrop Model to Estimate Rice Yields under Alternate Wetting and Drying Irrigation in the Coast of Peru. Sci. Agropecu. 2020, 11, 309–321. [Google Scholar] [CrossRef]
- Saha, S.K.; Ahmmed, R.; Jahan, N. Actual Evapotranspiration Estimation Using Remote Sensing: Comparison of Sebal and Metric Models. In Water Management: A View from Multidisciplinary Perspectives; Springer: Cham, Switzerland, 2022; pp. 365–383. [Google Scholar] [CrossRef]
- Quille-Mamani, J.A.; Ramos-Fernández, L.; Ontiveros-Capurata, R.E. Estimation of Rice Crop Evapotranspiration in Perú Based on the METRIC Algorithm and UAV Images. Rev. Teledetección 2021, 58, 23–38. [Google Scholar] [CrossRef]
- Taherparvar, M.; Pirmoradian, N. Estimation of Rice Evapotranspiration Using Reflective Images of Landsat Satellite in Sefidrood Irrigation and Drainage Network. Rice Sci. 2018, 25, 111–116. [Google Scholar] [CrossRef]
- Hussain, S.; Mubeen, M.; Nasim, W.; Fahad, S.; Ali, M.; Ehsan, M.A.; Raza, A. Investigation of Irrigation Water Requirement and Evapotranspiration for Water Resource Management in Southern Punjab, Pakistan. Sustainability 2023, 15, 1768. [Google Scholar] [CrossRef]
- Kra, J.L.; Adahi, M.B.; Konan-Waidhet, B.A.; N’Guessan, J.-Y.K.; Koné, J.D.; Assidjo, E.N. Estimation of the Actual Evapotranspiration by the SEBAL Method in the Irrigated Rice Perimeter of Zatta (Yamoussoukro—Côte d’Ivoire). J. Water Resour. Prot. 2023, 15, 539–556. [Google Scholar] [CrossRef]
- Sawadogo, A.; Kouadio, L.; Traoré, F.; Zwart, S.J.; Hessels, T.; Gündoğdu, K.S. Spatiotemporal Assessment of Irrigation Performance of the Kou Valley Irrigation Scheme in Burkina Faso Using Satellite Remote Sensing-Derived Indicators. ISPRS Int. J. Geoinf. 2020, 9, 484. [Google Scholar] [CrossRef]
- Ramos-Fernández, L.; Quispe-Tito, D.; Altamirano-Gutiérrez, L.; Cruz-Grimaldo, C.; Quille-Mamani, J.A.; Carbonell-Rivera, J.P.; Torralba, J.; Ruiz, L.Á. Estimation of Evapotranspiration from UAV High-Resolution Images for Irrigation Systems in Rice Fields on the Northern Coast of Peru. Sci. Agropecu. 2024, 15, 7–21. [Google Scholar] [CrossRef]
- Djaman, K.; Rudnick, D.R.; Moukoumbi, Y.D.; Sow, A.; Irmak, S. Actual Evapotranspiration and Crop Coefficients of Irrigated Lowland Rice (Oryza sativa L.) under Semiarid Climate. Ital. J. Agron. 2019, 14, 19–25. [Google Scholar] [CrossRef]
- Islam, M.D.; Di, L.; Qamer, F.M.; Shrestha, S.; Guo, L.; Lin, L.; Mayer, T.J.; Phalke, A.R. Rapid Rice Yield Estimation Using Integrated Remote Sensing and Meteorological Data and Machine Learning. Remote Sens. 2023, 15, 2374. [Google Scholar] [CrossRef]
- Santos, C.; Lorite, I.J.; Tasumi, M.; Allen, R.G.; Fereres, E. Performance Assessment of an Irrigation Scheme Using Indicators Determined with Remote Sensing Techniques. Irrig. Sci. 2010, 28, 461–477. [Google Scholar] [CrossRef]
- Novoa, V.; Rojas, O.; Arumí, J.L.; Ulloa, C.; Urrutia, R.; Rudolph, A. Variability of the Water Footprint of Cereal Crops, Cachapoal River, Chile. Tecnol. Cienc. Agua 2016, 7, 35–50. [Google Scholar]
- Senay, G.B.; Budde, M.E.; Verdin, J.P. Enhancing the Simplified Surface Energy Balance (SSEB) Approach for Estimating Landscape ET: Validation with the METRIC Model. Agric. Water Manag. 2011, 98, 606–618. [Google Scholar] [CrossRef]
- French, A.N.; Hunsaker, D.J.; Thorp, K.R. Remote Sensing of Evapotranspiration over Cotton Using the TSEB and METRIC Energy Balance Models. Remote Sens. Environ. 2015, 158, 281–294. [Google Scholar] [CrossRef]
- Ortega-Farías, S.; Ortega-Salazar, S.; Poblete, T.; Kilic, A.; Allen, R.; Poblete-Echeverría, C.; Ahumada-Orellana, L.; Zuñiga, M.; Sepúlveda, D. Estimation of Energy Balance Components over a Drip-Irrigated Olive Orchard Using Thermal and Multispectral Cameras Placed on a Helicopter-Based Unmanned Aerial Vehicle (UAV). Remote Sens. 2016, 8, 638. [Google Scholar] [CrossRef]
- Yang, J.; Zhou, Q.; Zhang, J. Moderate Wetting and Drying Increases Rice Yield and Reduces Water Use, Grain Arsenic Level, and Methane Emission. Crop J. 2017, 5, 151–158. [Google Scholar] [CrossRef]
- Heros, E.; Gómez, L.; Sosa, G. Use of Selection Indices in the Identification of Drought Tolerant Rice (Oryza sativa L.) Genotypes. Prod. Agropecu. Y Desarro. Sosten. 2014, 2, 11–31. [Google Scholar] [CrossRef]
- Albrizio, R.; Puig-Sirera, À.; Sellami, M.H.; Guida, G.; Basile, A.; Bonfante, A.; Gambuti, A.; Giorio, P. Water Stress, Yield, and Grape Quality in a Hilly Rainfed “Aglianico” Vineyard Grown in Two Different Soils along a Slope. Agric. Water Manag. 2023, 279, 108183. [Google Scholar] [CrossRef]
- Fan, L.; Gao, Y.; Brück, H.; Bernhofer, C. Investigating the Relationship between NDVI and LAI in Semi-Arid Grassland in Inner Mongolia Using in-Situ Measurements. Theor. Appl. Clim. 2009, 95, 151–156. [Google Scholar] [CrossRef]
- Caldas Cueva, J.F.; Lizárraga Travaglini, A.D.; Vásquez Pérez, H. Guía Técnica: Manejo del Cultivo de Arroz Bajo el Sistema de Riego con Secas Intermitentes en las Regiones de Tumbes, Piura, Lambayeque y la Libertad. Available online: https://repositorio.inia.gob.pe/handle/20.500.12955/1053 (accessed on 14 May 2024).
- INIA (Instituto Nacional de Innovación Agraria). INIA 515—CAPOTEÑA. Available online: https://repositorio.inia.gob.pe/bitstream/20.500.12955/1529/1/INIA_515_CAPOTE%C3%91A.pdf (accessed on 19 March 2024).
- Machaca-Pillaca, R.; Pino-Vargas, E.; Ramos-Fernández, L.; Quille-Mamani, J.; Torres-Rua, A. Estimation of Evapotranspiration for Irrigation Purposes in Real Time of an Olive Grove from Drone Images in Arid Areas, Case of La Yarada, Tacna, Peru. Idesia 2022, 40, 55–65. [Google Scholar] [CrossRef]
- Quispe-Tito, D.J.; Ramos-Fernández, L.; Pino-Vargas, E.; Quille-Mamani, J.; Torres-Rua, A. Use of RPAS for Precision Evapotranspiration in Rice Fields to Reduce Water Consumption. Agron. Mesoam. 2024, 35, 8–15. [Google Scholar] [CrossRef]
- Allen, R.G.; Tasumi, M.; Trezza, R. Satellite-Based Energy Balance for Mapping Evapotranspiration with Internalized Calibration (METRIC)—Model. J. Irrig. Drain. Eng. 2007, 133, 380–394. [Google Scholar] [CrossRef]
- Bastiaanssen, W.G.M.; Menenti, M.; Feddes, R.A.; Holtslag, A.A.M. A Remote Sensing Surface Energy Balance Algorithm for Land (SEBAL). 1. Formulation. J. Hydrol. 1998, 212–213, 198–212. [Google Scholar] [CrossRef]
- Pintér, K.; Nagy, Z. Building a UAV Based System to Acquire High Spatial Resolution Thermal Imagery for Energy Balance Modelling. Sensors 2022, 22, 3251. [Google Scholar] [CrossRef]
- Mzid, N.; Cantore, V.; Albrizio, R.; D’urso, G.; Suwanlertcharoen, T.; Chaturabul, T.; Supriyasilp, T.; Pongput, K. Estimation of Actual Evapotranspiration Using Satellite-Based Surface Energy Balance Derived from Landsat Imagery in Northern Thailand. Water 2023, 15, 450. [Google Scholar] [CrossRef]
- Allen, R.; Irmak, A.; Trezza, R.; Hendrickx, J.M.H.; Bastiaanssen, W.; Kjaersgaard, J. Satellite-Based ET Estimation in Agriculture Using SEBAL and METRIC. Hydrol. Process. 2011, 25, 4011–4027. [Google Scholar] [CrossRef]
- Acharya, B.; Sharma, V. Comparison of Satellite Driven Surface Energy Balance Models in Estimating Crop Evapotranspiration in Semi-Arid to Arid Inter-Mountain Region. Remote Sens. 2021, 13, 1822. [Google Scholar] [CrossRef]
- Allen, R.G.; Burnett, B.; Kramber, W.; Huntington, J.; Kjaersgaard, J.; Kilic, A.; Kelly, C.; Trezza, R. Automated Calibration of the METRIC-Landsat Evapotranspiration Process. J. Am. Water Resour. Assoc. 2013, 49, 563–576. [Google Scholar] [CrossRef]
- Bhattarai, N.; Quackenbush, L.J.; Im, J.; Shaw, S.B. A New Optimized Algorithm for Automating Endmember Pixel Selection in the SEBAL and METRIC Models. Remote Sens. Environ. 2017, 196, 178–192. [Google Scholar] [CrossRef]
- Elsadek, E.; Zhang, K.; Mousa, A.; Ezaz, G.T.; Tola, T.L.; Shaghaleh, H.; Hamad, A.A.A.; Alhaj Hamoud, Y. Study on the In-Field Water Balance of Direct-Seeded Rice with Various Irrigation Regimes under Arid Climatic Conditions in Egypt Using the AquaCrop Model. Agronomy 2023, 13, 609. [Google Scholar] [CrossRef]
- Nie, T.; Tang, Y.; Jiao, Y.; Li, N.; Wang, T.; Du, C.; Zhang, Z.; Chen, P.; Li, T.; Sun, Z.; et al. Effects of Irrigation Schedules on Maize Yield and Water Use Efficiency under Future Climate Scenarios in Heilongjiang Province Based on the AquaCrop Model. Agronomy 2022, 12, 810. [Google Scholar] [CrossRef]
- Amiri, E. Calibration and Testing of the Aquacrop Model for Rice under Water and Nitrogen Management. Commun. Soil Sci. Plant Anal. 2016, 47, 387–403. [Google Scholar] [CrossRef]
- Zeleke, K.T. AquaCrop Calibration and Validation for Faba Bean (Vicia faba L.) under Different Agronomic Managements. Agronomy 2019, 9, 320. [Google Scholar] [CrossRef]
- Moriasi, D.; Arnold, J.; Liew, M.; Bingner, R.; Harmel, R.; Veith, T. Model Evaluation Guidelines for Systematic Quantification of Accuracy in Watershed Simulations. Trans. ASABE 2007, 50, 885–900. [Google Scholar] [CrossRef]
- Pino, V.E.; Montalván, D.I.; Vera, M.A.; Ramos, F.L. Stomatal Conductance and Its Relationship with Leaf Temperature and Soil Moisture in Olive Cultivation (Olea europaea L.), in the Period of Fruit Ripening, in Arid Zones. La Yarada, Tacna, Perú. Idesia 2019, 37, 55–64. [Google Scholar] [CrossRef]
- Chu, R.; Li, M.; Shen, S.; Islam, A.R.M.T.; Cao, W.; Tao, S.; Gao, P. Changes in Reference Evapotranspiration and Its Contributing Factors in Jiangsu, a Major Economic and Agricultural Province of Eastern China. Water 2017, 9, 486. [Google Scholar] [CrossRef]
- Sisheber, B.; Marshall, M.; Ayalew, D.; Nelson, A. Tracking Crop Phenology in a Highly Dynamic Landscape with Knowledge-Based Landsat–MODIS Data Fusion. Int. J. Appl. Earth Obs. Geoinf. 2022, 106, 102670. [Google Scholar] [CrossRef]
- Ali, A.M.; Savin, I.; Poddubskiy, A.; Abouelghar, M.; Saleh, N.; Abutaleb, K.; El-Shirbeny, M.; Dokukin, P. Integrated Method for Rice Cultivation Monitoring Using Sentinel-2 Data and Leaf Area Index. Egypt. J. Remote Sens. Space Sci. 2021, 24, 431–441. [Google Scholar] [CrossRef]
- Gong, Y.; Yang, K.; Lin, Z.; Fang, S.; Wu, X.; Zhu, R.; Peng, Y. Remote Estimation of Leaf Area Index (LAI) with Unmanned Aerial Vehicle (UAV) Imaging for Different Rice Cultivars throughout the Entire Growing Season. Plant Methods 2021, 17, 88. [Google Scholar] [CrossRef] [PubMed]
- Serrano Reyes, J.; Jiménez, J.U.; Quirós-McIntire, E.I.; Sanchez-Galan, J.E.; Fábrega, J.R. Comparing Two Methods of Leaf Area Index Estimation for Rice (Oryza sativa L.) Using In-Field Spectroradiometric Measurements and Multispectral Satellite Images. AgriEngineering 2023, 5, 965–981. [Google Scholar] [CrossRef]
- Morton, C.G.; Huntington, J.L.; Pohll, G.M.; Allen, R.G.; Mcgwire, K.C.; Bassett, S.D. Assessing Calibration Uncertainty and Automation for Estimating Evapotranspiration from Agricultural Areas Using METRIC. JAWRA J. Am. Water Resour. Assoc. 2013, 49, 549–562. [Google Scholar] [CrossRef]
- Nassar, A.; Torres-Rua, A.; Kustas, W.; Alfieri, J.; Hipps, L.; Prueger, J.; Nieto, H.; Alsina, M.M.; White, W.; McKee, L.; et al. Assessing Daily Evapotranspiration Methodologies from One-Time-of-Day SUAS and EC Information in the GRAPEX Project. Remote Sens. 2021, 13, 2887. [Google Scholar] [CrossRef]
- Gevaerd Montibeller, Á. Estimating Energy Fluxes and Evapotranspiration of Corn and Estimating Energy Fluxes and Evapotranspiration of Corn and Soybean with an Unmanned Aircraft System in Ames, Iowa Soybean with an Unmanned Aircraft System in Ames, Iowa; University of Northern Iowa: Cedar Falls, IA, USA, 2017. [Google Scholar]
- Liu, X.; Xu, J.; Yang, S.; Zhang, J. Rice Evapotranspiration at the Field and Canopy Scales under Water-Saving Irrigation. Meteorol. Atmos. Phys. 2018, 130, 227–240. [Google Scholar] [CrossRef]
- Lee, Y.; Kim, S.; Senay, G.; Müller, R.; Thenkabail, P.S. The Modified SEBAL for Mapping Daily Spatial Evapotranspiration of South Korea Using Three Flux Towers and Terra MODIS Data. Remote Sens. 2016, 8, 983. [Google Scholar] [CrossRef]
- Ferreira, S.; Sánchez, J.M.; Gonçalves, J.M. A Remote-Sensing-Assisted Estimation of Water Use in Rice Paddy Fields: A Study on Lis Valley, Portugal. Agronomy 2023, 13, 1357. [Google Scholar] [CrossRef]
- Xie, H.; Hu, X.; Luo, Y.; Xu, Y.; Huang, P.; Yuan, D.; Song, C.; Cui, Y.; Li, Y. Spatiotemporal Variation in Rice Evapotranspiration under the Influence of Rice Expansion: A Case Study in the Sanjiang Plain, Northeast China. Authorea Prepr. 2023, 22, 535–550. [Google Scholar] [CrossRef]
- Neira Huamán, E.; Ramos Fernández, L.; Razuri Ramírez, L.R. Coefficient of Cropping (Kc) of Rice from Drain Lysimeter in The Molina, Lima-Perú. Idesia 2020, 38, 49–55. [Google Scholar] [CrossRef]
- Li, X.; Li, Z.; Fu, W.; Li, F. The Influence of Shallow Groundwater on the Physicochemical Properties of Field Soil, Crop Yield, and Groundwater. Agriculture 2024, 14, 341. [Google Scholar] [CrossRef]
- Hirayama, M.; Wada, Y.; Nemoto, H. Estimation of Drought Tolerance Based on Leaf Temperature in Upland Rice Breeding. Breed. Sci. 2006, 56, 47–54. [Google Scholar] [CrossRef]
- Alauddin, M.; Rashid Sarker, M.A.; Islam, Z.; Tisdell, C. Adoption of Alternate Wetting and Drying (AWD) Irrigation as a Water-Saving Technology in Bangladesh: Economic and Environmental Considerations. Land Use Policy 2020, 91, 104430. [Google Scholar] [CrossRef]
- Ishfaq, M.; Akbar, N.; Zulfiqar, U.; Ali, N.; Shah, F.; Anjum, S.A.; Farooq, M. Economic Assessment of Water-Saving Irrigation Management Techniques and Continuous Flooded Irrigation in Different Rice Production Systems. Paddy Water Environ. 2022, 20, 37–50. [Google Scholar] [CrossRef]
- Zhang, Y.; Wang, W.; Li, S.; Zhu, K.; Hua, X.; Harrison, M.T.; Liu, K.; Yang, J.; Liu, L.; Chen, Y. Integrated Management Approaches Enabling Sustainable Rice Production under Alternate Wetting and Drying Irrigation. Agric. Water Manag. 2023, 281, 108265. [Google Scholar] [CrossRef]
Disclaimer/Publisher’s Note: The statements, opinions and data contained in all publications are solely those of the individual author(s) and contributor(s) and not of MDPI and/or the editor(s). MDPI and/or the editor(s) disclaim responsibility for any injury to people or property resulting from any ideas, methods, instructions or products referred to in the content. |
© 2024 by the authors. Licensee MDPI, Basel, Switzerland. This article is an open access article distributed under the terms and conditions of the Creative Commons Attribution (CC BY) license (https://creativecommons.org/licenses/by/4.0/).