Article

Dynamic Changes and Driving Factors in the Surface Area of Ebinur Lake over the Past Three Decades

by
Yuan Liu
1,2,3,4,
Qingyu Wang
2,3,4,5,
Dian Wang
6,
Yunrui Si
2,3,4,
Tianci Qi
2,3,
Hongtao Duan
2,3,4 and
Ming Shen
2,3,4,*
1
College of Geographical Sciences, Nanjing University of Information Science and Technology, Nanjing 210044, China
2
Key Laboratory of Lake and Watershed Science for Water Security, Nanjing Institute of Geography and Limnology, Chinese Academy of Sciences, Nanjing 211135, China
3
Key Laboratory of Watershed Geographic Sciences, Nanjing Institute of Geography and Limnology, Chinese Academy of Sciences, Nanjing 211135, China
4
University of Chinese Academy of Sciences, Nanjing (UCASNJ), Nanjing 211135, China
5
School of Remote Sensing and Geomatics Engineering, Nanjing University of Information Science and Technology, Nanjing 210044, China
6
Marine Science and Technology College, Zhejiang Ocean University, Zhoushan 316022, China
*
Author to whom correspondence should be addressed.
Remote Sens. 2024, 16(20), 3876; https://doi.org/10.3390/rs16203876
Submission received: 14 August 2024 / Revised: 14 October 2024 / Accepted: 16 October 2024 / Published: 18 October 2024

Abstract

:
Dryland lakes are indispensable to regional water resource systems. Ebinur Lake, the largest saline lake in Xinjiang Uygur Autonomous Region, is vital for regional biodiversity and environmental stability but has been facing the predicament of gradual shrinkage in recent decades. In this study, we proposed a new dual-index method for Landsat (-5, -7, -8, and -9) data to extract water with the combinations of the normalized difference water index (NDWI) and the modified NDWI for turbid waters (NDWIturbid). The dual-index method showed a high overall accuracy of 96.36% for Ebinur Lake. Landsat series images from 1992 to 2023 were employed to acquire the water areas of Ebinur Lake. The results showed that, over the past three decades, the area of Ebinur Lake exhibited a fluctuating decreasing trend, with an average lake area of 568.74 ± 152.43 km². The northwest intermittent water areas showed significant changes, and there was a close connection between the northwest and core water areas. Seasonally, the lake area decreased from spring to autumn. River inflow, driven by rainfall and human activities, was the primary factor affecting the inter/inner annual changes in Ebinur Lake. Furthermore, due to the valley effects, wind was found to be a critical factor in the diurnal changes in the water areas. This study should deepen the understanding of the variations of Ebinur Lake and benefit local water resource management.

1. Introduction

Lakes, as essential water storage and supply sources, are important in regional ecology and social development [1,2]. Under the combined influence of global warming and increasing human activities, lakes are experiencing different degrees of expansion or contraction [3]. Lake shrinkage threatens the regional environment and ecosystems, including dust release and water salinization [4]. Determining the area of lakes is crucial for monitoring environmental changes, facilitating resource management, and supporting scientific research [5].
Compared to traditional methods, remote sensing is the most economical and efficient way to extract water body areas [6]. Optical remote sensing imagery and synthetic aperture radar (SAR) imagery are the primary data sources for water extraction [7]. SAR imagery suffers from significant radiometric noise, which limits its application in extracting fine water body features [8]. Optical remote sensing imagery, usually with higher spatial resolution and rich spectral information, can delineate lake boundaries and internal details. Therefore, it is more commonly used to determine water areas [9]. Among these optical satellite data, the Landsat (-5, -7, -8, and -9) series data can continuously provide observations with a 30 m spatial resolution over five decades since 1972 [10].
Research on water body extraction has developed various algorithms, including threshold methods, classifier methods, object-oriented methods, deep learning methods [7], as well as AI-integrated water body extraction algorithms [11]. Among these, threshold methods, characterized by clear principles and simple arithmetic operations, are widely utilized for extractions of water body areas [12]. Waters generally demonstrate lower reflectivity than other land covers like vegetation and soils [13], especially with nearly zero water-leaving reflectance in the near-infrared (NIR) and shortwave infrared (SWIR) bands. With these characteristics, numerous water extraction algorithms with threshold methods were developed. For example, the single SWIR band of Landsat-5 TM data with a threshold was used to distinguish water bodies from non-water bodies [14]. However, single-band-based algorithms are significantly sensitive to variations in water quality, shadows, and land cover types, resulting in misclassifications [15]. Therefore, many water indices were developed to overcome these misclassifications, such as the normalized difference water index (NDWI) [16], the automated water extraction index (AWEI) [17], and the enhanced water index (EWI) [18]. Most previous studies have explored the use of these indices and achieved significant improvement in the accuracy of water body area extraction [19]. However, inland lake waters are usually characterized by complex and highly dynamic optical properties [20]. A single water index may not capture these dynamics, limiting its ability to extract water bodies. Considering the complex and dynamic optical changes of inland waters, it is worth exploring the combination of water indices to more effectively extract water body areas.
Ebinur Lake, the largest lake in the Junggar Basin of Xinjiang, serves as an ecological barrier to the economic belt on the northern slope of the Tianshan Mountains and makes critical contributions to the local ecological environment and economic development. However, Ebinur Lake experiences significant fluctuations in water areas as a result of rapid economic development and climate changes. Therefore, precise monitoring of the dynamic changes in Ebinur Lake is of great significance. Due to the strong winds from the Alashankou Pass, Ebinur Lake experiences highly dynamic changes in water area and turbid optical properties. The conventional single-index threshold method is challenging to reliably capture these fluctuations in water body conditions [21]. The objectives of this study were to (1) develop a new water extraction method suitable for the optically complex waters in Ebinur Lake; (2) use the newly proposed method, along with the Landsat (-5, -7, -8, and -9) data from 1992 to 2023, to investigate the long-term spatiotemporal variation of Ebinur Lake; (3) explore the primary natural and anthropogenic factors of area changes in Ebinur Lake. This study should provide knowledge on dynamic changes in Ebinur Lake and serve as a reference for the water body area extraction of turbid dryland lakes.

2. Materials and Methods

2.1. Study Area

Ebinur Lake (44°43′N–45°12′N, 82°35′E–83°11′E, Figure 1) is located in Jinghe County of the Bortala Mongol Autonomous Prefecture in Xinjiang. It is a typical inland lake and the largest saline lake in Xinjiang. With the evolution of the hydrology and morphological characteristics of Ebinur Lake, it has gradually been divided into three parts: intermittent areas, core areas, and the connections between the intermittent and core areas. The local climate is temperate continental dry climate, characterized by significant annual temperature variations and pronounced seasonal rainfall. The area experiences an average temperature of 7.36 °C, with mean annual precipitation of 149 mm and annual potential evaporation of 2281 mm [22]. Ebinur Lake is surrounded by mountains on three sides and is situated below the Alashankou Pass; the lake floor is flat, with an average elevation of 189 m [23]. The narrow topography of the region contributes to a climate characterized by intense, frequent, and long-lasting winds, with the majority being northwesterly [24]. In the study area, the number of days with wind speeds exceeding 17.2 m/s can reach 164 days, with a maximum of 185 days, and the peak gusts can exceed 55.0 m/s [25,26]. In recent decades, the lake area has diminished, leading to increased desertification and salinization of the lakebed. Ebinur Lake has gradually become one of the primary sources of dust storms in northern Xinjiang [23].

2.2. Landsat Data and Preprocessing

Within the Google Earth Engine (GEE) platform, Landsat (-5, -7, -8, and -9) surface reflectance (SR) data were obtained in study region. Note that the Landsat-7 ETM+ after 2003, influenced by the malfunctioning of the scan-line corrector (SLC) issues, was corrected in ENVI to fill these gaps. Since there was only one valid image of Ebinur Lake before 1992, images spanning from 1992 to 2023 were obtained. Considering the ice seasons, images from April to October were used. Landsat datasets were obtained and clipped based on the specific time frame and study area. The QA band, obtained using the CFMask algorithm, was used to identify and remove clouds, cirrus, and shadows, thereby reducing the impact of cloud cover on image quality. Ultimately, a total of 800 valid Landsat images were utilized in this study (Figure 2).

2.3. Water Extraction Algorithm

2.3.1. Construction of the Algorithm

First, the images were preprocessed to filter out cloud-free areas. Subsequently, a dual-index method was employed to extract water body areas. Generally, the optimal water index (NDWI here) determined from six commonly used water indices (including NDWI, the modified normalized difference water index (MNDWI) [27], AWEI, the modified automated water extraction index (MAWEI) [28], and the lake water difference model (LWDM) [29]) was used; once the waters were identified as extremely turbid conditions, an NDWIturbid index was adopted (Figure 3).
Firstly, six commonly used water indices were compared to determine the optimal one; these indices were calculated as follows:
NDWI = Green NIR Green + NIR
MNDWI = Green SWIR 1 Green + SWIR 1
AWEIsh = Blue + 2.5 Green 1.5   NIR + SWIR 1 0.25 SWIR 2
AWEInsh = 4   Green SWIR 1 0.25 NIR + 2.75 SWIR 2
MAWEI = 5   Green NIR + Blue + Red 4 SWIR 2
LWDM = Blue + Green Red NIR SWIR 1 SWIR 2
where Red, Green, Blue, NIR, SWIR1, and SWIR2 represent the surface reflectance of the Landsat data.
The Otsu method was adopted to obtain the optimal threshold by comparing the maximum variance between the foreground and background [30,31,32]. Under the Otsu-derived thresholds, different water indices were compared with the accuracy of water body extraction in order to determine the optimal one. Finally, NDWI performed the best and was selected for water extraction from Ebinur Lake (Section 3.1.1. Comparison of Different Water Indices).
However, if the sediments at the bottom of Ebinur Lake were stirred up, the NIR band reflectances significantly increased. We defined the average reflectances of the NIR band (AVEnir) > 0.15 as an indication of extremely turbid conditions in the lake (Figure S1). At this point, the NDWI values decreased, making it challenging to distinguish water from the surrounding land. Additionally, under extremely turbid conditions, the average reflectances of the Red band (AVEred) in the initially NDWI-extracted water areas were found to be greater than that of the Green band (AVEgreen). Therefore, the Red, Green, and NIR bands were used to differentiate between normal conditions (AVEred ≤ AVEgreen and AVEnir < 0.15) and extremely turbid conditions (AVEred > AVEgreen and AVEnir > 0.15). To address water extractions under extremely turbid conditions, the modified NDWI for turbid waters (NDWIturbid) was introduced [33] (Equation (7)). The modified NDWIturbid employed a weighted method that emphasized the Green band, which improved the detection capability for water, even when the reflectance of any one of the other band exceeded that of the Green band.
NDWI turbid = 3 Green Blue Red SWIR 1 3 Green + Blue + Red + SWIR 1

2.3.2. Validation of the Algorithm

In this study, we ensured the reliability of the algorithm and results by comparing them with sampled data or recognized reference data. We employed two methods for validation: visually interpreted sample points and a comparison with GSW products (Figure 3: accuracy assessment).
(1) Visually interpreted sample points. Twelve images spanning different years and seasons were selected for validation. Through visual interpretation, the land cover types of 7200 random sample points were determined. The confusion matrices (Table 1) were calculated, and the metrics were determined, including overall accuracy (OA), Kappa coefficient, precision, recall, and F1 Score (Equation (8)–(13)) [34]:
OA = TP + TN TP + TN + FP + FN
Kappa = O A p e 1 p e
p e = t 1 p 1 + t 2 p 2 + + t n p n n n
Precision = TP T P + F P
Recall = TP TP + FN
F 1   Score = 2 P recision R ecall P recision + R ecall
where t1, t2, ⋯, tn indicates the number of actual samples of each type, p1, p2, ⋯, pn indicates the number of prediction samples for each type, and n is the total number of samples.
(2) Comparison with GSW products.
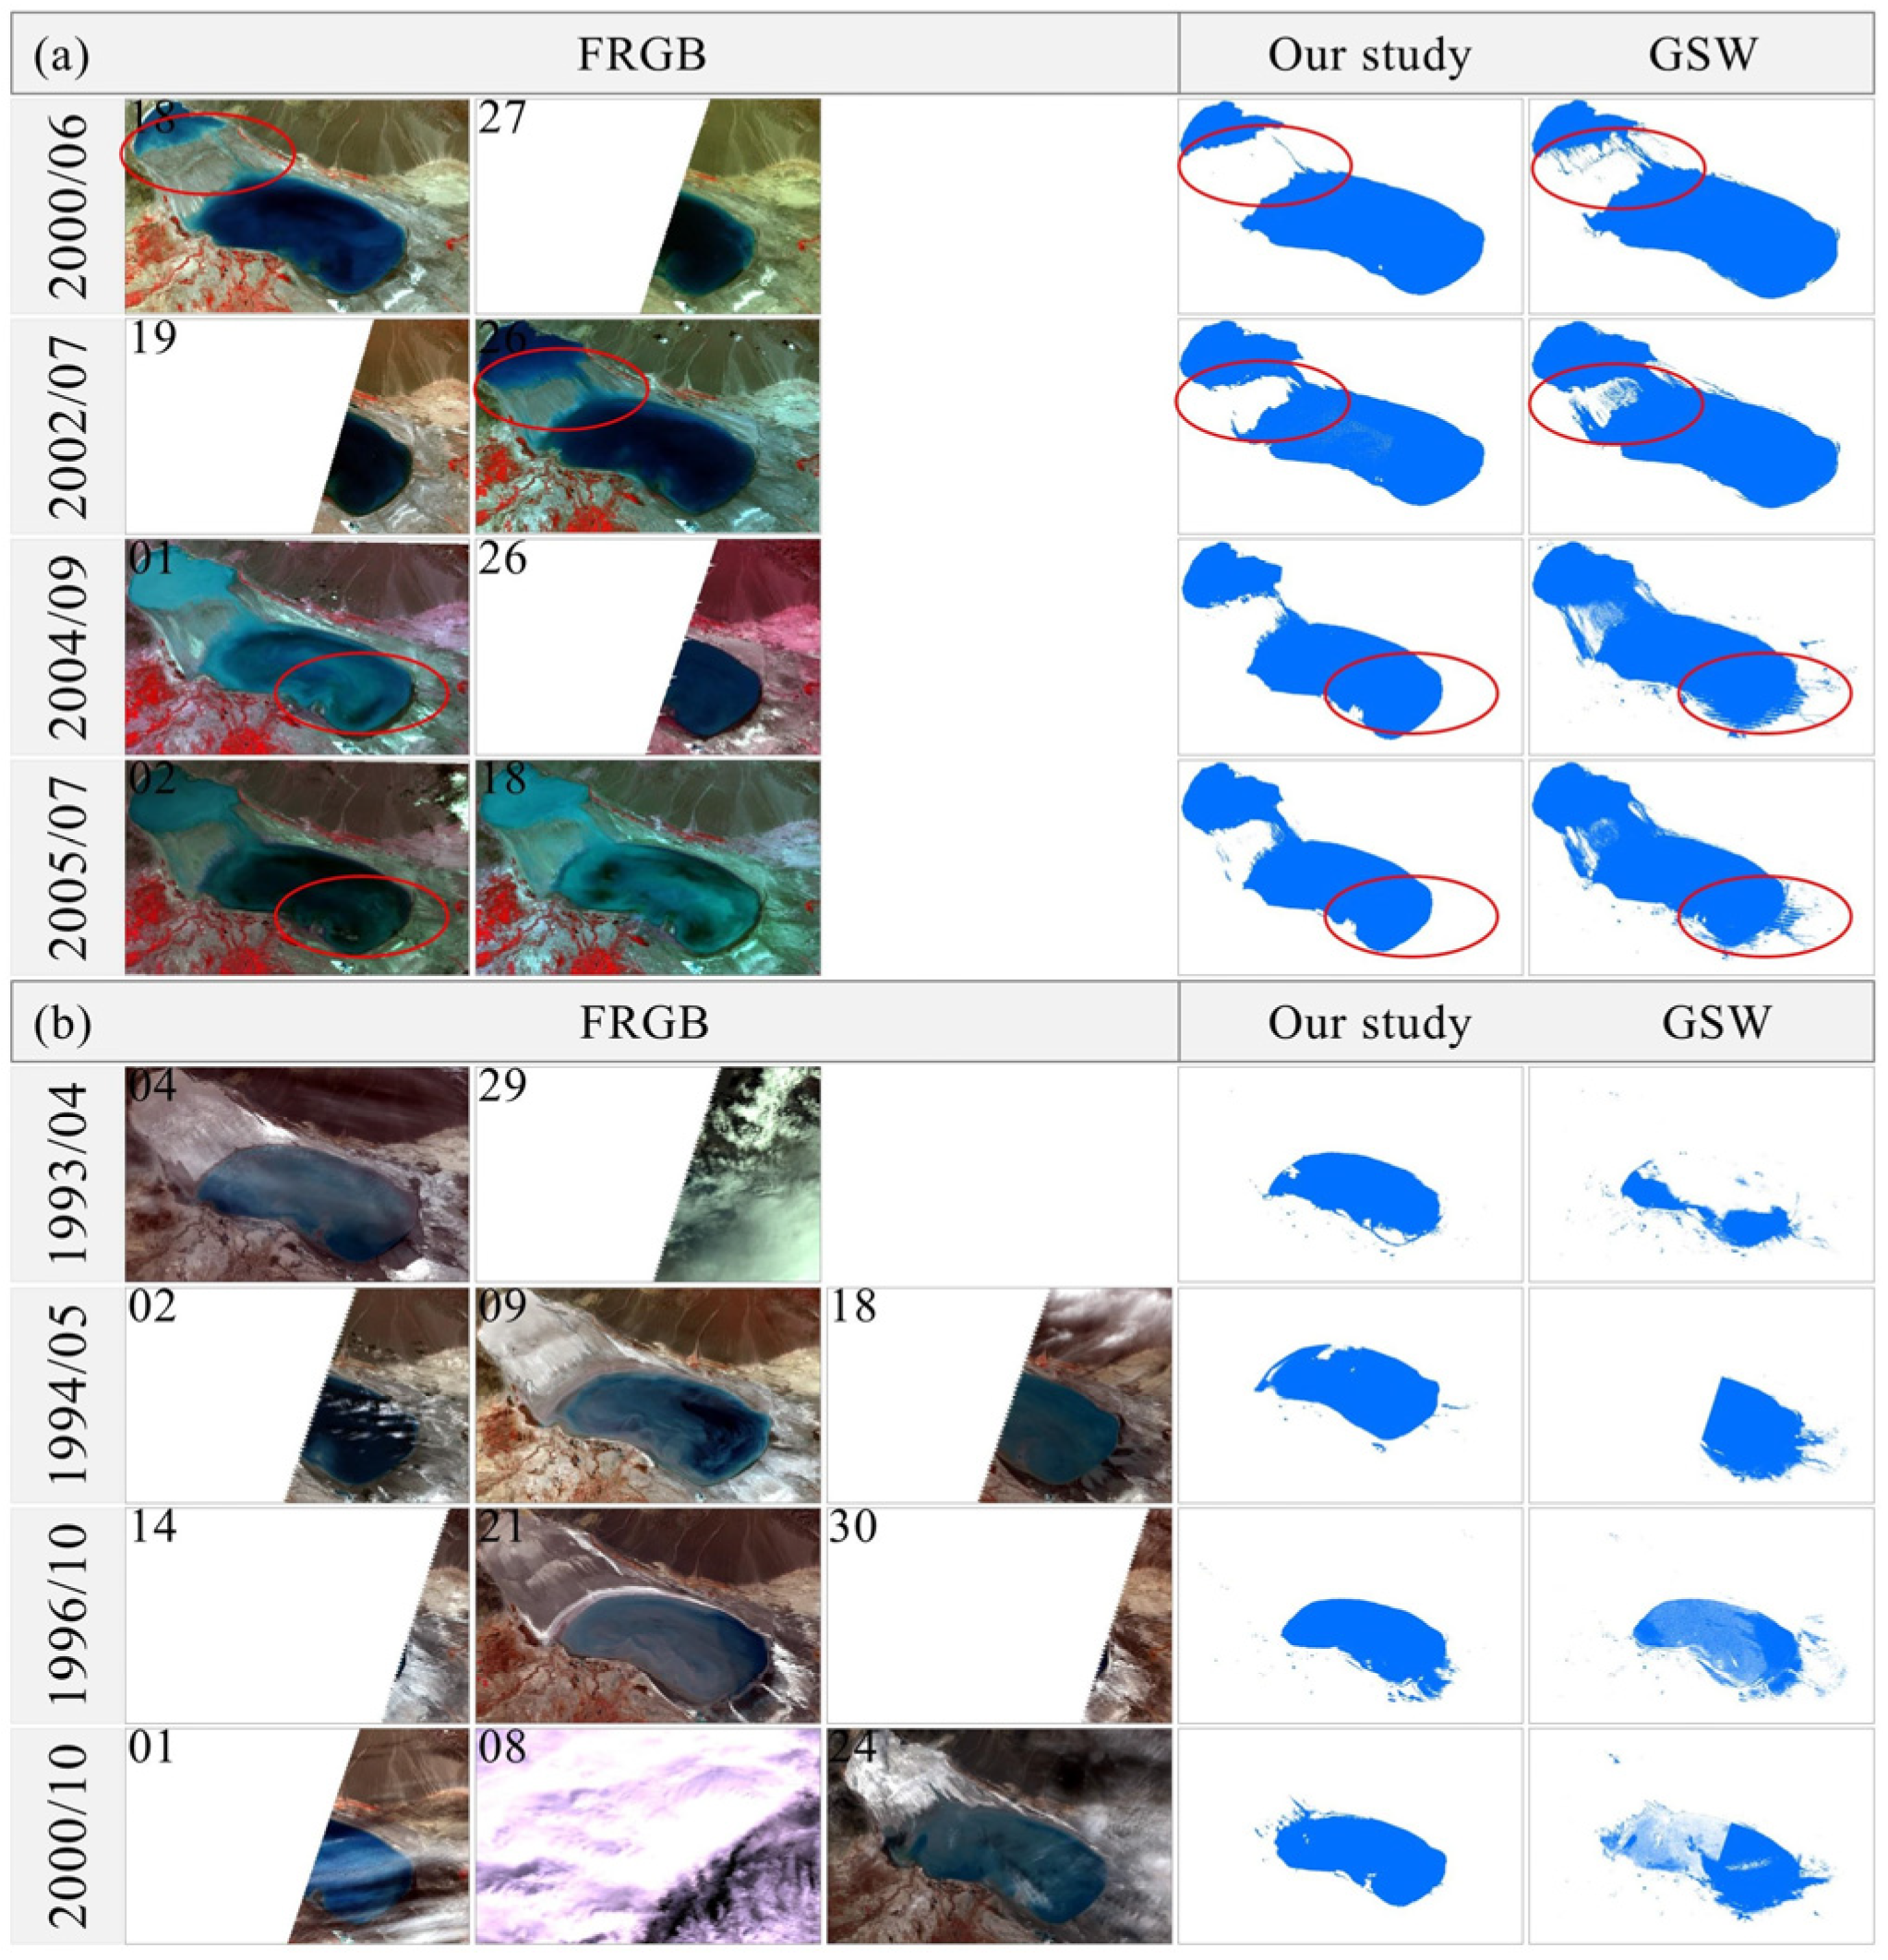
Released by the European Commission Joint Research Centre (JRC), the Global Surface Water (GSW) products span the spatial and temporal distribution of surface water [35]. Data covering the Ebinur Lake area were obtained, and the water area was computed to evaluate the accuracy of water extraction. Additionally, four images at a monthly scale were selected to validate GSW, comparing accuracy between our data and actual validation data. Land cover types of 2400 randomly sampled points were determined through visual interpretation, and confusion matrices were computed. The false RGB (FRGB) was also added to compare the differences in extraction positions.

2.3.3. Spatio-Temporal Statistics

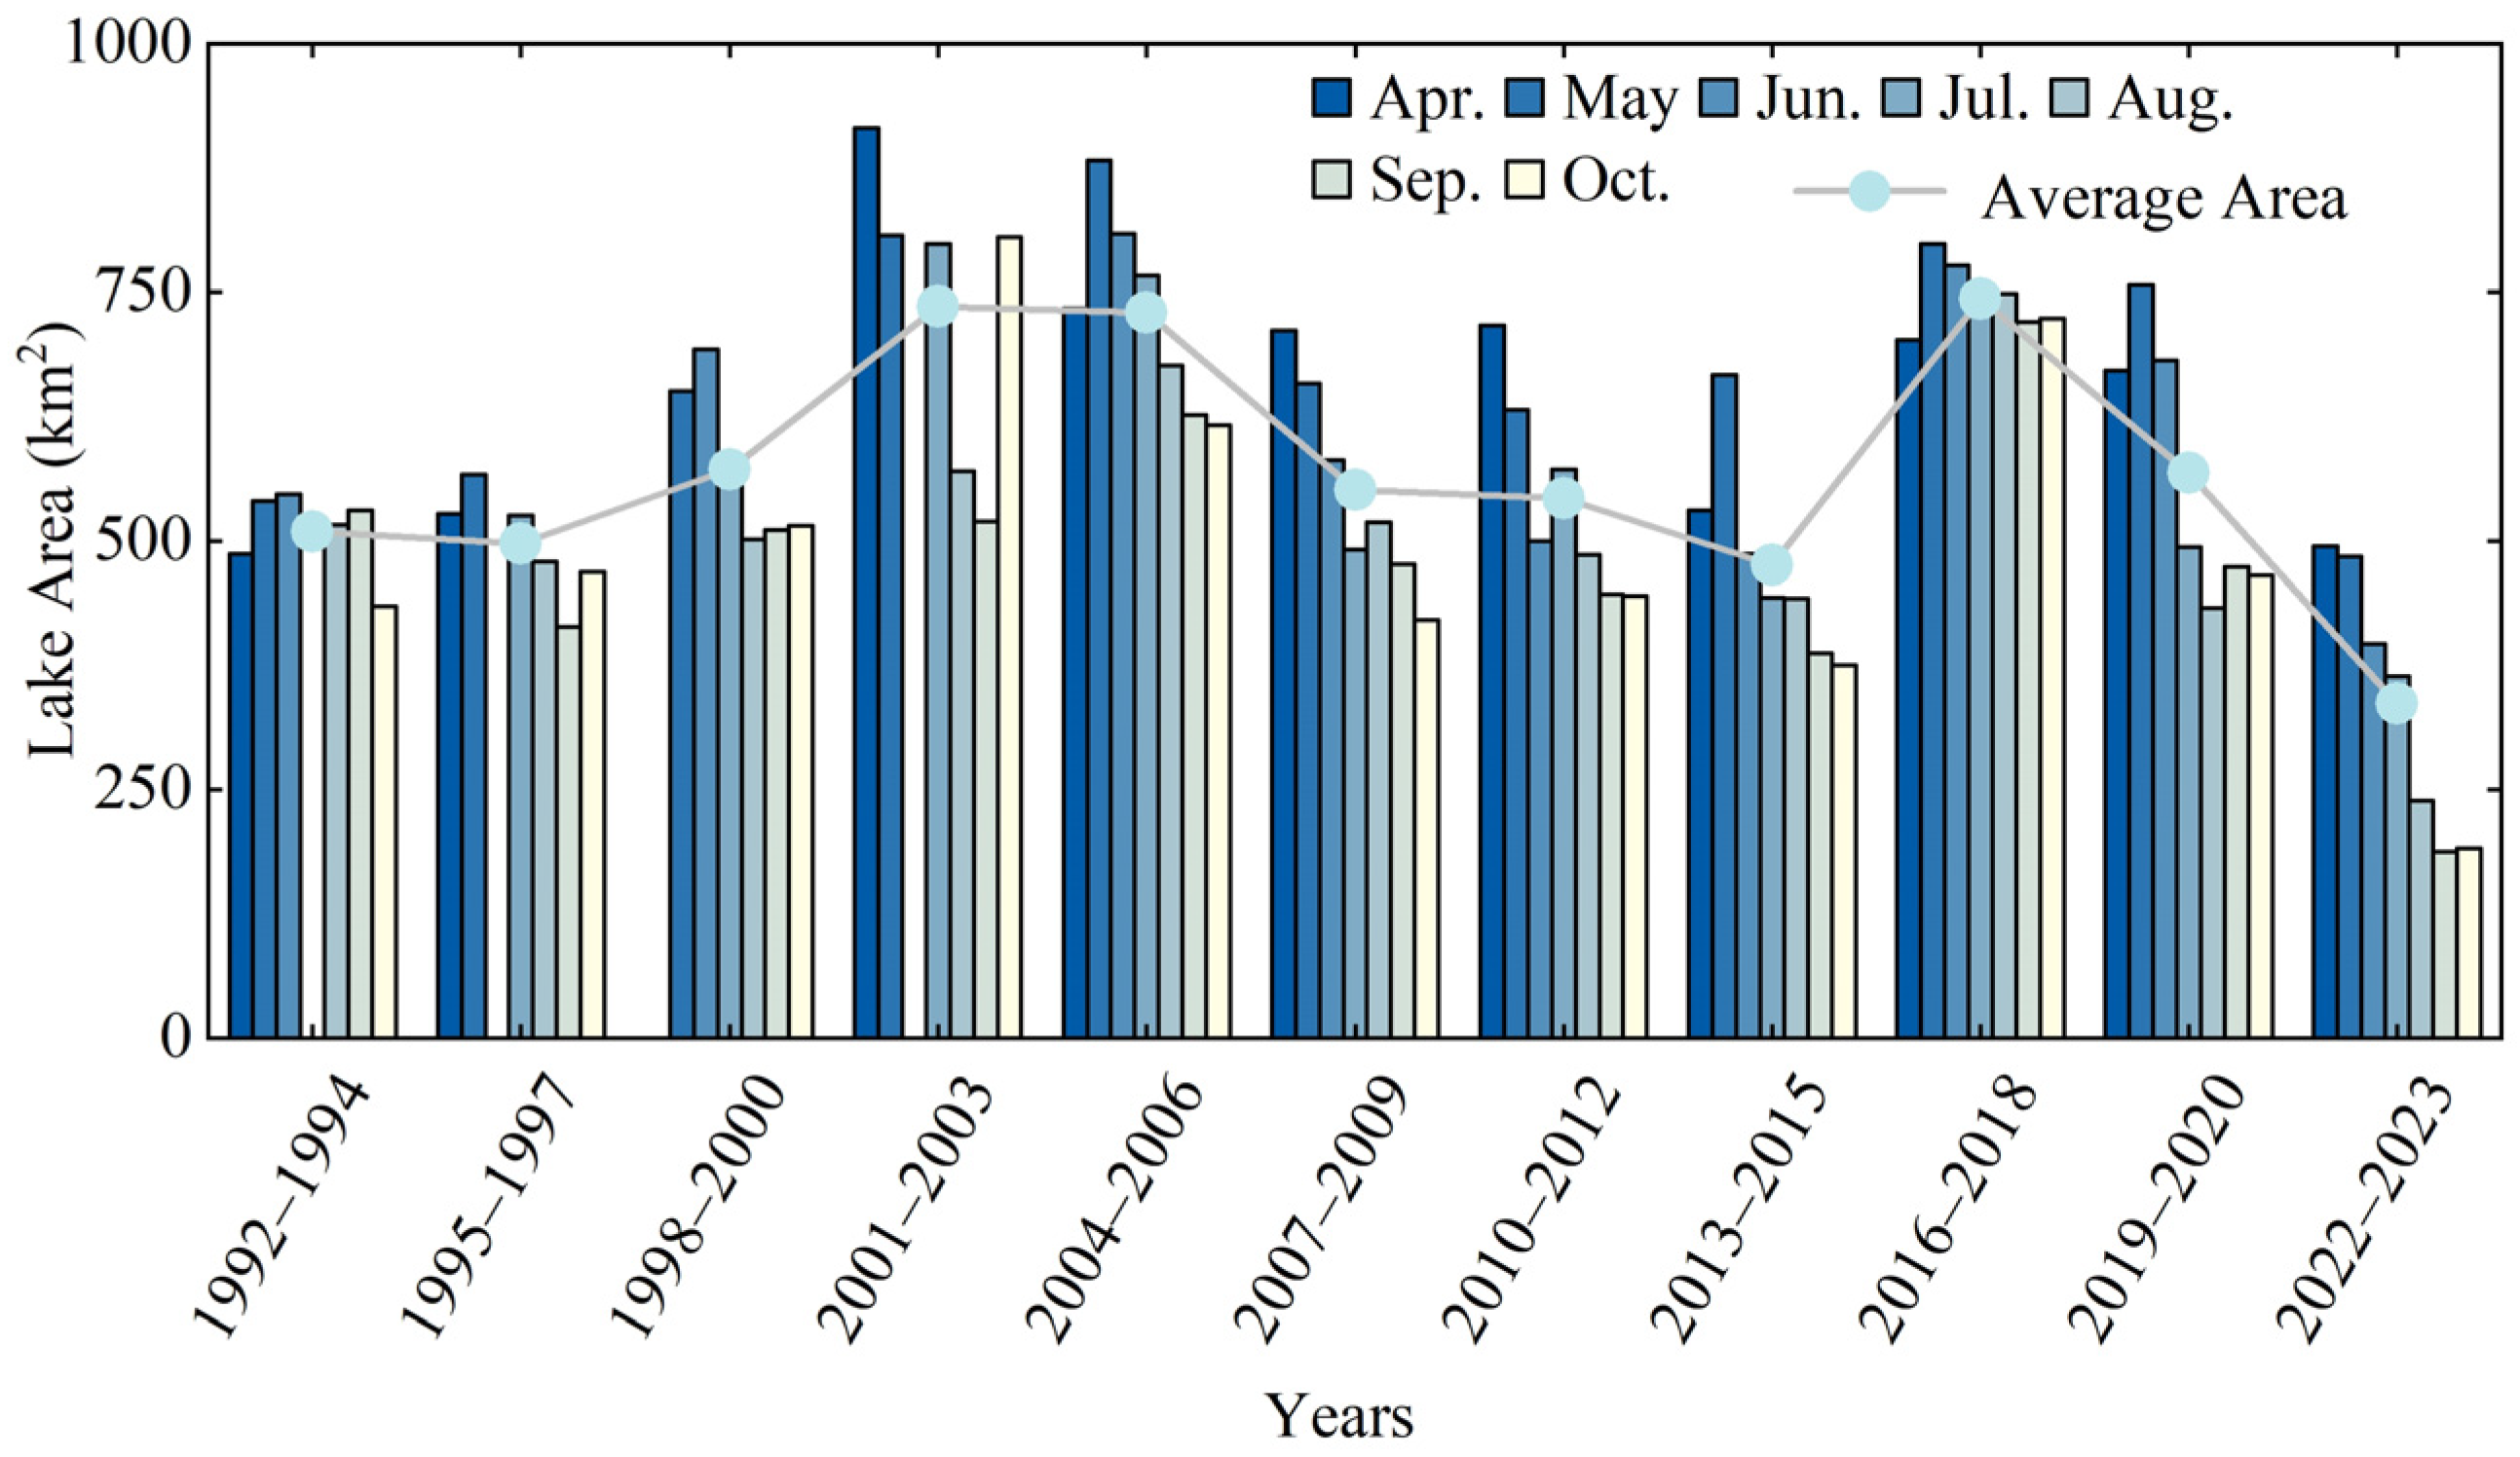
Given the 16-day revisit period of Landsat and persistent cloud contamination, the limited number of available images per year may not meet the statistical requirements for accurately assessing lake areas and changes in trends. Therefore, the lake areas were counted every three years (Figure 3: spatiotemporal statistics).
Water inundation frequency (WIF) is defined as the ratio of the times a pixel is identified as water to the total number of valid observations (Equation (14)):
W I F = i = 1 n S N × 100 %
where N signifies the number of valid observations, S represents a binary variable reflecting the pixel’s location type, where 1 indicates a water body, and 0 indicates a non-water body. Water bodies are divided into three classifications by WIF: high water inundation frequency (WIF ≥ 75%), moderate water inundation frequency (25% ≤ WIF < 75%), and low water inundation frequency (WIF < 25%) [12].
The Mann–Kendall (MK) statistical test and Sen’s slope estimator were utilized to examine monotonic trends and rates of change in time series data [36,37]. The MK test is a non-parametric (distribution-free) method. A positive MK test statistic (Z > 0) signifies an increasing trend, while a negative value (Z < 0) indicates a decreasing trend. In this research, a significance level of p < 0.1 was employed.
Sen’s slope estimator is employed to identify the monotonic trend. This non-parametric method provides a robust linear trend estimation resilient to outliers. For time series data (X = xt1, xt2, xt3, …, xtk), the non-parametric estimation of Sen’s slope is defined as the median of all possible slopes (xtj − xti, tj > ti) from pairs within the dataset (Equation (15)):
Sen s   slope = MEDIAN ( x t j x t i t j t i )

2.4. Analysis of Driving Forces

2.4.1. Source of Data

The inflow volume constitutes a crucial water source [38], and precipitation is acknowledged as a primary driver affecting both runoff and inflow volumes [39]. The waves and currents caused by the wind can erode the lake shore, altering the shape of the lake [40]. The influence of groundwater on lake water levels has led to changes in lake area [41]. Temperature is known to influence evaporation rates, which, in turn, affect the hydrological cycle and subsequently alter lake area [21,42,43,44]. With the development of agriculture, the demand for water resources is increasing. Land use can reflect irrigation conditions to some extent; therefore, cropland is used as a substitute indicator for irrigation [45]. Moreover, the lake area is also affected by human activities [46]. Therefore, these factors and the combined factor (net precipitation: precipitation minus evapotranspiration) were selected to analyze drivers of the lake areas.
The inflow volume was obtained from publications [23,47,48,49,50]. Temperature, precipitation, and wind were sourced from the NOAA’s National Climatic Data Center (NCDC) Global Surface Summary of the Day (GSOD) (GSOD, https://www.ncei.noaa.gov/access/metadata/landing-page/bin/iso?id=gov.noaa.ncdc:C00516) (accessed on 21 March 2024) [51]. GSOD provides near-global coverage for over four decades and contains daily measurements for meteorological variables, and Jinghe meteorological station was selected for this study. Monthly average values were computed for meteorological variables, with precipitation presented as cumulative values. Evaporation data were sourced from a 1 km monthly potential evapotranspiration dataset for China (https://data.tpdc.ac.cn/home) (accessed on 24 July 2024) [52], which provided monthly data from 1901 to 2023 and obtained by using 1 km monthly temperature dataset and theoretical solar radiation calculations. Groundwater data were obtained from ERA5 (https://cds.climate.copernicus.eu/) (accessed on 10 August 2024), specifically, the sub_surface_runoff_sum variable. Cropland data were obtained from the China Land Cover Dataset (CLCD) [53]. Average values for all datasets were computed every three years.

2.4.2. Analysis of Driving Factors

(1) Pearson correlation analysis. An in-depth investigation was conducted to analyze the correlation between changes in the lake area and its driving factors using Pearson correlation analysis [54]. The Pearson correlation coefficient (r) was used to measure the strength of association between the variables, with a p-value of <0.1 indicating a statistically significant correlation.
(2) Centroid movement. Daily changes in water areas were observed using multisource images, including MODIS, Landsat, Sentinel-2, Gaofen (GF), and Huanjing (HJ) satellites. The Zonal Geometry function of ArcGIS was used to calculate the centroids of the lake for each period. Due to the narrow topography of the Alashankou Pass, the study focused on the effects of wind in the main directions (northwest and southeast). The study focused on the main directions (northwest and southeast). Wind speed and direction data were recollected for the 24 h preceding the acquisition time of the satellite images, obtaining the maximum wind speed and direction for each date. For each period, the centroid position on the first observation date was used as the reference point, and the distance of centroid movement in the principal directions relative to this reference point was calculated for subsequent observation dates. Finally, the effects of wind on Ebinur Lake were analyzed based on wind speed, wind direction, centroid movement distance, and lake area.

3. Results

3.1. Ebinur Lake Water Body Extraction Algorithm

3.1.1. Comparison of Different Water Indices

Comparing various water indices (Figure 4), the NDWI significantly highlighted water bodies while effectively suppressing non-water areas, indicating good water extraction performance. While indices such as MNDWI, AWEIsh, AWEInsh, and LWDM effectively highlighted water bodies, they also highlighted non-water body areas, particularly in the intermittent water, connection areas, and the southwestern corner of the lake, suggesting that these indices are not fully effective in accurately extracting water bodies. MAWEI could not distinguish between water and non-water areas. An evaluation of the extraction performance of six water indices showed that NDWI performed best across all evaluation metrics (OA = 98.42%, Kappa = 0.94, precision = 98.82%, recall = 90.83%, F1 Score = 0.945) (Table 2). In contrast, MNDWI, AWEIsh, AWEInsh, and LWDM had relatively lower overall accuracy and Kappa values, especially MAWEI (OA = 39.17%, Kappa = 0.09). Therefore, NDWI was determined to be the optimal water index.
When Ebinur Lake became extremely turbid, the reflectance in the NIR band increased, leading to a decrease in the NDWI values. This inability to distinguish between water and non-water bodies resulted in the inclusion of a large number of non-water areas within the water extraction scope (Figure 5). NDWIturbid water index demonstrated good separability. By analyzing the numerical distribution of 600 randomly sampled points under extremely turbid conditions, the threshold for NDWIturbid was determined to be 0.19.

3.1.2. Validation

A total of 6,938 samples were correctly extracted out of 7,200 visually interpreted samples, with an overall accuracy of 96.36%, a precision of 90.57%, a Kappa coefficient of 0.89, and an F1 Score of 91.54. These results demonstrated the high classification accuracy of the newly proposed dual-index method (Table 3).
The correlation coefficient (r) between the GSW products and the water area in this study was 0.88 (Figure 6). However, the GSW products overestimated the water area compared to our dataset in most months, but with some underestimation. Generally, the GSW products misclassified non-water bodies within the connection areas and lakebed regions (highlighted with red circles), resulting in an overestimation of water areas (Figure 7a). The GSW products might underestimate the water area due to the presence of clouds and the omission of some high-quality images in a month (Figure 7b). In addition, our data products exhibited higher consistency with GSW data in terms of overall accuracy, Kappa coefficient, precision, recall, and F1 Score (Table S1), suggesting a very similar classification capability for surface water bodies between the two datasets. However, our data products showed slightly better performance in overall accuracy, Kappa coefficient, precision, and F1 Score, demonstrating higher reliability in water body identification. These results indicated that our dataset was more efficient in extracting water features in comparison with GSW products.

3.2. Spatio-Temporal Distribution

3.2.1. Spatial Variations

From 1992 to 2023, the average area of Ebinur Lake was 568.74 ± 152.43 km2, demonstrating significant spatial dynamics (Figure 8). High-WIF areas, with 232.61 ± 62.34 km2, were concentrated in the southeastern region of Ebinur Lake, serving as primary water storage zones. Medium-WIF areas averaged 146.17 ± 39.17 km2 and were primarily found in intermittent water areas or adjacent to High-WIF areas. Low-WIF areas, with 189.96 ± 50.91 km2, were situated in the connection areas and around the periphery of Medium-WIF areas.

3.2.2. Inter-Annual Variations

Inter-annually, during the past three decades, the lake area of Ebinur Lake exhibited fluctuations ranging from 336.68 km2 (2022–2023) to 743.37 km2 (2016–2018), with an increasing trend from 1992 to 2006, then decreasing (2006–2015), followed by an increase (2015–2018) and subsequent decrease (2018–2023) (Figure 9). Between 1992 and 1997, the lake area stayed relatively stable, concentrated in core areas. Intermittent water areas started to emerge from 1998 to 2000. However, over the past two decades, the overall extent of the intermittent water areas showed a declining trend. The connection areas began forming from 1998 to 2000, but by 2022 to 2023, most connection areas had disappeared. An analysis of perennially inundated areas (WIF = 100%) showed a minimum from 2022 to 2023, indicating a significant area decrease during these years (Figure 10).

3.2.3. Inner-Annual Variations

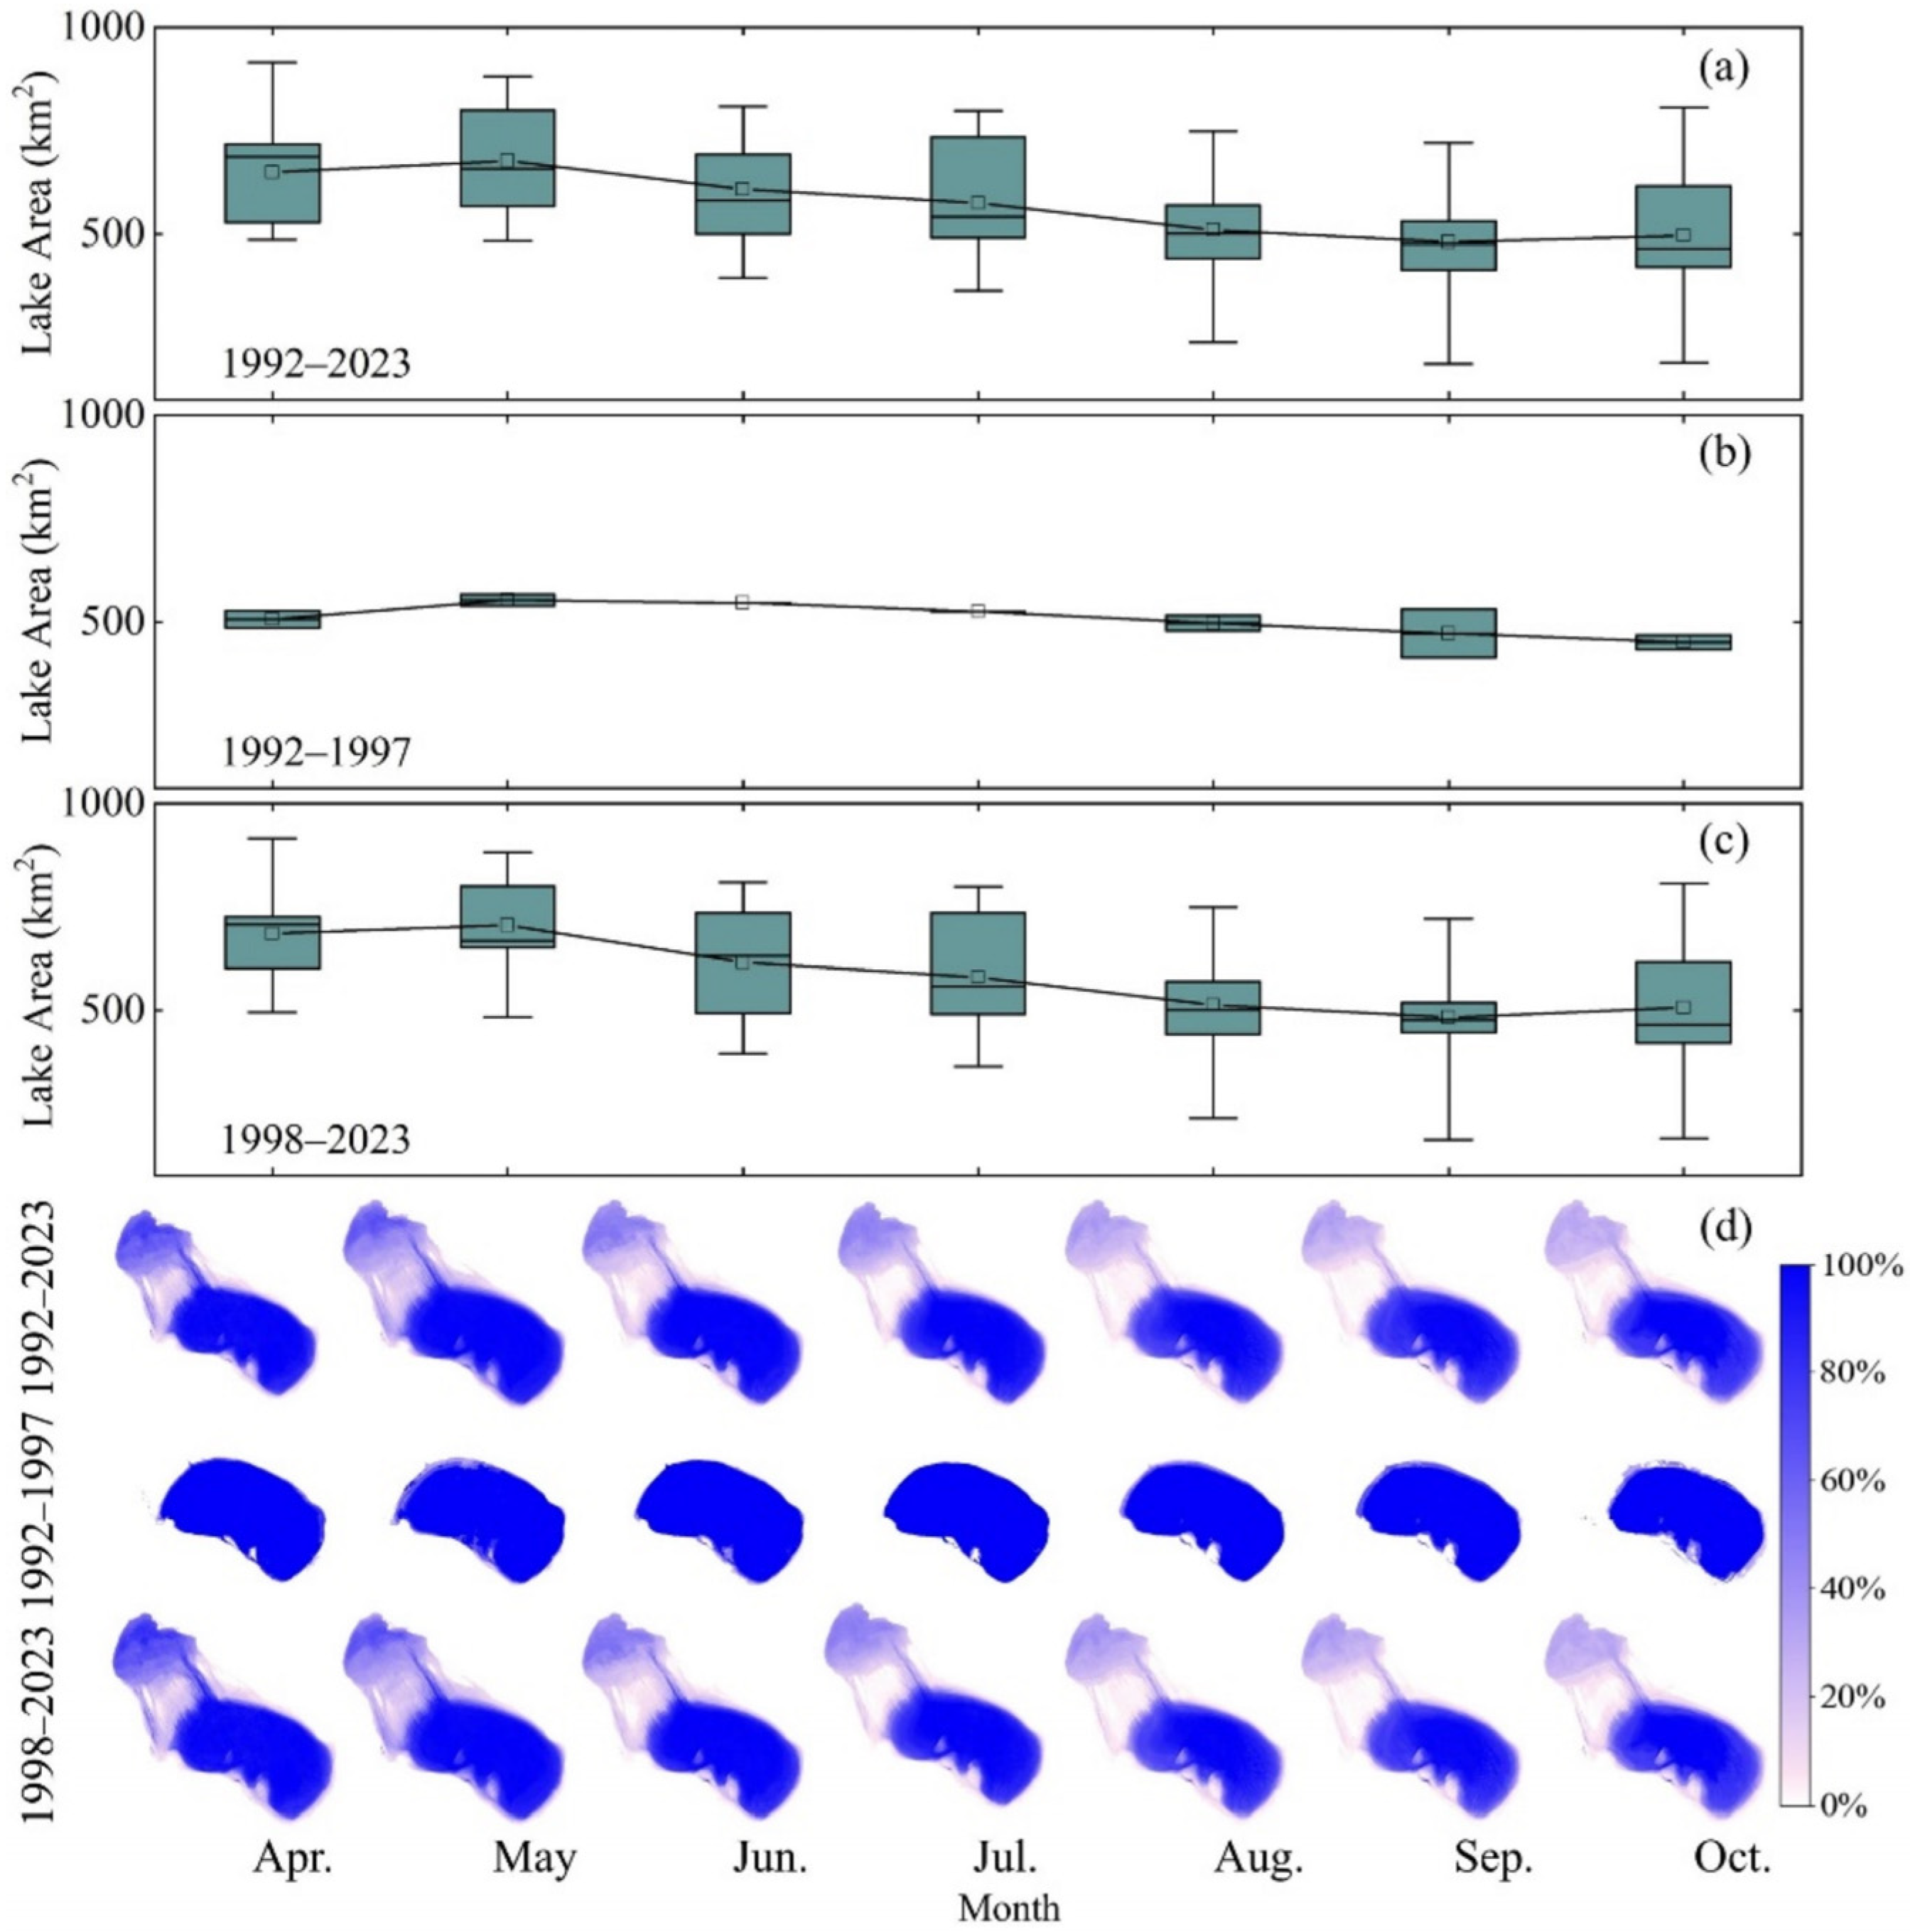
Inner-annually, the lake area of Ebinur Lake exhibited fluctuations ranging from 481.26 ± 129.33 km2 (September) to 676.88 ± 117.22 km2 (May). The area showed an increasing trend from April to May, decreased from May to September, and increased again in October (Figure 11a). Additionally, the variation in the inner-annual area of Ebinur Lake could be divided into two phases. In the first phase (1992–1997), the lake area remained relatively stable (Figure 11b), while in the second phase (1998–2023), the area variation trend was consistent with the overall trend (Figure 11c).
The WIF significantly changed from April to October (Figure 11d). The intermittent areas were more extensive in spring than in other seasons but decreased month by month. The connection areas showed a decreasing trend month by month, with no changes in the core areas. Moreover, from 1992 to 1997, the range of Ebinur Lake remained stable, primarily consisting of the core areas with no intermittent or connection areas. Starting from 1998, the spatial variation trends were consistent with the overall trend. An analysis of perennially inundated areas (WIF = 100%) across different months showed that the range of Ebinur Lake was relatively stable in April, while the extent of lake range changes was most dramatic in October.

3.3. Driving Factors

3.3.1. Drivers of Inter-Annual Variations

The relationships between inter-annual lake area and natural and anthropogenic factors were analyzed to identify potential key driving factors influencing inter-annual trends (Figure 12). Overall, the inter-annual lake area of Ebinur Lake was significantly positively correlated with inflow volume (r = 0.87, p < 0.1). No significant correlations were found between the inter-annual lake area and the remaining factors (i.e., temperature, wind speed, precipitation, evaporation, cropland, groundwater, and net precipitation) (p > 0.1).

3.3.2. Drivers of Inner-Annual Variations

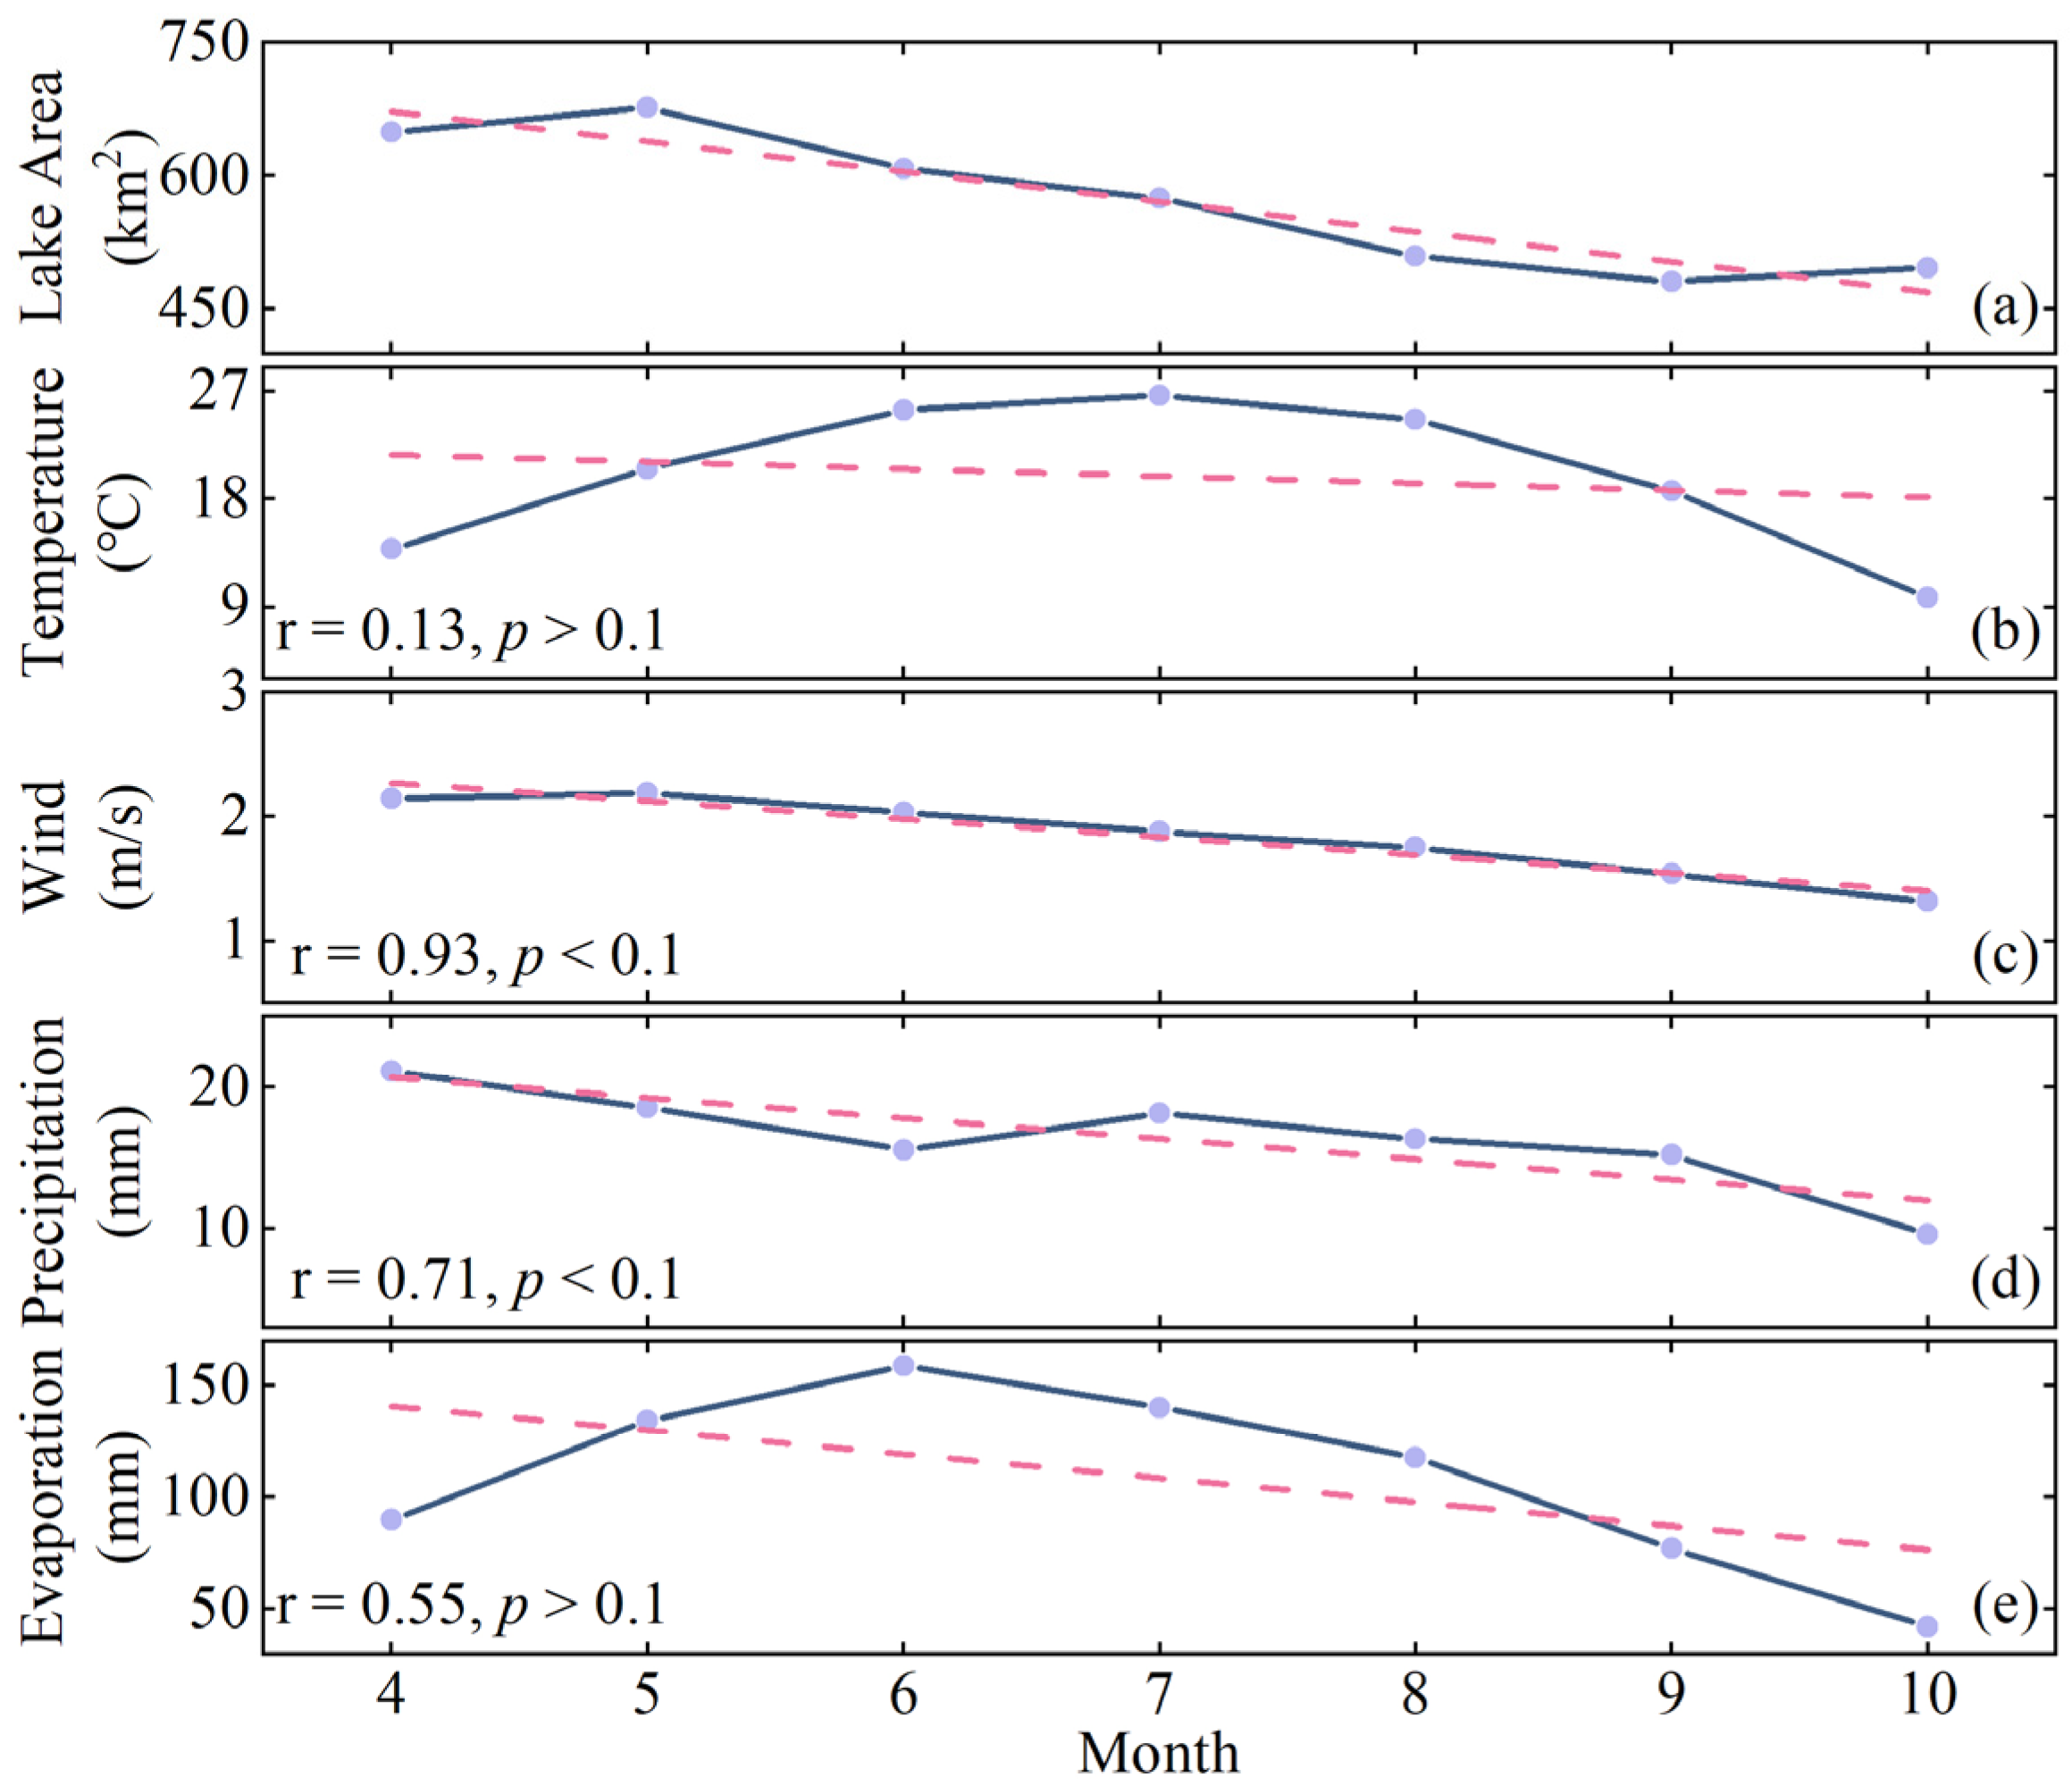
The Pearson correlation analysis was performed between the monthly mean lake area and meteorological factors (precipitation, wind speed, temperature, and evaporation) (Figure 13). The monthly mean lake area was significantly positively related to wind speed (r = 0.91, p < 0.1) and precipitation (r = 0.71, p < 0.1). No significant correlations were found between the monthly mean lake area and the remaining factors (i.e., temperature and evaporation) (p > 0.1).

3.3.3. Drivers of Diurnal Variations

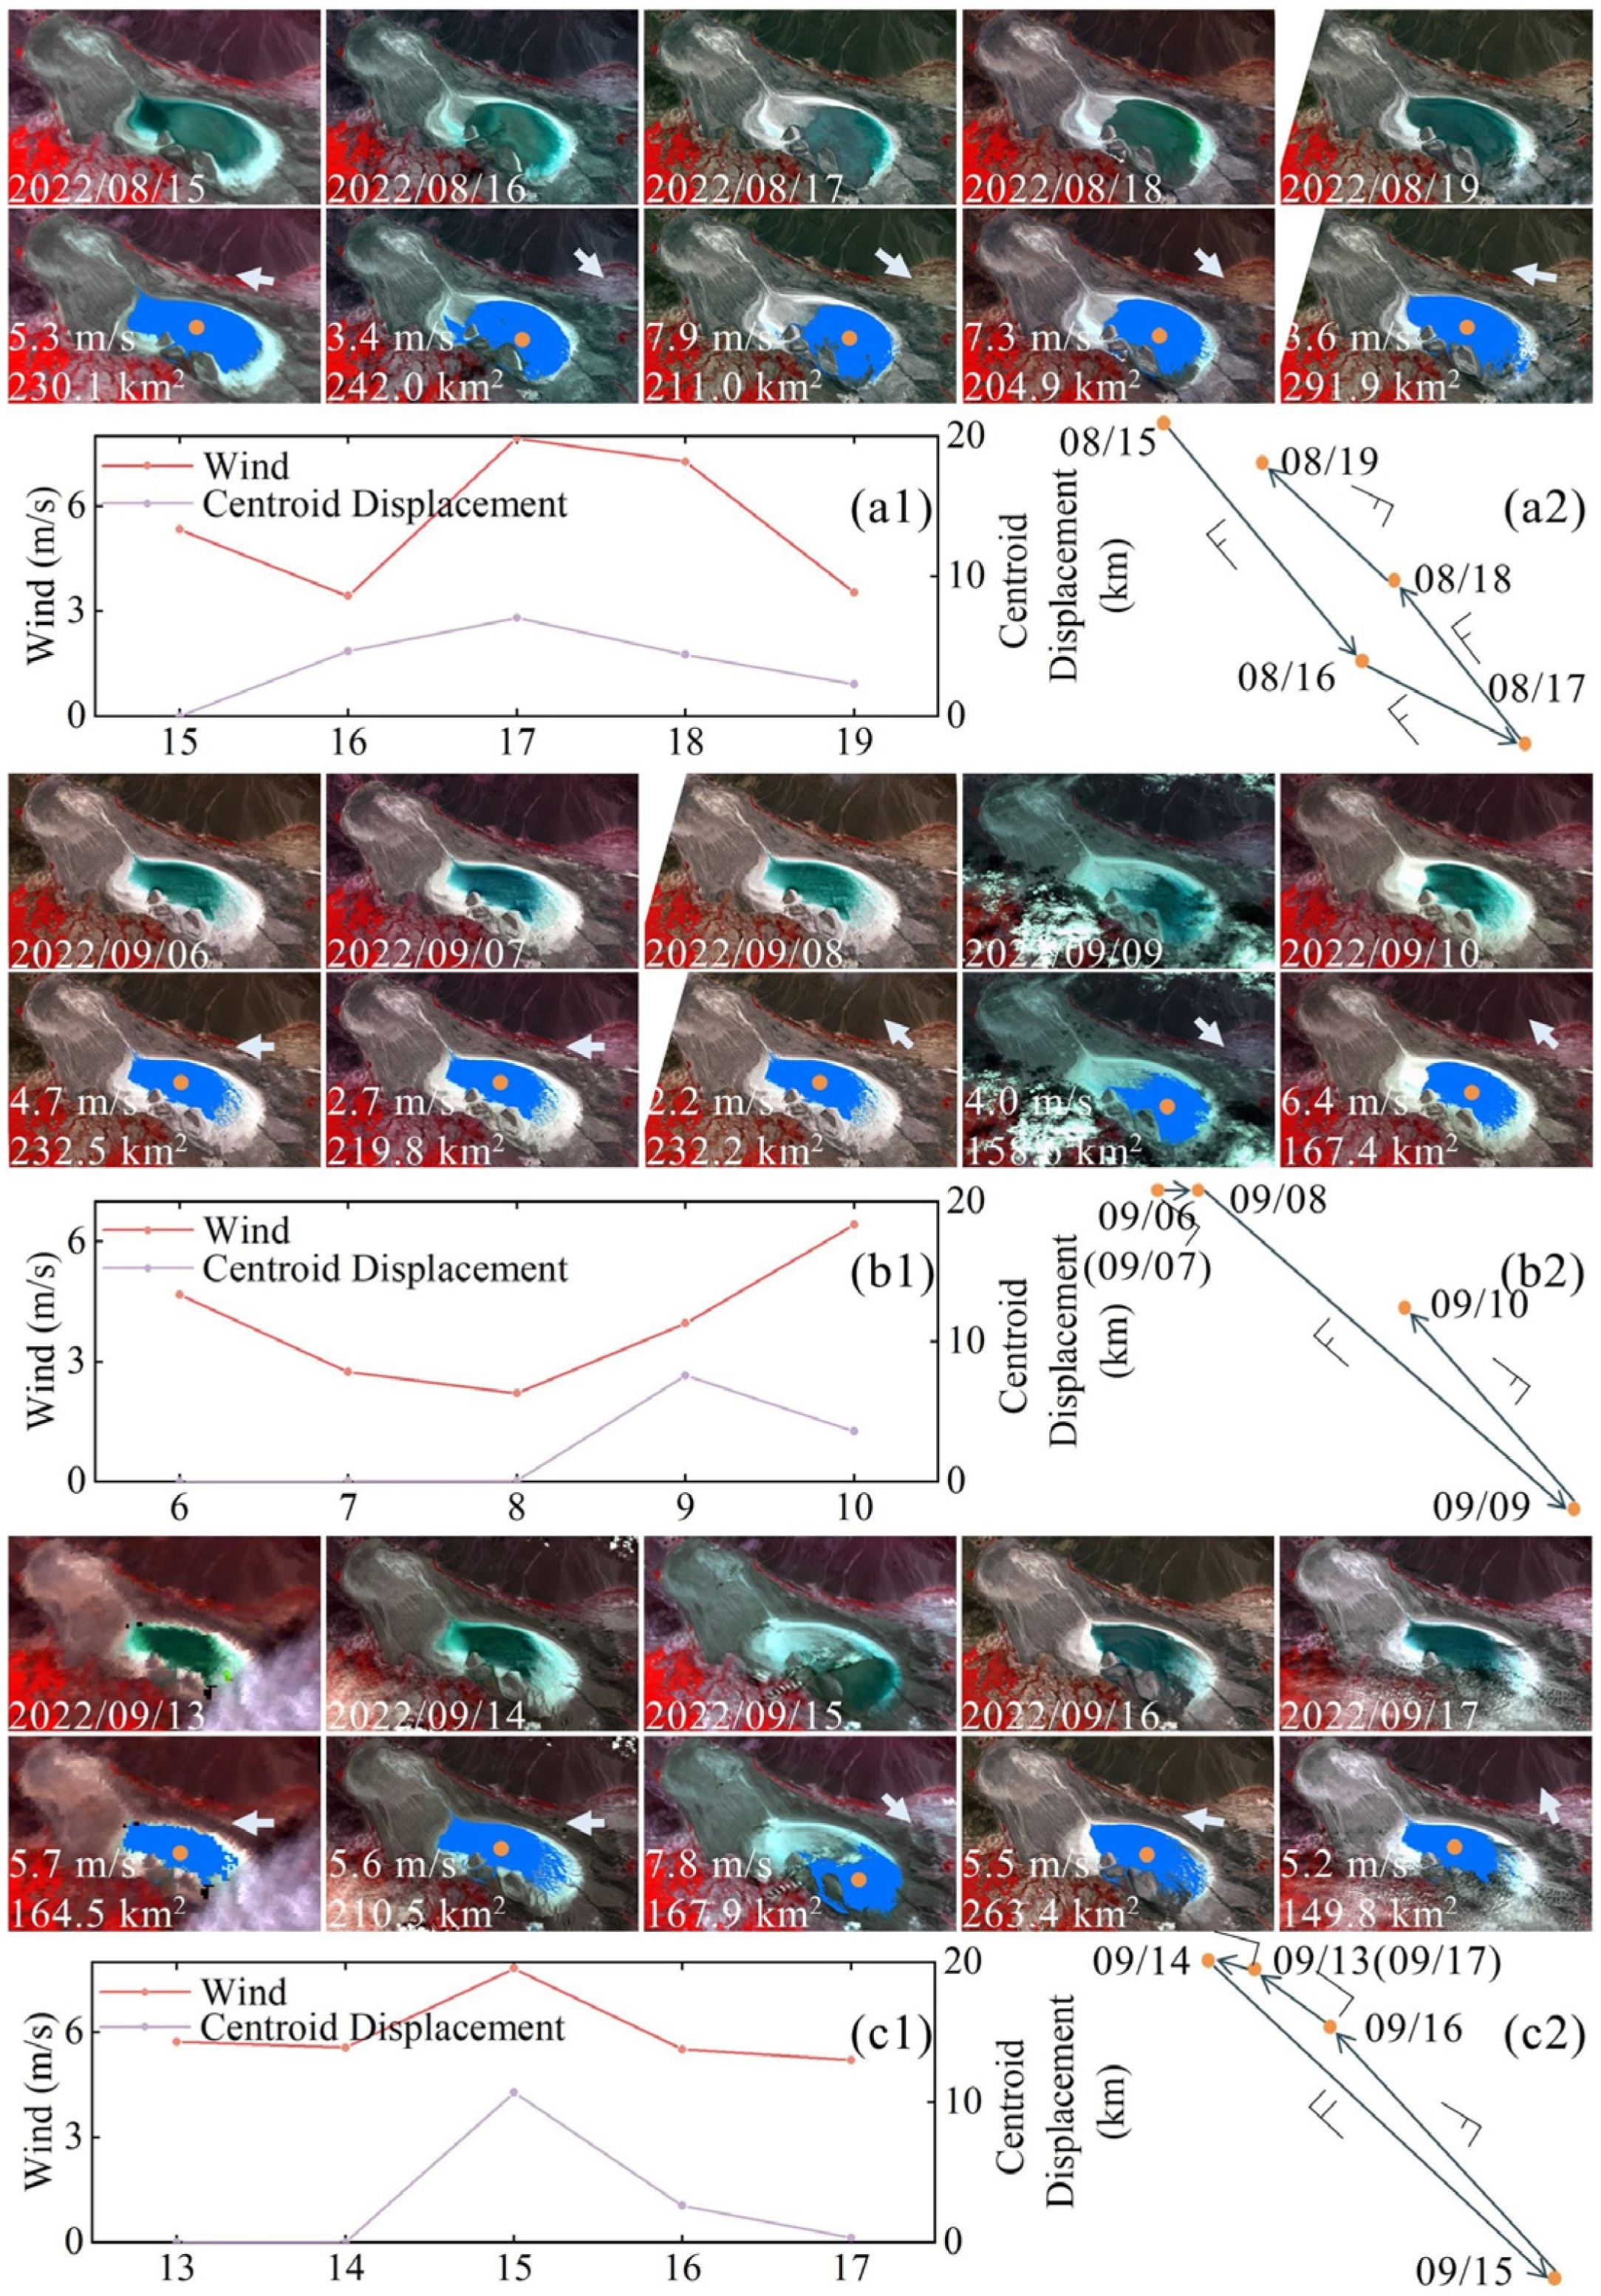
We analyzed the diurnal variations in wind and lake dynamics (Figure 14). For instance, from August 15th to 19th, on August 16th, northwest winds caused a slight southeastward movement of the water area. Subsequently, on the 17th, the northwest winds intensified to 7.9 m/s, significantly increasing the southeastward movement, resulting in the contraction of the northwest portion and the expansion of the southeast portion of the water area. By the 18th, the northwest winds continued to push the water area southeastward. On the 19th, southeast winds restored the water area to its initial state. The relationship between wind speed and centroid displacement indicated significant movement of the lake area with northwest or southeast winds (Figure 14(a1)). The relationship between wind direction and centroid movement direction indicated that wind direction could alter the direction of the water area movement (Figure 14(a2)).
Similarly, from September 6th to 10th, east winds initially had negligible impact on the water area. Although southeast winds on the 8th had limited effect due to their low speed, the northwest winds on the 9th significantly altered the water area dynamics: the northwest area shifted southeastward while the southeast area moved in the same direction, resulting in an overall contraction of the water area. The relationship between wind speed and centroid movement distance (Figure 14(b1)) indicated that high-speed winds could induce changes in the water area. Furthermore, the wind direction was consistent with the direction of water area movement (Figure 14(b2)). A comparative analysis from September 13th to 17th revealed similar changes: significant alterations in the water area occurred under northwest or southeast winds (Figure 14(c1,c2)).

4. Discussion

4.1. Analysis of Water Index and Limitations of Otsu Method

By using the QA band and cropping the image range, the image quality was improved. However, formulas such as MNDWI, AWEIsh, AWEInsh, and LWDM included the SWIR1 band, and in the saline–alkali environment surrounding Ebinur Lake (Figure 4), the reflectance of the SWIR band was significantly higher than that of the Green band [55]. This discrepancy led to an expansion of the negative value region in the histogram, causing the Otsu method’s threshold to skew towards non-water areas, resulting in false extractions. Additionally, the histogram of the MAWEI index lacked a distinct bimodal feature, making it ineffective for determining the threshold using Otsu, which led to extensive misclassification. In contrast, NDWI was unaffected by saline–alkali soil, effectively suppressing non-water areas [56], facilitating the selection of the Otsu threshold, and also showing excellent performance in domestic satellite imagery (Figure S2). Therefore, NDWI demonstrated greater advantages in the water extraction process at Ebinur Lake.
To further address the limitations of the Otsu method, we explored the Segment Anything Model (SAM) [48], which can segment any object within images, and compared the results with our study (Figure S3). The findings indicated that while SAM effectively mitigated the noise issues arising from saline–alkali regions, its extraction precision varied under different conditions. Notably, it struggled with the extraction of turbid water bodies, leading to significant misclassifications. In contrast, our algorithm consistently demonstrated robust performance across various scenarios, effectively avoiding misclassifications even in challenging conditions.

4.2. Runoff Changes Affected by Natural Factors and Policy

Runoff is influenced by both natural factors and human activities, indirectly affecting the lake area. In arid regions, runoff is also dependent on precipitation [48]. Fluctuations in precipitation impact runoff [57], and over the past 30 years, the trend of precipitation has shown significant variability without a clear decreasing trend. However, despite no significant reduction in precipitation, the trends of precipitation and runoff have not always been consistent. For instance, from 2004 to 2015, despite increased precipitation, runoff decreased. When the trends of precipitation and runoff were aligned, such as during 2001 to 2003 and 2016 to 2018, increased precipitation led to increased runoff, indicating that precipitation has a limited direct impact on the lake area. Temperature and evaporation have significant impacts on the lake area. Since 1992, temperatures have steadily risen, and evaporation rates have shown a similar upward trend. This suggests that rising temperatures and increased evaporation may have contributed to water loss, ultimately affecting the lake area. In addition, snow cover and glaciers are essential sources of runoff [58]. As temperatures and evaporation rates continue to rise and precipitation decreases, these trends may lead to a prolonged reduction in the contribution of snow cover and glaciers to runoff. Wind speeds have increased year by year, which could further enhance evaporation rates and contribute to the shrinkage of the lake. Wind may also affect the lake’s water balance by redistributing water vapor, increasing moisture loss. However, the weak correlation between wind speed and lake area suggests that wind speed itself is not a primary driving factor.
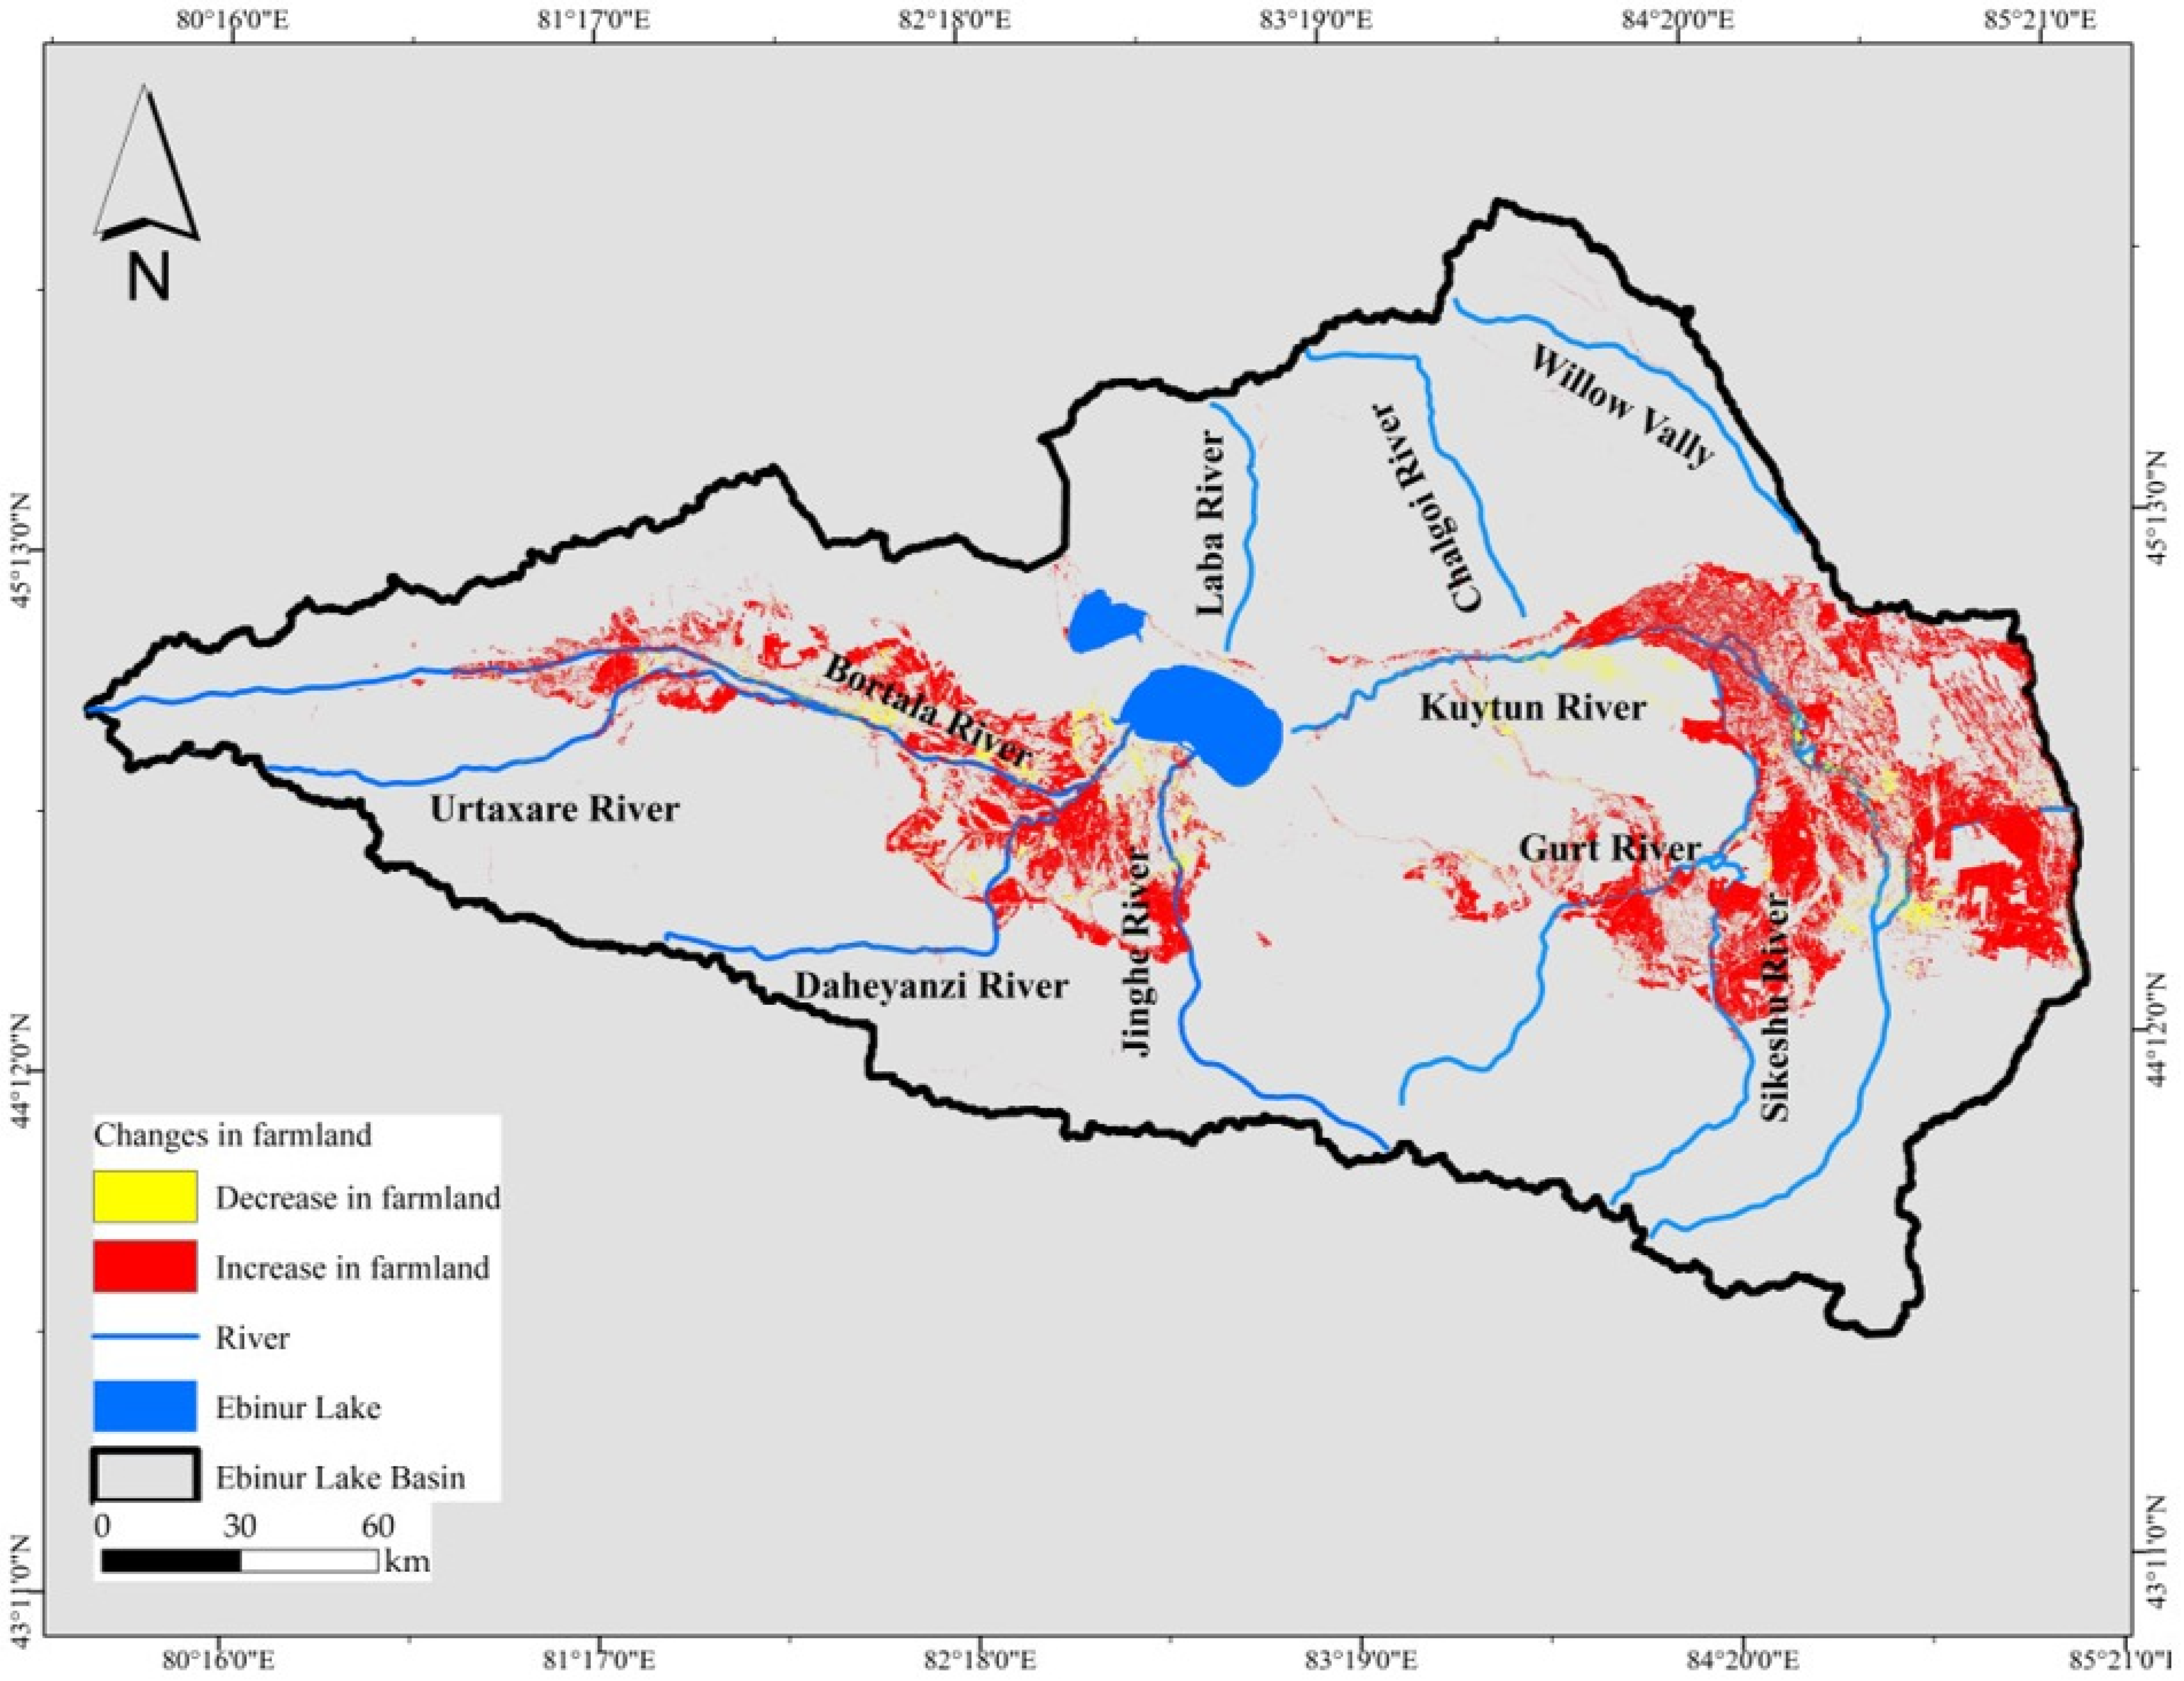
Human activities have had a profound impact on the area of Lake Ebinur [59,60] (Figure 15). Since the 1990s, the Xinjiang government has vigorously promoted the development of the cotton industry, leading to a rapid expansion of cropland [61], which increased the demand for irrigation water and reduced runoff, contributing to a decrease in the lake area. Particularly in the 21st century, cropland areas in the upstream and midstream regions of the rivers have continued to expand [56,62] (Figure 16), further reducing the water area of Lake Ebinur. Moreover, groundwater could be an important source of replenishment for the lake when surface water inflow decreases, but as agricultural demand increases, groundwater extraction may further reduce its contribution to the lake’s water levels.
Dam constructions in 1994, 1996, and 2012 significantly reduced runoff, leading to a decrease in the lake area [63]. Under a series of policies, the lake area may have shown partial recovery. Notably, the 1998 “Management Measures for Aquatic Resources such as Brine Shrimp in the Bortala Mongolian Autonomous Prefecture of Lake Ebinur”, the national government’s Grain for Green policy launched in 2000, and the Xinjiang Environmental Protection Plan (2018 to 2022) all contributed to these efforts. However, it is worth noting that the lake area has decreased again since 2018, indicating the need for strengthened government policies and regulations.

4.3. Climate Dominates Seasonal Changes

The Ebinur Lake area is characterized by a temperate continental arid climate with significant seasonal rainfall variations. On the monthly scale, precipitation decreased incrementally (Figure 13d) [61]. During periods of heavy rainfall, runoff flowed into rivers or lakes, increasing the lake area; conversely, during periods of sparse rainfall, the supply to rivers and lakes decreased, leading to a reduction in lake area [57].
Temperature was a crucial factor influencing snow and glacier melt, affecting river flow and the lake area [64]. At the monthly scale, temperatures typically rose in April and May, triggering the melting of glaciers and snow within the basin (Figure 13b). Combined with seasonal rainfall, this increased runoff and, consequently, the lake area. However, during summer and autumn, the lake area decreased due to the high evaporation from increased temperatures (Figure 13e) and reduced rainfall, combined with the increased demand for irrigation in the surrounding cropland.
The wind in the Ebinur Lake exhibited distinct seasonal variations (Figure 13c). Winds were stronger in spring and relatively weaker in summer and autumn. The higher wind speeds in spring were attributed to frequent alternations between warm and cold air masses, which created a significant pressure gradient and increased wind strength. Coupled with Ebinur Lake’s average depth of 1.4 m and its flat lakebed [23], the lake was particularly susceptible to wind influences, which stirred up waves and currents, altered the lake’s shape, and increased its area.

4.4. Wind Dominates the Daily Dynamic Changes of the Water Body in Ebinur Lake

Ebinur Lake experiences frequent changes in wind direction and speed over short periods. Situated below the Alashan Pass, the lake’s surface temperature increased due to solar heating, leading to greater thermal differentials and the formation of strong convection. This convection intensified wind speeds around the lake area [65]. Due to the canyon and wind tunnel effects, combined with the flat terrain, wind speeds became higher. It was important to note that the lake’s response to wind varied under different conditions. The lake area showed almost no change when the entire lake contained water. However, when only the intermittent and core areas had water, the changes were mainly concentrated in the intermittent area, causing a shift in the lake surface towards the connecting area and increasing the lake area. Conversely, when only the core area had water, there was a dramatic change in the lake area, often leading to a decrease in the lake area.

5. Conclusions

The Ebinur Lake plays a crucial role in supporting both the economy and ecology of the Ebinur Lake basin. Based on the NDWI and the NDWIturbid index combinations, we developed a new dual-index method for Landsat (-5, -7, -8, and -9) data to extract water. We mapped the spatial and temporal patterns of the Ebinur Lake area from 1992 to 2023 with the proposed method. Meanwhile, the potential natural and anthropogenic factors of the Ebinur Lake area variations were analyzed. The results showed that the average area of the lake was 568.74 ± 152.43 km2, with highly dynamic variations in the northwest (i.e., intermittent water areas) and the connection between the northwest and core water areas. Inter-annually, the lake area generally showed an initial increase, followed by fluctuations and subsequent decreases. Inner-annually, the lake area decreased from spring to autumn, with May as the largest area and September as the smallest. Inflow primarily drove inter-annual variations in Ebinur Lake, while seasonal variations were influenced by precipitation and wind. Wind was found to be a critical factor in the diurnal changes in water area. This study underscores the critical importance of monitoring lake water areas for understanding the hydrological dynamics of lake variations and for the effective management of local water resources.

Supplementary Materials

The following supporting information can be downloaded at: https://www.mdpi.com/article/10.3390/rs16203876/s1. Figure S1: Reflectance of lakes under normal conditions and extremely turbid conditions in different bands. The blue line on the right represents a typical lake, while the light brown line represents an extremely turbid lake. Figure S2: Results of water body extraction using the double exponential method on different satellite series. It can be seen that the water body extraction performance is good in each satellite series, indicating that domestic satellites demonstrate good performance in water body extraction models. The grayscale histogram shows threshold values, with the orange line indicating the threshold value in the histogram; Figure S3: Comparison of the performances of our study with the SAM method; Table S1: comparison of water body classification metrics between our data and GSW data.

Author Contributions

Conceptualization, Y.L.; methodology, Y.L. and M.S.; software, Y.L.; validation, Y.L.; formal analysis, Y.L.; investigation, Y.L.; resources, Y.L.; data curation, Y.L.; writing—original draft preparation, Y.L.; writing—review and editing, Y.L., M.S., Q.W., D.W., Y.S., T.Q. and H.D.; visualization, Y.L.; supervision, H.D.; project administration, M.S.; funding acquisition, M.S. All authors have read and agreed to the published version of the manuscript.

Funding

This work acknowledges the support of the Natural Science Foundation of Jiangsu Province [BK20221159], the National Natural Science Foundation of China [42201403, 42111540259, and 41971309], the Science and Technology PlanningProject of NIGLAS [NIGLAS2022TJ17], and the Third Comprehensive Scientific Expedition to Xinjiang [2021xjkk1403].

Data Availability Statement

The data presented in this study are available upon request from the corresponding author.

Acknowledgments

The authors sincerely thank all the teachers and classmates who provided guidance and suggestions for this research and gratefully acknowledge the United States Geological Survey for offering free Landsat data.

Conflicts of Interest

The authors declare no conflicts of interest.

References

  1. Fisher, J.B.; Melton, F.; Middleton, E.; Hain, C.; Anderson, M.; Allen, R.; McCabe, M.F.; Hook, S.; Baldocchi, D.; Townsend, P.A. The future of evapotranspiration: Global requirements for ecosystem functioning, carbon and climate feedbacks, agricultural management, and water resources. Water Resour. Res. 2017, 53, 2618–2626. [Google Scholar] [CrossRef]
  2. Cosgrove, W.J.; Loucks, D.P. Water management: Current and future challenges and research directions. Water Resour. Res. 2015, 51, 4823–4839. [Google Scholar] [CrossRef]
  3. Chen, B.; Chen, L.; Huang, B.; Michishita, R.; Xu, B. Dynamic monitoring of the Poyang Lake wetland by integrating Landsat and MODIS observations. ISPRS J. Photogramm. Remote Sens. 2018, 139, 75–87. [Google Scholar] [CrossRef]
  4. Hou, X.; Feng, L.; Chen, X.; Zhang, Y. Dynamics of the wetland vegetation in large lakes of the Yangtze Plain in response to both fertilizer consumption and climatic changes. ISPRS J. Photogramm. Remote Sens. 2018, 141, 148–160. [Google Scholar] [CrossRef]
  5. Lu, S.; Wu, B.; Yan, N.; Wang, H. Water body mapping method with HJ-1A/B satellite imagery. Int. J. Appl. Earth Obs. Geoinf. 2011, 13, 428–434. [Google Scholar] [CrossRef]
  6. Cao, H.; Han, L.; Liu, Z.; Li, L. Monitoring and driving force analysis of spatial and temporal change of water area of Hongjiannao Lake from 1973 to 2019. Ecol. Inform. 2021, 61, 101230. [Google Scholar] [CrossRef]
  7. Huang, C.; Chen, Y.; Zhang, S.; Wu, J. Detecting, extracting, and monitoring surface water from space using optical sensors: A review. Rev. Geophys. 2018, 56, 333–360. [Google Scholar] [CrossRef]
  8. Dronova, I. Object-based image analysis in wetland research: A review. Remote Sens. 2015, 7, 6380–6413. [Google Scholar] [CrossRef]
  9. Tian, S.; Zhong, Y.; Zheng, Z.; Ma, A.; Tan, X.; Zhang, L. Large-scale deep learning based binary and semantic change detection in ultra high resolution remote sensing imagery: From benchmark datasets to urban application. ISPRS J. Photogramm. Remote Sens. 2022, 193, 164–186. [Google Scholar] [CrossRef]
  10. Wulder, M.A.; Loveland, T.R.; Roy, D.P.; Crawford, C.J.; Masek, J.G.; Woodcock, C.E.; Allen, R.G.; Anderson, M.C.; Belward, A.S.; Cohen, W.B. Current status of Landsat program, science, and applications. Remote Sens. Environ. 2019, 225, 127–147. [Google Scholar] [CrossRef]
  11. Valman, S.J.; Boyd, D.S.; Carbonneau, P.E.; Johnson, M.F.; Dugdale, S.J. An AI approach to operationalise global daily PlanetScope satellite imagery for river water masking. Remote Sens. Environ. 2024, 301, 113932. [Google Scholar] [CrossRef]
  12. Zou, Z.; Dong, J.; Menarguez, M.A.; Xiao, X.; Qin, Y.; Doughty, R.B.; Hooker, K.V.; Hambright, K.D. Continued decrease of open surface water body area in Oklahoma during 1984–2015. Sci. Total Environ. 2017, 595, 451–460. [Google Scholar] [CrossRef] [PubMed]
  13. Longfei, S.; Zhenxuan, L.; Fei, G.; Min, Y. A review of remote sensing image water extraction. Remote Sens. Land Resour. 2021, 33, 9–11. [Google Scholar]
  14. Jupp, D.L.; Mayo, K.; Kucher, D.; Heggen, S.; Kendall, S.; Radke, B.; Ayling, T. Landsat Based Interpretation of the Cairns Section of the Great Barrier Reef Marine Park; CSIRO Division of Water & Land Resources: Canberra, ACT, Australia, 1985. [Google Scholar]
  15. Bi, H.; Wang, S.; Zeng, J.; Zhao, Y.; Wang, H.; Yin, H. Comparison and Analysis of Several Common Water Extraction Methods Based on TM Image. Remote Sens. Inf. 2012, 27, 77–82. [Google Scholar]
  16. McFeeters, S.K. The use of the Normalized Difference Water Index (NDWI) in the delineation of open water features. Int. J. Remote Sens. 1996, 17, 1425–1432. [Google Scholar] [CrossRef]
  17. Feyisa, G.L.; Meilby, H.; Fensholt, R.; Proud, S.R. Automated Water Extraction Index: A new technique for surface water mapping using Landsat imagery. Remote Sens. Environ. 2014, 140, 23–35. [Google Scholar] [CrossRef]
  18. Wang, S.; Baig, M.H.A.; Zhang, L.; Jiang, H.; Ji, Y.; Zhao, H.; Tian, J. A Simple Enhanced Water Index (EWI) for Percent Surface Water Estimation Using Landsat Data. IEEE J. Sel. Top. Appl. Earth Obs. Remote Sens. 2015, 8, 90–97. [Google Scholar] [CrossRef]
  19. Pickens, A.H.; Hansen, M.C.; Hancher, M.; Stehman, S.V.; Tyukavina, A.; Potapov, P.; Marroquin, B.; Sherani, Z. Mapping and sampling to characterize global inland water dynamics from 1999 to 2018 with full Landsat time-series. Remote Sens. Environ. 2020, 243, 111792. [Google Scholar] [CrossRef]
  20. Chang, M.X.; Li, P.; Hu, Y.F.; Sun, Y.; Wang, H.J.; Li, Z.H. A new algorithm for mapping large inland water bodies using CYGNSS. Int. J. Remote Sens. 2024, 45, 1522–1538. [Google Scholar] [CrossRef]
  21. Wang, C.; Jiang, W.; Deng, Y.; Ling, Z.; Deng, Y. Long Time Series Water Extent Analysis for SDG 6.6.1 Based on the GEE Platform: A Case Study of Dongting Lake. IEEE J. Sel. Top. Appl. Earth Obs. Remote Sens. 2022, 15, 490–503. [Google Scholar] [CrossRef]
  22. Zhang, F.; Yushanjiang, A.; Jing, Y. Assessing and predicting changes of the ecosystem service values based on land use/cover change in Ebinur Lake Wetland National Nature Reserve, Xinjiang, China. Sci. Total Environ. 2019, 656, 1133–1144. [Google Scholar] [CrossRef] [PubMed]
  23. Wang, J.; Ding, J.; Li, G.; Liang, J.; Yu, D.; Aishan, T.; Zhang, F.; Yang, J.; Abulimiti, A.; Liu, J. Dynamic Detection of Water Surface Area of Ebinur Lake using Multi-source Satellite Data (Landsat and Sentinel-1A) and Its Responses to Changing Environment. Catena 2019, 177, 189–201. [Google Scholar] [CrossRef]
  24. Zhang, F.; Duan, P.; Jim, C.Y.; Johnson, V.C.; Liu, C.; Chan, N.W.; Tan, M.L.; Kung, H.-T.; Shi, J.; Wang, W. An Advanced Spatiotemporal Fusion Model for Suspended Particulate Matter Monitoring in an Intermontane Lake. Remote Sens. 2023, 15, 1204. [Google Scholar] [CrossRef]
  25. Li, Y.M.; Zhang, Y.; Wang, J.; Wang, L.; Li, Y.Y.; Chen, L.X.; Zhao, L.; Kong, Z.C. Preliminary study on pollen, charcoal records and environmental evolution of Alahake Saline Lake in Xinjiang since 4700 cal yr BP. Quat. Int. 2019, 513, 8–17. [Google Scholar] [CrossRef]
  26. Han, L.J.; Liu, D.W.; Cheng, G.S.; Zhang, G.C.; Wang, L.X. Spatial distribution and genesis of salt on the saline playa at Qehan Lake, Inner Mongolia, China. Catena 2019, 177, 22–30. [Google Scholar] [CrossRef]
  27. Xu, H. Modification of normalised difference water index (NDWI) to enhance open water features in remotely sensed imagery. Int. J. Remote Sens. 2007, 27, 3025–3033. [Google Scholar] [CrossRef]
  28. Nie, Y.; Yu, M.; Lan, T. Research on water information extraction based on MAWEI index. J. Earth Environ. 2019, 10, 281–290. [Google Scholar]
  29. Wen, G.; Li, X.; Wu, B.; Wang, X.; Xie, H. An automatic method for delineating lake surfaces in Qaidam Basin using Landsat images. Arid Zone Res. 2022, 39, 774–786. [Google Scholar]
  30. Otsu, N. A threshold selection method from gray-level histograms. IEEE Trans. Syst. Man Cybern. 1979, 9, 62–66. [Google Scholar] [CrossRef]
  31. Xie, H.; Luo, X.; Xu, X.; Pan, H.; Tong, X. Evaluation of Landsat 8 OLI imagery for unsupervised inland water extraction. Int. J. Remote Sens. 2016, 37, 1826–1844. [Google Scholar] [CrossRef]
  32. Du, Z.; Li, W.; Zhou, D.; Tian, L.; Ling, F.; Wang, H.; Gui, Y.; Sun, B. Analysis of Landsat-8 OLI imagery for land surface water mapping. Remote Sens. Lett. 2014, 5, 672–681. [Google Scholar] [CrossRef]
  33. Yan, D. Analysis of Different Turbid Inland Water Mapping Using Landsat Images. Master’s Thesis, Northwest University, Xi’an, China, 2018. [Google Scholar]
  34. Liu, X.F.; Liu, X.D.; Wang, Z.H.; Huang, G.H.; Shu, R. Classification of Laser Footprint Based on Random Forest in Mountainous Area Using GLAS Full-Waveform Features. IEEE J. Sel. Top. Appl. Earth Obs. Remote Sens. 2022, 15, 2284–2297. [Google Scholar] [CrossRef]
  35. Pekel, J.-F.; Cottam, A.; Gorelick, N.; Belward, A.S. High-resolution mapping of global surface water and its long-term changes. Nature 2016, 540, 418–422. [Google Scholar] [CrossRef] [PubMed]
  36. Mann, H.B. Nonparametric tests against trend. Econometrica 1945, 13, 245–259. [Google Scholar] [CrossRef]
  37. Kendall, M.G. Rank Correlation Methods; Griffin: London, UK, 1948. [Google Scholar]
  38. Busker, T.; de Roo, A.; Gelati, E.; Schwatke, C.; Adamovic, M.; Bisselink, B.; Pekel, J.-F.; Cottam, A. A global lake and reservoir volume analysis using a surface water dataset and satellite altimetry. Hydrol. Earth Syst. Sci. 2019, 23, 669–690. [Google Scholar] [CrossRef]
  39. Sharma, P.J.; Patel, P.L.; Jothiprakash, V. Impact of rainfall variability and anthropogenic activities on streamflow changes and water stress conditions across Tapi Basin in India. Sci. Total Environ. 2019, 687, 885–897. [Google Scholar] [CrossRef]
  40. Wu, T.-f.; Qin, B.-q.; Zhu, G.-w.; Zhu, M.-y.; Wei, L.; Luan, C.-m. Modeling of turbidity dynamics caused by wind-induced waves and current in the Taihu Lake. Int. J. Sediment Res. 2013, 28, 139–148. [Google Scholar] [CrossRef]
  41. Javadzadeh, H.; Ataie-Ashtiani, B.; Hosseini, S.M.; Simmons, C.T. Interaction of lake-groundwater levels using cross-correlation analysis: A case study of Lake Urmia Basin, Iran. Sci. Total Environ. 2020, 729, 138822. [Google Scholar] [CrossRef]
  42. Yao, C.; Wang, Y.; Chen, Y.; Wang, L.; Yao, J.; Xia, B. Meteorological driving factors effecting the surface area of Ebinur Lake and determining associated trends and shifts. Front. Environ. Sci. 2022, 10, 994260. [Google Scholar] [CrossRef]
  43. Salerno, F.; Gambelli, S.; Viviano, G.; Thakuri, S.; Guyennon, N.; D’Agata, C.; Diolaiuti, G.; Smiraglia, C.; Stefani, F.; Bocchiola, D. High alpine ponds shift upwards as average temperatures increase: A case study of the Ortles–Cevedale mountain group (Southern Alps, Italy) over the last 50 years. Glob. Planet. Chang. 2014, 120, 81–91. [Google Scholar] [CrossRef]
  44. Zhang, G.; Yao, T.; Chen, W.; Zheng, G.; Shum, C.; Yang, K.; Piao, S.; Sheng, Y.; Yi, S.; Li, J. Regional differences of lake evolution across China during 1960s–2015 and its natural and anthropogenic causes. Remote Sens. Environ. 2019, 221, 386–404. [Google Scholar] [CrossRef]
  45. Siebert, S.; Kummu, M.; Porkka, M.; Döll, P.; Ramankutty, N.; Scanlon, B.R. A global data set of the extent of irrigated land from 1900 to 2005. Hydrol. Earth Syst. Sci. 2015, 19, 1521–1545. [Google Scholar] [CrossRef]
  46. Xie, C.; Huang, X.; Mu, H.; Yin, W. Impacts of land-use changes on the lakes across the Yangtze floodplain in China. Environ. Sci. Technol. 2017, 51, 3669–3677. [Google Scholar] [CrossRef] [PubMed]
  47. Wang, J. Detection of terminal lake wetland and its landscape dynamics in arid regions: A case study from Ebinur Lake Wetland. Acta Geod. Cartogr. Sin. 2021, 50, 562. [Google Scholar]
  48. Zhang, F.; Tiyip, T.; Johnson, V.C.; Kung, H.T.; Ding, J.L.; Sun, Q.; Zhou, M.; Kelimu, A.; Nurmuhammat, I.; Chan, N.W. The influence of natural and human factors in the shrinking of the Ebinur Lake, Xinjiang, China, during the 1972–2013 period. Environ. Monit. Assess. 2015, 187, 4128. [Google Scholar] [CrossRef]
  49. Su, X.; Liu, Z.; Wei, T.; Wang, Y.; Liu, Y. Change of Ebinur Lake Area and Its Response Characteristics of the Runoff Change. Res. Soil Water Conserv. 2016, 23, 252–256. [Google Scholar]
  50. Su, H.; Chahan, B.; Pang, C.; Ji, J. Change in Ebinur Lake Area and Its Impact on Eco-environment. J. Glaciol. Geocryol. 2006, 28, 941–949. [Google Scholar]
  51. Kilibarda, M.; Tadić, M.P.; Hengl, T.; Luković, J.; Bajat, B. Global geographic and feature space coverage of temperature data in the context of spatio-temporal interpolation. Spat. Stat. 2015, 14, 22–38. [Google Scholar] [CrossRef]
  52. Peng, S. 1-km Monthly Potential Evapotranspiration Dataset for China (1901–2023). 2024. Available online: http://loess.geodata.cn/data/datadetails.html?dataguid=34595274939620&docid=74 (accessed on 1 July 2024).
  53. Yang, J.; Huang, X. The 30 m annual land cover dataset and its dynamics in China from 1990 to 2019. Earth Syst. Sci. Data 2021, 13, 3907–3925. [Google Scholar] [CrossRef]
  54. Sun, Z.; Luo, J.; Xu, Y.; Zhai, J.; Cao, Z.; Ma, J.; Qi, T.; Shen, M.; Gu, X.; Duan, H. Coordinated dynamics of aquaculture ponds and water eutrophication owing to policy: A case of Jiangsu province, China. Sci. Total Environ. 2024, 927, 172194. [Google Scholar] [CrossRef]
  55. Zhang, F.; Tiyip, T.; Ding, J.; Kung, H.; Johnson, V.C.; Sawut, M.; Tashpolat, N.; Gui, D. Studies on the reflectance spectral features of saline soil along the middle reaches of Tarim River: A case study in Xinjiang Autonomous Region, China. Environ. Earth Sci. 2013, 69, 2743–2761. [Google Scholar] [CrossRef]
  56. Kirillov, A.; Mintun, E.; Ravi, N.; Mao, H.; Rolland, C.; Gustafson, L.; Xiao, T.; Whitehead, S.; Berg, A.C.; Lo, W.-Y. Segment anything. In Proceedings of the IEEE/CVF International Conference on Computer Vision, Paris, France, 2–3 October 2023; pp. 4015–4026. [Google Scholar]
  57. Jing, Y.; Zhang, F.; Wang, X. Monitoring dynamics and driving forces of lake changes in different seasons in Xinjiang using multi-source remote sensing. Eur. J. Remote Sens. 2017, 51, 150–165. [Google Scholar] [CrossRef]
  58. Liu, H.; Chen, Y.; Ye, Z.; Li, Y.; Zhang, Q. Recent Lake Area Changes in Central Asia. Sci. Rep. 2019, 9, 16277. [Google Scholar] [CrossRef] [PubMed]
  59. Immerzeel, W.W.; Droogers, P.; De Jong, S.; Bierkens, M. Large-scale monitoring of snow cover and runoff simulation in Himalayan river basins using remote sensing. Remote Sens. Environ. 2009, 113, 40–49. [Google Scholar] [CrossRef]
  60. Hou, X.; Feng, L.; Tang, J.; Song, X.-P.; Liu, J.; Zhang, Y.; Wang, J.; Xu, Y.; Dai, Y.; Zheng, Y. Anthropogenic transformation of Yangtze Plain freshwater lakes: Patterns, drivers and impacts. Remote Sens. Environ. 2020, 248, 111998. [Google Scholar] [CrossRef]
  61. Zeng, H.; Wu, B.; Zhu, W.; Zhang, N. A trade-off method between environment restoration and human water consumption: A case study in Ebinur Lake. J. Clean. Prod. 2019, 217, 732–741. [Google Scholar] [CrossRef]
  62. Xu, Y.; Cheng, X.; Gun, Z. What Drive Regional Changes in the Number and Surface Area of Lakes Across the Yangtze River Basin During 2000–2019: Human or Climatic Factors? Water Resour. Res. 2022, 58, e2021WR030616. [Google Scholar] [CrossRef]
  63. Liu, Y.; Ye, Z.; Jia, Q.; Mamat, A.; Guan, H. Multi-Source Remote Sensing Data for Lake Change Detection in Xinjiang, China. Atmosphere 2022, 13, 713. [Google Scholar] [CrossRef]
  64. Chen, Y.; Li, W.; Deng, H.; Fang, G.; Li, Z. Changes in Central Asia’s water tower: Past, present and future. Sci. Rep. 2016, 6, 35458. [Google Scholar] [CrossRef]
  65. Abuduwaili, J.; Gabchenko, M.V.; Junrong, X. Eolian transport of salts—A case study in the area of Lake Ebinur (Xinjiang, Northwest China). J. Arid Environ. 2008, 72, 1843–1852. [Google Scholar] [CrossRef]
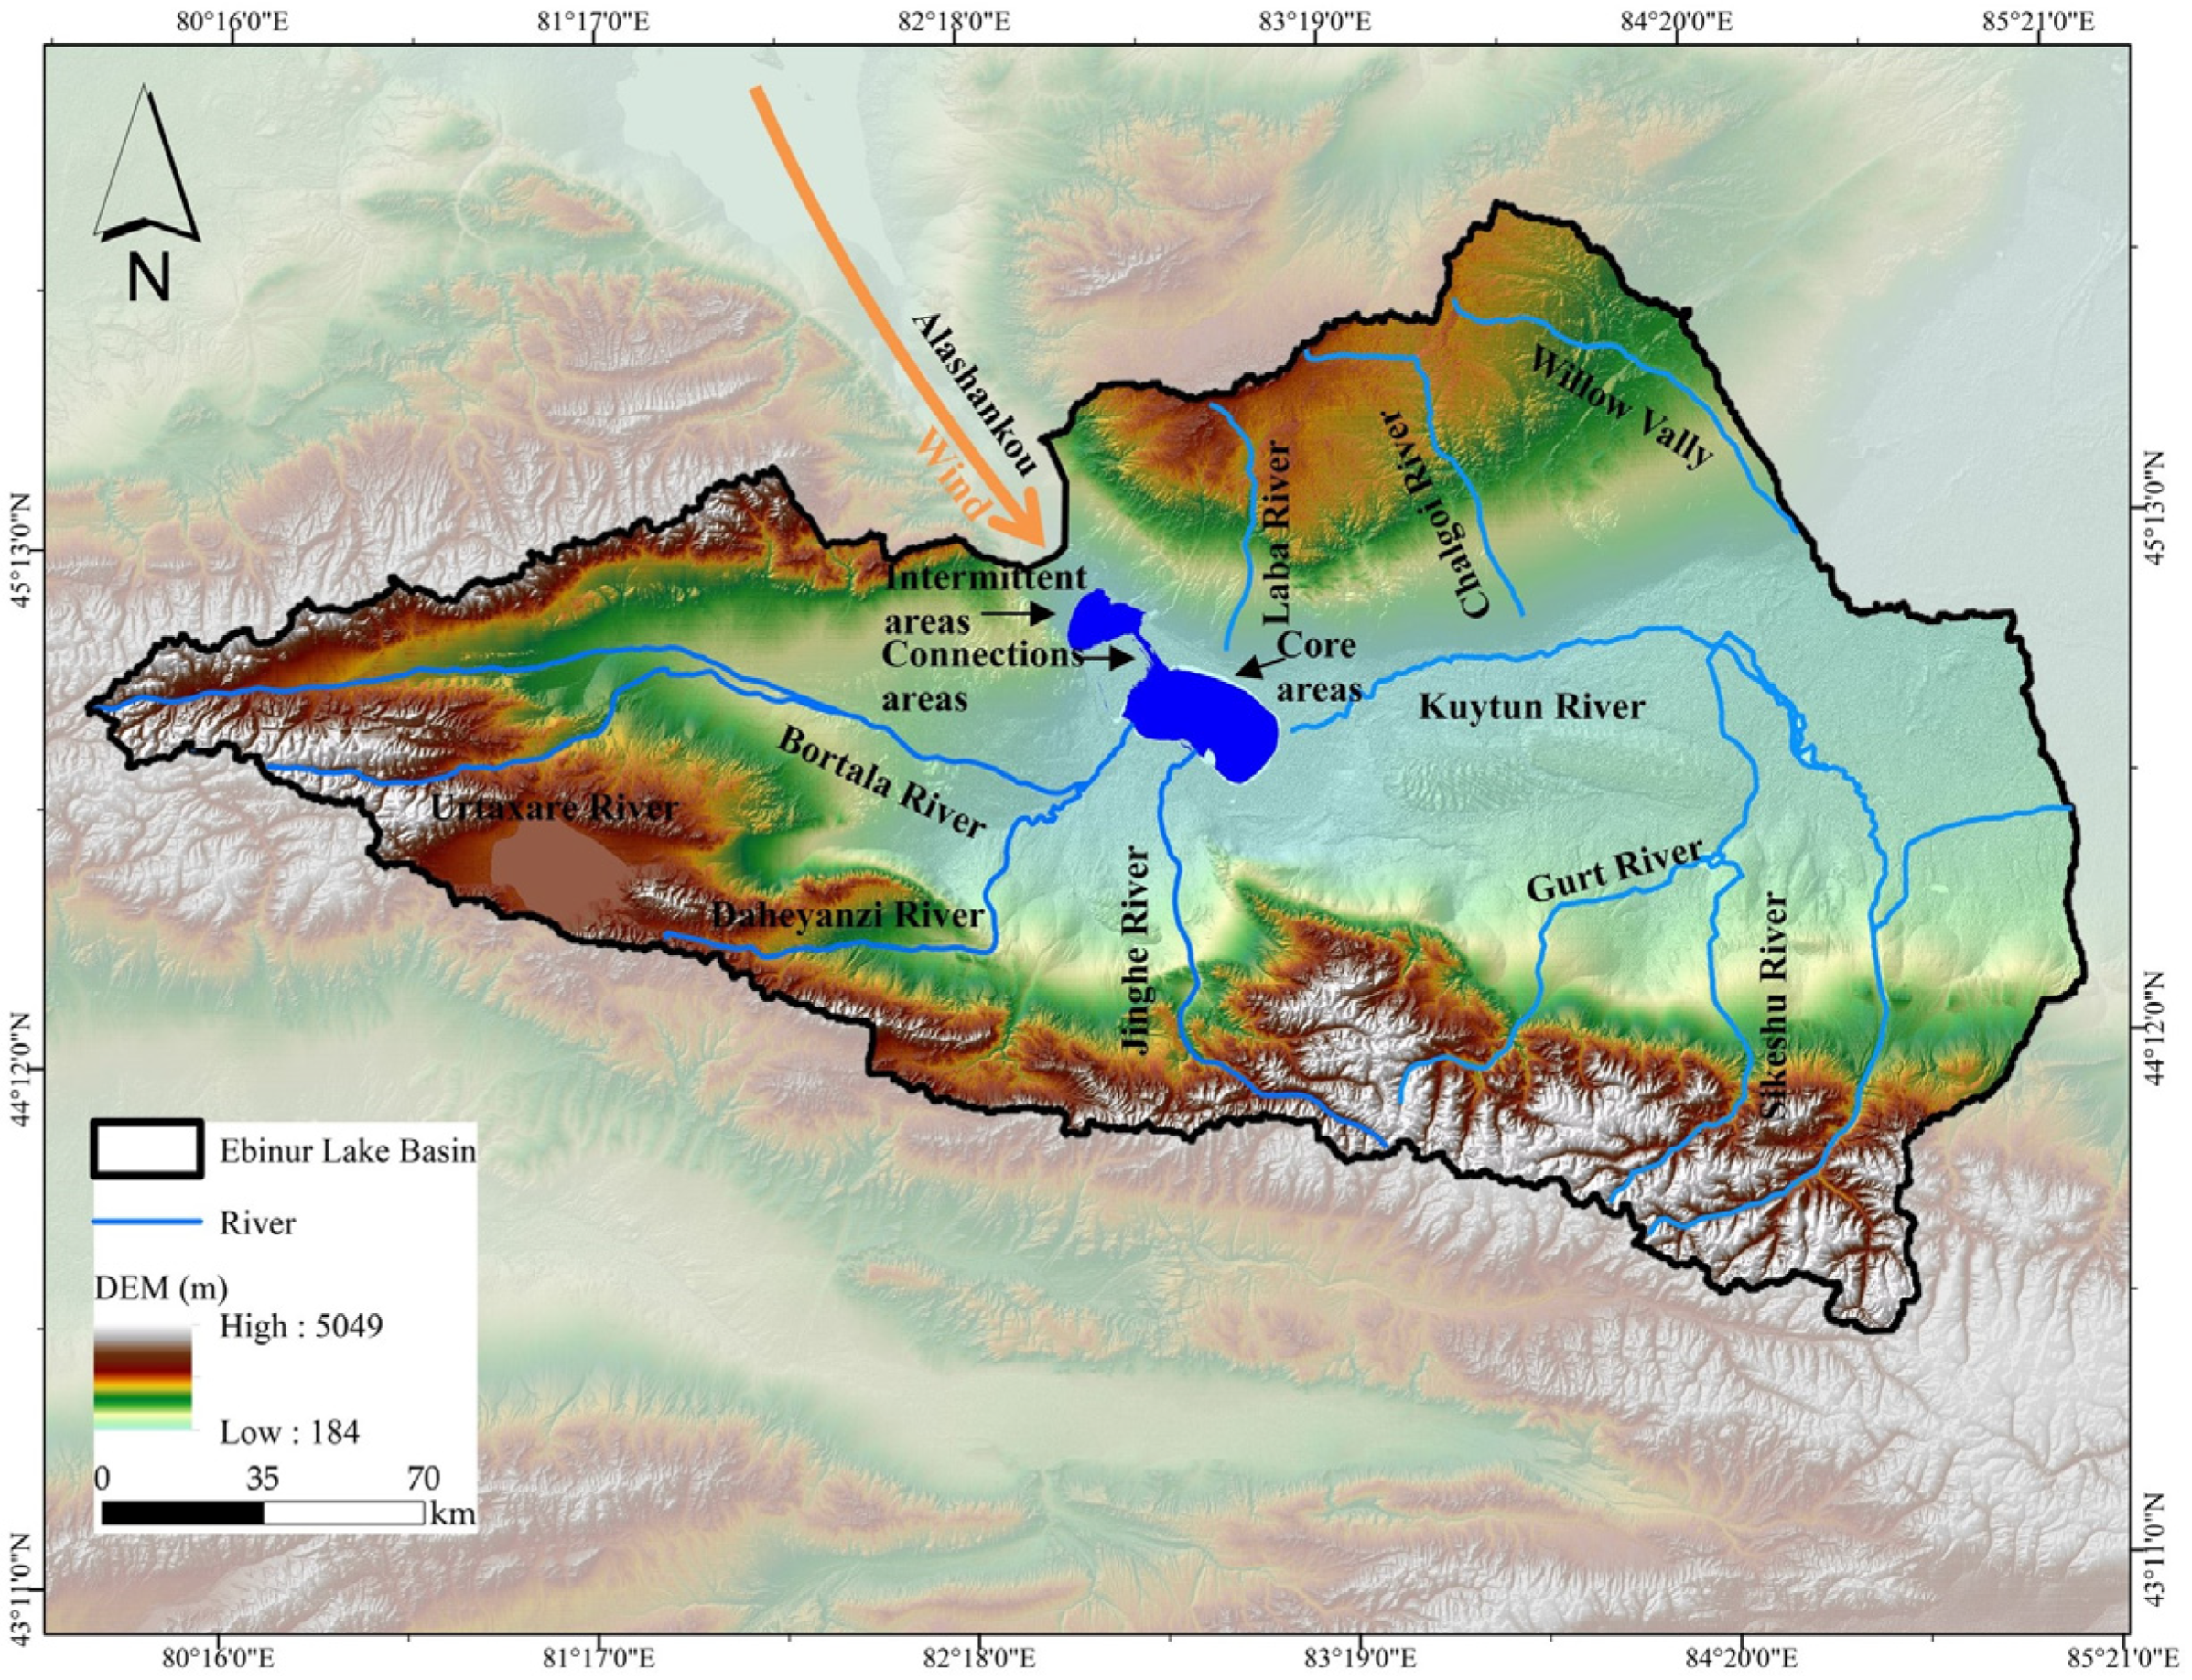
Figure 1. Map of the study area. Since the 1950s, due to increased water consumption upstream, only the Bortala and Jinghe Rivers flow into Ebinur Lake; all other rivers no longer flow into the lake.
Remotesensing 16 03876 g001
Figure 2. Number of image observations across Ebinur Lake from 1992 to 2023.
Remotesensing 16 03876 g002
Figure 3. Flowchart of this study. First, the images were preprocessed to filter out cloud-free areas. Subsequently, a dual-index method was employed to extract water body areas, followed by an accuracy validation to demonstrate the effectiveness of this extraction technique. The analysis focused on the maximum water area synthesized on a monthly basis every three years. Finally, a spatiotemporal change analysis of the water area was conducted to explore the driving factors behind its variations.
Remotesensing 16 03876 g003
Figure 4. Comparison of the performances of different indices combined with the Otsu method.
Remotesensing 16 03876 g004
Figure 5. Performances of NDWI and NDWIturbid under extremely turbid conditions.
Remotesensing 16 03876 g005
Figure 6. Comparison of water area measurements from our dataset with GSW products. The x-axis represents our dataset, while the y-axis shows the water area (km²) estimated by the GSW products.
Remotesensing 16 03876 g006
Figure 7. Comparison of water extraction results with GSW products. (a) Analysis using GSW image data. The numbers in the top left corner of the FRGB images indicate the precise day of the month. GSW underestimated water area in four months, shown compared against the 1:1 line with water area relatively far from the bottom left corner. (b) Random selection of four months’ data for comparison in areas where GSW overestimated water area.
Remotesensing 16 03876 g007
Figure 8. Water inundation frequency (a) and inundation frequency classification (b).
Remotesensing 16 03876 g008
Figure 9. Statistics of water areas of Ebinur Lake.
Remotesensing 16 03876 g009
Figure 10. Water inundation frequency from 1992 to 2023, calculated in three-year intervals.
Remotesensing 16 03876 g010
Figure 11. Statistics of water areas of Ebinur (ac) and water inundation frequency (d).
Remotesensing 16 03876 g011
Figure 12. Variations of the inter-annual mean of (a) Ebinur Lake area, (b) temperature, (c) wind, (d) precipitation, (e) inflow volume, (f) evaporation, (g) cropland, (h) groundwater, and (i) net precipitation. The red line represents the fitted line. The relationships between the inter-annual mean area and driving factors are as follows: temperature, wind, precipitation, inflow volume, evaporation, and cropland. The r and p are factors related to the correlation analysis of the lake area.
Remotesensing 16 03876 g012
Figure 13. Variations of the inner-annual mean of (a) Ebinur Lake area, (b) temperature, (c) wind, (d) precipitation, and (e) evaporation. The red line represents the fitted line. Relationships between the inner-annual mean area and driving factors: temperature, wind, precipitation, and evaporation. The r and p are factors related to the correlation analysis of the lake area.
Remotesensing 16 03876 g013
Figure 14. Diurnal wind impacts on the water area. The dates are marked on the FRGB images. The image below shows the corresponding water extraction areas (blue), with annotations for lake area, wind speed, and wind direction (indicated by arrows). Orange dots represent the centroid position of the lake. The line graphs illustrate the relationship between wind speed and centroid displacement for each date (a1,b1,c1). The centroid displacement graphs show centroid movement and wind direction on different dates (a2,b2,c2).
Remotesensing 16 03876 g014
Figure 15. Relevant laws, policies, regulations, and plans for environmental development and protection.
Remotesensing 16 03876 g015
Figure 16. Changes in cropland area in the Ebinur Lake basin in 2022 compared to 1992. Yellow indicates decrease, while red indicates increase. The increased farmland area is mainly concentrated near rivers, requiring more water for irrigation, which may affect river flow.
Remotesensing 16 03876 g016
Table 1. Confusion matrix for binary classification.
WaterNon-Water
Predicted waterTrue Positive (TP)False Negative (FN)
Predicted non-waterFalse Positive (FP)True Negative (TN)
Table 2. Validation of visually interpreted sample points for different water indices.
Water IndexOA (%)KappaPrecision (%)Recall (%)F1 Score
NDWI98.420.9498.8290.830.95
MNDWI92.330.7567.4897.860.8
AWEIsh83.830.5850.9297.860.67
AWEInsh84.670.5951.3298.390.68
MAWEI39.170.0919.4791.950.32
LWDM94.170.8173.5397.860.84
Table 3. Validation of visually interpreted sample points.
SatellitesDateOA
(%)
KappaPrecision
(%)
Recall
(%)
F1
Score
CategoryConfusion Matrix
WaterNon-waterPrecision (%)Recall (%)OA
(%)
KappaF1
Score
L5
TM
1994/05/0995.830.8580.9095.690.87Water3954388.2088.4095.170.860.89
1996/10/2196.170.8884.5698.290.90
2009/05/0296.830.8994.2888.390.91Non-water53190988.1690.18
2010/06/0695.170.8394.8479.310.86
L7
ETM+
2000/06/1898.830.9698.6596.710.97Water5484594.3092.4096.750.910.93
2001/05/2096.170.8995.5688.350.91
2008/04/2196.670.9296.3193.360.94Non-water33177494.3292.41
2015/08/1595.330.8383.1789.890.86
L8
OLI
2015/09/2495.830.8582.2493.610.87Water4692788.594.696.360.890.91
2016/08/0995.490.8799.2092.900.90
2018/08/3197.500.9293.2294.10.93Non-water61184388.4994.56
2019/07/0196.500.9089.1797.220.93
Overall 90.5792.4696.360.8991.51
Disclaimer/Publisher’s Note: The statements, opinions and data contained in all publications are solely those of the individual author(s) and contributor(s) and not of MDPI and/or the editor(s). MDPI and/or the editor(s) disclaim responsibility for any injury to people or property resulting from any ideas, methods, instructions or products referred to in the content.