1. Introduction
A low-level jet (LLJ) is an important weather phenomenon with notable impacts globally [
1,
2]. LLJs play crucial roles in influencing rainfall by creating favorable conditions for convective activities through both thermodynamic and dynamic processes [
1,
2,
3]. Thermodynamically, LLJs transport warm and moist air, destabilizing the lower atmosphere [
4,
5]. The intensity of LLJs directly affects the transport and convergence of water vapor [
2,
4,
5,
6]. Dynamically, the convergence at the terminus of LLJs enhances upward motions, thus promoting convection [
4,
7,
8].
In South China, LLJs occur frequently in early summer. An LLJ is generally defined by the following criteria: (1) the maximum wind speed below 700 hPa exceeds 10 m s
−1, and (2) there is a strong vertical wind shear, characterized by a wind speed decrease of at least 3 m s
−1 in wind speed from the maximum to the next minimum at or below the 600 hPa level. Building on this definition, LLJs can be classified into two main types based on their different characteristics and formation mechanisms [
9,
10,
11,
12]: (1) the boundary layer jet (BLJ), which occurs below 1 km and exhibits profound diurnal variation, and (2) the synoptic-weather-related LLJ (SLLJ), with its core located at higher altitude (~850–700 hPa). Both types are crucial for rainfall in South China [
2,
13,
14]. Unlike SLLJs, which are predominantly observed over the inland of South China, BLJs exhibit a higher frequency over the Beibu Gulf and the northern South China Sea (SCS) [
2,
15,
16]. Based on a reanalysis dataset, Du et al. [
16] identified that the BLJ cores over the northern SCS are primarily located at 950 hPa, with their peak occurrences in June. Numerical models suggest that BLJs over the northern SCS facilitate convection initiation and subsequent upscale convective growth along the South China coast [
17]. Dong et al. [
15] also utilized a reanalysis dataset and documented that BLJs over the northern SCS impact afternoon rainfall in inland Guangdong Province due to their influence on dynamic lifting and moisture transport.
BLJs are affected by both synoptic weather systems and boundary processes. On the synoptic scale, a persistent pressure gradient force aids in maintaining the BLJ [
18,
19,
20]. On the diurnal scale, the formation of the BLJ with a nighttime peak is explained by mechanisms such as inertial oscillation theory [
21,
22], baroclinic theory related to topographic thermal difference [
22,
23], or a combination of these factors [
18,
24,
25].
Despite advances in understanding BLJs, most observational research in China has focused on inland regions [
10,
19,
26,
27]. For instance, Cui et al. [
27] documented that BLJs in the middle reaches of the Yangtze River concentrate between 300–1200 m and typically peak at 2300 LST based on radiosonde data. Miao et al. [
19] compared the characteristics of LLJs in Beijing and Guangzhou using wind profiler data and soundings. Yan et al. [
26] examined the strengths, heights, and wind directions of LLJs in inland China using long-term radiosonde observations.
Numerous studies have documented the characteristics of coastal BLJs across various regions of the world. For instance, Holt and Sethuraman [
28] confirmed the existence of a BLJ, known as Somali Jet, with its core near 900 hPa and wind speeds exceeding 16 m s
−1, based on aircraft and ship-launched radiosondes. In the Antarctica region, Andreas et al. [
29] documented the frequent occurrence of BLJs at the Ice Station Weddell, with jet cores primarily below 400 m and a wind speed of less than 14 m s
−1, using radiosonde data. Over the Arctic Ocean, Jakobson et al. [
30] utilized observations from the drifting ice station Tera to investigate the characteristics of BLJs, identifying jet cores below 1200 m with a wind speed of less than 12 m s
−1. Specifically, BLJs in the northern SCS, located upstream of South China, are critical for improving precipitation predictions in South China, possibly through assimilating their observations. However, due to limited observational data over the northern SCS, the characteristics and structures of BLJs remain inadequately verified through observations.
Previous studies over the northern SCS (15°N–22°N, 110°E–121°E) have primarily utilized reanalysis datasets and numerical models to explore the characteristics of BLJs, highlighting the need for performance evaluation of these datasets. ERA5 generally aligns closely with observations [
27,
31,
32,
33,
34]. In the North Sea, ERA5 has shown biases in wind speed representation and poor one-to-one correspondence for LLJs relative to met-mast and lidar observations, though it captures climatological characteristics effectively, including seasonal cycles and circulation patterns [
34]. Similarly, in the southern Baltic Sea, ERA5 underestimates LLJ occurrences and struggles with core height and shear representation compared to ship-based lidar measurements [
31]. MERRA2 tends to overestimate near-surface wind speeds, while JRA-55 underestimates them [
32]. Given these reanalysis datasets’ varied performances in different regions and conditions, it is crucial to assess their accuracy for BLJs in the northern SCS.
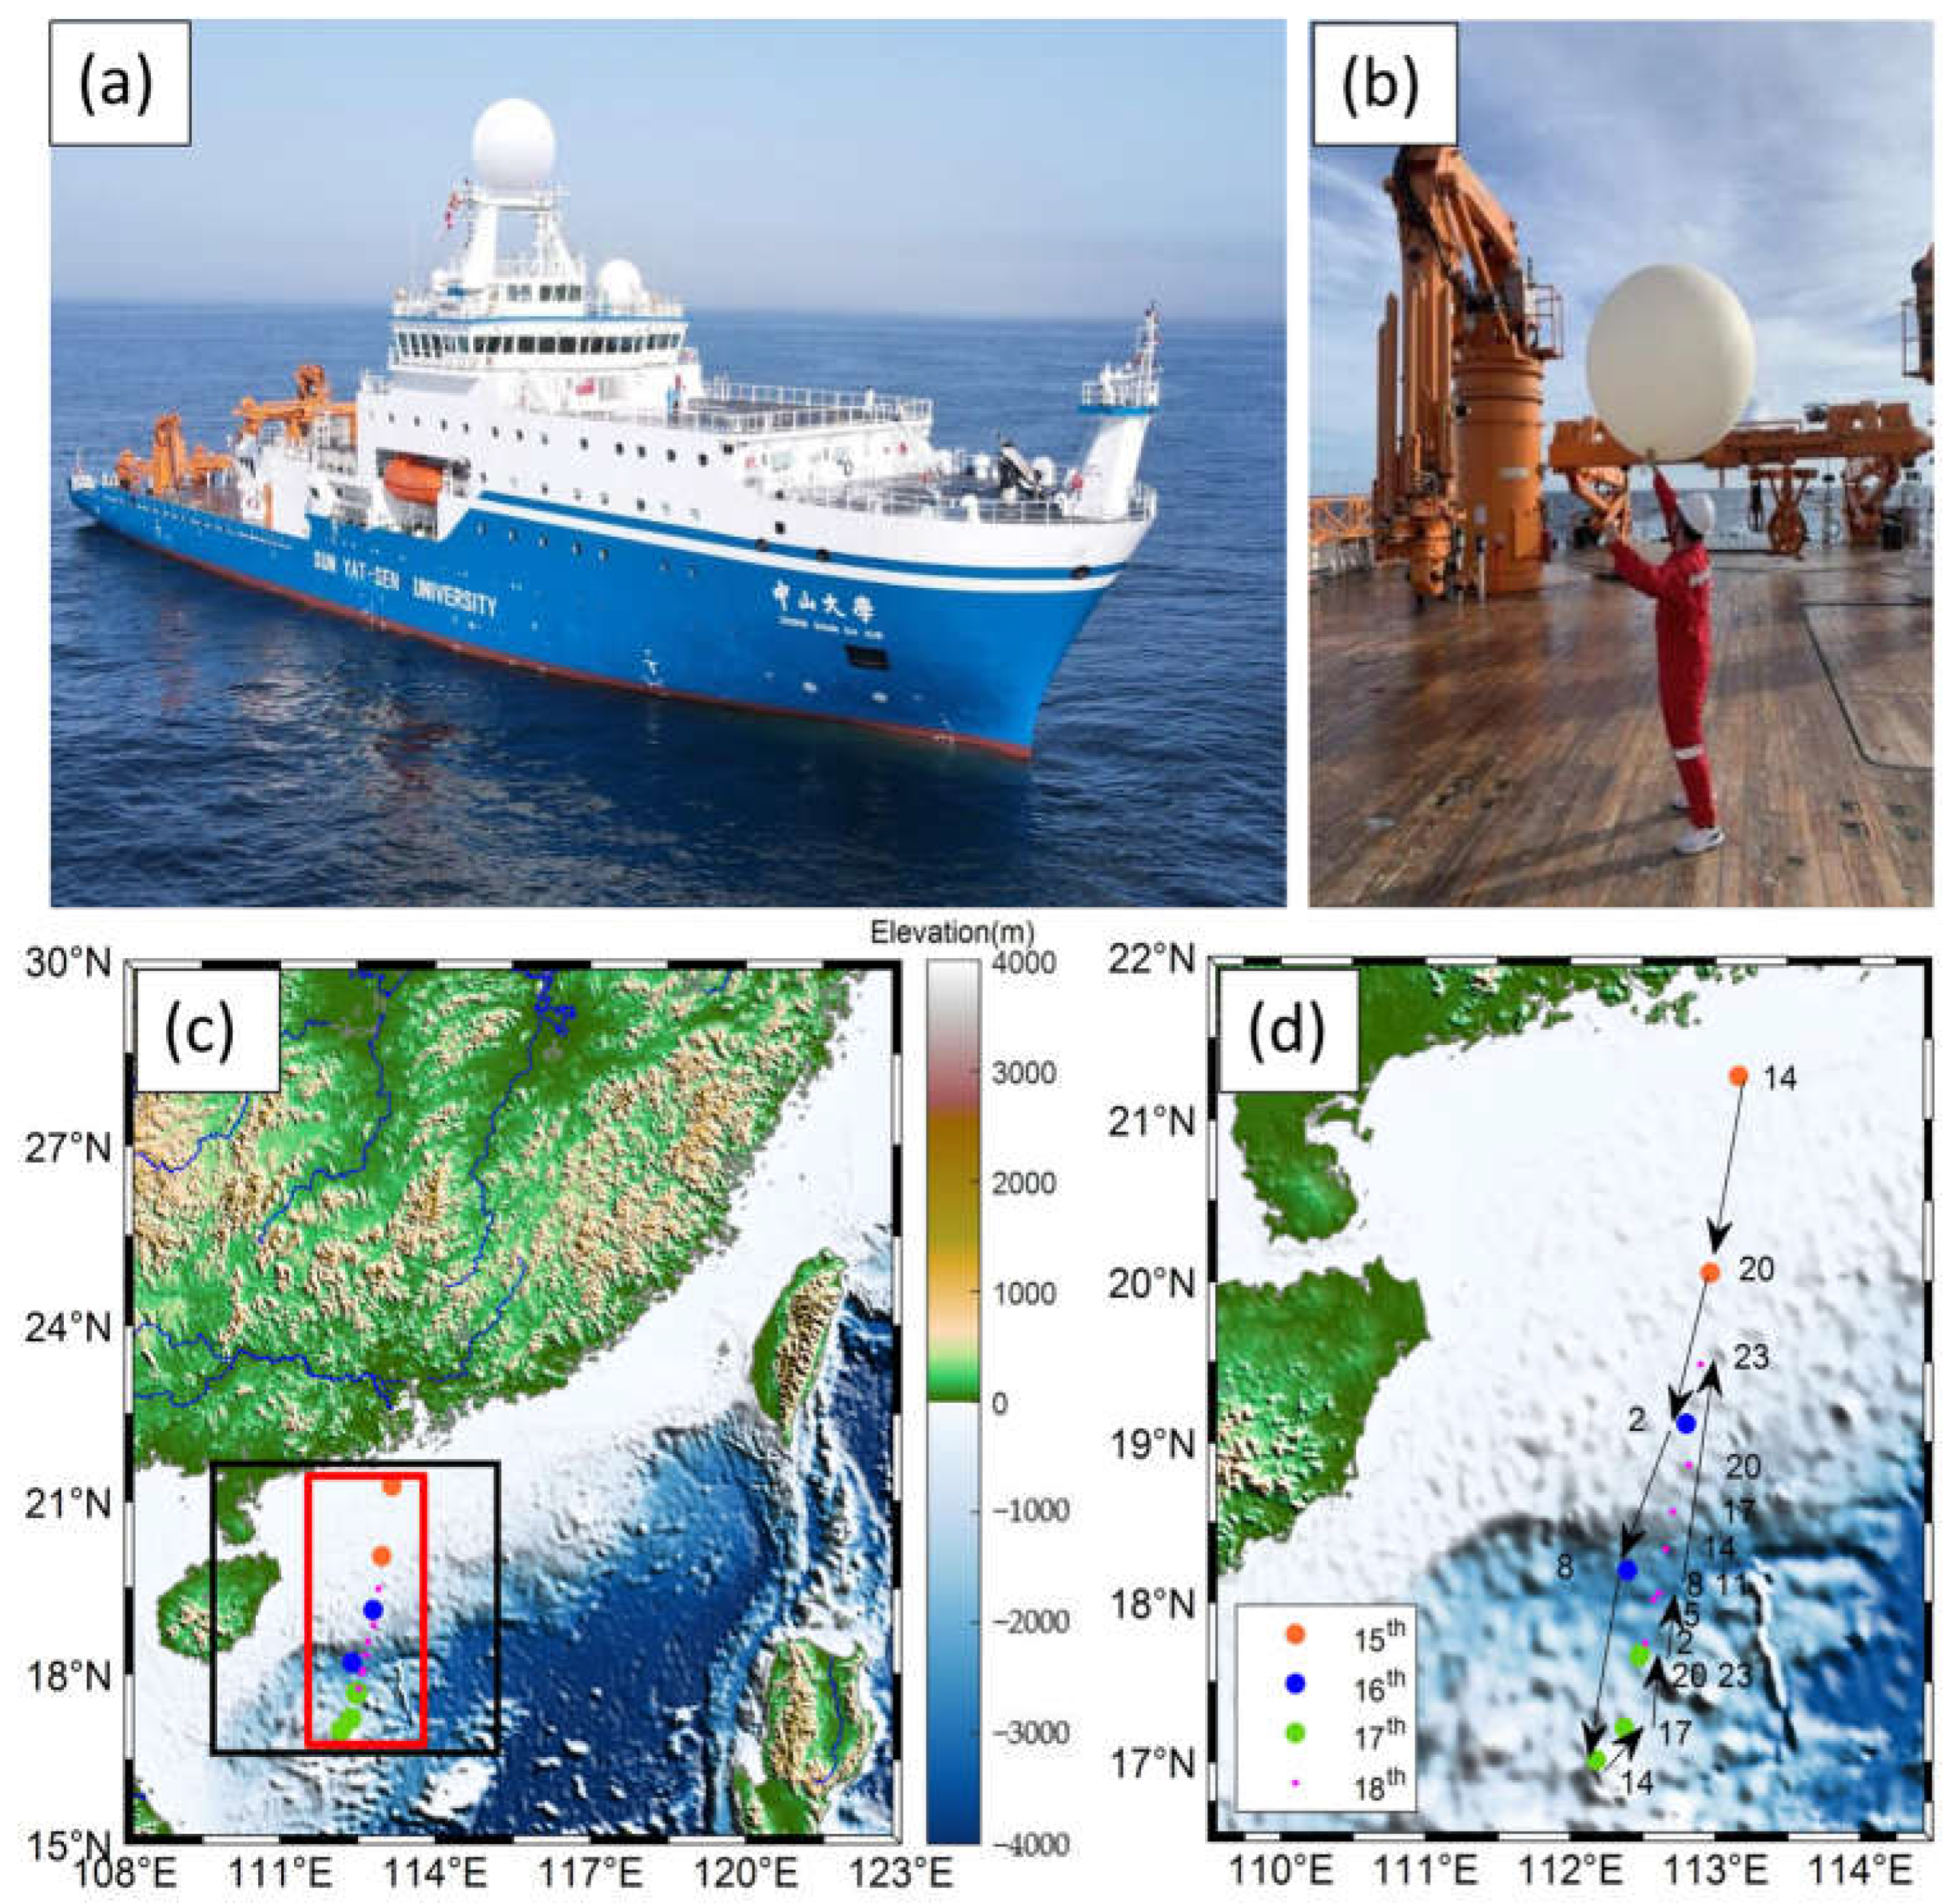
From 15 to 18 June 2022, the Sun Yat-sen University research vessel conducted its maiden voyage for scientific expedition in the northern SCS, which coincided with the BLJ events. Radiosonde-equipped sounding balloons were launched up to eight times in a single day during the study period to measure wind speeds, temperature, pressure, and humidity. These radiosondes provided high vertical resolution (approximately 100 m in the lower levels below 2 km) up to 25 km, offering critical data for studying BLJs’ characteristics and temporal evolution. This leads to several scientific questions: (1) What are the observed characteristics of BLJs in the northern SCS, their variation mechanisms, and their relationships with precipitation? (2) How accurately do reanalysis datasets capture the vertical structure and temporal evolution of BLJs in the northern SCS during this period?
Therefore, this study aims to examine BLJs in the northern SCS through radiosonde observations and to evaluate the performance of reanalysis datasets. The following section outlines the data and methodology, including an overview of radiosonde data during the expedition.
Section 3 analyzes the observed characteristics of BLJs, while
Section 4 compares observational and reanalysis datasets. The mechanisms driving BLJ variations and their relationship with precipitation are described in
Section 5. The final section summarizes the results.
4. Comparison Between Observation and Reanalysis Datasets
In this section, we compare the vertical characteristics and temporal evolutions of BLJs between observational data and reanalysis datasets. Additionally, we perform a quantitative evaluation of errors in the reanalysis datasets.
4.1. Temporal and Vertical Comparisons of Wind and Moisture
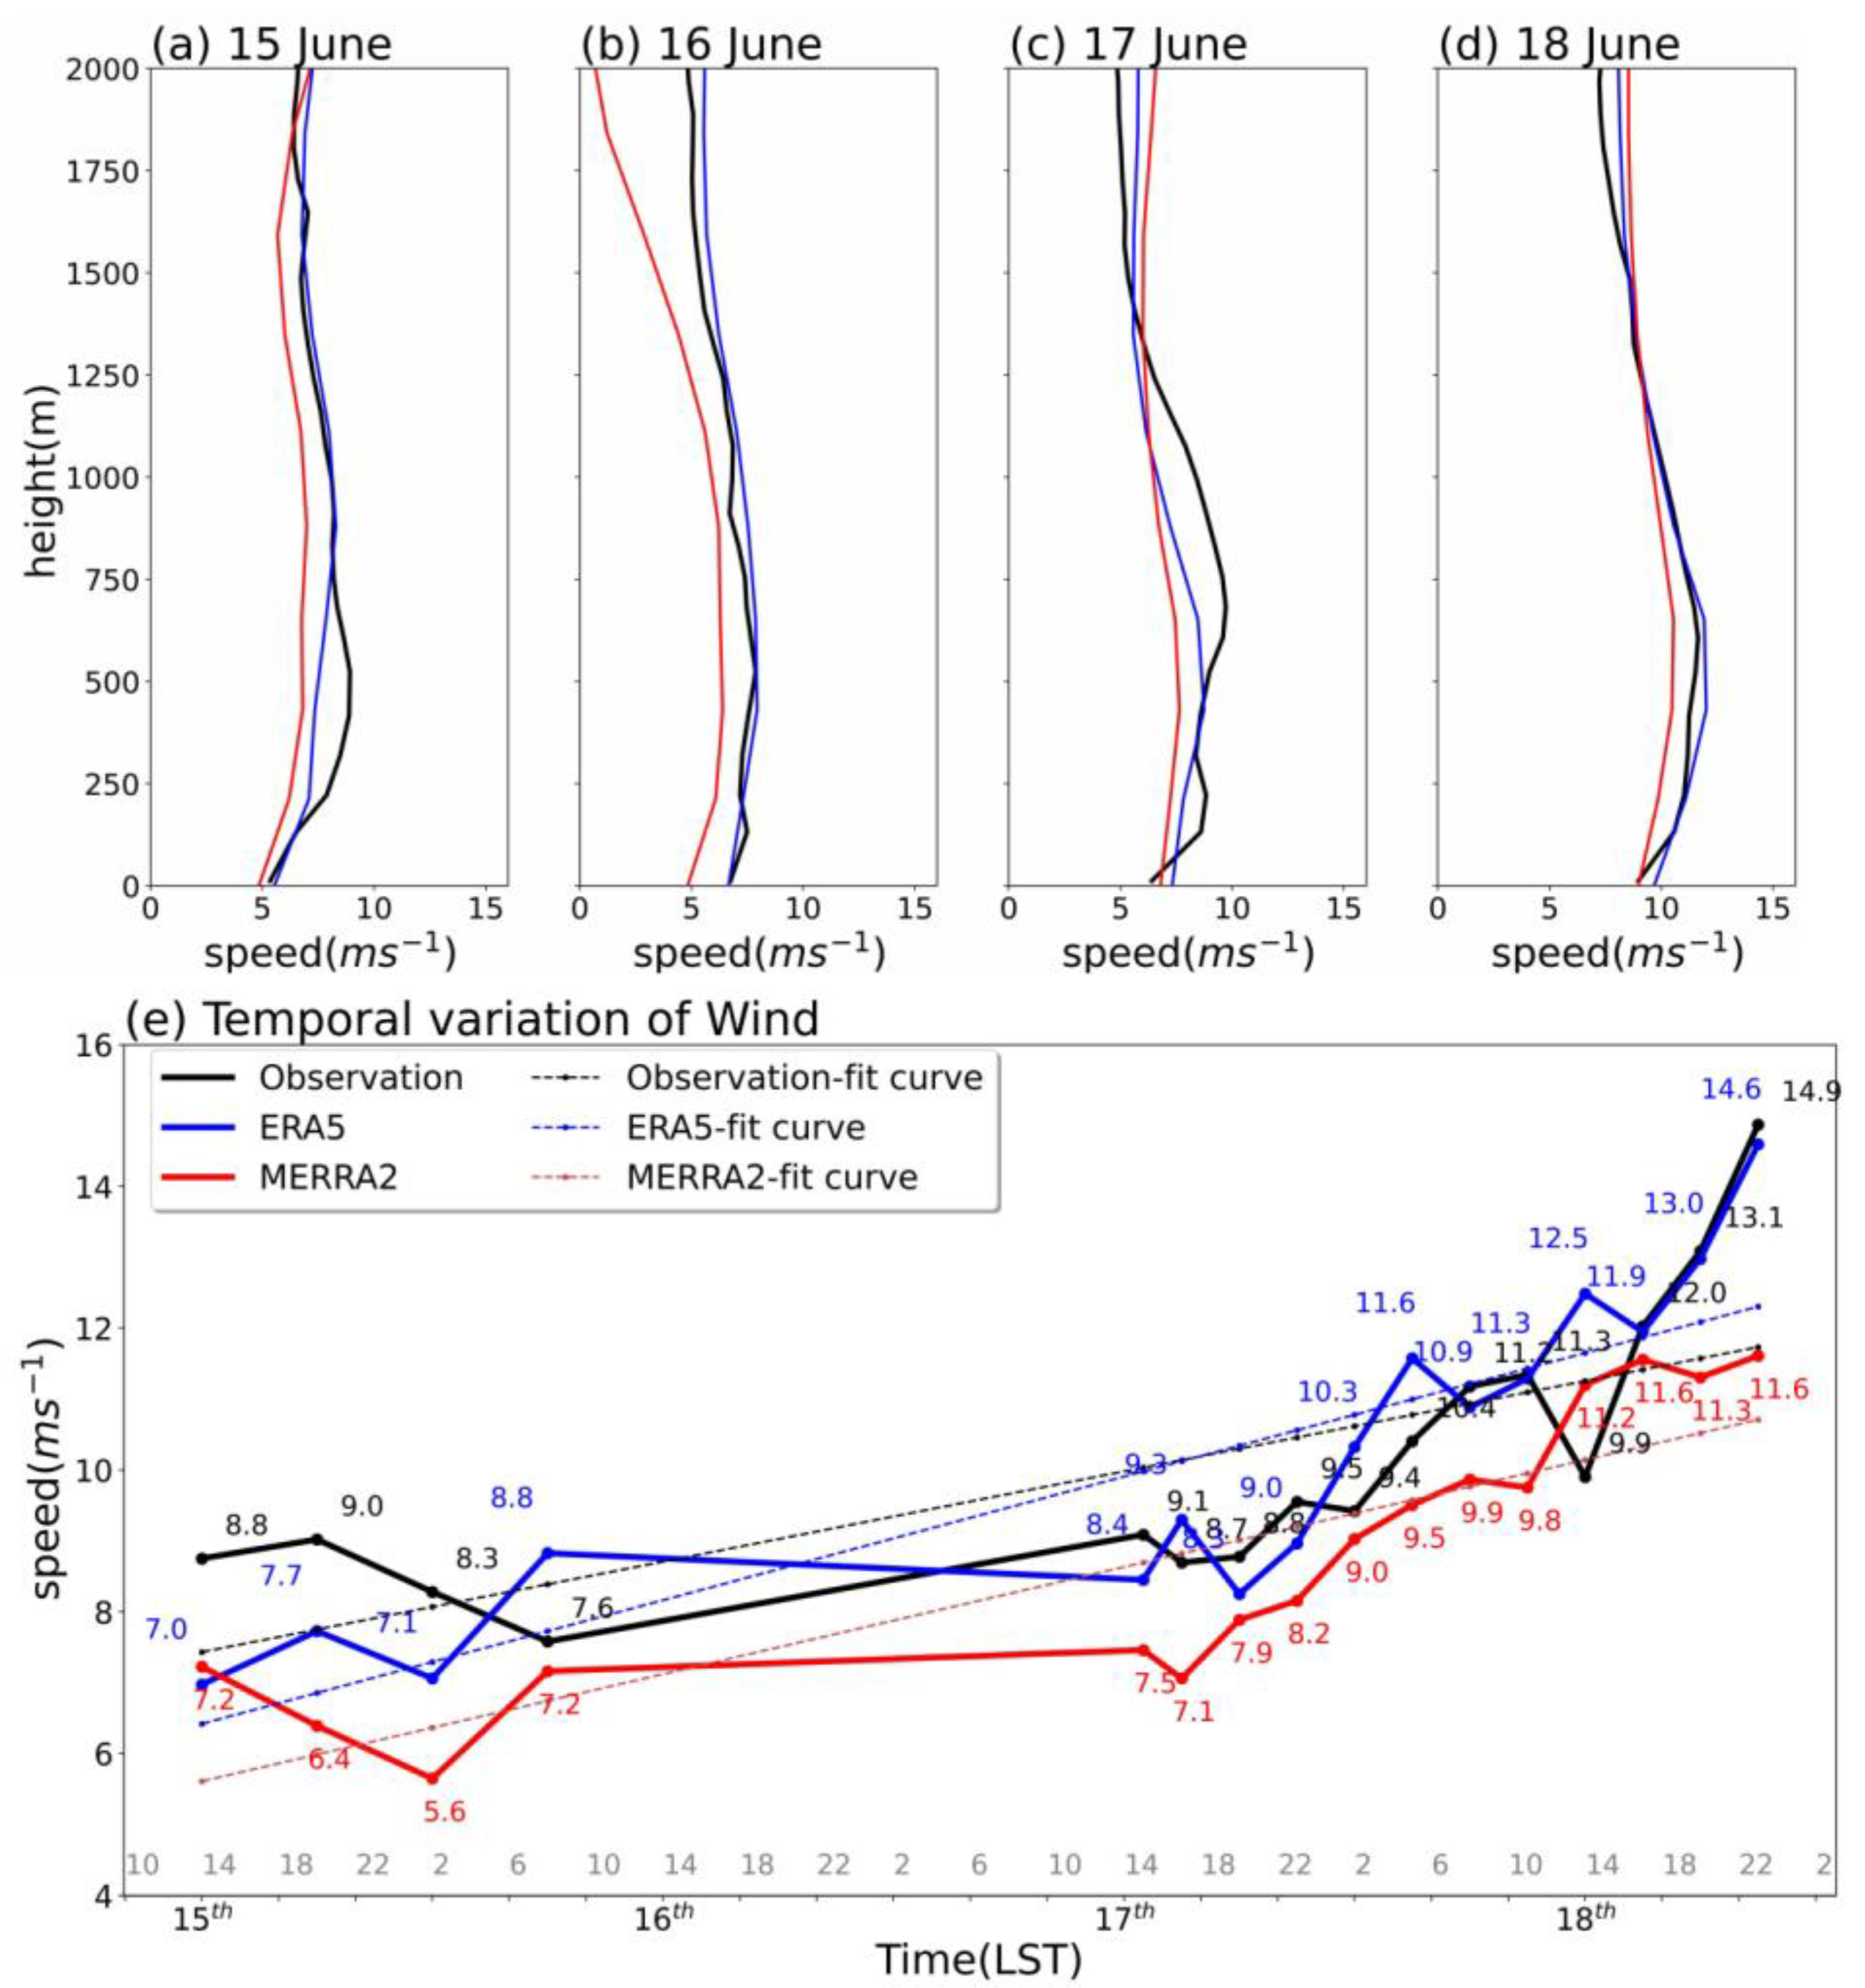
The daily average wind speed vertical profiles retrieved from the ERA5 and MERRA2 datasets are compared with the observational data from 15 to 18 June (
Figure 5a–d). On 15 June, the wind speeds and vertical wind shears in ERA5 and MERRA2 were insufficiently pronounced, especially at 500 m, failing to adequately represent the BLJ characteristics documented in the observational profiles (
Figure 5a). On 16 June, ERA5 exhibited better performance in capturing the general characteristics of the observed atmospheric condition within the altitude range from 0 to 2000 m. In contrast, MERRA2 struggled to capture fine-scale variations in wind speed at different altitudes. On 17 June, the daily average wind speed profile in the observations exhibited double peaks at 250 and 750 m (
Figure 5c). However, both ERA5 and MERRA2 failed to capture these two peaks, with the BLJ core height in both datasets being consistently around 500 m, though ERA5 more closely approximated the observed wind speeds below 1 km. On 18 June, both reanalysis datasets and observational data displayed the BLJ characteristics, with ERA5 exhibiting a closer resemblance to the observed wind speed profile and MERRA2 slightly underestimating it (
Figure 5d).
This inability of the reanalysis datasets to accurately represent the detailed vertical structures of BLJs might be attributed to the inadequate horizontal and vertical resolution of the models, as well as limitations in the parameterization of the boundary layer. Different horizontal resolutions in various reanalysis datasets can result in varying degrees of horizontal smoothing, potentially obscuring fine-scale features of BLJs. Moreover, the selection and tuning of boundary layer schemes can significantly impact the representation of turbulence mixing and vertical temperature stratification, both of which are essential processes in the formation and maintenance of BLJs [
42].
Figure 5e compares the temporal evolutions of wind speed at approximately 950 hPa near the observation locations from the ERA5 and MERRA2 datasets with the corresponding measured data. Both ERA5 and MERRA2 generally captured the synoptic-scale increase, while MERRA2 underestimated the strength of BLJs slightly. However, the details of their representation differed.
From 15 June to 0200 LST on 16 June, the observation and ERA5 displayed a similar trend, initially with a slight increase followed by a decrease, although ERA5 consistently underestimated wind speeds by approximately 1 m s−1. Conversely, MERRA2 demonstrated a contrary trend during this period. From 0200 to 0800 LST on 16 June, both ERA5 and MERRA2 showed an increasing trend, while the observations, however, displayed a decreasing trend. The differences among the ERA5, MERRA2, and observational data were relatively small after 1400 LST on 17 June. During this period, compared to MERRA2, ERA5 more accurately captured the pronounced increasing trend in wind speeds recorded in the observational data, whereas MERRA2 generally underestimated the wind speeds by approximately 1 m s−1. This discrepancy might stem from the varying capabilities of the reanalysis datasets to resolve the fine-scale horizontal distributions of the BLJs, as reflected by the shifting comparison points due to the moving observational ship.
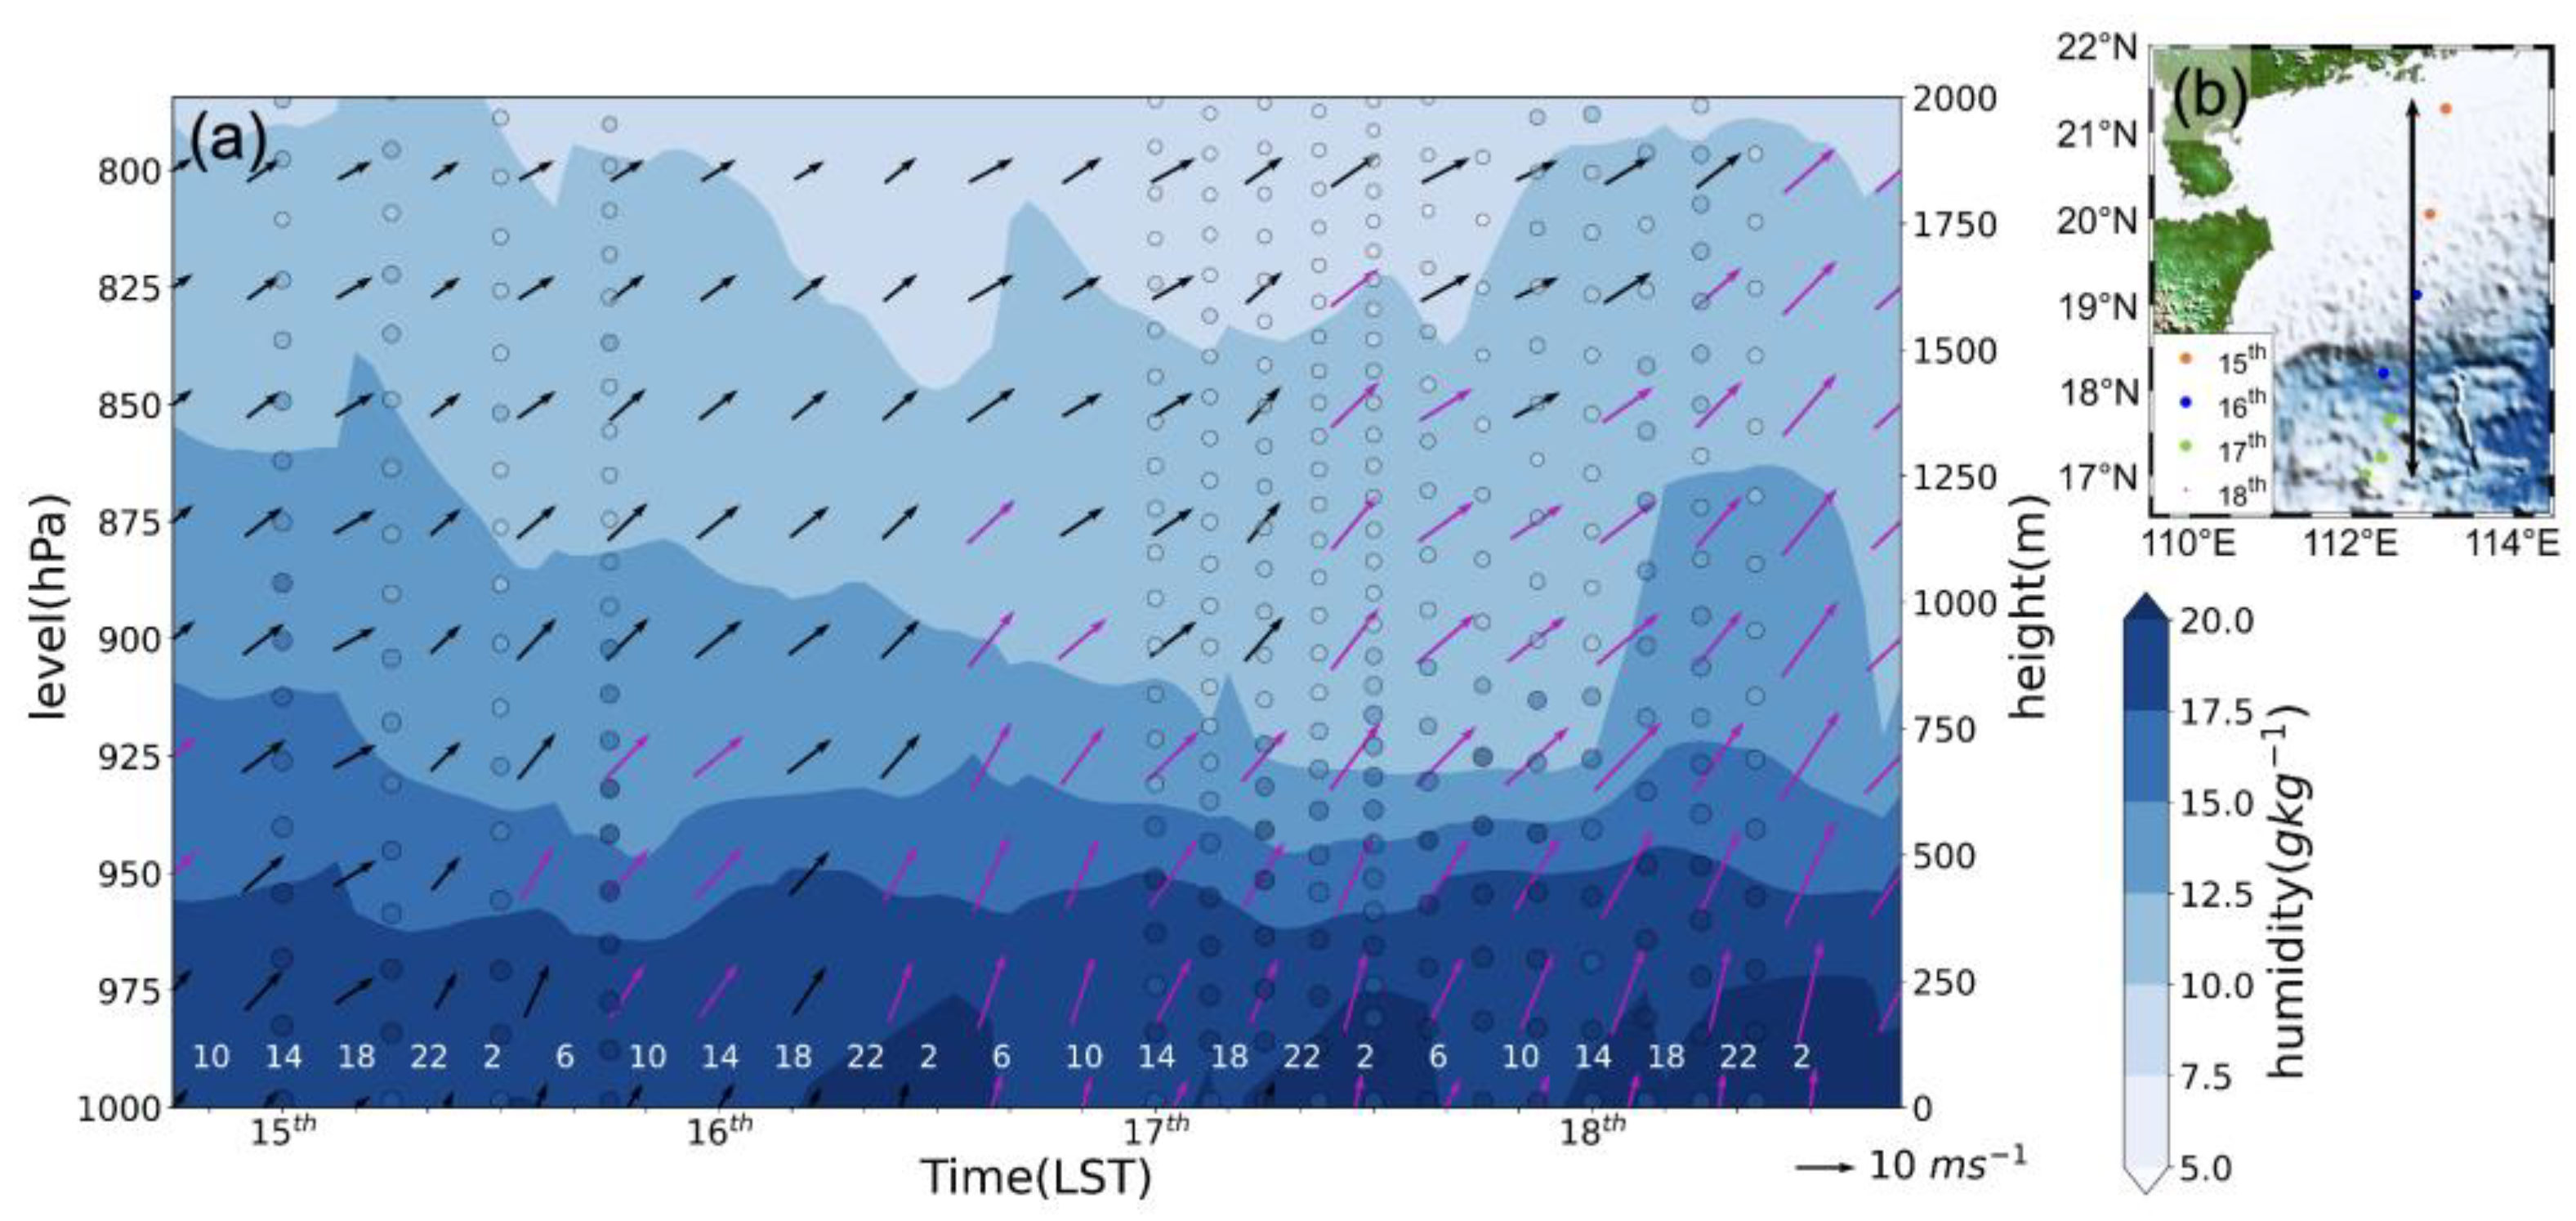
Figure 6a compares the temporal evolutions of the specific humidity profiles, averaged along the black line in
Figure 6b, between the observational data and the ERA5 dataset. Overall, ERA5 underestimated moisture in the lower layers, particularly at around 950 hPa, where the thickness of moisture exceeding 17.5 g kg
−1 was underestimated. In contrast, specific humidity was overestimated in mid-levels. For instance, specific humidity below 7.5 g kg
−1 was observed at 800 hPa during the research campaign, while ERA5 recorded values exceeding 7.5 g kg
−1 at the same level.
The inability of the ERA5 reanalysis dataset to accurately represent specific humidity, typically underestimating it in lower levels of BLJs while overestimating it at higher levels, might be attributed to the vertical resolution of the model. Nevertheless, ERA5 generally captured the observed thickening of the moist layer below 1 km after 17 June, corresponding to enhanced southwesterlies, though some detailed discrepancies were present.
In the observational data, as shown in dots in
Figure 6a, the altitude at which the specific humidity reached 12.5 g kg
−1 showed a significant decreasing trend to 800 m on 15 June and a gradual increase to approximately 1.3 km during 17–18 June, with two minor peaks at 0800 LST on 16 June and 1700 LST on 18 June, respectively. Compared to observations, the thickness of the moist layer in ERA5 did not reflect the first minor peak but demonstrated consistency with observational data after 17 June. The detailed temporal differences between ERA5 and the observational data might be related to the varying positions of shipboard observations.
4.2. Horizontal and Diurnal Variations of BLJs
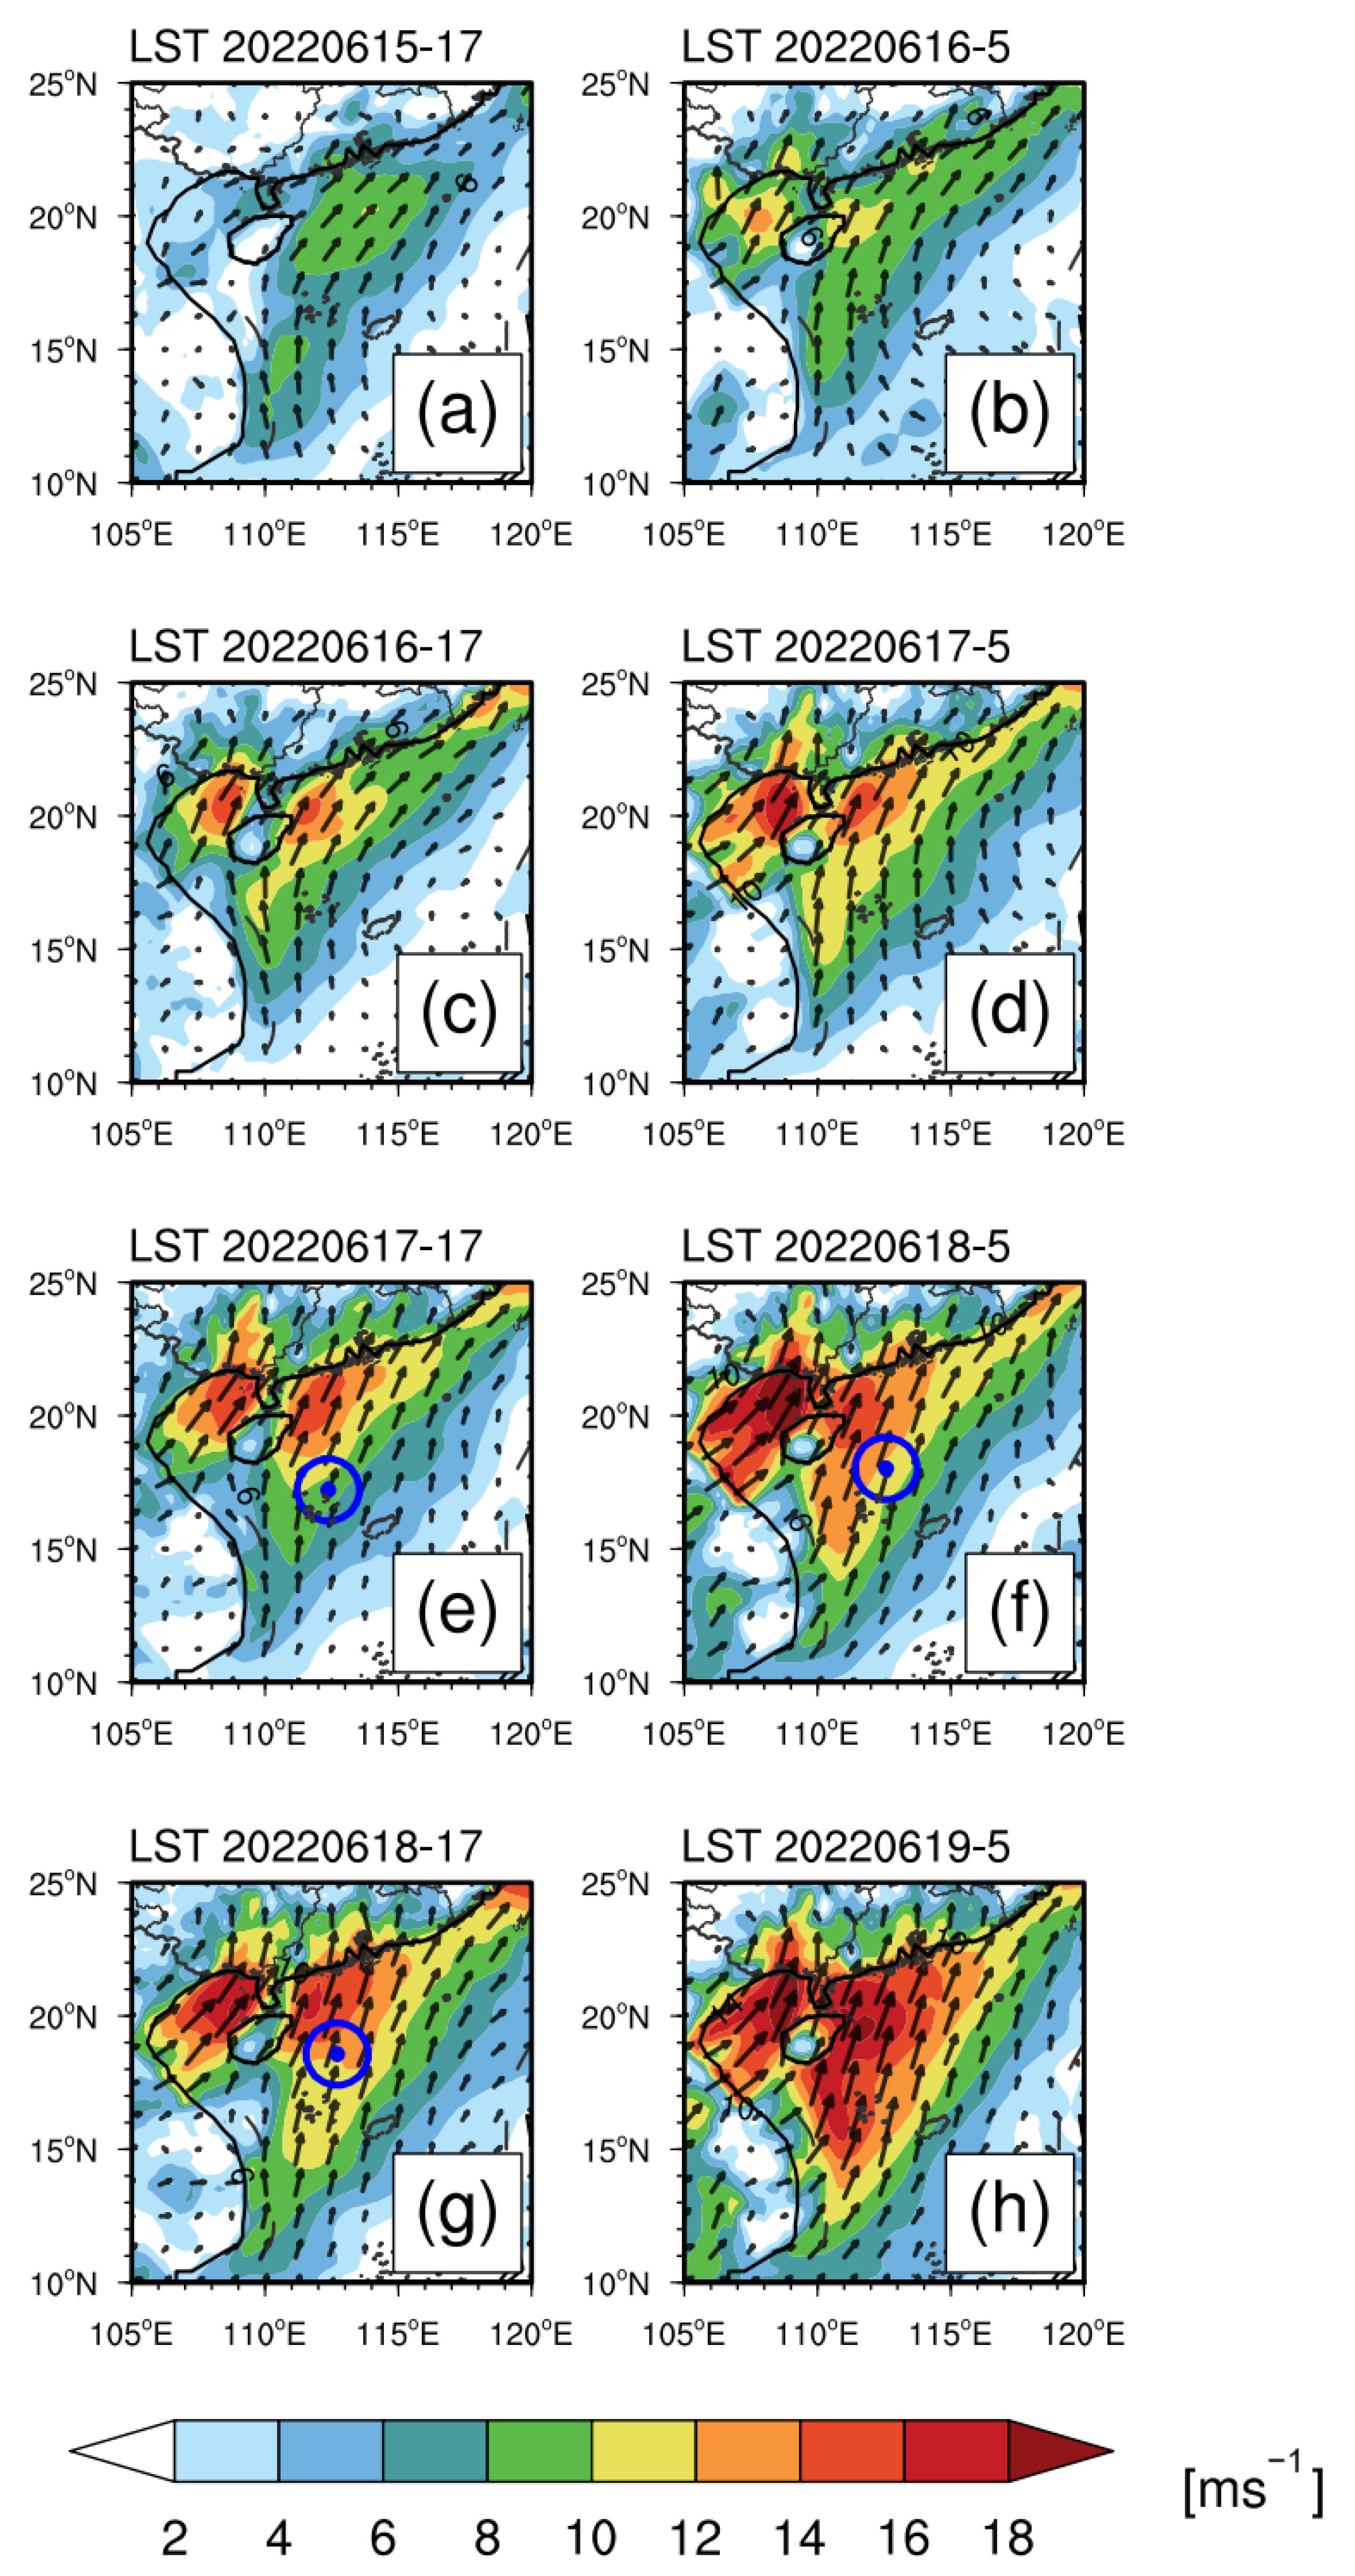
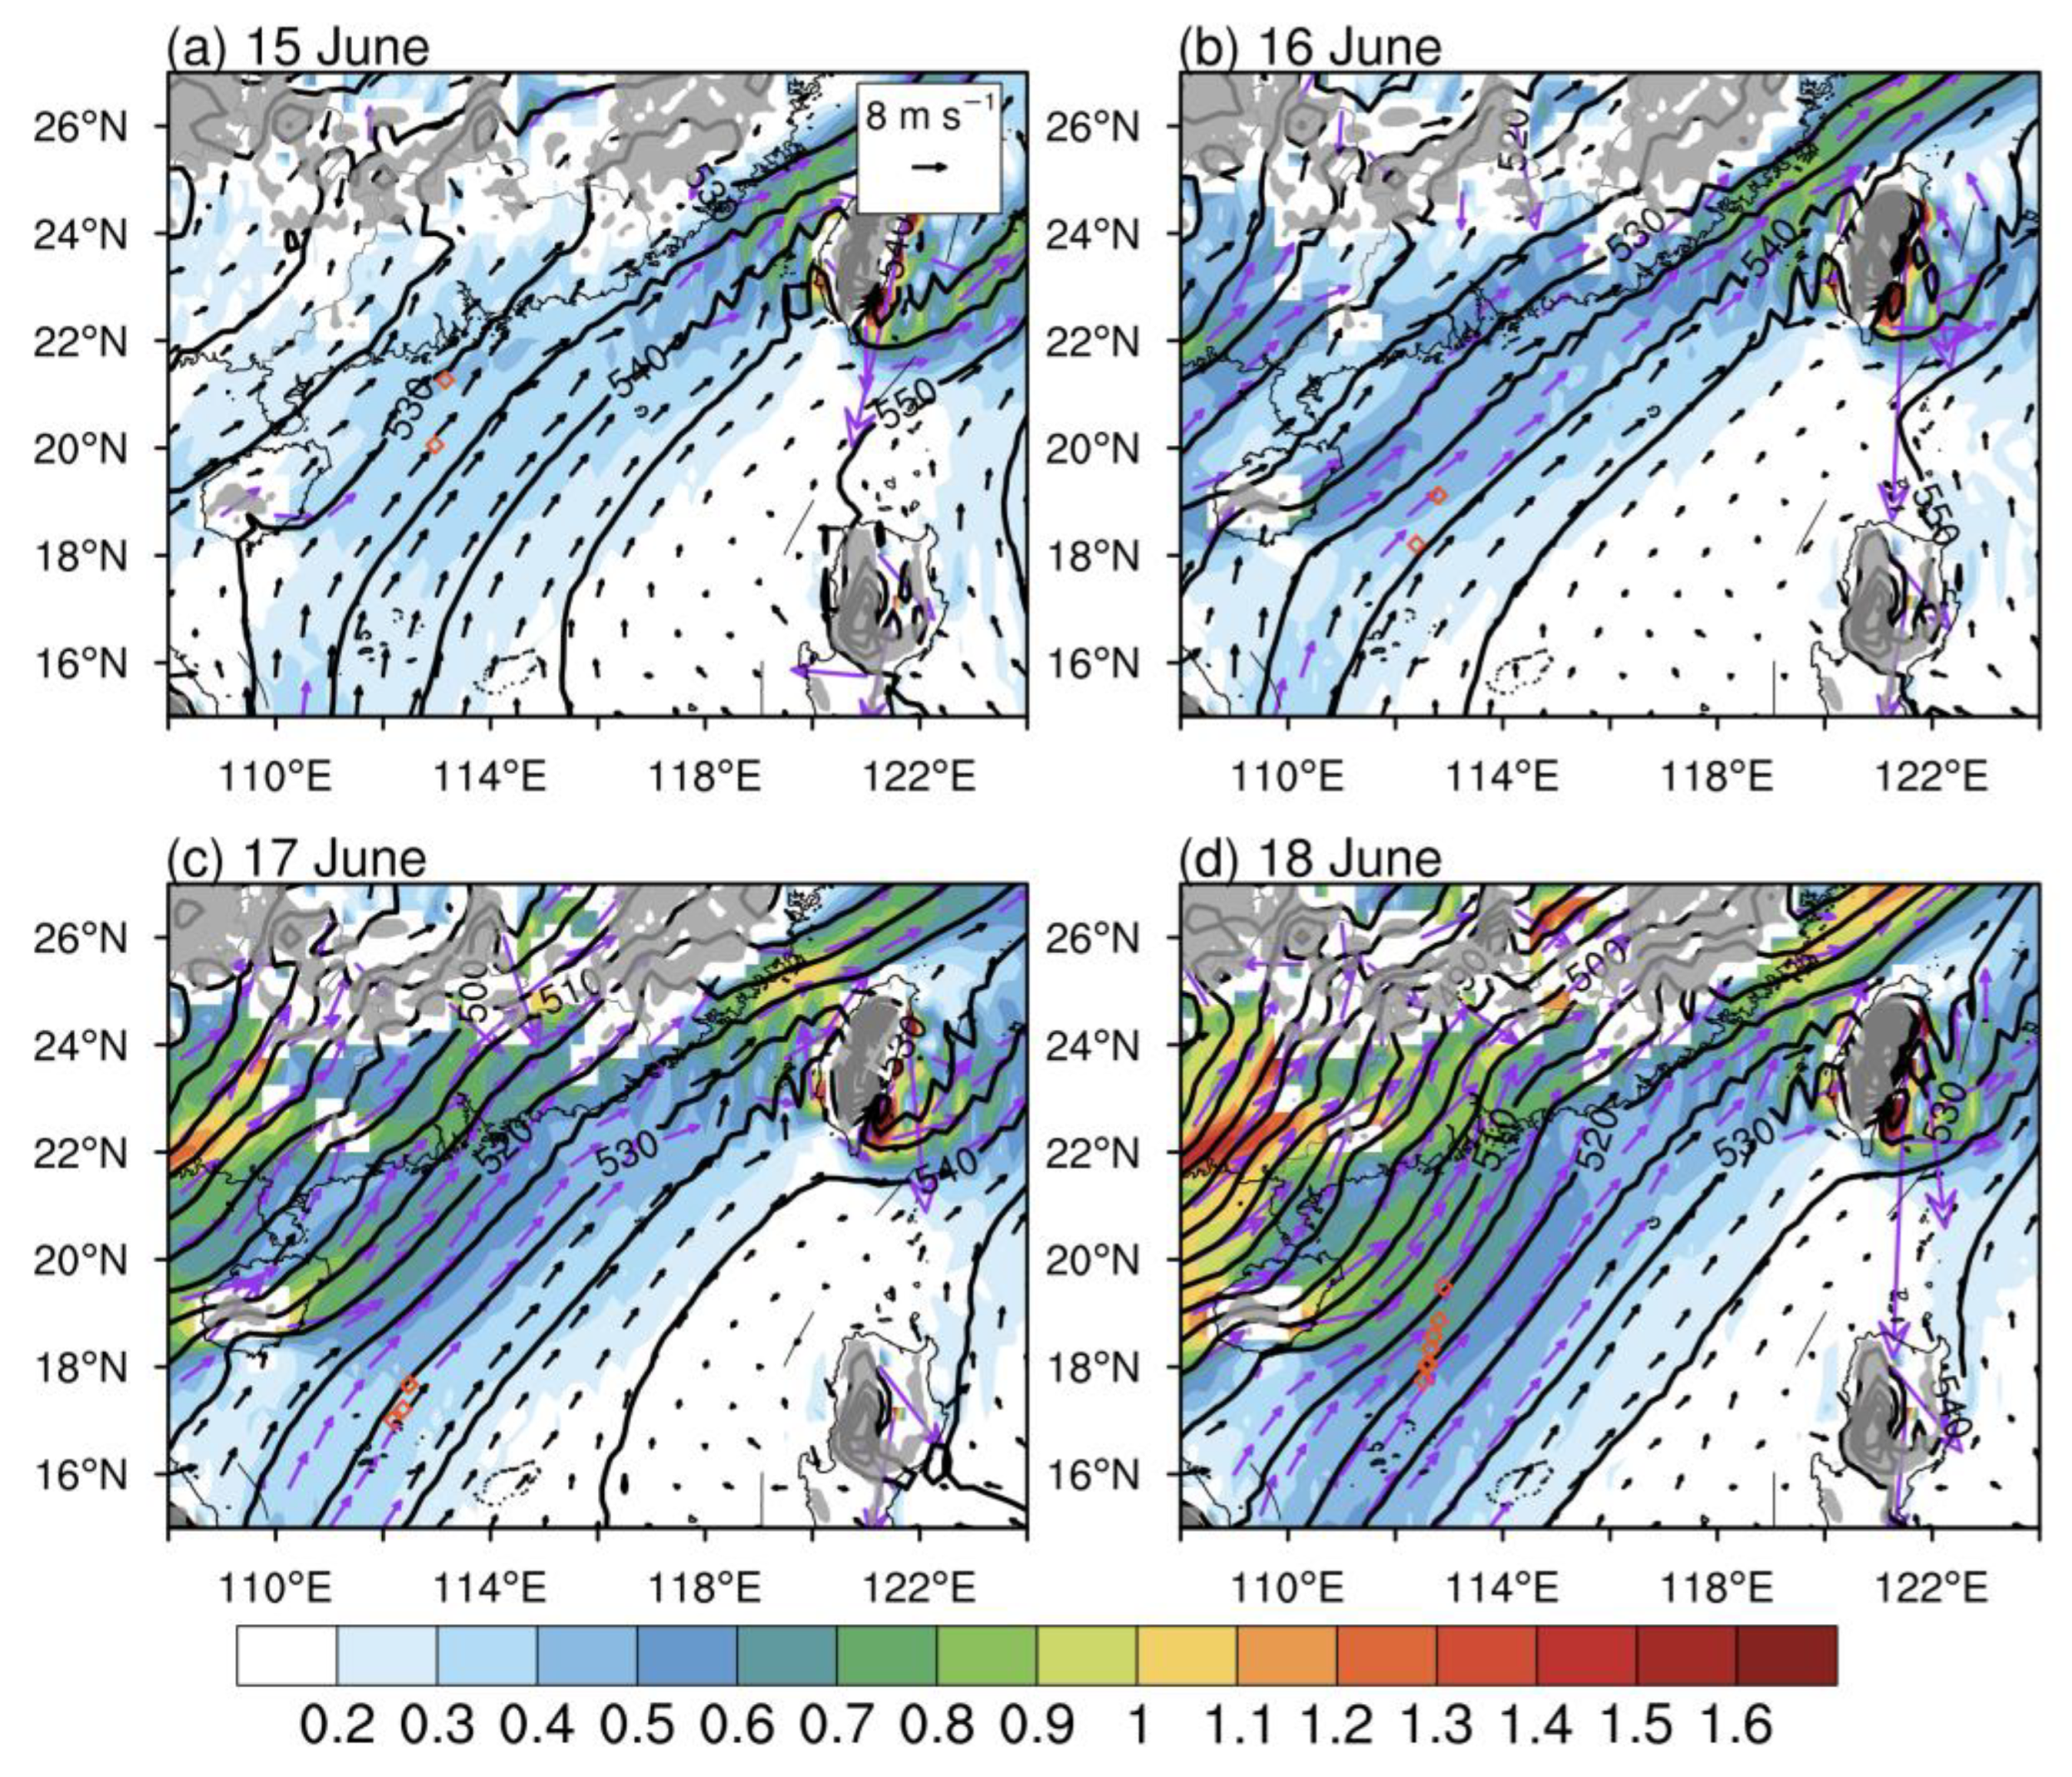
Figure 7 presents the temporal variation of horizontal wind speed distributions at 950 hPa based on the ERA5 dataset. From 16 to 18 June, regions where wind speeds exceeded 10 m s
−1, indicative of BLJs, were observed in the Beibu Gulf and the northern SCS. The observed times, indicated by blue markers, fell within the influence range of these BLJs.
During the research period, the wind speeds at 950 hPa over the northern SCS exhibited a gradual strengthening trend on a synoptic scale, which was generally consistent with the results from the observation analysis. In the initial stage, the BLJ in the northern SCS had a width of approximately 4 degrees in longitude (110°E–114°E) and around 8 degrees in latitude (13°N–21°N). After intensification, the BLJ expanded to 9 degrees in longitude (109°E–118°E) and 14 degrees in latitude (10°N–24°N). On 15 June, the area with wind speed exceeding 10 m s
−1 is very limited (
Figure 7a), and the observed strong wind shear at this time is insufficient to meet the BLJ criterion. By 0500 LST on 16 June, the occurrence range of BLJs remains relatively small (
Figure 7b), which explains why they were not detected in
Figure 3b. As the overall wind strengthened, the width of the jet stream expanded from 2 degrees in longitude by 2 degrees in latitude to 5 degrees in longitude by 6 degrees in latitude by 1700 LST on 16 June (
Figure 7c). The jet’s rapid expansion along the latitude scale highlights the dominance of the southerly wind. From 17 to 18 June, the positions of the shipboard observations experienced minimal changes relative to BLJ regions (
Figure 7e–g). In the observations, wind speeds at 950 hPa gradually increased during this period. By 0500 LST on 19 June, BLJs in northern SCS expanded to cover an area ranging between 12° to 22°N in latitude and 110° to 118°E in longitude (
Figure 7h). Diurnally, BLJs in ERA5 were enhanced at night, with a peak around 0500 LST during the studied period.
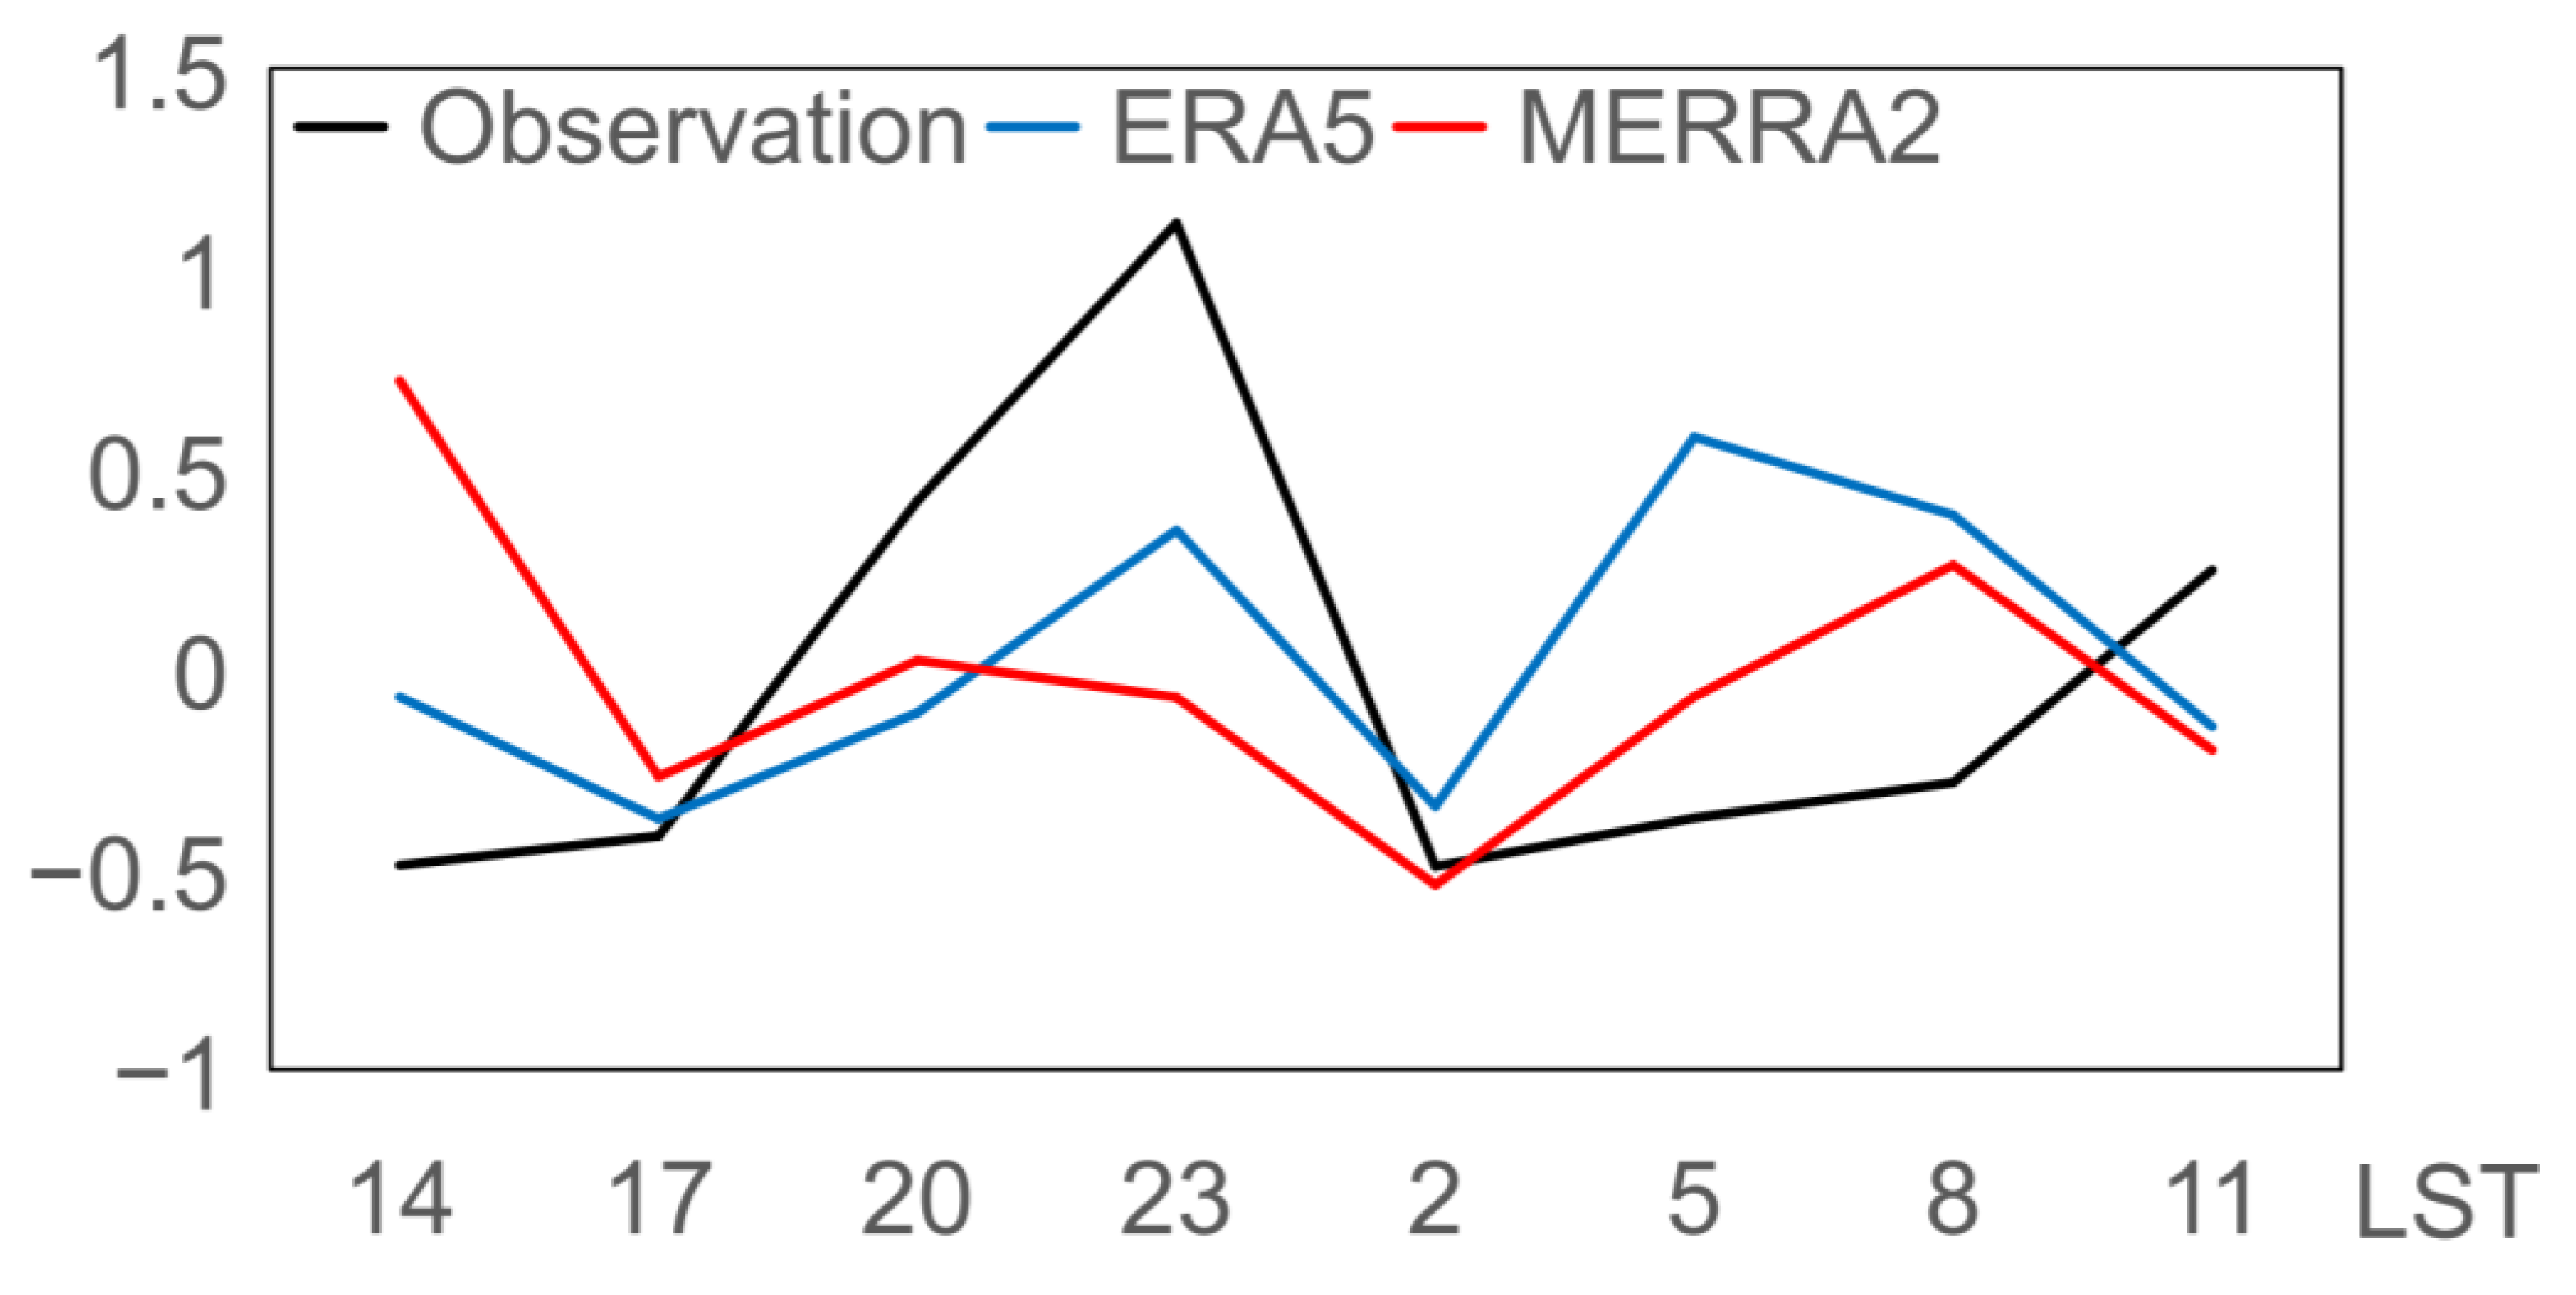
The diurnal variations of BLJs are further compared among observation data and the ERA5 and MERRA2 datasets in
Figure 8, with diurnal deviations calculated by subtracting their corresponding first-order linear trends in
Figure 5. In the observational data, wind speeds reached their primary peak at 2300 LST, accompanied by a secondary peak at 1100 LST. Both the ERA5 and MERRA2 datasets struggled to accurately replicate the diurnal variation of BLJs observed. MERRA2 displayed an opposite pattern, with higher wind speeds during the daytime and lower wind speeds at nighttime. MERRA2’s lower horizontal and temporal resolution makes it more difficult to capture the fine-scale variations and rapid changes within the boundary layer that influence BLJ characteristics. As a result, MERRA2 struggles to represent the diurnal variations of BLJs accurately, as these jets are influenced not only by synoptic-scale weather patterns but also by boundary layer processes. In contrast, ERA5 was able to capture the nighttime wind speed maxima, with the peak wind speed of BLJs occurring at 0500 LST and a secondary peak at 2300 LST. The anomaly peak at 0500 LST in ERA5 might be related to the 12 h windows used in the 4D-Var data assimilation of ERA5 at 0900 UTC and 2100 UTC [
35], leading to sudden, artificial changes in diurnal variation at 0500 LST and 1700 LST (LST = UTC + 8) [
43]. In summary, compared to MERRA2, the ERA5 dataset provided a slightly more accurate representation of the diurnal variations in wind speeds at 950 hPa during the observation period.
4.3. Quantitative Error Analysis
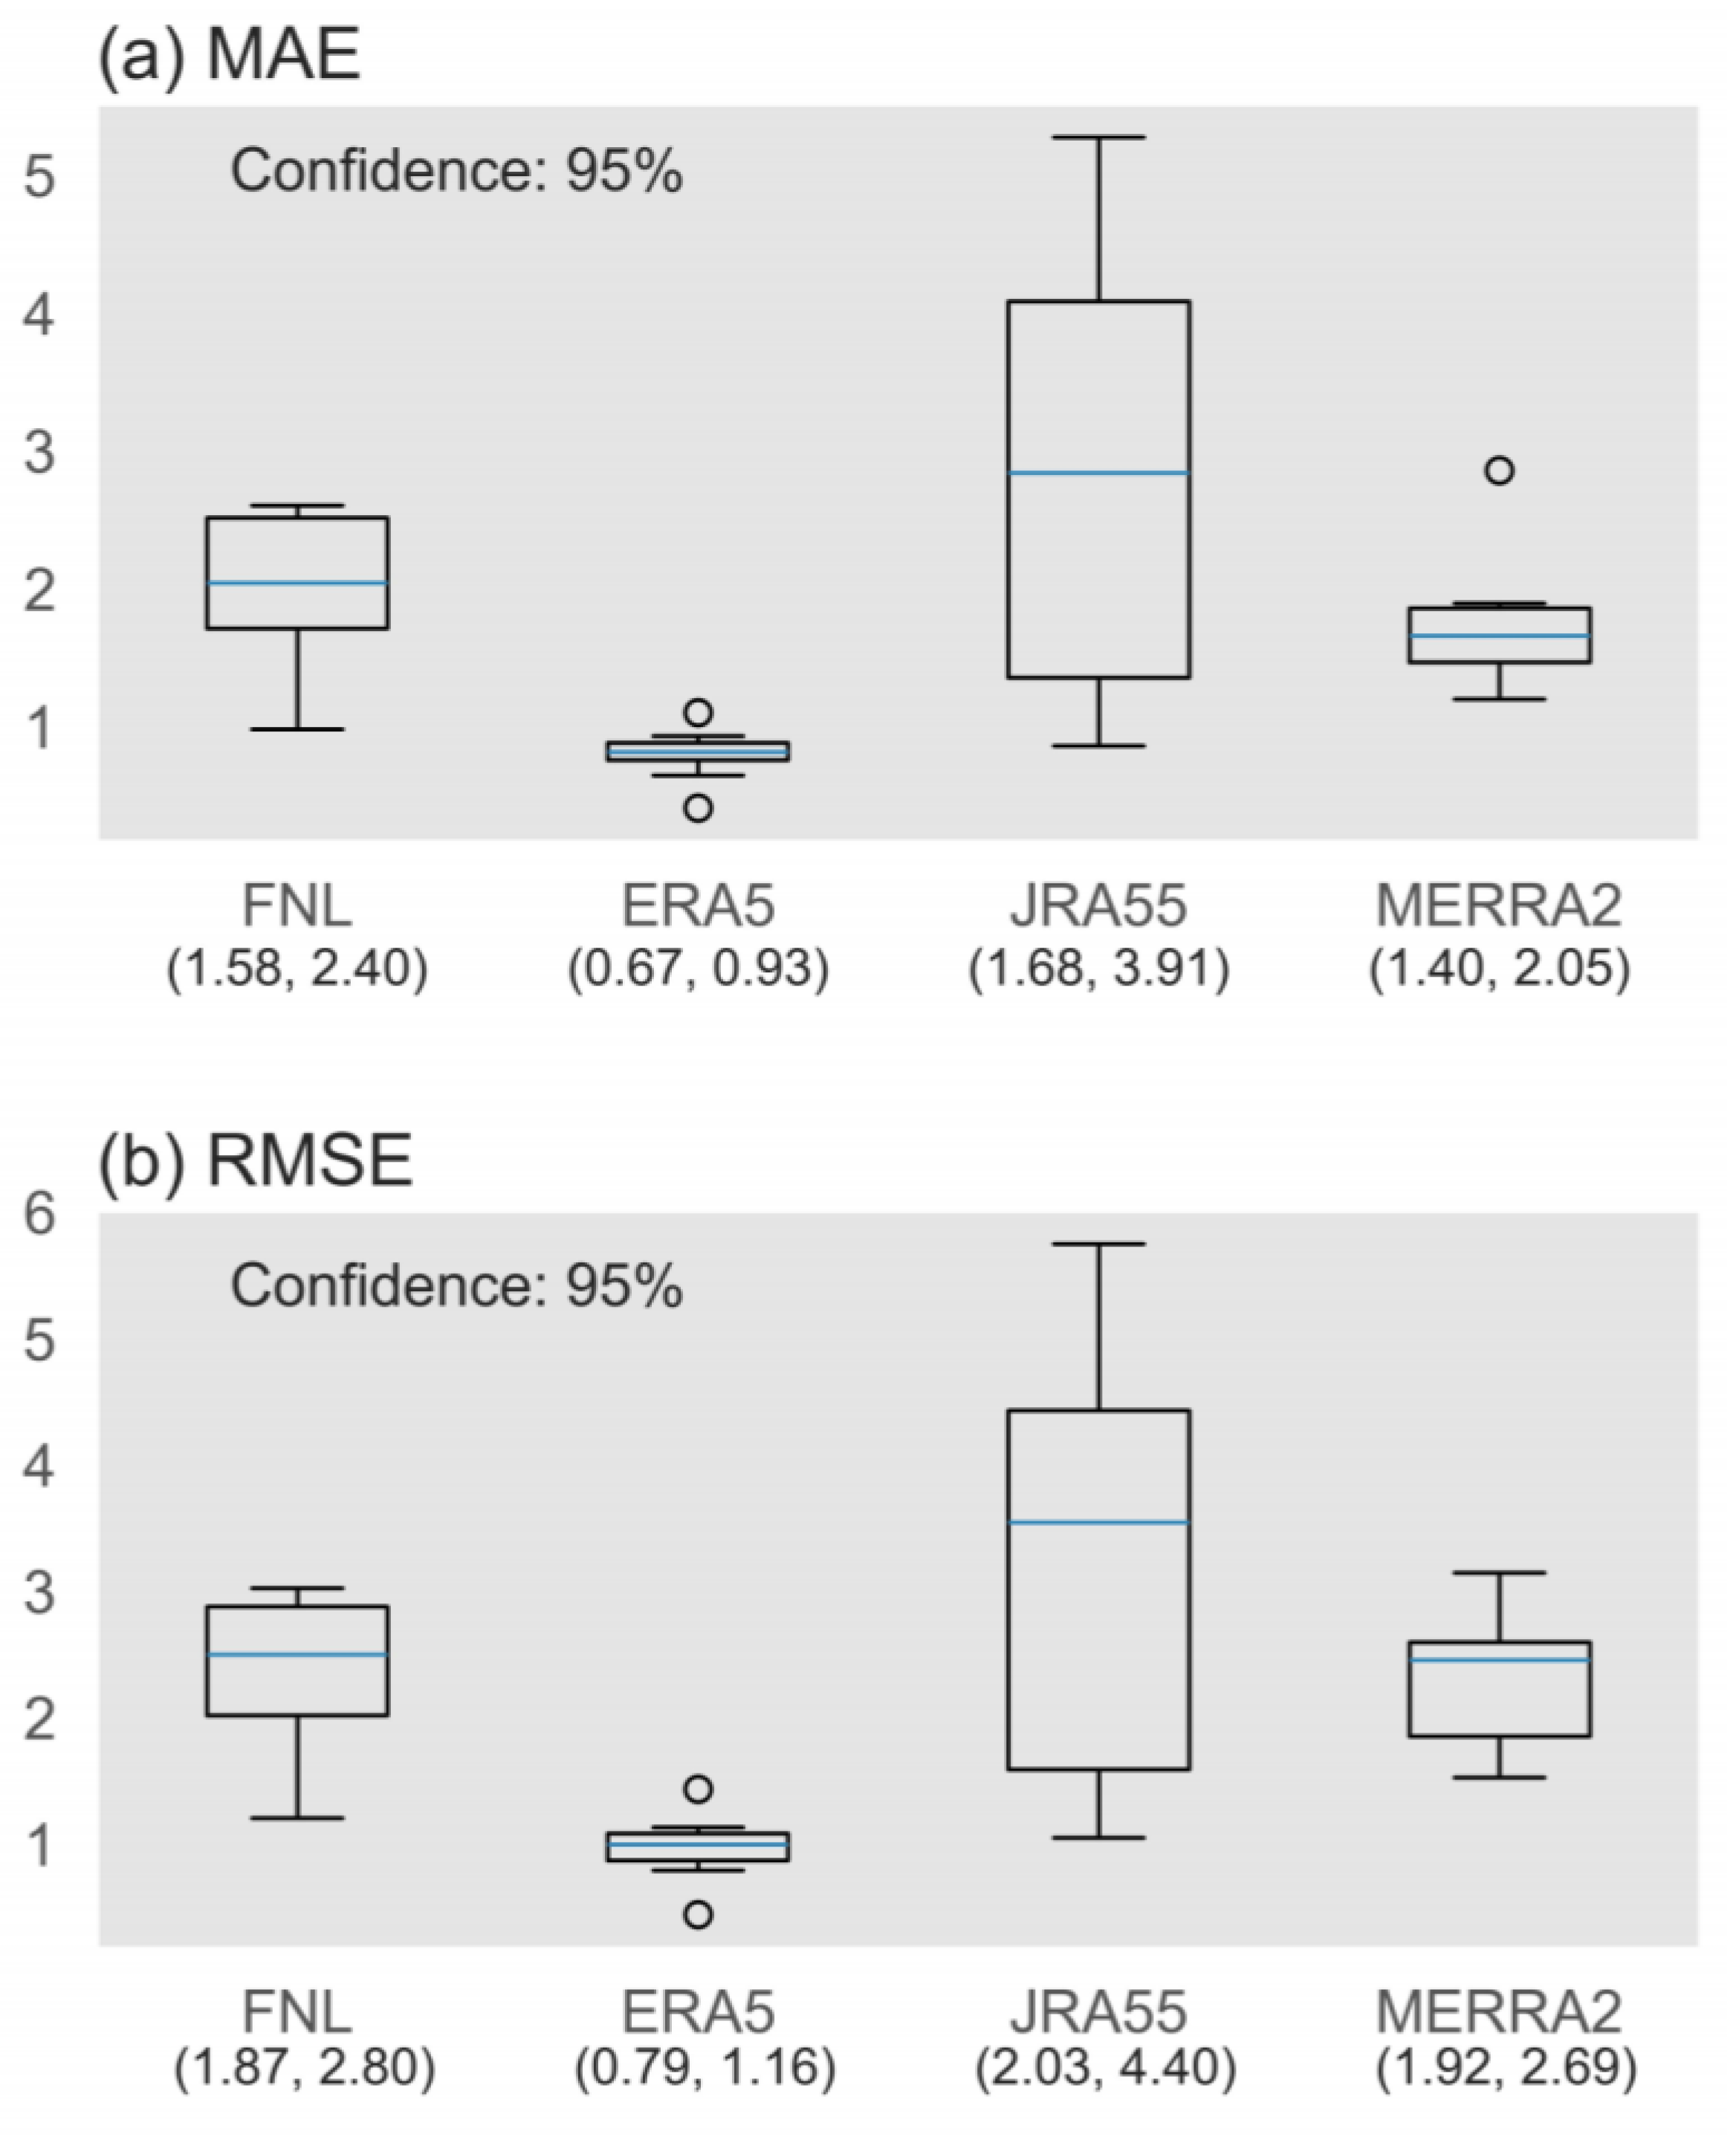
The FNL and JRA55 datasets are included to provide a broader comparison in the quantitative error analysis of reanalysis datasets (
Figure 9). To calculate RMSEs and MAEs, wind speeds corresponding to the observation times were derived from the nearest raster points of the FNL, ERA5, JRA55, and MERRA2 datasets. Missing values caused by the six-hour temporal resolution of the FNL and JRA55 datasets were removed before the confidence intervals were calculated.
Among the datasets, ERA5 yielded the lowest and narrowest confidence interval in MAE (0.79–1.16 m s−1) and RMSE (0.67–0.93 m s−1), indicating the highest accuracy in reflecting observational data on a synoptic scale. During the enhancement period of the BLJ from 15 to 18 June, ERA5 exhibited more reliable performance in capturing the strength of BLJs, with both RMSE and MAE being less than 1.2 m s−1. Overall, MERRA2 performed well, with relatively narrow confidence intervals for MAE and RMSE in the ranges of 1.40–2.05 and 1.90–2.69 m s−1, respectively, surpassing all other datasets except ERA5. FNL and JRA55 exhibited poorer performance, with differences between the maximum and minimum confidence interval values in RMSEs of 0.93 and 1.97 m s−1, respectively, particularly with JRA55 exceeding 4 m s−1 in this period. The wide range of the confidence interval suggests the need for further investigation and analysis to better understand the underlying data and reduce uncertainty. This degradation in performance might be attributed to their lower spatio-temporal resolutions.
To further examine the differences between the datasets, we conducted significance tests on the RMSEs and MAEs (
Table 1). All three datasets—FNL, JRA55, and MERRA2—passed the significance test at the 0.01 level when compared with ERA5, indicating significant differences from the ERA5 data. This finding supports the reliability of ERA5 shown in
Figure 9. In contrast, the performance of JRA55 in
Figure 9 exhibits distinct differences from the other datasets, which have achieved significance at the 0.01 level in the significance test. This suggests that JRA55, to a certain degree, lacks the capability to adequately characterize the BLJs in the northern SCS region during this observational period.
6. Summary and Conclusions
Boundary layer jets (BLJs), with jet cores lower than 900 hPa, frequently occur in the northern South China Sea (SCS) and significantly contribute to rainfall in South China. Despite their importance, direct observations of BLJs in this maritime region remain critically scarce. This study examines the characteristics and temporal evolutions of BLJs through direct observational data collected during a research voyage campaign from 15 to 18 June 2022. Additionally, it evaluates the performance of various reanalysis datasets in representing these BLJs during the observation period.
The observational campaign over northern SCS from 15 to 18 June 2022 coincided with an active period of BLJs, providing valuable insights into their detailed structures. The observation period is representative of typical conditions over the northern SCS, as its horizontal wind distribution and diurnal variation closely align with those observed in long-term reanalysis data [
15,
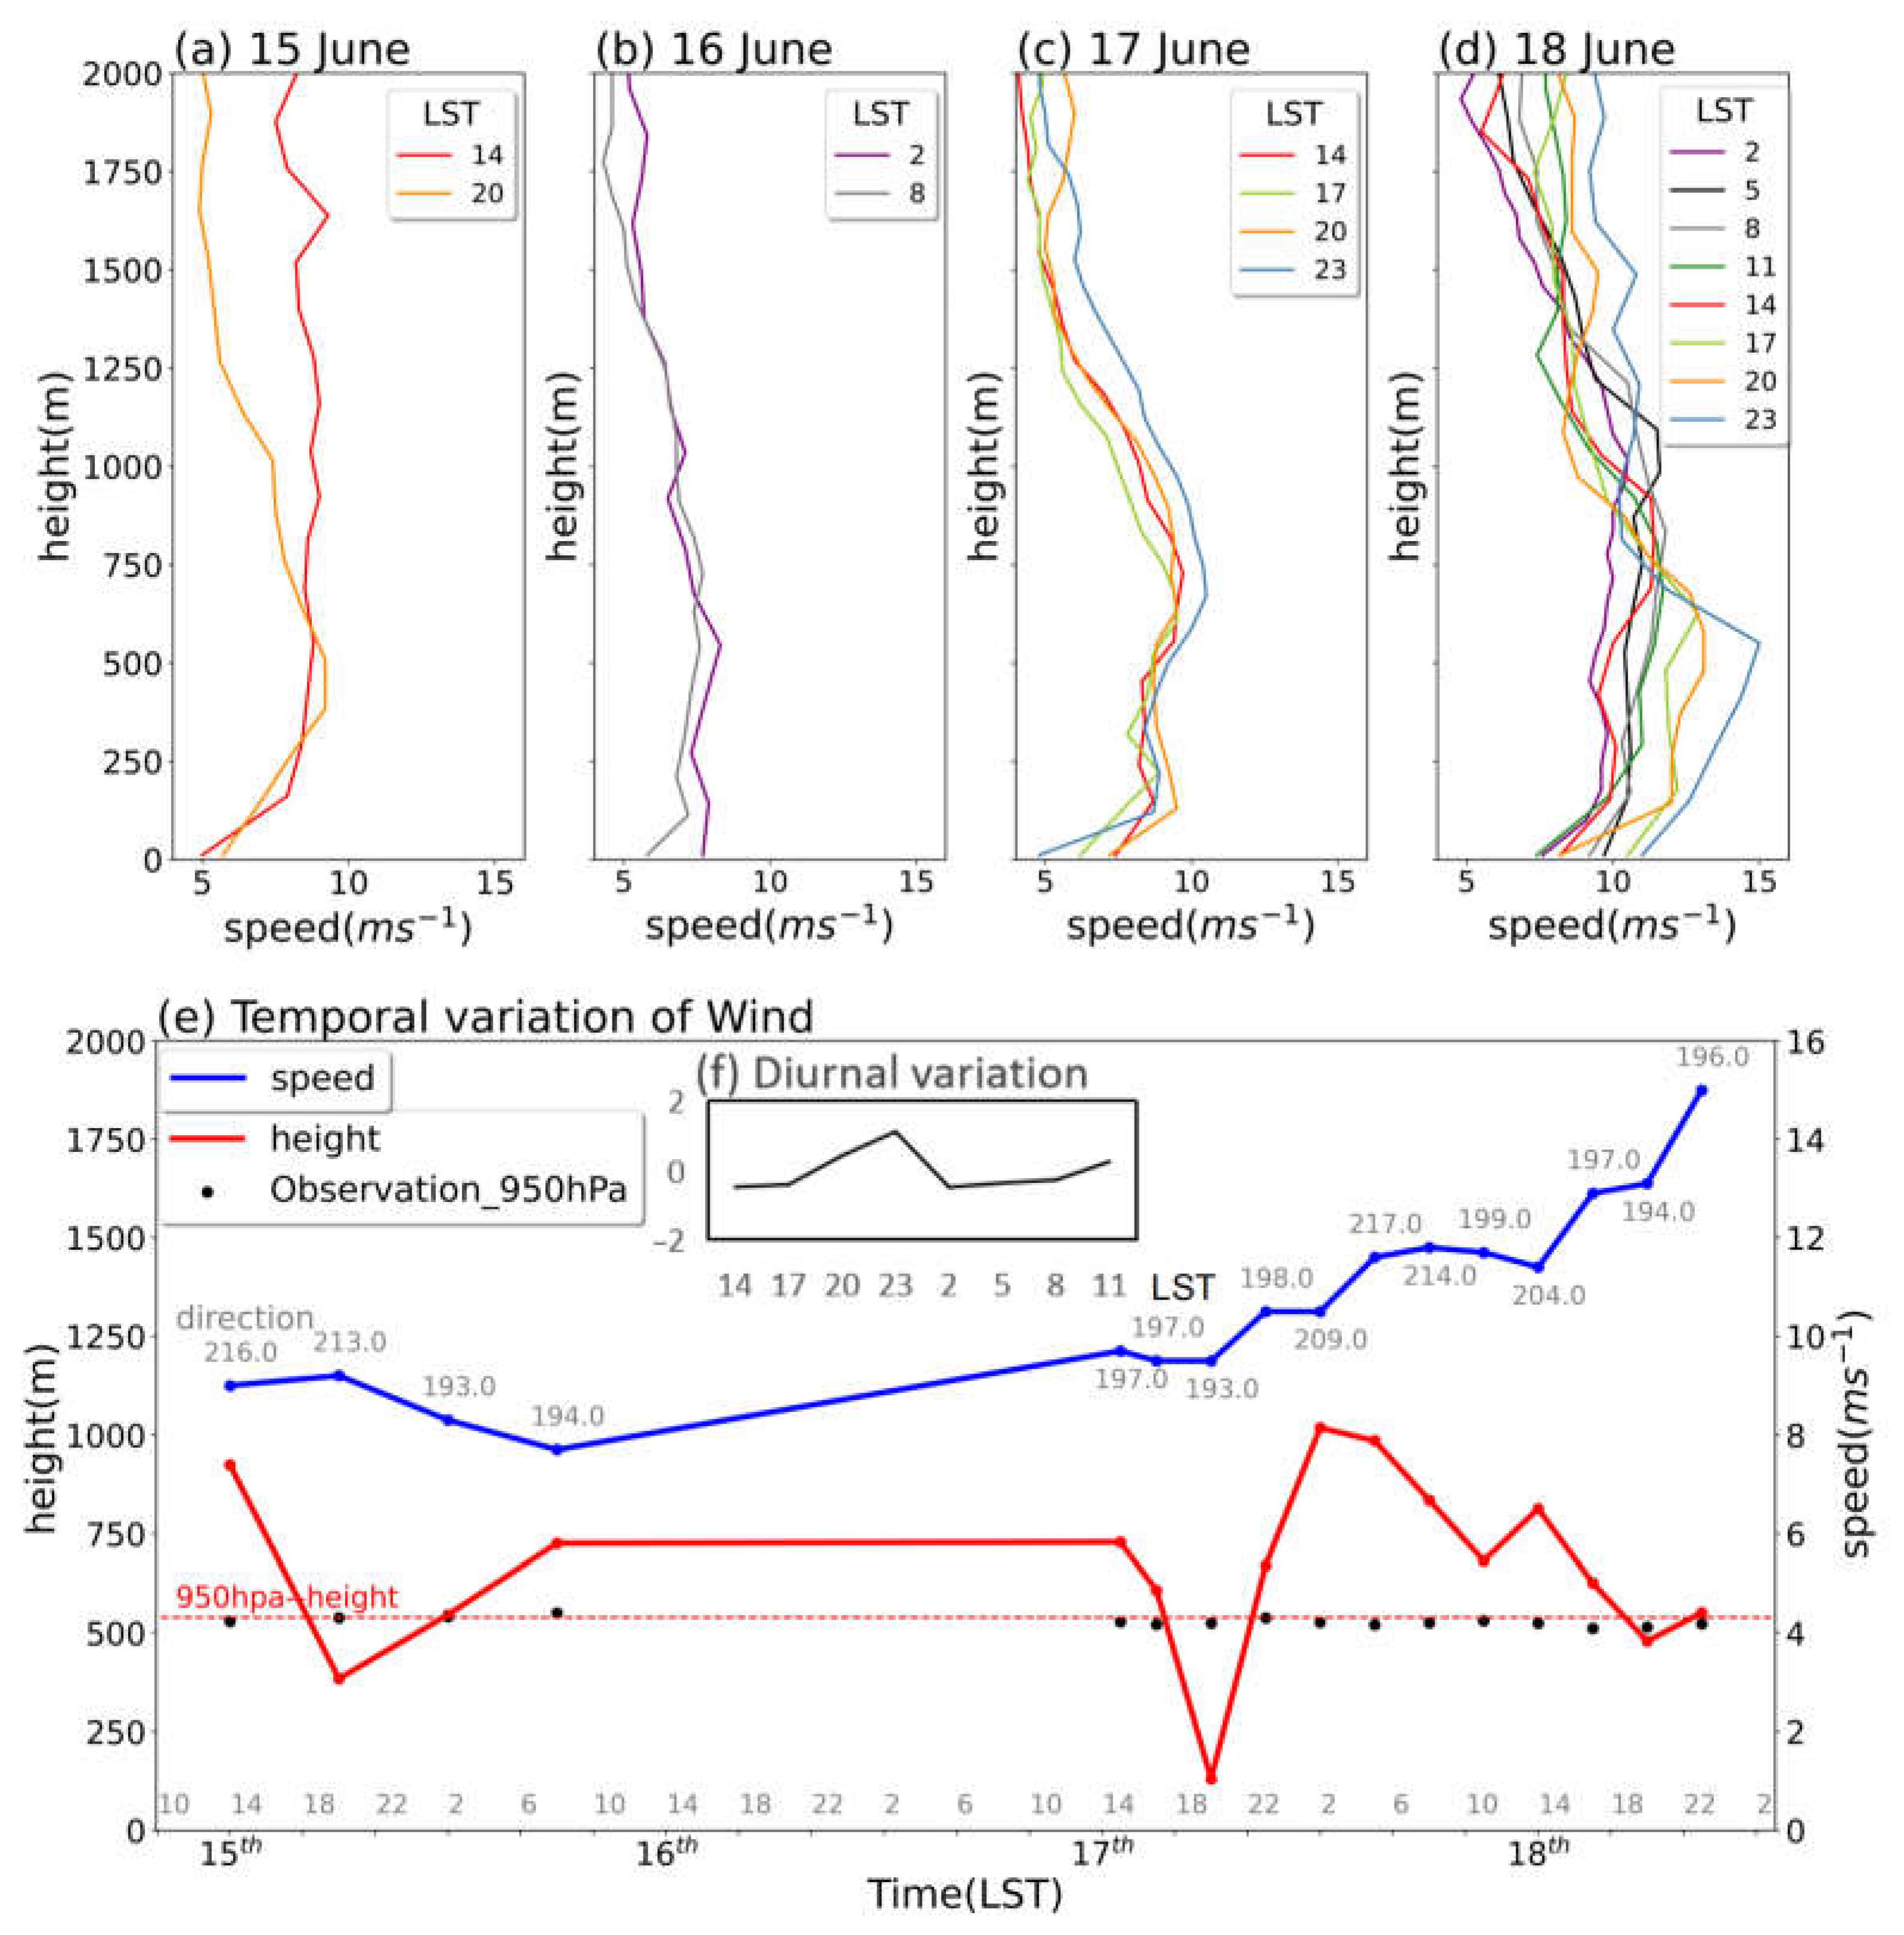
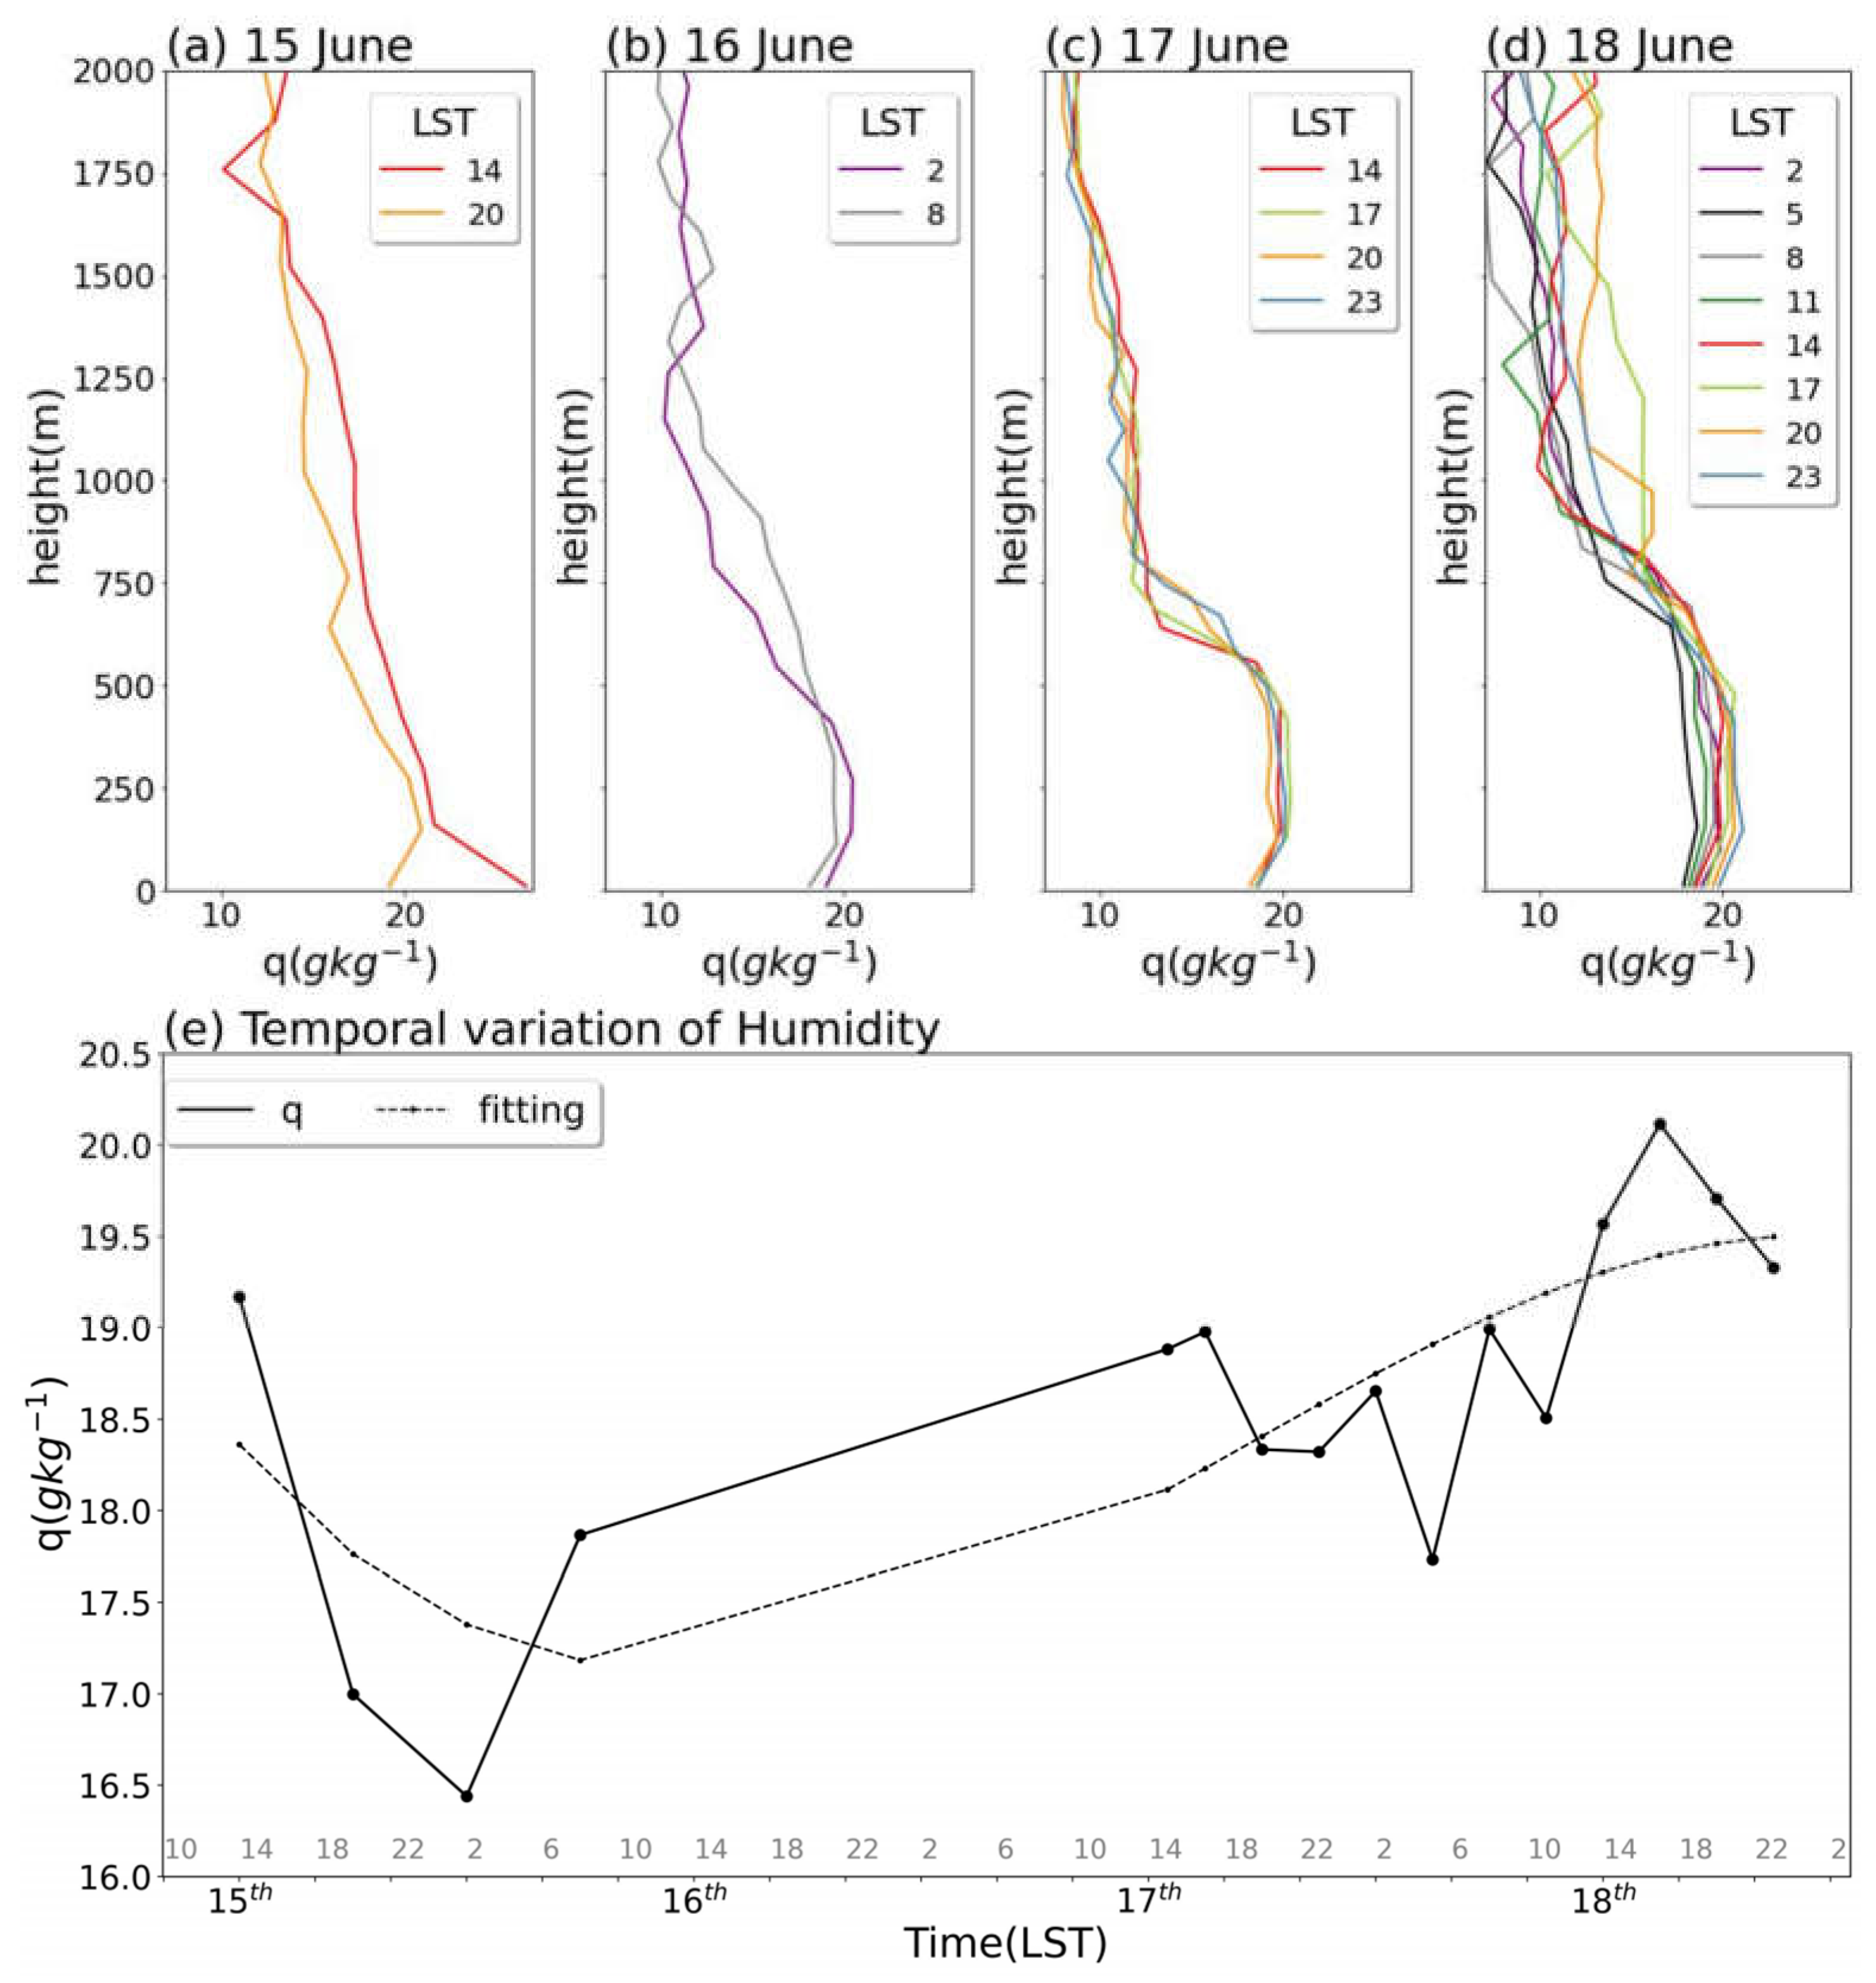
16]. Radiosonde data, obtained from soundings launched on the research vessel, indicated that BLJs primarily peaked at altitudes of 500–750 m above sea level. Synoptically, BLJ wind speeds exhibited a slight decrease from 15 to 16 June, followed by a significant increase after 17 June. Notably, on 17 June, double wind speed peaks were observed below 1 km, manifesting at altitudes of 250 and 700 m, respectively. Diurnally, BLJs exhibited peak wind speeds at 2300 LST and a secondary peak at 1100 LST. Temporal evolutions of moisture and wind speeds in the BLJs demonstrated similar trends, with an initial slight decrease in specific humidity followed by an increase in the thickness of the moisture layer.
This study also provides a detailed evaluation of the performances of ERA5 and MERRA2 reanalysis datasets in representing BLJs. On a synoptic scale, ERA5 effectively captured the weak decrease trend in wind speeds on 15 June and the subsequent BLJ enhancement on June 18. In contrast, MERRA2 performed poorly during 15–16 June but demonstrated improvement during the BLJ intensification period on 17–18 June. ERA5 generally underestimated specific humidity within the boundary layer while overestimating moisture at mid-levels around 800 hPa. Among the reanalysis datasets (ERA5, MERRA2, FNL, and JRA55), ERA5 demonstrated the best performance in representing BLJs on the synoptic scale, followed by MERRA2. However, both ERA5 and MERRA2 struggled to capture diurnal peaks in wind speeds, with ERA5 performing better in representing nocturnal wind speed acceleration.
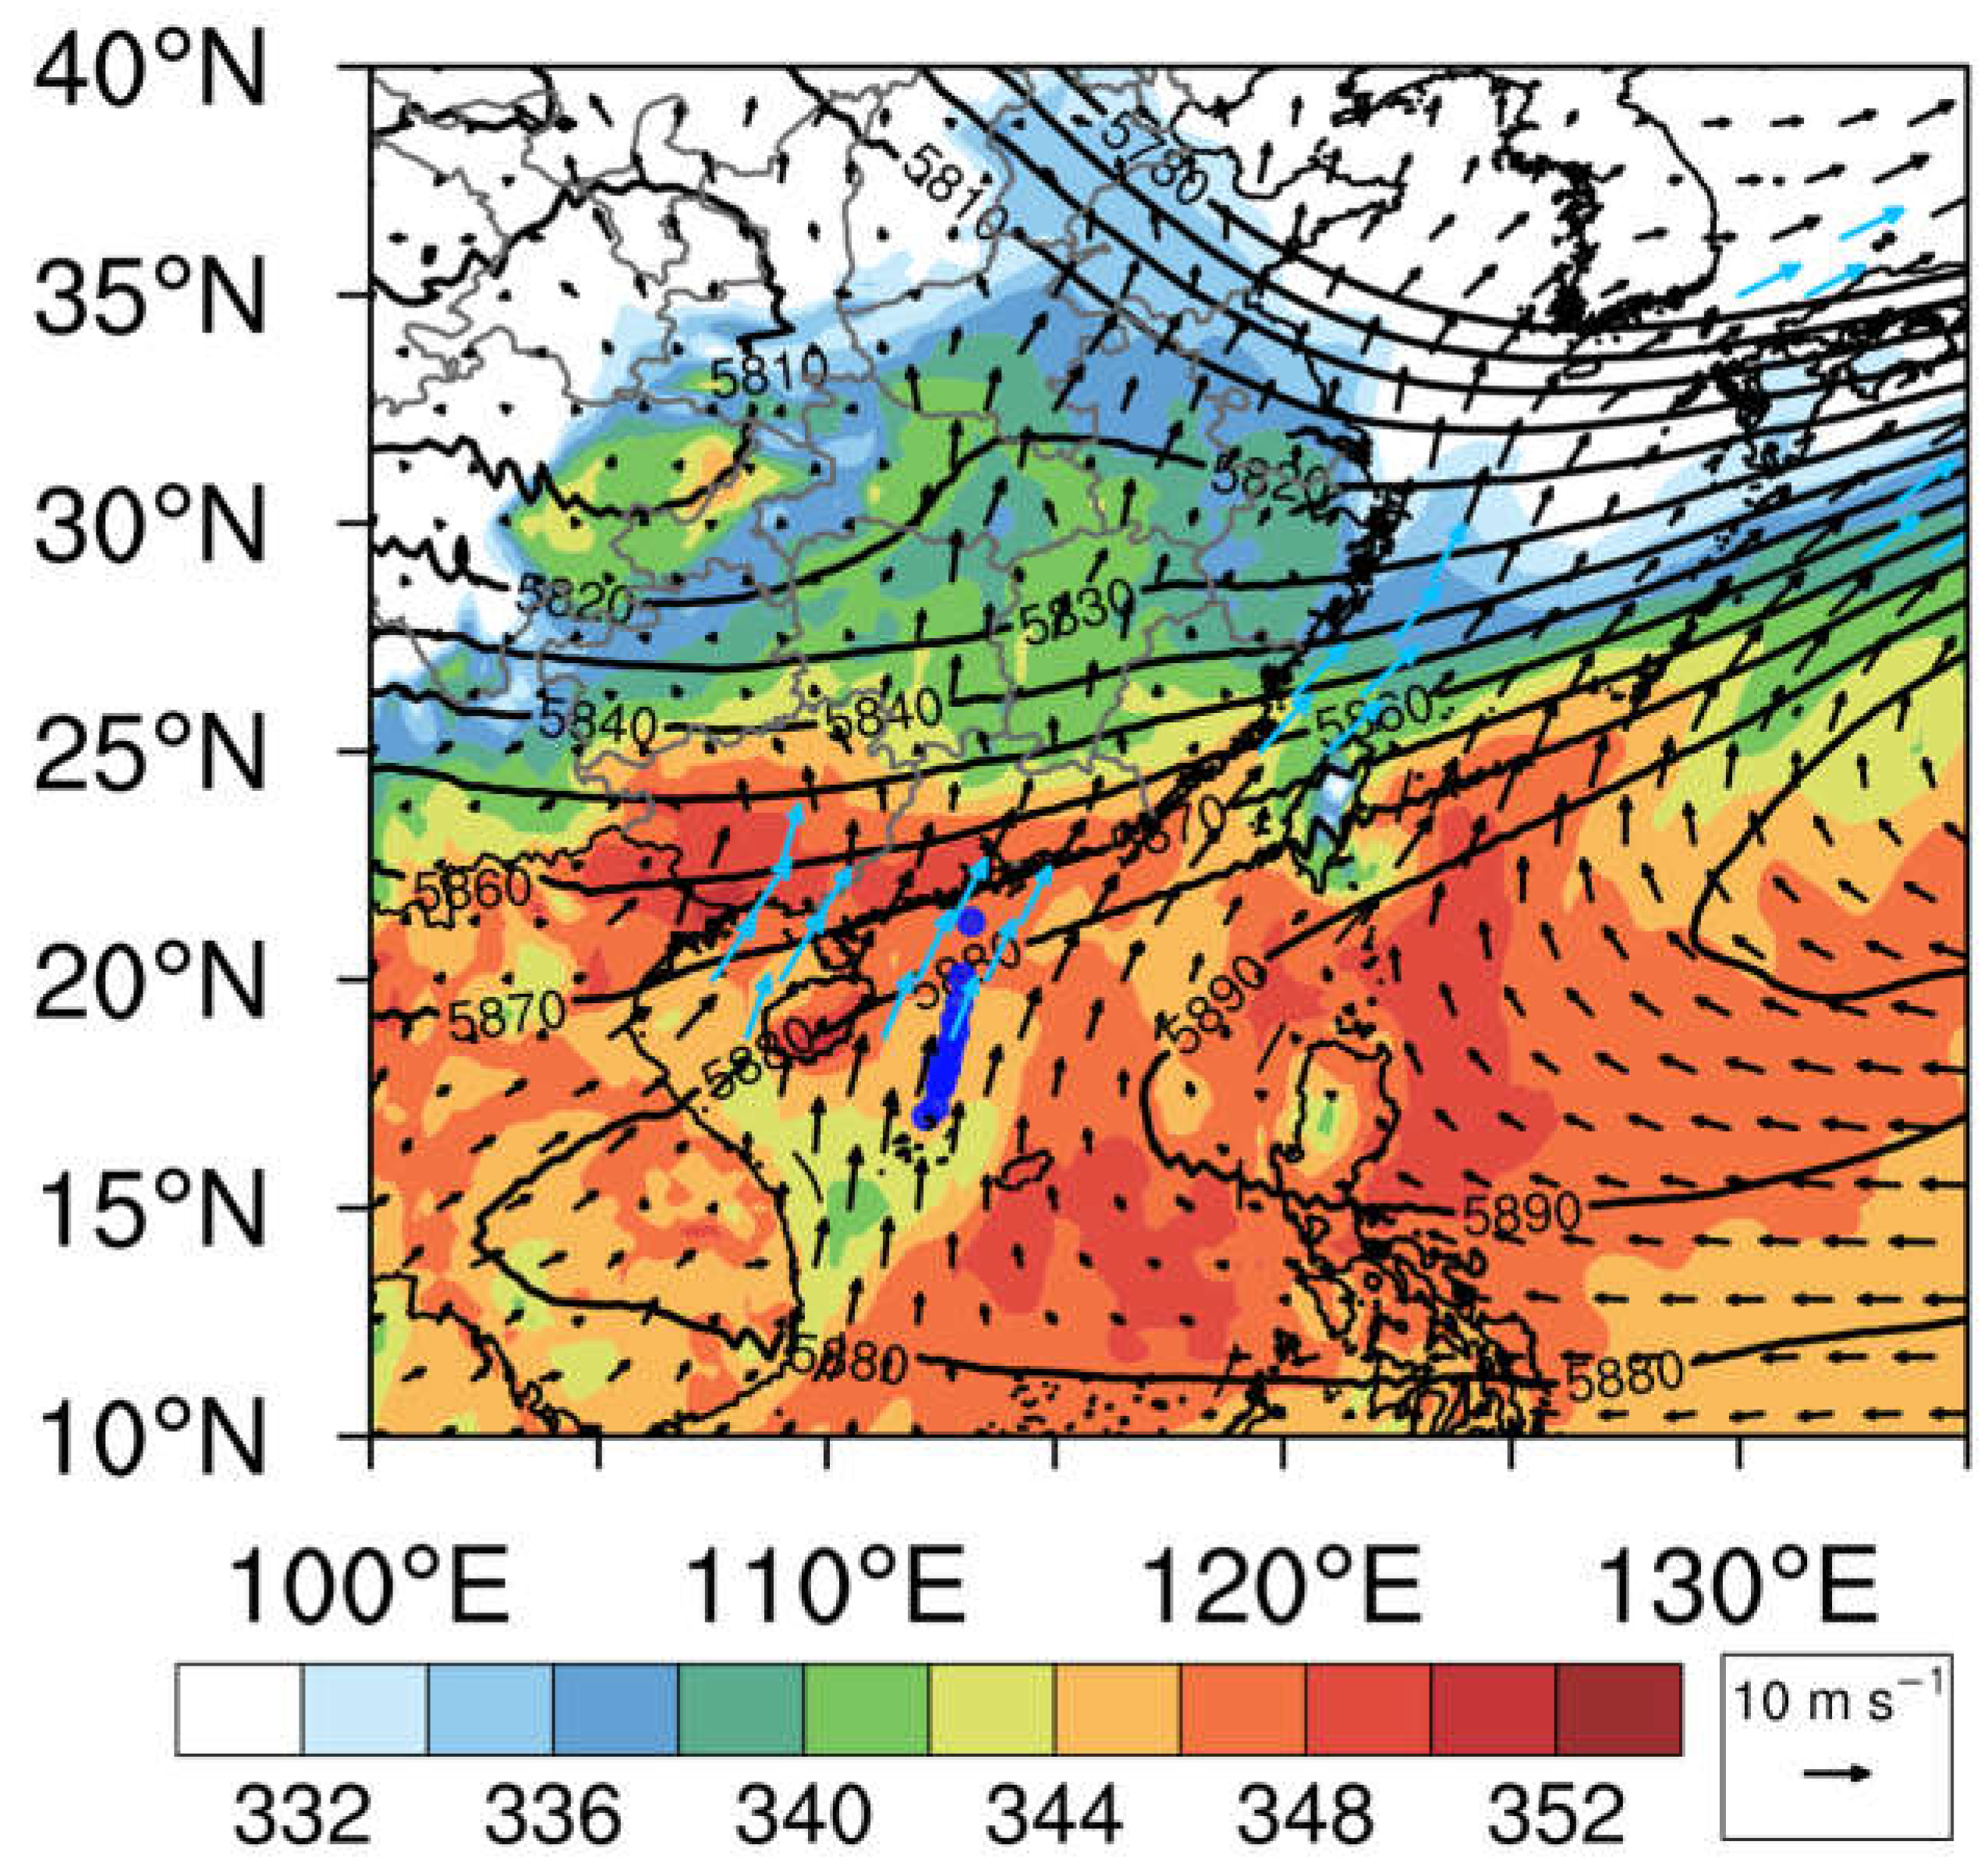
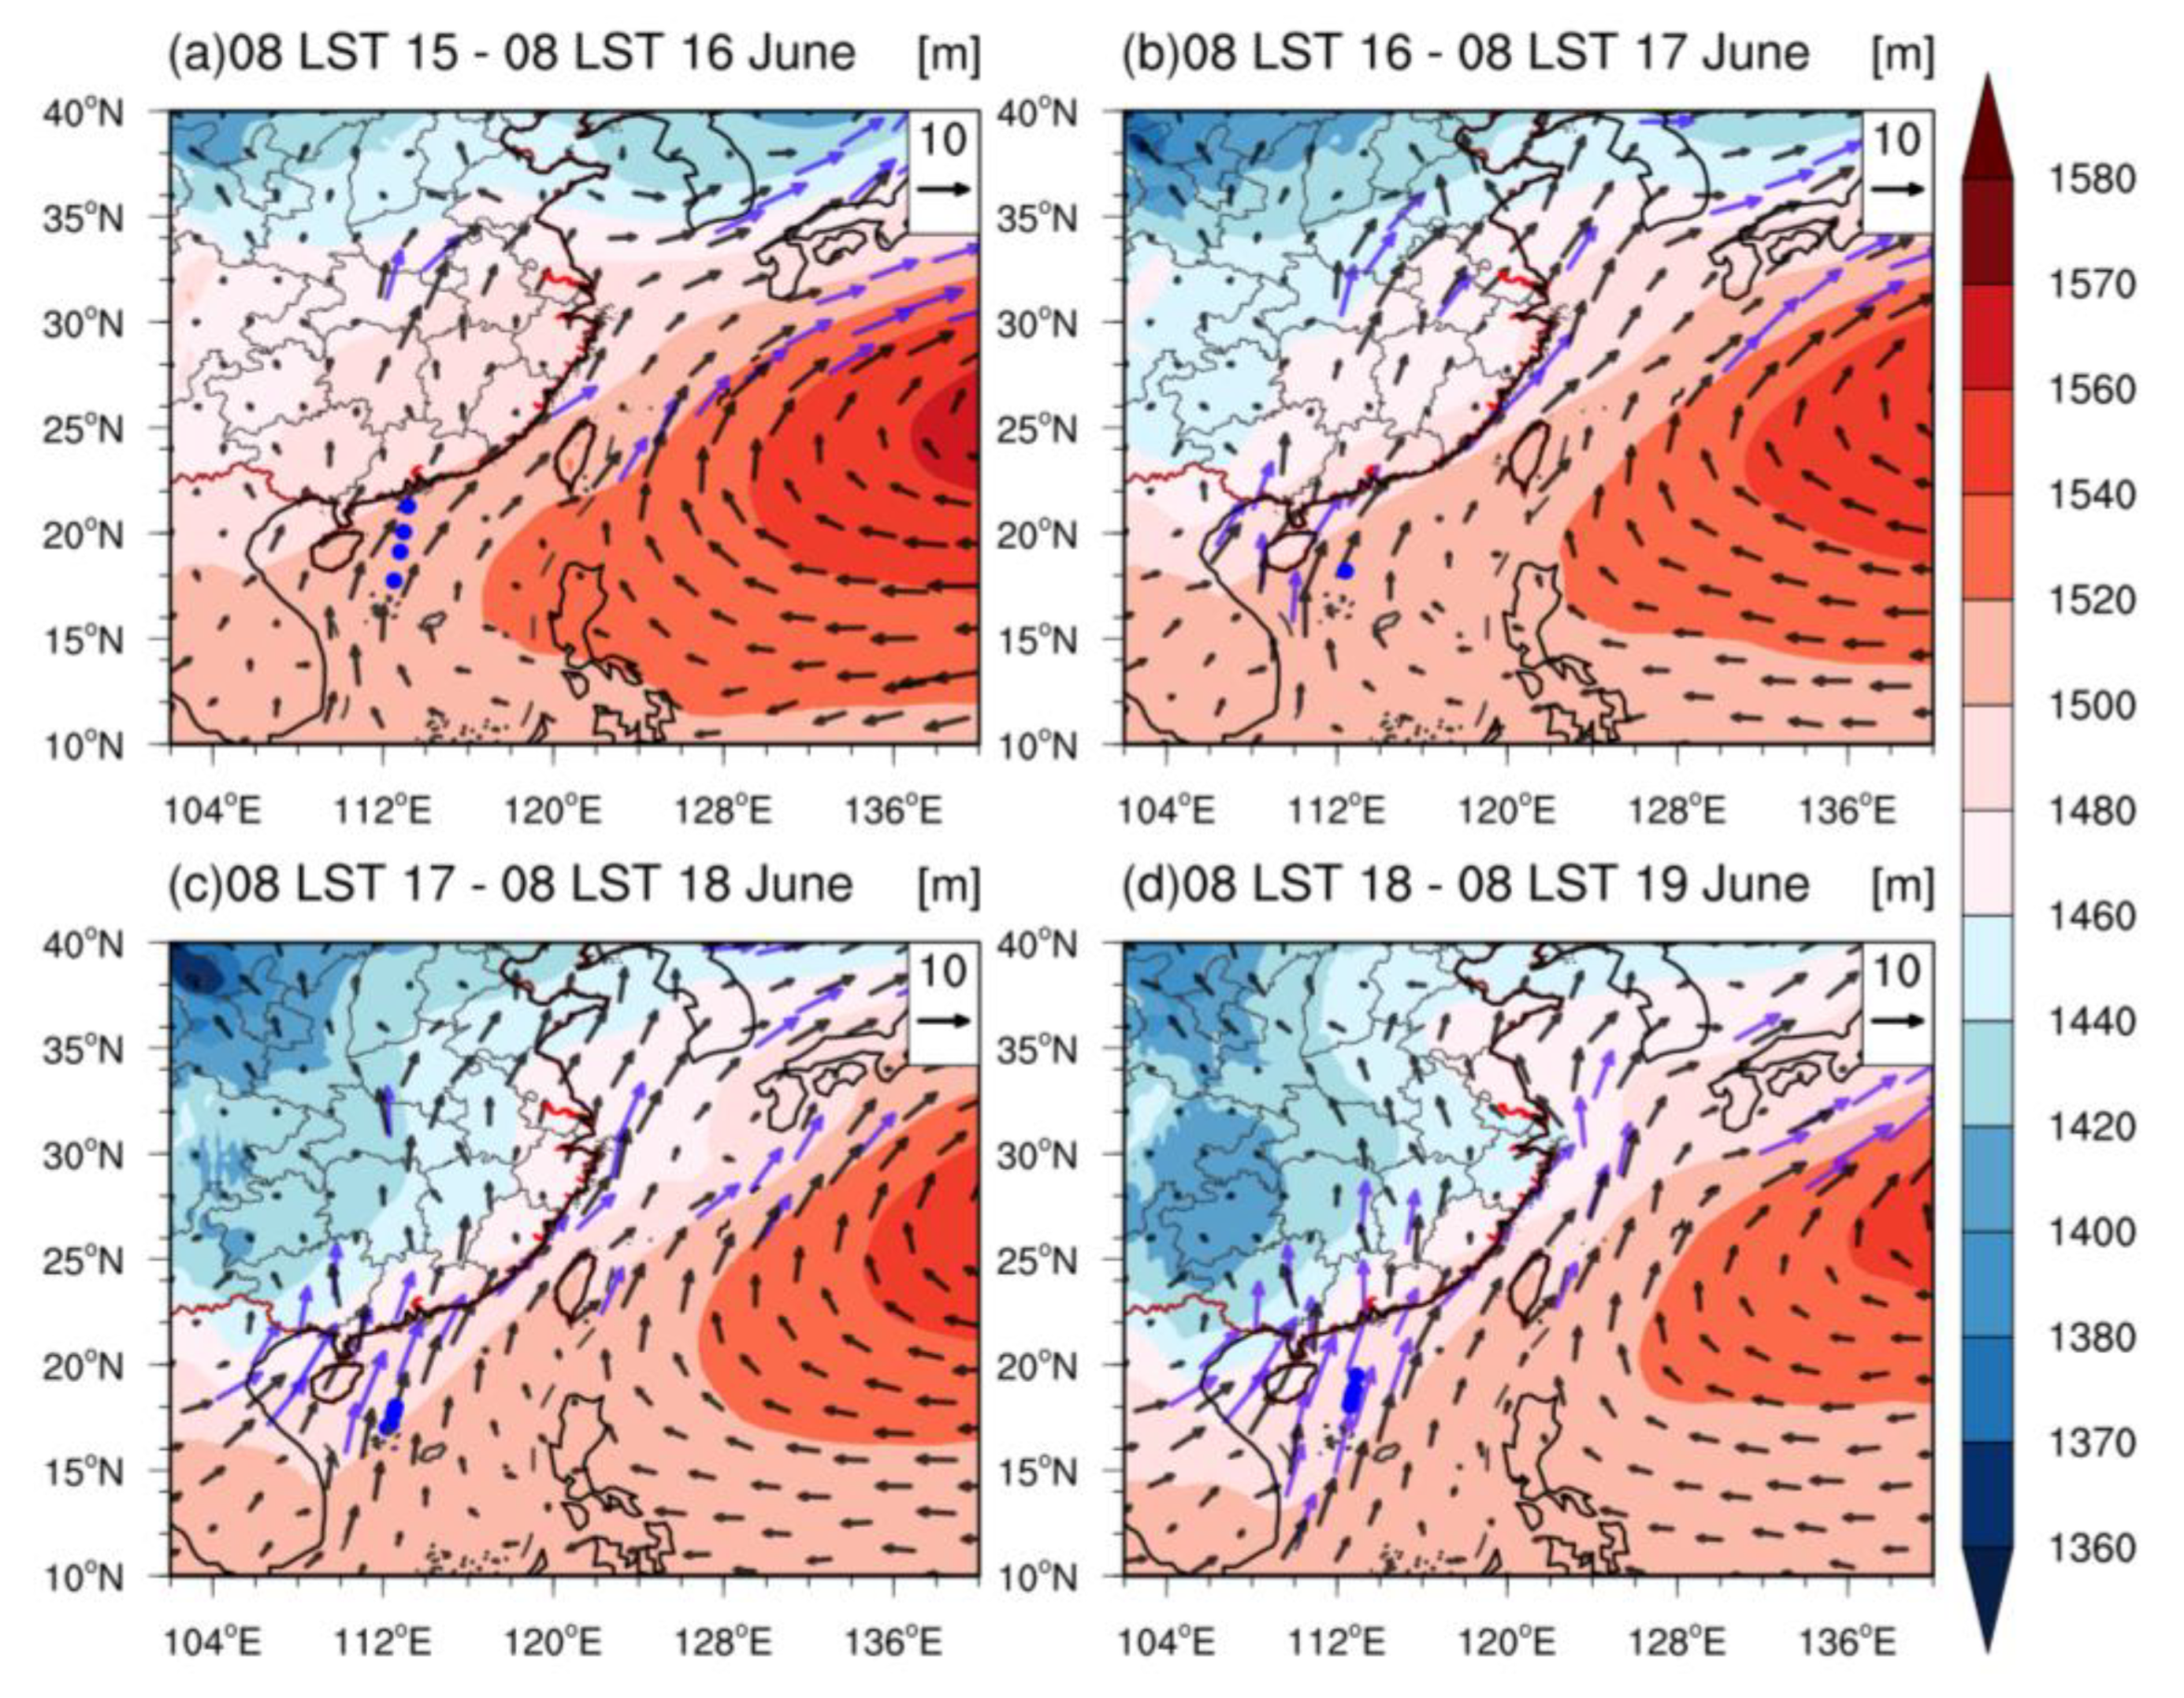
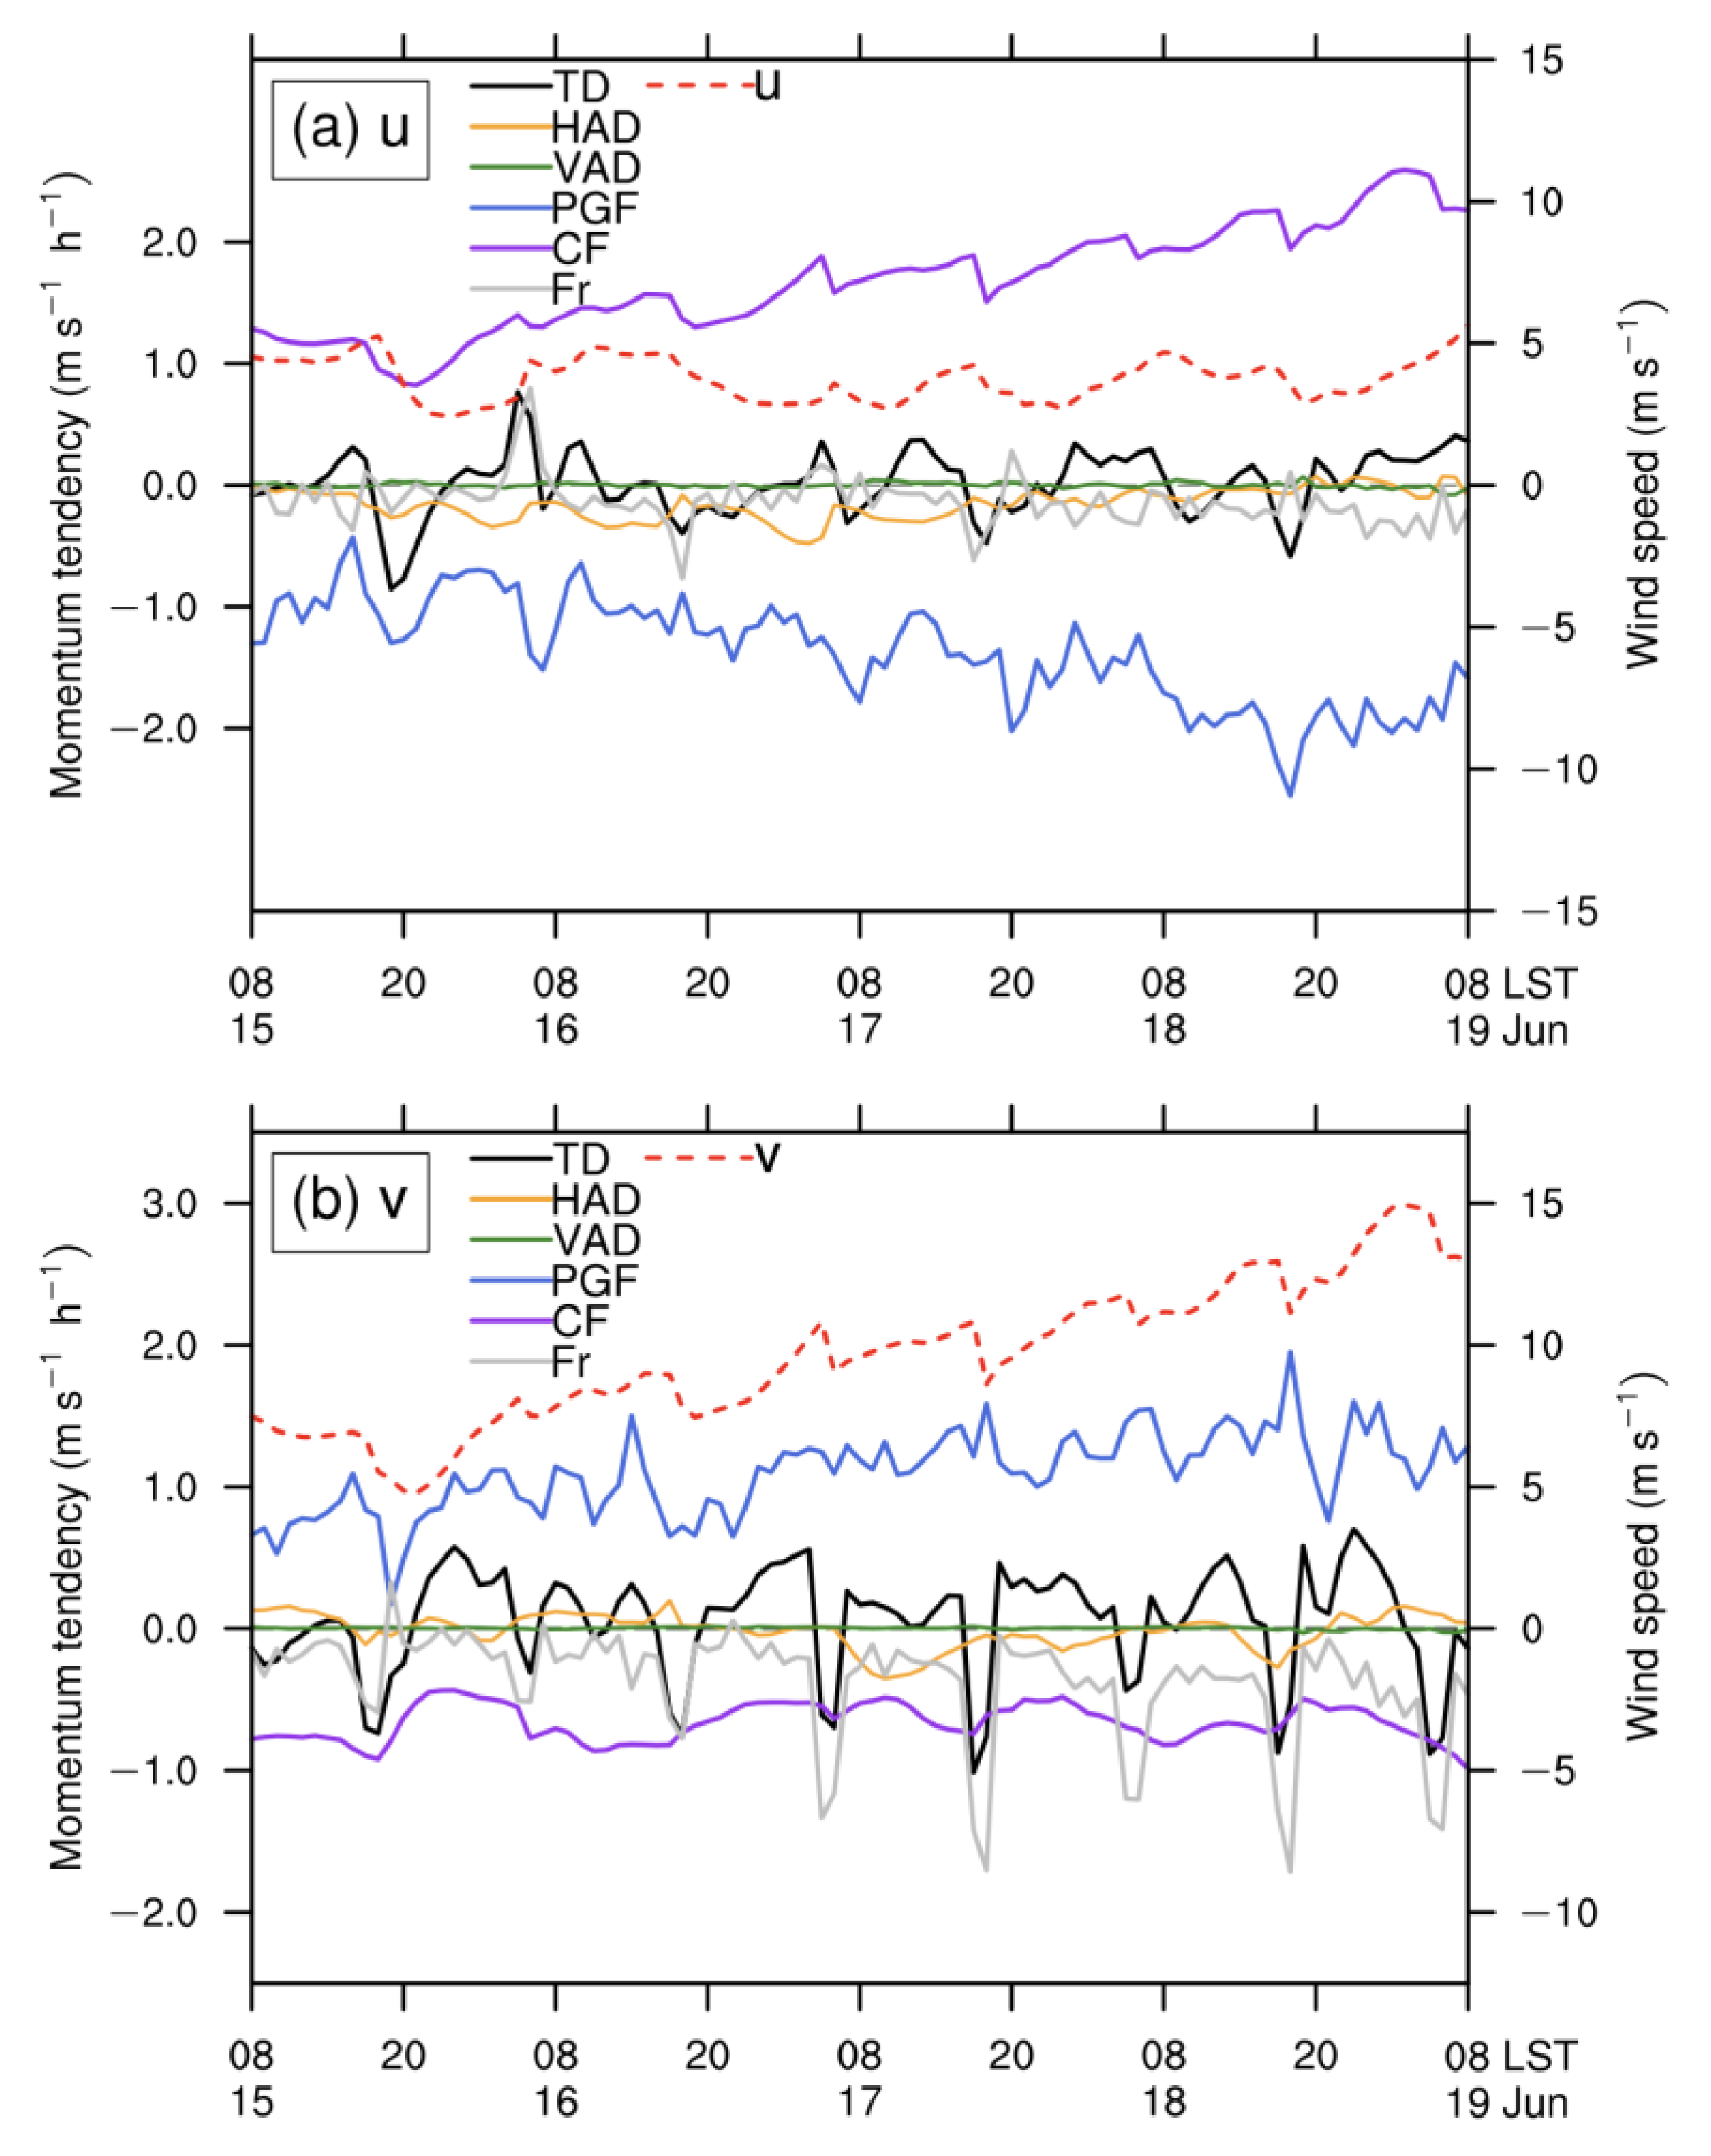
During this period, the BLJs were enhanced by a substantial pressure gradient force, resulting from the high-pressure system over the ocean and a low-pressure vortex over inland regions, further promoting rainfall in South China. On 15 June, a high-pressure system covered part of the northern SCS, modestly enhancing geostrophic wind. From 16 to 18 June, a low-pressure vortex intensified and moved southward to South China, accompanied by the sustained eastward movement of the high-pressure system. The core regions of the BLJs were located between the low-pressure system inland and the high-pressure system over the sea. In addition, the positions and intensity of the BLJs significantly influenced precipitation in South China, with a northward movement to inland regions and intensification of the rainband on 17–18 June.
This study is significant as it provides rare observational data and evaluates the ability of reanalysis datasets to represent BLJs over the northern SCS. Direct observations, as precise measurements at specific locations, offer greater reliability and reduce uncertainties compared to reanalysis or satellite data, which are influenced by model assumptions and retrieval errors. Moreover, direct observations have the advantage of revealing fine-scale features and local variations. The observed double jet cores below 1 km were not captured by reanalysis datasets, likely due to their limited vertical and horizontal resolution as well as the boundary layer parameterization scheme.
In addition, ERA5 exhibits insufficient accuracy in the diurnal variation of BLJs compared to observation data. Given the potential for artificial discontinuities introduced by assimilation windows, ERA5 may be more suitable for synoptic-scale studies rather than resolving fine-scale diurnal variations in representing BLJs. Given that numerous studies have utilized reanalysis data to investigate BLJs, the comparison of four reanalysis datasets with observation data provides valuable insights for refining these datasets in the future.
Compared to other coastal BLJs that have been included in global statistical analyses, the BLJs in the northern SCS have been extensively documented through various case studies and regional analyses, highlighting their dependence on synoptic-scale systems as well as local thermal and dynamical processes [
2,
13,
15]. The BLJs in the northern SCS exhibit similar altitudes and wind speeds to other coastal BLJs, while they display unique diurnal variations. Unlike the typical single nocturnal peak observed in other coastal BLJs, driven by nocturnal boundary layer inversions, the BLJs in the northern SCS often exhibit double peaks diurnally, with one peak occurring during the nighttime and another in the afternoon.
To better understand the climatological characteristics of BLJs in the northern SCS, future research requires longer time series and higher-resolution observation data, potentially through repeated observations by scientific research vessels or intensive observations of fixed islands and reefs. The universality and inter-annual variation of BLJs before and after the onset of the SCS monsoon merit further investigation. Moreover, to improve the evaluation of reanalysis datasets, it is crucial to explore the specific weather conditions under which these datasets can more accurately reflect BLJ characteristics. In addition, other factors contributing to errors in these datasets warrant further investigation.
