Article

Comparison of Non-Contact Measurement Technologies Applied on the Underground Glacier—The Choice for Long-Term Monitoring of Ice Changes in Dobšiná Ice Cave

1
Research and Monitoring Department, Cave Protection Branch, Slovak Caves Administration, Hodžova 11, 03101 Liptovský Mikuláš, Slovakia
2
Institute of Geodesy, Cartography and Geographical Information Systems, Faculty of Mining, Ecology, Process Control and Geotechnologies, Technical University of Košice, Park Komenského 19, 04001 Košice, Slovakia
3
Cave Care Department, Cave Protection Branch, Slovak Caves Administration, Hodžova 11, 03101 Liptovský Mikuláš, Slovakia
4
Department of Physical Geography and Geoinformatics, Faculty of Natural Sciences, Comenius University Bratislava, Ilkovičova 6, 84215 Bratislava, Slovakia
5
Institute of Earth Resources, Faculty of Mining, Ecology, Process Control and Geotechnology, Technical University of Košice, Park Komenského 19, 04001 Košice, Slovakia
*
Author to whom correspondence should be addressed.
Remote Sens. 2024, 16(20), 3870; https://doi.org/10.3390/rs16203870
Submission received: 11 September 2024 / Revised: 15 October 2024 / Accepted: 16 October 2024 / Published: 18 October 2024
(This article belongs to the Section Remote Sensing in Geology, Geomorphology and Hydrology)

Abstract

:
Because of the international significance of Dobšiná Ice Cave (Slovakia), it is important to have proper data about the state, movement, or decrease of the ice in which various information about past environments can be preserved. Thus, the goal of the study is to find out which of the 3D scanners used here is the most suitable for long-term monitoring of ice changes. A comparison of the 3D point clouds acquired from laser scanners Leica C10 and Leica RTC360 and the mobile scanners GeoSLAM Zeb Horizon and the iPhone 14 Pro to reference clouds from photogrammetry or tacheometry is provided, and also the process of data acquisition and registration is described. To catch the differences in point clouds according to different types of ice, cross-sections of the vertical and layered ice wall, horizontal ice surface, and artificial ice tunnel are analysed. Some remarkable but also unwanted properties of 3D scanners have been concluded, and the best compromise for 3D scanning of this ice cave has been chosen. According to the diversity of ice types and different layers occurring in Dobšiná Ice Cave, results could be partially helpful in choosing a suitable measurement technology for ice in other caves worldwide.

1. Introduction

Modern non-contact technologies such as terrestrial laser scanning (TLS) and photogrammetry have been increasingly used in cave environments in the last decade. These technologies brought opportunities to the research of caves, with which we can easily map, measure, and visualise the morphology of caves. The results are incomparable with the possibilities offered by classical surveying. Firstly, 3D mapping in caves was mostly focused on visualisation or extracting basic morphometric characteristics from 3D models [1,2,3,4,5,6], but the models of caves have also been used for advanced research, for instance, geomorphological analyses or studying the genesis of caves [7,8,9,10,11,12,13], for modelling the cave’s climate [14,15,16], or even for chiropterological mapping [12,17], and there are many other applications widespread not only in geosciences. A review of a decade of cave surveying with TLS is provided by [18]. However, there are not many studies dealing with 3D scanning of the ice fillings of caves (see next subchapter), and even fewer describing the real accuracy of 3D mapping (not just the ideal one provided in the producer’s datasheet). Speleologists are overwhelmed either by new possibilities of analyses or just by an overview of the cave, which a 3D model provides. They usually do not have the need, time, expertise, or possibilities to analyse such information, and in the studies dealing with the ice cave scanning, there usually is just a note about greater noise or deeper penetration in the point cloud, but no exact values or further analysis is given. Sometimes, a mention of filtration or manual removal of false points is provided, even though the process could be time-consuming. For better future choices and less time spent with such work, this study aims to find out which devices are more suitable for TLS in ice caves. Our goal is to find out if the accuracy of used TLS technologies is good enough for long-term monitoring of the ice surface in Dobšiná Ice Cave (Slovakia). Research is focused on the comparison of mobile laser scanners—which are more compact, more comfortable, and more preferable by cavers; with classical TLS—static laser scanners on tripods, which are mostly used in geodesy and considered more accurate in general. The topic is becoming more important as climate change is present, so we are losing the ice as a potential source of information, e.g., about past climate and environmental changes [19] or as evidence of past vegetation changes [20] rapidly. That is the reason why there is a need to find out if methods and measuring instruments are suitable and reliable in such an environment, so the time will not be wasted, and the possible information will not be lost.

1.1. Non-Contact Measurement Technologies in Ice Caves

In the field of TLS and photogrammetry, in comparison with other caves, very few studies dealing with ice caves have been published to date. In the Eisriesenwelt Cave, based on 3D laser scanning, the first estimation of the actual ice surface was given using a 3D scanner Faro Photon 120/20 (FARO Technologies, Inc., Lake Mary, FL, USA) with laser in the near-infrared spectrum at a wavelength of 785 nanometres. The penetration depth of the laser beam into the ice was analysed here but, unfortunately, not described in the study. The entire surface structures of the ice-filled part of the Eisriesenwelt were scanned from 158 scan stations, resulting in digital point clouds with just a few millimetres of point spacing [21,22]. In the Peña Castil ice cave, systematic control of variations in the ice level had been performed since October of 2011 at the different cryospeleothems and their volumes through the use of medium-range scanner Leica ScanStation C10 (Leica Geosystems, Balgach, Heinrich-Wild-Strasse, Switzerland) with a nominal precision of ±6 mm at a distance of 50 m. The study claims that the application of TLS technology is crucial for monitoring cave ice evolution, ice flow, and surveying specific cave morphologies [23]. Research in this ice cave led to an interesting application of TLS, where a thermographic camera was used to characterise and study the vertical thermal component of the air masses and thermal study in three dimensions, combining the results with the TLS to generate orthothermograms [23,24]. A recent study in the Picos de Europa was focused on Cryomorphological topographies presented on the Peña Castil ice cave, Altaiz ice cave, and Verónica ice cave using Faro Focus 3D X330 (FARO Technologies, Inc., Lake Mary, FL, USA), with a range of 330 m and a precision of <1 mm at distances of less than 25 m. Obtained 3D models were used for monitoring variations and changes in the ice mass [25]. With similar properties of the environment, similar problems are being discussed in the research of ice conduits. Also, with the use of FARO Focus 3D X330, the applicability of TLS was tested in the englacial channel of valley glacier Austre Brøggerbreen, Svalbard. Registration of each scan was conducted within 6.8 mm positional accuracy; however, the study concluded that the point cloud quality depends on the physical and optical properties of the surfaces within the conduit (ice, snow, hoar frost, and sediment) with their respective absorption coefficients in the shortwave infrared, reflectance type, and the complex conduit morphology determining point density and distribution. Although laser beam penetration into the uppermost ice layers was small, structural weaknesses allowed penetration and reflection from depths of ≤0.6 m [26]. Also, research in the Silická ľadnica cave in Slovakia provided information about how the accuracy of TLS can affect the results. The cave was surveyed by a laser scanner Riegl VZ-1000 (RIEGL Laser Measurement Systems GmbH, Horn, Austria), which operates with a laser beam in the near-infrared wavelength (1550 nm) with a nominal precision of ±8 mm at a distance of 100 m. Complex 3D models of the cave floor were used to quantify the volumetric changes. The selective Cloud-to-Cloud approach reduced the overall registration error of the data time series into a unified coordinate system by avoiding the repeated positioning of GCPs (ground control points) by GNSS (Global Navigation Satellite System). With the total error (error of instruments + error of registration) of 0.0092 m on the observation area of 1200 m2, a volume of up to 11.04 m3 may result from a measurement error [14]. For the 3D ice change detection, TLS was also applied in the alpine Hundsalm ice cave (Austria), which was surveyed with Riegl VZ-2000i (RIEGL Laser Measurement Systems GmbH, Horn, Austria) with a wavelength of 1550 nm during the three campaigns in 2020. For outliers’ filtration, thresholds for deviation and reflectance were used and selected based on the local and dataset-dependent requirements [27]. The same 3D scanner was used in Slovenian ice caves with the aim of measuring ice thickness in the context of climate change. Multiple measurements were integrated into a single point cloud, co-registered using stable cave walls. A reflection filter tool was used because ice and wet surfaces are prone to false reflections. The datasets were used to make detailed comparisons of ice level change and calculation of ice volume change between different periods. Because of the problematic reflection of measurements on ice and especially on wet surfaces, scanning during cold periods, when water is completely frozen, was recommended [28]. In the Julian Alps, the application of a terrestrial Structure-from-Motion Multi-View Stereo approach combined with ground-penetrating radar surveys was investigated for monitoring the surface topographic change in the two permanent ice deposits in caves. The study provided comprehensive ice thickness imaging with sub-centimetre resolution results allowing the total ice volume calculation, with a total error of 0.01 ± 0.01 m related to the best coverage areas of the cave, where the image overlap is high [29]. Studies dealing with ice measurements in Dobšiná Ice Cave are listed in the following subchapter.

1.2. Study Area

Dobšiná Ice Cave is located in the southern part of the Slovenský raj (Slovak Paradise) National Park, on the right side of the Hnilec River valley, north of the town of Dobšiná (Rožňava district). The Slovenský raj represents a karst area, which occupies the north-eastern part of the Spiš-Gemer Karst in the northern part of the Slovenské rudohorie Mountains (Slovak Ore Mountains) (Figure 1).
Despite its altitude below 1000 m a.s.l., the newest measurements published to date have shown that the largest volume of cave ice in the world is found here [31]. However, it has been a target for many surveyors since it has been known. An overview of the ice measurements is provided in [31]. E. Ruffínyi, who first measured the cave, created the first map of the ice part of the cave and estimated its area to be 7171 m2 and the ice volume to 125,000 m3 in 1871 [32,33,34,35]. In 1950, A. Droppa estimated the ice area to be 11,200 m2, the average thickness of ice to be 13 m, and based on these data, the ice volume to be 145,000 m3 [36]. In 1986–1996, Ján Tulis and Ladislav Novotný carried out research on spatial changes of the ice fill by geodetic, geophysical, and photogrammetric methods. As a result of these works, the following morphometric data were estimated: The biggest thickness was in the Great Hall: 26.5 m, the area of ice: 9772 m2, and the volume of ice: 110,132 m3 [37,38]. In 2001, the georadar also identified the greatest ice thickness in the Great Hall during the biggest international professional event in glaciological research in Dobšiná Ice Cave [39]. In 2010, for better protection and safety of tourist paths through the Dobšiná Ice Cave, a Cooperation of the Slovak Caves Administration with the Institute of Geodesy, Cartography, and GIS at the Technical University of Košice, Faculty of Mining, Ecology, Process Control, and Geotechnology (further as fBERG) had started with the aim to do exact monitoring and digital modelling of ice mass balance using non-contact measurement technologies. TLS was carried out in the Small Hall and Great Hall of Dobšiná Ice Cave using a 3D scanner Leica ScanStation C10. To find out if the progressive method of TLS is suitable for an ice-filled environment, tacheometry using total station Leica Viva TS 15 (Leica Geosystems, Balgach, Heinrich-Wild-Strasse, Switzerland) with the reflection stick was also conducted. The study concluded that the ice floor is not an ideal object to measure by TLS because of its optical properties, but it is possible to include corrections to point clouds from TLS using the data from tacheometry, which were measured with better accuracy [40]. Since 2018, TLS using Leica ScanStation C10 (firstly) and Leica RTC360 (Leica Geosystems, Balgach, Heinrich-Wild-Strasse, Switzerland) (in later years), tacheometry in the Small and Great halls and Collapsed Dome (places with horizontal ice) and digital photogrammetry in the Ruffínyi’s corridor, ice tunnel, and Great curtain (places with the vertical ice masses) were conducted by the researchers from fBERG as a continual cooperation with Slovak Caves Administration, with the combination of geophysical method—ground penetrating radar used by researchers from Comenius University in Bratislava and Technical university Bratislava to find out the depth of ice. The mobile laser scanner GeoSlam Zeb Horizon (FARO Technologies, Inc., Lake Mary, FL, USA) was tested here by the Slovak Caves Administration in 2021 to find out if it is possible to capture ice fillings with this device. The results show that it can be conducted, but there is a need to keep in mind that the rays penetrate into clear ice in this cave up to a depth of about 10 cm [6]. The deepest penetration observed here was 12 cm under the real ice surface [41]. Accordingly, the Slovak Caves Administration started monitoring ice in the long term with this mobile 3D scanner. In 2023, cross-polarised photogrammetry, by which unwanted reflections could be filtered out, was proposed on the example of the Dobšiná Ice Cave by Bartoš [30]. Using this method, a compact, dense point cloud covering the shape of the tunnel without significant noise can be obtained.
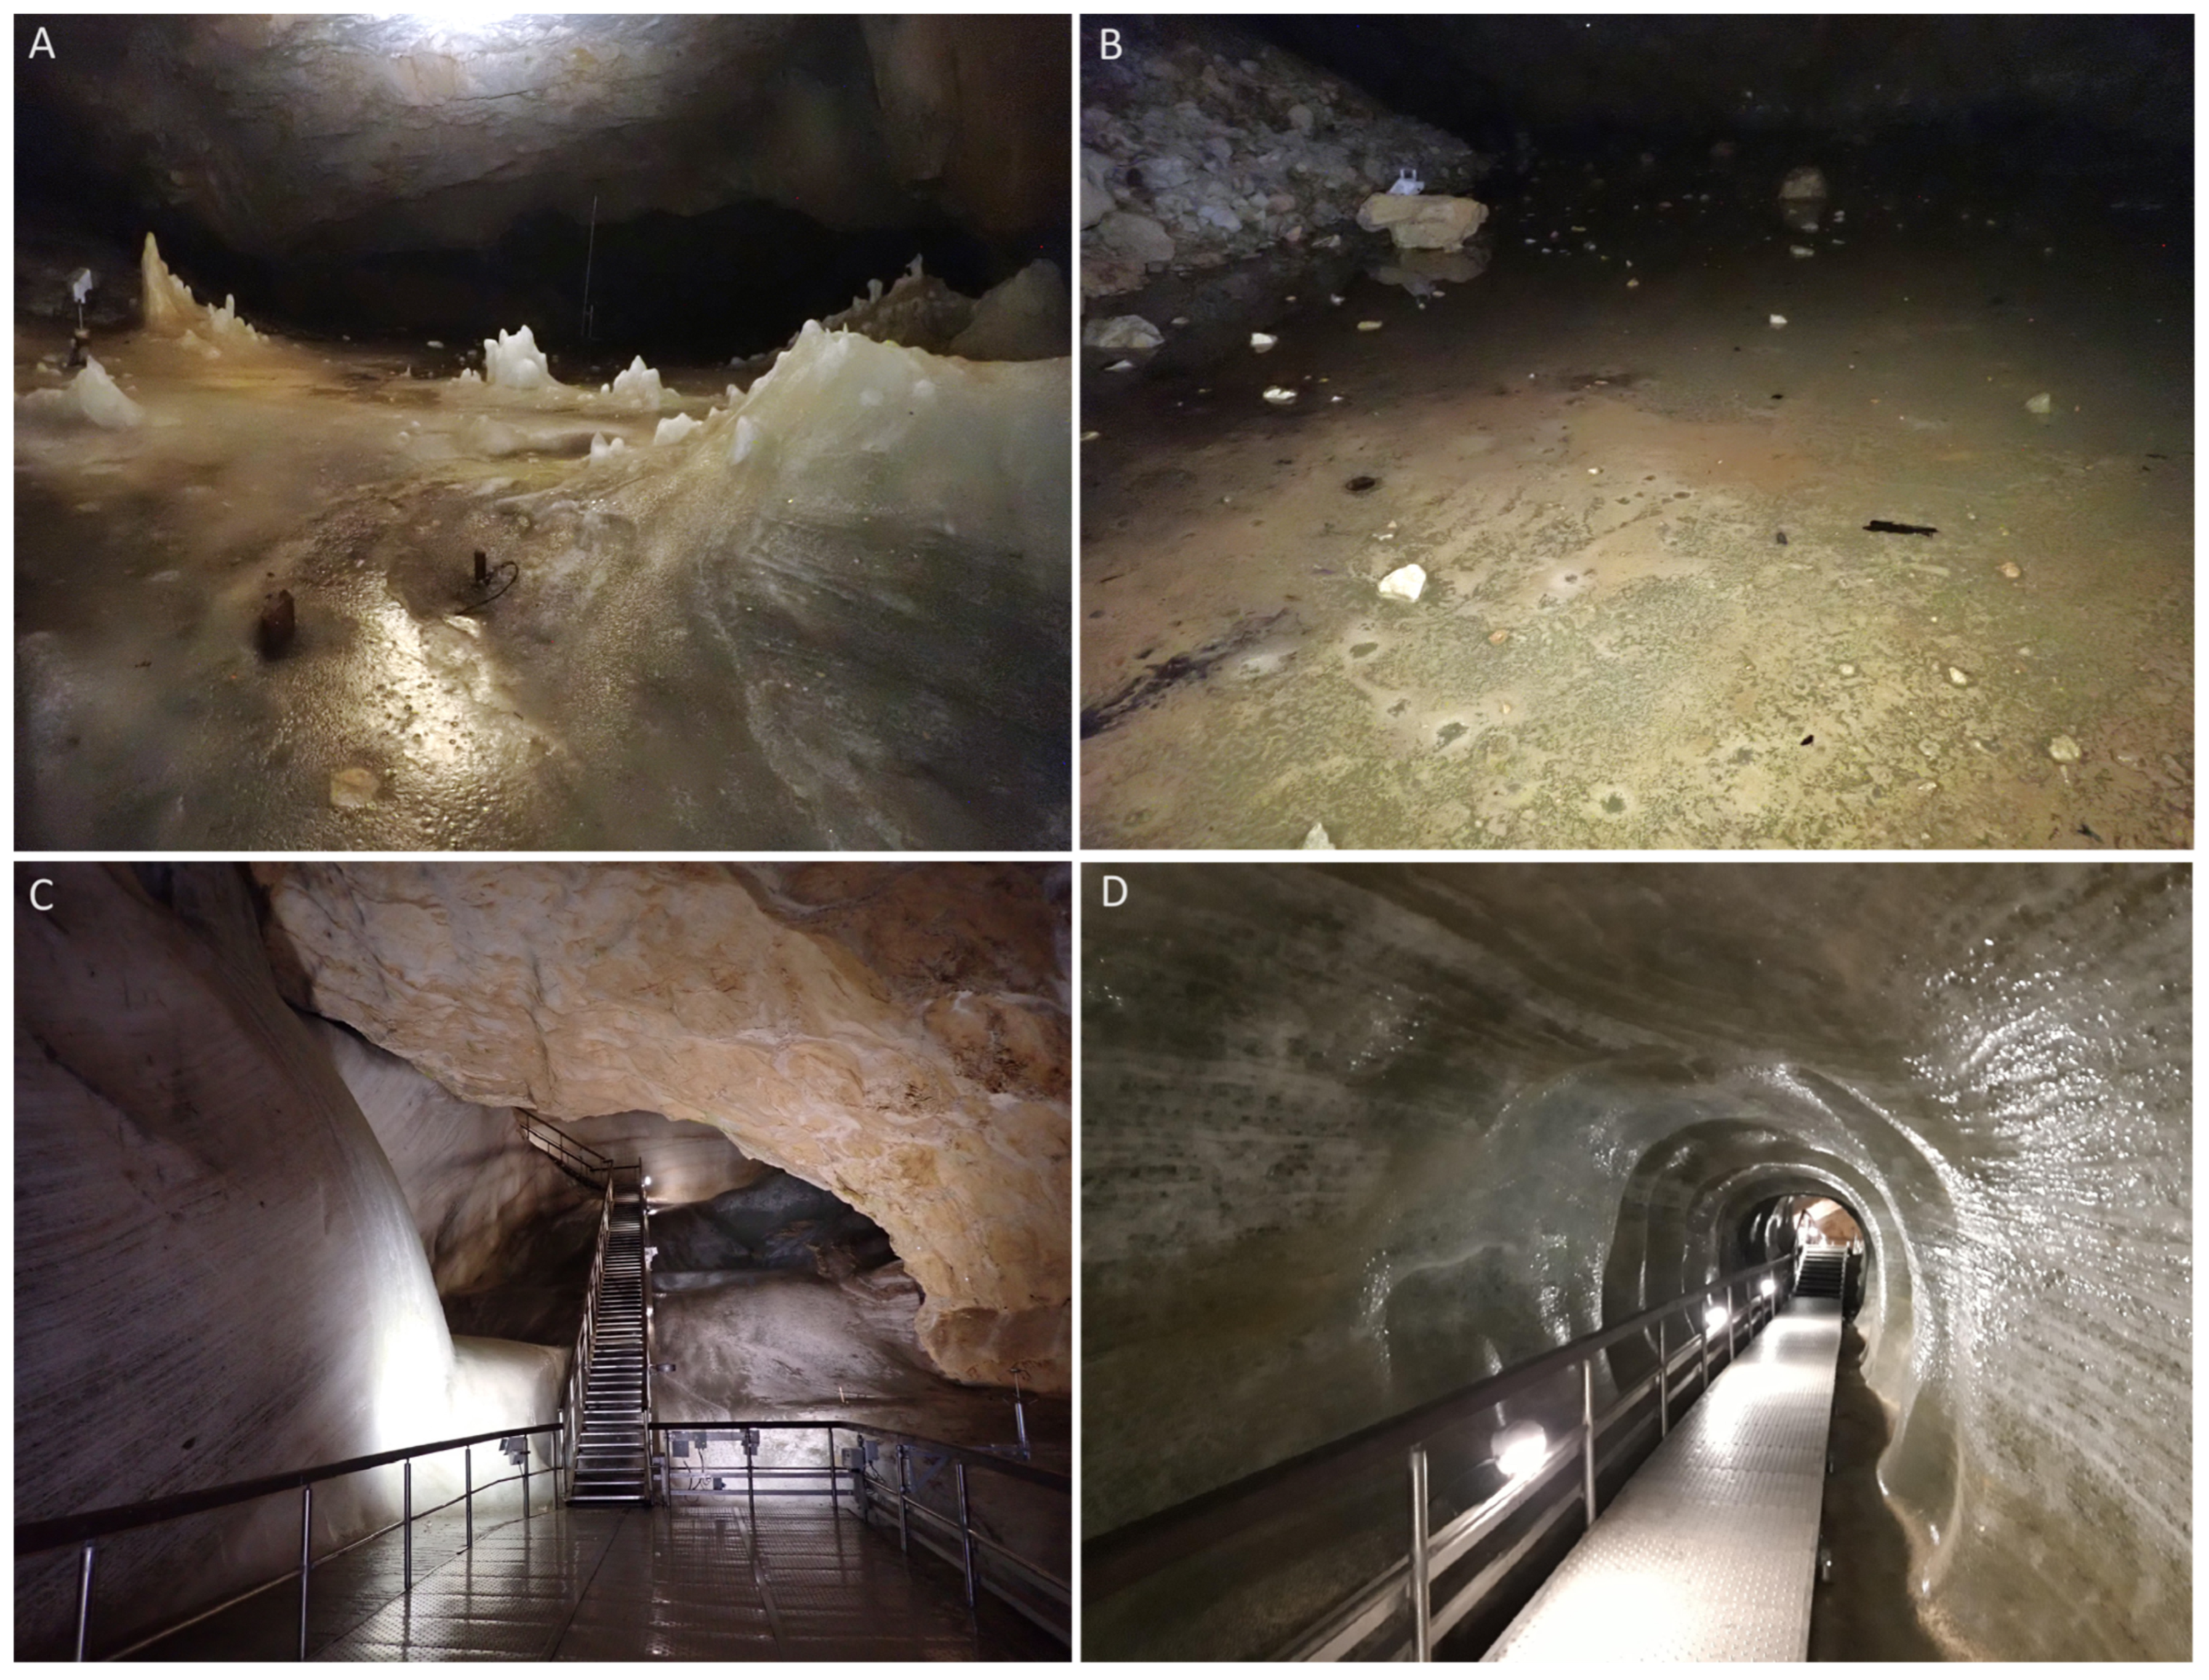
As we can see in these studies, the area and volume of ice differ when different measurement technologies are used. The precision and accuracy of non-contact measurement technologies are also dependent on the parameters of each device. Not all 3D scanners are suitable to capture smaller ice changes, and also some types of ice are harder to scan than others: “The ice mass in the Dobšiná Ice Cave is inhomogeneous and highly variable in terms of surface structure and texture, which is most evident between different parts of the cave, either in terms of horizontal or vertical position. In some parts, the ice layers just below/on the surface also contain other particles (dust, dusty wood, gravel), and the surface itself is thus dull with a variable texture (allowing for easier SfM photogrammetric processing), or there is no penetration of the laser beam below the surface (allowing for easier use of TLS). In some places, the ice itself has these properties, with ice crystals forming on the ice depending on the season and the conditions in the cave. In other places, however, the ice is clear, transparent, or with a smooth surface with no structure” [30]. Because of the international significance of Dobšiná Ice Cave, it is important to have proper data about the state, movement, or decrease of the ice in which various information about past environments can be preserved. To get more complex insights into 3D scanners which were used in the past and the present studies, three locations in the Dobšiná Ice Cave were chosen to catch the differences in point clouds according to different types of ice: First is the Small Hall (Figure 2A) and the Collapsed Dome (Figure 2B) with the large horizontal ice; the second, the Ruffínyi’s Corridor with the 10 m high vertical ice wall (Figure 2C); and the third is the most challenging, artificial ice tunnel (Figure 2D) with a length of 25 m and a diameter of about 2 m.

2. Materials and Methods

Thanks to the uniqueness of Dobšiná Ice Cave, which resulted in the continuous interest of researchers since its discovery, we can benefit from a relatively satisfying amount of data collected, especially from data acquired in recent years by modern non-contact measurement technologies. A complex and diverse database of point clouds allows us to compare the results of 3D scanning and the properties of the devices used.

2.1. Measurement Technologies

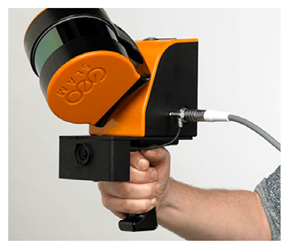
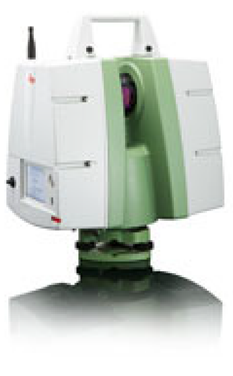
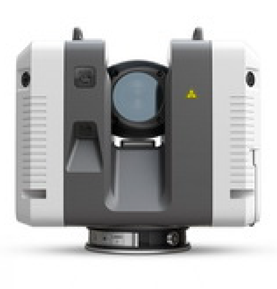
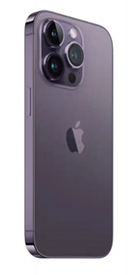
Slovak Caves Administration possesses mobile scanners GeoSlam Zeb Horizon and the iPhone 14 pro (Apple Inc., Cupertino, CA, USA) with built-in LiDAR sensors, which are compared to classical TLS-laser scanners used with tripods Leica ScanStation C10 and Leica RTC360 owned and operated by fBERG. Selected properties of the stated devices as described in the manufacturer’s datasheets (Zeb Horizon, Leica C10, and Leica RTC360) or articles (iPhone 14 Pro) are shown in Table 1.

2.2. Data Acquisition and Registration

Lacking noise and penetration in the point clouds, the tacheometry and the digital photogrammetry are considered more accurate, so the data acquired this way provide a reference base for comparison in registration errors, penetration, and noise. Tacheometry was conducted at places with lower slopes, mostly horizontal—Small Hall, Great Hall, and Collapsed Dome. For the places with vertical ice masses—Ruffínyi’s corridor and artificial ice tunnel, where the tacheometry is not possible, digital photogrammetry was used. Except for the scanning with the Leica C10 (which was carried out in 2018 and later replaced in spite of not satisfying results), all the other data were acquired in November of 2023 on the same date to have relevant comparable data with the same state of ice during the same microclimatic conditions. The measurement process was different for each device, so we describe it separately for each one below.
Geodetic network: The positional and height connection was made to the monumented points of the underground horizontal and vertical geodetic control in the national coordinate system Datum of Uniform Trigonometric Cadastral Network (S-JTSK) in the implementation of JTSK03 and in the Baltic Vertical Datum—After Adjustment (Bpv). The GNSS static method was used to determine 2 points of the oriented aligning base, approximately 1047 m apart, followed by the points of the surface and underground geodetic control in the cave monumented in the solid, unweathered parts of the rock ceiling of the cave with survey nails. The network was adjusted using indirect measurements, and the computation was carried out in the MatLab vR2011a environment [47]. The network as a whole in the 2D cartographic plane can be characterised by a mean positional error of 4.9 mm and a mean coordinate error of 3.5 mm. In the vertical adjustment, the mean error of the adjusted point heights took the value of 1.7 mm.
Electronic tacheometry: Tacheometry (or spatial polar method) is a geodetic method of detailed measurement in which the position of detailed points is determined by measuring the oblique distance, the horizontal angle, and the elevation or zenithal angle. When using a total station, we can talk about electronic tacheometry. The tacheometric survey in the cave was performed with total stations Leica TS15 and TS50 using a corresponding surveying prism (for more details, see [48]). The spatial connection was realised to survey points of the geodetic network within the cave. The accuracy of the polar method can be characterised by the mean positional error mp for a horizontal component and the mean error derived for trigonometrical measurement of heights mh for a vertical component. Then the overall accuracy can be determined as a priori mean error of measurement for the furthest measured point from the survey station. In this case, assuming mean errors of observed values, the longest measured distance of 30 m, and the highest zenithal distance of 120 gons, mean errors of electronic tacheometry are defined as mp ≤ 2 mm and mh = ≤ 1.5 mm.
Reflecting these mean errors, we can consider the tacheometry as the most accurate, so the measured data can be used as the reference for further analysis and comparison with other technologies. However, the density of the acquired data is significantly lower than from point clouds acquired from TLS. Accordingly, the mesh was created first to fill the gaps between points and then subsampled with high density to have the same data format for the following comparison.
Digital photogrammetry: For places where it was not possible to use tacheometry (vertical, or highly sloping ice surfaces), a digital close-range photogrammetry—Structure-from-Motion (SfM) method was applied. SfM photogrammetry, originating from computer vision and visual perception, can be considered as one of the most advanced techniques in photogrammetry including image matching, bundle adjustment, and reconstruction of the scene. Its principle lies in estimating a 3D structure of objects or surfaces from 2D digital image sequences acquired by a moving camera. For more details about the photogrammetric survey and related issues in Dobšiná Ice Cave, see [30,48].
All images for photogrammetry were obtained by a DSLR Pentax K-5 (RICOH Imaging Company, Ltd., Tokyo, Japan), with the lens Pentax SMC DA 15 mm f/4 ED AL Limited (RICOH Imaging Company, Ltd., Tokyo, Japan), and subsequently processed in Agisoft Metashape® Professional Edition, Version 1.6.0 software (Agisoft LLC, St. Petersburg, Russia, 2019).
Generally, three places in the cave were surveyed by photogrammetry with an average imaging distance of 1–3 m, a number of used images 42–150 m, and a ground sampling distance of 0.5–1.0 mm/pix. The accuracy of the final data after processing, i.e., dense point cloud, achieved the reprojection error of 0.5 pix and accuracy in the reference system of 1–5 mm (depending on the location). For more details, see [48].
Reflecting these values, we can consider the SfM photogrammetry as a complementary reference method to the tacheometry.
Leica C10: Laser scanning using the Leica ScanStation C10 scanner was realised in 2018, with a density of 2 × 2 cm at a distance of 30 m, resulting in more than 85 million points from 30 scanning stations. Data processing, editing, and point cloud export were performed using Leica Cyclone 7.3 software. The overall spatial error of registration over 30 scanning stations was 6 mm. Using this data, we were able to obtain a complete point cloud for the whole cave and, thus, also a 3D model of the glaciated part of the cave. Due to the penetration of the laser beam below the ice surface, not all parts of the point cloud from the Leica C10 scanner are suitable for further analysis. Such data could be used for the overall visualisation of the cave area or for a more detailed analysis of selected parts, taking into account the penetration of the laser beam under the ice [48].
Leica RTC 360: A medium resolution was chosen for scanning in a cave environment, i.e., the scan resolution of 6 mm at 10 m with a maximum range of 130 m. Due to the cold temperatures, acclimatisation of approximately 20 min was performed. Leica RTC360 is equipped with VIS technology with a repetitive application of resection and forward-intersection with an optional bundle adjustment at the very end (Visual Simultaneous Localisation and Mapping (SLAM) technology), which provides point cloud registration based on integrated cameras. In a continuous process, the SLAM algorithm computes the 3D coordinates (mapping) of the tracked features from two or more positions and uses these coordinates for the determination of the following position (localisation) [49]. Scanning stations were chosen to capture as much overlap as possible between them, with a total of 70 stations for the whole cave. The distances between each station were 5–10 m depending on the surrounding cave walls and ceiling, tourist path platforms and staircases, etc. The entire scanning process took about 5 h. Data processing, editing, and point cloud export were performed using Cyclone Register 360 v2022.0 software, with the overall cloud-to-cloud registration error of 3 mm and the mean error of targets used for georeferencing of 4 mm.
GeoSLAM Zeb Horizon: Scanning by walking using a SLAM algorithm is, from the caver’s point of view, the best choice considering its bearable weight with all its components carried in the small backpack and range, which allows to scan great domes but also walk and scan easily through smaller corridors. The whole glaciated part of the Dobšiná Ice Cave was captured by 2 approximately 20-minute-long scanning missions resulting in two-point clouds. For more accurate results, we do not rely just on the SLAM algorithm; instead, a reference point is created by keeping the scanner still on monumented geodetic points on stable cave walls for 10 s. At least three of them (in each scan) are then used for georeferencing in Cloud Compare v2.13 [50] software. Georeferencing can also be performed in GeoSlam HUB v6.2.1, but the only possible export is laz., so information about normals (orientation of points) is lost. The existing points of our geodetic network in this cave were not established, at that time, for the needs of mobile scanners, which are held in the hands of a surveyor while walking; so many points are unreachable this way. Accordingly, new points were measured and monumented to be reached from the planned scanning trajectory. For the SLAM algorithm, it is appropriate to start and end at the same point to enclose the global SLAM and to walk in smaller rounded paths everywhere it is possible to create the local SLAMs too. For this, the occurrence and nature of the ice almost everywhere along the tourist path is a limitation.
iPhone 14 Pro: Generally, LiDAR companies use EELs (Edge-Emitting Lasers) or fibre lasers. The iPhone LiDAR uses Photon-Counting detectors (also known as SPADs—Single Photon Avalanche Photodiodes) and Vertical Cavity Surface-Emitting Lasers (also known as VCSELs) [42]. There are no datasheets of the iPhone’s lidar available, just a note that the iPhone 14 Pro has one, so it is not easy to access reliable information about it, and still, some places in Table 1 are empty because of that. However, working with an iPhone is simple, and the mobile application PolyCam [51] is user-friendly. The dimension and weight of a classic mobile phone are a real advantage in a cave environment, especially in the smaller passages. Scanning a place like an average room takes just a few (up to 10) minutes and just a few more for immediate (offline) processing in the above-mentioned app. The display of the phone intuitively navigates a person through a real-time view, showing places that have not yet been captured in a different colour. A surveyor can choose what formats will be exported in the pro (paid) version. Textured point clouds allowed the identification of black and white paper targets in A4 format easily on the ice walls, which were measured by the total station Leica TS15. The a priori mean error of measurement for these targets was defined as the mean positional error mp ≤ 1.4 mm and mean vertical error mh ≤ 1.4 mm. These points were used for georeferencing in the Cloud Compare software accordingly.

2.3. Data Comparison

Cloud Compare [50] software was used to compare all acquired point clouds. After different processes of registration of point clouds from all the devices, the steps given below were followed:
1.
C2C distance:
 
After georeferencing point clouds, Cloud to Cloud (C2C) distance to a reference base (point cloud from tacheometry or photogrammetry) provided us with information about possible position errors at a mesoscale (e.g., a hall, a corridor, and a tunnel).
2.
Fine C2C registration:
 
As each georeferenced point cloud had a different registration error with no perfect match in a geographical space, the clouds were hard to compare. For better results, fine C2C registration was applied to each locality, which we wanted to compare. The reference base for the registration was the cloud from the photogrammetry or the tacheometry. This step was not applied to Leica C10’s cloud, as the resulting information would be meaningless based on recent ice changes.
3.
Cross-sections selection:
 
To find information about diverse types of ice, or its layers, roughness maps were created. Although the places with higher curvature could also be seen on these maps, higher roughness values navigated us to noisy parts or places with higher penetration and more outliers, too. Also, as the point clouds from the scanners on tripods have a higher density around the scanning positions, we tried to choose the localities of the cross-sections near those positions.
4.
Comparison of noise and penetration on cross-section:
 
Leica RTC360 automatically filters multiple reflections while scanning, so the “raw” data are almost free of outliers, and the noise is lowered too. Scanning with the iPhone is based on LiDAR, but the first result is not the point cloud; it is an automatically processed mesh created from the scanned data, and the point cloud can only be extracted from the mesh in the following step. So, we do not have true information about penetration or noise because it was lost in such a process, and the extracted point cloud is thin and clean (except for some artefacts). In fact, if we do not count Leica C10, the point cloud from the Zeb Horizon is the only one that needs filtration in post-processing. Accordingly, we provide both results reached with Zeb Horizon: the first without the noise filtration—to save the information about how much or whether any such work is needed and the second with the filtration—to have more comparable data. In each case, data from all the devices were exported without any additional simplification. On the cross-sections, the places with maximal noise and laser penetration values were identified visually.
5.
C2C distances between the cross-sections:
 
C2C distances were computed again (this time after fine C2C registration) to quantify possible offset, shift, or deformation on the cross-section. Distances were not computed for the Leica C10, as they could refer to a loss of ice. In this case, C2C distances on the cross-sections of Zeb Horizon’s cloud are provided just after filtration, as the values could be distorted by the higher thickness of the cloud.
All the steps were applied at each of the three localities with all the cross-sections.

3. Results

Scanning in Dobšiná Ice Cave was not performed with the purpose of comparing the data, but comparison was made as a result of a diverse database of acquired data in the same space and from the different devices that have been used recently, so, considering the needs of each measurement technology, the process of acquiring the data was not the same (different location and number of positions, duration, registration, post-processing). Also, as the data acquired with Leica C10 are from another year (October 2018) with different states of ice and conditions in general, we provide information that is relevant to compare, like noise, density, registration error, and duration. All the other datasets that were used for the following comparison were acquired in November of 2023 during the same 2-day scanning session and thus could be compared to a reference base also in additional criteria such as C2C distance, fine C2C registration, depth of laser penetration, and C2C distance after fine C2C registration.

3.1. Horizontal Ice

Results from TLS with Leica C10, Leica RTC360, and GeoSLAM Zeb Horizon were compared here with the data from tacheometry (see Figure 3, Figure 4, Figure 5 and Figure 6) at two cross-sections: CS-A in the Small Hall and CS-B in the Collapsed Dome. The iPhone 14 Pro was not used here in spite of its short range, which makes scanning time unusable on such a large area of ice.
Figure 3. Side view of the result of 3D scanning in the Small Hall with Leica RTC 360, Leica C10, GeoSLAM Zeb Horizon, and the reference base from the tacheometry.
Remotesensing 16 03870 g003
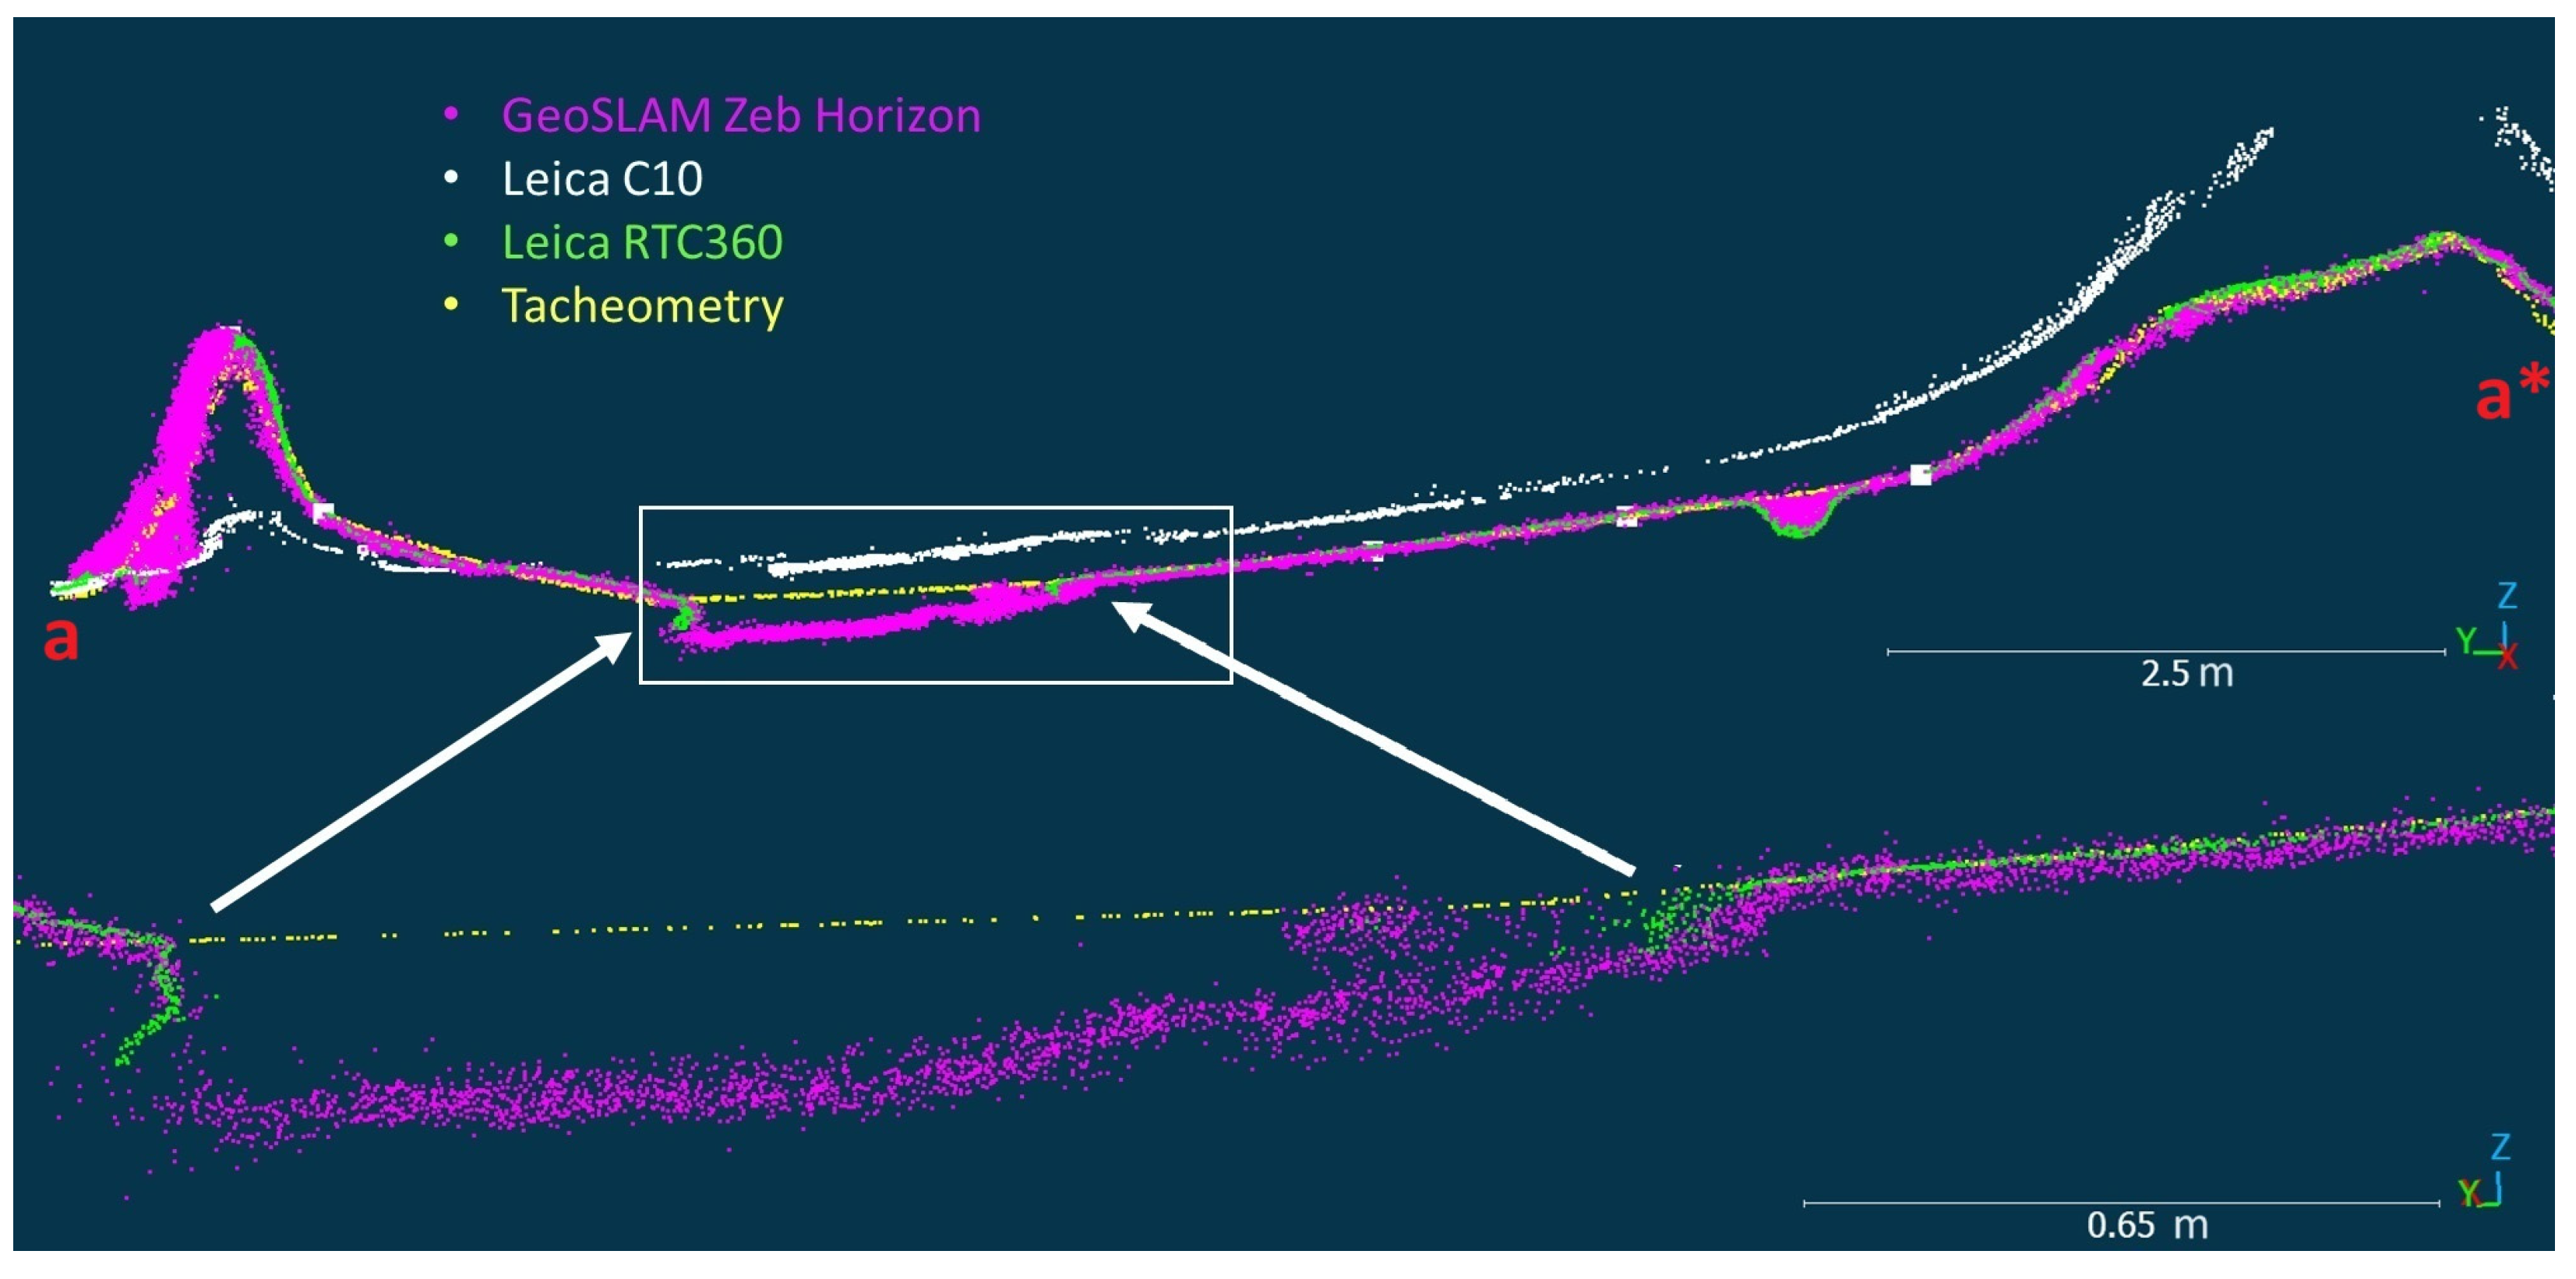
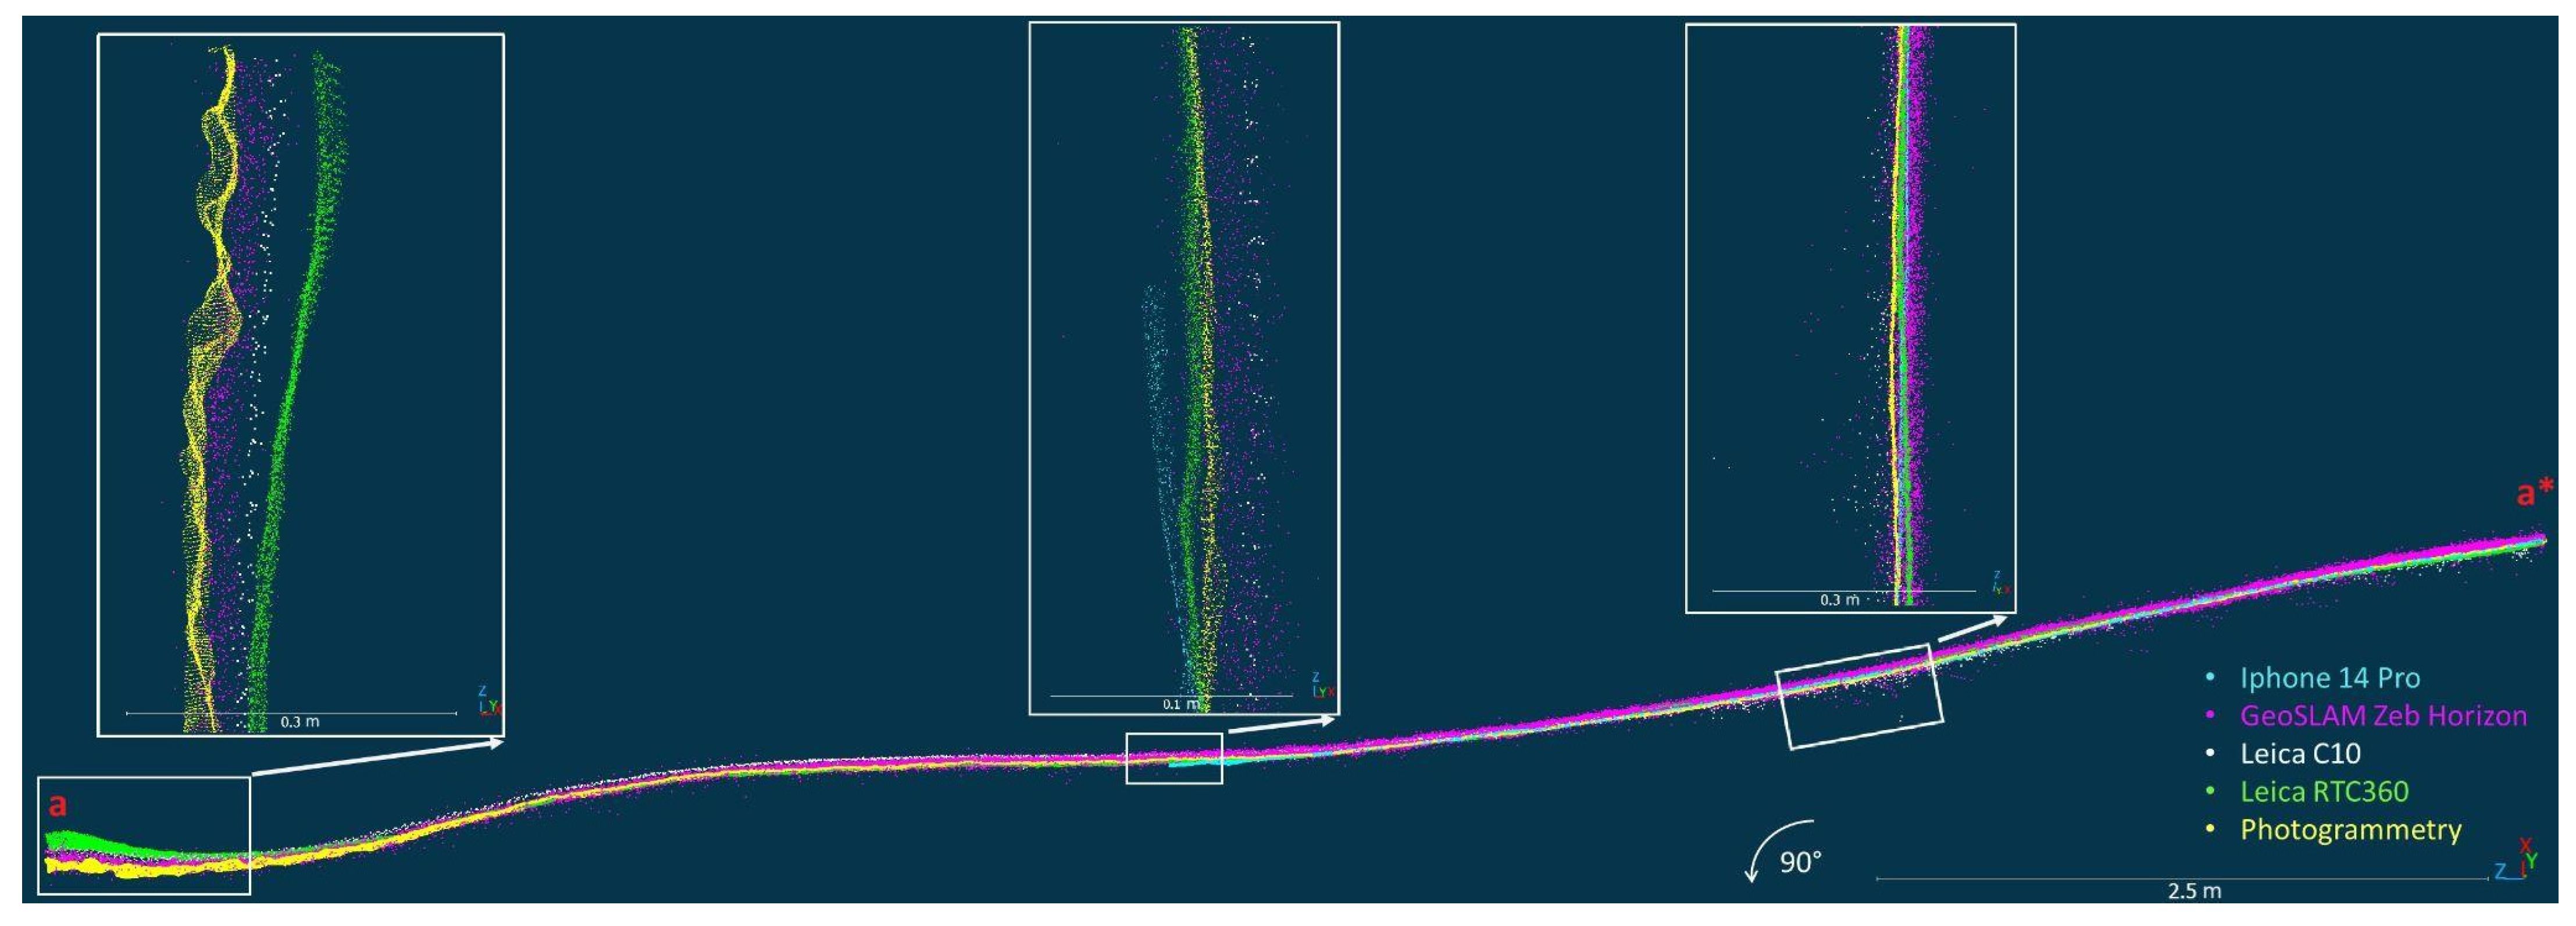
In Figure 3, we can see artificial surfaces beneath the real ice surface or some penetrated isolated points, mostly in C10’s and Horizon’s clouds. Ice in this part of the cave is the uppermost, including the newest ice layers, and the ice surface has properties similar to those of the whole hall; thus, the roughness maps did not show any interesting places to focus on. The cross-section A was therefore placed between two icy stalagmites, and shallow water-filled depressions between them were also recorded to compare various surfaces and morphologies (Figure 4).
Figure 4. Top-front view of the result of 3D scanning in the Small Hall with the GeoSLAM Zeb Horizon with placed line a–a* of CS-A.
Remotesensing 16 03870 g004
In Figure 5, we can see that the clouds fit the tacheometry well. Leica RTC’s cloud is missing in the depression filled with water while the Zeb Horizon catches the ice surface below the water but with obviously higher noise. As can be seen in Table 2, the smallest density of points has Leica C10, but it can be partly related to fewer scanning positions and the smallest thickness (5 cm) of a cloud. In this criterion, the Leica RTC is just 2 cm behind, and the Zeb Horizons cloud has the highest noise—up to 17 cm. However, this value is related to a place where Leica RTC has no points at all because of the presence of the water, but the noise is obviously higher with Zeb Horizon also in other parts of the cloud. It may look like the clouds are thicker on the stalagmites in the cross-section, but that is because of the width and the path of the section—to catch more original points from tacheometry for comparison, and the noise is not higher here, actually.
Figure 5. CS-A located in the Small Hall (upper) with a detailed view of the water-filled depression and its surroundings.
Remotesensing 16 03870 g005
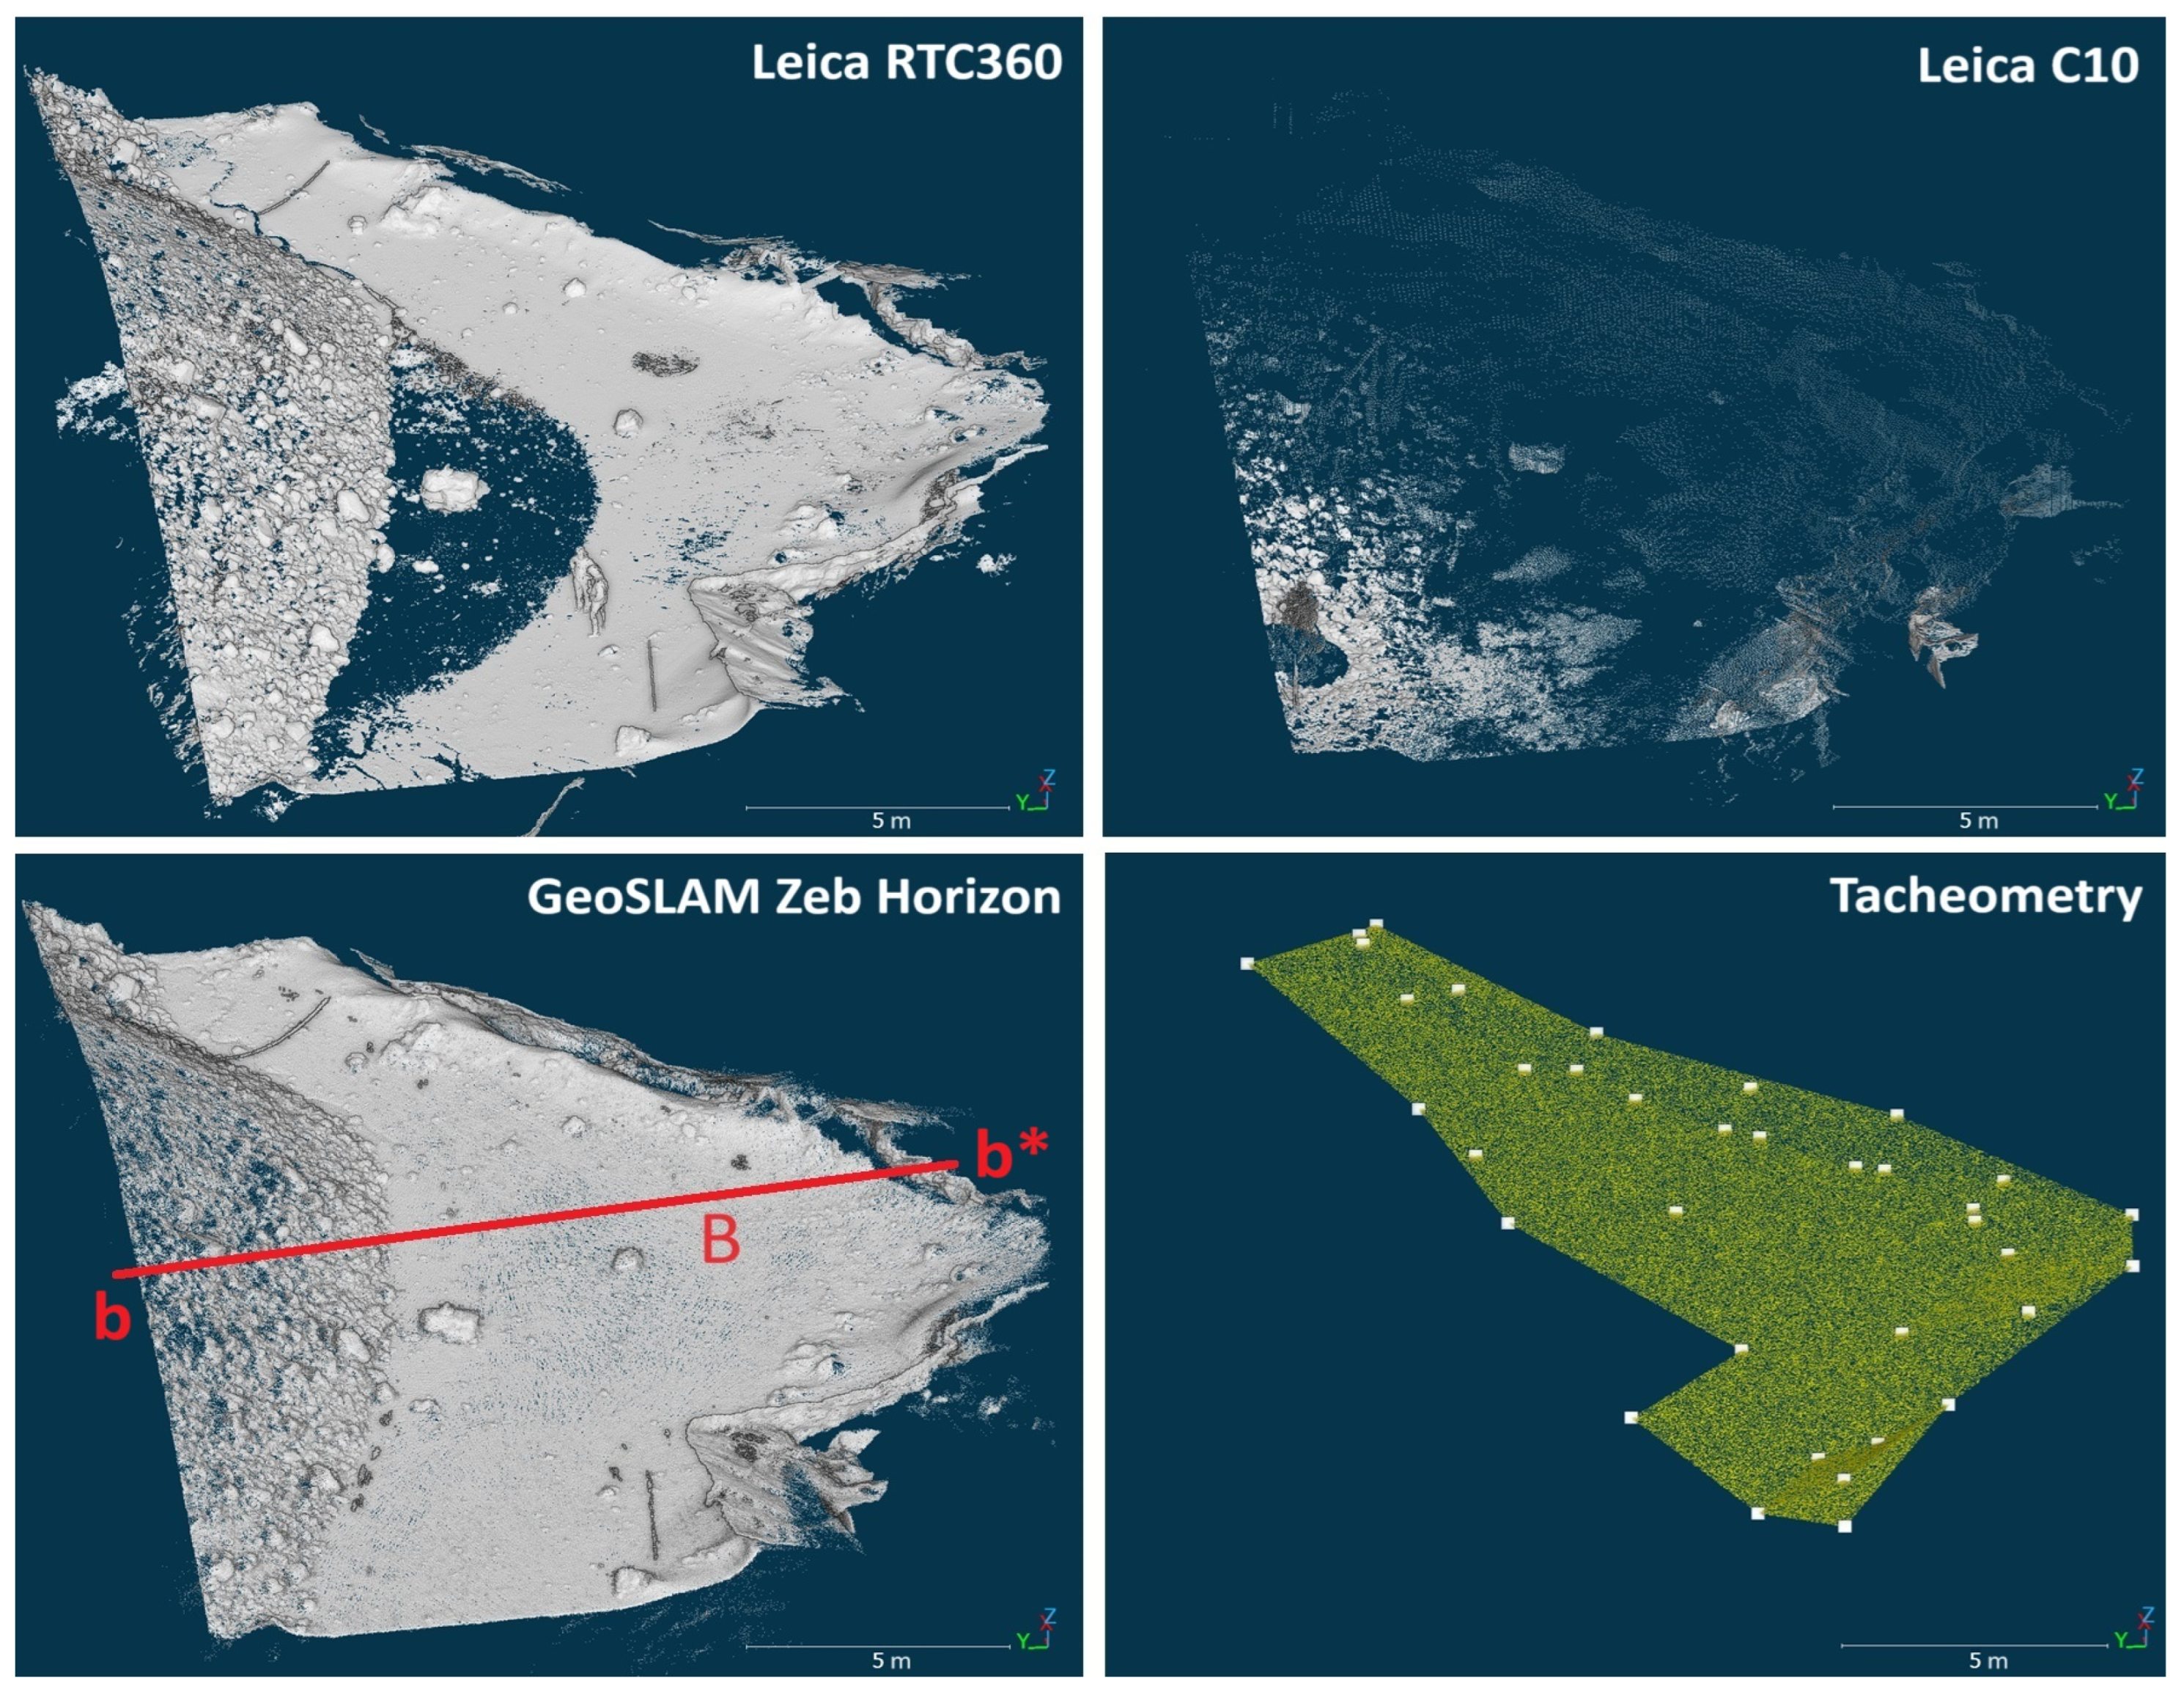
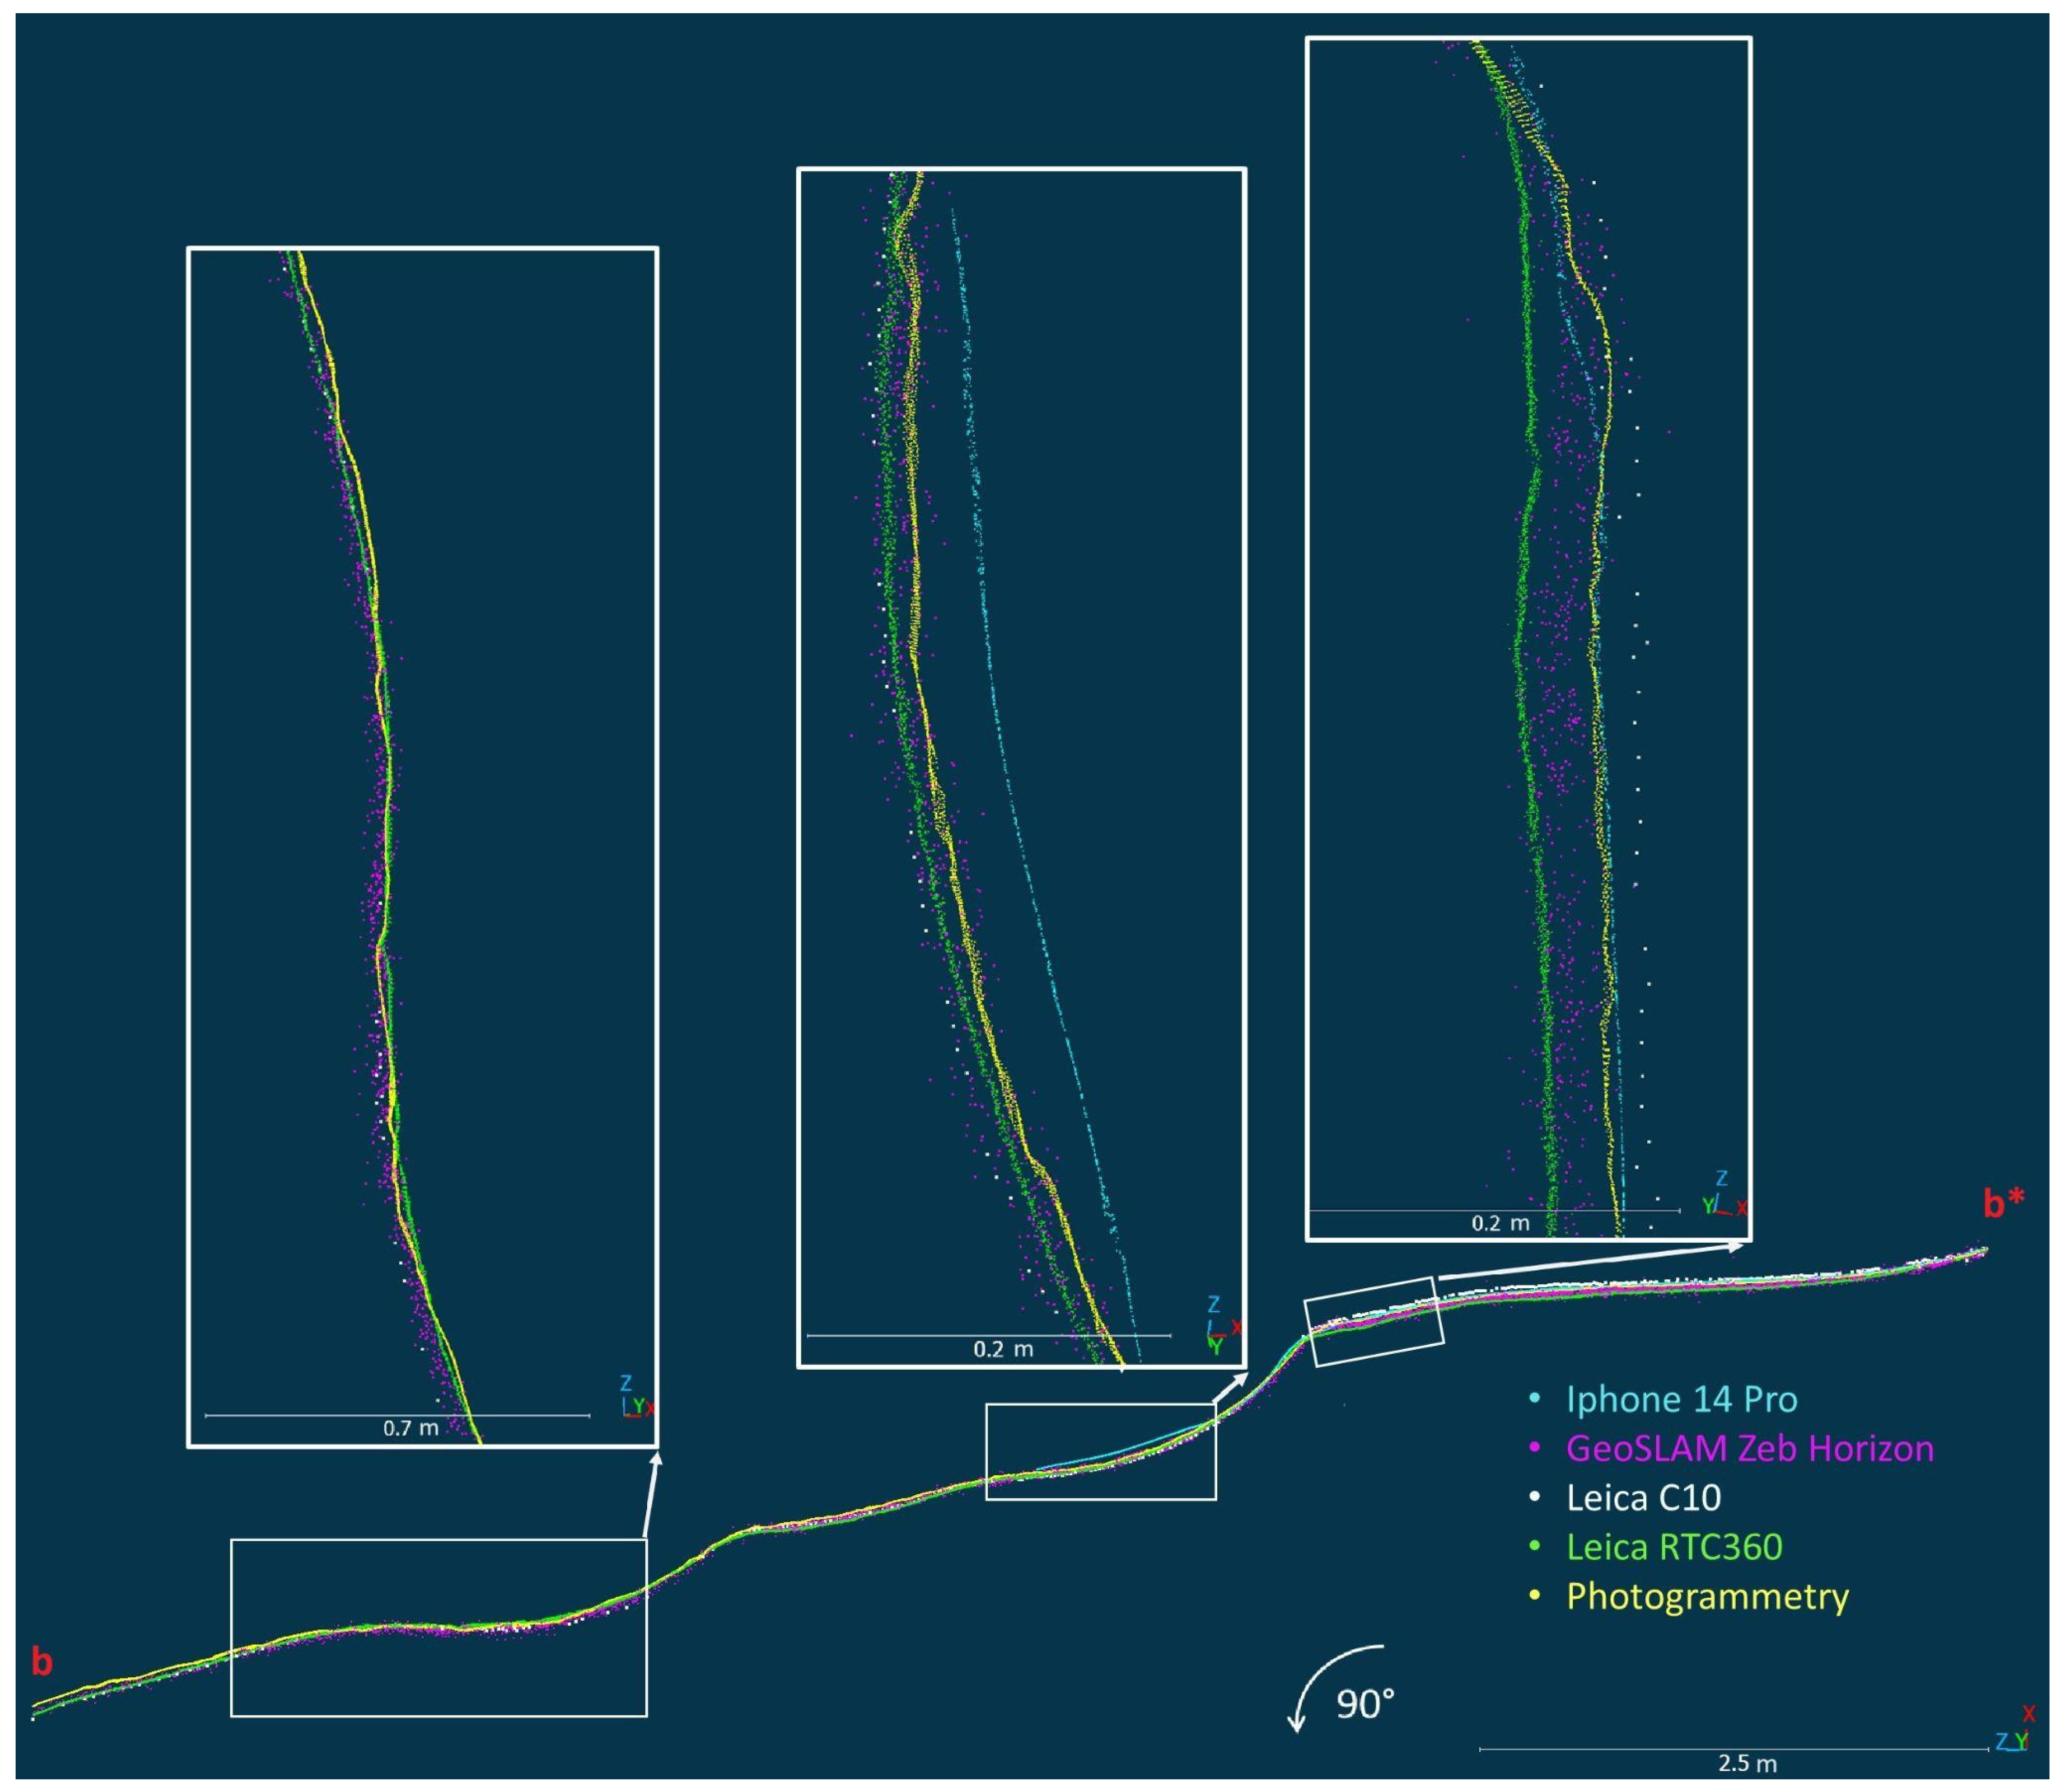
In the Collapsed Dome, even at first sight, a big hole in the cloud of Leica RTC is visible (Figure 6), which refers to water up to 5 cm deep covering the ice. On the other hand, the Zeb Horizon’s cloud is continuous without any markable error, maybe to mention higher noise in comparison with the RTC360, which has a really smooth cloud. Leica C10’s cloud obviously has a lower density, too, but to be objective, the scanning position was just one on the side of this dome.
Figure 6. Top-front view of results of 3D scanning in the Collapsed Dome with Leica RTC360, Leica C10, GeoSLAM Zeb Horizon with the placed line b–b* of CS-B, and the reference base from the tacheometry.
Remotesensing 16 03870 g006
On cross-section B (Figure 7), the mirror effect can be noticed on the sides of the section, where the ice or water meets the rock accumulation or wall, and the reflections are incorrect on all of the scanners. But the Zeb Horizon dealt with them a little better here, as the real surface could be seen clearly, and the point cloud was gapless. On the cloud of Leica RTC, it would be harder to distinguish whether the mirror surface is real or artificial, if other clouds would not be available.
The thickness of the cloud (see Table 2) is the smallest with Leica C10, which is free of any noise, then Leica RTC360, which is thick just 1 cm and the highest values were reached with Zeb Horizon—up to 9 cm without and up to 6 cm with filtration. In Figure 7, we can also see that the penetration is lower with Leica RTC360 than with Zeb Horizon. We do not have a reference base to find out the penetration of Leica C10’s laser. The cloud provides us with information about the state of ice from 4 years ago, based on which we can also detect some small gaps, assuming the water was there covering the ice too.
As expected, the registration error is the smallest (up to 6 mm) using 3D scanners on tripods—Leica C10 and Leica RTC360. Density at a cross-section is lowest in all cases with the Leica C10. The highest number of points at the cross-section is the Zeb Horizon, which is obviously the result of higher noise. Then, with very good results considering density versus the thickness of the cloud, the RTC follows. Cloud-to-cloud values were calculated after the filtration in the case of Zeb Horizon, as the noisy cloud provided us with lower and better but misleading values. Although differences in comparison with RTC are very small, both devices could catch geometries without any bigger errors or deformations.

3.2. Vertical Ice

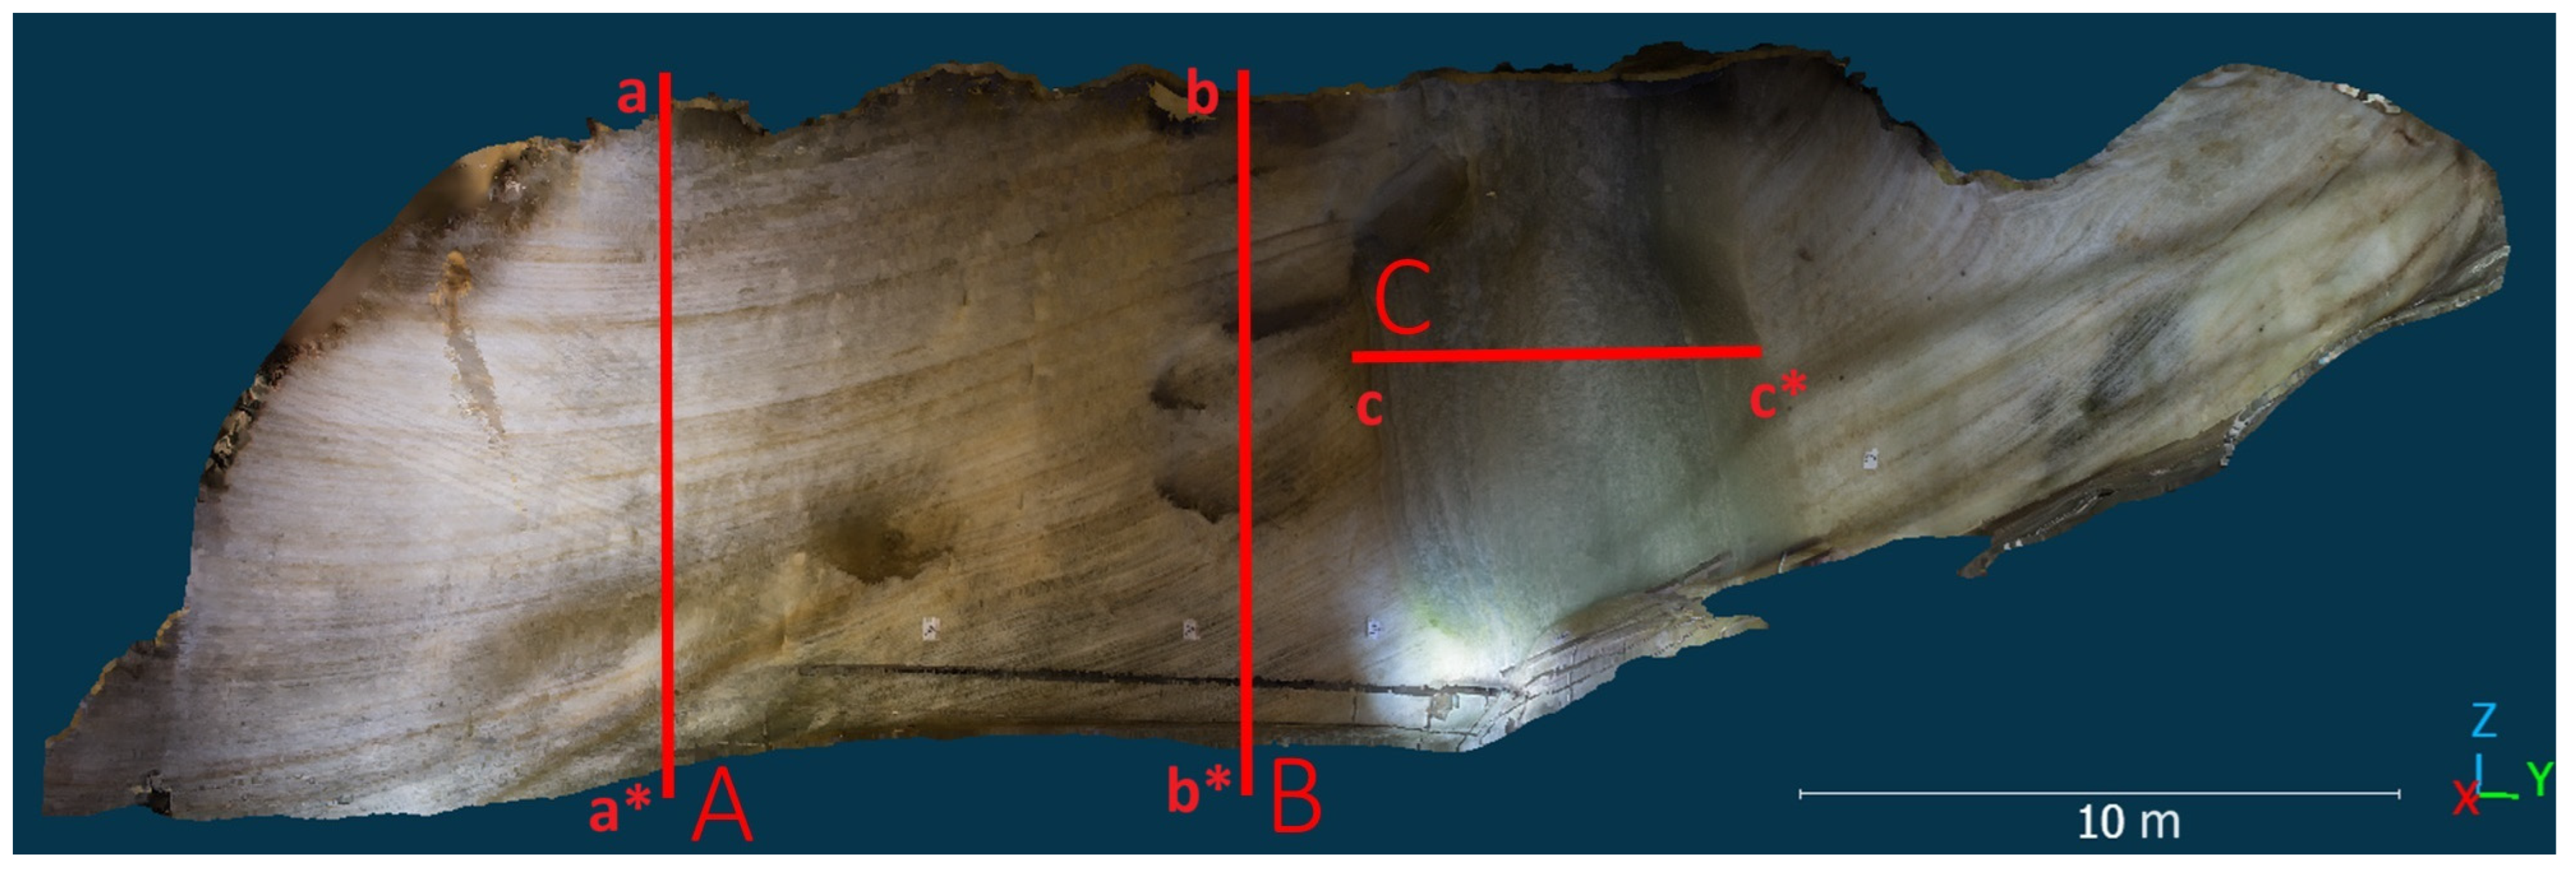
For a comparison with reference base from photogrammetry, in the Ruffínyi’s Corridor, where the vertical and layered ice wall around 10 m high occurs, three places for cross-sections were chosen (Figure 8) based on the roughness maps of the point clouds (Figure 9) and different morphologies and properties of the ice.
The first (A) is vertical and represents the ice with more layers and different properties, but it lacks any significant morphologies. In the second section (B), which is also vertical and layered, some concave forms occur, and the third (C) is focused on the younger type of ice with layer properties changing in a horizontal way, so it is more illustrative to have cross-section oriented perpendicularly to layering. The result of the comparison is given in Table 3.
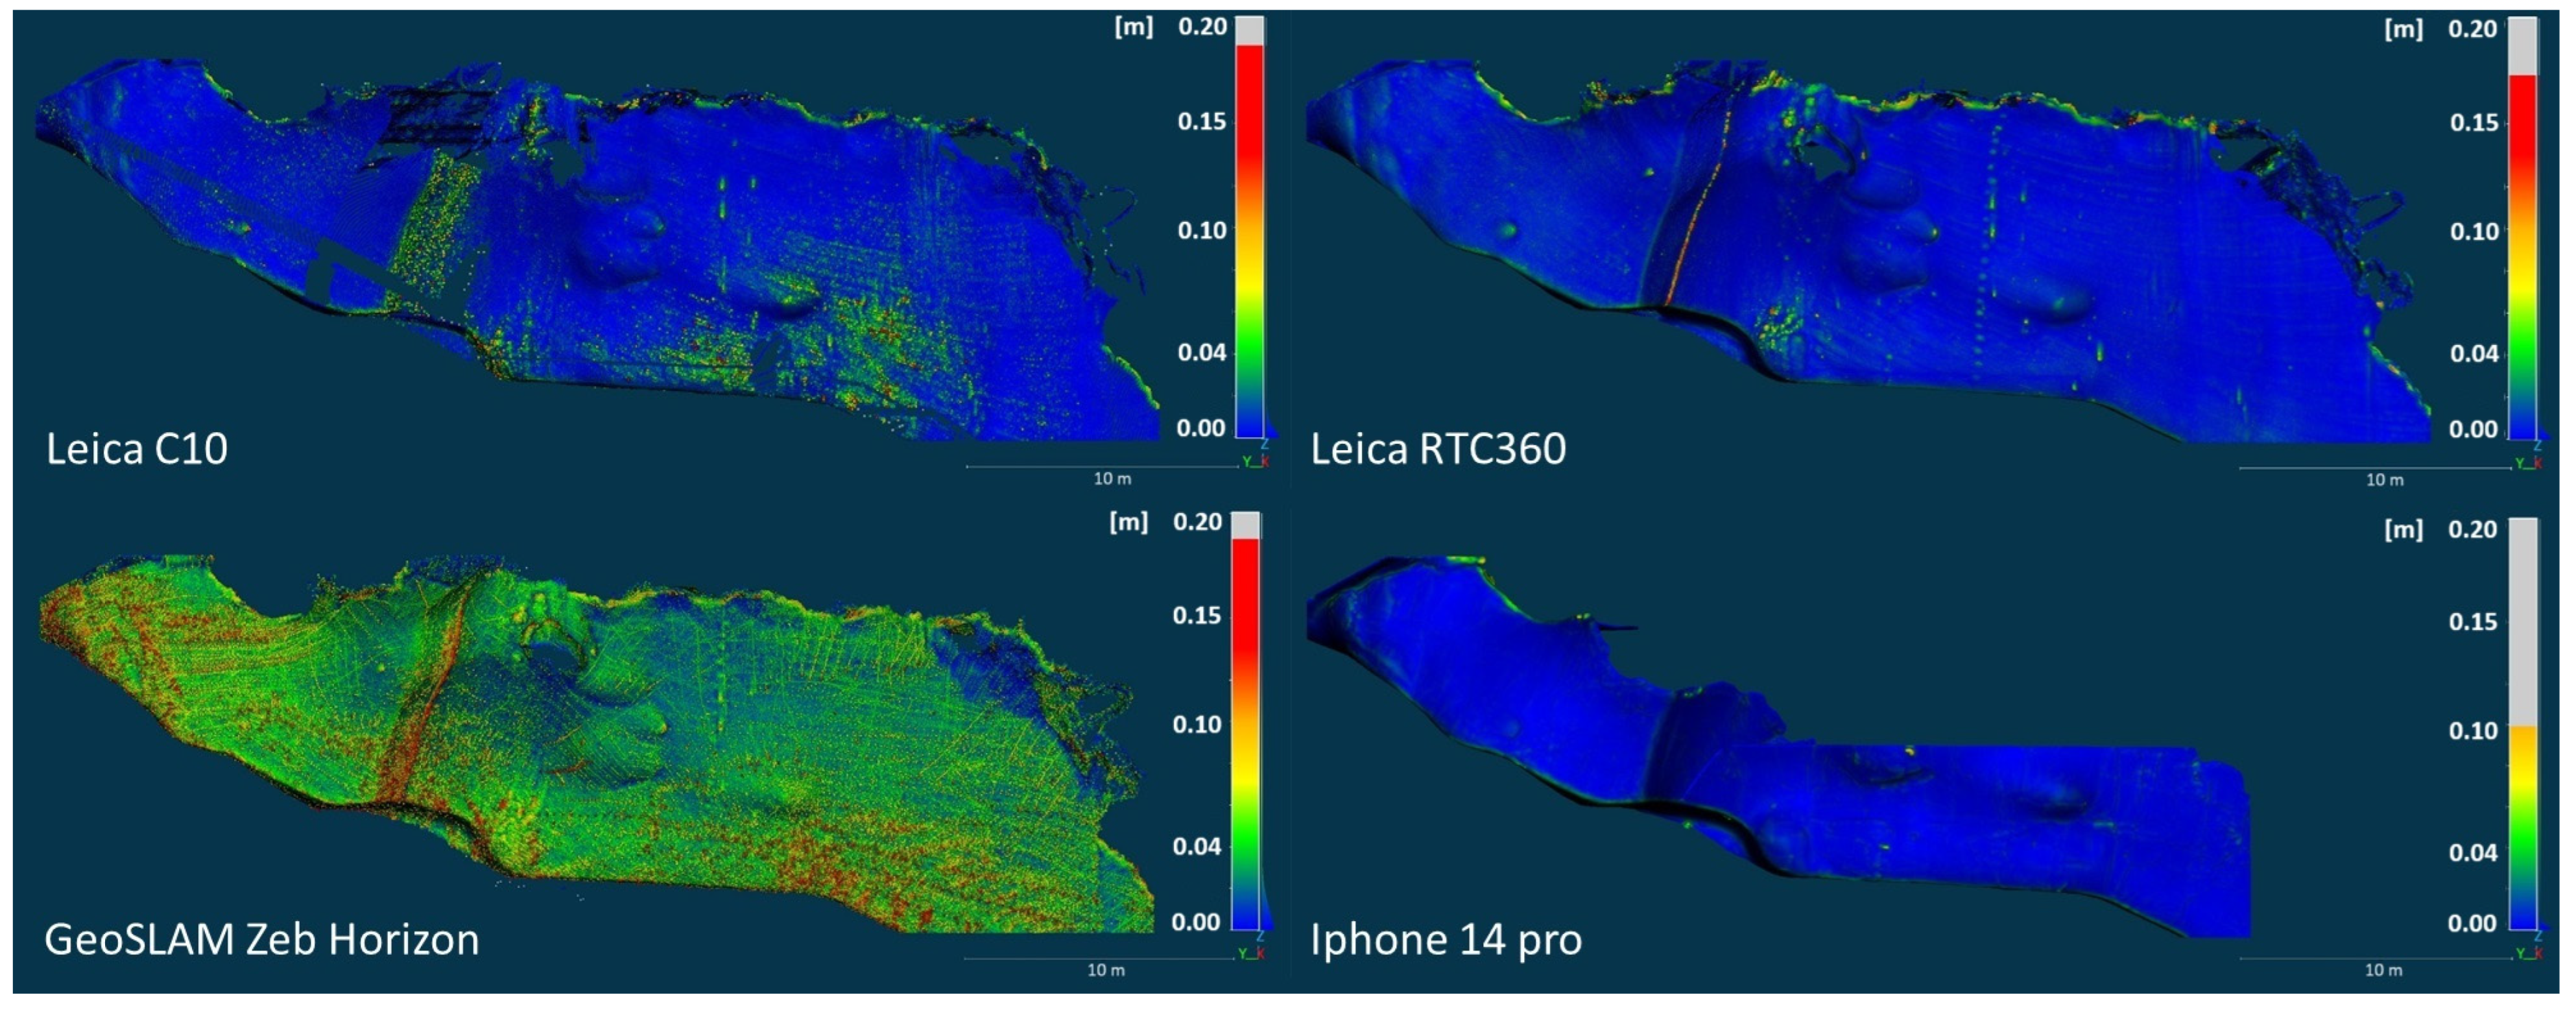
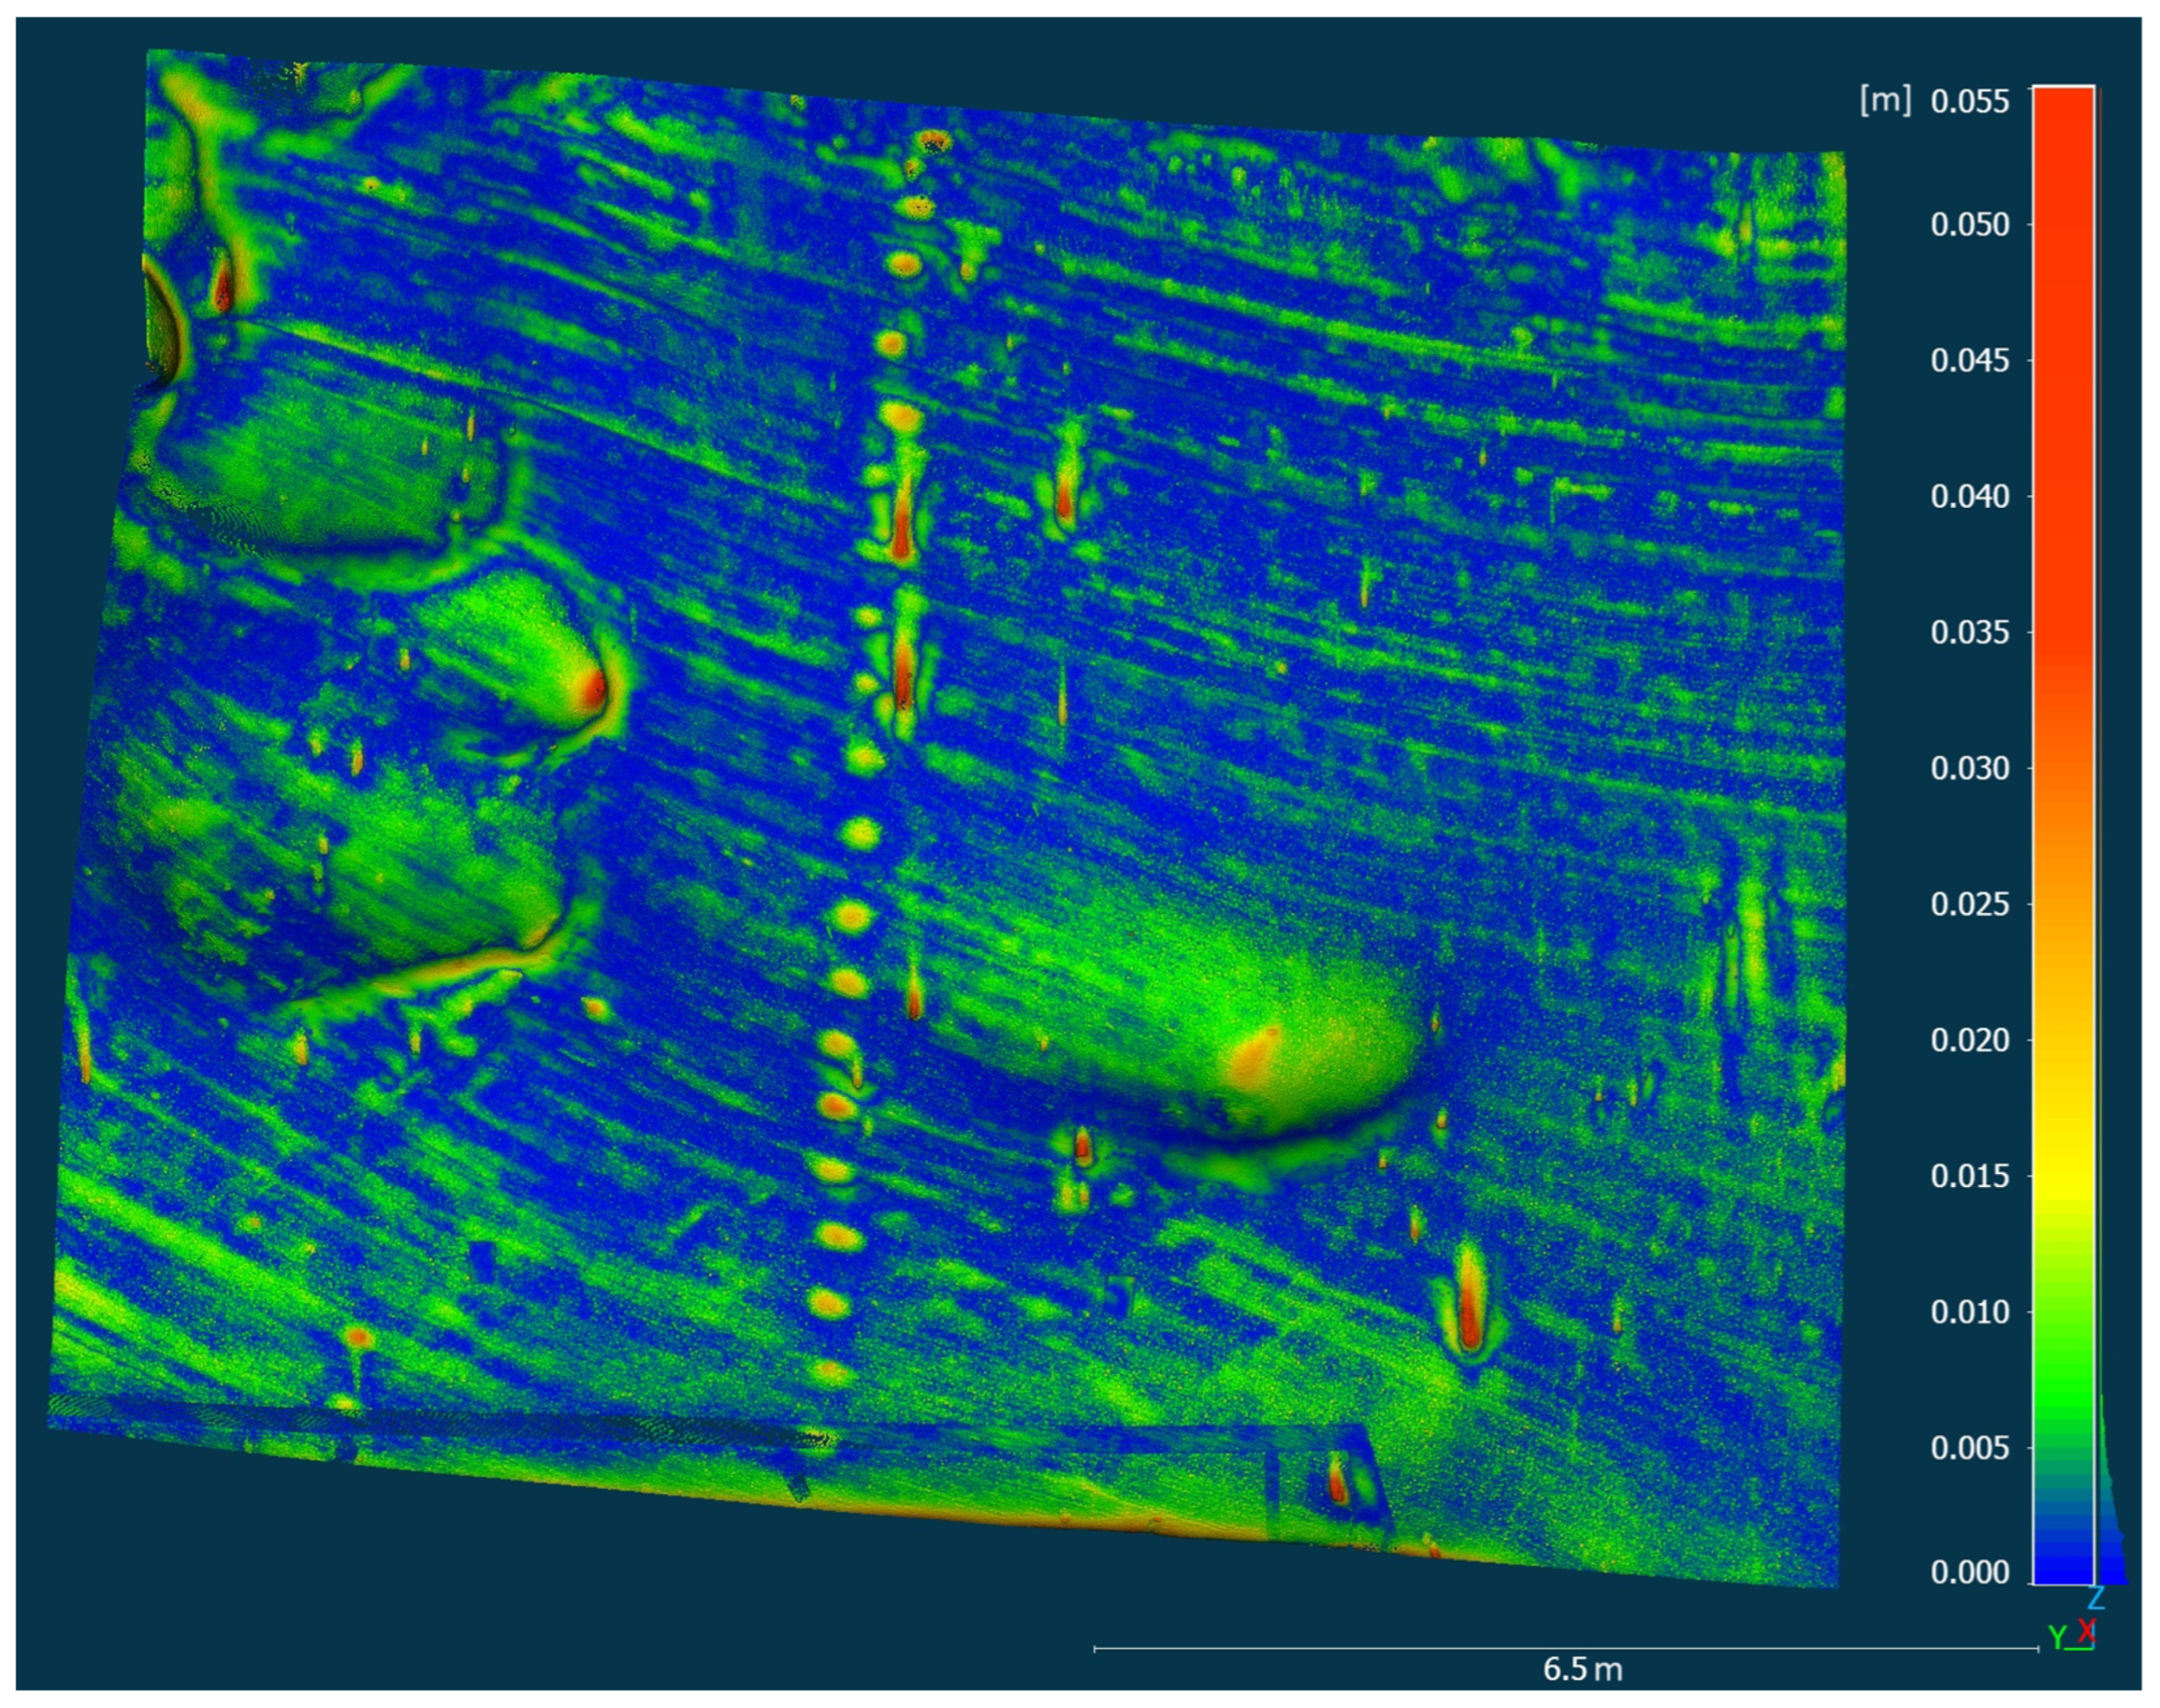
According to Figure 9, the noisiest is the Zeb Horizon’s cloud, and in some places, the Leica C10’s cloud has similar values. As the data from the iPhone are automatically processed (filtered or subsampled from mesh), the roughness map is not interesting in this case. The automatic filtration of multiple reflections during the RTC scanning was also useful here, so with the roughness parameter 0.2 m, it is not interesting either. But if it is changed to smaller values, or the settings of the colour ramp boundaries are within the interval of 0 to Leica RTCs maximal values of penetration or noise, significant differences occur on the map between the different types of ice, and only the cloud from this scanner allowed us to see such details at this locality (Figure 10).
The roughness map shows places where the curvature is highest, but higher values can also be seen in places with darker layers of clearer ice or the ones with the dust, where laser reflection is lower than ice layers with snowy texture and lighter—white colour. These are less noisy, and the laser did not penetrate in such depth as in the previous types.
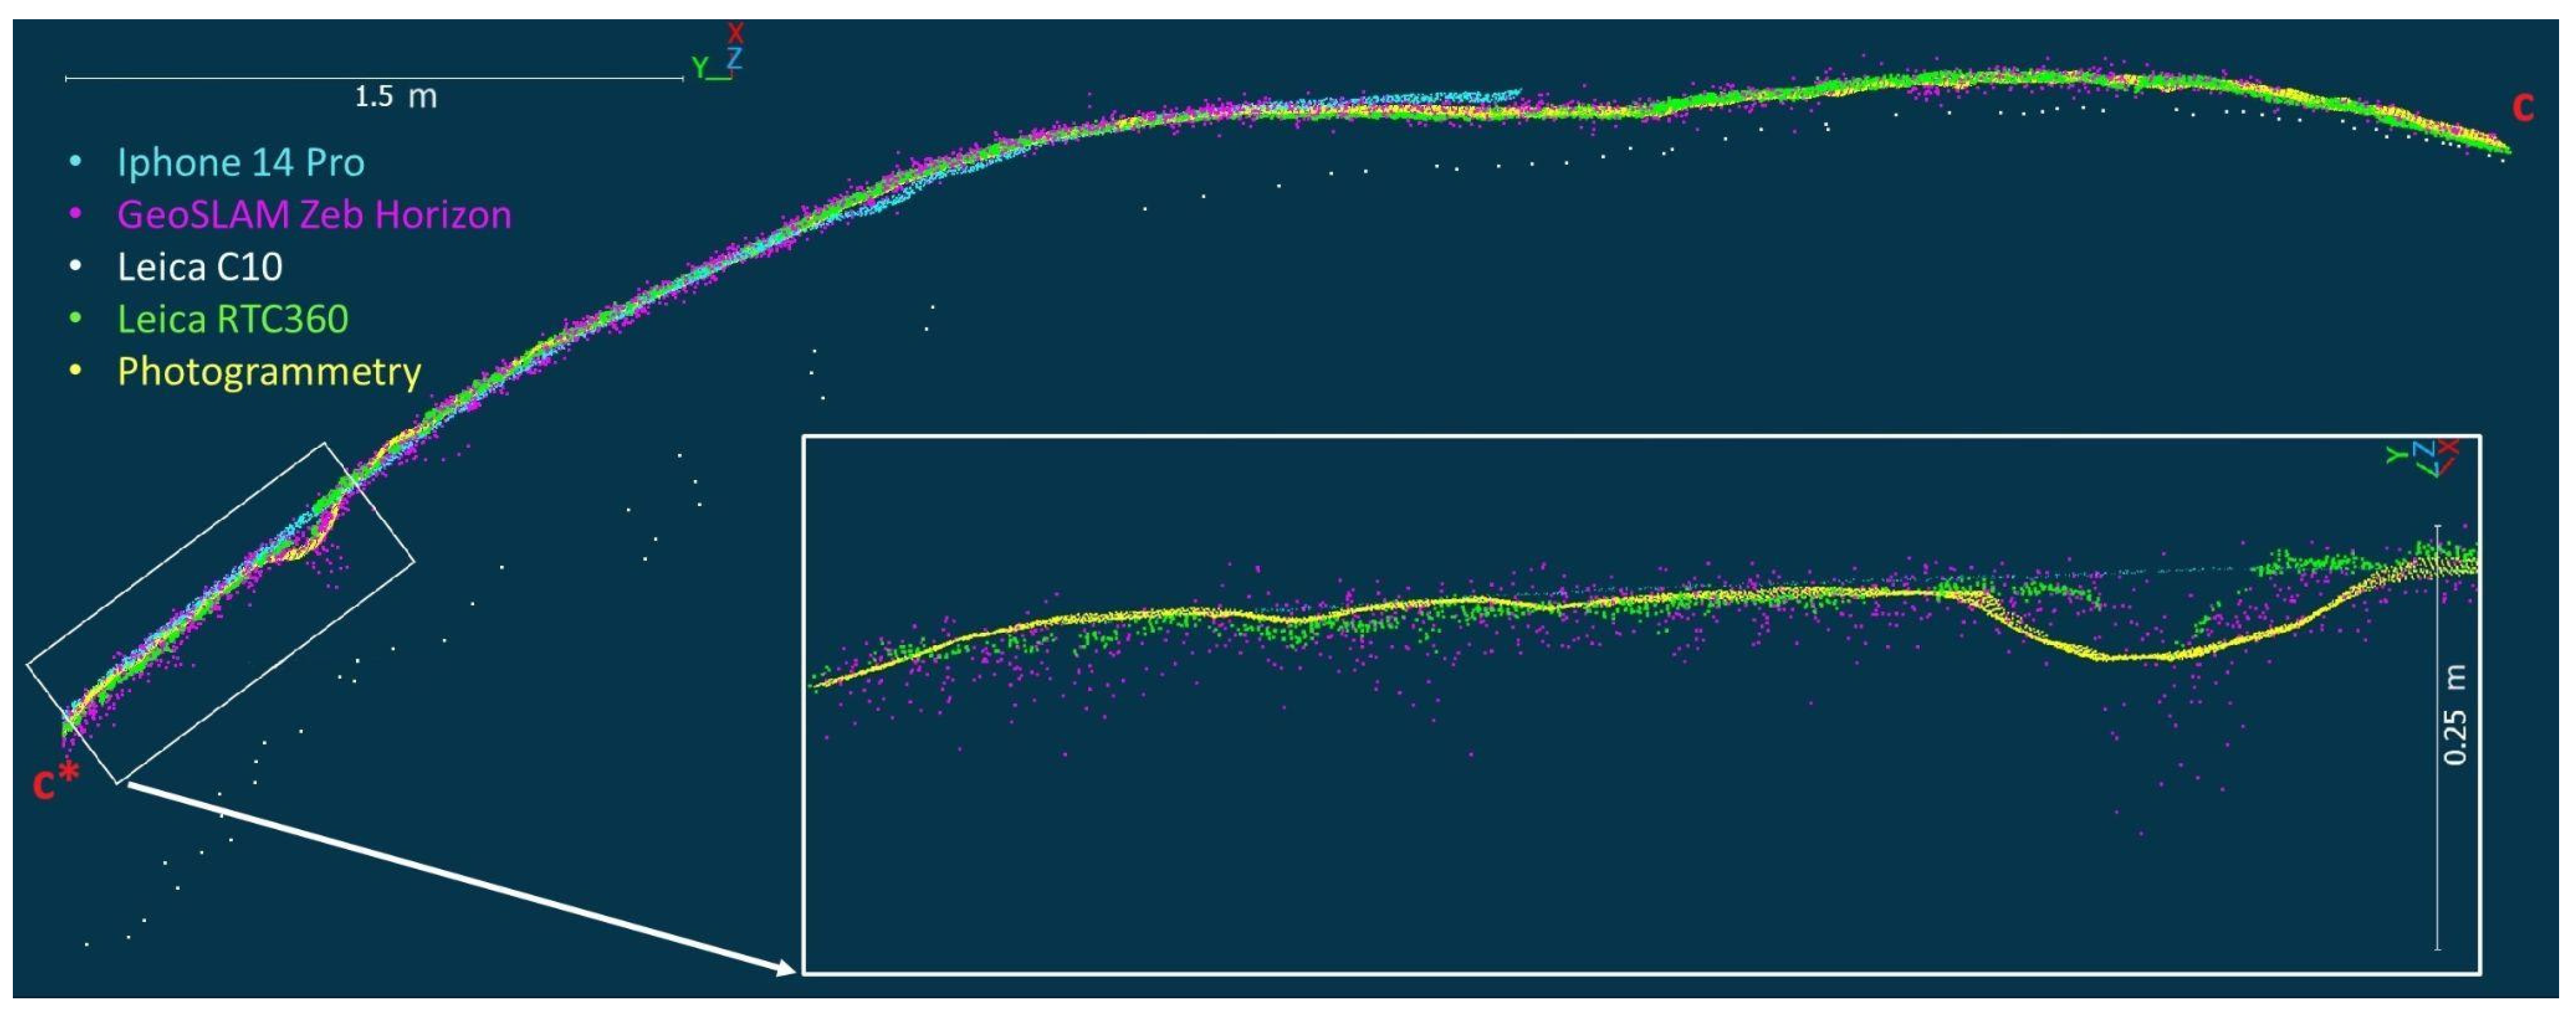
At the A section, the maximal depth of penetration reached the scanner Leica C10. In this case, it was possible to compare it because the change of the ice was not so obvious here and penetrated points were easy to recognise, but as we do not have a real reference base, the value in Table 3 is just maximal depth from what we can see and, in reality, could be higher. Penetration is worse in the lower part, where more layers of darker (clearer or dustier) ice occur. As can be seen in Figure 11, all the clouds align well with the cloud from photogrammetry. Zeb Horizon had obviously higher noise (6 cm), but after quick filtration with parameters that kept the cloud continuous without gaps, the noise reached 4 cm, and penetrated points were reduced from a depth of 15 cm to 2 cm. The RTC has excellent noise and penetration values in this section; the only visible problem is the artificial surface at the top of the wall, where the biggest C2C distance can be observed. The iPhone’s cloud has a similar issue at the end of its range—around half of the height of the wall.
In cross-section B (Figure 12), we can see that the iPhone generalises a lot of the concave part, which is at the end of its range, but at the bottom, it fits the photogrammetry the best. In the lower part, Zeb Horizon penetrates ice deeper and with the highest noise, but the deepest here is the Leica RTC. We cannot say with certainty actually how deep the penetration of Leica C10 is in reality. With RTC, the mean C2C distance was also the worst (see Table 2). In the highest part of the section, surprisingly, all the clouds (except for the iPhone with a smaller range) fit fine with the photogrammetry.
At cross-section C, which is horizontally oriented to be perpendicular to different layers of ice (Figure 13), we can see the noise getting higher from the right to left part of the picture. In this part of the section, the water from the upper parts of the cave flows down along the ice wall, and new ice layers are created when freezing. In the detailed view, we can also see that the iPhone ignores this stream of water (also the photogrammetry generalises that), but the small valley is visible well in the cloud of Zeb Horizon, just with high noise—around 19 cm (without filtration) in the stream. In the cloud of RTC, we can see the morphology of the stream partly, because of the small gap here.
In Ruffínyi’s corridor, most of the best values in all compared categories (Table 3) are in the column of Leica RTC. Registration is the worst with the iPhone, and the noise is highest with Zeb Horizon. Maximal penetration reaches Leica C10, and then Zeb Horizon follows.

3.3. Artificial Ice Tunnel

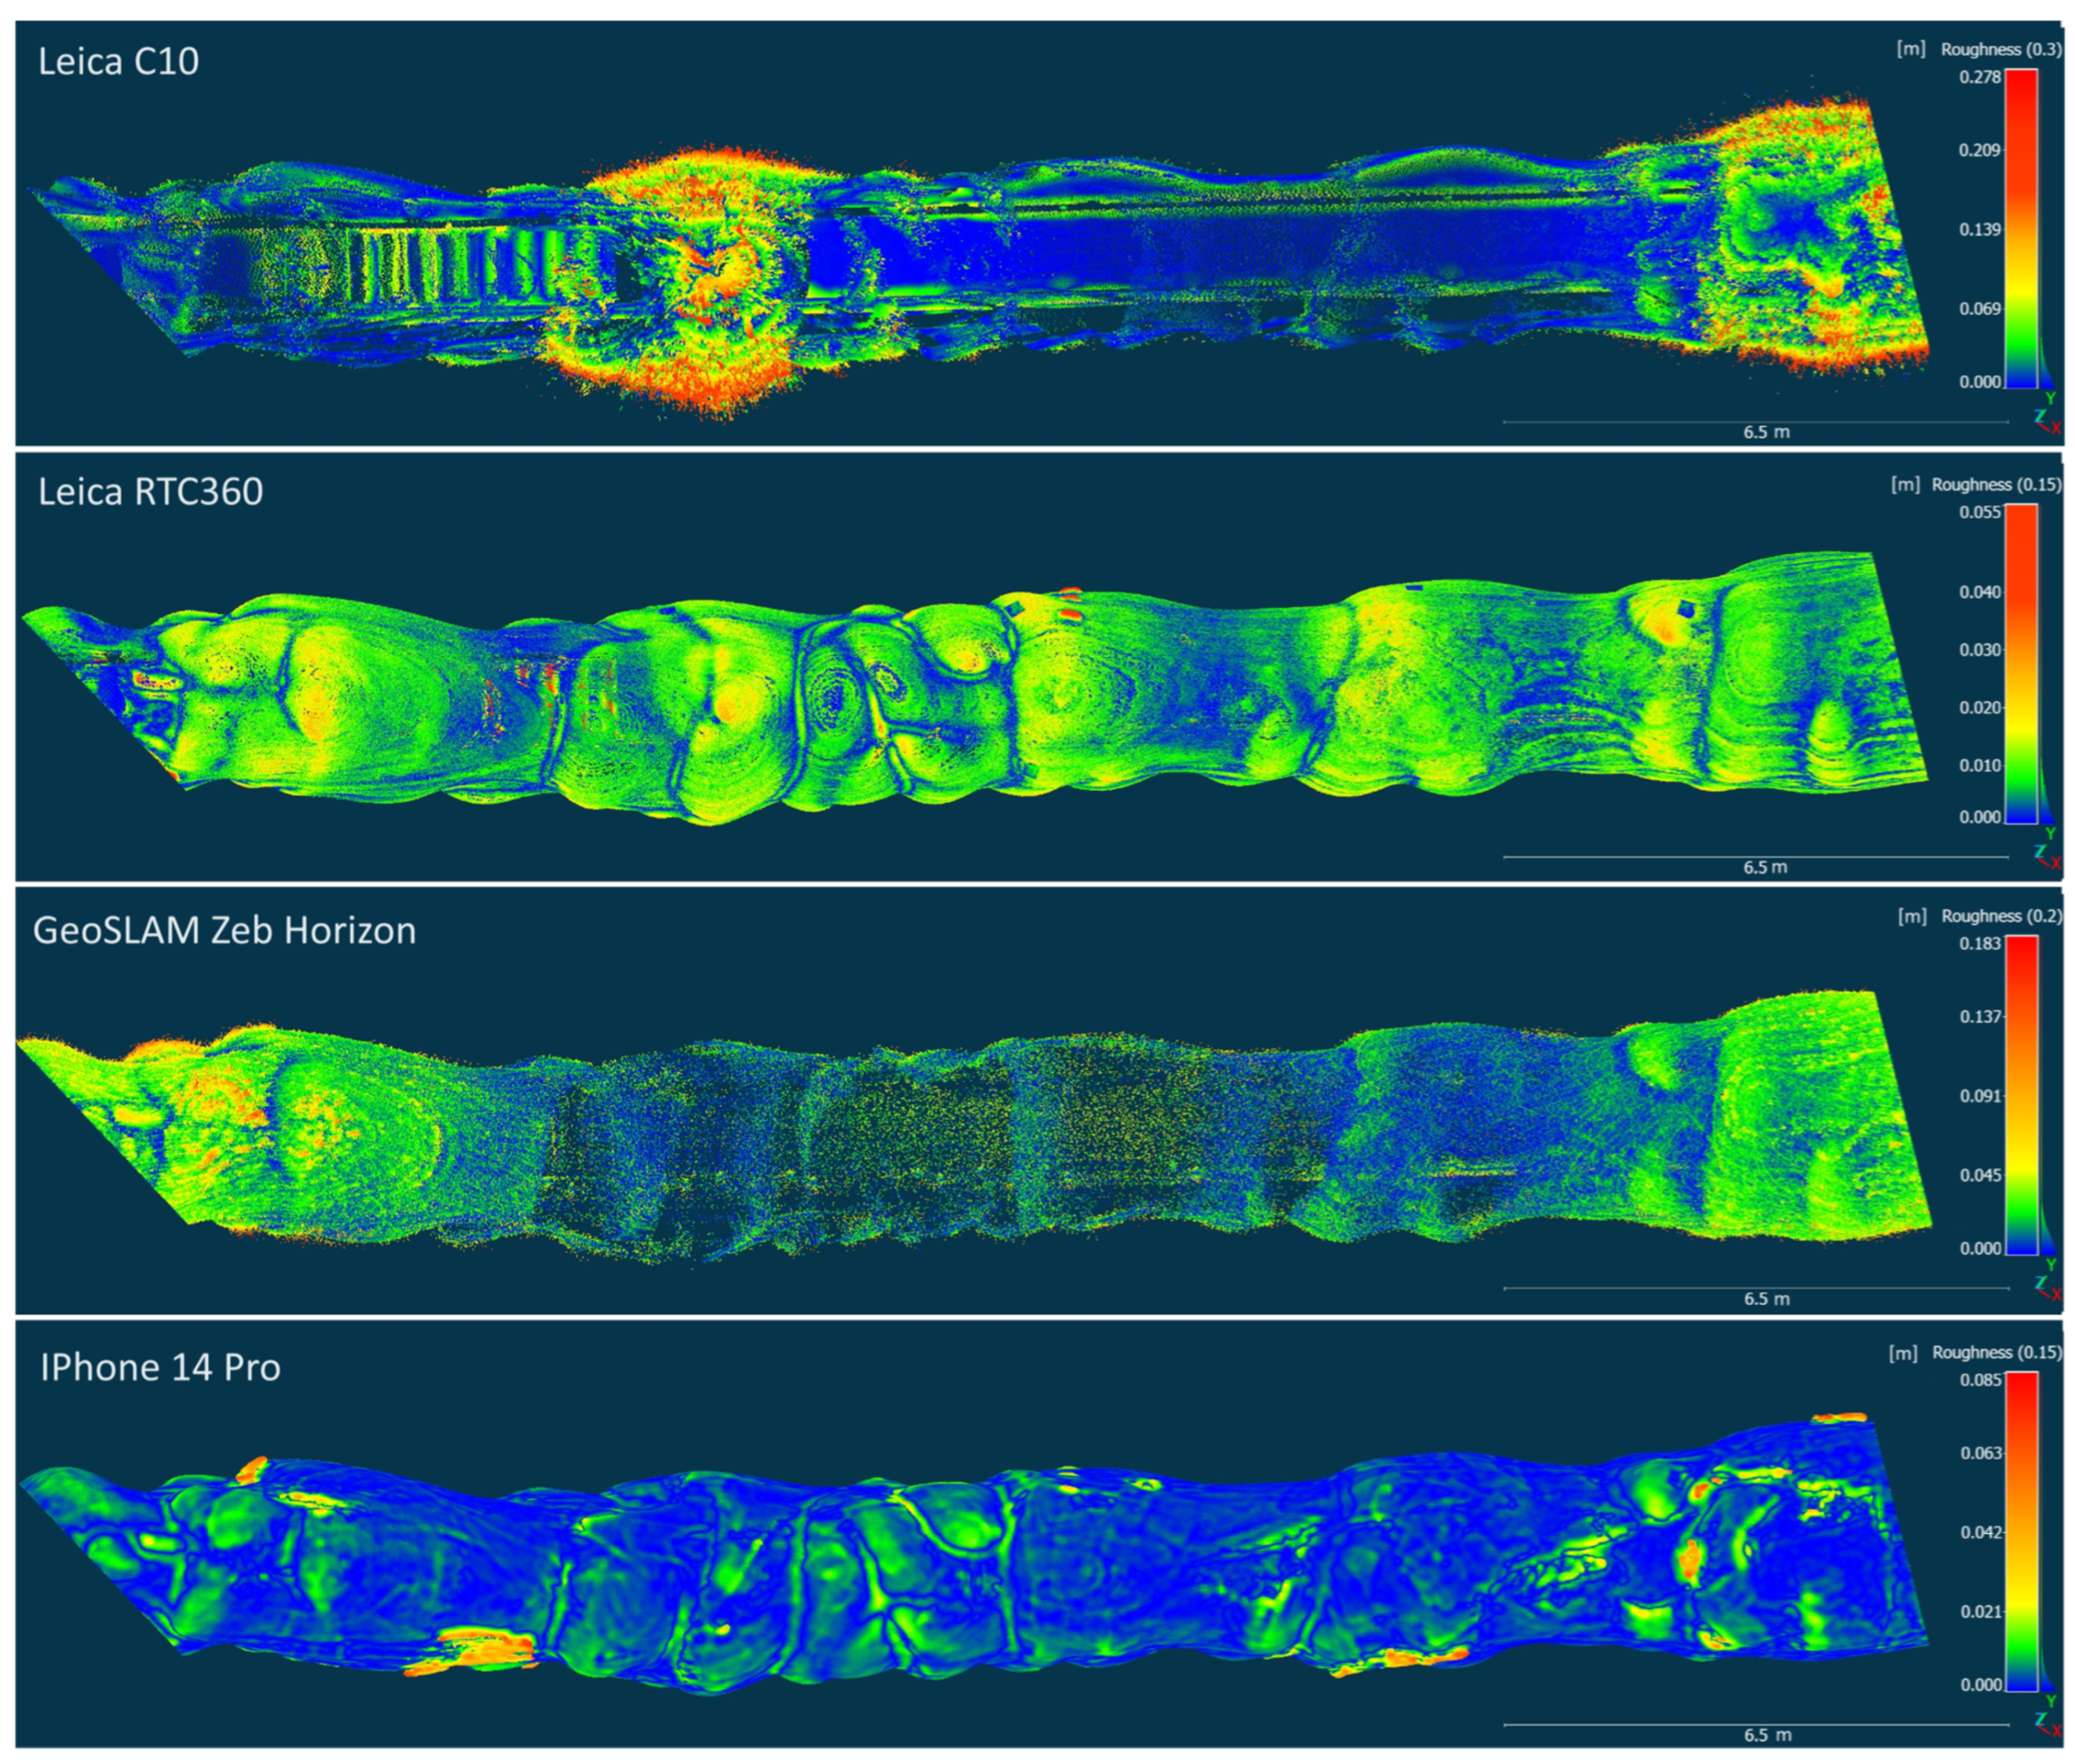
As the artificial ice tunnel was created right through the body of the glacier, the layers of ice with different properties can also be seen here. Based on the roughness maps of the point clouds (Figure 14), cross-sections A and B were chosen for further analysis (Figure 15). In the first one, Leica C10 has the highest roughness values; it is also close to its scanning positions, so the information about the density of clouds is more relevant. In cross-section B, the highest roughness values reached Zeb Horizon’s cloud. It is important to note that the Leica C10’s scanning position was further in this case, so the cloud’s density is lower and not so comparable here. Obviously, the lower density of points in the middle of the Zeb Horizon’s cloud is caused by the fact that the tunnel was scanned just from its beginning (in the first trajectory) and its ending (in the second trajectory), as it lacks significant features which are needed for the orientation of this device in the space, so it is risky since the cloud is prone to have an error in such situation. We can also see the very satisfying preciseness of Leica RTC’s cloud, where, comparing with the coloured photogrammetry cloud, we can relate darker layers of ice (here, the darker means, the clearer, with less snowy/firny particles with white texture) to higher values of roughness. This is also visible in the Leica C10’s and partly in the Zeb Horizon’s cloud. In the iPhone’s cloud, as we do not have a raw point cloud, the map shows mostly the places with higher curvature, but also this cloud has some artificial features, and it is a little deformed—slightly shifted in the beginning and at the end.
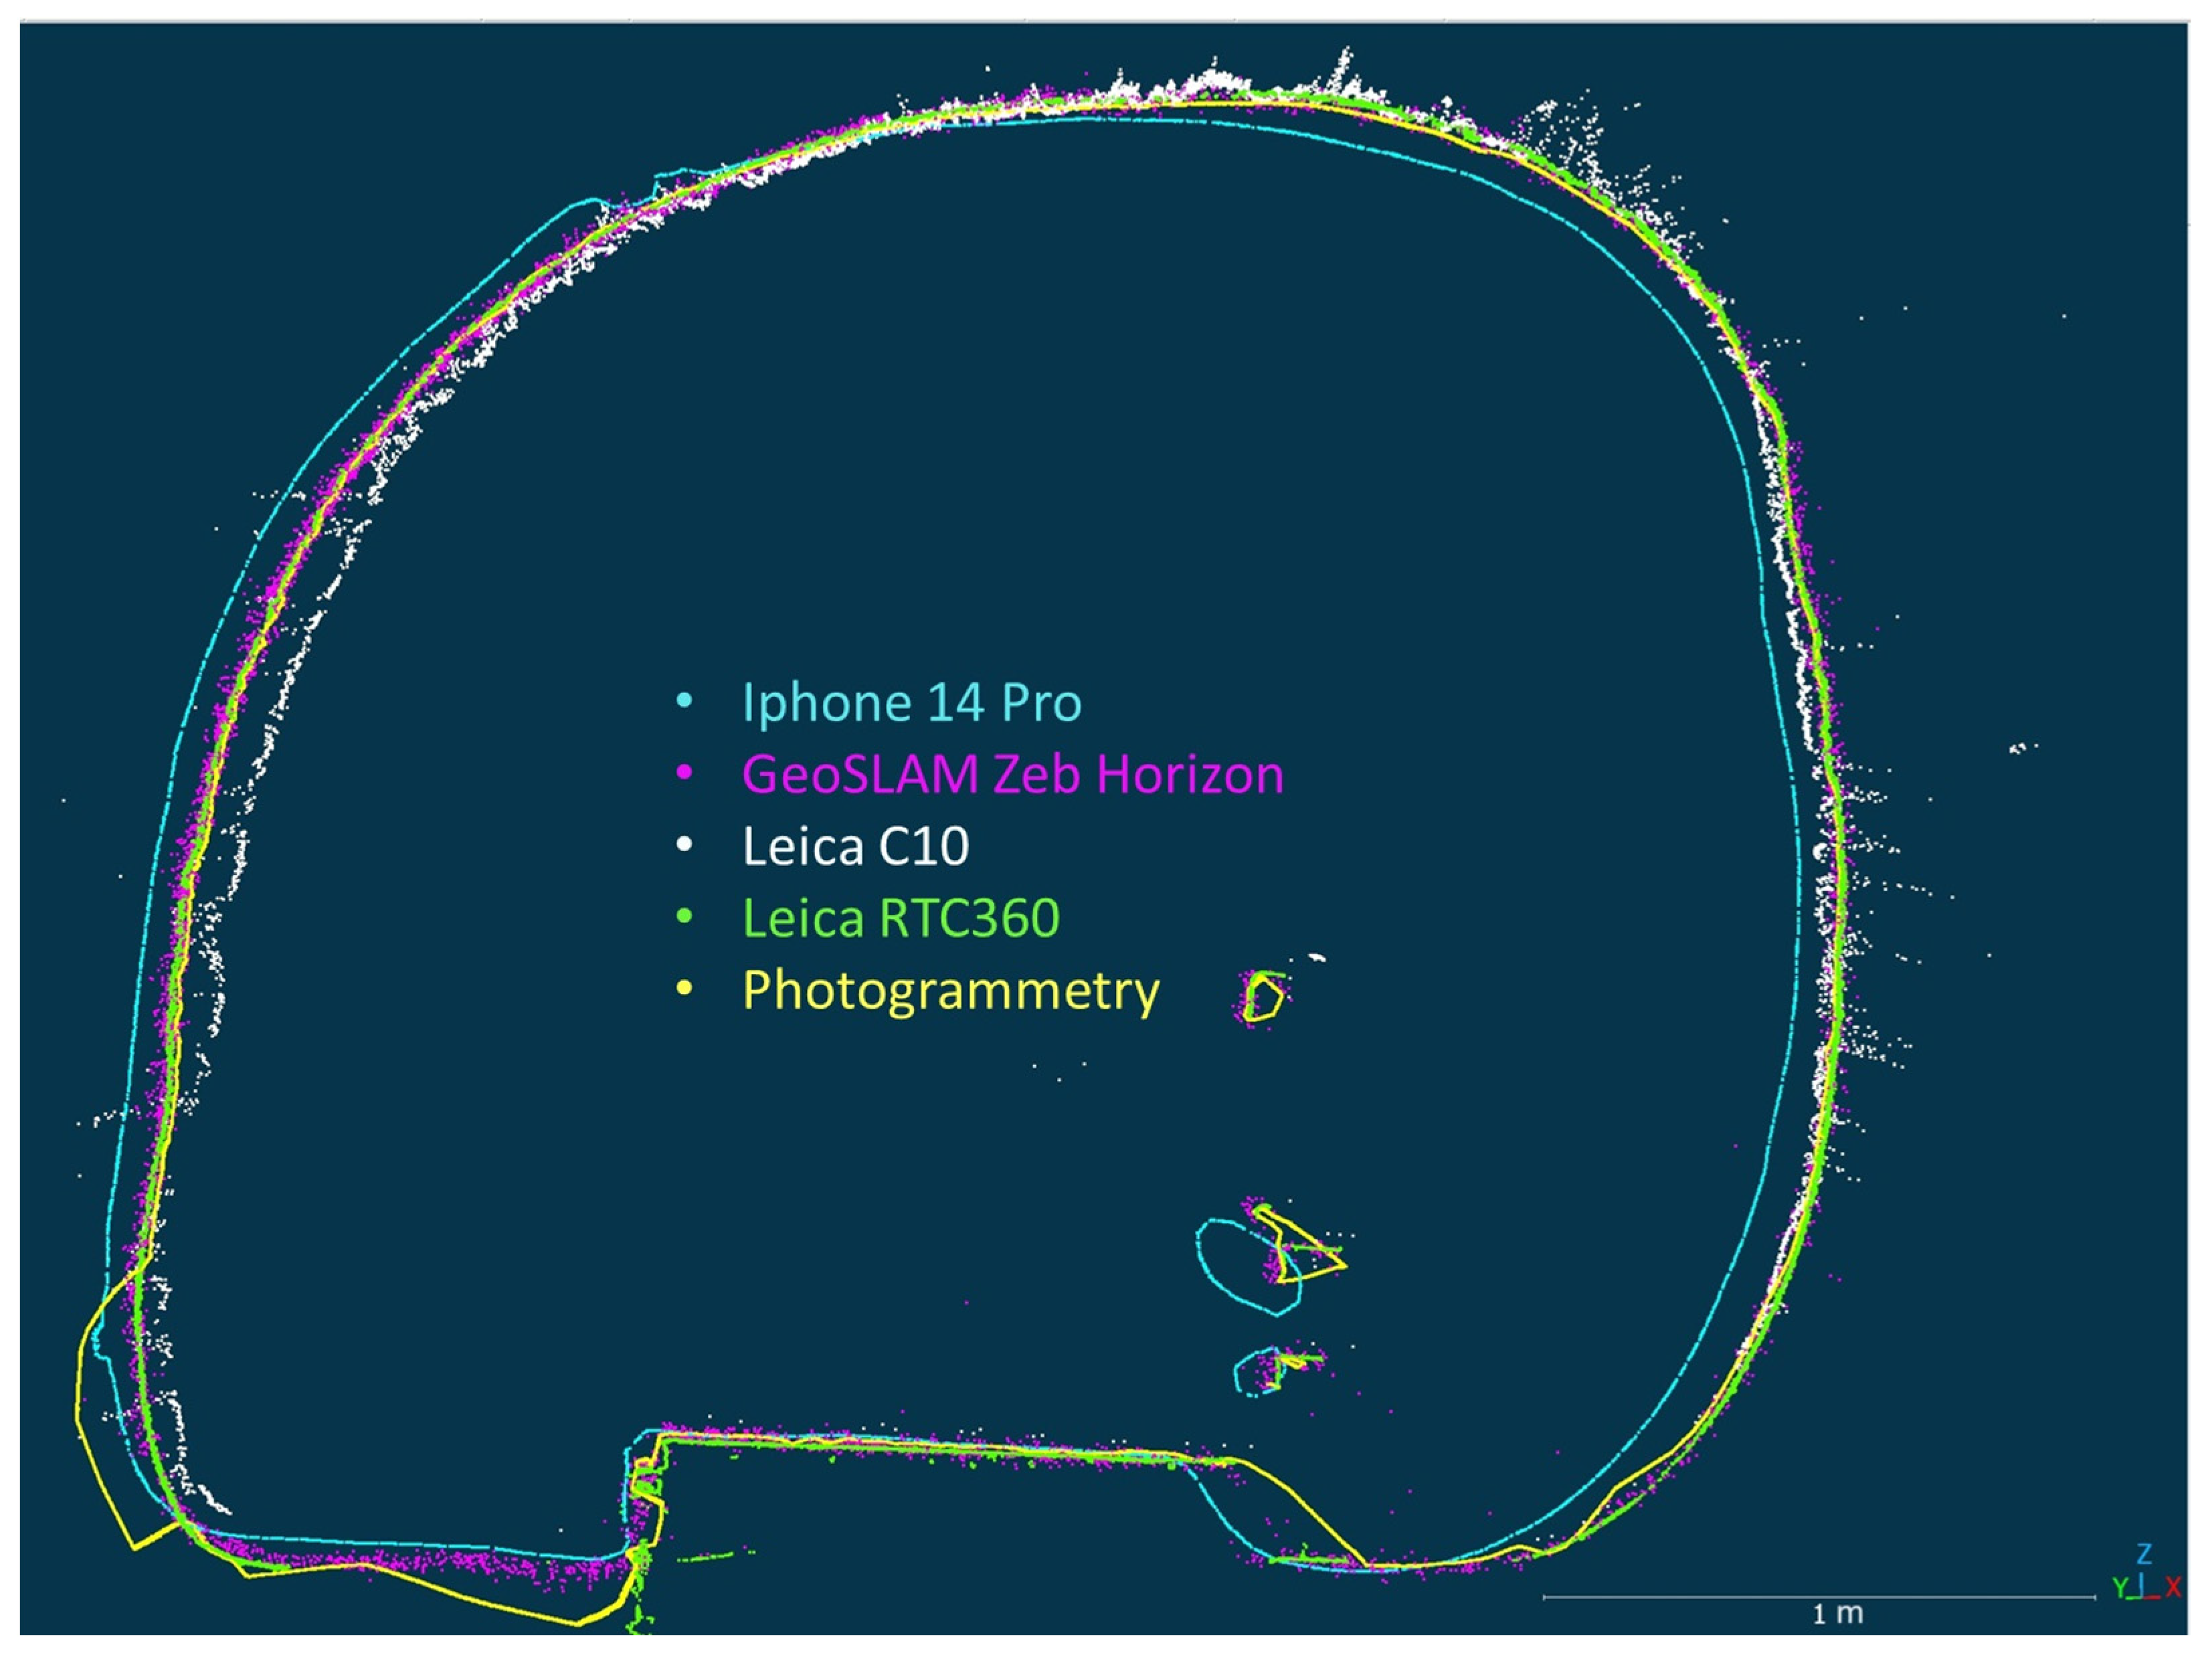
In cross-section A (Figure 16), we can see really high penetration of Leica C10—up to 60 cm—which was one of the reasons why it was replaced in recent years with Leica RTC360 but also the reason why we included it in this comparative study—to illustrate the difference. Penetration is different based on layers of ice here, too. The floor of the section was not compared because the photogrammetry and also stationary scanners have no or unreal data here because of the shades of railings and tourist path. As can be seen, the clouds from RTC and Zeb Horizon align well with the photogrammetry, but the iPhone’s cloud is evidently shifted all along the profile, except for the tourist trail. The Leica C10’s penetration is present almost everywhere, so the cloud can look the noisiest. Then, the Zeb Horizon follows—see Table 4.
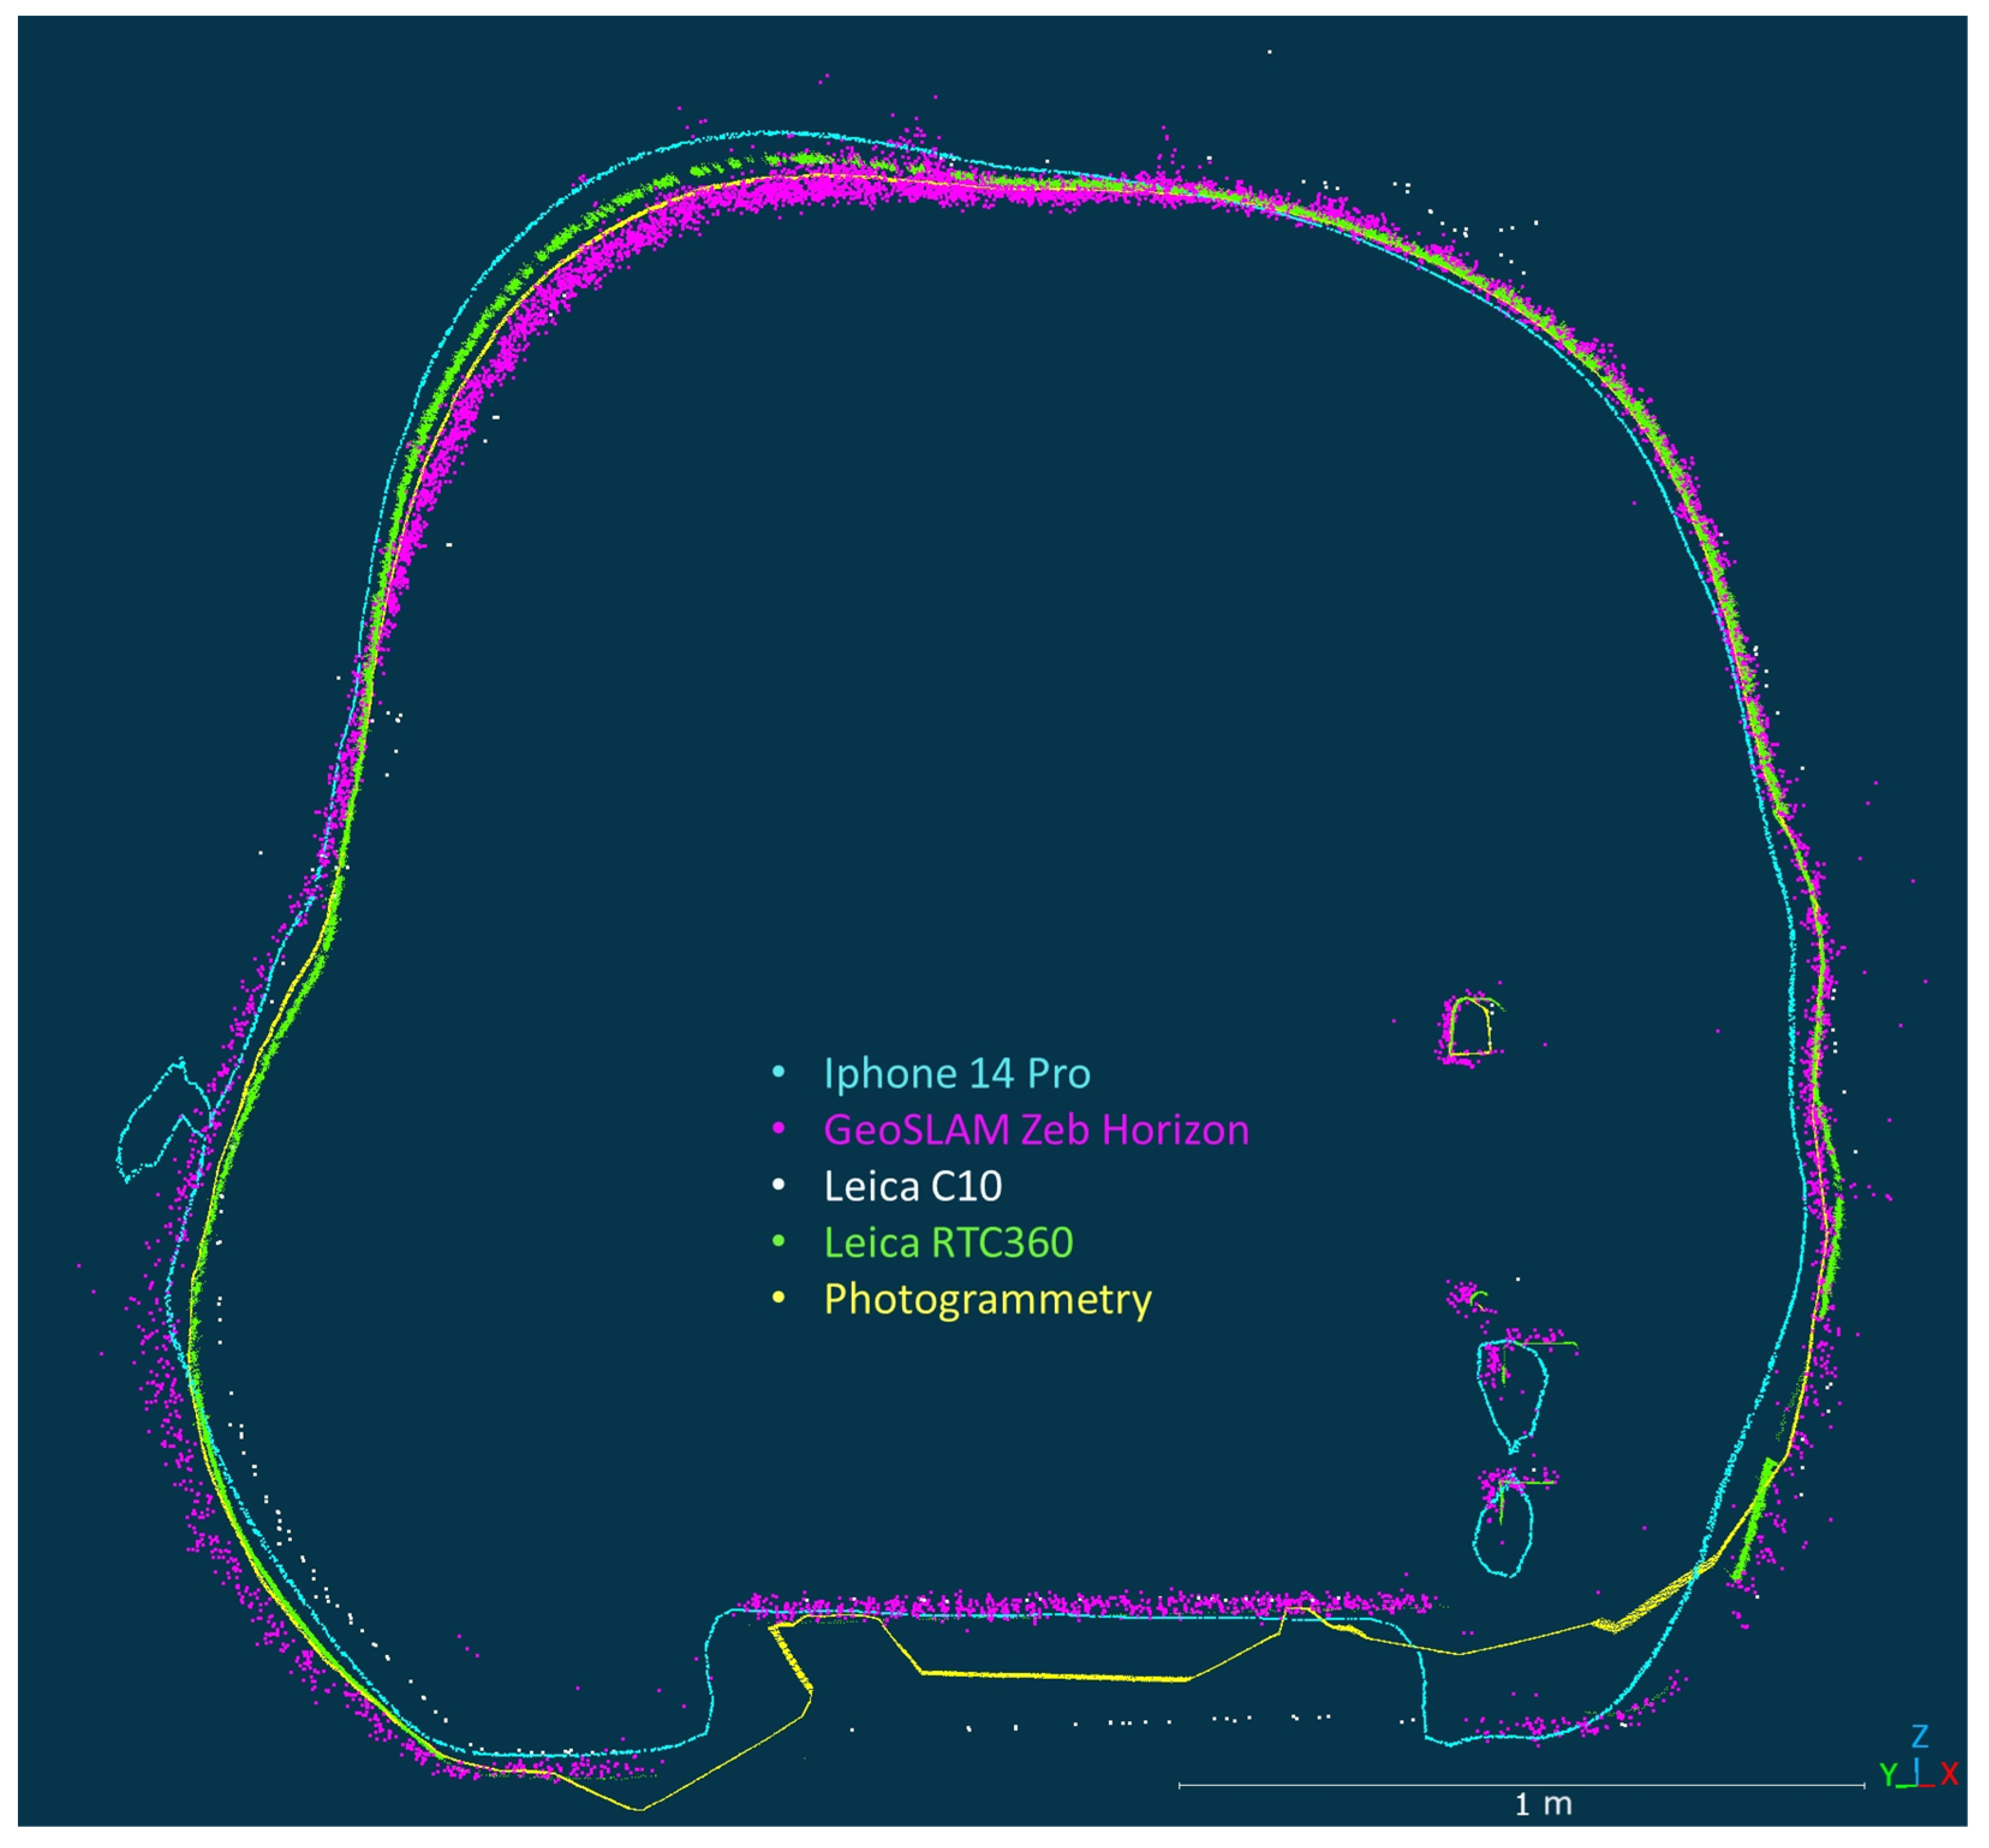
In cross-section B (Figure 17), a slight shift in the iPhone’s cloud also can be seen. Except that, penetration is obvious in the top-left part. Here, the Leica RTC also has higher penetration values, and even when the Zeb Horizon has only several penetrated outliers, the thickness of the cloud is obviously the highest. In this section, Leica C10 has the highest penetration values, which can be seen despite recent ice surface changes. As we do not have an actual reference base for this cloud, the values in Table 4 could be even higher in reality. Its cloud is also sparse as the section was extracted further from its scanning position. The floor of the section was not compared for the same reason as in the previous one.
Based on the graphics and the data in Table 4, we can conclude that the best option in the tunnel is the Leica RTC360, which has the best values in most of the criteria, except for the scanning time—in this one, Zeb Horizon is still the best. Leica C10, with its really deep and often occurring penetration, and iPhone, with its artificial features and shifts (the highest mean C2C distances at the cross-section), do not provide reliable results here.

4. Discussion

From the results of the comparisons, it is evident that the Leica RTC360 excels in most of the assessed properties. It performs best regarding registration error (up to 0.006 m), point cloud density, low noise, penetration, and capturing the highest amount of details (for instance, different layers of ice). In terms of time of scanning and registration in the cave, it is significantly faster than the Leica C10, which also has a registration error of up to 6 mm but extremely high penetration values, too. Therefore, within the same time frame, with RTC, it is possible to achieve a point cloud with significantly higher detail without filtering in the post-process. However, problematic areas for this device are the ones where ice is covered by the water. Even shallow (a few cm) and small water surfaces or tiny streams create gaps in the point cloud, which is consistent with [28], where scanning with Riegl VZ2000i (1550 nm) in cold periods was recommended to avoid wet ice surfaces. In the case of RTC360, holes could be caused by the automatic filtration of multiple reflections during the scanning. In clear water conditions, Leica C10 can capture (penetrate to) gravel beds in shallow (up to 0.68) water streams [52]. In our case, shallow water up to 10 cm creates the mirror effect of the real surface or the gaps, mostly in the point cloud of Leica C10 and Leica RTC360, so obviously it is a combination of the ice surface under the water which is hard to scan. However, GeoSLAM Zeb Horizon was able to capture the real ice surface below the shallow water even though the noise was obviously higher. It also excels in the speed of scanning and in situ registration, and although its registration errors (around 0.1 m) are higher compared to stationary scanners, they can be reduced (to a few cm) by densifying the network of control points that are used during scanning (which would slightly increase the scanning time). Higher noise is a price for the speed of scanning by walking, in this case. The trade-off between scanning time and registration error is the worst for the iPhone 14 Pro. Although it is similar to the Zeb Horizon scanner in registration error, the number of points used for registration, in this case, was substantially higher over a significantly smaller scanned area, making further improvement difficult. Additionally, its range (5 m) limits it to smaller spaces where capturing fine details in lidar mode is not possible too. Interestingly, the iPhone’s C2C distances for the tunnel in Table 4 (before fine C2C registration) do not reflect the shift and deformation that can be seen in the graphics. Values are similar to or even better than those in Zeb Horizon’s column, whose cloud visually fits the photogrammetry better. The reason for the iPhone’s better values is probably almost no noise, which, in the case of Zeb Horizon, provides us, for the whole tunnel, higher C2C distances on average.
When comparing the producer’s datasheet information about noise and penetration, we can see that the noise of Leica RTC360 is significantly higher when applying the device on ice surfaces in the cave than in the ideal conditions: up to 4 cm (or up to 7 cm with water on ice) in comparison with the value of 0.4 mm @ 10 m in the datasheet—so it is 10 times worse in the ice cave. For Leica C10, the noise in the datasheet states 2 mm. Such a result could be seen just in the Collapsed Dome, where the thickness of a cloud is actually the thickness of a single point, but it usually is up to 2 or 3 cm (Ruffínyi’s corridor, except the water stream at CS-C with noise up to 13 cm). So, it is 10 times higher than in the datasheet, too. The Zeb Horizon’s noise declared in the datasheet (± 3 cm) is similar to our results in Ruffínyi’s corridor on the layered ice wall (A cross-section), where many layers with snowy structure and some dust occur. We can say that ice acts similarly to a normal wall or rock surface in the case of Zeb Horizon, but maximal values of noise are around 3 times higher.
Trzeciak and Brilakis [53] compared mobile scanners GeoSLAM Zeb Horizon and KAARTA Stencil 2 to static Faro Focus 3D by systematically scanning a rectangular target at a growing distance and showed that the accuracy of the scans outputted by the static scanner is about 20 times better at 5 m than those produced by the mobile devices, and this gap further increases along with the distance. The density drops along with the distance for all these devices, with mobile scanners outperforming the static ones. In our study, we can compare it to the wall in Ruffínyi’s corridor, where the top is above 10 m. We noticed bigger C2C distances with the iPhone at the end of its range, which is consistent with [54], who determined the optimal phone-to-target distance range between 0.30 m and 2.00 m and also found that after reaching a distance of more than 3 m, results are getting unreliable. From our experience in the artificial ice tunnel, where C2C distances were higher at both ends of the tunnel, such challenging conditions as in the ice tunnel can make results unreliable even in the above-mentioned optimal distances. In one case (CS-A), we also saw Leica RTC at the top of the wall to have the biggest C2C values for which we do not have an explanation; as in the other studied profiles, it fits the photogrammetry cloud very well. Lowering the cloud density with distance was obvious in the case of Leica C10 in our cross-sections and such distances, so we cannot confirm the relationship between mobile and static scanners described by [53]. On the other hand, the relationship between different types of ice layers can be seen, especially obvious on the roughness maps. Higher roughness values are usually on the layers with clearer (darker blue) ice, while layers of white (snowy) ice could better reflect the laser. Based on [55], the absorption coefficient of ice increases with wavelength from blue to red, and thus, while wavelength 700 nm is absorbed in a length of 2 m, 400 nm wavelength can be absorbed to 200 m. So, in our case, the green laser of the Leica C10 (532 nm) is more prone to be absorbed in greater depth in the ice than other scanners, and based on a shorter wavelength, it is more susceptible to creating internal reflection according to internal ice structure, which we identified as penetration. Also, in the Eisriesenwelt, big holes in the cloud were found when Faro Photon 120/20 with a laser of 785 nm was used [21,22]. The fact is relatively consistent with the study of ice conduits, which claims that penetration into some ice layers is small with Faro Focus 3D X330 (1550 nm), although structural weaknesses allow penetration to and reflection from depths of ≤0.6 m [26].
As the TLS in ice caves is usually used to find out information about surface or volume change of ice, it would be good to specify what volume could be a result of measurement error or have information about depth of laser penetration, as can be found in the cases [6,14,26,29,30,40,41], but not in many others [21,22,23,24,25,27,28], if we do not count brief notes about undefined holes or unspecified filtrations. Such data could facilitate further selection of measurement devices in such a challenging and unique environment and so increase the future research quality.

5. Conclusions

We conclude that for the purpose of long-term monitoring of the ice surface focusing on larger changes, the mobile 3D scanner GeoSLAM Zeb Horizon is sufficient for the Dobšinská Ice Cave, representing the best compromise between the time needed and the accuracy and the complexity obtained, universal enough to have a gapless point cloud. If there is a need to monitor more detailed changes in ice morphology or small volume differences, for example, within a season, a stationary scanner is required, with the Leica RTC360 being the most suitable among those mentioned, but we also assume that similar quality of the results could be reached with static laser scanners of similar wavelength, e.g., Riegl VZ2000i, Riegl VZ1000, or Faro Focus 3D X330 used in other ice caves [14,25,26,27]. Ideally, the future collaboration would involve a combination of a mobile scanner Zeb Horizon for scanning the whole cave and a more precise stationary scanner only in specific monitored areas, significantly reducing scanning time and increasing accuracy on research sites. A mobile built-in scanner in iPhone 14 pro is not appropriate for this cave, as the walls, where the precision was good enough, are higher than its range, horizontal surfaces are large and thus would take a long time to scan them and in the ice tunnel, which has dimensions within the optimal distances described by [54]; it is no reliable in monitoring ice changes as both endings of the tunnel were shifted. Based on comparing lidar and photo mode on scallops in the Mylna cave, for a more detailed 3D model, it would be better to use a photogrammetry mode instead of the lidar [56], but it is rather recommended for the objects than for bigger spaces [57]. We also do not recommend the usage of Leica C10 for ice surfaces because of its penetration, assuming that the lower the wavelength of the laser, the deeper its penetration to ice, and the higher the wavelength, the higher the absorption coefficient and so the smaller is the depth, in which the light (laser) can be absorbed, and thus, the smaller is the space for unwanted internal reflections. We also provide some remarks on the following list:
-
Leica RTC360
-
the best details,
-
the best registration error,
-
the least postprocessing,
-
the worst on the water,
-
the need for light for registration (visual SLAM algorithm),
-
Leica C10
-
the longest in situ registration,
-
the deepest penetration,
-
the highest weight,
-
bad on the water,
-
the lowest noise (in case of no penetration),
-
GeoSLAM Zeb Horizon
-
the most universal,
-
the highest noise,
-
the highest speed of scanning,
-
the shortest in situ registration,
-
additional noise filtration recommended,
-
Iphone 14 Pro
-
the lowest weight and dimensions,
-
the smallest field of view,
-
the shortest range,
-
the longest scanning time,
-
the most deformations and artificial features in the cloud,
-
raw data unavailable (automatic mesh processing in app).

Author Contributions

Conceptualisation, L.D. and J.Š.; methodology, P.H., K.P. and K.B.; software, J.Š.; validation, P.H., K.B. and Ľ.K.; formal analysis, K.B. and Ľ.K.; investigation, L.D., P.H., K.P., K.B. and Ľ.K.; resources, L.D. and P.H.; data curation, K.P. and J.F.; writing—original draft preparation, L.D. and K.P.; writing—review and editing, L.D., K.P. and K.B.; visualisation, L.D., K.P. and K.B.; supervision, P.H. and K.P.; project administration, K.P. and J.F.; funding acquisition, K.P. All authors have read and agreed to the published version of the manuscript.

Funding

The study is the result of the Grant Project of the Ministry of Education of the Slovak Republic KEGA No. 003TUKE-4/2023, VEGA No.1/0340/22, and 1/0679/25.

Data Availability Statement

The datasets presented in this article are not readily available, and original raw data from 3D scanning is not public due to the size of the datasets and ongoing research. Requests to access the datasets should be directed to [email protected].

Conflicts of Interest

The authors declare no conflicts of interest.

References

  1. Zlot, R.; Bosse, M. Three-dimensional mobile mapping of caves. J. Cave Karst Stud. 2014, 76, 191–206. [Google Scholar] [CrossRef]
  2. Cosso, T.; Ferrando, I.; Orlando, A. Surveying and mapping a cave using 3D Laser Scanner: The Open Challenge with free and open source software. Int. Arch. Photogramm. Remote Sens. Spat. Inf. Sci. 2014, XL–5, 181–186. [Google Scholar] [CrossRef]
  3. Bartos, K.; Pukanska, K.; Rakay, S.; Sabova, J.; Bella, P. 3D digital mapping of cave spaces in Slovakia by Terrestrial Laser Scanning. In Advances and Trends in Geodesy, Cartography and Geoinformatics, 1st ed.; Molčíková, S., Hurčíková, V., Zelizňaková, V., Blišt’an, P., Eds.; CRC Press: London, UK, 2018; pp. 9–14. [Google Scholar]
  4. Pukanská, K.; Bartoš, K.; Sabová, J.; Tometzová, D. High-resolution 3-D mapping for the survey of valuable inaccessible Medvedia cave in the National Park of slovenský raj. In Advances and Trends in Geodesy, Cartography and Geoinformatics, 1st ed.; Molčíková, S., Hurčíková, V., Zelizňaková, V., Blišt’an, P., Eds.; CRC Press: London, UK, 2018; pp. 89–94. [Google Scholar]
  5. Pukanská, K.; Bartoš, K.; Bella, P.; Gašinec, J.; Blistan, P.; Kovanič, Ľ. Surveying and high-resolution topography of the Ochtiná aragonite cave based on TLS and digital photogrammetry. Appl. Sci. 2020, 10, 4633. [Google Scholar] [CrossRef]
  6. Herich, P. Mobilné laserové skenovanie jaskýň–prvé výsledky a skúsenosti. Aragonit 2021, 26, 77–79. [Google Scholar]
  7. Bella, P.; Littva, J.; Pukanská, K.; Gašinec, J.; Bartoš, K. Využitie terestrického laserového skenovania pri skúmaní štruktúrno-geologických diskontinuít a morfológie jaskýň: Príklad jaskyne Dúpnica v Západných Tatrách. Acta Geol. Slovaca 2015, 7, 93–102. [Google Scholar]
  8. Hofierka, J.; Hochmut, Z.; Kaňuk, J.; Gallay, M.; Gessert, A. Mapovanie jaskyne Domica pomocou terestrického laserového skenovania. Geogr. Časopis 2016, 68, 25–38. [Google Scholar]
  9. Gallay, M.; Kaňuk, J.; Hochmuth, Z.; Meneely, J.; Hofierka, J.; Sedlák, V. Large-scale and high-resolution 3-D cave mapping by Terrestrial Laser Scanning: A case study of the Domica cave, Slovakia. Int. J. Speleol. 2015, 44, 277–291. [Google Scholar] [CrossRef]
  10. Gallay, M.; Hochmuth, Z.; Kaňuk, J.; Hofierka, J. Geomorphometric analysis of cave ceiling channels mapped with 3-D terrestrial laser scanning. Hydrol. Earth Syst. Sci. 2016, 20, 1827–1849. [Google Scholar] [CrossRef]
  11. Pukanská, K.; Bartoš, K.; Bella, P.; Rákay, Š.; Sabová, J. Comparison of non-contact surveying technologies for modelling underground morphological structures. Acta Montan. Slovaca 2017, 22, 246–256. [Google Scholar]
  12. Fabbri, S.; Sauro, F.; Santagata, T.; Rossi, G.; Waele, J.D. High-resolution 3-D mapping using terrestrial laser scanning as a tool for geomorphological and speleogenetical studies in caves: An example from the Lessini mountains (North Italy). Geomorphology 2017, 280, 16–29. [Google Scholar] [CrossRef]
  13. Pukanská, K.; Blistan, P.; Bartoš, K.; Kovanič, Ľ. Surveying the Ochtiná Aragonite Cave, Slovakia with terrestrial laser scanning and digital photogrammetry: High resolution phreatic and epiphreatic morphologies originated in slowly moving and standing water, and comparing the applicability of these methods. In Specific Irregular Surfaces: Laser Scanning and Structure from Motion Approach, 1st ed.; Pukanská, K., Blistan, P., Bartoš, K., Kovanič, Ľ., Eds.; Tribun EU s.r.o.: Brno, Czech Republic, 2020; pp. 96–116. [Google Scholar]
  14. Šupinský, J.; Kaňuk, J.; Hochmuth, Z.; Gallay, M. Detecting dynamics of cave floor ice with selective cloud-to-cloud approach. Cryosphere 2019, 13, 2835–2851. [Google Scholar] [CrossRef]
  15. Hochmuth, Z.; Šupinský, J.; Stankovič, J.; Halama, J.; Kaňuk, J. Dynamics of temperature changes in the Silická ľadnica cave (Slovak karst) and its influence on the ice accumulations. Aragonit 2020, 25, 42–43. [Google Scholar]
  16. Šupinský, J.; Nováková, M.; Gallay, M.; Kaňuk, J. Microclimatic and ice accumulation change monitoring in Silická ľadnica cave. In Proceedings of the 10th International Workshop on Ice Caves, Werfenweng, Austria, 12–18 May 2024; p. 39. [Google Scholar] [CrossRef]
  17. Shazali, N.; Chew, T.H.; Shamsir, M.S.; Tawie Tingga, R.C.H.; Mohd-Ridwan, A.R.; Anwarali Khan, F.A. Assessing Bat Roosts Using the LiDAR System at Wind Cave Nature Reserve in Sarawak. Acta Chiropterologica 2017, 19, 199–210. [Google Scholar] [CrossRef]
  18. Oludare Idrees, M.; Pradhan, B. A decade of modern cave surveying with Terrestrial Laser Scanning: A review of sensors, method and application development. Int. J. Speleol. 2016, 45, 71–88. [Google Scholar] [CrossRef]
  19. Persoiu, A.; Onac, B.P.; Wynn, J.G.; Bojar, A.-V.; Holmgren, K. Stable isotope behavior during cave ice formation by water freezing in Scărisoara Ice Cave, Romania. J. Geophys. Res. Atmos. 2011, 116, D02111. [Google Scholar] [CrossRef]
  20. Feurdean, A.; Persoiu, A.; Pazdur, A.; Onac, B.P. Evaluating the palaeoecological potential of pollen recovered from ice in caves: A case study from Scărisoara Ice Cave, Romania. Rev. Palaeobot. Palynol. 2011, 165, 1–10. [Google Scholar] [CrossRef]
  21. Petters, C.; Milius, J.; Buchroithner, M.F. Eisriesenwelt: Terrestrial laser scanning and 3D visualisation of the largest ice cave on Earth. In Proceedings of the European LiDAR Mapping Forum, Salzburg, Austria, 29–30 November 2011; pp. 1–10. [Google Scholar]
  22. Milius, J.; Petters, C. Eisriesenwelt -From laser scanning to photo-realistic 3D model of the biggest ice cave on Earth. In Proceedings of the GI-Forum 2012: Geovisualization, Society and Learning, Salzburg, Austria, 3–6 July 2012; Wichmann Verlag: Berlin, Germany, 2012; pp. 513–523. [Google Scholar]
  23. Gómez-Lende, M.; Berenguer, F.; Serrano, E. Morphology, ice types and thermal regime in a high mountain ice cave. First studies applying terrestrial laser scanner in the Peña Castil ice cave (Picos de Europa, northern Spain). Geogr. Fis. Din. Quat. 2014, 37, 141–150. [Google Scholar]
  24. Berenguer-Sempere, F.; Gómez-Lende, M.; Serrano, E.; de Sanjosé-Blasco, J.J. Orthothermographies and 3D models as potential tools in ice cave studies: The Peña Castil Ice Cave (Picos de Europa, Northern Spain). Int. J. Speleol. 2014, 43, 35–43. [Google Scholar] [CrossRef]
  25. Gómez-Lende, M.; Sánchez-Fernández, M. Cryomorphological topographies in the study of Ice Caves. Geosciences 2018, 8, 274. [Google Scholar] [CrossRef]
  26. Kamintzis, J.E.; Jones, J.P.; Irvine-Fynn, T.D.; Holt, T.O.; Bunting, P.; Jennings, S.J.; Porter, P.R.; Hubbard, B. Assessing the applicability of Terrestrial Laser Scanning for mapping Englacial Conduits. J. Glaciol. 2017, 64, 37–48. [Google Scholar] [CrossRef]
  27. Pfeiffer, J.; Rutzinger, M.; Spötl, C. Terrestrial laser scanning for 3D mapping of an alpine ice cave. Photogramm. Rec. 2023, 38, 6–21. [Google Scholar] [CrossRef] [PubMed]
  28. Blatnik, M.; Obu, J.; Košutnik, J.; Gabrovšek, F. Use of Terrestrial LiDAR Scanner for Monitoring of Ice Thickness in Ice Caves; Examples from Slovenia. In Proceedings of the EuroKarst 2022, Málaga, Spain, 22–25 June 2022. [Google Scholar] [CrossRef]
  29. Securo, A.; Forte, E.; Martinucci, D.; Pillon, S.; Colucci, R.R. Long-term mass-balance monitoring and evolution of ice in caves through structure from motion–multi-view stereo and ground-penetrating radar techniques. Prog. Phys. Geogr. Earth Environ. 2022, 46, 422–440. [Google Scholar] [CrossRef]
  30. Bartoš, K.; Pukanská, K.; Kseňak, Ľ.; Gašinec, J.; Bella, P. Cross-Polarized SfM Photogrammetry for the Spatial Reconstruction of Challenging Surfaces, the Case Study of Dobšiná Ice Cave (Slovakia). Remote Sens. 2023, 15, 4481. [Google Scholar] [CrossRef]
  31. Bella, P.; Tulis, J.; Zelinka, J.; Papáč, V.; Višňovská, Z.; Haviarová, D. Dobšiná Ice cave (Slovakia, central Europe) and its unique underground glacier originated in the mid-mountain position of the moderate climate zone. Aragonit 2020, 25, 4–16. [Google Scholar]
  32. Lalkovič, M. On the problems of the ice filling in the Dobšiná Ice Cave. Acta Carsol. 1995, 24, 313–322. [Google Scholar]
  33. Pelech, J.E. A Sztracenai Völgy és a Dobsinai Jégbarlang [The Stratená Valley and Dobšiná Ice Cave]. Külön-lenyomat a Magyarországi Kárpátegylet 1878, 5, 29. (In Hungarian) [Google Scholar]
  34. Pelech, J.E. Valley of Stracena and the Dobschau Ice-Cavern; Trubner & Co.: Ludgate Hill, London, 1879; p. 31. [Google Scholar]
  35. Pelech, J.E. Das Stracenaer Thal und die Dobschauer Eishöhle; Buchdruckerei des Franklin-Verein: Budapest, Hungary, 1884; p. 51. [Google Scholar]
  36. Droppa, A. Dobšinská Ľadová Jaskyňa [Dobšiná Ice Cave]; Šport: Bratislava, Slovakia, 1960; 115p, (In Slovak with Russian, German and French summary). [Google Scholar]
  37. Novotný, L.; Tulis, J. Výsledky najnovších výskumov v Dobšinskej ľadovej jaskyni. Slov. Kras 1996, 34, 139–147. [Google Scholar]
  38. Tulis, J. Výskum Dobšinskej ľadovej jaskyne. Aragonit 2001, 6, 4. [Google Scholar]
  39. Zelinka, J. Speleoklimatický a glaciologický výskum a monitoring od roku 1990. Aragonit 2009, 14, 104–109. [Google Scholar]
  40. Gašinec, J.; Gašincová, S.; Černota, P.; Staňková, H. Uses of Terrestrial Laser Sanning in Mnitoring of Ground Ice within Dobšinská Ice Cave. Inz. Miner. 2012, 13, 31–42. [Google Scholar]
  41. Herich, P. Mobile laser scanning in ice caves–preliminary results. Conference poster. In Proceedings of the 9th International Workshop on Ice Caves (IWIC–IX), Liptovský Mikuláš, Slovakia, 9–13 May 2022. [Google Scholar]
  42. Forbes. Available online: https://www.forbes.com/sites/sabbirrangwala/2020/11/12/the-iphone-12lidar-at-your-fingertips/?sh=5a4db3d43e28 (accessed on 6 August 2024).
  43. Geotech. Available online: https://www.geotech.sk/Produkty/Laserove-skenery-HDS/Leica-RTC360.html (accessed on 6 August 2024).
  44. 3gon Positioning. Available online: https://cz.3gon.eu/produkt/zeb-horizon (accessed on 6 August 2024).
  45. Geotech. Available online: https://www.geotech.sk/Produkty/Laserove-skenery-HDS/Leica-ScanStation-C10.html (accessed on 6 August 2024).
  46. Istores. Available online: https://www.istores.sk/produkt/iphone-14-pro-1-tb-temne-fialovy-2214586 (accessed on 6 August 2024).
  47. Gašinec, J.; Gašincová, S.; Gergeľová, M. Tvorba priestorového modelu Dobšinskej ľadovej jaskyne a jeho pripojenie na JTSK03. Geod. A Kartogr. Obz. 2012, 58, 221–223. [Google Scholar]
  48. Pukanská, K.; Bartoš, K.; Gašinec, J.; Pašteka, R.; Zahorec, P.; Papčo, J.; Kseňak, Ľ.; Bella, P.; Andrássy, E.; Dušeková, L.; et al. Measurement of spatio-temporal changes of cave ice using geodetic and geophysical methods: Dobšiná Ice Cave, Slovakia. Cryosphere Discuss. 2023, 2023, 1–29. [Google Scholar] [CrossRef]
  49. Leica Geosystems. Available online: https://leica-geosystems.com/products/laser-scanners/scanners/leica-rtc360/visual_inertial_system_technology (accessed on 6 August 2024).
  50. Available online: https://www.danielgm.net/cc/ (accessed on 8 October 2024).
  51. Available online: https://poly.cam/ (accessed on 8 October 2024).
  52. Smith, M.W.; Vericat, D. Evaluating shallow-water bathymetry from through-water terrestrial laser scanning under a range of hydraulic and physical water quality conditions. River Res. Appl. 2014, 30, 905–924. [Google Scholar] [CrossRef]
  53. Trzeciak, M.P.; Brilakis, I. Comparison of accuracy and density of static and mobile laser scanners. In Proceedings of the 2021 European Conference on Computing in Construction, Ixia, Rhodes, Greece, 25–27 July 2021. [Google Scholar] [CrossRef]
  54. Tondo, G.R.; Riley, C.; Morgenthal, G. Characterization of the iPhone LiDAR-Based Sensing System for Vibration Measurement and Modal Analysis. Sensors 2023, 23, 7832. [Google Scholar] [CrossRef]
  55. Warren, S.G. Optical properties of ice and snow. Philos. Trans. R. Soc. A 2019, 377, 20180161. [Google Scholar] [CrossRef] [PubMed]
  56. Pluta, P.; Siemek, D. Possibilities and limitations of using iPhone 13 Pro with built-in LiDAR sensor in cave research-on the example of paleoflow analysis in Mylna Cave (WesternTatra Mts, Poland). Landf. Anal. 2024, 42, 51–62. [Google Scholar] [CrossRef]
  57. Polycam Help Center. Available online: https://learn.poly.cam/hc/en-us/articles/27425185907348-Creating-Photogrammetry-Captures (accessed on 6 August 2024).
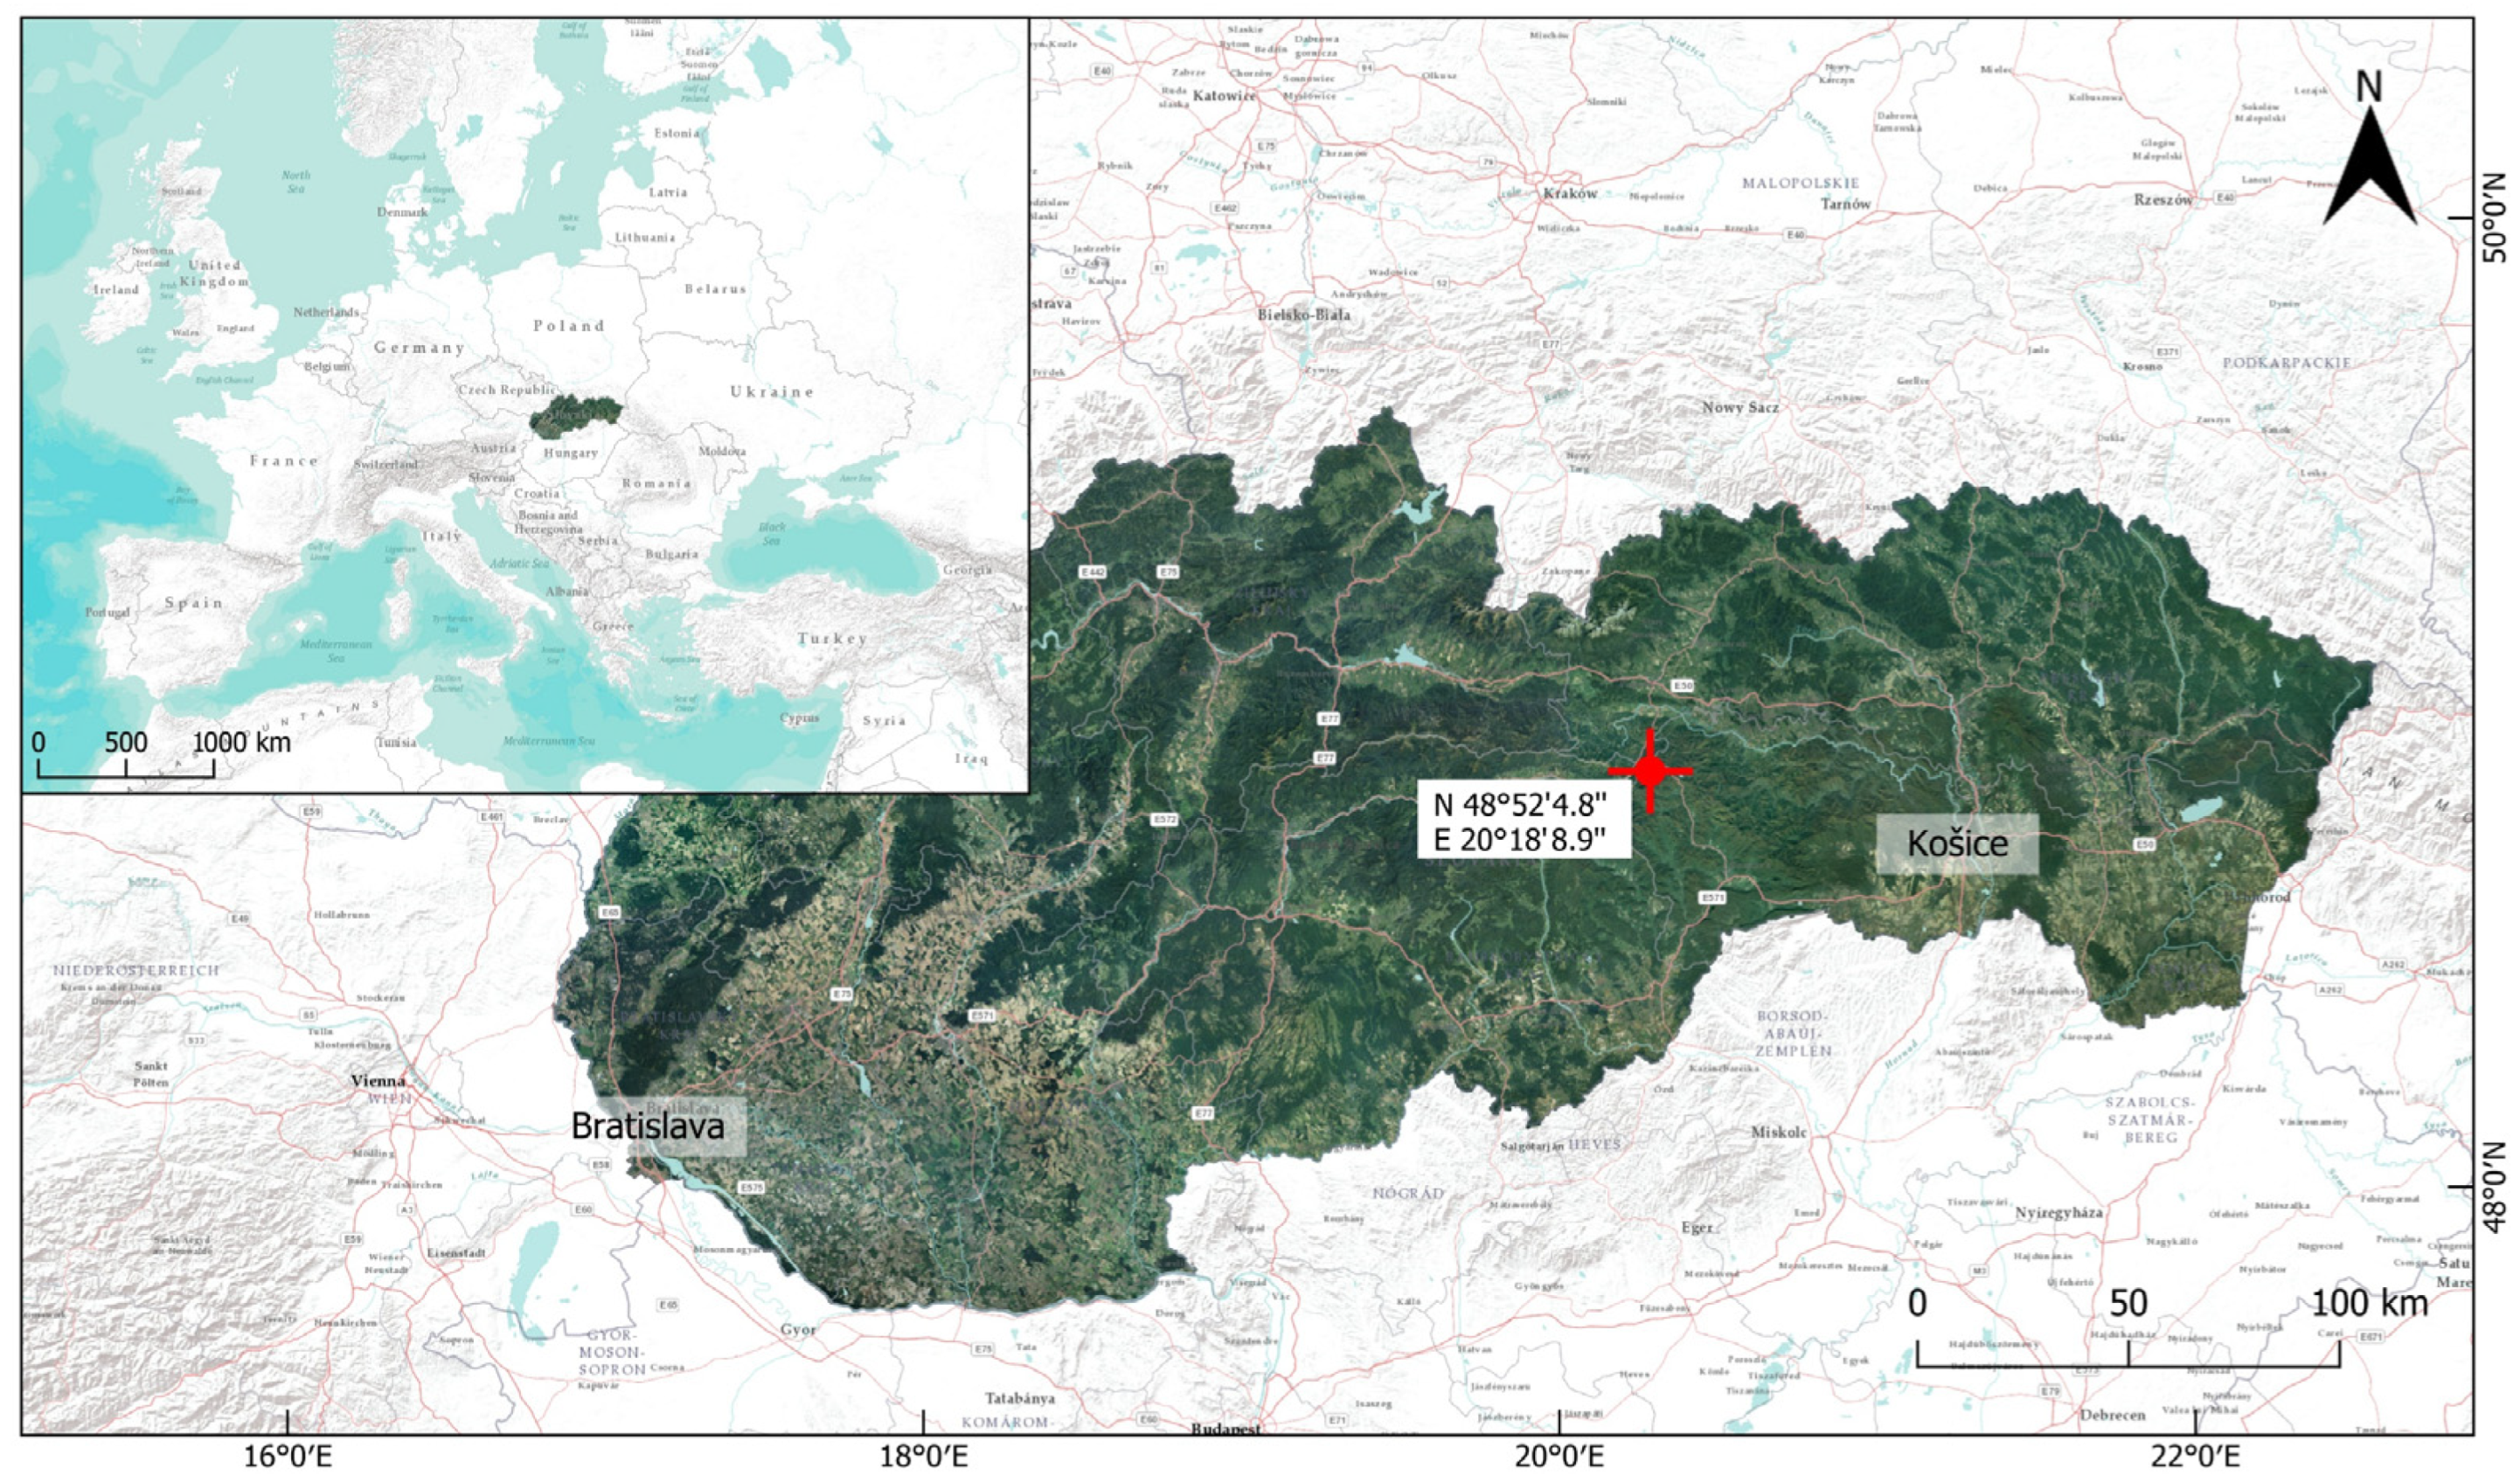
Figure 1. Location of Dobšiná Ice Cave [30].
Remotesensing 16 03870 g001
Figure 2. The horizontal ice with some stalagmites in the Small Hall (A), with dusty film, rocks, and also water area in the Collapsed Dome (B), the vertical ice wall on the left in the Ruffínyi’s Corridor (C), and the artificial ice tunnel (D).
Remotesensing 16 03870 g002
Figure 7. CS-B located in the Collapsed Dome (lower) with a detailed view between two points acquired by tacheometry (upper).
Remotesensing 16 03870 g007
Figure 8. The lines of cross-sections A (a–a*), B (b–b*), and C (c–c*) in the Ruffínyi’s Corridor shown on the reference point cloud from photogrammetry.
Remotesensing 16 03870 g008
Figure 9. The results of 3D scanning in Ruffínyi’s corridor coloured by the scale of roughness map with a local neighbourhood radius 0.2 m and with the point of view rotated 180° horizontally (the view “from the inside of ice”).
Remotesensing 16 03870 g009
Figure 10. Closer view to roughness map of the Leica RTC’s cloud with colour ramp focused on lower values with the view “from the inside of ice”.
Remotesensing 16 03870 g010
Figure 11. Side view of the CS-A in the Ruffínyi’s Corridor with detailed views of the interesting parts.
Remotesensing 16 03870 g011
Figure 12. CS-B in the Ruffínyi’s corridor with detailed views on the interesting parts.
Remotesensing 16 03870 g012
Figure 13. Top view of CS-C in the Ruffínyi’s corridor with a detail on the noisiest part with the water stream.
Remotesensing 16 03870 g013
Figure 14. The results of 3D scanning in the artificial ice tunnel coloured by the scale of roughness map with local neighbourhood radius from 0.15 to 0.3 based on assumed maximal values.
Remotesensing 16 03870 g014
Figure 15. The results of the photogrammetry as the reference base with the chosen cross-sections A and B.
Remotesensing 16 03870 g015
Figure 16. The cross-section A in the artificial ice tunnel.
Remotesensing 16 03870 g016
Figure 17. The cross-section B in the artificial ice tunnel.
Remotesensing 16 03870 g017
Table 1. Selected properties of the measurement technologies that were used [42,43,44,45,46].
Zeb HorizonLeica C10Leica RTC360iPhone 14 Pro
Remotesensing 16 03870 i001Remotesensing 16 03870 i002Remotesensing 16 03870 i003Remotesensing 16 03870 i004
Laser λ903 nm (invisible)532 nm (green)1550 nm (invisible)8XX nm (invisible)
Field of view360° × 270°360° × 270°360° × 300°61.1° × 47.8°
Range100 m300 m130 m5 m
Speed points/second300,00050,000Up to 2,000,000?
Accuracy angular (Vertical/Horizontal)2°/0.2°12″/12″18″ (3D)?
AccuracyRelative accuracy up to 6 mmPosition—6 mm
Distance—4 mm
Range accuracy 1.0 mm + 10 ppm?
Range noise±3 cm2 mm0.4 mm @ 10 m,
0.5 mm @ 20 m
?
IP54545468
Operating temperature/humidity0 °C to 40 °C0 °C to 40 °C−5 °C to 40 °C0 °C to 35 °C/
5 to 95% without condensation
Weight2.85 (1.45 kg scanner, 1.4 kg ogger + battery)13 kg (without battery)5.35 kg (without battery)206 g
SoftwareGeoSLAM Hub v6.2.1 + GeoSLAM Connect v2.3.0 + Cloud Compare v2.13Leica Cyclone v7.3 + Cloud Compare v2.13Cyclone FIELD 360 v5.0.0 and
Cyclone REGISTER 360 v2022.0
Polycam v3.4.0 + Cloud Compare v2.13
Table 2. Comparison of selected properties of point clouds of the horizontal ice in the Small Hall and the Collapsed Dome, some according to A and B cross-sections. Data in Zeb Horizon’s column are provided in some cases as results without filtration (w.f.) and after filtration (a.f.).
Small Hall (SH), Collapsed Dome (CD)Zeb HorizonLeica C10Leica RTC360
Duration of scanningA part of the trajectory: cca 6 min3 positions × 1 min11 positions × 30 s
Registration RMS [m]0.121max 0.006max 0.006
mean/max C2C distance [m]0.027/0.075 (CD)x0.021/0.121 (CD)
0.027/0.255 (SH)0.032/0.294 (SH)
Fine C2C registration RMS [m]0.043 (CD)x0.039 (CD)
0.051 (SH)0.050 (SH)
Number of pointsAw.f. 20,29537447146
a.f. 15,003
Bw.f. 16,076834940
a.f. 8648
Max thickness of a cloud (noise) [m]Aw.f. 0.170.050.07
a.f. 0.17
Bw.f. 0.09a point0.01
a.f. 0.06
Max depth of penetration [m]Aw.f. 0.11x/∞(water holes)0.07/∞(water holes)
a.f. 0.09
Bw.f. 0.18x/∞(water holes)0.018/∞(water holes)
a.f. 0.07
Mean/max C2C distance [m]Aa.f. 0.013/0.033x0.011/0.025
Ba.f. 0.020/0.031x0.011/0.013
Table 3. Comparison of selected properties of point clouds from the Ruffínyi’s Corridor, some according to A, B, and C cross-sections. Data in Zeb Horizon’s column are provided in some cases as a result without filtration (w.f.) and after filtration (a.f.).
Ruffínyi’s CorridorZeb HorizoniPhoneLeica C10Leica RTC360
Duration of scanningA part of a trajectory: cca 2 min2 trajectories: 6 + 7 min2 positions × 1 min6 positions × 30 s
Registration RMS [m]0.1210.040 (1st traj.)up to 0.006up to 0.006
0.032 (2nd traj.)
Mean/max C2C distance [m]0.027/0.2610.049/0.324 (1st traj.)X0.010/0.080
0.015/0.106 (2nd traj.)
Fine C2C registration RMS [m]0.0520.056 (1st traj.)X0.052
0.051 (2nd traj.)
Number of pointsAw.f. 37,10124,041271591,047
a.f. 15,602
Bw.f. 4117/2188446824011,470
Cw.f. 2882/14812986394284
Max thickness of a cloud (noise [m])Aw.f. 0.06a point/?0.030.008
a.f. 0.04
Bw.f. 0.1a point/?0.020.015
a.f. 0.05
Cw.f. 0.19a point/?0.130.04
a.f. 0.06
Max depth of penetration [m]Aw.f. 0.150.005min. 0.20.015
a.f. 0.02
Bw.f. 0.090.02X0.05
a.f. 0.03
Cw.f. 0.080.03X0.03
a.f. 0.05
Mean/max C2C distance [m]Aa.f. 0.012/0.0340.006/0.028X0.010/0.131
Ba.f. 0.013/0.0470.010/0.043X0.022/0.046
Ca.f. 0.009/0.0490.012/0.056X0.006/0.043
Table 4. Comparison of selected properties of point clouds from the artificial ice tunnel, some according to A and B cross-sections. Data in Zeb Horizon’s column are provided in some cases as a result without filtration (w.f.) and after filtration (a.f.).
Ice TunnelZeb HorizonIphoneLeica C10Leica RTC360
Duration of scanningA part of the 2 trajectories: cca 20 s1 trajectory: 12 min2 positions × 1 min4 positions × 30 s
Registration RMS [m]0.1119 (1st traj.)0.095up to 0.006 up to 0.006
0.1211 (2nd traj.)
Mean/max C2C distance [m]0.0856/0.4280.039/0.345X0.035/0.384
Fine C2C registration RMS [m]0.03900.0527X0.0362
Number of pointsAw.f. 53882906927431,647
a.f. 2427
Bw.f. 86056547192120,958
a.f. 4171
Max thickness of a cloud (noise [m])Aw.f. 0.09a point/?0.150.025
a.f. 0.05
Bw.f. 0.18a point/?0.130.03
a.f. 0.08
Max depth of penetration [m]Aw.f. 0.100.090.600.03
a.f. 0.05
Bw.f. 0.130.080.170.04
a.f. 0.05
Mean/max C2C distance [m]Aa.f. 0.010/0.0460.061/0.090X0.008/0.029
Ba.f. 0.014/0.0750.032/0.078X0.008/0.041
Disclaimer/Publisher’s Note: The statements, opinions and data contained in all publications are solely those of the individual author(s) and contributor(s) and not of MDPI and/or the editor(s). MDPI and/or the editor(s) disclaim responsibility for any injury to people or property resulting from any ideas, methods, instructions or products referred to in the content.