Abstract
Sparse synthetic aperture radar (SAR) imaging has demonstrated excellent potential in image quality improvement and data compression. However, conventional observation matrix-based methods suffer from high computational overhead, which is hard to use for real data processing. The approximated observation sparse SAR imaging method relieves the computation pressure, but it needs to manually set the parameters to solve the optimization problem. Thus, several deep learning (DL) SAR imaging methods have been used for scene recovery, but many of them employ dual-path networks. To better leverage the complex-valued characteristics of echo data, in this paper, we present a novel complex-valued convolutional neural network (CNN)-based approximated observation sparse SAR imaging method, which is a single-path DL network. Firstly, we present the approximated observation-based model via the chirp-scaling algorithm (CSA). Next, we map the process of the iterative soft thresholding (IST) algorithm into the deep network form, and design the symmetric complex-valued CNN block to achieve the sparse recovery of large-scale scenes. In comparison to matched filtering (MF), the approximated observation sparse imaging method, and the existing DL SAR imaging methods, our complex-valued network model shows excellent performance in image quality improvement especially when the used data are down-sampled.
1. Introduction
Recently, sparse synthetic aperture radar (SAR) imaging methods have achieved remarkable progress in image quality improvement, unambiguous reconstruction, and radar system simplification [1,2,3]. In 2007, Baraniuk and Steeghs stated that compressive sensing (CS) can replace matched filtering (MF) and reduce the required sampling rate at the receiver [4]. In 2010, Patel and colleagues introduced a new SAR imaging technique in the spotlight mode, which can provide a high-resolution reconstruction of the targets using significantly reduced data [5]. Then, Jiang et al. stated an innovative sparse imaging approach for directly processing the spaceborne SAR echo [6]. However, sparse SAR imaging algorithms based on exact observation matrix increase the computational complexity, which limits its application in the fast reconstruction of broad-scale scenes. To address this issue, Fang et al. formulated a new approximated observation-based SAR imaging method, which saves the computational costs in both time and memory [7]. In 2019, Bi et al. presented a frequency modulation continuous wave (FMCW) SAR sparse imaging method deducted from the wavenumber domain algorithm (WDA) [8]. This method compensates for the motion error in practical airborne SAR data, thereby achieving large-scale sparse imaging if the radar velocity is steady. Furthermore, Bi and co-authors introduced a novel real-time sparse SAR imaging method that reduces the sparse recovery time to a level comparable to MF [9]. With the advancement in sparse SAR imaging technology, CS theory has been applied to the fields of three-dimensional (3-D) SAR [10,11] and inverse SAR (ISAR) imaging [12].
Nevertheless, CS-based SAR imaging algorithms still suffer from some issues, such as time-consuming iterative operations and optimal parameter selection, which hinder their further applications. Deep learning (DL) excels in feature learning and representation, providing a novel solution for addressing the challenges in sparse imaging. In 2017, Chierchia and co-authors applied convolutional neural networks (CNNs) to SAR image despeckling for the first time [13]. In the same year, Mousavi and Baraniuk developed a network called DeepInverse, which innovatively applied deep convolutional networks to sparse signal reconstruction [14]. In 2019, Gao and co-authors developed a radar imaging network employing complex-valued CNN, which was utilized to increase the imaging performance [15]. In 2020, Rittenbach and Walters presented an integrated SAR processing pipeline, which can map echo data to SAR images directly [16]. The deep neural network, RDAnet, performs SAR imaging and SAR image processing, ultimately achieving imaging performance comparable to the range Doppler algorithm (RDA). In 2021, Pu derived an auto-encoder model-based deep SAR imaging algorithm, and introduced a motion compensation scheme to eliminate errors [17]. In 2023, Meraoumia et al. proposed a self-supervised training strategy for single-look complex (SLC) images, named MERLIN, aimed at improving multitemporal filtering [18]. Lin et al. proposed a dynamic residual-in-residual scaling network for polarimetric SAR (PolSAR) image despeckling. Compared with traditional methods, this network is more computationally efficient and better preserves the image details [19].
However, the above methods treat the network as a “black box”, which can bypass the optimal hyperparameter selection but lacks interpretable characteristics. Zhang and Ghanem developed ISTA-Net, a structured deep network for the CS reconstruction of SAR images, which converts the iterative soft thresholding (IST) algorithm into the deep network form [20]. On this basis, Yonel et al. presented a DL framework for passive SAR image reconstruction, which outperforms traditional sparse algorithms in both computational cost and recovered image quality [21]. In 2022, Zhang et al. proposed a proximal mapping model, named sparse representation-based ISTA-Net (SR-ISTA-Net), and applied it to the recovery of nonsparse scenes [22]. The SR-ISTA-Net is based on the one-dimensional (1-D) exact observation matrix, in which echoes and scene backscattering are expressed as vectors, making the storage and computing burden excessive. To overcome these shortcomings, Kang and colleagues introduced an innovative approximated observation-based SAR imaging net, which employs the range Doppler algorithm to construct the echo simulation operator, and achieves high-quality recovery of the surveillance area based on the DL imaging model [23]. Similarly, the deep network form of alternating direction method of multipliers (ADMM) has been implemented in SAR imaging. In 2021, Wei et al. casted multicomponent ADMM (MC-ADMM) into the deep network form, i.e., the parametric super-resolution imaging network (PSRI-Net), which obtains high-quality SAR images through end-to-end learning [24]. In 2022, Li et al. established a target-oriented SAR imaging model by unfolding the ADMM-based solution process, which improves the signal-to-clutter ratio (SCR) of the target [25]. Since the CNN module is not used for sparse representation, the above methods are not competent for nonsparse scene reconstruction. Then, Zhang et al. formulated a DL-based approximated observation SAR imaging method via the chirp-scaling algorithm (CSA) [26]. It has a dual-path CNN block in the nonlinearity module to enhance the sparse representation capability. In addition, sparse SAR imaging techniques based on deep unfolded network (DUN) have been widely used in fields such as SAR tomography (TomoSAR) [27,28] and ISAR [29], due to their enhanced reconstruction capabilities and efficiency.
Although the above-mentioned DL-based SAR imaging methods address the limitations of sparse data processing, they all employ path networks, which inevitably increases the complexity of the imaging model. This paper introduces a new complex-valued CNN-based two-dimensional (2-D) sparse SAR imaging method. Our complex-valued network firstly constructs an approximated observation-based imaging model using the CSA. Then, the IST algorithm is utilized to address the -norm regularization problem, and the problem solving procedure is mapped into a deep network form. Finally, a single-path complex-valued CNN block is constructed to increase the imaging performance. Compared with conventional approximated observation-based sparse imaging algorithms and existing DL SAR imaging networks, our imaging method shows superiority and robustness in scene reconstruction from both full- and down-sampled data.
The rest of this paper is structured as follows. Section 2 provides a brief introduction to the exact observation and approximated observation-based sparse SAR imaging models. In Section 3, our imaging network is introduced in detail, from the imaging model, the network structure, to the loss function. The experimental results based on the surface target and real scenes are provided in Section 4. Finally, conclusions are drawn in Section 5.
2. Sparse SAR Imaging
2.1. Sparse SAR Imaging-Based 1-D Observation Matrix
In this study, we adopt the airborne SAR imaging geometry depicted in Figure 1. It is assumed that the radar beam footprint has pixels in azimuth and pixels in range, denotes the 2-D backscattering coefficient matrix, and denotes the 2-D echo matrix. Next, with represents the backscattering coefficient vector. Similarly, with . Considering the down-sampling processing of echo data, the exact observation-based sparse SAR reconstruction model can be formulated as [5]
where is the sampling matrix, is the observation matrix, and is the system measurement matrix. When the considered scene is sparse enough and satisfies the restricted isometry property (RIP) condition, we achieve sparse imaging by solving [9]
where is the regularization parameter, and is the reconstructed 1-D backscattering coefficient.
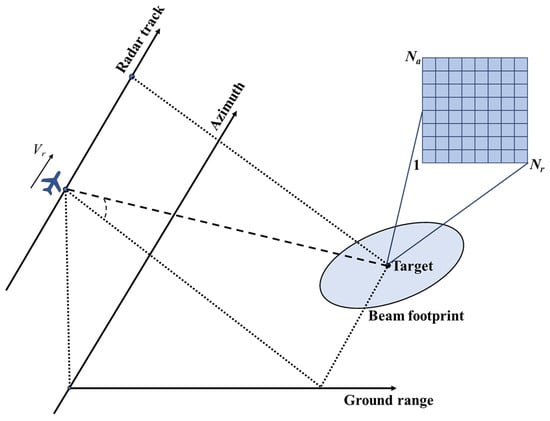
Figure 1.
SAR imaging geometry.
2.2. Sparse SAR Imaging-Based 2-D Observation Matrix
The approximated observation-based sparse SAR imaging model can be expressed as [1,7,9]
where is the noise matrix, ∘ is the Hadamard product operator, and and are the azimuth and range down-sampling matrices, respectively. Let denote the imaging process of the MF SAR imaging algorithm, like CSA used in this paper, and represent the inverse process of , named the echo simulation operator. The operators and can be defined as [30]
where and are the azimuth and range fast Fourier transform (FFT) matrices, respectively, and are the azimuth and range inverse FFT matrices, is the conjugate transpose operator, is the chirp scaling operator, is the phase matrix used for the range compression and consistent range correction, and is the phase matrix used for the azimuth compression and residual phase compensation. Then, the 2-D scene of interest is recovered by addressing the -norm regularization issue [9]
where denotes the scene of interest for reconstruction.
3. Complex-Valued Network-Based Approximated Observation Sparse SAR Imaging
3.1. Complex-Valued Network Structure
There are several algorithms used to address the -norm optimization issue, such as IST, ADMM [31], complex approximated message passing (CAMP) [32], and BiIST [33]. In this study, IST is selected to tackle the optimization issue presented in (6), whose iteration is among the following update steps
where denotes the 2-D linear reconstruction result in the k-th iteration, k denotes the IST iteration index, represents the step size, and denotes the threshold. However, IST requires multiple iterations to converge, with all parameters including and being pre-defined, which makes it difficult to adjust the prior information. Therefore, we map the update steps of IST to a deep network structure consisting of a fixed number of stages, each corresponding to an iteration in IST. In addition, considering that real scenes and their transformation domain results may not exhibit sparsity, we exploit CNNs to obtain a sparse representation of the data. In recent years, complex-valued neural networks have shown their effectiveness in image classification, speech spectrum prediction, and other applications [34]. Both the input echo and the output image for SAR imaging are 2-D complex matrices. Therefore, in order to effectively extract the complex-valued features, we choose a complex-valued neural network, which is represented by , whose parameters are learnable. Then, the scene imaging of the complex-valued network can be divided into linear module R and nonlinear module N, which is written as
where is the reconstructed 2-D scene, and are the adaptive step size and the threshold in the k-th phase, respectively, and is structured to be symmetric to . Specifically, can be formulated as
where is the complex-valued convolution operation, which uses filters (each of size in the experiments of this paper). This operation aims to convert a single-channel input into channel outputs, and is another set of filters. Assume that is a complex-valued convolution matrix, is a complex-valued image, and let . Thus, the complex-valued convolution operation can be expressed as [34]
Next, is the complex-valued batch normalization (BN) operation [34], which is defined as
with
where x is the input, is the bias parameter with two trainable elements (the real and imaginary parts), and is the scaling parameter with three trainable elements. Then, is the complex-valued activation function, which can be expressed as [34]
Therefore, the structure of our complex-valued network-based approximated observation sparse SAR imaging model is depicted in Figure 2.
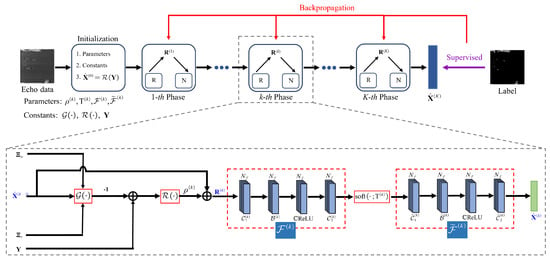
Figure 2.
Network structure of our imaging method.
3.2. Loss Function Design
The training process for the complex-valued network involves updating the learnable parameters to minimize the loss function. In order to satisfy the symmetry constraints , we adopt a loss function including the reconstruction error and the symmetry constraint error to design a novel total loss function, i.e.,
with
where is the linear reconstruction result in the k-th phase corresponding to the m-th training sample; and are the reconstructed result and label for the m-th training sample; ; M is the total number of training samples; and is a weighting factor.
3.3. Complex-Valued Network Analysis
The detailed workflow of the constructed complex-valued network is illustrated in Figure 3, which takes 2-D echo data as input and outputs a 2-D SAR image. The primary innovation of this paper lies in the single-path network structure, which includes linear modules (denoted as R), nonlinear modules (denoted as N), and loss functions. Different from the dual-path linear module of CSA-Net and SR-CSA-Net, the proposed complex-valued network employs a single-path linear module to simplify the imaging model. The nonlinear module of the model includes complex-valued convolution, complex-valued batch normalization (BN), and complex-valued activation function, which treats the complex data as an entirety. is a learnable element set of the proposed method, where K is the total number of complex-valued network phases. Then, we optimize the learnable parameter set through supervised learning. It should be noted that trainable parameters across different phases are not shared. The number of learnable parameters in complex-valued CNN modules and is the same as . Subsequently, the total number of learnable parameters in the designed complex-valued network can be written as
Figure 3.
Complex-valued network workflow.
4. Experiments Based on Surface Target
The experiments using simulated data are conducted to verify the designed complex-valued network. Experimental parameters are shown in Table 1. All experiments are performed in the PyTorch framework with the Adam optimizer and are accelerated by an NVIDIA GeForce RTX 4090 GPU. The surface target simulated scene, which is the label of this part, is illustrated in Figure 4. During dataset generation, the full-sampled echo data are collected firstly. We then add some noise with a signal-to-noise ratio (SNR) randomly distributed between −10 dB and 35 dB to the collected echoes, and perform the down-sampling for the data to create the used simulated dataset. The down-sampling ratio (DSR) is randomly varied between 0.36 and 1. A total of 1600 simulated echoes with known imaging geometries and parameters are generated, of which 1280 are used for training and 320 for testing.

Table 1.
Simulated Parameters.
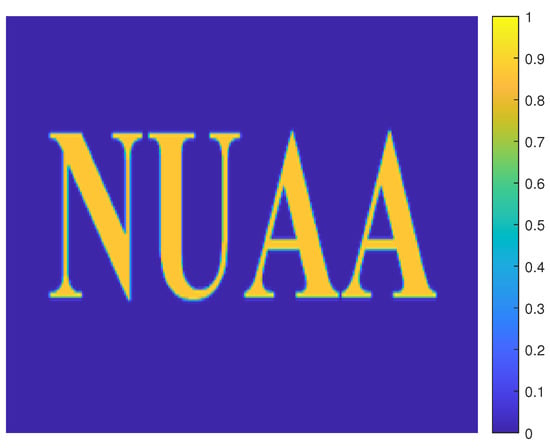
Figure 4.
Surface target simulated scene. Horizontal axis is range direction.
4.1. Anti-Noise Simulations
To explore the influence of SNR, full-sampled echoes with different SNRs are applied to CSA, an approximated observation-based sparse SAR imaging method (-De) [9], CSA-Net [26], SR-CSA-Net [26], and our complex-valued network model. Figure 5 shows the recovered images of five different SAR imaging methods from full-sampled data under different SNRs. Due to the limited noise immunity of CSA, the target scene will be overwhelmed by noise at a low SNR. In contrast, -De and CSA-Net have a certain anti-noise ability, but cannot maintain the backscattering coefficient of the target at low SNRs. However, SR-CSA-Net and our complex-valued network can reconstruct the backscattering coefficient of the target while suppressing noise. When SNR is −5 dB, the recovered image of the proposed method has a clearer outline than the SR-CSA-Net-based result (see Figure 5s,t).
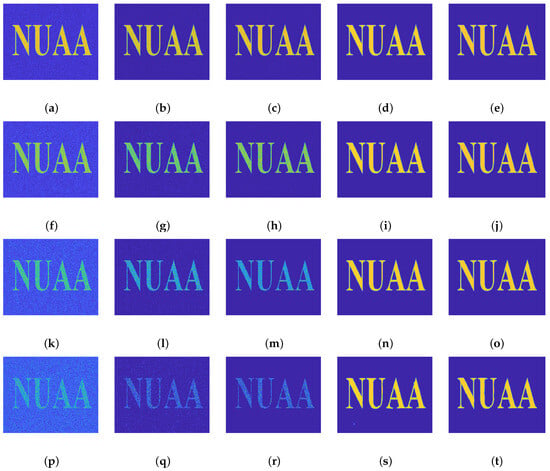
Figure 5.
Recovered images of surface target from full-sampled echo by (from left to right column) (a,f,k,p) CSA, (b,g,l,q) -De, (c,h,m,r) CSA-Net, (d,i,n,s) SR-CSA-Net, and (e,j,o,t) our complex-valued network, respectively. From top to bottom row, the SNRs are 10 dB, 5 dB, 0 dB, and −5 dB, respectively.
In addition, the normalized mean square error (NMSE) and peak SNR (PSNR) are used to quantitatively assess the performance of different methods. The NMSE is formulated as
where is the recovered result, and represents the label. Then, the PSNR can be expressed as
with
where is the mean square error between the reconstructed result and the label, is the maximum pixel value of the image, which is 255 in this paper. A smaller NMSE indicates that the reconstructed result is closer to the label, which reflects better imaging performance. The PSNR represents the similarity and distortion between the recovered image and the label.
The average values of the quantitative indicators obtained by 100 Monte Carlo simulations are shown in Table 2. CSA, as a more traditional SAR imaging method, does not use optimization or DL techniques. Therefore, its NMSE and PSNR performance results are the worst among all methods. It is seen that compared with -De, CSA-Net has lower NMSE and higher PSNR values in each case due to the optimal parameters obtained by training. Table 2 verifies that SR-CSA-Net and our complex-valued network significantly outperform the other methods. Our complex-valued network consistently shows the lowest NMSE values and the highest PSNR values, indicating its effectiveness in suppressing noise and preserving important image features, even under challenging conditions.

Table 2.
Performance comparison with different SNRs.
4.2. Simulations Based on Down-Sampled Data
Then, we study the effect of different DSRs on the recovered image quality. To preserve generality, we add an additional 25 dB of white Gaussian noise to the collected echo. The reconstructed results of five SAR imaging methods under different DSRs are shown in Figure 6. It is seen that affected by the down-sampling, the CSA-based results have obvious energy dispersion and a defocusing phenomenon in both the azimuth and range directions. When DSR = 0.72 and DSR = 0.49, both -De and CSA-Net are capable of reconstructing the simulated scene using the down-sampled echoes. However, they do not perform well at low DSRs, especially in the precise recovery of target scattering intensity. SR-CSA-Net can recover target scattering intensity but cannot eliminate the ambiguity phenomenon caused by the data down-sampling. For the proposed method, it achieves well-focused images in all cases.
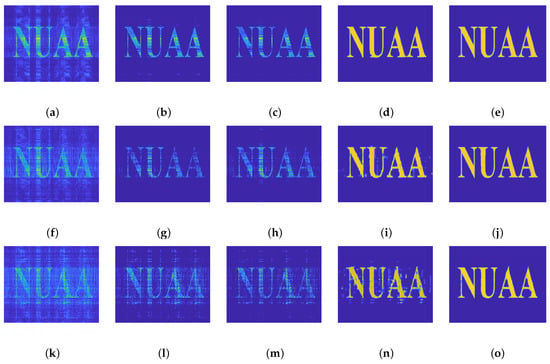
Figure 6.
Recovered images of surface target from down-sampled echo by (a,f,k) CSA, (b,g,l) -De, (c,h,m) CSA-Net, (d,i,n) SR-CSA-Net, and (e,j,o) our complex-valued network, respectively. From top to bottom row, the DSRs are 72%, 49%, and 36%, respectively.
The average values of the quantitative indicators of the recovered images in Figure 6 are shown in Table 3. The quantitative metrics of CSA, -De, and CSA-Net are significantly declined by down-sampling. Therefore, for scenes with lower sparsity, the optimization technique struggles with accurate reconstruction from the incomplete data. Compared with CSA-Net, SR-CSA-Net further advances the performance of SAR imaging by incorporating CNN modules. Even at lower DSRs, SR-CSA-Net maintains relatively high reconstruction quality. The results show that although the imaging performance of our complex-valued network decreases with the decrease in DSR, it achieves the optimal NMSE and PSNR values in all test scenarios. Since the surface target simulated scene is fixed, the required computational time is approximately under different DSRs. It is seen that compared with -De, the imaging time of three SAR imaging networks is closer to that of CSA. Among these three networks, CSA-Net has the shortest computation time attributed to the absence of sparse representation modules. Under down-sampled cases, our complex-valued network offers a compelling balance of accuracy and efficiency, making it suitable for the sparse imaging of broad-scale scenes.

Table 3.
Performance comparison with different down-sampling ratios.
4.3. Comparative Experiments
To further show the superiority of our complex-valued network, the comparative experiments are presented in this part. Figure 7 illustrates the average PSNR curves at different phases and epochs when the DSR is 0.72. It is found that the average PSNR curves initially increase with the number of phases and then plateaus. Clearly, when K is set to 7, SR-CSA-Net improves the PSNR by nearly 15 dB over CSA-Net, and the proposed method achieves about 4 dB additional gain over SR-CSA-Net. Figure 7b indicates that SR-CSA-Net and the proposed method obtain higher PSNR as the number of training epochs increases. Moreover, the proposed method demonstrates superior performance upon training convergence. In summary, the symmetric neural network modules used in SR-CSA-Net and our method significantly enhance the performance of sparse SAR imaging. In addition, balancing network complexity with reconstruction performance, we set and the default epoch to 150, which provide optimal convergence.
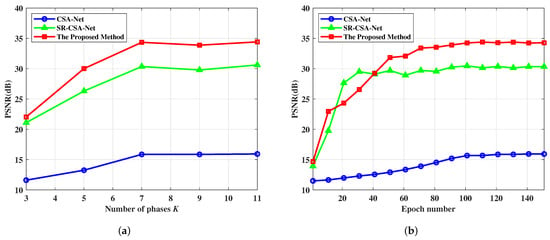
Figure 7.
PSNR comparison of three SAR imaging networks with various numbers of (a) phases and (b) epochs.
5. Experiments Based on SSDD Dataset
In this section, we use the Open SAR Ship Detection Dataset (SSDD) to prove the feasibility of our complex-valued network in a real scene [35]. The SSDD contains 1160 images, 928 of which are used for training. Firstly, the scenes in SSDD are cut into the size of for experiments. Next, to preserve the target’s scattering characteristics while minimizing background noise and clutter, we apply the maximum connection domain algorithm to obtain a suitable mask for each SAR image. It is worth noting that the mask assigns the target value to 1 and the background value to 0, using the mask to multiply the original real scene to obtain the training label as illustrated in Figure 8. Lastly, the dataset is created in a similar way to the previous simulation, with the only difference being that the images in SSDD already contain noise. The experimental parameters and environment are consistent with Section 4. In addition, the training parameters, including the epoch number and the initial parameter values, are set identically for the three SAR imaging networks.

Figure 8.
The process of the real scene label. (a) Original SAR image after cropping. (b) Mask obtained by the maximum connection domain algorithm. (c) Label of real scene.
Figure 9 and Figure 10 display the recovered images of two different scenes indexed 724 and 751 in SSDD by CSA, -De, CSA-Net, SR-CSA-Net, and the proposed method, respectively (the horizontal axis is the range direction). For full-sampled echoes, compared with CSA, the other four methods can productively suppress noise in the SAR images. However, both -De and CSA-Net also inadvertently suppress some target points and their scattering intensities. At a high down-sampling ratio with DSR = 72%, -De and CSA-Net can restrain the energy dispersion and achieve acceptable recovered images. When DSR is decreased to 0.49, it is evident that -De and CSA-Net are no longer competent for image recovery. SR-CSA-Net is capable of suppressing the ambiguity phenomenon while preserving the original scattering intensity of the real scene. But as the down-sampling ratio decreases, the contours of its recovered images become blurred. Furthermore, the recovered images of our complex-valued network have less noise and clearer edges than the other four methods.
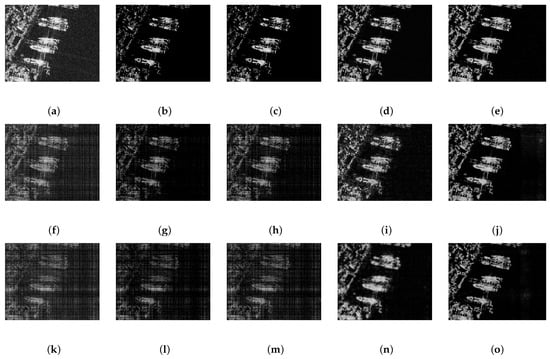
Figure 9.
Recovered images of real scene 1 from down-sampled data by (a,f,k) CSA, (b,g,l) -De, (c,h,m) CSA-Net, (d,i,n) SR-CSA-Net, and (e,j,o) our complex-valued network, respectively. From top to bottom column, the DSRs are 100%, 72%, and 49%, respectively.
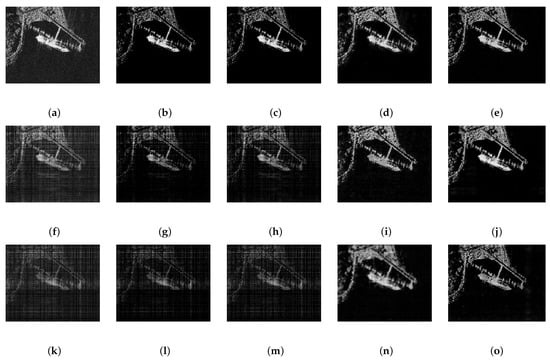
Figure 10.
Recovered images of real scene 2 from down-sampled data by (a,f,k) CSA, (b,g,l) -De, (c,h,m) CSA-Net, (d,i,n) SR-CSA-Net, and (e,j,o) our complex-valued network, respectively. From top to bottom column, the DSRs are 100%, 72%, and 49%, respectively.
The average values of the quantitative indicators of the recovered images are shown Table 4 and Table 5. In the real scene experiments, CSA has the shortest computation time, which is only 3 ms, while -De has the longest computation time. It is seen that compared with -De, the three networks not only exhibit better imaging performance but also meet the real-time imaging requirement. Moreover, CSA-Net and -De are seriously affected by down-sampling, with their quantitative indicators gradually approaching CSA as the DSR decreases. Table 4 indicates that the proposed method achieves approximately 2 dB and 6 dB gains over SR-CSA-Net and CSA-Net, respectively. In conclusion, our complex-valued network shows the optimal performance in the real scene reconstruction from both full- and down-sampled data.

Table 4.
Performance comparison of real scene 1 with different down-sampling ratios.

Table 5.
Performance comparison of real scene 2 with different down-sampling ratios.
6. Conclusions
We develop a new complex-valued CNN-based approximated observation sparse SAR imaging method. The typical approximated observation-based sparse imaging method is time-consuming due to multiple iterative operations, and it is challenging to obtain the optimal parameters. Therefore, we map the IST algorithm into a deep network form, i.e., single-path complex-valued CNN, to decrease the number of iterations. Extensive experiments show that our complex-valued network achieves accurate sparse reconstruction of the considered scene from both full- and down-sampled echoes. Compared with CSA, -De, CSA-Net, and SR-CSA-Net, our complex-valued network shows better performance in SAR imaging quality improvement, especially in the down-sampling cases. In addition, it further reduces the computational time for sparse imaging to a level comparable to that of the MF-based methods.
Since the proposed network for solving the -norm regularization problem associated with sparse representation is very common and effective, a future research orientation is to build deep networks using other optimization algorithms, like CAMP [32] and BiIST [33]. Additionally, the proposed method only considers the side-look SAR imaging mode of static targets. In future work, we will further develop SAR imaging networks for moving targets under high-squint conditions.
Author Contributions
Conceptualization was done by H.B.; Z.J. and L.L. developed the methodology; validation was conducted by Z.J. and L.L.; Z.J. and L.L. prepared the original draft; H.B. performed the review and editing. All authors have read and agreed to the published version of the manuscript.
Funding
This work was supported in part by the National Natural Science Foundation of China under Grant 62271248, in part by the Natural Science Foundation of Jiangsu Province under Grant BK20230090, and in part by the Key Laboratory of Land Satellite Remote Sensing Application, Ministry of Natural Resources of China under Grant KLSMNR-K202303.
Data Availability Statement
The real scene image used in this study is the SSDD dataset, which can be found at https://drive.google.com/file/d/1glNJUGotrbEyk43twwB9556AdngJsynZ/view?usp=sharing (accessed on 14 October 2024).
Conflicts of Interest
The authors declare no conflicts of interest.
Abbreviations
The following abbreviations are used in this paper:
| SAR | Synthetic Aperture Radar |
| ISAR | Inverse SAR |
| PolSAR | Polarimetric SAR |
| TomoSAR | SAR tomography |
| DL | Deep Learning |
| IST | Iterative Soft Thresholding |
| CNN | Convolutional Neural Network |
| PSRI-Net | Parametric Super-Resolution Imaging Network |
| CSA | Chirp-scaling algorithm |
| MF | Matched Filtering |
| CS | Compressive Sensing |
| FMCW | Frequency Modulation Continuous Wave |
| WDA | Wavenumber Domain Algorithm |
| SLC | Single-Look Complex |
| SR-IST-Net | Sparse Representation-based ISTA-Net |
| RDA | Range Doppler Algorithm |
| ADMM | Alternating Direction Method of Multipliers |
| BN | Batch Normalization |
| MC-ADMM | Multicomponent ADMM |
| SCR | Signal-to-Clutter Ratio |
| 1-D | One-dimensional |
| RIP | Restricted Isometry Property |
| 2-D | Two-dimensional |
| CAMP | Complex Approximated Message Passing |
| ReLU | Rectified Linear Unit |
| 3-D | Three-dimensional |
| SNR | Signal-to-Noise Ratio |
| C-R | Cauchy–Riemann |
| DSR | Down-Sampling Ratio |
| NMSE | Normalized Mean Square Error |
| PSNR | Peak SNR |
| SSDD | Open SAR Ship Detection Dataset |
References
- Zhang, B.; Hong, W.; Wu, Y. Sparse microwave imaging: Principles and applications. Sci. China Inf. Sci. 2012, 55, 1722–1754. [Google Scholar] [CrossRef]
- Donoho, D. Compressed sensing. IEEE Trans. Inform. Theory 2006, 52, 1289–1306. [Google Scholar] [CrossRef]
- Wu, Y.; Hong, W.; Zhang, B.; Jiang, C.; Zhang, Z.; Zhao, Y. Current developments of sparse microwave imaging. J. Radars 2014, 3, 383–395. [Google Scholar] [CrossRef]
- Baraniuk, R.; Steeghs, P. Compressive radar imaging. In Proceedings of the 2007 IEEE Radar Conference, Waltham, MA, USA, 17–20 April 2007; pp. 128–133. [Google Scholar]
- Patel, V.; Easley, G.; Healy, D.; Chellappa, R. Compressed synthetic aperture radar. IEEE J. Sel. Topics Signal Process. 2010, 4, 244–254. [Google Scholar] [CrossRef]
- Jiang, C.; Zhang, B.; Zhang, Z.; Hong, W.; Wu, Y. Experimental results and analysis of sparse microwave imaging from spaceborne radar raw data. Sci. China Inf. Sci. 2012, 55, 1801–1815. [Google Scholar] [CrossRef][Green Version]
- Fang, J.; Xu, Z.; Zhang, B.; Hong, W.; Wu, Y. Fast compressed sensing SAR imaging based on approximated observation. IEEE J. Sel. Top. Appl. Earth Obs. Remote Sens. 2014, 7, 352–363. [Google Scholar] [CrossRef]
- Bi, H.; Wang, J.; Bi, G. Wavenumber domain algorithm-based FMCW SAR sparse imaging. IEEE Trans. Geosci. Remote Sens. 2019, 57, 7466–7475. [Google Scholar] [CrossRef]
- Bi, H.; Bi, G.; Zhang, B.; Hong, W.; Wu, Y. From theory to application: Real-time sparse SAR imaging. IEEE Trans. Geosci. Remote Sens. 2020, 58, 2928–2936. [Google Scholar] [CrossRef]
- Wang, Y.; Qian, K.; Zhu, X. Efficient SAR tomographic inversion via sparse bayesian learning. In Proceedings of the 2021 IEEE International Geoscience and Remote Sensing Symposium (IGASS), Brussels, Belgium, 12–16 July 2021; pp. 4830–4832. [Google Scholar]
- Zhang, S.; Dong, G.; Kuang, G. Matrix completion for downward-looking 3-D SAR imaging with a random sparse linear array. IEEE Trans. Geosci. Remote Sens. 2018, 56, 1994–2006. [Google Scholar] [CrossRef]
- Rao, W.; Li, G.; Wang, X. ISAR imaging via adaptive sparse recovery. In Proceedings of the 2013 IEEE International Geoscience and Remote Sensing Symposium (IGASS), Melbourne, VIC, Australia, 21–26 July 2013; pp. 121–124. [Google Scholar]
- Chierchia, G.; Cozzolino, D.; Poggi, G.; Verdoliva, L. SAR image despeckling through convolutional neural networks. In Proceedings of the 2017 IEEE International Geoscience and Remote Sensing Symposium (IGASS), Fort Worth, TX, USA, 23–28 July 2017; pp. 5438–5441. [Google Scholar]
- Mousavi, A.; Baraniuk, R. Learning to invert: Signal recovery via deep convolutional networks. In Proceedings of the 2017 IEEE International Conference on Acoustics, Speech and Signal Processing (ICASSP), New Orleans, LA, USA, 5–9 March 2017; pp. 2272–2276. [Google Scholar]
- Gao, J.; Deng, B.; Qin, Y.; Wang, H.; Li, X. Enhanced radar imaging using a complex-valued convolutional neural network. IEEE Geosci. Remote Sens. Lett. 2019, 16, 35–39. [Google Scholar] [CrossRef]
- Rittenbach, A.; Walters, J.P. RDAnet: A deep learning based approach for synthetic aperture radar image formation. arXiv 2021, arXiv:2001.08202. [Google Scholar]
- Pu, W. Deep SAR imaging and motion compensation. IEEE Trans. Image Process. 2021, 30, 2232–2247. [Google Scholar] [CrossRef] [PubMed]
- Meraoumia, I.; Dalsasso, E.; Denis, L.; Abergel, R.; Tupin, F. Multitemporal speckle reduction with self-supervised deep neural networks. IEEE Trans. Geosci. Remote Sens. 2023, 61, 5201914. [Google Scholar] [CrossRef]
- Lin, H.; Jin, K.; Yin, J.; Yang, J.; Zhang, T.; Xu, F.; Jin, Y. Residual in residual scaling networks for polarimetric SAR image despeckling. IEEE Trans. Geosci. Remote Sens. 2023, 61, 5207717. [Google Scholar] [CrossRef]
- Zhang, J.; Ghanem, B. ISTA-Net: Interpretable optimization-inspired deep network for image compressive sensing. In Proceedings of the 2018 IEEE/CVF Conference on Computer Vision and Pattern Recognition, Salt Lake City, UT, USA, 18–22 June 2018; pp. 1828–1837. [Google Scholar]
- Yonel, B.; Mason, E.; Yazıcı, B. Deep learning for passive synthetic aperture radar. IEEE J. Sel. Topics Signal Process. 2018, 12, 90–103. [Google Scholar] [CrossRef]
- Zhang, H.; Ni, J.; Xiong, S.; Luo, Y.; Zhang, Q. SR-ISTA-Net: Sparse representation-based deep learning approach for SAR imaging. IEEE Geosci. Remote Sens. Lett. 2022, 19, 4513205. [Google Scholar] [CrossRef]
- Kang, L.; Sun, T.; Luo, Y.; Ni, J.; Zhang, Q. SAR imaging based on deep unfolded network with approximated observation. IEEE Trans. Geosci. Remote Sens. 2022, 60, 5228514. [Google Scholar] [CrossRef]
- Wei, Y.; Li, Y.; Ding, Z.; Wang, Y.; Zeng, T.; Long, T. SAR parametric super-resolution image reconstruction methods based on ADMM and deep neural network. IEEE Trans. Geosci. Remote Sens. 2021, 59, 10197–10212. [Google Scholar] [CrossRef]
- Li, M.; Wu, J.; Huo, W.; Jiang, R.; Li, Z.; Yang, J.; Li, H. Target-oriented SAR imaging for SCR improvement via deep MF-ADMM-Net. IEEE Trans. Geosci. Remote Sens. 2022, 60, 5223314. [Google Scholar] [CrossRef]
- Zhang, H.; Ni, J.; Li, K.; Luo, Y.; Zhang, Q. Nonsparse SAR scene imaging network based on sparse representation and approximate observations. IEEE Trans. Geosci. Remote Sens. 2023, 15, 4126. [Google Scholar] [CrossRef]
- Budillon, A.; Johnsy, A.C.; Schirinzi, G.; Vitale, S. SAR tomography based on deep learning. In Proceedings of the 2019 IEEE International Geoscience and Remote Sensing Symposium (IGASS), Yokohama, Japan, 28 July–2 August 2019; pp. 3625–3628. [Google Scholar]
- Wang, Y.; Liu, C.; Zhu, R.; Liu, M.; Ding, Z.; Zeng, T. MAda-Net: Model-adaptive deep learning imaging for SAR tomography. IEEE Trans. Geosci. Remote Sens. 2023, 61, 5202413. [Google Scholar] [CrossRef]
- Li, H.; Xu, J.; Song, H.; Wang, Y. PIN: Sparse aperture ISAR imaging via self-supervised learning. IEEE Geosci. Remote Sens. Lett. 2024, 21, 3502905. [Google Scholar] [CrossRef]
- Raney, R.; Runge, H.; Bamler, R.; Cumming, I.; Wong, F. Precision SAR processing using chirp scaling. IEEE Trans. Geosci. Remote Sens. 1994, 32, 786–799. [Google Scholar] [CrossRef]
- Shi, W.; Ling, Q.; Yuan, K.; Wu, G.; Yin, W. On the linear convergence of the ADMM in decentralized consensus optimization. IEEE Trans. Signal Process. 2014, 62, 1750–1761. [Google Scholar] [CrossRef]
- Bi, H.; Zhang, B.; Zhu, X.; Hong, W.; Sun, J.; Wu, Y. L1 regularization-based SAR imaging and CFAR detection via complex approximated message passing. IEEE Trans. Geosci. Remote Sens. 2017, 55, 3426–3440. [Google Scholar] [CrossRef]
- Bi, H.; Li, Y.; Zhu, D.; Bi, G.; Zhang, B.; Hong, W.; Wu, Y. An improved iterative thresholding algorithm for L1-norm regularization based sparse SAR imaging. Sci. China Inf. Sci. 2020, 63, 219301. [Google Scholar] [CrossRef]
- Trabelsi, C.; Bilaniuk, O.; Zhang, Y.; Serdyuk, D.; Subramanian, S.; Santos, J.; Mehri, S.; Rostamzadeh, N.; Bengio, Y.; Pal, C. Deep complex networks. arXiv 2018, arXiv:1705.09792. [Google Scholar]
- Li, J.; Qu, C.; Shao, J. Ship detection in SAR images based on an improved faster R-CNN. In Proceedings of the 2017 SAR in Big Data Era: Models, Methods and Applications (BIGSARDATA), Beijing, China, 1–6 November 2017. [Google Scholar]
Disclaimer/Publisher’s Note: The statements, opinions and data contained in all publications are solely those of the individual author(s) and contributor(s) and not of MDPI and/or the editor(s). MDPI and/or the editor(s) disclaim responsibility for any injury to people or property resulting from any ideas, methods, instructions or products referred to in the content. |
© 2024 by the authors. Licensee MDPI, Basel, Switzerland. This article is an open access article distributed under the terms and conditions of the Creative Commons Attribution (CC BY) license (https://creativecommons.org/licenses/by/4.0/).