Article

Ghost Removal from Forward-Scan Sonar Views near the Sea Surface for Image Enhancement and 3-D Object Modeling

by
Yuhan Liu
and
Shahriar Negahdaripour
*
ECE Department, University of Miami, Coral Gables, FL 33146, USA
*
Author to whom correspondence should be addressed.
Remote Sens. 2024, 16(20), 3814; https://doi.org/10.3390/rs16203814
Submission received: 24 May 2024 / Revised: 2 October 2024 / Accepted: 6 October 2024 / Published: 14 October 2024
(This article belongs to the Topic Computer Vision and Image Processing, 2nd Edition)

Abstract

:
Underwater sonar is the primary remote sensing and imaging modality within turbid environments with poor visibility. The two-dimensional (2-D) images of a target near the air–sea interface (or resting on a hard seabed), acquired by forward-scan sonar (FSS), are generally corrupted by the ghost and sometimes mirror components, formed by the multipath propagation of transmitted acoustic beams. In the processing of the 2-D FSS views to generate an accurate three-dimensional (3-D) object model, the corrupted regions have to be discarded. The sonar tilt angle and distance from the sea surface are two important parameters for the accurate localization of the ghost and mirror components. We propose a unified optimization technique for improving both the measurements of these two parameters from inexpensive sensors and the accuracy of a 3-D object model using 2-D FSS images at known poses. The solution is obtained by the recursive updating of sonar parameters and 3-D object model. Utilizing the 3-D object model, we can enhance the original images and generate synthetic views for arbitrary sonar poses. We demonstrate the performance of our method in experiments with the synthetic and real images of three targets: two dominantly convex coral rocks and a highly concave toy wood table.

Graphical Abstract

1. Introduction

In addition to enabling the generation of environmental maps, building 3-D object models from 2-D images provides information for automatic target recognition, establishing the types, sizes, and relative spatial arrangement of various scene objects, collision-free navigation, landmark-based positioning, reallocating objects within mapped sites, and change detection.
For underwater applications, 2-D optical imaging has restricted range in relatively clear waters and quickly becomes ineffective under poor visibility and turbidity—conditions that are commonly encountered in polluted ports, shallow turbulent surf zones, rivers, marine sanctuaries, lakes, ponds, and other still bodies of water. Here, sonar is the preferred and primary visual sensing modality, by virtue of acoustic signal penetrability through silt, mud, and other similar sources of water turbidity.
The imaging sonars have been commonly utilized in subsea remote sensing applications to generate 2-D visual and 3-D topographical maps of the ocean floor [1,2]. In one deployment scenario, a side-scan sonar (SSS) operating at frequencies of 100–500 KHz can map narrow strips of the terrain that extend up to several hundred meters on either side of a ship [3,4]. The typical (across-track) range resolutions of several centimeters can be improved to 1–2 [cm] at operating frequencies of about 1 MHz. This is achieved at the cost of decreased maximum ranges of only 10’s of meters because the acoustic waves at these high frequencies attenuate faster than those at lower frequencies that are commonly employed for long-range applications.
The Synthetic Aperture Sonar (SAS) technology [2,5,6] overcomes the decreasing SSS resolution (when operating at the lower frequencies required for long-distance applications) by integrating data collected over multiple sonar transmissions with a synthetic array. Here, constant resolution with range can be achieved by scaling of the array; increasing the array length for longer ranges.
The 2-D multi-beam FSS systems, originally developed in the early 2000s at operating frequencies of 100’s KHz, have been commonly deployed near the front end of the hull for obstacle-free navigation in shallow, poorly-chartered waters [7,8,9]. The advanced units operating at 2–3 MHz produce high-resolution video images of small objects with sub-centimeter resolution at 10–30 frames/s but a limited maximum range of about a dozen meters; e.g., [10,11,12]. The mapping of relatively large areas of the sea bottom can be achieved by image mosaicing [13,14,15,16,17]. The increasing use of these high-resolution FSS systems has sparked interest in developing algorithms for automated 2-D sonar image processing, interpretation, and 3-D object reconstruction.
In 2-D ranging systems, it is common to employ the spherical coordinate ( , θ , ϕ ) T for the 3-D position of an object/scene surface points. Here, the elevation angle ϕ is lost in the projection of these 3-D points onto the 2-D sonar image. The 3-D reconstruction from FSS data involves the estimation of the unknown ϕ by various “shape from X” techniques [18]. For example, several 2-D images at a multitude of known poses can be used to generate high-resolution 3-D object models [19,20,21,22,23,24,25], with key applications in target recognition, environmental mapping, and marine scientific studies that rely on the distribution of object types and sizes. However, satisfactory performance often requires certain implicit/explicit restrictive assumptions and conditions about the environment, sonar trajectory, as well as target shape. For example, nearby reflecting surfaces in cluttered scenes and (or) surface patches within object concavities generate multipath that can corrupt and degrade the target image. Thus, the key conditions to minimize data corruption for accurate 3-D model reconstruction include the following: (1) dominantly convex targets (with only mild concavities producing no more than negligible multipath reverberation); and (2) no nearby surfaces with strong acoustic reflectance, e.g., air–sea interface, hard bottoms, and clutter.
The sonar images of targets resting on hard bottoms or in shallow water (floating) near the air–water interface can be corrupted by the contributions from the multipath propagation of acoustic beams [19,20,26,27]. These generate ghost regions that often overlap with the target image (the multipath phenomenon also arises in deploying a high-resolution radar on an autonomous road vehicle for environmental perception [25,28,29,30,31], where the key objective is to locate the “ghost” vehicles in the scene images). Referring to each of the four views of a coral rock in Figure 1, the indistinguishable overlapping ghost object corrupts both the shape and intensity values of (some parts within) the coral image region. Additionally, a mirror region is formed by the “virtual mirror object” above the water surface (or below the seabed). As in (a), the mirror component (nearly) coincides with the ghost region when the image plane is (roughly) parallel to the sea surface (or bottom). It separates into a distinct blob upon rotating the sonar about the viewing axis; here, from 0° to 67.5° in steps of 22.5°.
In this work, we investigate the generation of a 3-D model for an object floating near the sea surface, imaged by an FSS from a multitude of known poses. To this end, improved 3-D modeling performance directly depends on the accurate knowledge of sonar pose relative to the air–water interface, allowing us to circumvent the shape distortion in the 3-D object modeling process. To be precise, the air–water interface distance and the sonar tilt angle are two key pose parameters in localizing the ghost and mirror components. Both parameters can be determined using relatively inexpensive sensors [32,33], but the measurement inaccuracies are generally unacceptable. We propose to estimate these with reduced uncertainty and (or) improved precision by devising an integrated recursive optimization technique that builds on an earlier 3-D modeling framework [19,20]. Moreover, we exploit the mirror contours, where distinct in certain views, as a regularizer to improve the reconstruction accuracy.
Additionally, our method enables the generation of ghost-free object views from the model-based synthetic images [26,27,34,35,36], using a look-up table that is constructed from the intensity distributions within the uncorrupted object regions in the data and synthetic images. Experimental results confirm that our method performs consistently with real and computer-generated data under similar imaging conditions. The real data includes the images at known poses of two dominantly convex coral rocks and a concave toy wood table, recorded by a lens-based Dual-Frequency IDentification SONar (DIDSON) [10].
The remaining sections are organized as follows: Section 2 covers (1) some notations and relevant technical background, including 3-D coordinate transformation, 3-D-to-2-D sonar projection, representation of sonar data as a beam-bin array, and transformation to generate a 2-D FSS image; (2) a unified optimization framework for 3-D target modeling and sonar pose estimation, error metrics applied for the quantitative assessment of the results, and the generation of ghost-free object images. In Section 3, we first present the results of experiments with synthetic data, aimed at assessing the accuracy and convergence rate of our optimization scheme for 3-D modeling and sonar pose estimation. Here, we utilize the 3-D models of our three targets generated by a Kinect camera under the same imaging conditions as the real data. We then give the results of experiments with real data. We summarize our contributions in Section 4.

2. Materials and Methods

2.1. Notation, Coordinate Transformation and FSS Image Formation

The Cartesian P = ( X , Y , Z ) and spherical Π = ( , θ , ϕ ) coordinates of a 3-D point transform according to the following equations:
P = X Y Z = cos ϕ sin θ cos ϕ cos θ sin ϕ Π = θ ϕ = X 2 + Y 2 + Z 2 t a n 1 ( X / Y ) t a n 1 ( Z / X 2 + Y 2 )
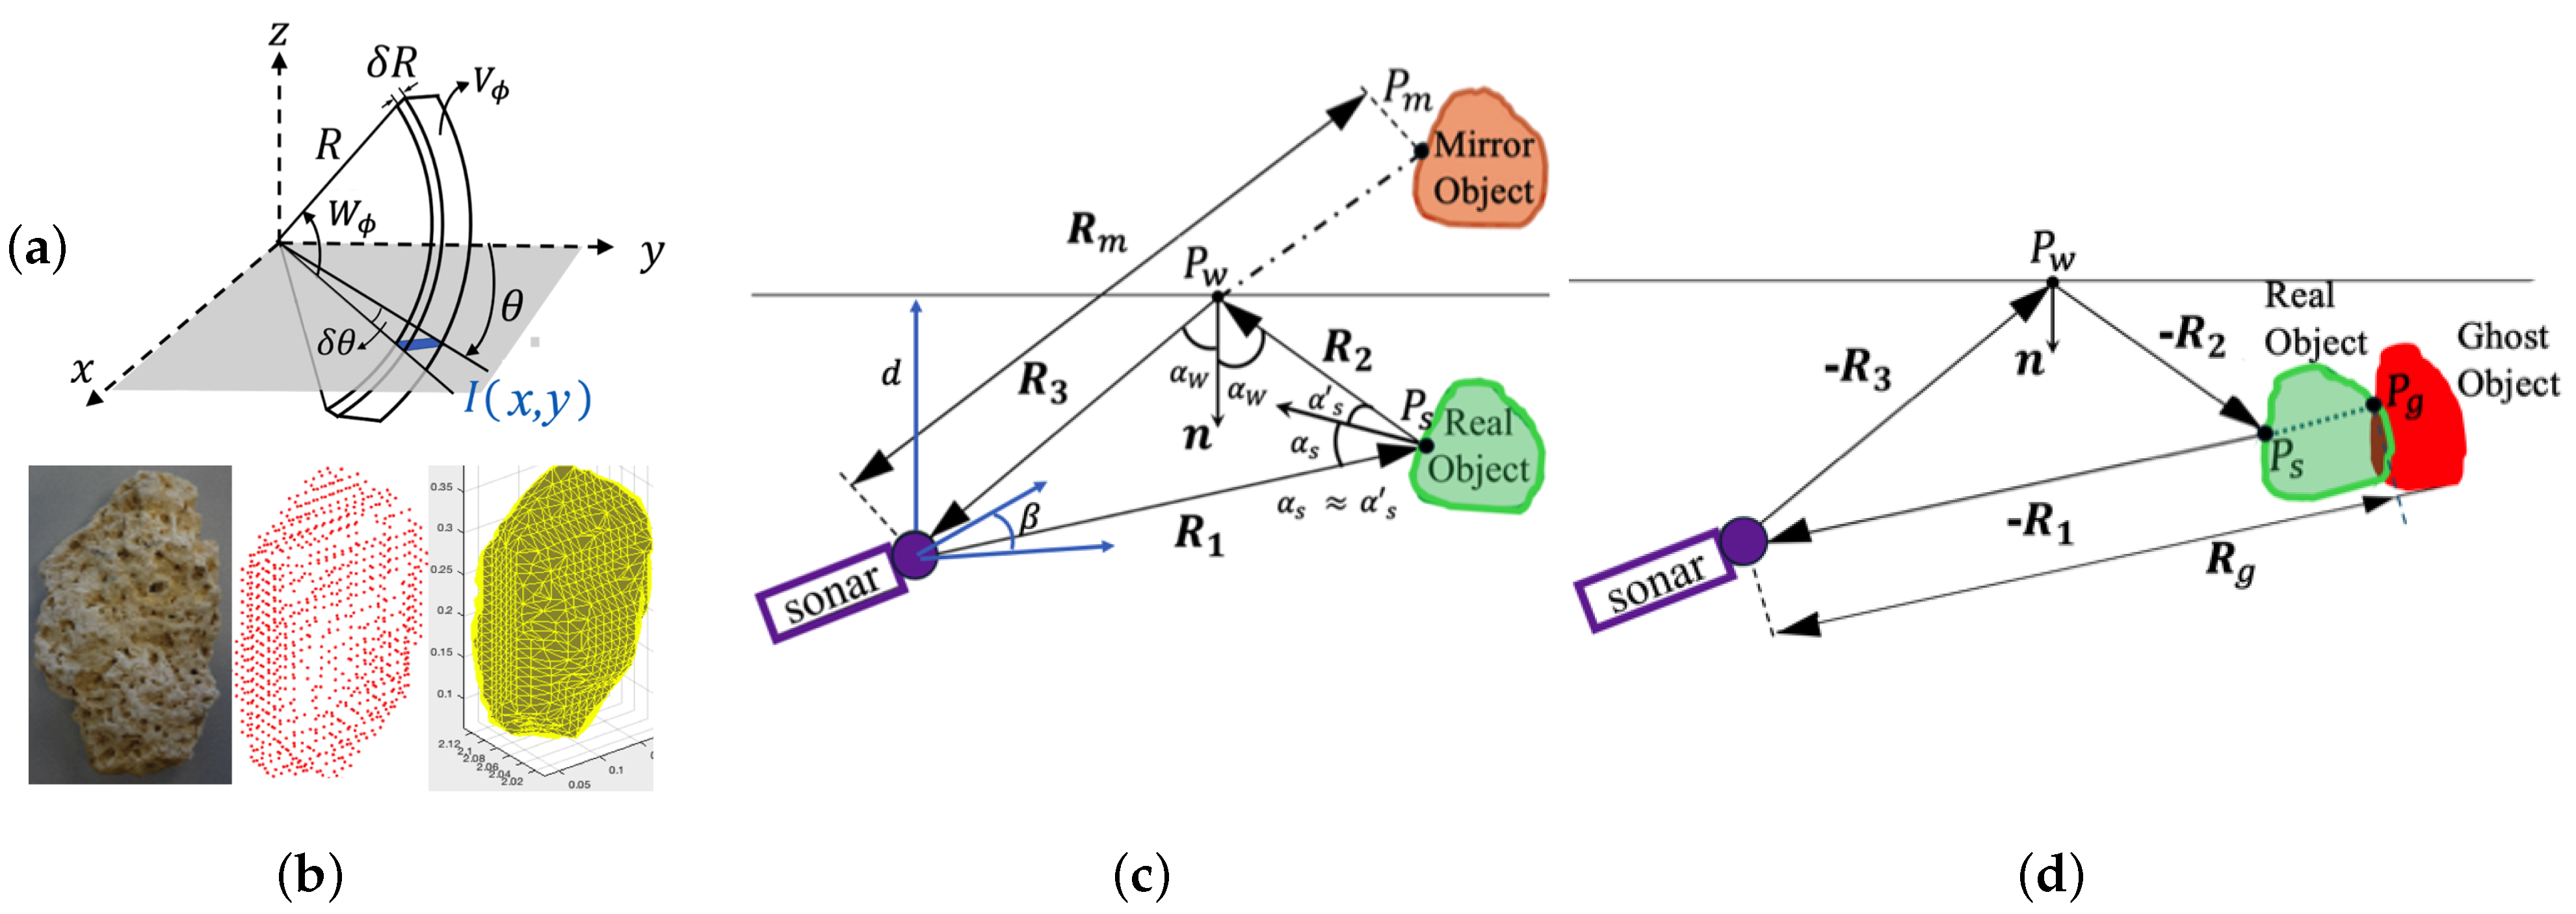
Figure 2a depicts a single sonar beam in the azimuth direction θ . In a multi-beam FSS, the horizontal field of view (FoV) | θ | W θ is covered by N b beams, each with a narrow horizontal width δ θ . The vertical FoV is fixed by the half-angle beam width W ϕ . For most existing FSS systems, we have δ θ = 0.25 ° 1 ° , 6° ≤ Wϕ ≤ 10° and 15° ≤ Wθ ≤ 65.
At various sample times, the round-trip times of flight T t o f of target echos in a direction θ yield the range measurements = 1 2 T t o f υ , where υ is the sound speed within the medium. Ideally, we calculate ( , θ ) from the so-called “beam-bin” ( b , B ) coordinates by the following linear equations:
= min + ( B 1 ) δ ( B = 1 , 2 , , N B ) θ = W θ + ( b 1 ) δ θ ( b = 1 , 2 , , N b )
where N B range bins cover the minimum range min to maximum range max with resolution δ = ( max min ) / ( N B 1 ) . In practice, deviations from these models are determined and rectified by calibration; e.g., a “mild” cubic equation models the b-to- θ transformation in a lens-based DIDSON with lens distortion [37].
The beam-bin intensity array I ( b , B ) encodes the strength of (collective) echoes from potentially several scene surface patches within the elevation arc W ϕ , leading to the inherent many-to-one projection ambiguity of FSS imaging. We construct the 2-D FSS image I ( x , y ) from the beam-bin data using the transformation
x y = sin θ cos θ
The elevation angles ϕ of points on an object or scene surfaces (over some region of interest) are lost in the 3-D-to-2-D projection process. The application of a 3-D reconstruction technique involves the recovery of unknown ϕ from the radiometric and (or) geometric cues in one or more FSS images. In this work, we utilize the data captured with a DIDSON unit, for which an image formation model has been derived [26]; this enables synthesizing images of a given object at known poses relative to the sonar.

2.2. 3-D Object Modeling

Applying the space carving (SC) paradigm [38], a 3-D reconstruction method has been proposed [39] to generate an object surface model S o from M images I m at distinct sonar poses m m ( m = 0 , 1 , , M 1 ) . The M = M p M r poses are represented by 3-D translation t i ( i = 0 , 1 , , M p 1 ) and rotation r j ( j = 0 , 1 , , M r 1 ) vectors relative to reference pose m 0 = [ t 0 T , r 0 T ] T . The carving efficiency is improved by acquiring M r rotated images at each of M p positions around the object; through incremental roll rotations d ω r = π / M r [rad] (about the viewing axis) from π to π + ( M r 1 ) d ω r (The shape complexity, namely, convexity or concavity are two key factors in setting M p and M r ).
The SC method exploits geometric cues solely. First, the 3-D space visible in all sonar poses is discretized into volume elements (voxels). Each is examined to label as an object voxel if it projects onto the feasible region in every view; otherwise it is labeled as a non-object voxel and discarded. The feasible region of each view is defined by the object highlight and dark/shadow region behind it, onto which the object surface patches occluded by the visible surfaces may project. The surface model S o is the outer boundary of the volume formed by all object voxels, as shown in Figure 2b for the coral-two rock in our experiments. Referring to Figure 2b, the SC model S o consists of a closed mesh of N T triangles formed by N p vertices P l o ( l = 1 , , N p ); the triangulation connectivity list T s fixes the N T triangles in S o , formed by the triplet sets { P i o , P j o , P k o } .
The 3-D model refinement scheme in [19,20] is an efficient implementation of the optimization framework in [40] that utilizes the intensity data within object regions in various views by minimizing the discrepancy between the data and synthetic target images, generated by the sonar image formation model in [26]. Starting with the SC mesh model S o , the sought-after optimal model S ˜ is the discrete approximation of the true continuous surface S c , defined by the N p displaced vertices P ˜ l = P l o + V ˜ l ( l = 1 , , N p ) of the N T triangles in the triangular connectivity list T s of S o . The optimal displacements V ˜ = [ V ˜ 1 , V ˜ 2 , , V ˜ N p ] are calculated iteratively by minimizing the sum-squared difference between the data I m and synthetic images I ˜ m over all M poses:
V ˜ = arg min S ˜ E ( S ) = m = 1 M | I m I ˜ m ( x , y ; S ) | 2
At iteration t, the incremental 3-D vertex displacement field V ˜ t (to revise the 3-D model S ˜ t ) is estimated from the 2-D motion fields v m t that align the data and synthetic images at “relevant” sonar poses m m ( m = 1 , 2 , M M ). Here, ( M M ) views may be excluded if the vertices/patches are invisible or the 2-D motion vectors have large errors.
For targets imaged near the sea surface, we need to account for the impact of multipath propagation, namely, the object region corrupted by the ghost component. To this end, multipath modeling serves two purposes: (1) to localize and discard the ghost-corrupted object region to avoid the distortion of the 3-D model; and (2) to exploit the geometric constraints imposed by the mirror image boundaries in relevant views to improve the 3-D object modeling.It is noted that the multipath arising from reverberation within object concavities and ground reflection for objects on the seabed have been incorporated in sonar simulators [26,27,34,35,36,41,42,43]. However, these investigations offer no model validation with real data and calibrated objects. In our work, we rely solely on geometric cues, i.e., the ghost and mirror locations and the mirror contour, for 3-D model refinement.

2.3. Unified Optimization Famework

Inexpensive depth sensors with an accuracy of 0.1% have negligible error at depths of a few meters [32]. However, a low-cost angle sensor with an uncertainty of ± 0.6 ° [33] can introduce large biases in localizing the ghost, mirror, and thus the uncorrupted object regions. We next describe a unified optimization scheme by incorporating the estimation of the two pose parameters within the 3-D target modeling framework.
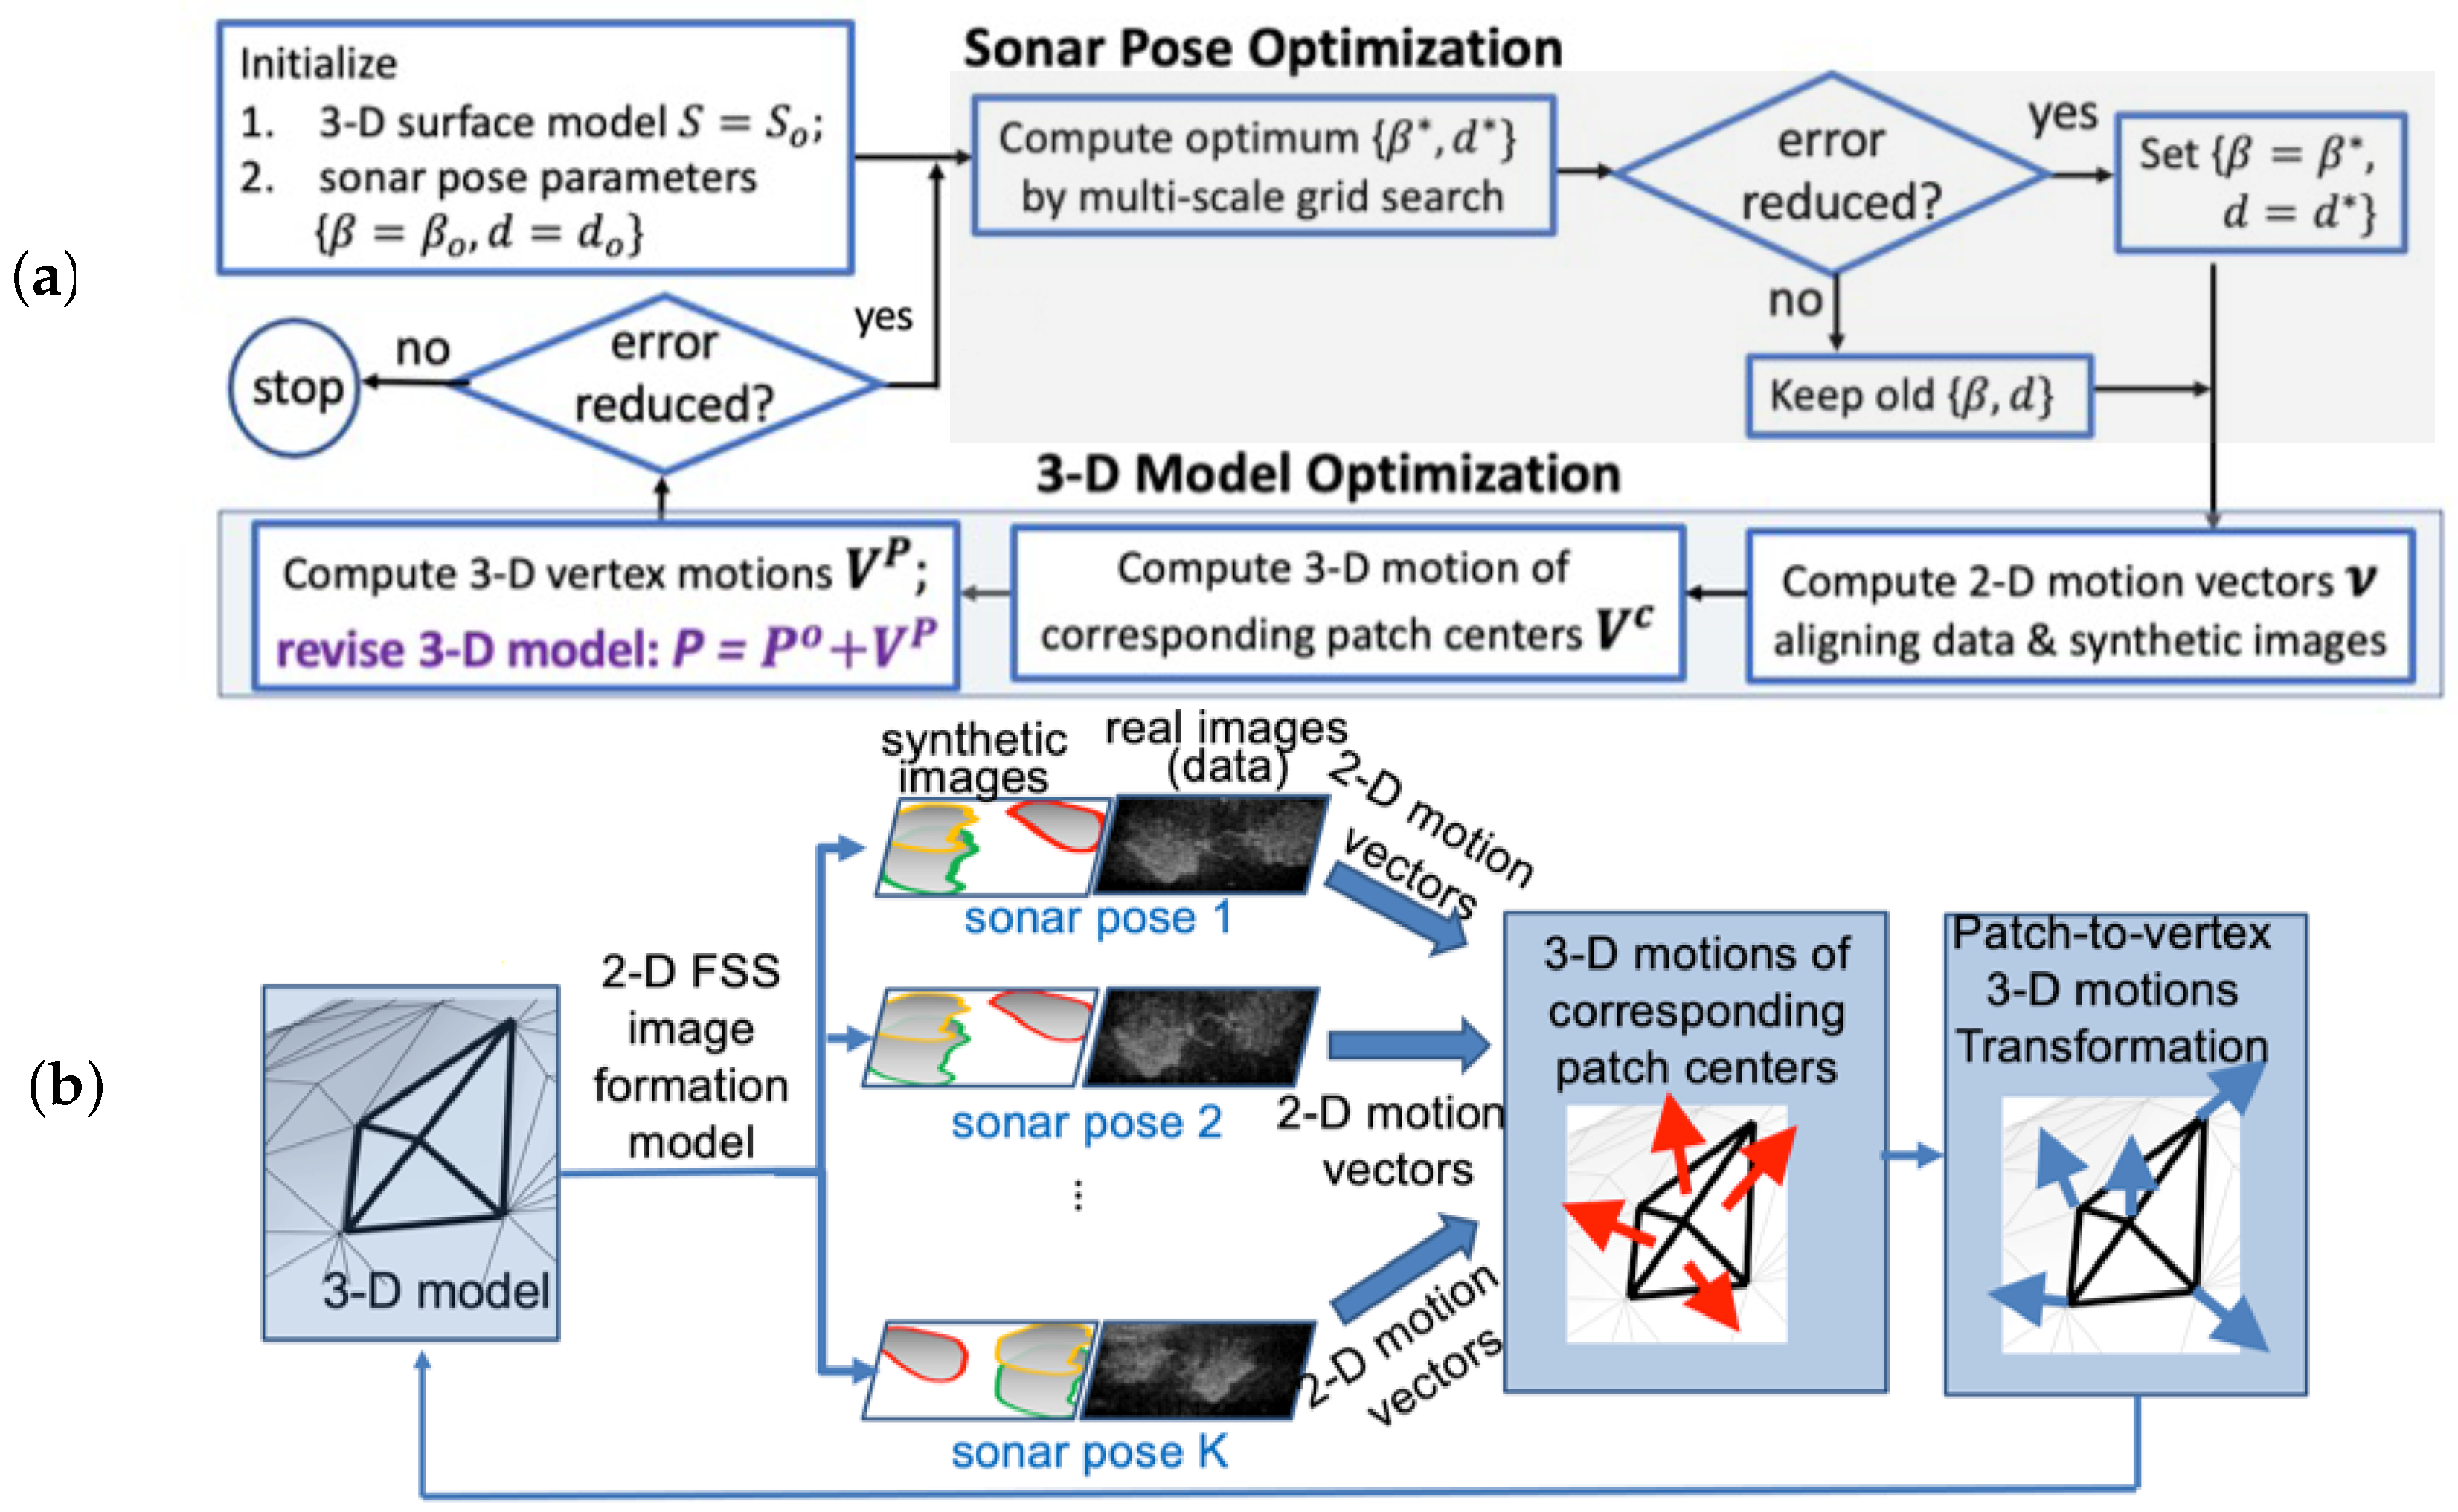
Figure 3a depicts the block diagram of the process: recursively updating the pose parameters and the 3-D shape. Here, we employ the 3-D object model estimate to calculate the new values of sonar depth d and tilt angle β . These are adopted only if they yield a smaller error, subsequently employed in the next iteration of 3-D shape refinement. The iterative updating of the 3-D target model, detailed in [19,20] and depicted in Figure 3b, consists of three key steps: (1) computation of 2-D motion vectors in various views for the alignment of object regions in the data and synthetic images (constructed from the 3-D model); (2) estimation of the 3-D motions of corresponding triangular-patch centers from the 2-D image motion fields for all views; (3) transformation of 3-D motions from the patch centers to the 3-D model vertices. Finally, we update the 3-D shape by displacing the model vertices. The execution of the two-mode optimization continues as long as the objective error function diminishes.

2.4. Sonar Pose Optimization

Referring to Figure 2d, the ghost image, generally overlapping with the more distant region of the object image, is formed by the sound propagation along the longer multipath routes. The paths for all visible surface patches are readily calculated based on the sonar pose relative to the target and to the air–water interface [19,20]. However, inaccuracies in the initial 3-D SC model (note that the 3-D model incorporates the relative sonar-to-target pose) and the depth and tilt sensor measurements can lead to the imprecise location of the ghost region, thus diminishing the effectiveness of utilizing the image intensity and contour information for various views. We minimize both types of error through the optimization method described next.
We employ superscript ( · ) O and ( · ) M for entities associated with the object and mirror components, respectively; e.g., 3-D models S O and S M explicitly differentiate between the true model and the virtual 3-D mirror object, respectively. For a sonar pose m m ( m = 1 , 2 , , M ) , a frontal patch refers to the visible surface patch at shortest range along each sonar beam, projecting onto a frontal contour point in the corresponding view.
Let C m O = { c m k O | k = 1 , 2 , , N m O } and C m M = { c m l M | l = 1 , 2 , , N m M } denote the sets of frontal contour points of the object and mirror regions in image I m . Likewise, C ˜ m O = { c ˜ m i O | i = 1 , 2 , , N ˜ m O } and C ˜ m M = { c ˜ m j M | j = 1 , 2 , , N ˜ m M } denote the same in the synthetic image I ˜ m . Note that N m O N ˜ m O and N m M N ˜ m M generally, for real quantized data. We perform contour alignment by the Iterative Closest Point (ICP) algorithm [44,45], namely, the iteratively reweighted least squares (IRLS) variant [46,47]. A key advantage of the ICP methods is the applicability in registering two unequal-size unmatched point sets.
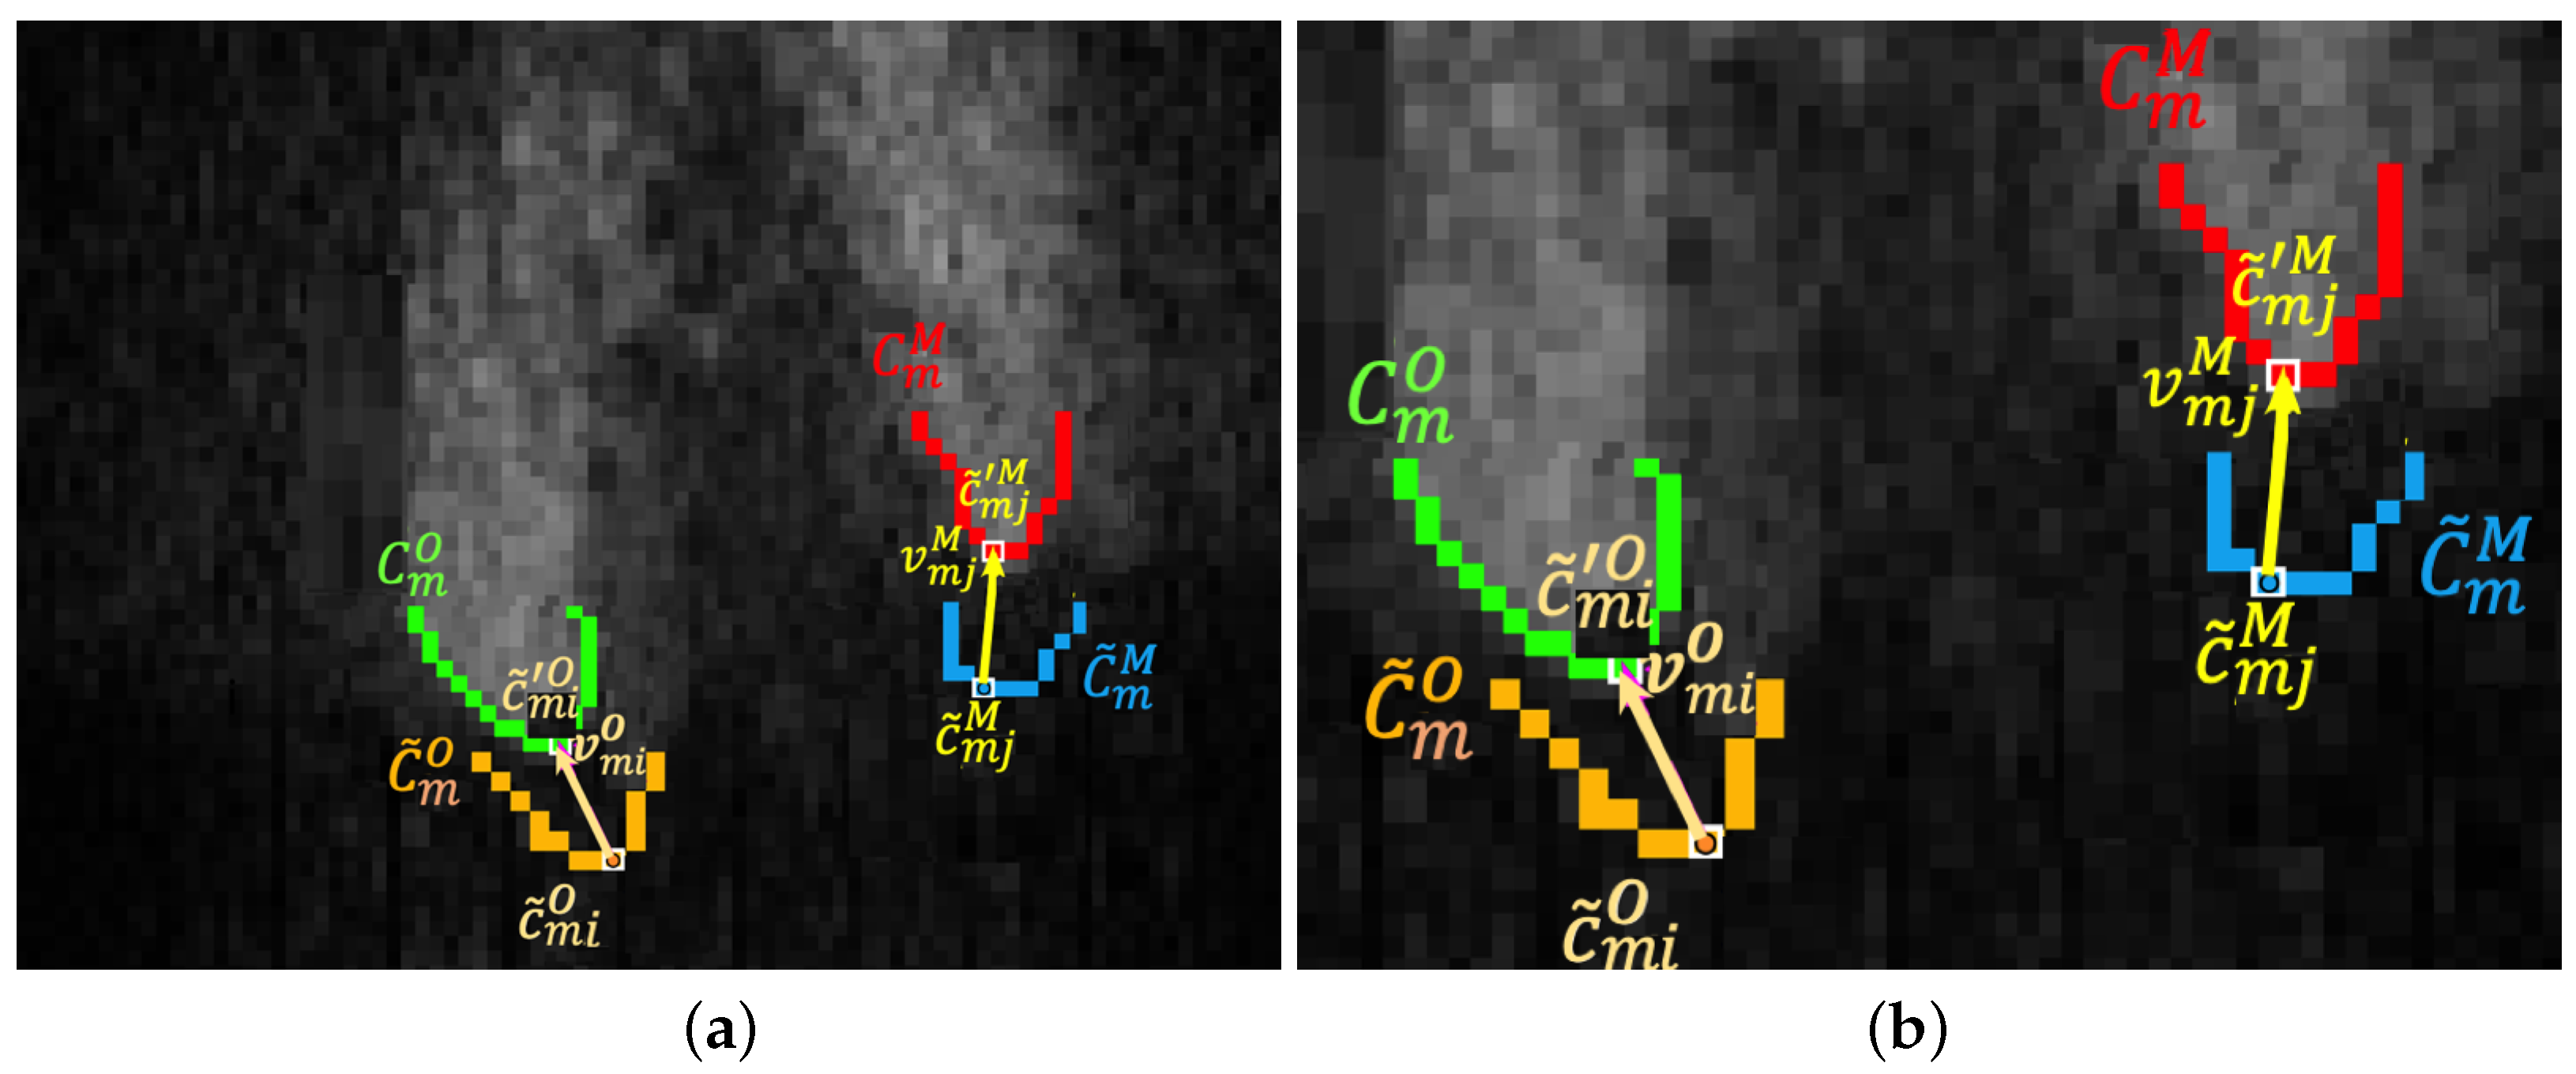
Figure 4 depicts these contours superimposed on a sample real image. The registration of contours C ˜ m O and C m O with N ˜ m O N ˜ m O inlier matching points { c ˜ m i O , c m k O } (with indeces { i , k ( i ) } ) yields the planar transformation C ˜ m O = T O ( C ˜ m O ) ( C ˜ m O = { c ˜ m i O | i = 1 , 2 , N ˜ m O } ) ( T O ( . ) involves 2-D translation and in-plane rotation).
The 2-D motion of contour C ˜ m O is given by V ˜ m O = { v ˜ m i O | i = 1 , 2 , , N ˜ m O } , where v ˜ m i O = c ˜ m i O c ˜ m i O .
For each synthetic image I ˜ m , the contour error is computed based on the discrepancy between the contour pixels c m k ( i ) O in the data I m and the transformed contour pixels c ˜ m i O in the synthetic view I ˜ m t :
CE ( I ˜ m ) = 1 N ˜ m O i = 1 N ˜ m O | c m k ( i ) O c ˜ m i O |
Following the same steps for the mirror image, N ˜ m M pairs { c ˜ m j M , c m l M } of inlier mirror-contour correspondences with indeces { j , l ( j ) } are established by the transformation C ˜ m M = T M ( C ˜ m M ) . This yields the 2-D mirror-contour motions V ˜ m M = { v ˜ m j M | j = 1 , 2 , . . . , N ˜ m M N ˜ m M } , where v ˜ m j M = c ˜ m j M c ˜ m j M .
With accurate sonar pose parameters D and β , the 2-D motions V ˜ m O and V ˜ m M computed from images I m and I ˜ m (for pose m m ) incorporate the inaccuracies of estimated 3-D models S ˜ O and S ˜ M in a consistent manner.
To explain, we utilize the simplified notation { z | z = 1 , 2 , , Z m } for the set of Z m frontal patch indeces in view m m for both the true and estimated object-mirror pairs { S O , S M } and { S ˜ O , S ˜ M } , respectively. Moreover, the 2-D motion vectors v m z O and v m z M align the frontal contours of objects and mirror regions in the real and synthetic images, respectively. Finally, the erroneous 2-D motion vectors based on imperfect knowledge of sonar depth and tilt angle are denoted v ˜ m z O and v ˜ m z M .
Next, let the pairs { P z c O , P z c ˜ O } represent the true and estimated 3-D frontal patch centers on { S O , S ˜ O } , projecting onto matching 2-D object-contour points { c m z O , c ˜ m z O } in the data I m and synthetic view I ˜ m , respectively. In [19,20], we show how to calculate the 3-D motion of the patch center V ˜ z O = P z c ˜ O P z c O from the redundant 2-D object-contour motions v ˜ m z O in visible views m = 1 , 2 , , M M .
In the same manner, (1) the patch-center pair { P z c M , P z c ˜ M } of true and estimated 3-D mirror model pair { S M , S ˜ M } project onto matching 2-D mirror-contour pairs { c m z M , c ˜ m z M } in the data I m and synthetic view I ˜ m , respectively; and (2) the 3-D mirror patch-center motion V ˜ z M = P z c ˜ M P z c M is calculated from the redundant 2-D mirror-contour motions v ˜ m z M over the visible mirror patches.
The consistent manner means that mapping of the pair { P z c O , P z c ˜ O } to two corresponding 3-D mirror pairs on { S M , S ˜ M } yields the same terminal points { P z c M , P z c ˜ M } that are derived from the 2-D mirror-contour motions v ˜ m z M (calculated from all views where the mirror surface patch centered at P z c ˜ M is visible).
This so-called consistency does not hold when sonar pose parameters are imprecise: deviations arise in V ˜ z O and V ˜ z M due to the inaccurate 2-D motions calculated from the dislocated object and mirror contours. First, we expect the 3-D motion vector V ˜ z O to be larger than the estimate based on precise sonar depth and tilt measurements. Accordingly, we would seek sonar pose parameters that minimize V ˜ z O . Next, inconsistency exists between V ˜ z M , calculated from the 2-D mirror contour motions, and V z M based on the mapping of 3-D patch-center motion from the object S ˜ O to the virtual mirror S ˜ M . We can directly calculate the discrepancy V z M V ˜ z M , which is also to be minimized by the optimal sonar pose parameters. Collectively, we define and minimize the error metric E μ ( D , β ) that integrates the errors μ m for all sonar poses:
μ m = 1 Z m z = 1 Z m V z O + V z M V ˜ z M ; E μ ( D , β ) = 1 M m = 1 M μ m
The error metric E μ ( D , β ) is a highly nonlinear function of parameters D and β , requiring a computationally expensive non-linear optimization scheme (e.g., some variation of iterative gradient descent [48]). Moreover, the convergence to the global minimum cannot be guaranteed. Instead, we determine the optimal values D and β more efficiently by multi-resolution grid search in a 2-D parameter space. That is, representing the uncertainty bounds of sensor measurements D 0 (of depth) and β 0 (of tilt angle) by ± e D and ± e β , we calculate E μ ( D , β ) over the 2-D grid U g = [ D o e D , D o + e D ; β o e β , β o + e β ] with (low to high) grid resolution δ D and δ β :
( D , β ) = arg min ( D , β ) U g E μ ( D , β )
We update D and β in a “greedy” manner: ( D , β ) is accepted if it gives a smaller error E μ compared with the latest value; see the “Sonar Orientation Optimization” block in Figure 3a. Next, we carry out the computational steps in the “3-D Model Optimization” block as described in [20].

2.5. Error Metric

We define two error measures to assess the performance of our method [19,20]: to quantify the 3-D object model error and the discrepancy between the data and synthetic images generated from the 3-D model. Denoting I ˜ t = { I ˜ m t | m = 1 , 2 , , M } the set of synthetic beam-bin images at iteration t, we employ the average intensity error (IE) comprising of pixel set Ω m t within the uncorrupted object region of I ˜ m t , in calculating the average intensity error (AIE) over the whole synthetic image set:
IE ( I ˜ m t ) = 1 | Ω m t | ( b , B ) Ω m t | I ˜ m t ( b , B ) I t ( b , B ) | AIE ( I ˜ t ) = 1 M m = 1 M IE ( I ˜ m )
where | Ω m t | denotes the cardinality of set Ω m t . We also compute the average contour error (ACE) from (5):
ACE ( I ˜ t ) = 1 M m = 1 M CE ( I ˜ m t )
Finally, these two average errors (over the entire data set) are normalized with respect to their initial values (using the synthetic images of the 3-D SC solution):
N A I E ( I ˜ t ) = A I E ( I ˜ t ) / A I E ( I ˜ 0 ) N A C E ( I ˜ t ) = A C E ( I ˜ t ) / A C E ( I ˜ 0 )
and combined to establish the image error at iteration t:
E I ( t ) = 1 2 ( N A I E ( I ˜ t ) + N A C E ( I ˜ t )
The 3-D modeling error can be quantified in terms of the volumes V c = V ( S c ) and V ˜ = V ( S ˜ ) of the true and estimated 3-D object models. With no knowledge of S c , we instead utilize the model generated by a Kinect camera [49], albeit not perfect. Accordingly, we define the normalized volumetric error at iteration t [39]:
E V t = V ˜ t + V c 2 V S ˜ t S c V ˜ t + V c V S ˜ t S c ; V S ˜ t S c = V ( S ˜ t S c )
The metric 0 E V 1 is the ratio of non-common volumes of the two 3-D models to their union. Thus, zero error indicates two identical volumes, and the maximum unity error corresponds to no common volume. We utilize E V primarily to determine the correlation with E I and whether E I (which is computable) can serve as an indicator of E V (which we cannot determine in practice).

2.6. Enhanced Target Images

As discussed, almost all object views are generally corrupted by the ghost image, and only some by the mirror image component. For any arbitrary sonar pose, we can synthesize a noise-free, uncorrupted image from the 3-D target model. In addition, it is highly desired to generate enhanced real object views by removing the ghost contributions.
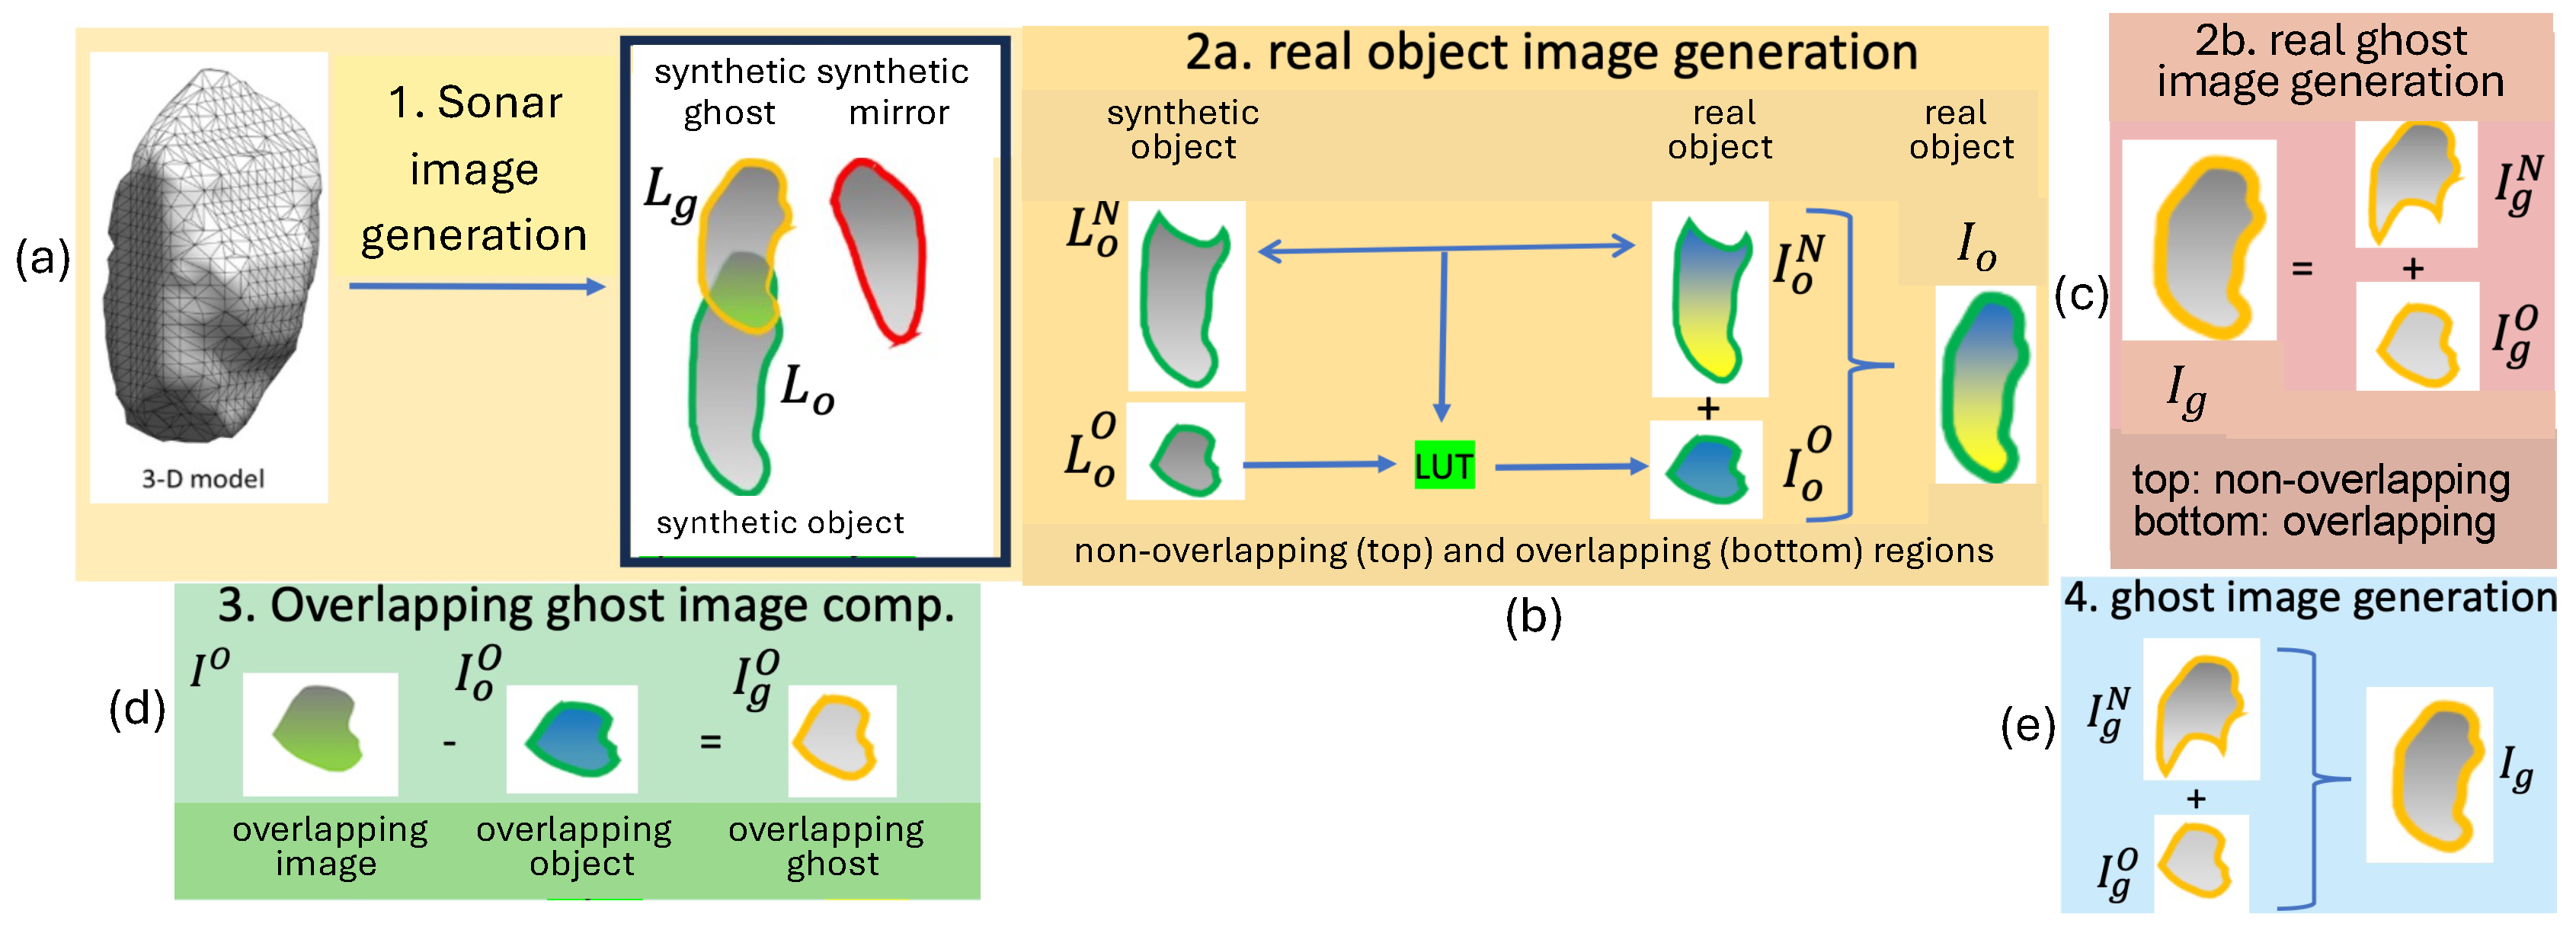
Let I o = ( I o N , I o O ) and I g = ( I g N , I g O ) denote the intensity values of object and ghost components, respectively, formed by the union of their respective overlapping and non-overlapping regions (steps 2a and 2b in Figure 5b,c). Ignoring the impact of noise, I o N and I g N are measured directly from the image. The object image enhancement involves the generation of I o by the estimation of I o O . In the process given below to generate the object image, we assume the transformation to map the synthetic image to the real data within the non-overlap object region can be reliably applied to estimate the intensity values of the object within the overlap region. Referring to Figure 5, the complete process involves the following steps:
  • Generation of synthetic logarithmic object image L o based on the model in [26], applied to the 3-D object model S ˜ (step 1);
  • Localization of ghost region by employing the estimated sonar pose parameters [19,20] (step 1);
  • Segmentation of non-overlapping and overlapping object regions L o N from L o O , respectively (step 2a), and the generation of normalized intensity values L ^ o N with zero mean and unit variance;
  • Calculation of mean-variance pair { I ¯ , σ I } of intensity values I o N , and applying the transformation L o N = σ I L ^ o N + I ¯ ;
  • Construction of look-up table (LUT) to transform L o N to I o N by matching their histograms (step 2a);
  • Computation of scaled intensity values L o O = σ I L ^ o O + I ¯ within overlapping object region, and applying the LUT to map L o O values to I o O values (step 2a).
In some applications, including the development and verification of a ghost image formation model, it may be desired to isolate the ghost component from the real data. Figure 5c–e depicts the process, once the object image has been computed as described above.

3. Results

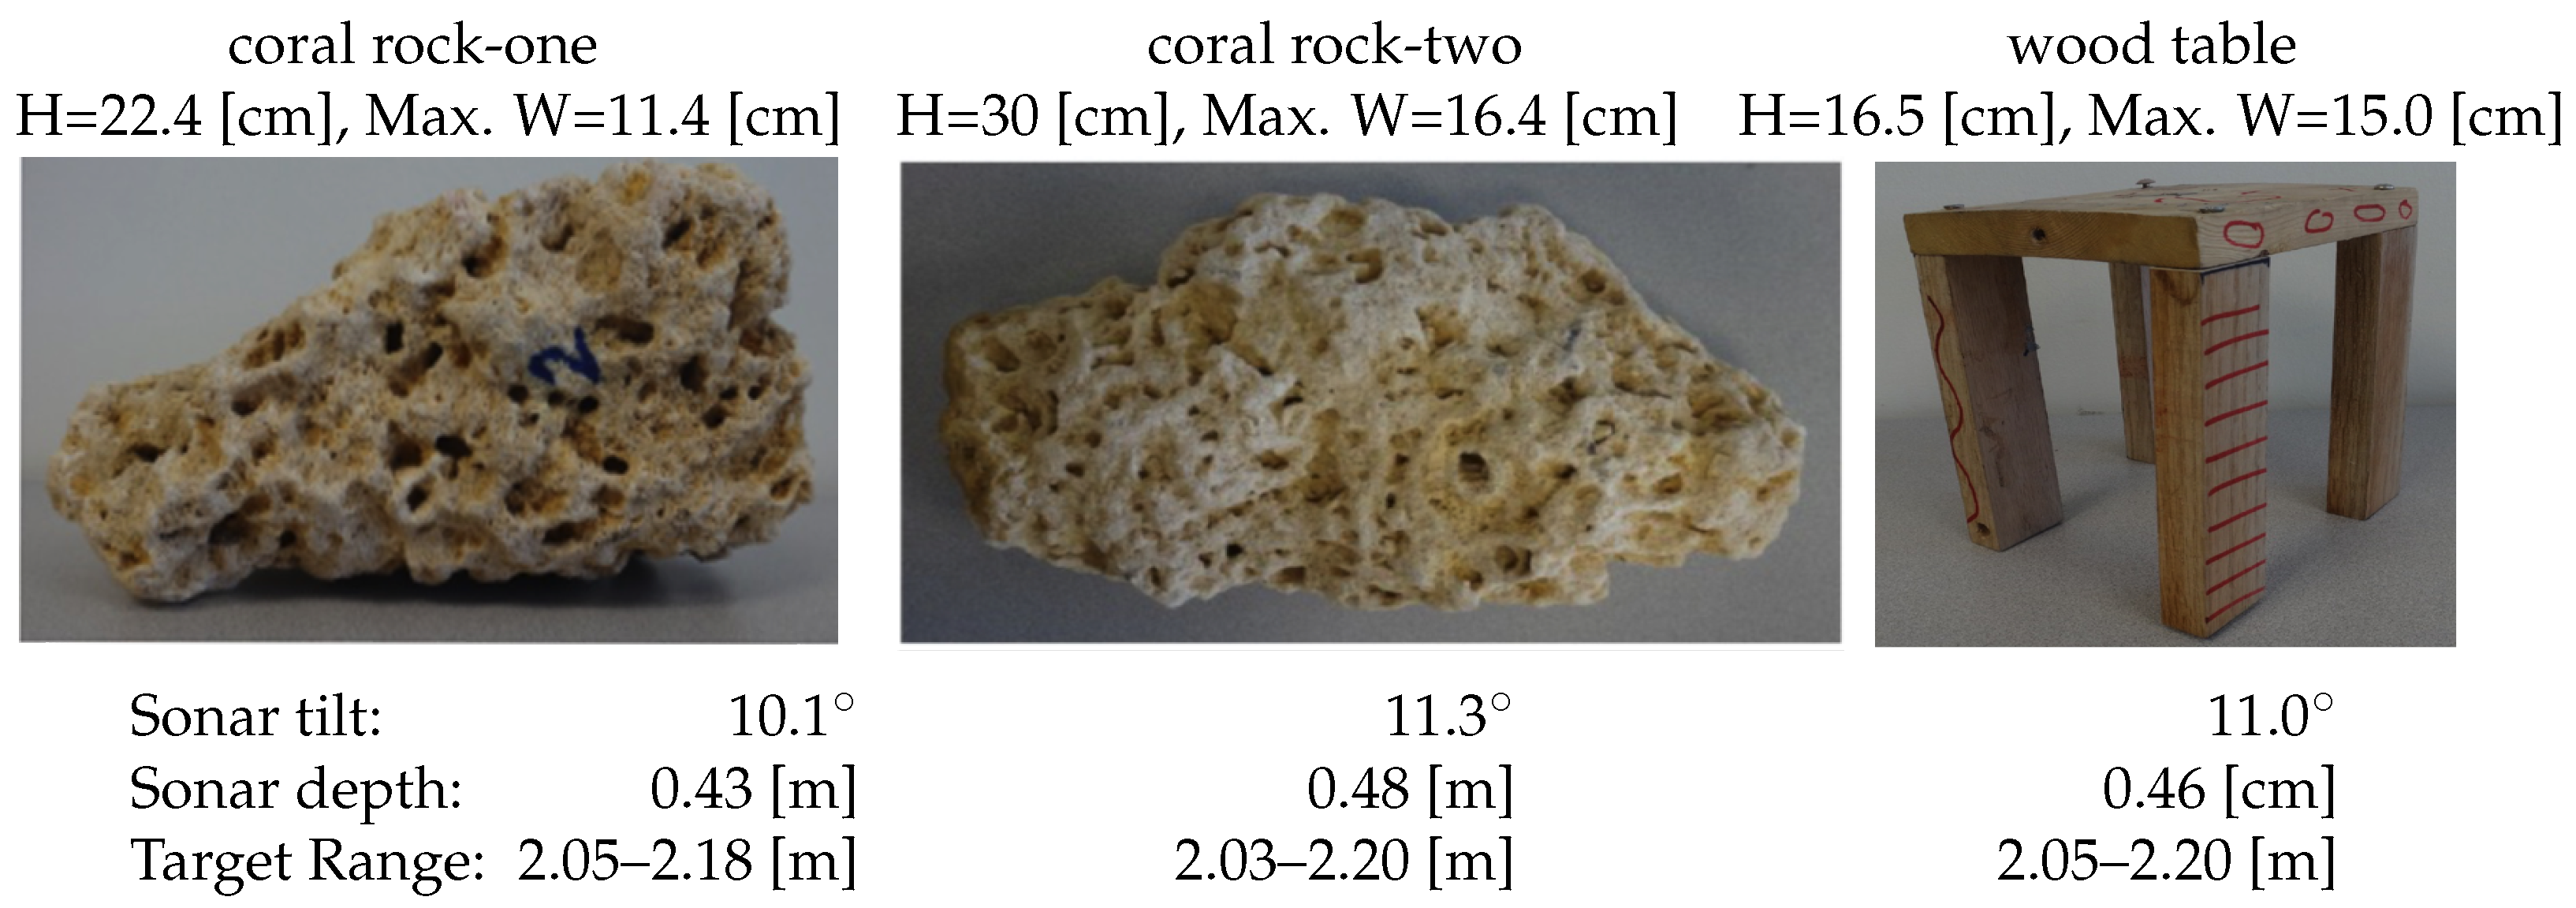
Experiments with both synthetic and real images of three targets are presented to demonstrate different aspects of our method. These include two “dominantly-convex” coral rocks with mild local concavities and a concave “toy” wood table; see Figure 6.
The simulations with synthetic data allow us to assess the performance and convergence of the unified optimization scheme, namely, errors in converged sonar depth and tilt angle values, the discrepancy between the optimized 3-D model (initialized by the SC solution) and the Kinect 3-D model, as well as the consistency of results from experiments with synthetic and real data.
For ground truth, we employ the 3-D surface mesh models of these objects generated by a Kinect camera, utilizing Kinect video while slowly rotating the target in air at a distance of about 1 [m]. Although not perfect, various spot measurements confirm an accuracy of better than an order of magnitude in comparison to the average error of 3-D models generated from the 2-D sonar data. The real data for the two coral rocks comprises 16 total images at two opposite, north (N) and south (S) sides of each object. At each position, eight images are captured while the sonar rolls on a motorized rotator about the viewing axis from −90° to 67.5°, in increments of 22.5°; the unrotated (zero-degree roll) at the S position is the reference view. For the wood table, we have a total of 32 images from four sides: east (E) and west (W), in addition to N and S.
We employ these sonar poses and the parameters of each experiment listed in Figure 6 to generate the synthetic images of the 3-D Kinect model by applying the DIDSON image formation model [26]. In assessing convergence, all experiments are initialized with the 3-D SC model [39] and imprecise depth and tilt-angle values.
Finally, the mirror component overlaps with the object region in three views: at the reference pose and two rotated views at roll angles of ±22.5°. Discarding these, the optimization is applied to 10 images of each coral rock and 20 images of the wood table (recall that we require a distinct mirror region boundary in the optimization process). Moreover, we treat the discarded views as the new ones to compare with the computer-generated images.

3.1. Experiments with Synthetic Data

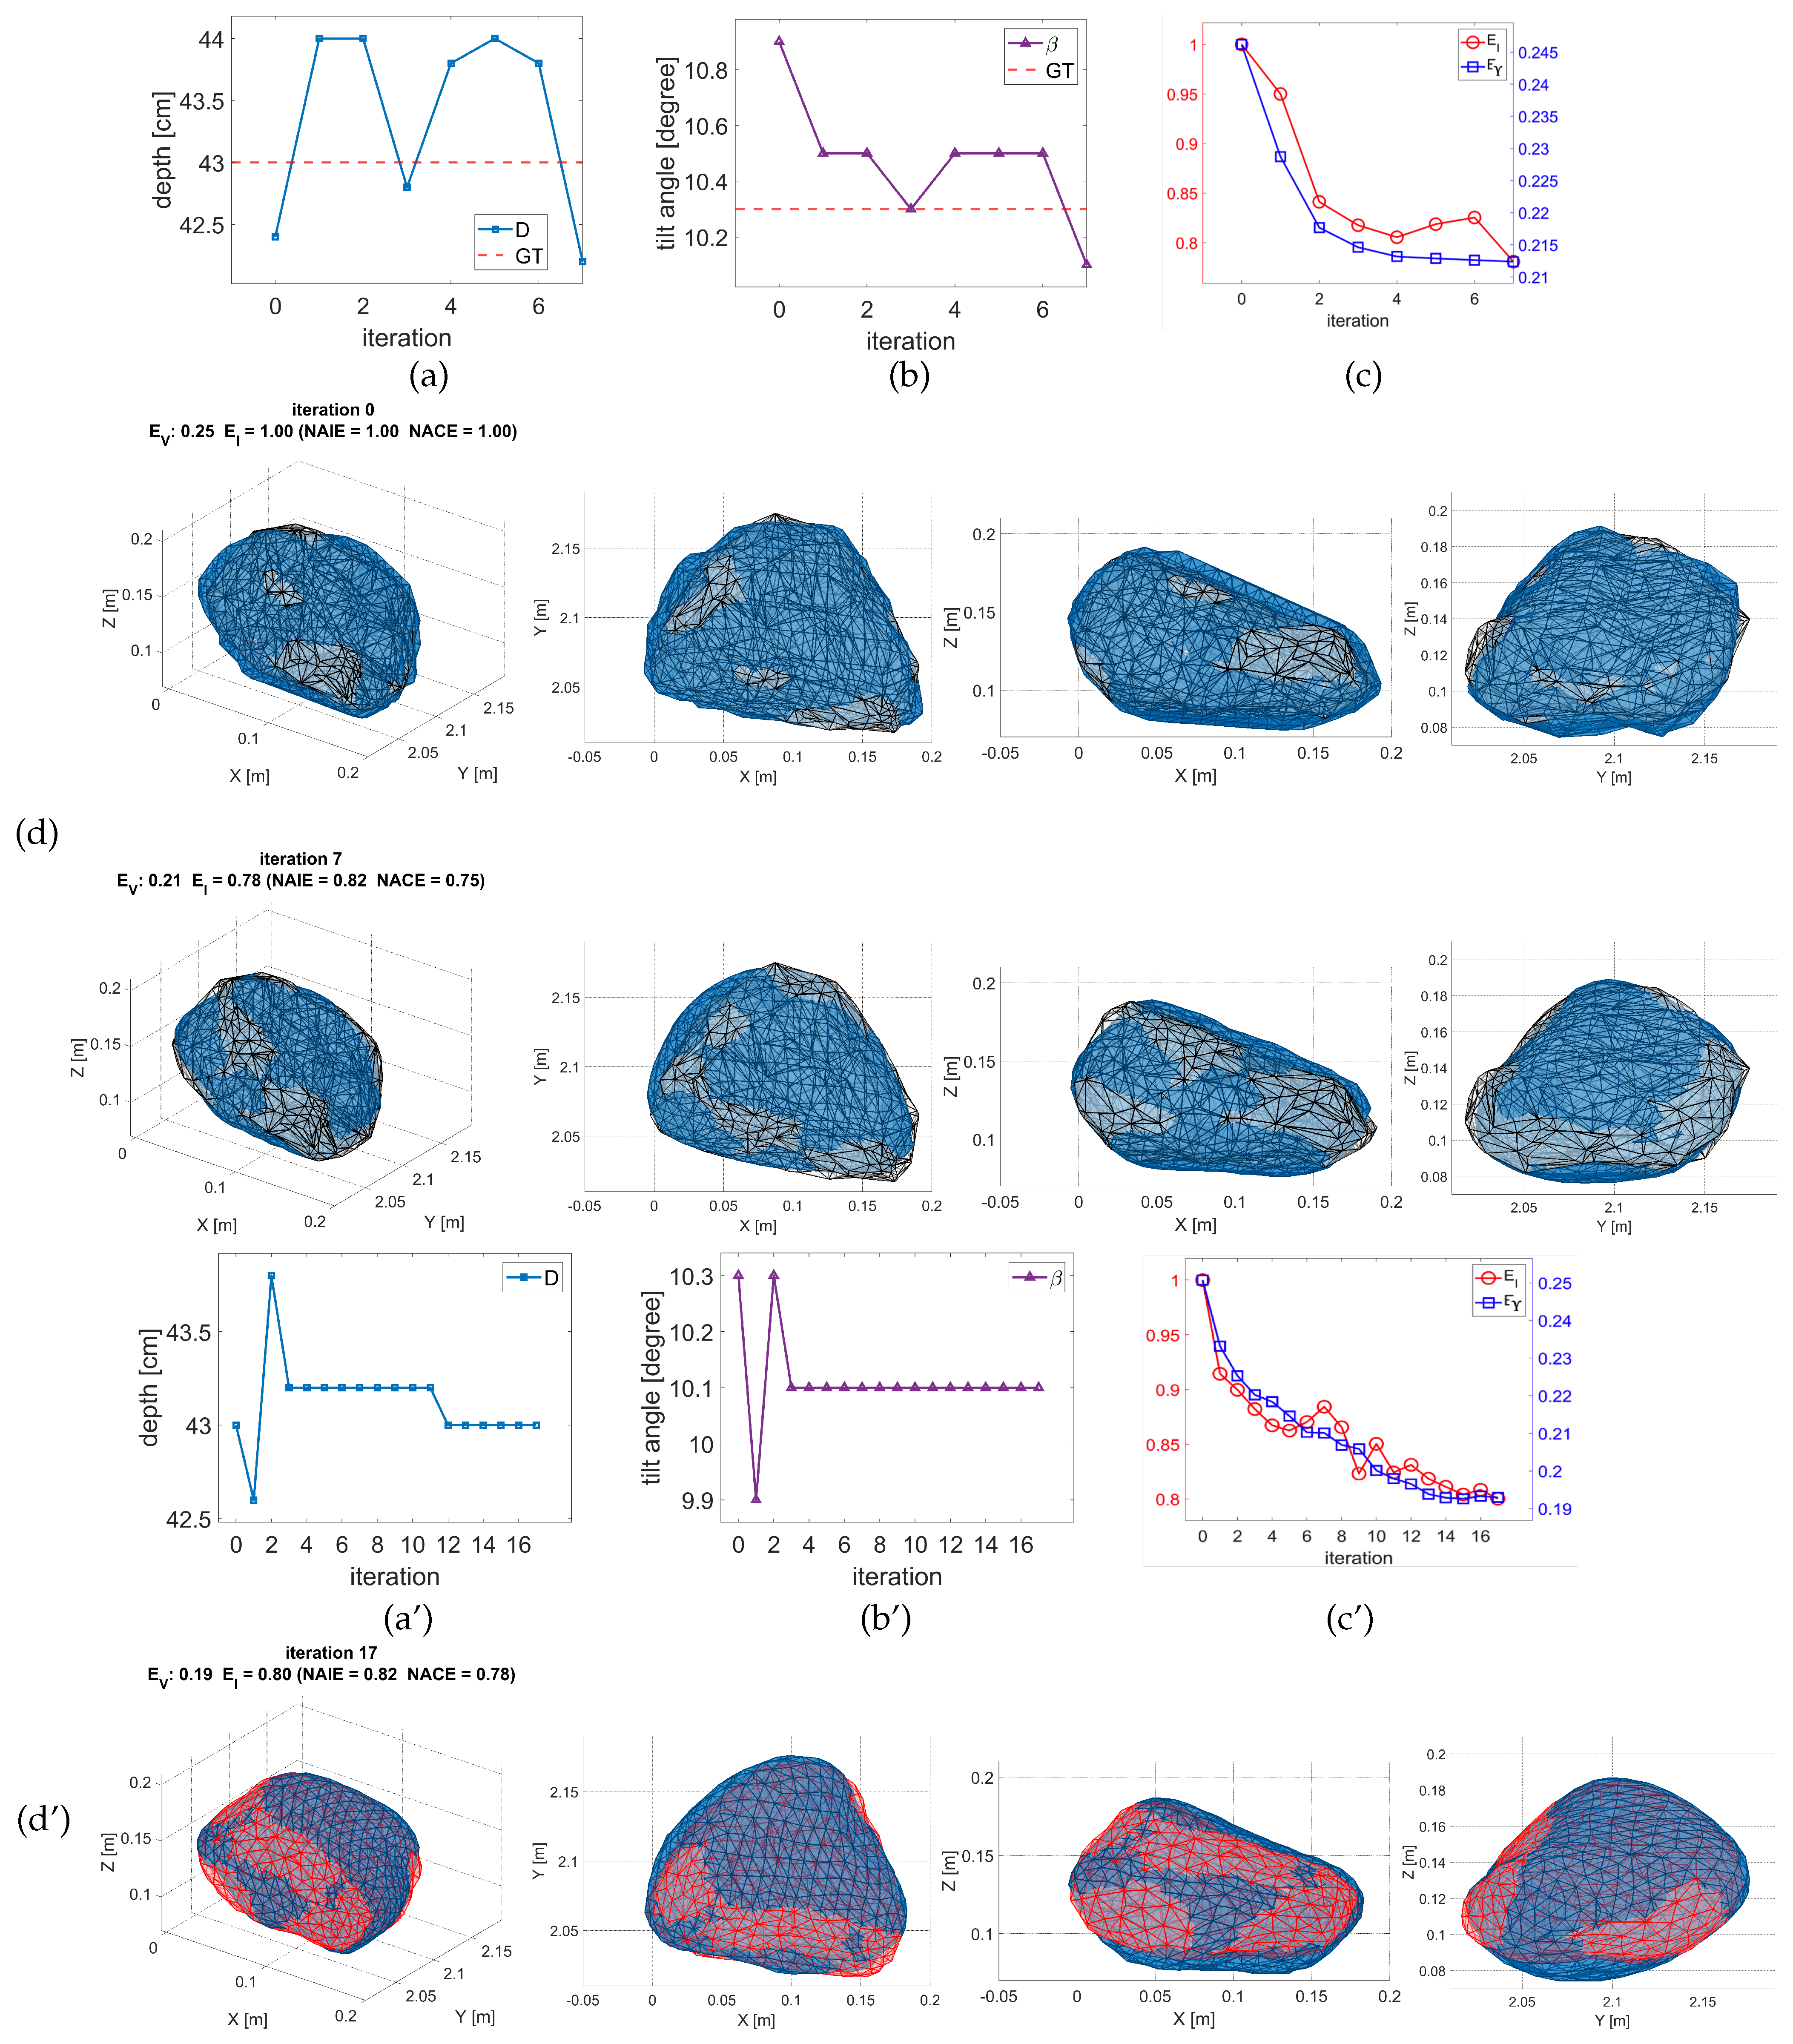
Figure 7a–d depicts the results of the experiment with the coral-one data. The sonar depth and tilt parameters in (a,b) approach the assumed values of 43 [cm] and 10.3° (shown in red dashed lines) in seven iterations. In (d), we compare the initialized SC solution (top: blue mesh) and optimized 3-D model (bottom: blue mesh), superimposed on the Kinect model (black mesh). Decreasing in tandem, the image E I and volumetric E V errors in (c) confirm that the reduced image error leads to an improved 3-D model. Thus, the measurable E I serves as an indicator of incalculable 3-D modeling accuracy. Initialized with the SC solution, the improved target model after seven iterations reduces the volumetric error by about 16% and the image error by better than 20%.
Similar results are obtained for the second coral rock. Referring to Figure 8a–d, the sonar depth in (a) and tilt angle in (b) approach the assumed values of 48 [cm] and 11.5° (red dashed lines), and the image and volumetric errors in (c) improve by better than 20% in four iterations.
A noteworthy observation is that the reconstructed 3-D models of both rocks preserve (some of) the mild local concavities of their surfaces. For example, these are pronounced in the X Y and X Z views of coral-one; see columns 2–3 in Figure 7d and Figure 8d.
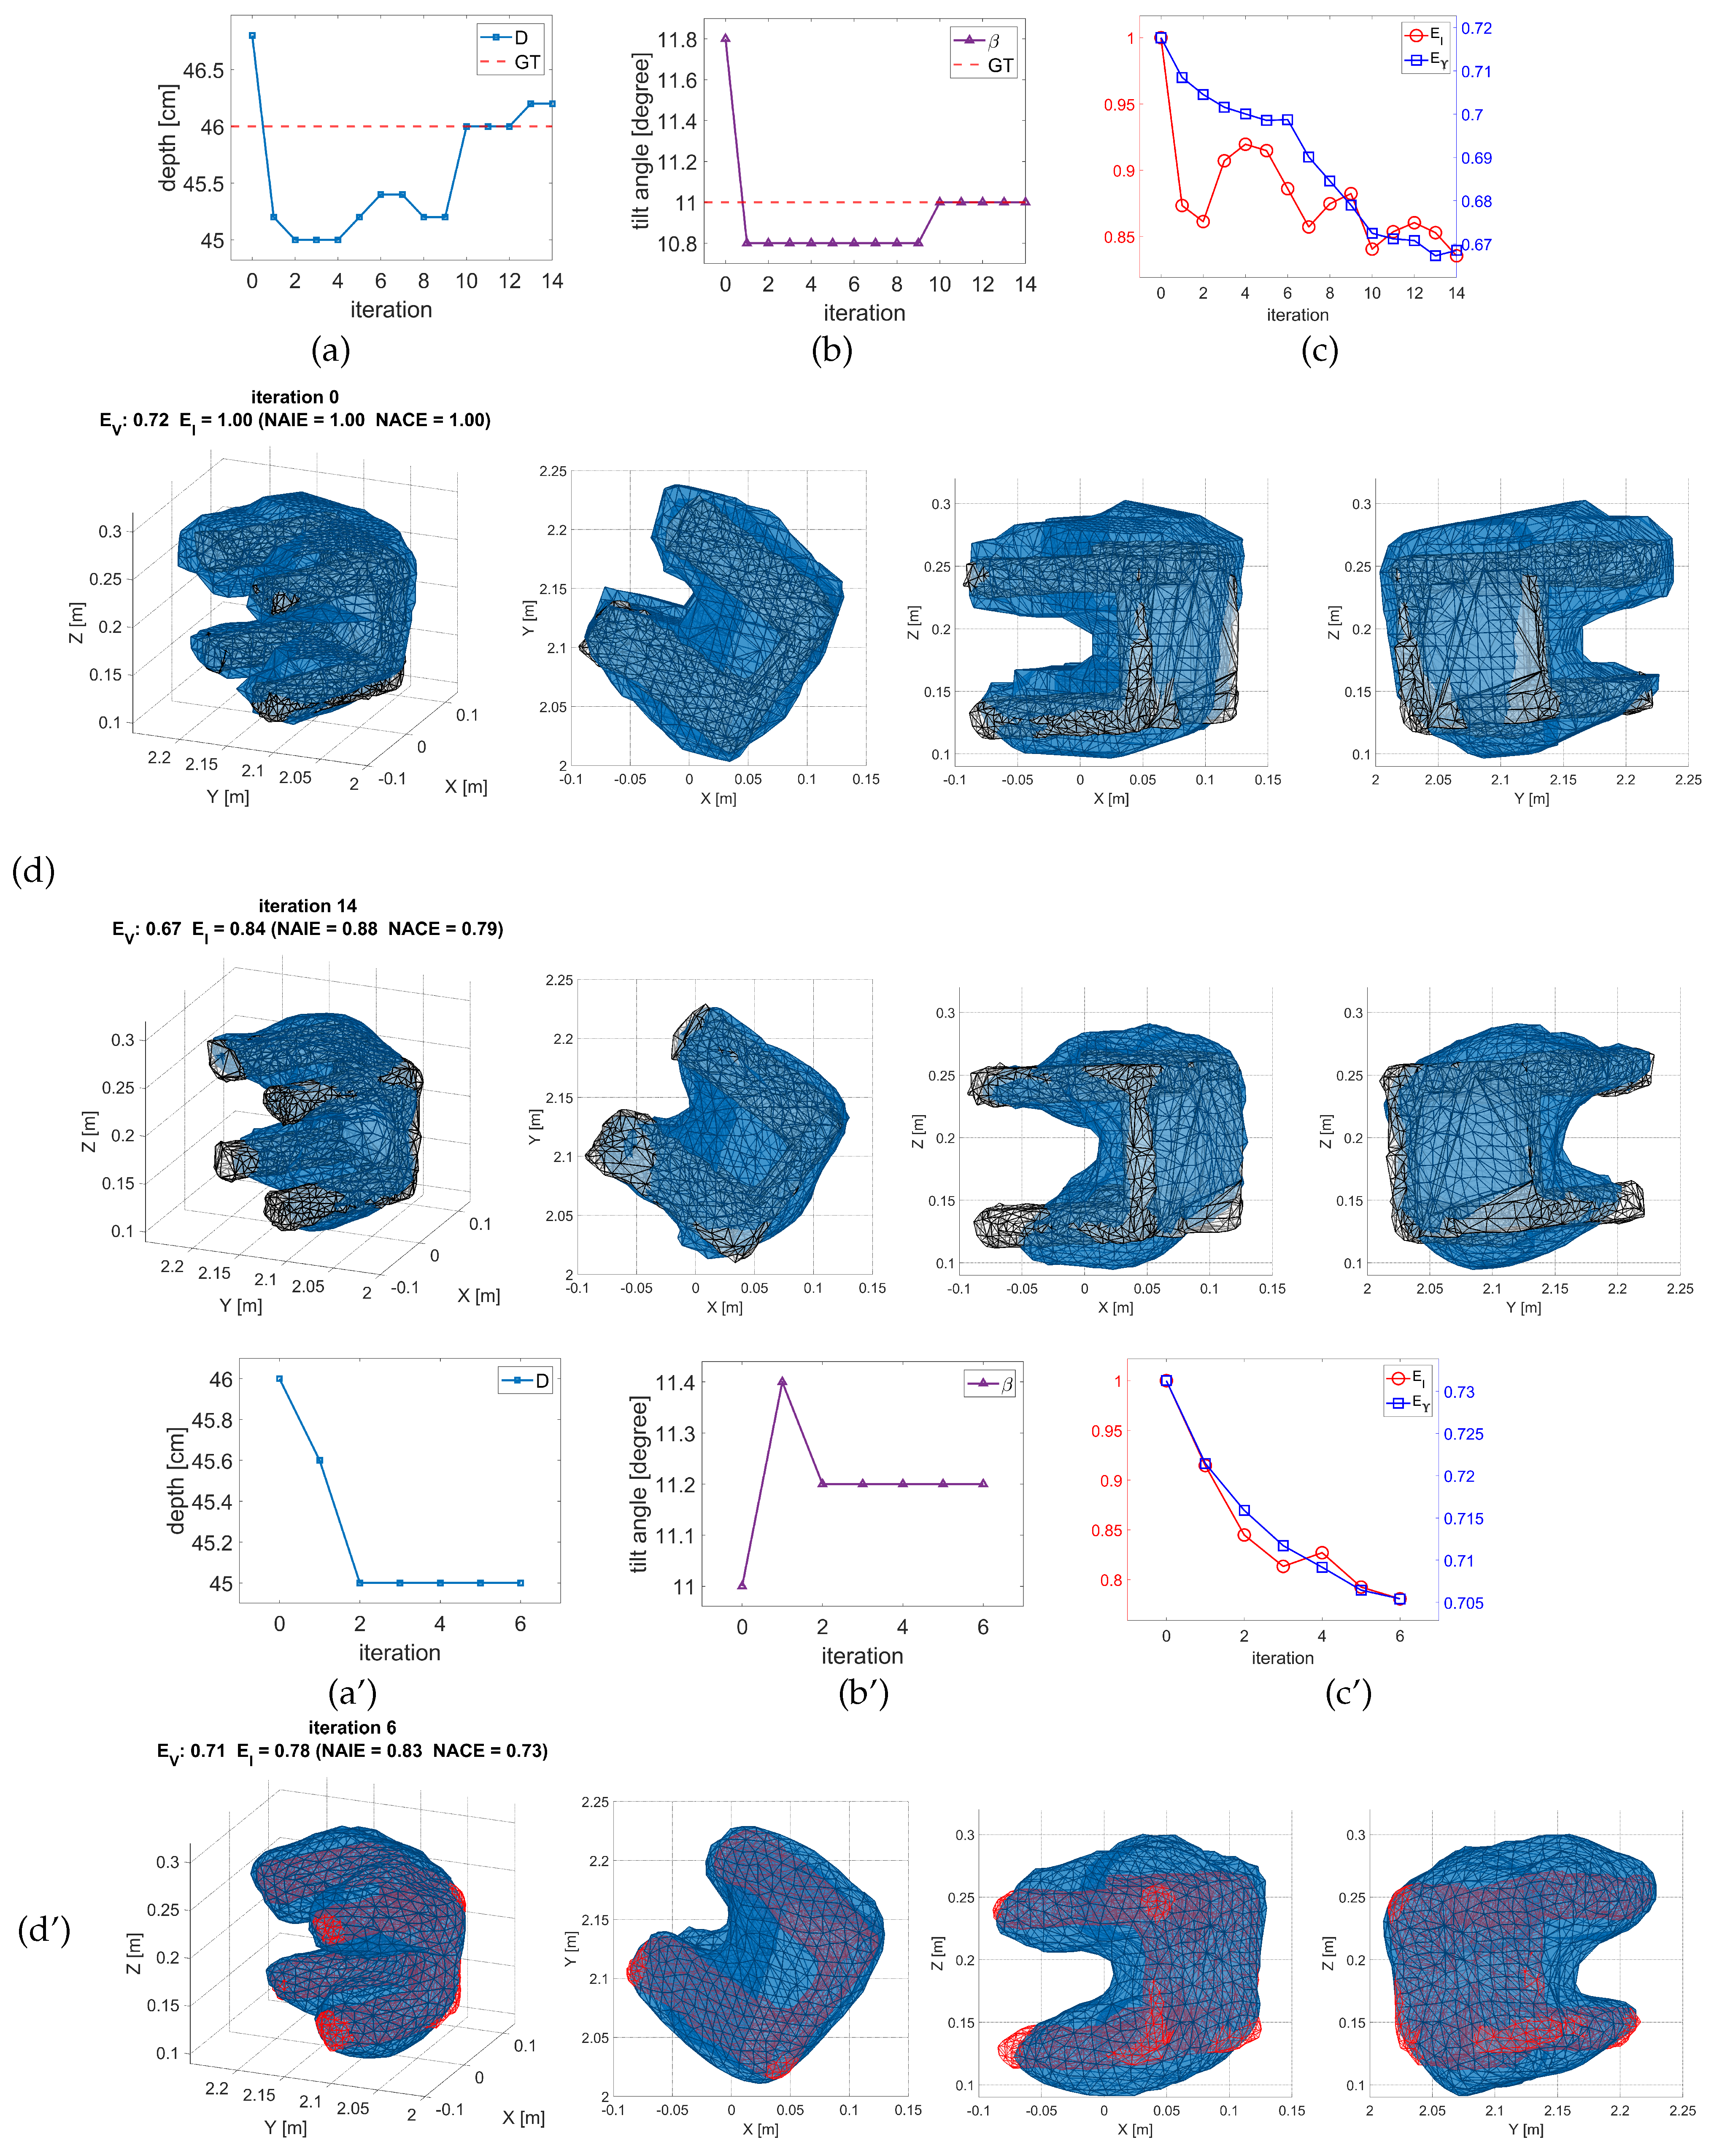
The experimental results for the concave wood table are presented in Figure 9a–d. Here, the reverberation among the inner surfaces of the four legs leads to their inflated appearances in different views. Minimizing the discrepancy between the data and synthetic images yields a 3-D model with thickened legs. Consequently, the volumetric improvement (with respect to the initial SC solution) in (c) is relatively insignificant, despite an image error improvement of better than 20%. Still, the reconstructed 3-D model captures the structural and topological properties of the shape, including the top surface, four legs, and the deep concavity within these legs.
Moreover, the convergence of the sonar depth in (a) and tilt angle in (b) takes 10 iterations. A notable observation in (c) is the non-monotonic convergence of the image (red circles) and volumetric (blue squares) errors. These errors increase (before resuming the improvement in accuracy) at iterations where the sonar pose parameters diverge from their true values (red dashed lines).

3.2. Experiments with Real Data

Figure 7d’, Figure 8d’, and Figure 9d’ are the 3-D Kinect (red. mesh) and the optimized model based on initialization with the SC solution (blue). The reconstruction accuracy of the optimized model is consistent with those from the computer simulations, albeit at a slower convergence rate; compare (c) and second row in (d) with (c’,d’) in each figure. The same conclusion is drawn from the wood table reconstruction, despite inferior precision relative to the two dominantly convex coral rocks. Interestingly, the convergence is achieved monotonically and faster, directly tied to the same behavior for the sonar pose parameters.
Here again, some of the mild concavities of the two coral rocks are recovered, as in the experiments with the computer-generated data. Moreover, the reconstructed model captures the structural and topological properties of the wood table. The largest discrepancy arises in the coral-two reconstruction over the SW–W and E–NE regions (e.g., see X Y projection). Here, the thickness variations are not replicated in the estimated model, mainly due to the unavailability of data from the E and W directions (this has been confirmed in an experiment with real-synthetic mixed data, using additional computer-generated views from these two positions [19,20]).
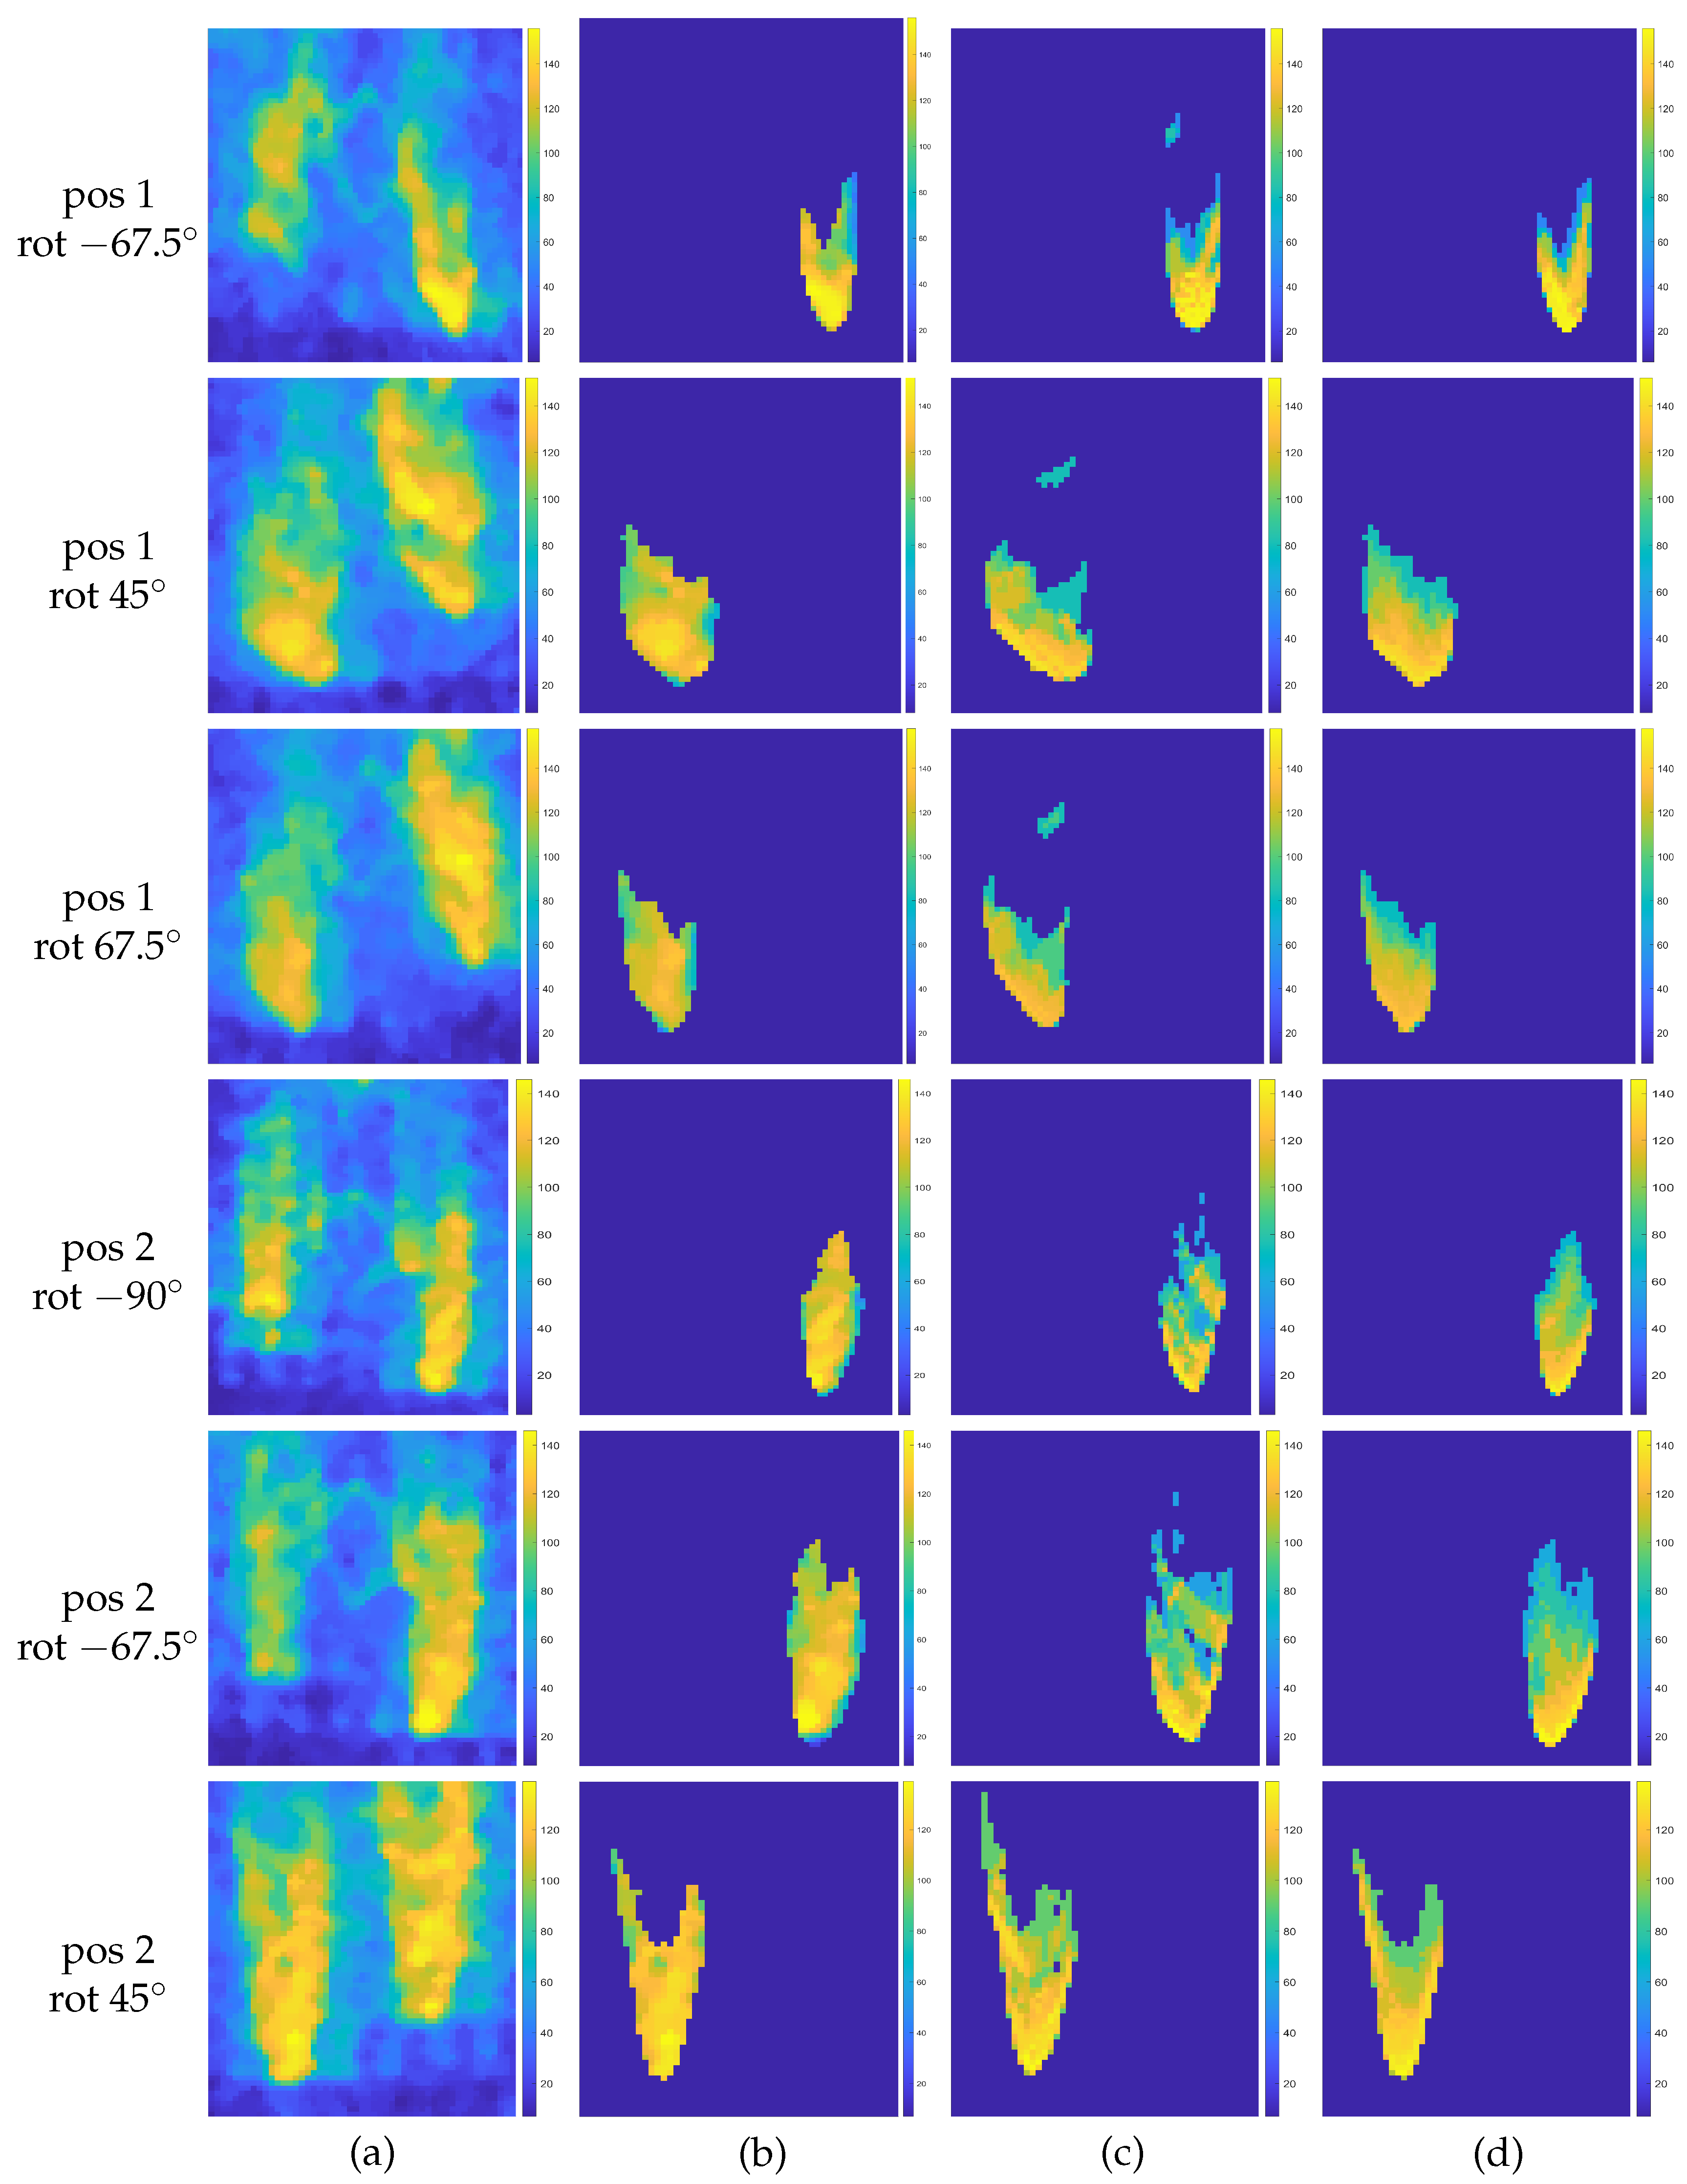
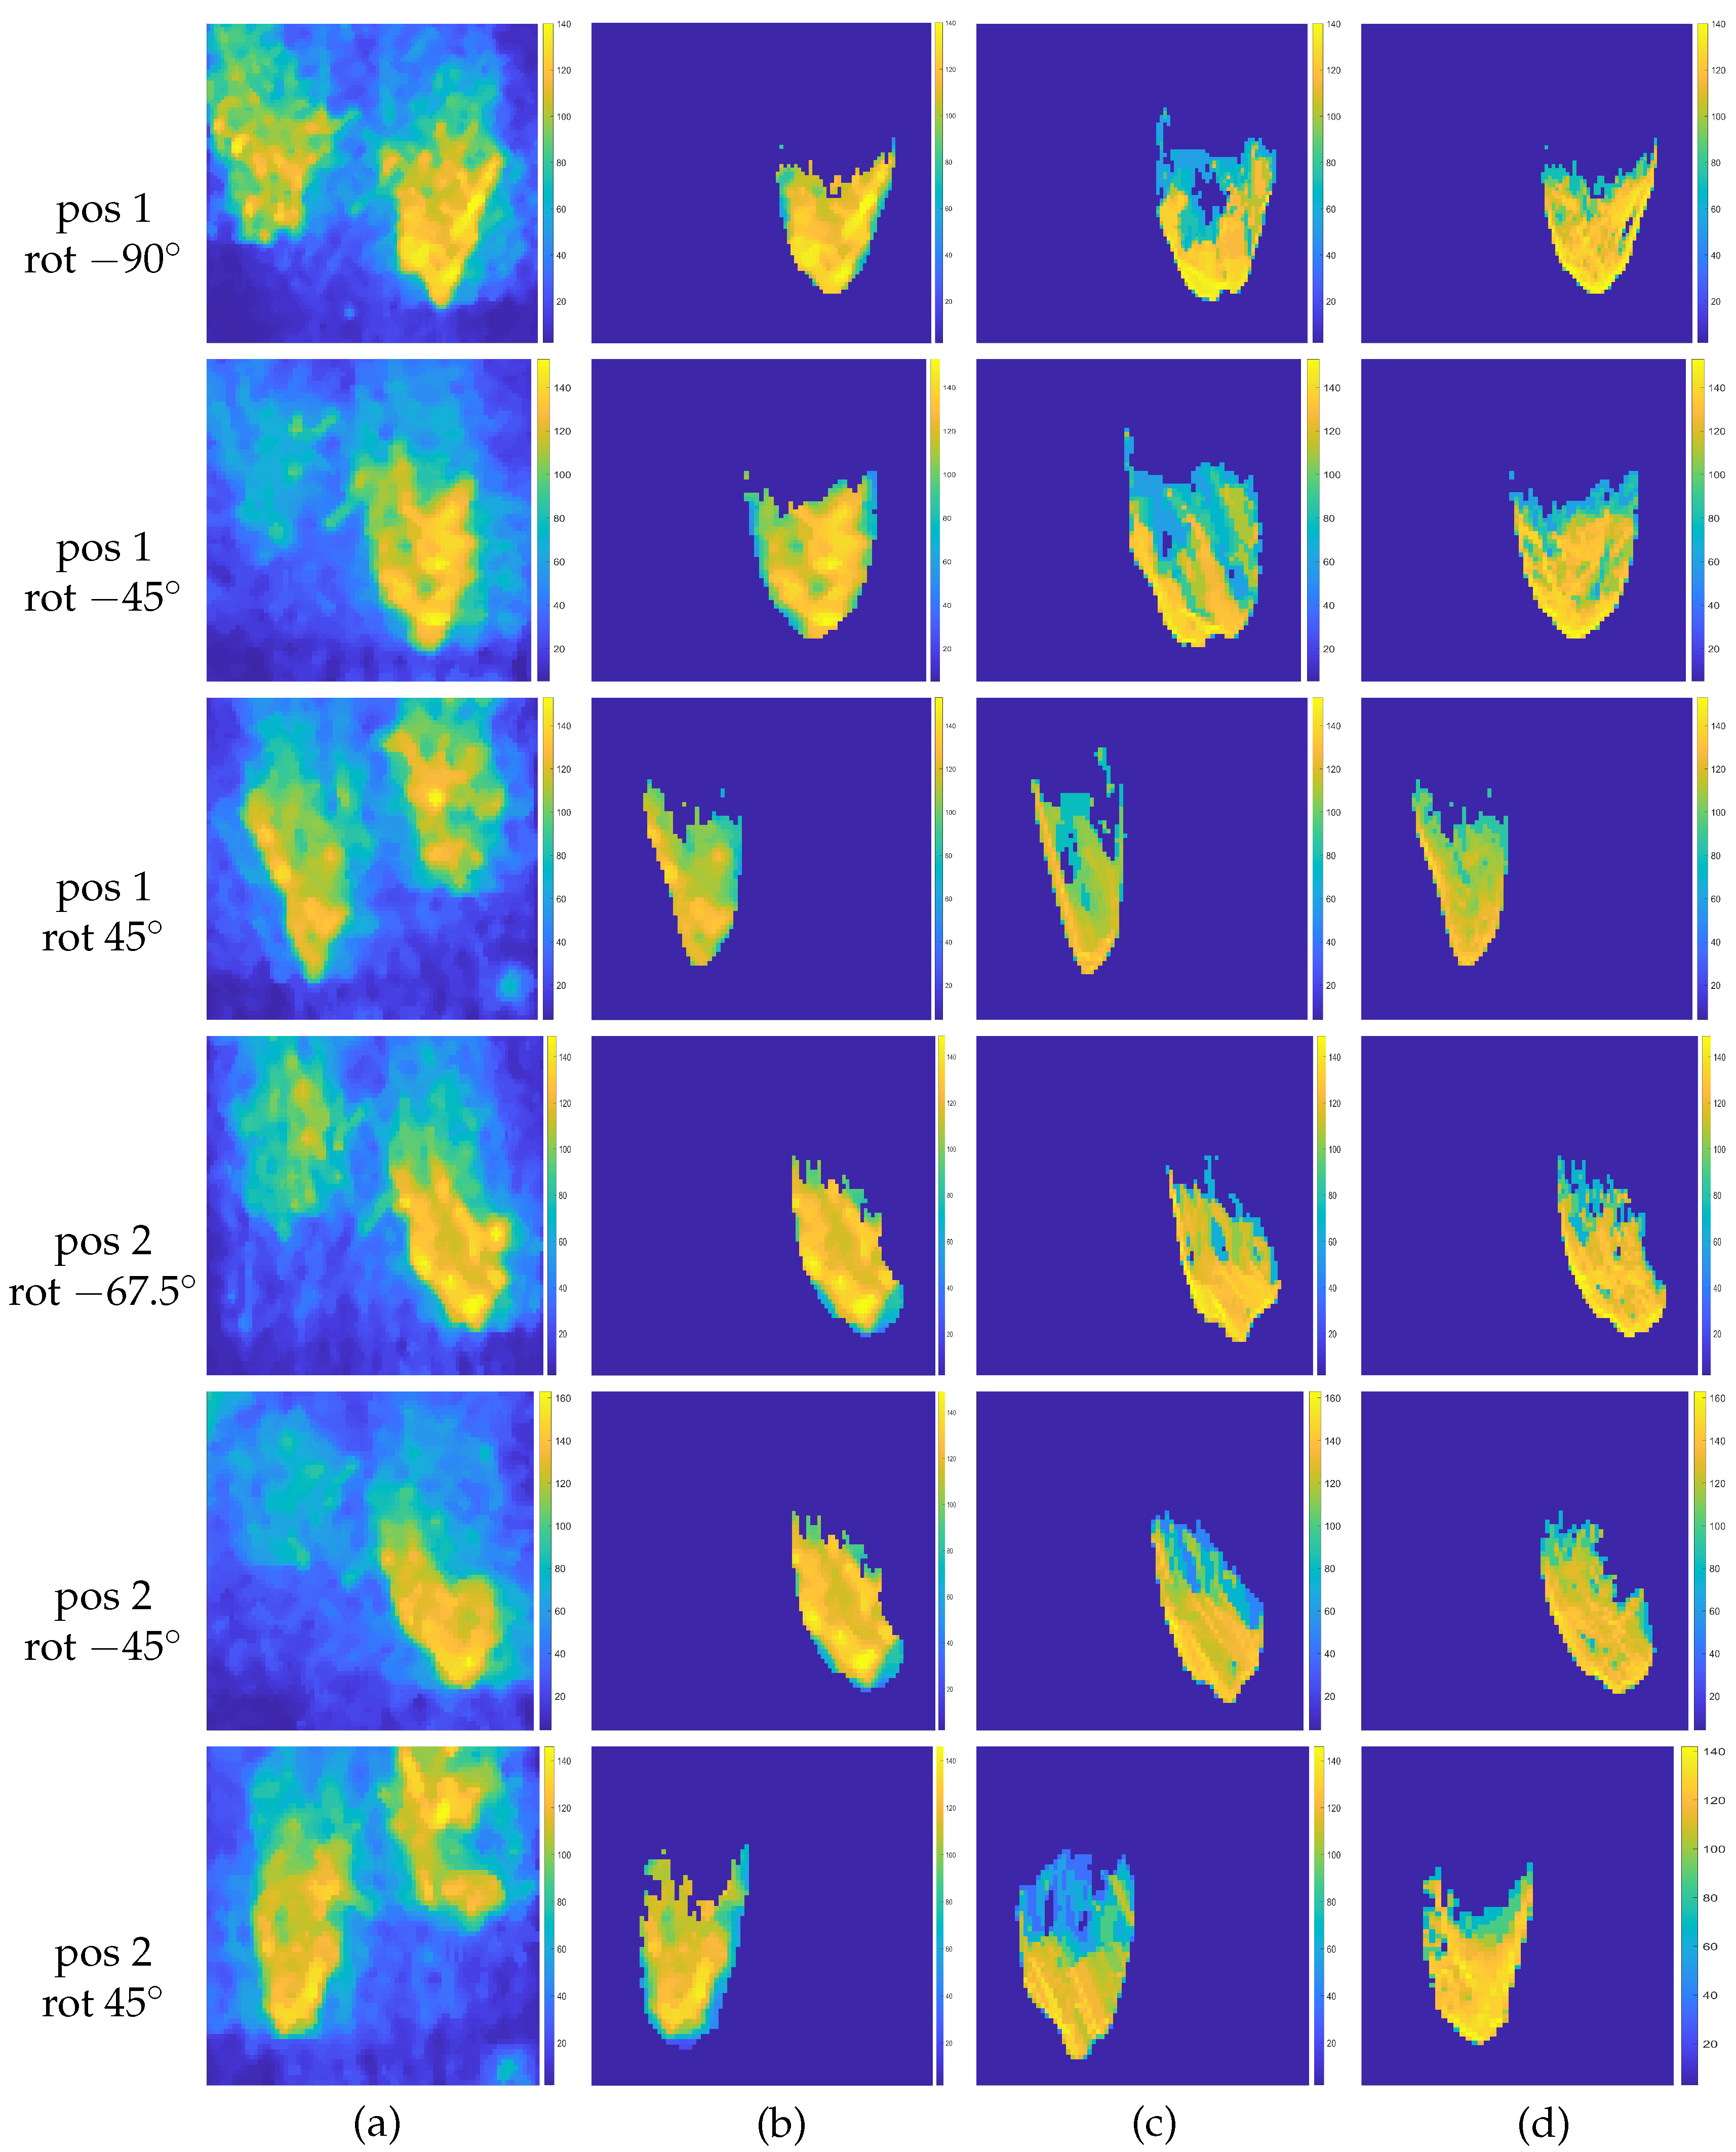
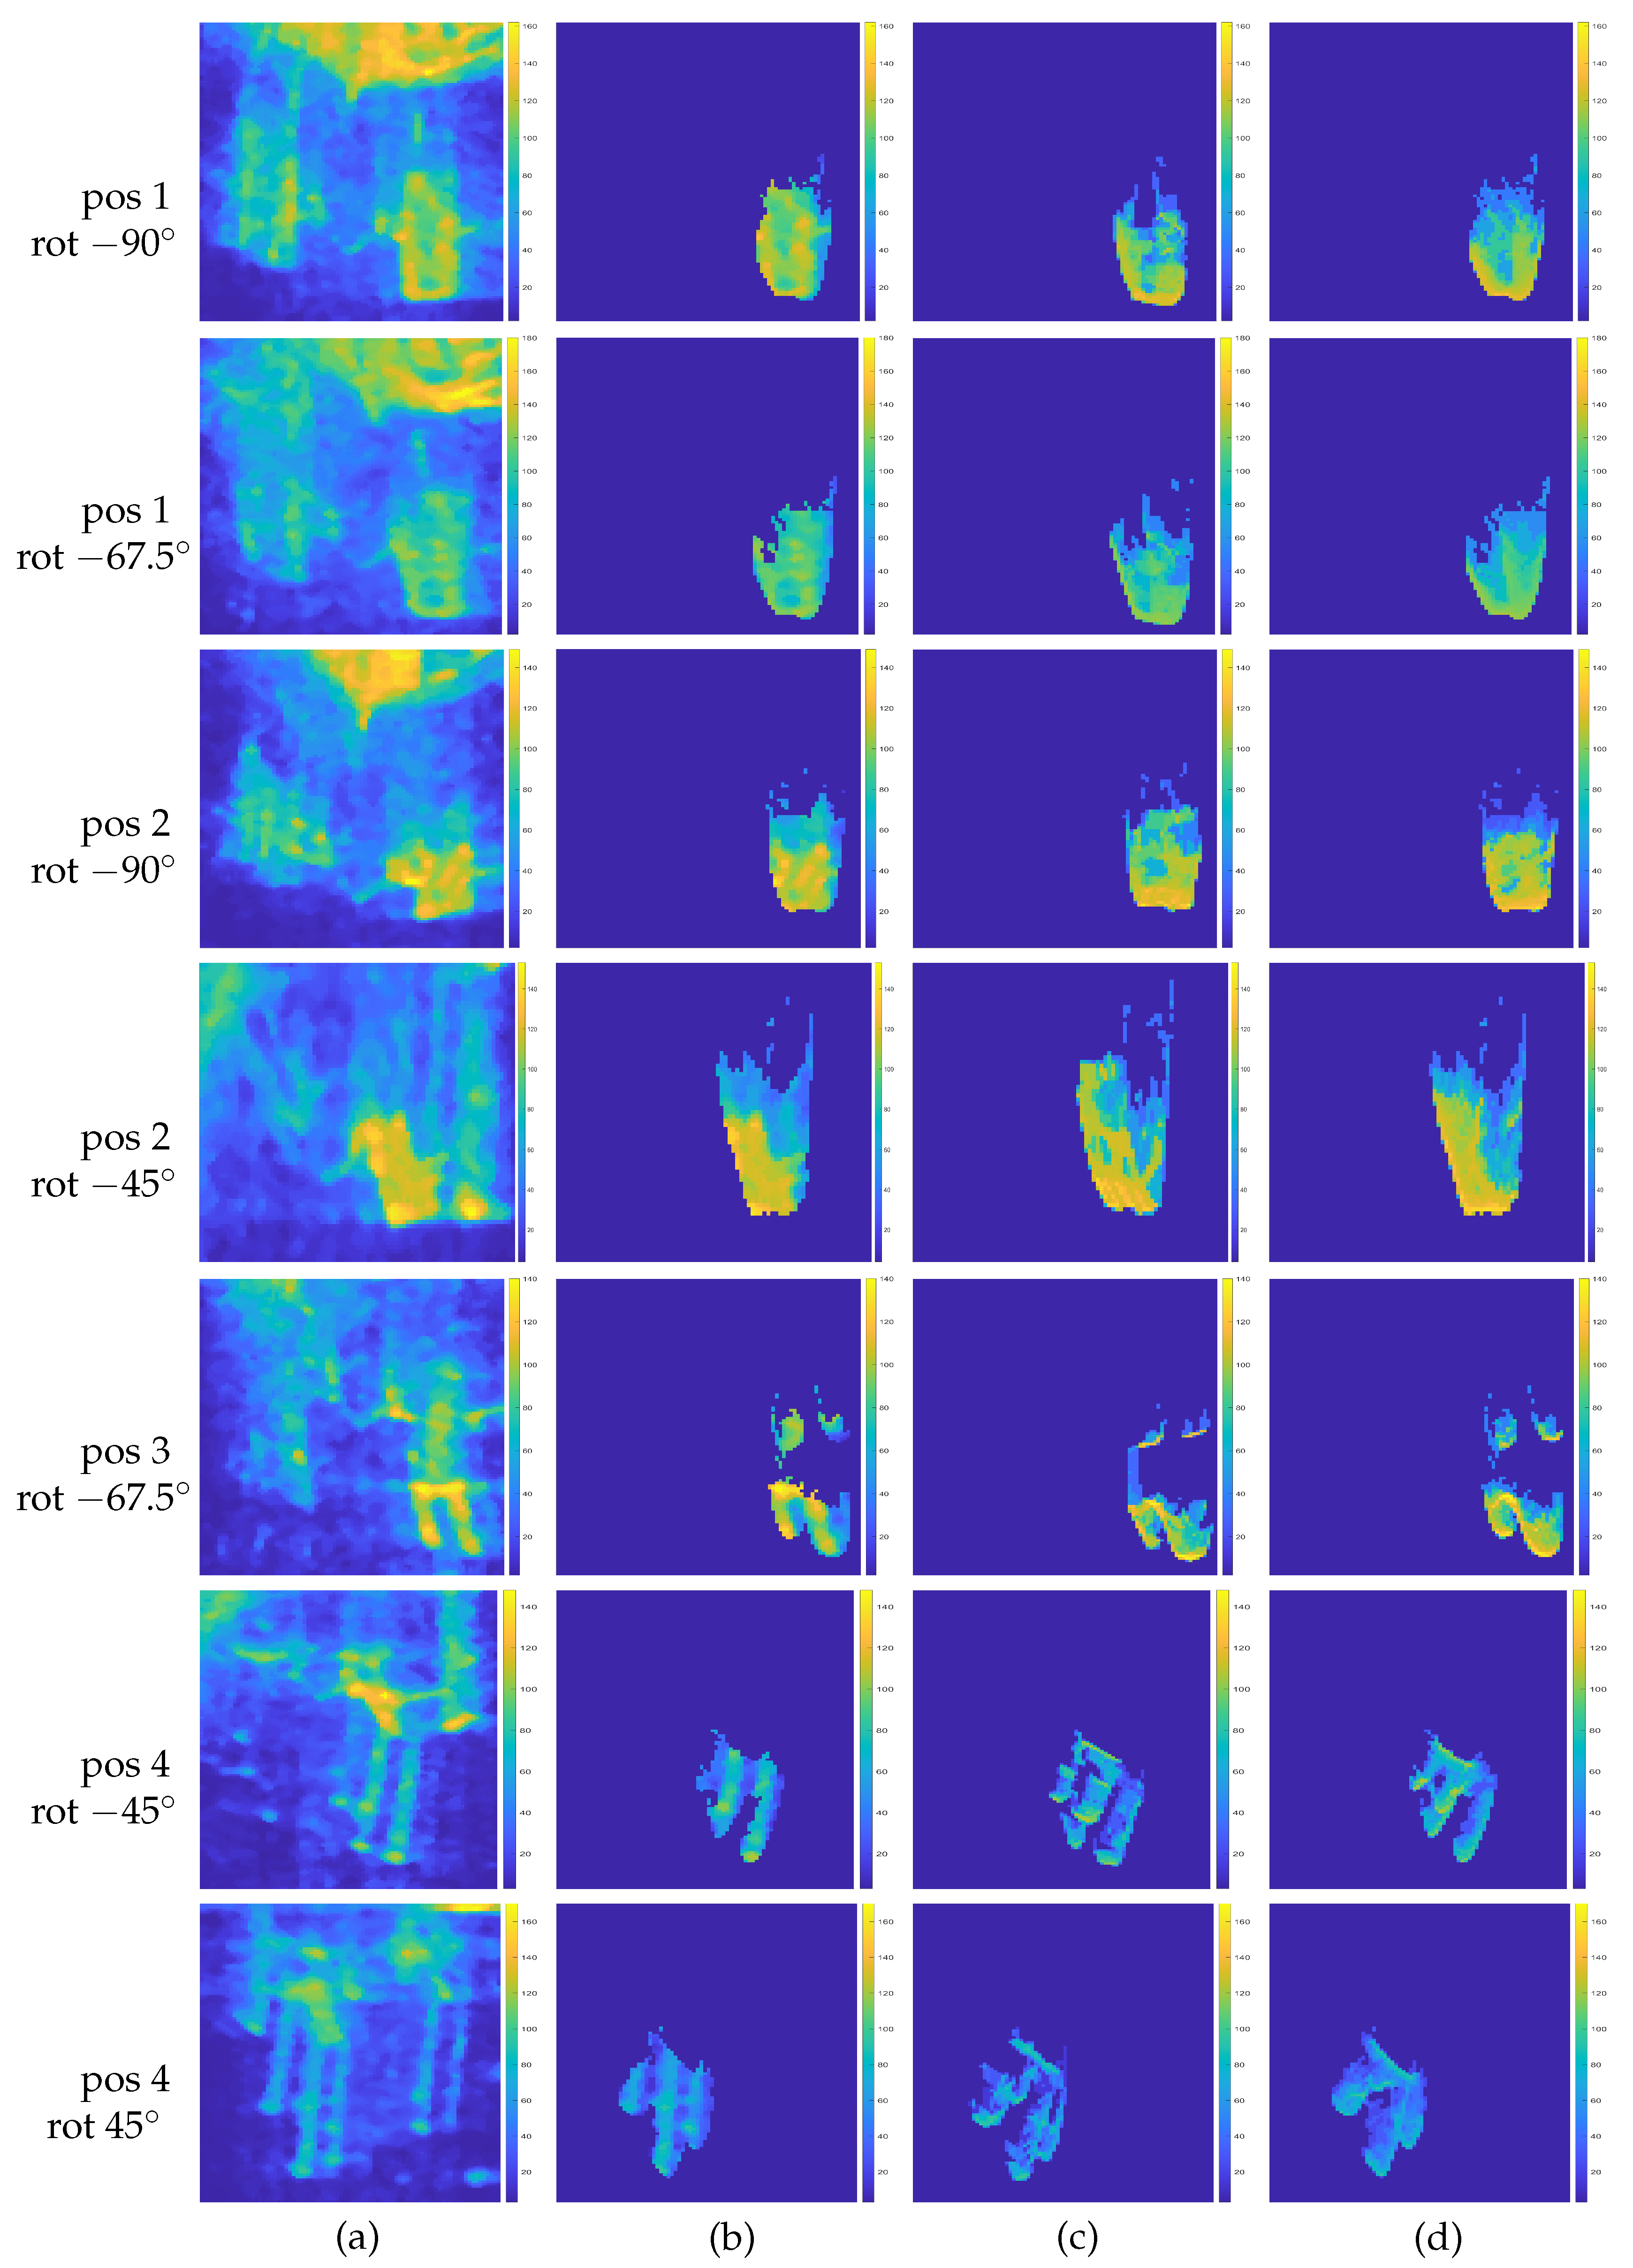
Next, we present sample results of target image enhancement. For the first coral rock, Figure 10 depicts three samples, out of five rotated views used in the optimization at S (pos 1) and N (pos 2) sonar positions. Columns (a,b) include the original data and the processed ghost-free image, respectively. Columns (c,d) are the synthetic images constructed from the initial SC and optimized 3-D models, respectively. We can readily confirm that the consistency within the object region in the data and synthetic images improves in almost all views after optimization. The same conclusions are drawn from the results for the second coral rock in Figure 11 and the wood table images in Figure 12 (despite the lower 3-D reconstruction accuracy of the optimized solution).
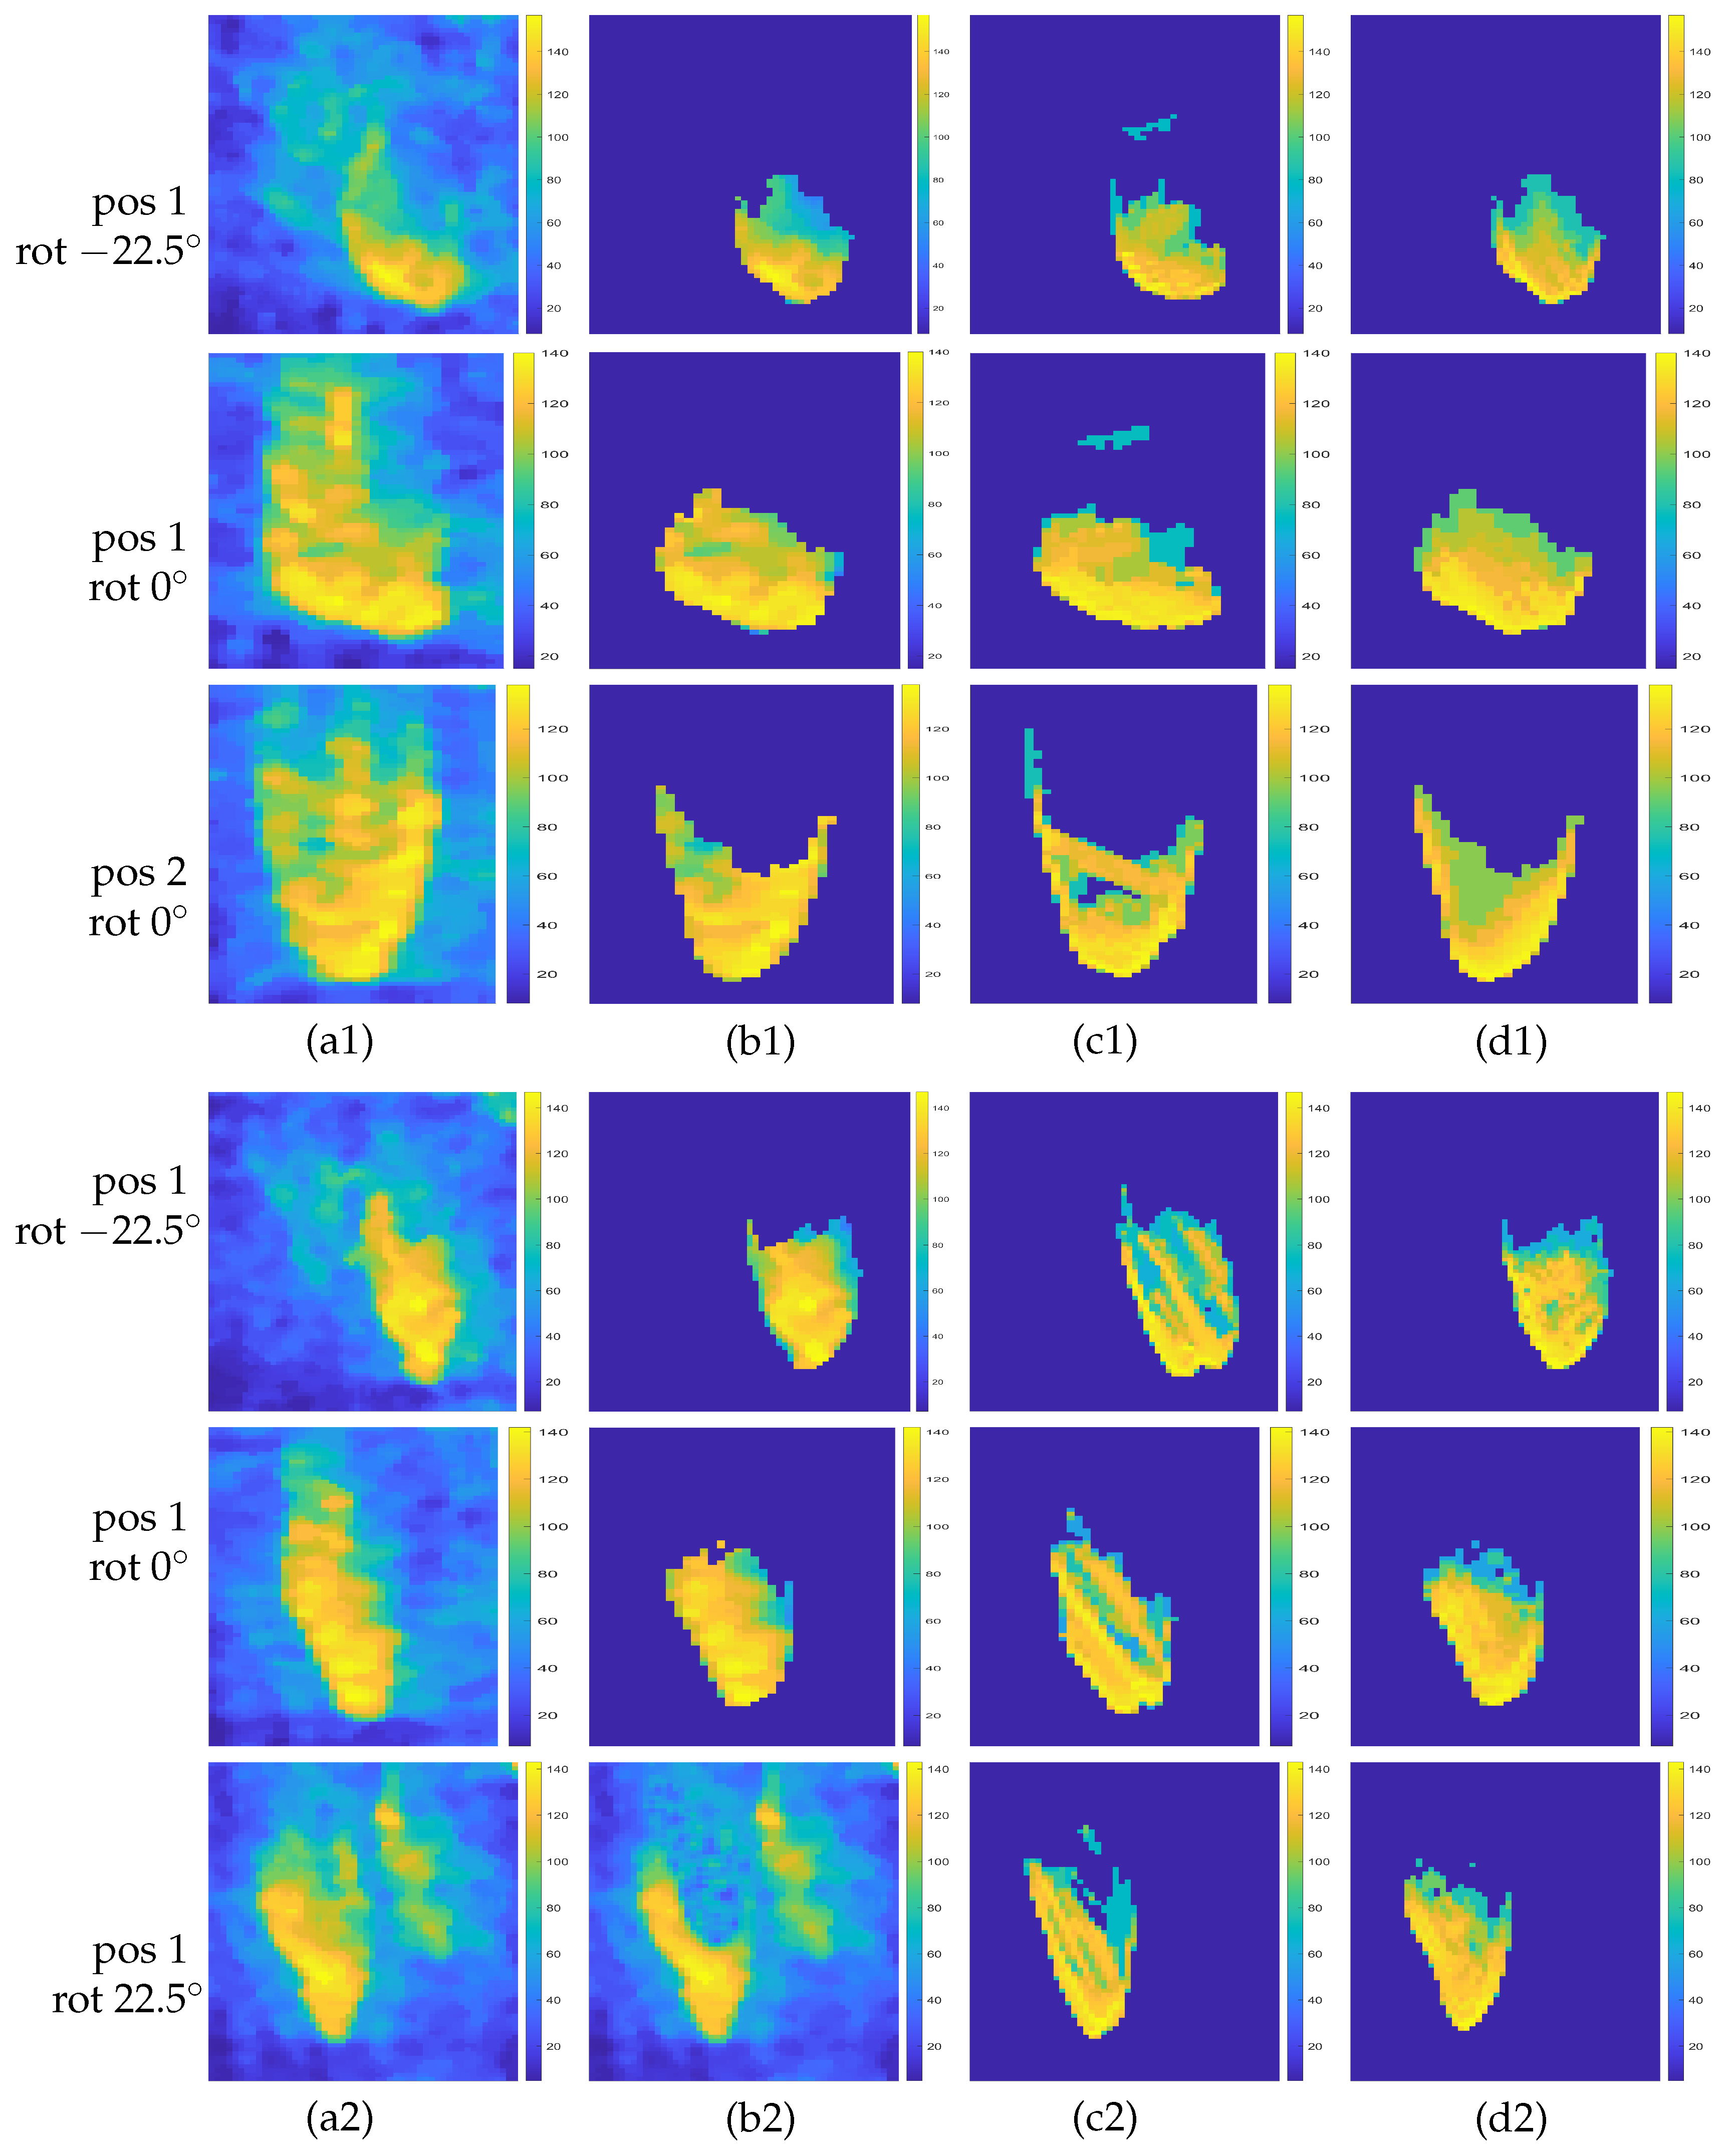
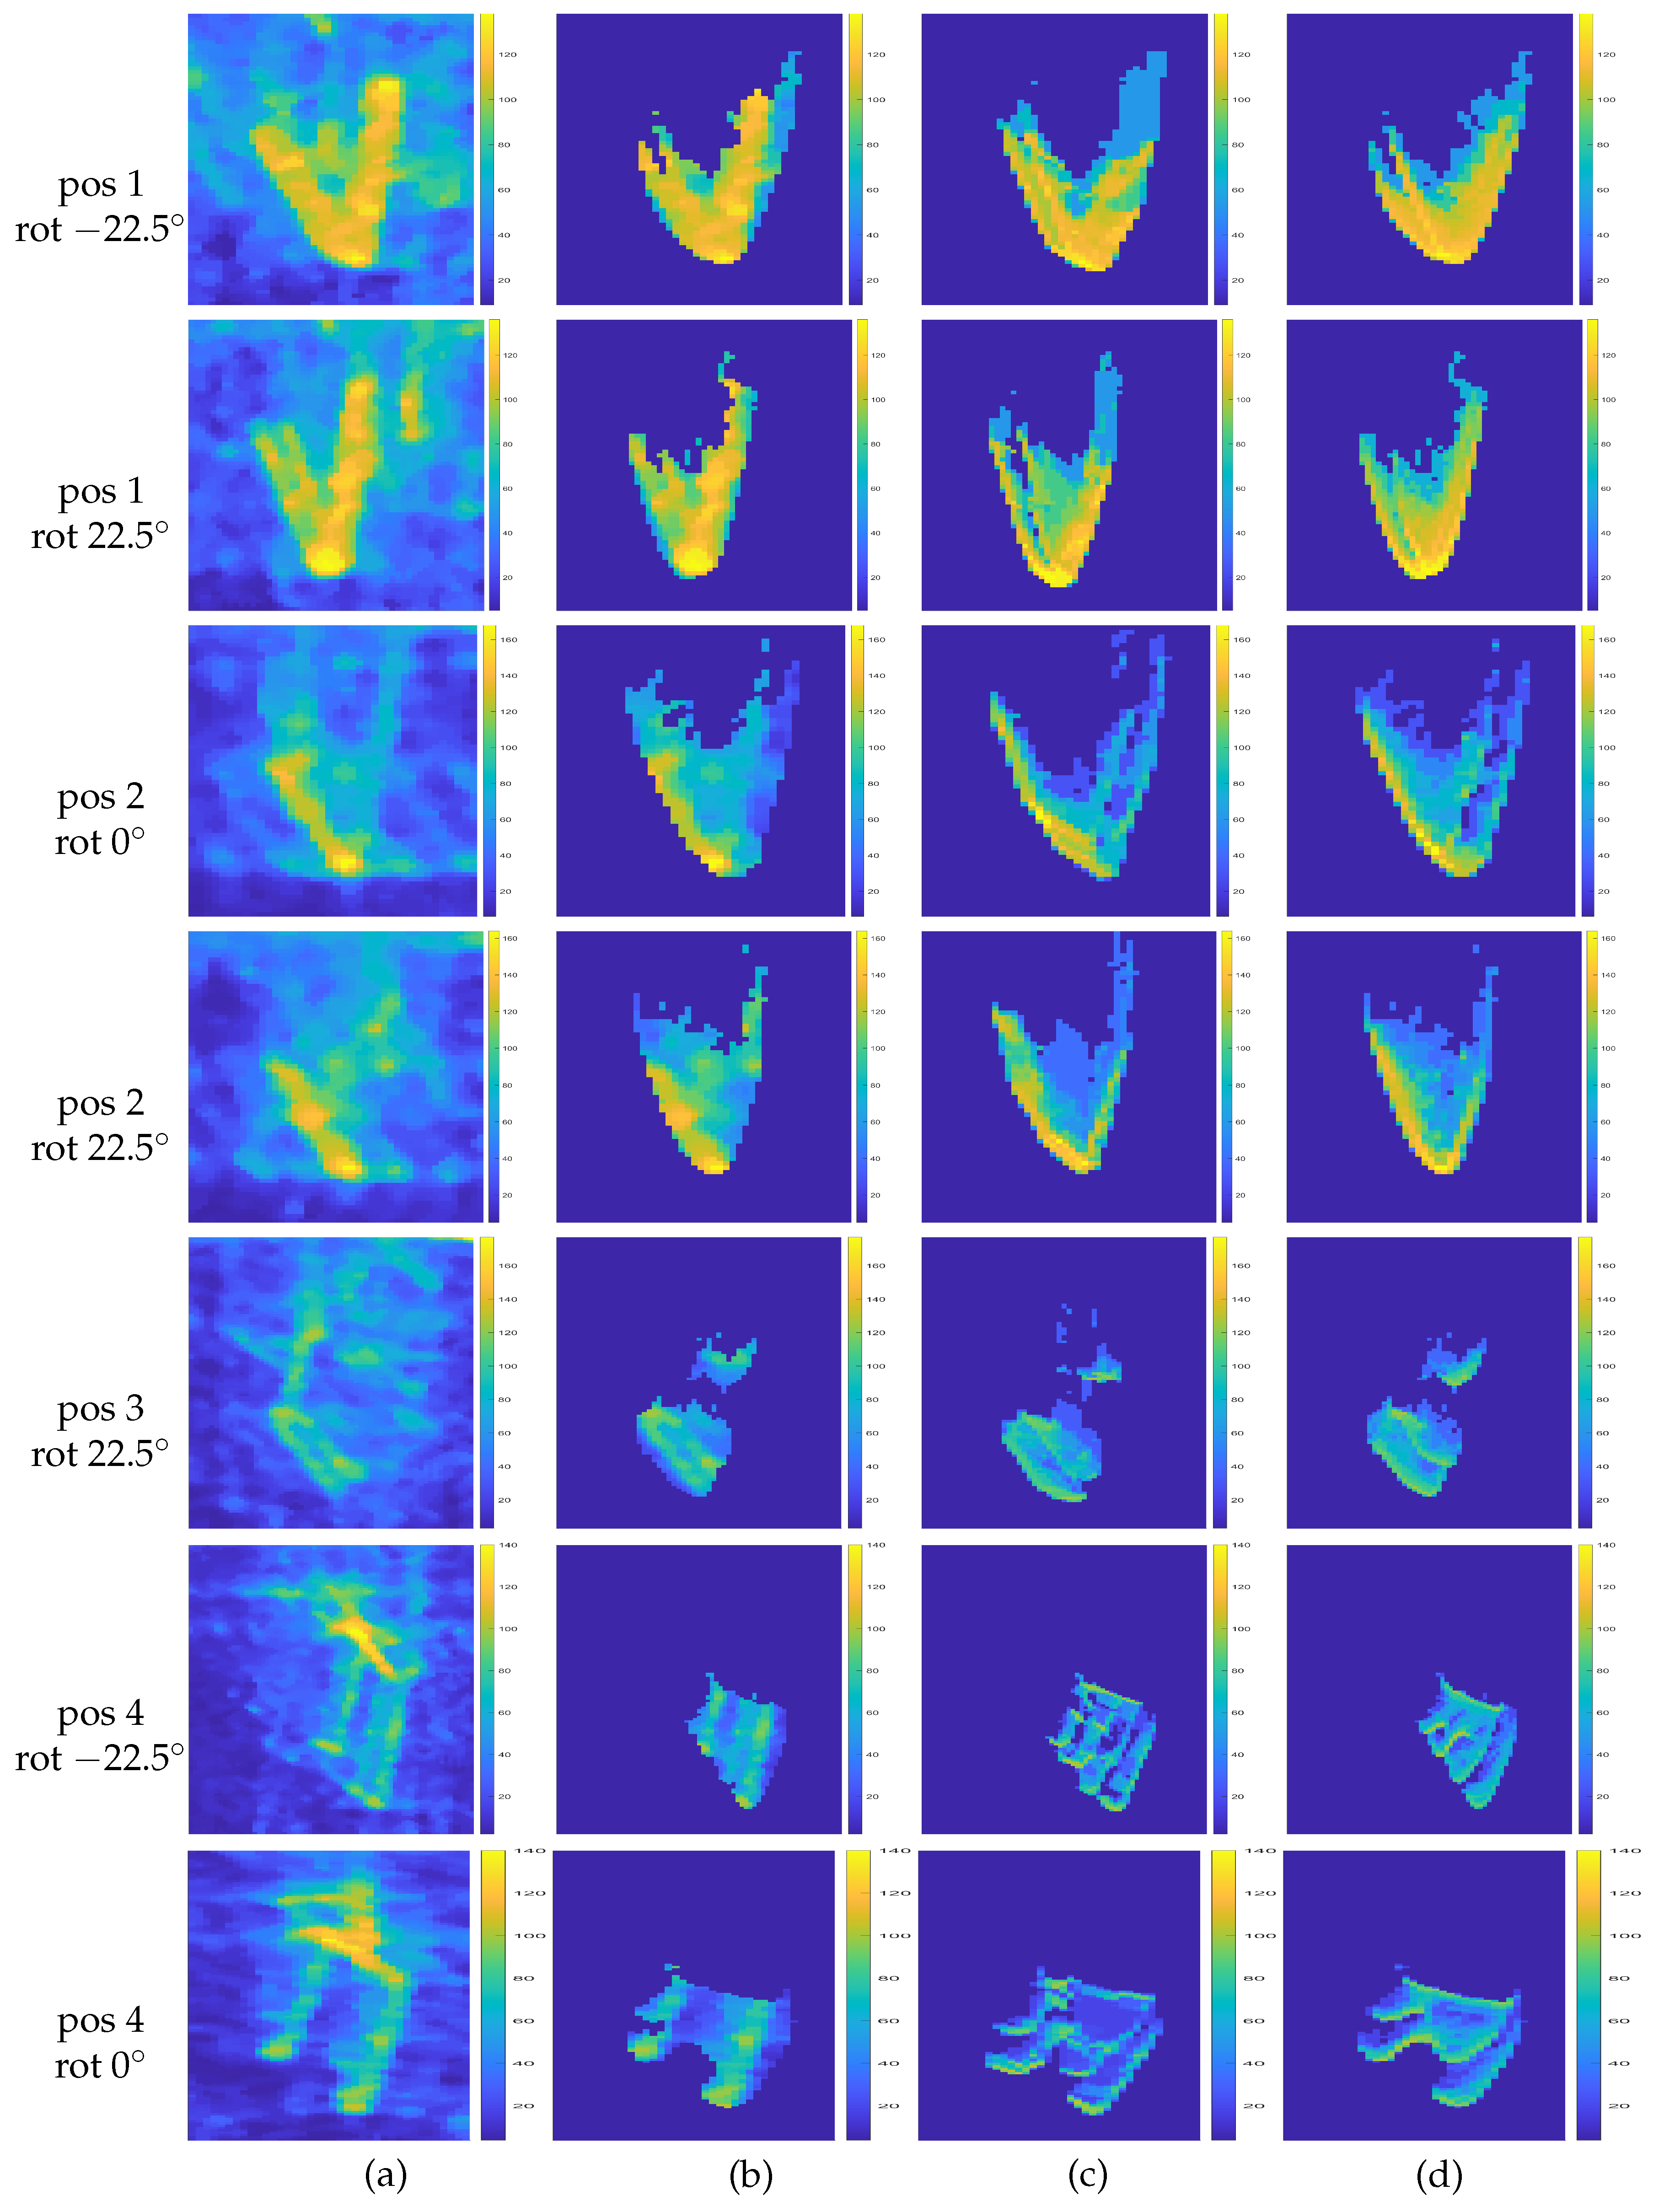
Sample sonar images at zero and ±22.5° roll angles (which are not used in the optimization) are found in Figure 13 and Figure 14. Here, results in the last column can be treated as synthetic views at new arbitrary sonar poses and can be compared with the ghost-free data in column (b) to assess accuracy in the presence of unmodeled environmental factors (of the original data).

4. Conclusions

In this work, we address the reconstruction of a 3-D object model from 2-D FSS images at known poses, with multipath propagation due to sea surface reflectance. To this end, we propose a unified optimization framework to improve the accuracy of the two key sonar pose parameters (measured by low-cost sensors) and the 3-D model. Embedded in the approach to localize and remove the ghost images formed by multipath is the generation of synthetic views from the estimated 3-D object model based on the environmental conditions. This has a number of applications, including the generation of a large volume of training data under a variety of environmental conditions for object recognition. Moreover, a LUT is generated from the distributions of object intensities within the non-overlap region in the real and synthetic images and utilized in generating the object within the ghost-corrupted overlap region.
The targets in three experiments with synthetic and real data are two dominantly convex coral rocks and a concave toy wood table. Assuming the same setup as for the real data, computer simulations with synthetic data highlight the accuracy and convergence in 10 or fewer iterations of the estimated pose parameters and the 3-D target model. Comparable performances are achieved in experiments with real data.
The results of the wood table experiment demonstrate the applicability of our method in constructing shapes with deep concavities, albeit at lower accuracy. Here, the primary complexity is the inability to account for the shape-dependent multipath without a priori knowledge of the target shape. The multipath reverberations from object surfaces within concavities lead to the thickened appearances of object parts. To decouple the direct and multipath components, we require knowledge of the unknown 3-D object model. This poses a chicken-and-egg problem, which is faced by most other methods for 3-D object reconstruction from FSS imagery. Aside from collecting a much larger volume of data from different poses looking into concavities at close ranges, further investigation is needed for devising a suitable mechanism to accurately account for the multipath generated by the surface patches within concavities.

Author Contributions

Conceptualization, Y.L. and S.N.; methodology, Y.L. and S.N.; software, Y.L. and S.N.; Validation, Y.L. and S.N.; formal analysis, Y.L. and S.N.; investigation, Y.L. and S.N.; data curation, Y.L.; writing—original draft preparation, Y.L.; writing—review and editing, Y.L. and S.N.; visualization, Y.L. and S.N.; funding acquisition, S.N. All authors have read and agreed to the published version of the manuscript.

Funding

The research is based on work initially supported by the Office of Naval Research under grant N00014-15-1-2089.

Data Availability Statement

The data for this study were collected with a DIDSON unit purchased using funds from the ONR DURIP award N00014-06-1-0765. The distribution of the data is subject to the University of Miami policies for public sharing of the data.

Acknowledgments

The authors acknowledge support from the Herbert Wellness Center at the University of Miami for the use of the indoor pool facility for data acquisition.

Conflicts of Interest

The authors declare no conflicts of interest. The funders had no role in the design of the study; in the collection, analyses, or interpretation of data; in the writing of the manuscript; or in the decision to publish the results.

References

  1. Available online: https://oceanexplorer.noaa.gov/edu/materials/multibeam-sonar-fact-sheet.pdf (accessed on 5 October 2024).
  2. Available online: https://www.uio.no/studier/emner/matnat/ifi/INF-GEO4310/h12/undervisningsmateriale/sonar_introduction_2012_compressed.pdf (accessed on 5 October 2024).
  3. Available online: https://en.wikipedia.org/wiki/Side-scan_sonar (accessed on 5 October 2024).
  4. Burguera, A.; Oliver, G. High-resolution underwater mapping using side-scan sonar. PLoS ONE 2016, 11, e0146396. [Google Scholar] [CrossRef] [PubMed]
  5. Hansen, R.E. Synthetic aperture sonar technology review. Mar. Technol. Soc. J. 2013, 47, 117–127. [Google Scholar] [CrossRef]
  6. Hayes, M.P.; Gough, P.T. Synthetic aperture sonar: A review of current status. IEEE J. Ocean. Eng. 2009, 34, 207–224. [Google Scholar] [CrossRef]
  7. Available online: https://www.sonardyne.com/applications/obstacle-avoidance/#:~:text=When%20your%20marine%20operation%20takes,warn\%20of%20potential%20collision%20hazards (accessed on 5 October 2024).
  8. Available online: https://www.simrad-yachting.com/sonar-and-transducers/forwardscan-sonar/ (accessed on 5 October 2024).
  9. Available online: https://www.teledynemarine.com/en-us/products/product-line/Pages/forward-looking-sonars.aspx (accessed on 5 October 2024).
  10. Available online: http://www.soundmetrics.com/Products/DIDSON-Sonars (accessed on 5 October 2024).
  11. Available online: https://www.seascapesubsea.com/product/oculus-m750d/#:~{}\protect\protect\leavevmode@ifvmode\kern+.1667em\relax:text=Description,horizontal%20fields%20of%20view%20\respectively (accessed on 5 October 2024).
  12. Available online: https://www.tritech.co.uk/products/gemini-720is (accessed on 5 October 2024).
  13. Ferreira, F.; Djapic, V.; Micheli, M.; Caccia, M. Forward looking sonar mosaicing for mine countermeasures. Annu. Rev. Control. 2015, 40, 212–226. [Google Scholar] [CrossRef]
  14. Hurtos, N.; Petillot, Y.; Salvi, J. Fourier-based registrations for two-dimensional forward-looking sonar image mosaicing. In Proceedings of the IEEE/RSJ International Conference on Intelligent Robots and Systems (IROS’12), Vilamoura-Algarve, Portugal, 7–12 October 2012; pp. 5298–5305. [Google Scholar]
  15. Hurtos, N.; Nagappa, S.; Palomeras, N.; Salvi, J. Real-time mosaicing with two-dimensional forward-looking sonar. In Proceedings of the IEEE International Conference Robotics and Automation (ICRA’14), Hong Kong, China, 31 May–7 June 2014; pp. 601–606. [Google Scholar]
  16. Kim, K.; Intrator, N.; Neretti, N. Image registration and mosaicing of noisy acoustic camera images. In Proceedings of the IEEE International Conference on Electronics, Circuits and Systems, (ICECS’04), Tel Aviv, Israel, 15 December 2004; pp. 527–530. [Google Scholar]
  17. Negahdaripour, S.; Aykin, M.D.; Sinnarajah, S. Dynamic scene analysis and mosaicing of benthic habitats by FS sonar imaging—Issues and complexities. In Proceedings of the OCEANS’11 MTS/IEEE, Waikoloa, HI, USA, 19–22 September 2011. [Google Scholar]
  18. Geiger, A. Computer Vision - Lecture 8.1 (Shape-from-X: Shape-from-Shading). Available online: https://www.youtube.com/watch?v=YQ5QOiyoF9U (accessed on 5 October 2024).
  19. Liu, Y. 3-D Object Modeling from 2-D Underwater Forward-Scan Sonar Imagery in the Presence of Multipath near Sea Surface. Master’s Thesis, University of Miami, Coral Gables, FL, USA, 2022. [Google Scholar]
  20. Liu, Y.; Negahdaripour, S. Object modeling from underwater forward-scan sonar imagery with sea-surface multipath. IEEE J. Ocean. Eng. 2024, 1–14. [Google Scholar] [CrossRef]
  21. Cho, H.; Kim, B.; Yu, S. Auv-based underwater 3-D point cloud generation using acoustic lens-based multibeam sonar. IEEE J. Ocean. Eng. 2018, 43, 856–872. [Google Scholar] [CrossRef]
  22. Guerneve, T.; Subr, K.; Petillot, Y. Three-dimensional reconstruction of underwater objects using wide-aperture imaging sonar. J. Field Robot. 2018, 35, 890–905. [Google Scholar] [CrossRef]
  23. Westman, E.; Gkioulekas, I.; Kaess, M. A volumetric albedo framework for 3d imaging sonar reconstruction. In Proceedings of the IEEE International Conference on Robotics and Automation, Paris, France, 31 May–31 August 2020; pp. 9645–9651. [Google Scholar]
  24. Zerr, B.; Stage, B. Three-dimensional reconstruction of underwater objects from a sequence of sonar images. In Proceedings of the 3rd IEEE International Conference on Image Processing, Lausanne, Switzerland, 19 September 1996; Volume 3, pp. 927–930. [Google Scholar]
  25. Wang, Y.; Ji, Y.; Liu, D.; Tsuchiya, H.; Yamashita, A.; Asama, H. Elevation angle estimation in 2d acoustic images using pseudo front view. IEEE Robot. Autom. Lett. 2021, 6, 1535–1542. [Google Scholar] [CrossRef]
  26. Aykin, M.D.; Negahdaripour, S. Modeling 2-D lens-based forward-scan sonar imagery for targets with diffuse reflectance. IEEE J. Ocean. Eng. 2016, 41, 569–582. [Google Scholar] [CrossRef]
  27. Wang, Y.; Wu, C.; Ji, Y.; Tsuchiya, H.; Asama, H.; Yamashita, A. 2d forward looking sonar simulation with ground echo modeling. arXiv 2023, arXiv:2304.0814. [Google Scholar]
  28. Kraus, F.; Scheiner, N.; Dietmayer, K. Using machine learning to detect ghost images in automotive radar. In Proceedings of the IEEE 23rd International Conference on Intelligent Transportation Systems (ITSC’20), Rhodes, Greece, 20–23 September 2020. [Google Scholar]
  29. Kraus, F.; Scheiner, N.; Ritter, W.; Dietmayer, K. The radar ghost dataset—An evaluation of ghost objects in automotive radar data. In Proceedings of the IEEE/RSJ International Conference on Intelligent Robots and Systems (IROS), Prague, Czech Republic, 27 September–1 October 2021; pp. 8570–8577. [Google Scholar]
  30. Liu, C.; Liu, S.; Zhang, C.; Huang, Y.; Wang, H. Multipath propagation analysis and ghost target removal for FMCW automotive radars. In Proceedings of the IET International Radar Conference, Online, 4–6 November 2020; pp. 330–334. [Google Scholar]
  31. Longman, O.; Villeval, S.; Bilik, I. Multipath ghost targets mitigation in automotive environments. In Proceedings of the IEEE Radar Conference, Atlanta, GA, USA, 7–14 May 2021; pp. 1–5. [Google Scholar]
  32. Swl Marine Bronze Submersible Level Sensor. Available online: https://www.sensorsone.com/swl-marine-bronze-submersible-level-sensor/ (accessed on 5 October 2024).
  33. Tdk-Tmrsensor. Available online: https://product.tdk.com/en/techlibrary/productoverview/tmr-angle-sensors.html/ (accessed on 5 October 2024).
  34. Barrault, G. Modeling the forward Look Sonar. Master’s Thesis, Florida Atlantic University, Boca Raton, FL, USA, 2001. [Google Scholar]
  35. Choi, W.S.; Olson, D.; Davis, D.; Zhang, M.; Racson, A.; Bingham, B.; McCarrin, M.; Vogt, C.; Herman, J. Physics-based modeling and simulation of multibeam echosounder perception for autonomous underwater manipulation. Front. Robot. AI 2021, 8, 706646. [Google Scholar] [CrossRef] [PubMed]
  36. Liu, D.; Wang, Y.; Ji, Y.; Tsuchiya, H.; Yamashita, A.; Asama, H. Cyclegan-based realistic image dataset generation for forward-looking sonar. Adv. Robot. 2021, 35, 242–254. [Google Scholar] [CrossRef]
  37. Negahdaripour, S. Calibration of DIDSON forward-scan acoustic video camera. In Proceedings of the OCEANS 2005 MTS/IEEE, Washington, DC, USA, 17–23 September 2005. [Google Scholar]
  38. Kutulakos, K.N.; Seitz, S.M. A theory of shape by space carving. Int. J. Comput. Vis. 2000, 38, 199–218. [Google Scholar] [CrossRef]
  39. Aykin, M.D.; Negahdaripour, S. Three-dimensional target reconstruction from multiple 2-D forward-scan sonar views by space carving. IEEE J. Ocean. Eng. 2017, 42, 574–589. [Google Scholar] [CrossRef]
  40. Negahdaripour, S.; Milenkovic, V.M.; Salarieh, N.; Mirzargar, M. Refining 3-D object models constructed from multiple fs sonar images by space carving. In Proceedings of the IEEE/MTS Oceans Conference-Anchorage, Anchorage, AK, USA, 18–21 September 2017; pp. 1–9. [Google Scholar]
  41. Gu, J.-H.; Joe, H.-G.; Yu, S.-C. Development of image sonar simulator for underwater object recognition. In Proceedings of the OCEANS’13, San Diego, CA, USA, 23–27 September 2013. [Google Scholar]
  42. Kwak, S.; Ji, Y.; Yamashita, A.; Asama, H. Development of acoustic camera-imaging simulator based on novel model. In Proceedings of the IEEE 15th International Conference on Environment and Electrical Engineering (EEEIC’15), Rome, Italy, 10–13 June 2015; pp. 1719–1724. [Google Scholar]
  43. Potokar, E.; Lay, K.; Norman, K.; Benham, D.; Neilsen, T.B.; Kaess, M.; Mangelson, J.G. HoloOcean: Realistic sonar simulation. In Proceedings of the IEEE/RSJ International Conference on Intelligent Robots and Systems, Kyoto, Japan, 23–27 October 2022. [Google Scholar]
  44. Besl, P.J.; McKay, N.D. A method for registration of 3-D shapes. IEEE T. Pattern Anal. Mach. Intell. 1992, 14, 239–256. [Google Scholar] [CrossRef]
  45. Chen, Y.; Medioni, G. Object modeling by registration of multiple range images. Image Vis. Comput. 1992, 10, 145–155. [Google Scholar] [CrossRef]
  46. Bergström, P.; Edlund, O. Robust registration of point sets using iteratively reweighted least squares. Comput. Optim. Appl. 2014, 58, 543–561. [Google Scholar] [CrossRef]
  47. Bergström, P.; Edlund, O. Robust registration of surfaces using a refined iterative closest point algorithm with a trust region approach. Numer. Algorithms 2017, 74, 755–779. [Google Scholar] [CrossRef]
  48. Ruder, S. An overview of gradient descent optimization algorithms. arXiv 2017, arXiv:1609.04747v2. [Google Scholar]
  49. Azure Kinect DK. Available online: https://www.microsoft.com/en-us/d/azure-kinect-dk/8pp5vxmd9nhq?activetab=pivot:overviewtab (accessed on 5 October 2024).
Figure 1. Ghost component overlaps with and is indistinguishable from the object region in every view. Mirror component at reference position (elevation axis pointing upward) overlaps with both object and ghost regions (a). As the sonar rotates about the viewing direction (from 0° to 67.5° in increments of 22.5°, here), it separating from the object (b), and forms a distinct blob (c,d).
Remotesensing 16 03814 g001
Figure 2. (a) For a sonar beam in θ direction, image intensity I of pixel ( x , y ) depends on cumulative echos from unknown number of surface patches within volume V ϕ arriving at sonar receiver simultaneously; V ϕ covers elevation-angle interval [ W ϕ , W ϕ ] , range interval [, + δ ] along the beam covering azimuthal-angle interval [ θ , θ + δ θ ]. (b) A coral rock with voxelated volume and triangular surface mesh of SC solution. (c) Virtual mirror object geometry: transmitted sound waves in direction R 1 are scattered by surface at P s . Reflected portion along “unique direction” R 2 towards P W on water surface (with surface normal n ) is specularly reflected towards the sonar along R 3 , leading to the appearance of a virtual mirror object point at P m . (d) Virtual ghost object geometry: considering the reverse direction of the mirror-point pathway, sound waves traveling along R 3 are specularly reflected towards the object along R 2 , and are scattered at P s , of which components along R 1 are captured by the sonar. This leads to the appearance of ghost point P g along the sonar beam directed at P s (at a longer range R g ).
Remotesensing 16 03814 g002
Figure 3. (a) Block diagram of entire algorithm; (b) steps in 3-D shape optimization by displacement of model vertices, computed from 3-D vertex motions that are estimated from the 2-D image motions aligning the object regions in the data and synthetic views.
Remotesensing 16 03814 g003
Figure 4. (a) The 2-D vectors { v m i O , v m j M } align the frontal contours { C m O , C m M } of the object and mirror regions in the real images with counterparts { C ˜ m O , C ˜ m M } in the synthetic views; (b) magnified view of relevant regions.
Remotesensing 16 03814 g004
Figure 5. Processing steps in the decomposition of sonar data into object and ghost components. (a) Generation of synthetic object image from image formation model, and localizing the ghost and mirror components to identify regions overlapping with object image. (b) Segmentation of real and synthetic object regions into overlapping and non-overlapping parts, using non-overlapping region in generating the LUT for synthetic-to-real object transformation, and apply the LUT to reconstruct overlapping object region to complete the object image by fusing with non-overlapping part. (c) Segmentation of ghost area into overlapping and non-overlapping regions, producing the non-overlapping part. (d) Discounting for the object image within overlap area to generate the ghost component. (e) Generation of ghost image from overlapping and non-overlapping components.
Remotesensing 16 03814 g005
Figure 6. Three targets—two dominantly convex coral rocks with mild local concavities and a highly concave wood table—with height, maximum width, and imaging conditions.
Remotesensing 16 03814 g006
Figure 7. Coral-one experiment—(ad) synthetic and (a’d’) real data. (a,b,a’,b’) Optimization of sonar depth and tilt parameters. (c,c’) Image E I and volumetric E V errors moving in tandem confirm 3-D model improvement with reduced image error. (d) Initialized SC solution (top) and optimized 3-D model (bottom), shown by blue surface mesh, are superimposed on Kinect model (black mesh); (d’) optimized SC (blue mesh) and Kinect (red mesh) models.
Remotesensing 16 03814 g007
Figure 8. Coral-two experiment—(ad) synthetic and (a’d’) real data. (a,b,a’,b’) Optimization of sonar depth and tilt parameters. (c,c’) Improving 3-D model leads to smaller volumetric E V and image E I errors. (d) Kinect model (black mesh) superimposed on initialized SC solution (top) and optimized 3-D model (bottom), shown by blue surface meshes. (d’) Optimized SC (blue mesh) and Kinect (red mesh) models.
Remotesensing 16 03814 g008
Figure 9. Wood table experiment— (ad) synthetic and (a’d’) real data. (a,b,a’,b’) Optimization of sonar depth and tilt parameters. (c,c’) Improving 3-D model reduces both volumetric E V and image E I errors. (d) Kinect model (black mesh) superimposed on initialized SC solution (top) and optimized 3-D model (bottom), shown by blue surface meshes. (d’) Optimized SC (blue mesh) and Kinect (red mesh) models.
Remotesensing 16 03814 g009
Figure 10. Coral-one experiment—(a) data; (b) data over image region only; (c) initial and (d) optimized synthetic view generated by the 3-D model.
Remotesensing 16 03814 g010
Figure 11. Coral-two experiment—(a) data; (b) data over image region only; (c) initial and (d) optimized synthetic view generated by the 3-D model.
Remotesensing 16 03814 g011
Figure 12. Wood table experiment—(a) data; (b) data within object region only; (c) initial and (d) optimized synthetic view generated by the 3-D model.
Remotesensing 16 03814 g012
Figure 13. Sets of images as in previous experiments for (a1d1) coral-one and (a2d2) coral-two views, in which object, ghost, and mirror components overlap (not used in the optimization). (a1,a2) data; (b1,b2) data within object region only; (c1,c2) initial and (d1,d2) optimized synthetic view generated by the 3-D model.
Remotesensing 16 03814 g013
Figure 14. Sets of wood table images as in previous figures for views in which object, ghost, and mirror components overlap (not used in optimization process). (a) data; (b) data within object region only; (c) initial and (d) optimized synthetic view generated by the 3-D model.
Remotesensing 16 03814 g014
Disclaimer/Publisher’s Note: The statements, opinions and data contained in all publications are solely those of the individual author(s) and contributor(s) and not of MDPI and/or the editor(s). MDPI and/or the editor(s) disclaim responsibility for any injury to people or property resulting from any ideas, methods, instructions or products referred to in the content.