Article

Quantifying the Contributions of Vegetation Dynamics and Climate Factors to the Enhancement of Vegetation Productivity in Northern China (2001–2020)

by
Kaixuan Liu
1,2,
Xufeng Wang
1 and
Haibo Wang
1,*
1
Key Laboratory of Remote Sensing of Gansu Province, Heihe Remote Sensing Experimental Research Station, Key Laboratory of Cryospheric Science and Frozen Soil Engineering, Northwest Institute of Eco-Environment and Resources, Chinese Academy of Sciences, Lanzhou 730000, China
2
University of Chinese Academy of Sciences, Beijing 100049, China
*
Author to whom correspondence should be addressed.
Remote Sens. 2024, 16(20), 3813; https://doi.org/10.3390/rs16203813
Submission received: 30 August 2024 / Revised: 1 October 2024 / Accepted: 11 October 2024 / Published: 14 October 2024

Abstract

:
Vegetation dynamics are critical to the terrestrial carbon and water cycle, with China recognized as one of the largest contributors to global greening due to significant variations in forest coverage. However, distinguishing the effects of vegetation changes from those of climate factors on vegetation productivity remains challenging. This study conducted a comprehensive analysis of vegetation productivity in Northwest China over the past two decades, focusing on the spatiotemporal patterns and drivers of gross primary production (GPP) within ecological restoration areas. Using trend analysis and ridge regression models, we assessed the relative contributions of climate factors and vegetation coverage changes to GPP dynamics. The results revealed a significant increase in both the GPP and vegetation coverage in Northern China from 2001 to 2020, with GPP rising by 6.7 g C m−2 yr−1 and forest coverage increasing by 0.08% per year. A strong positive correlation (r = 0.9) was observed between vegetation coverage changes and GPP. The increase in GPP was driven by both climate factors and changes in forest coverage, with climate factors contributing 61.0% and vegetation coverage changes contributing 39.0%. Among the climate factors, radiation, temperature, and precipitation contributed 15.4%, 6.4%, and 39.2%, respectively. The study highlights the critical role of ecological restoration efforts, particular in regions like the Less Plateau and Inner Mongolian Plateau, in enhancing vegetation productivity. These findings provide valuable insights for addressing desertification and inform strategies for ecological restoration and sustainable development in Northern China.

1. Introduction

Vegetation serves as a critical link between the carbon and water exchanges within the ecosphere, atmosphere, and hydrosphere, playing an essential role in the terrestrial carbon and water cycle. Due to global climate warming and improper land resource use, vegetation is undergoing tremendous changes. Satellite observations have revealed a global trend of increasing vegetation greening in recent decades [1]. China, in particular, has experienced significant greening over the past two decades, emerging as one of the largest contributors to this global greening [2]. This widespread greening is primarily driven by a combination of climatic changes and human activities, particularly land use management [1,2]. In recent decades, China has implemented several large-scale ecological restoration projects aimed at mitigating land degradation and addressing environmental issues such as desertification, dust storms, and air pollution [3,4]. These projects improved vegetation coverage and reduced the impacts of sandstorms [2]. Policy-driven initiatives, such as the Three-North Shelterbelt Program (initiated in 1978) and the Grain for Green Program (launched in 1999), have substantially increased forest coverage, enhanced ecological sustainability, and boosted carbon sequestration in the affected areas [5,6]. Despite the impact of these ecological projects and climate change on vegetation dynamics, the specific contributions of each factor to vegetation productivity remain uncertain. Thus, accurately quantifying their effects on vegetation productivity is crucial for a comprehensive understanding of vegetation growth processes and carbon budgeting [7,8].
Vegetation growth is significantly influenced by climate change—a central theme in global change research [9,10]. Previous studies have identified climate warming as a major driver of increased productivity in China’s Qinghai-Tibet Plateau (QTP), where temperature serves as the primary driver of productivity changes [11]. In contrast, precipitation and radiation are noted as the main influences on productivity in Northeastern and Southwestern China [12]. Recent research highlights precipitation as a critical factor in vegetation change in Northwestern China’s arid and semi-arid regions, with even slight increases significantly boosting vegetation [13]. However, some studies indicate that climatic factors have inhibited vegetation growth in the Three Rivers Source Region [14]. The impact of climatic factors on vegetation productivity changes in Northern China remains debated, especially concerning future climate scenarios. Given these findings, this study focused on temperature, precipitation, radiation, and forest cover as the primary factors influencing GPP. These factors were selected due to their demonstrated effects on vegetation growth: temperature affects metabolic rates, precipitation is essential for moisture availability, and radiation provides the energy for photosynthesis. Additionally, forest cover serves as a key indicator of human influence on vegetation dynamics, reflecting the impact of extensive ecological restoration projects across the region. Furthermore, with the implementation of large-scale ecological engineering initiatives, human activities have increasingly become significant drivers of vegetation changes, largely dominating vegetation greening across many parts of the country [15,16]. While these restoration efforts are credited with contributing to greening [17,18], urban expansion has adversely affected urban vegetation [19]. Notably, research quantifying the effects of climate factors and changes in vegetation coverage on productivity in Northern China—an area critical for afforestation and reforestation—has not been adequately evaluated.
Several studies have employed the residual method, using vegetation indices (e.g., normalized difference vegetation index) or vegetation productivity models combined with climate data. However, this method may not fully capture the influence of climate factors or effectively separate the distinct effects of different variables. It also falls short in assessing the impact of ecological engineering on vegetation [20]. Unlike vegetation indices, gross primary production (GPP) directly measures carbon fixation through photosynthesis [21], offering a more nuanced view of vegetation activity and its feedback on the carbon cycle and climate change [12,22]. Therefore, this study adopted GPP as a measure to examine vegetation changes and the contributions of climate factors in Northern China’s ecological engineering areas, considering radiation, precipitation, and temperature as climate indicators. In addition to introducing GPP as an indicator of vegetation productivity, this study utilized continuous forest cover data from MODIS, which provides high-resolution, temporally continuous observations, allowing for detailed, large-scale assessments of vegetation dynamics over time. These data are particularly well-suited for capturing subtle changes in forest cover, thereby offering a comprehensive representation of vegetation changes in the ecological restoration areas. Furthermore, the study employed ridge regression analysis to examine the relative contributions of driving variables. This approach can effectively distinguish the complex interactions between vegetation and climate factors and avoid the multicollinearity problem [23,24], and aim to provide a comprehensive understanding of contributions of vegetation dynamics and climate factors on vegetation productivity in the region.
Northern China, a significant contributor to global vegetation greening with diverse ecosystems, has experienced widespread human impact through afforestation. However, the effects of these activities as well as climatic factors on vegetation productivity in areas undergoing ecological restoration remain unclear. Therefore, this study aimed to: (1) analyze the spatiotemporal patterns of vegetation productivity in Northern China’s ecological restoration programs areas, and (2) identify the driving factors and their relative contributions to vegetation productivity changes in the region.

2. Materials and Methods

2.1. Study Area

The northern region encompasses Northeast China, North China, and Northwest China, covering 13 provincial administrative units with a total area of 4.1 million km2 and a forest coverage rate of 13.57% [25]. The elevation decreases from west to east, while both temperature and precipitation exhibit a gradient from east to west. Our study focused on ecological restoration areas in Northern China, which are categorized into four major regions: the Three-North Shelterbelt Program (TNSP), the Afforestation Program for Taihang Mountain (APTM), the Shelterbelt Program for Liaohe River (SPLR), and the Shelterbelt Program for Middle Reaches of Yellow River (SPMRYR) (Figure 1). The boundaries of these ecological engineering areas were obtained from the Resource and Environmental Science and Data Center of the Chinese Academy of Sciences. The TNSP is the largest of these regions, spanning multiple provinces. This area includes the Junggar Basin, the Taklamakan Desert, the Tianshan Mountains, parts of the Tibetan Plateau, the Inner Mongolia Plateau, and portions of the Northeast Plain, featuring landscapes such as deserts, grasslands, mountains, and basins. The APTM region primarily consists of the Taihang Mountains and parts of the North China Plain, impacting areas in Shanxi, Hebei, Henan, and Beijing, and encompasses both alpine and plain ecosystems. The SPLR region mainly comprises the eastern part of the Inner Mongolia Plateau and the western part of the Northeast Plain, featuring plateau and plain ecosystems. The SPMRTR covers areas along the middle reaches of the Yellow River including parts of Shaanxi, Shanxi, Gansu, Ningxia, and Inner Mongolia. This region is dominated by the Loess Plateau and includes landscapes such as plateaus, deserts, and mountains.

2.2. Data Sources and Processing

2.2.1. GPP Datasets

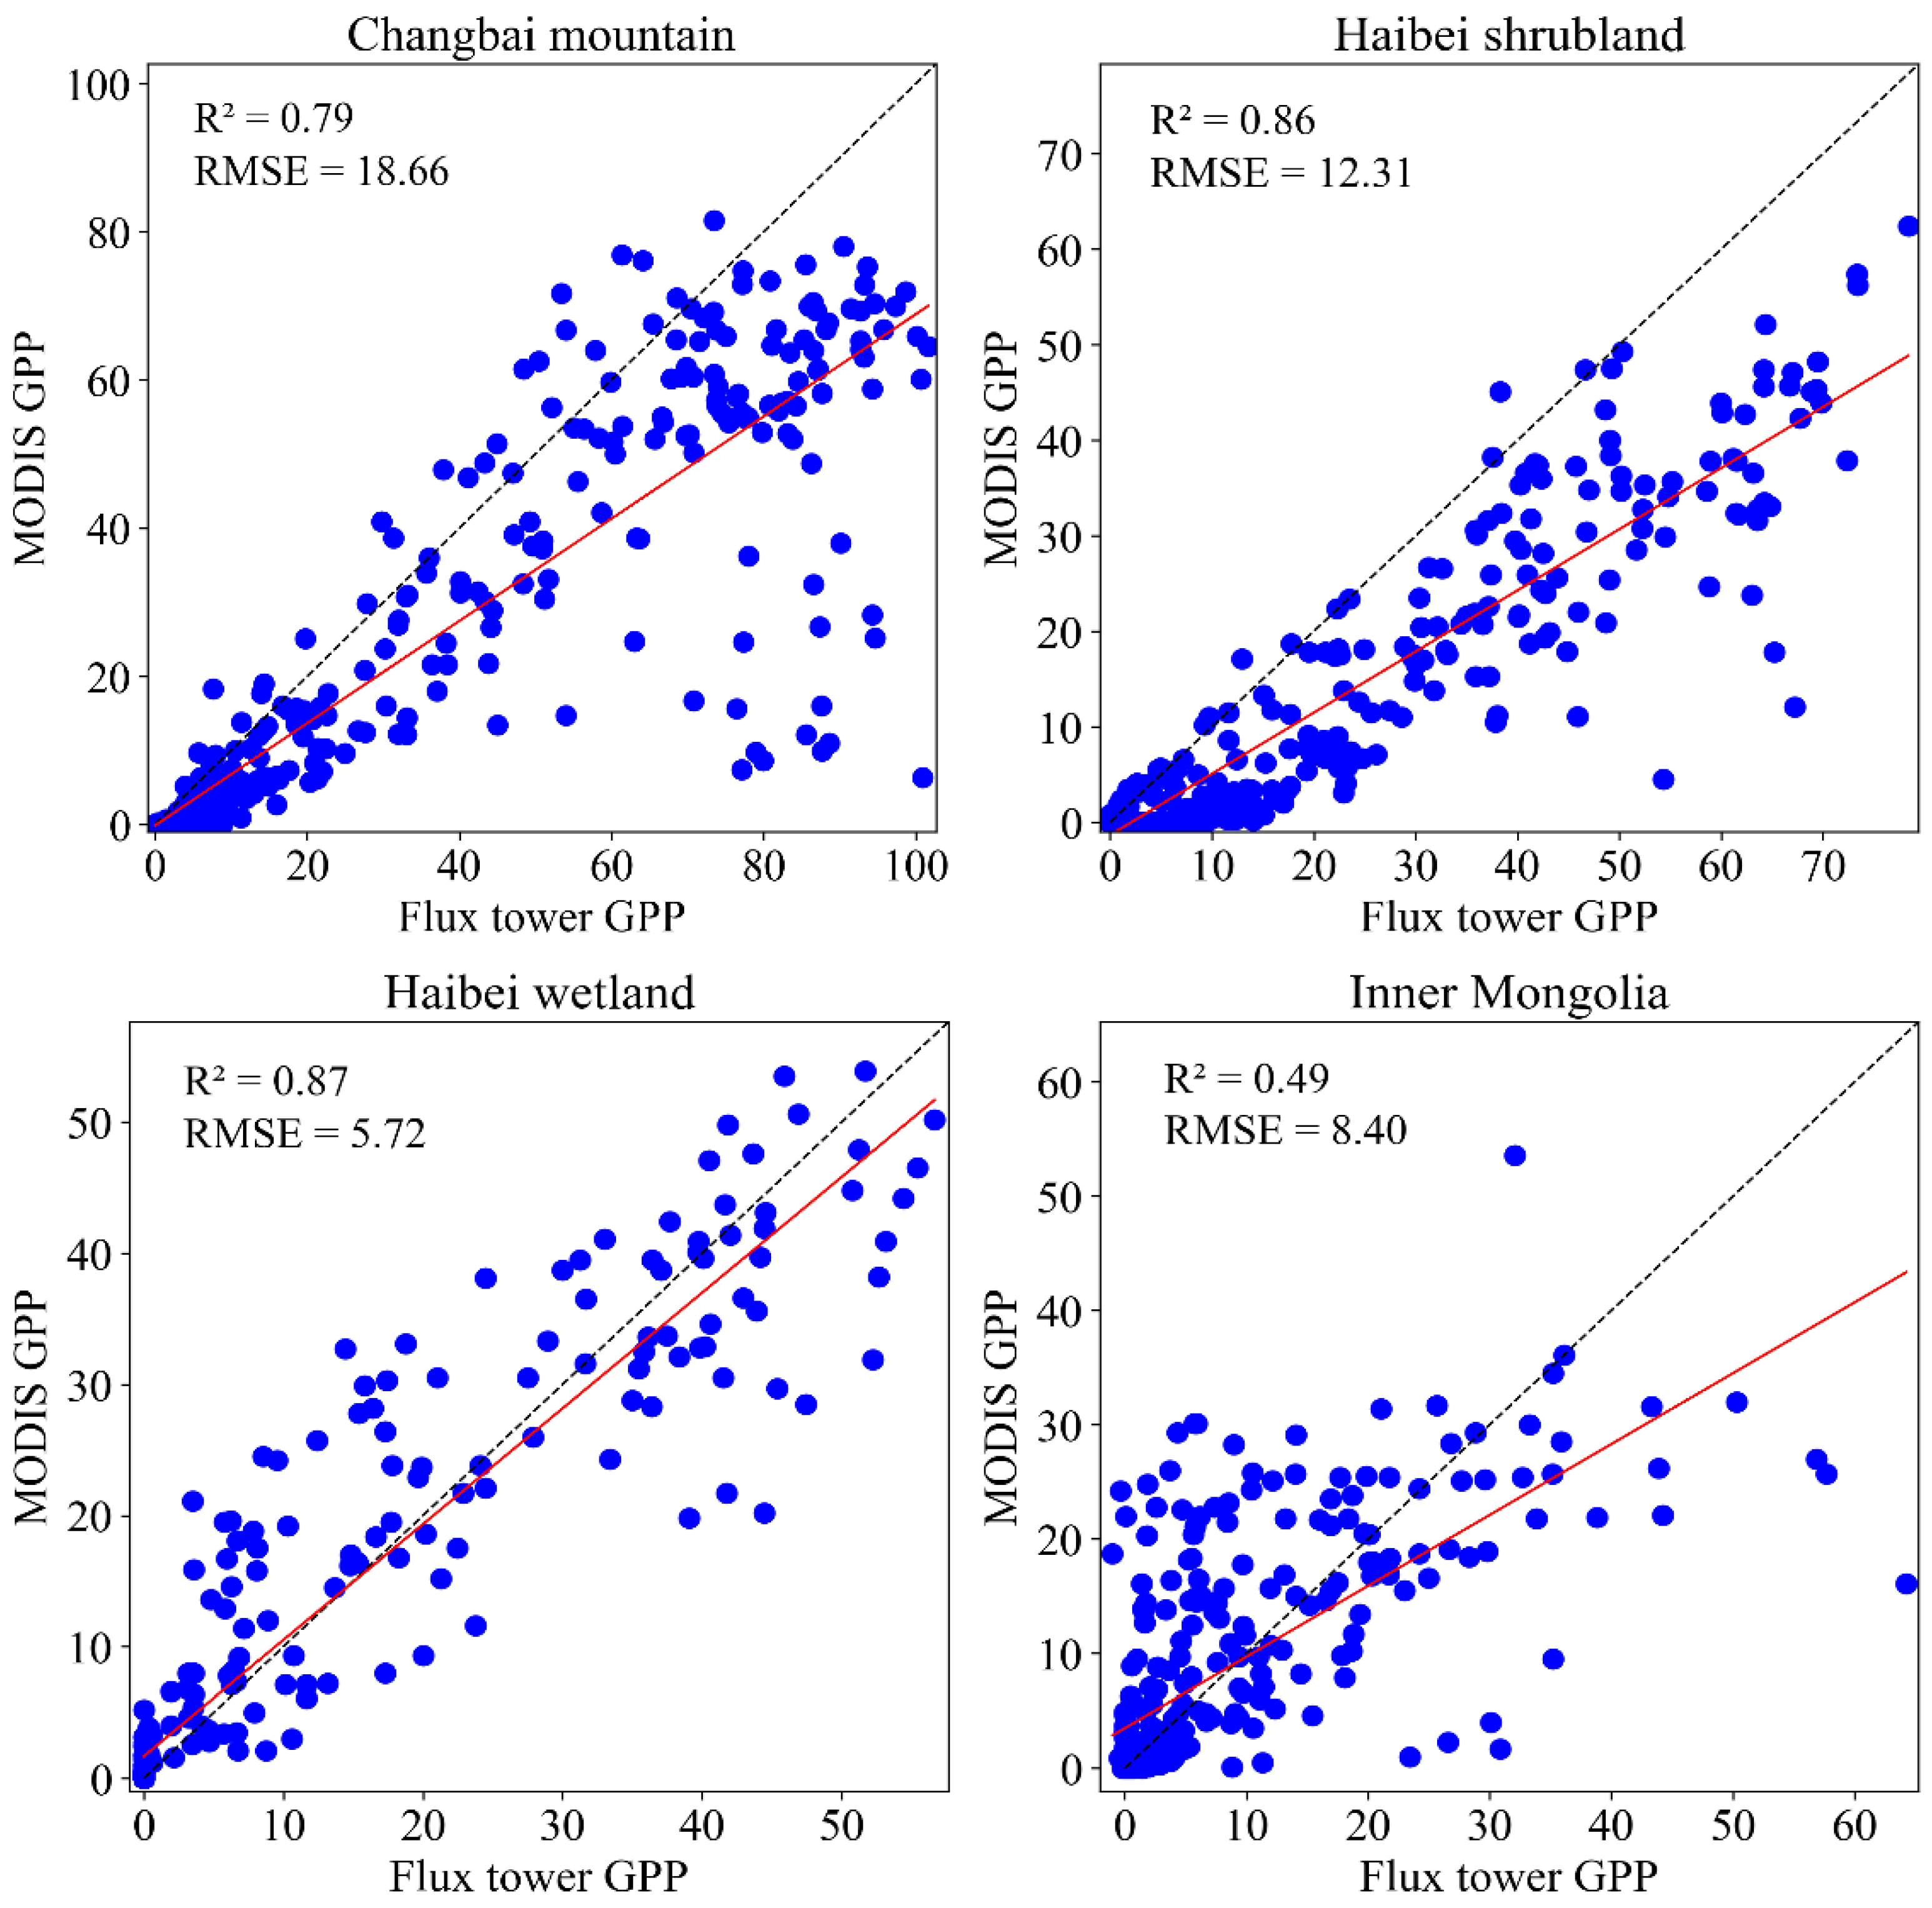
Gross primary production (GPP) data for Northern China from 2001 to 2020 were obtained from the MODIS MOD17A2HV006 product, which is generated using a photosynthetic efficiency model and provides 8-day composite GPP data at a 500 m spatial resolution. To ensure consistency in spatial resolution across different data sources, the dataset was annualized by summing and rescaled to a 1 km resolution [26]. Additionally, GPP measurements from four flux towers in Northern China were sourced from the China Flux Observation and Research Network (ChinaFLUX) via the National Ecosystem Science Data Center [27]. The specific information of the site is shown in Table 1. Carbon fluxes were measured using the eddy covariance (EC) system (LI-7500, LI-COR, Lincoln, NE, USA; and CSAT3, Campbell Scientific Inc., Logan, UT, USA) and processed following the standard procedures of ChinaFLUX. The EC technique is widely recognized as a standard method for observing carbon flux [28]. Detailed descriptions of the flux sites are available in Yu et al. (2006) [27]. Our assessment indicates a high level of agreement between the MODIS GPP product and the GPP measurements from flux towers in Northern China (Figure 2), with a strong correlation (R2 > 0.8) and good RMSE confirming the reliability of MODIS GPP data for this analysis.

2.2.2. Other Data and Processing

Temperature and precipitation data, with a 1 km spatial resolution, were acquired from the “monthly precipitation and monthly average temperature for China” from the National Tibetan Plateau Data Center. This dataset was created by downscaling global climate data from the Climatic Research Unit (CRU) and WorldClim using the Delta spatial downscaling approach [29]. In this study, we used the annual mean temperature and the total annual precipitation.
Radiation data were sourced from the Breathing Earth System Simulator (BESS) Radiation v1 dataset, which is based on radiation transfer models and artificial neural networks. This dataset integrates various MODIS atmospheric and land products as input layers and has a temporal resolution of 4 days. It has been validated for reliability across instantaneous, 4-day, and interannual scales [30]. For this study, the radiation data were synthesized on an annual scale. Tree cover data, covering the period from 2001 to 2020, were derived from the MOD44BV006 dataset, which was also synthesized annually and adjusted to a 1 km spatial resolution to match the study’s parameters.

2.3. Methods

2.3.1. Abrupt Change Analysis

We employed the MK method to detect changes in the time series. For the GPP time series, we constructed the rank sequence sk [31,32]:
s k = i = 1 k r i ,   r i = 1 ,   G P P i > G P P j   0 ,   G P P i   G P P j   ,   j = 1,2 , , i ,
the statistical variables are defined as:
U F k = s k E s k V a r s k ,   k = 1,2 , , n ,  
E s k = n × ( n 1 ) 4 ,  
V a r s k = n × ( n 1 ) × ( 2 n + 5 ) 72 ,  
reverse the sequence and repeat the above steps to obtain the reverse U B k = U F k , and two broken lines were obtained by plotting the series of U F k and U B k on a graph. An intersection point of the sequence lines of U F k and U B k between the critical lines ± U α / 2 (a = 0.05) corresponds to an abrupt change point.

2.3.2. Trend Analysis

A univariate linear regression analysis was conducted to calculate the variation of GPP in Northern China from 2001 to 2020 using a linear trend model based on the least squares method. The slope of the linear trend was determined as follows [33,34]:
θ s l o p e = n i = 1 n i G P P i i = 1 n i i = 1 n G P P i n i = 1 n i 2 i = 1 n i 2 ,  
where θ s l o p e represents the long-term trend in GPP, n is the length of the time series (i.e., the number of years studied), and GPPi is the total GPP for the i-th year. A positive θ indicates an increase in GPP over the study period, suggesting that climate changes are promoting vegetation growth. Conversely, a negative θ suggests a decline in GPP, indicating that climate changes may be inhibiting vegetation growth. A θ value of zero implies no significant change in GPP, indicating stable vegetation growth over time. The significance of the GPP trend was assessed using a t-test, with p < 0.05 indicating statistical significance.

2.3.3. Partial Correlation Analysis

To investigate the relationships between vegetation dynamics and climate factors (precipitation, temperature, solar radiation) as well as forest coverage changes, a partial correlation analysis was conducted. This method allows for the isolation of the influence of each variable by controlling for the effects of the others. The relationship between GPP and each climate variable was analyzed independently, with the other variables treated as controls. This approach enables a focused examination of the impact of individual factors on vegetation productivity dynamics. The partial correlation coefficient was calculated using the following formula [35,36,37]:
R x y , z ( i ) = R x y R x z ( i ) × R y z ( i ) 1 R x z ( i ) 2 × 1 R y z ( i ) 2 ,  
where Rxy,z(i) represents the partial correlation coefficient between variables x and y excluding the influence of other factors z(i). Rxy, Rxz(i), and Ryz(i) are the correlation coefficients between variables x, y, and z(i), respectively. The significance of the relationship between GPP, climate factors, and vegetation changes was further evaluated using a t-test.

2.3.4. Relative Contributions of Factors

To quantify the contributions of various factors to GPP, standardized ridge regression was employed. Initially, both GPP and the influencing factors were standardized to eliminate the effects of unit differences in the original regression coefficients. The standardization was performed using the following formula:
G P P i = G P P i μ σ ,  
where GPPi represents the total GPP for the i-th year, and μ and σ are the mean and standard deviation of the GPP dataset, respectively. Precipitation, temperature, solar radiation, and forest cover were also standardized using the same method. Ridge regression analysis was then applied to assess the influence of individual factors on GPP using the following equations:
X = [ T e m ,   P r e ,     P A R ,     T r e e ] ,  
β = ( X T X + λ I ) 1 X T G P P ,
where GPP′, Tem′, Pre′, PAR′, and Tree′ are the standardized values of GPP, temperature, precipitation, solar radiation, and forest coverage, respectively. X is the matrix of independent variables, λ is the regularization parameter, I is the identity matrix, and β represents the standardized ridge regression coefficient. Compared to linear regression, ridge regression effectively addresses the multicollinearity problem among different variables [23,24].
The relative contributions of each factor to GPP variation were calculated using the following equation:
C i = β i β 1 + β 2 + β 3 + | β 4 | ,  
where C i represents the relative contribution of the i-th factor to GPP variation, and β i is the regression coefficient of the corresponding factor in the multiple linear regression model. This calculation allows for the determination of the relative importance of each factor in influencing GPP variations. A higher value of C i indicates a greater impact of that particular factor on GPP changes in the study area.

3. Results

3.1. Spatiotemporal Variations of GPP

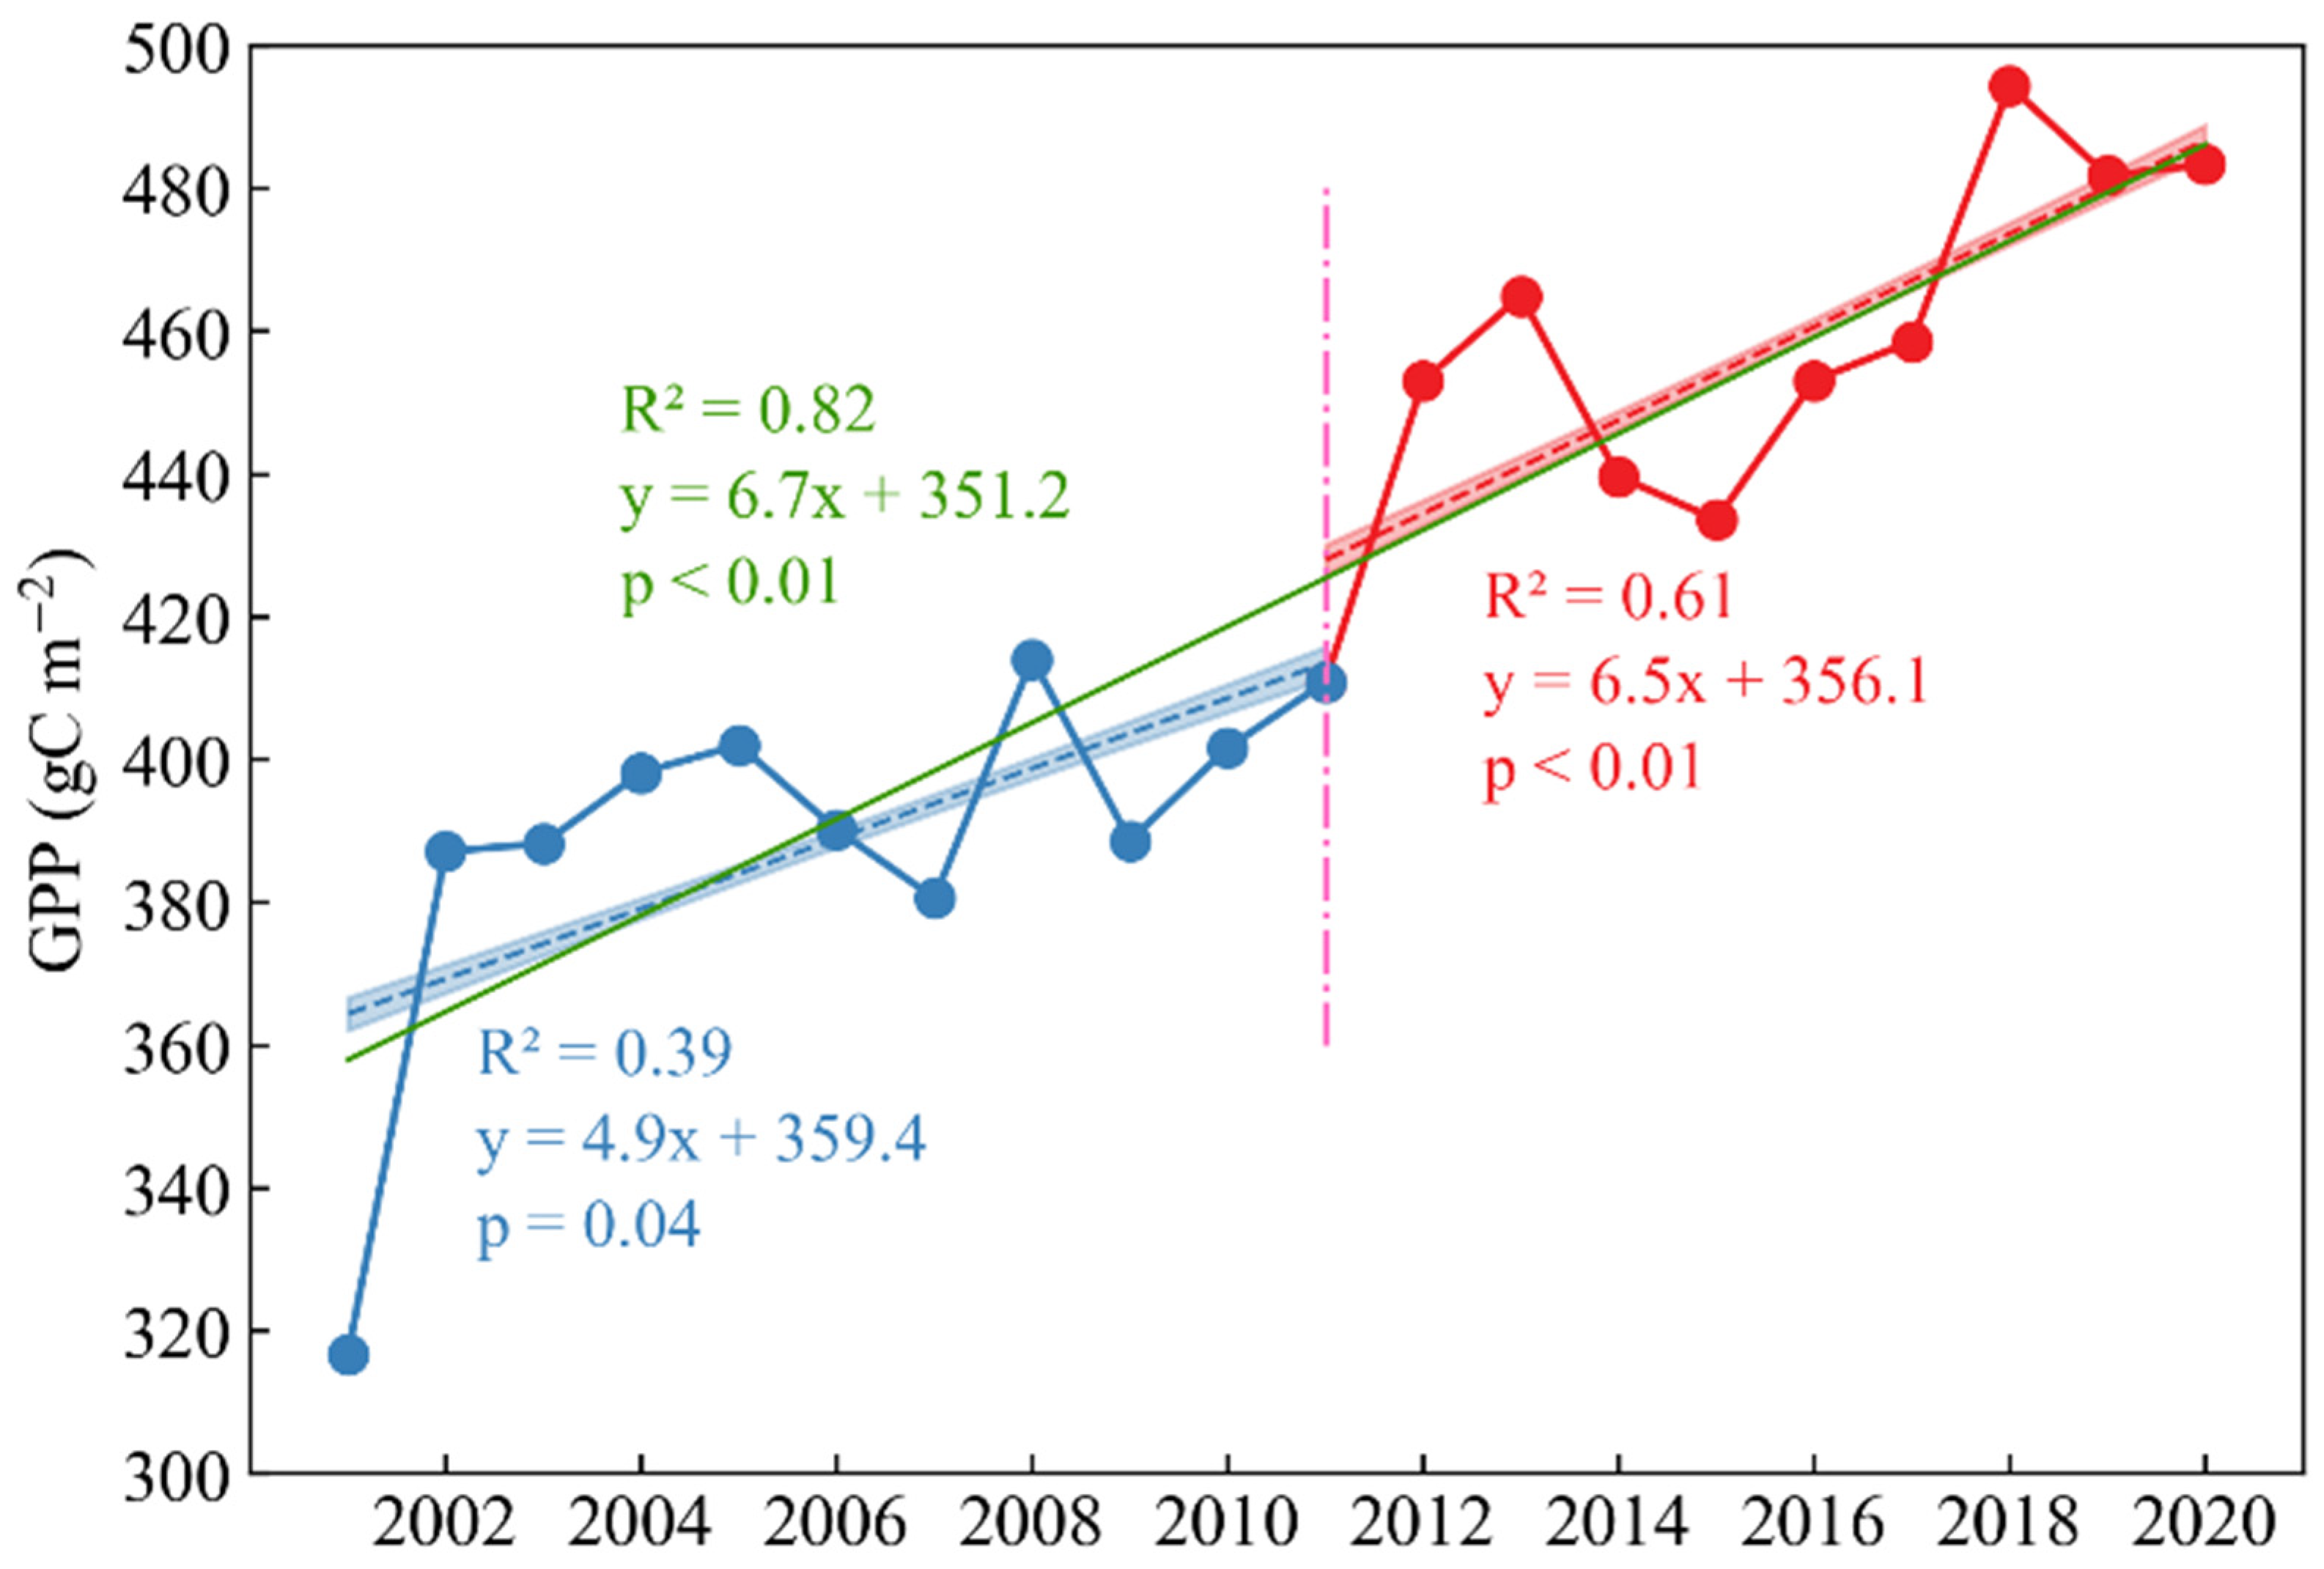
Figure 3 illustrates the spatiotemporal changes in GPP across ecological restoration areas in Northern China from 2001 to 2020. During this period, the annual average GPP exhibited a significant upward trend, increasing at a rate of 6.7 gC m−2 per year, with a coefficient of determination (R2) of 0.82. GPP values rose from 316.7 gC m−2 in 2001 to 483.3 gC m−2 in 2020, representing a substantial 52.6% increase over the two decades. We conducted a change point detection for GPP from 2001 to 2020 and found a turning point in 2011. Before 2011, the GPP increased by 4.9 gC m−2 per year, with an R2 of 0.39. After 2011, the increase was 6.5 gC m−2 per year, with an R2 of 0.61.
Figure 4 and Table 2 present the spatial distribution and statistical analysis of GPP across Northern China’s ecological engineering areas from 2001 to 2020. The annual average GPP within the region exhibited substantial variability, ranging from 0.005 gC m−2 to 1438.9 gC m−2. The multi-year average GPP was significantly higher in the APTM region compared to SPMRYR, with SPLR and TNSP displaying progressively lower values. High GPP values were predominantly observed in Qinling, Taihang, and the Yanshan Mountains, with a general decreasing trend from east to west and from south to north across the study area. By 2020, GPP had increased across all four main regions compared to 2001, with increments of 127.0 gC m−2 (TNSP), 306.3 gC m−2 (APTM), 145.5 gC m−2 (SPLR), and 328.4 gC m−2 (SPMRYR), corresponding to 46.4%, 66.6%, 33.7%, and 94.1% of the 2001 GPP values, respectively. These increases represent significant growth, particularly in the APTM and SPMRYR regions, highlighting substantial improvements in vegetation productivity over the past two decades.
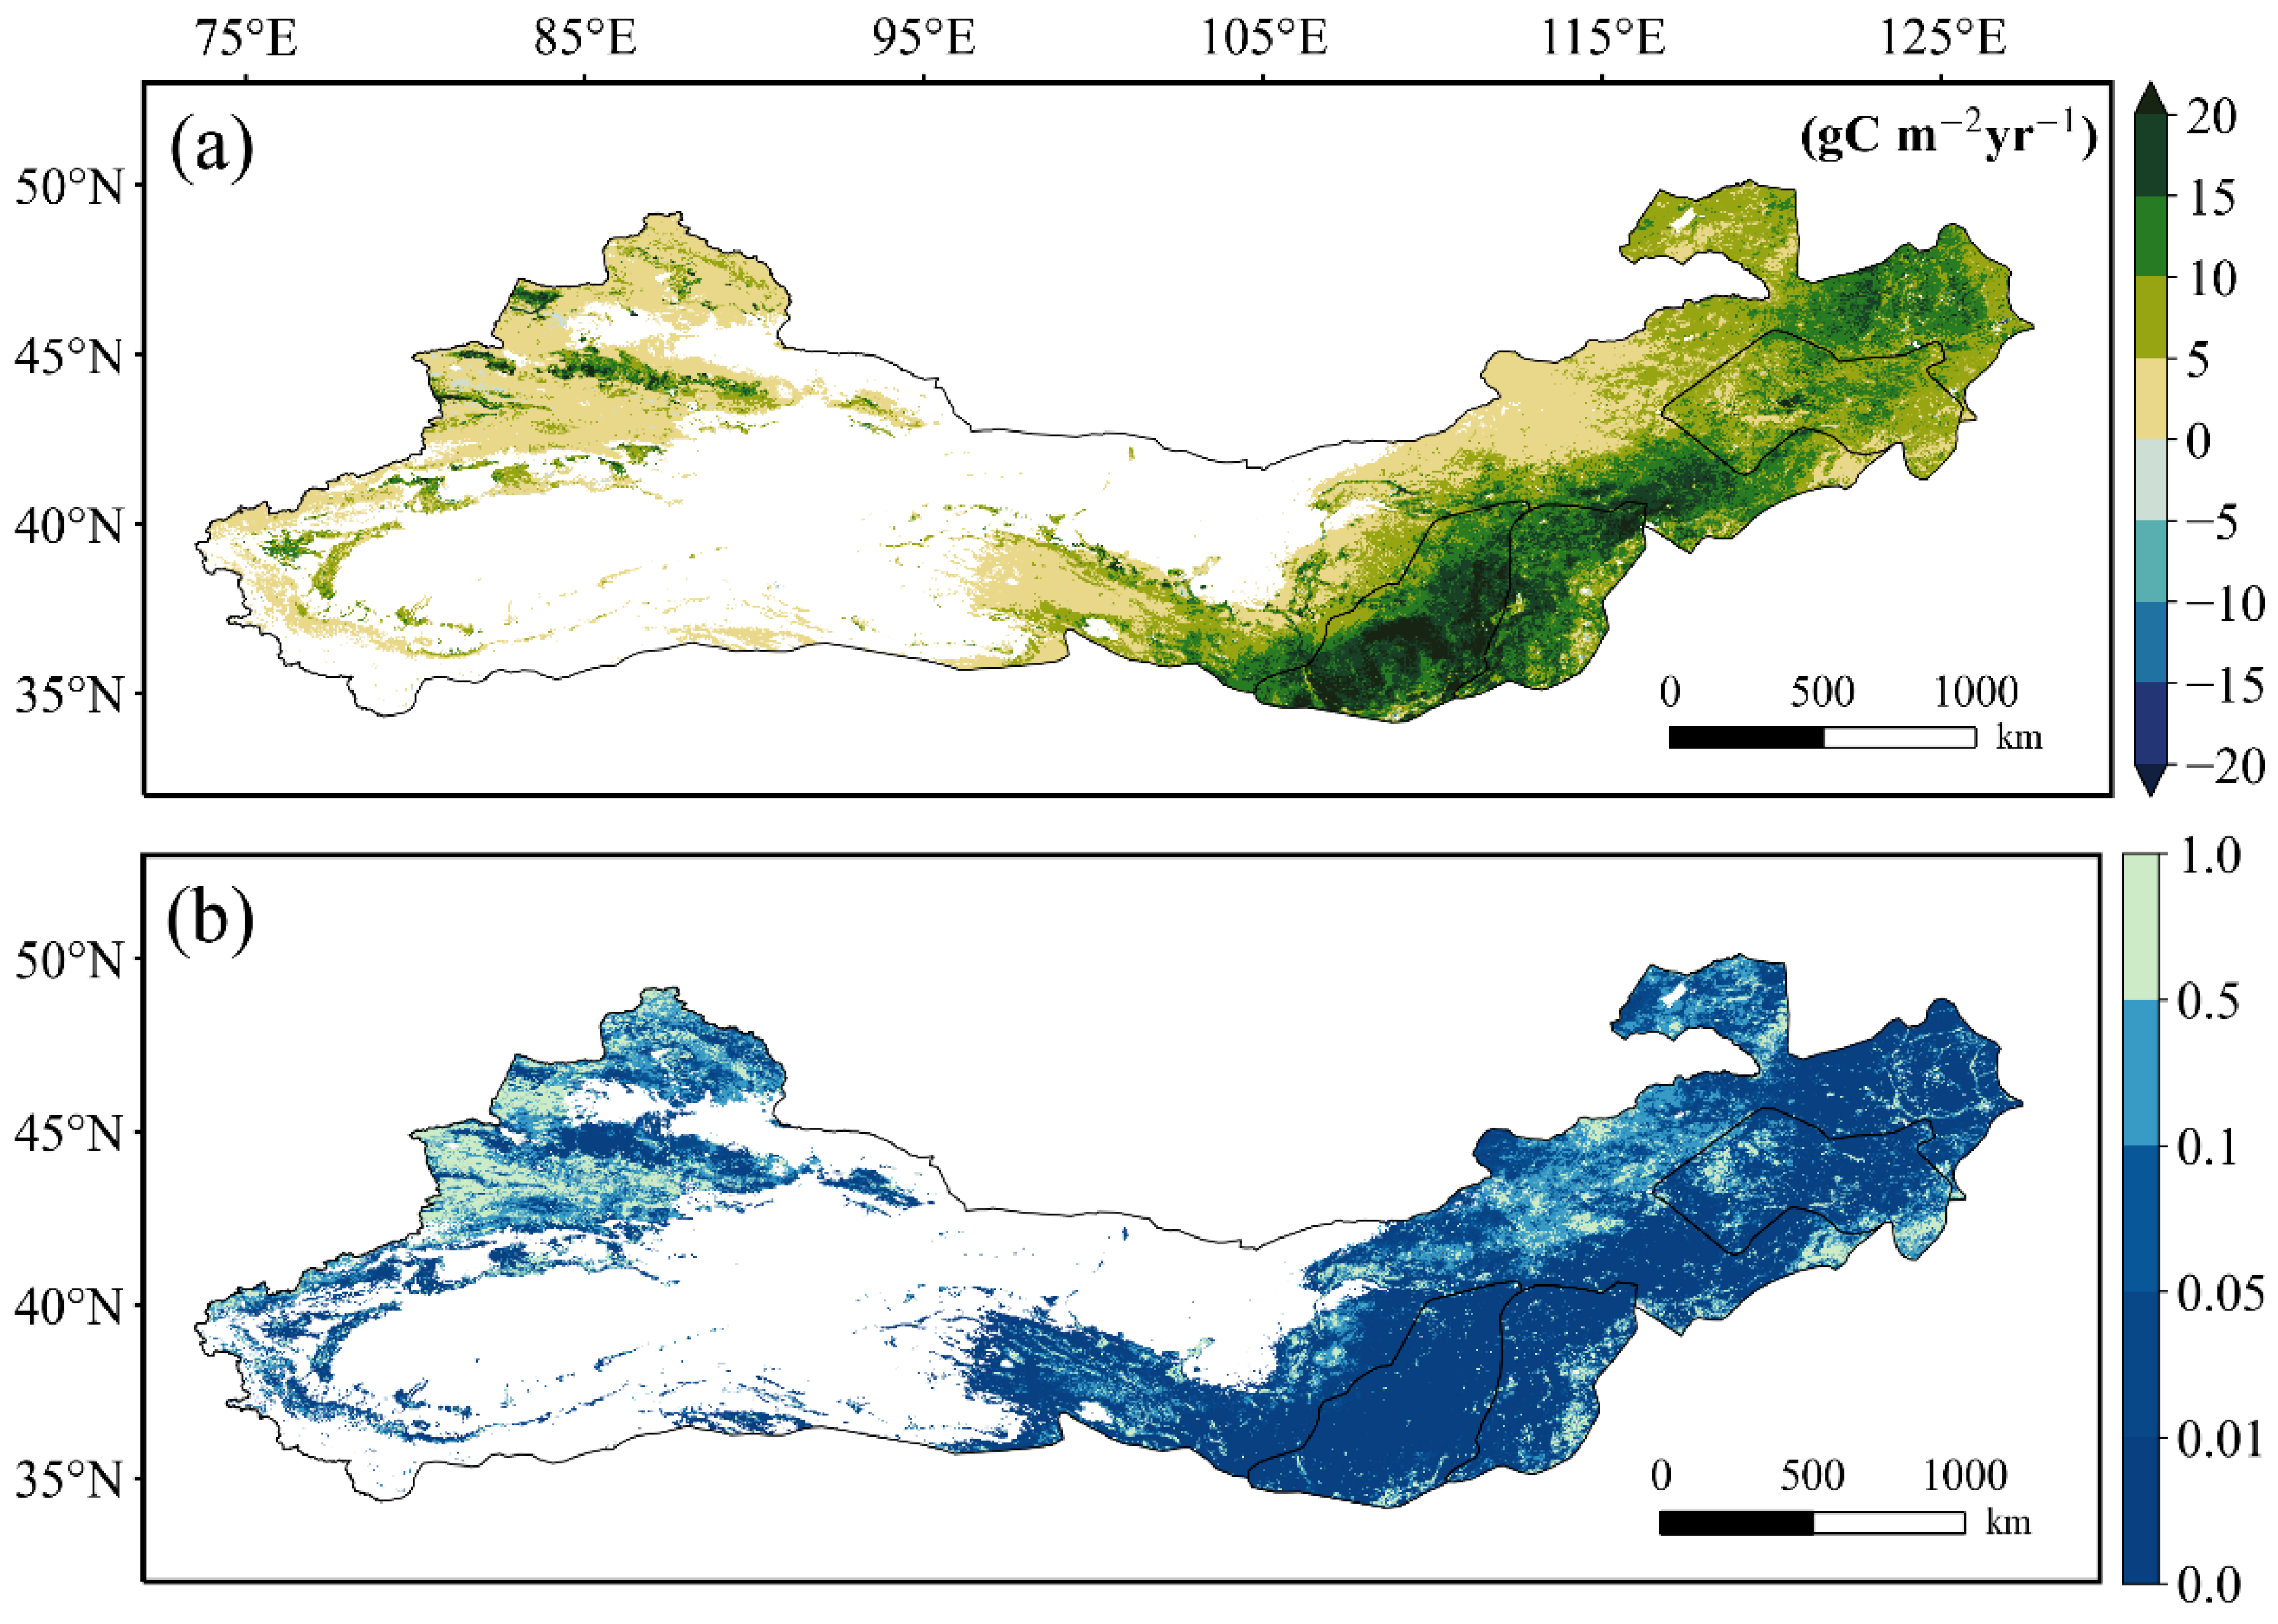
Figure 5 illustrates the long-term trends in GPP from 2001 to 2020, with corresponding significance levels as detailed in Table 2 (p < 0.05 and p < 0.01). The GPP trends ranged between −41 gC m−2yr−1 and 48 gC m−2yr−1. A substantial portion of the areas under ecological restoration programs exhibited increases in GPP. Specifically, 60.9% of the regions demonstrated highly significant enhancements in vegetation greenness, 14.0% showed significant improvements, and 22.2% experienced non-significant improvements. Only 2.9% of the areas saw vegetation degradation over the last two decades. Significant GPP increases were predominantly observed in the northeastern Three-North Shelterbelt, Taihang Mountains, Loess Plateau, and other regions. In contrast, some areas in Qinghai, Xinjiang, and northwestern Gansu exhibited non-significant or slight decreases in GPP.

3.2. Impacts of Environment Factors on GPP Dynamics

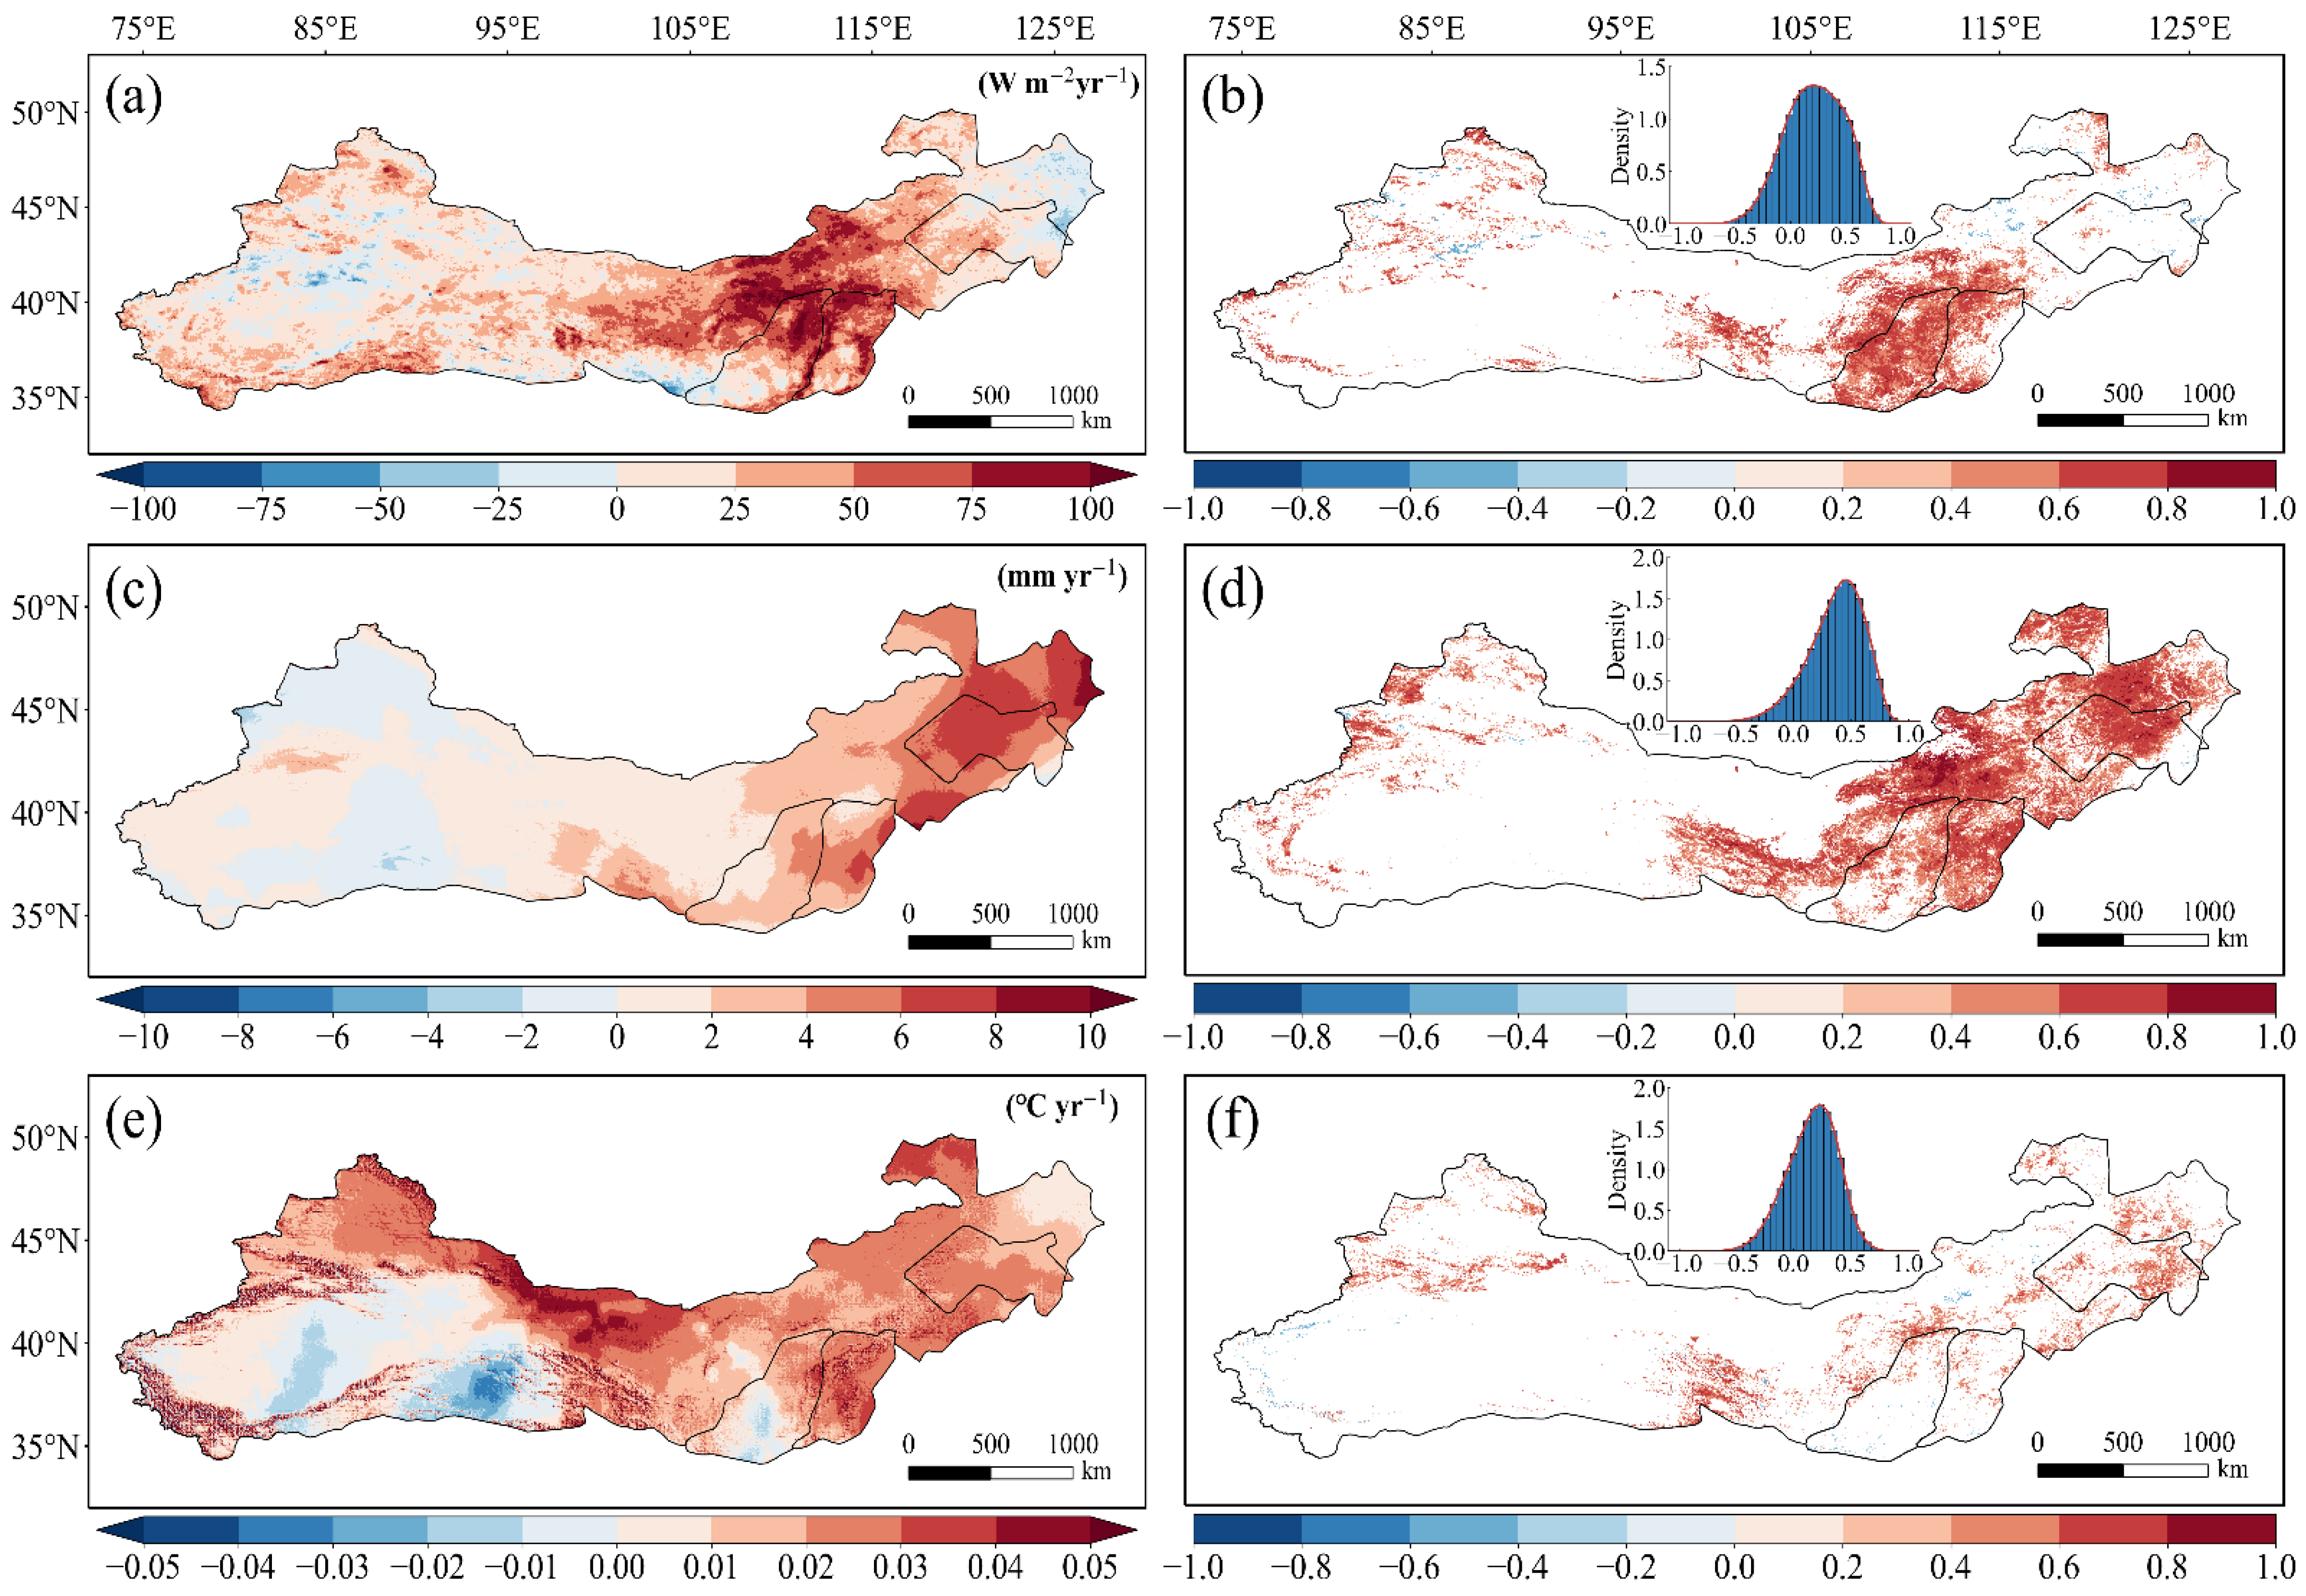
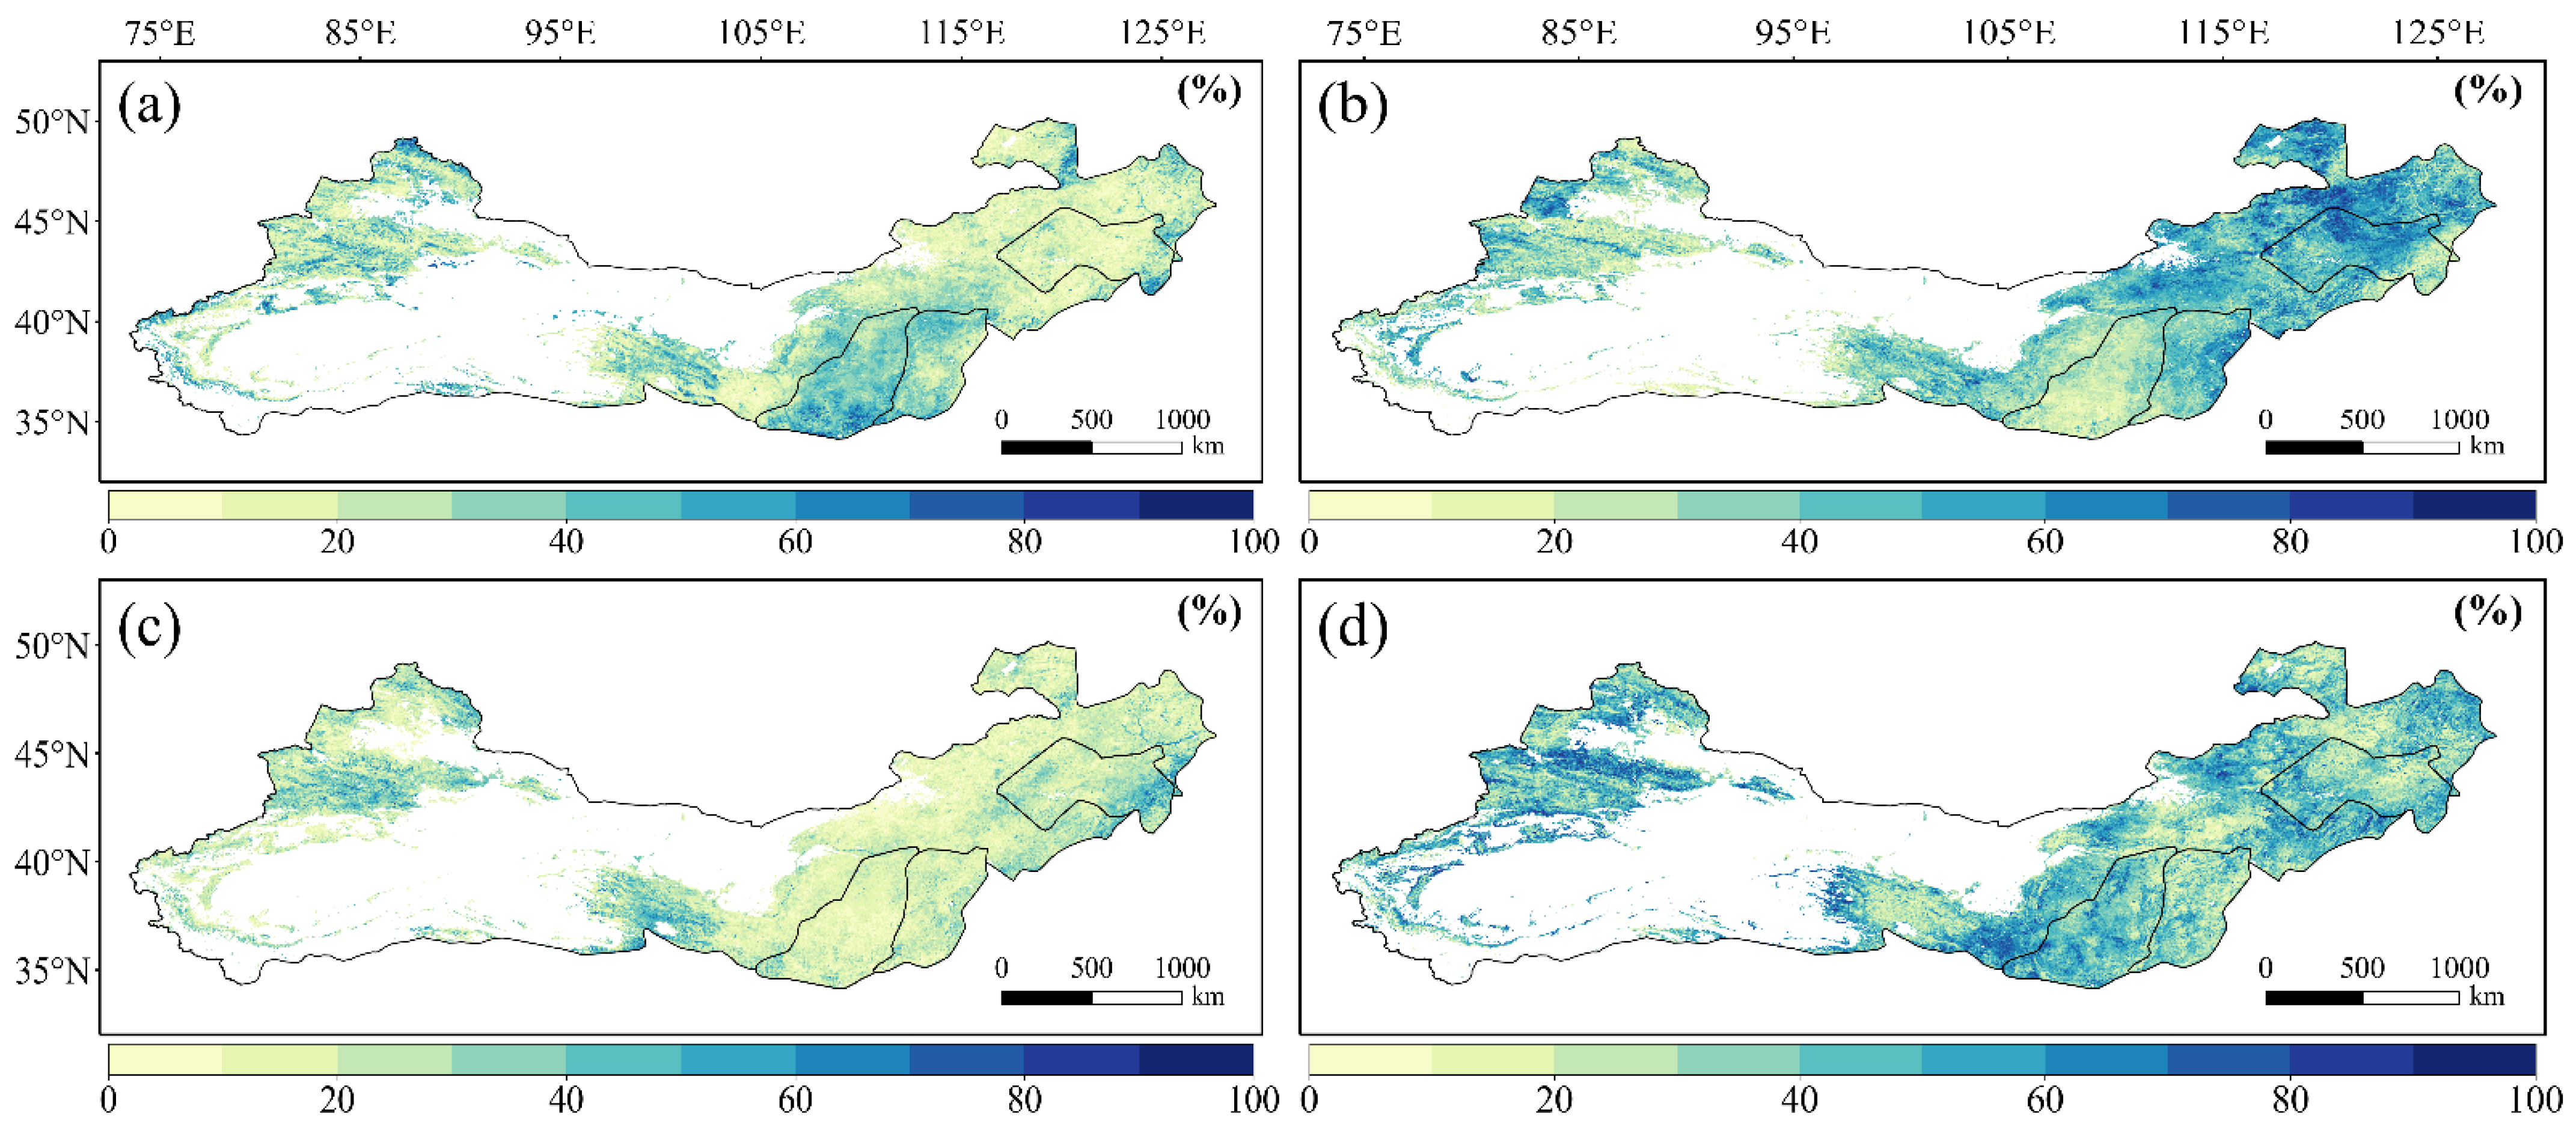
We presented the interannual trends of climate factors, and partial correlation analysis was conducted to evaluate the relationships between climate factors (i.e., solar radiation, precipitation, and temperature) and GPP within Northern China’s ecological restoration areas (Figure 6). From Figure 6a, it can be observed that radiation is significantly increasing in the western Mongolian Plateau and the northern Loess Plateau. A positive correlation between solar radiation and GPP was observed in 78.2% of the study areas, particularly in the Loess Plateau, western Inner Mongolian Plateau, and northern Xinjiang, indicating that solar radiation positively influences GPP. The Loess Plateau, in particular, exhibited a significant positive correlation, covering 18.3% of the study area, underscoring the role of solar radiation in enhancing vegetation growth. Conversely, negative correlations were found in 21.8% of the study area including regions such as the Northeast Plain, eastern Inner Mongolian Plateau, Tianshan Mountains, and parts of the Junggar Basin, suggesting that solar radiation may inhibit vegetation growth in these areas (Figure 6b).
In areas with ecological restoration projects, the increasing trend of precipitation over the past 20 years showed a pattern of higher values in the west and lower values in the east, with an overall upward trend, although there was a decline observed in the Tianshan Mountains and the Tarim Basin (Figure 6c). A total of 92.0% of the vegetation exhibited a positive correlation between precipitation and GPP, especially in the Northeastern Plain, the Loess Plateau, the Inner Mongolian Plateau, and the northwestern part of Xinjiang, indicating that precipitation has a beneficial effect on GPP. Significant positive correlations were particularly evident in the Northeastern Plains, Loess Plateau, and Inner Mongolian Plateau, covering 35.3% of Northern China, highlighting enhanced vegetation growth in these regions. However, in Northwestern Xinjiang, Northeastern China, and parts of the QTP, significant negative correlations indicated that precipitation might inhibit vegetation growth, as shown in Figure 6d.
In most ecological restoration areas, temperatures showed an upward trend, with only a slight decrease observed in the Tarim Basin and southern Loess Plateau (Figure 6e). Figure 6f shows that approximately 77.1% of the study area exhibited a positive correlation between temperature and GPP, mainly in the Northeastern Plain, the QTP, and certain areas of the northern Loess Plateau. The QTP, Tianshan Mountains, and Northeastern Plain displayed significantly higher correlations, indicating that higher temperatures favored GPP growth in 6.2% of the study region. In contrast, negative correlations were observed in 22.9% of the area, particularly in the southern Loess Plateau and parts of the Inner Mongolian Plateau, suggesting that rising temperatures may hinder GPP growth and vegetation development in these regions.

3.3. Impacts of Vegetation Dynamics on GPP Dynamics

Figure 7 illustrates the changes in forest coverage within the ecological restoration areas over the past 20 years. The trend in vegetation growth closely paralleled that of the GPP. From 2001 (2.5%) to 2020 (4.8%), the average forest coverage in Northern China increased by 0.08% per year, leading to an overall increase of 92% relative to the 2001 value. This growth is supported by a coefficient of determination (R2) of 0.62, highlighting the significant impact of ecological engineering on vegetation greening in Northern China, in conjunction with other contributing factors.
We also conducted a partial correlation analysis to evaluate the relationship between forest coverage and GPP, complemented by pixel-wise significance statistics (Figure 8). A significant positive correlation between forest cover and GPP was observed in 85.0% of the study area, particularly in the northern part of Northeast China and most regions of Northwestern China. This finding suggests that increases in forest coverage have contributed to GPP growth. Notably, strong positive correlations were identified in northern Xinjiang, the Loess Plateau, and Northeastern China, which together account for 32.0% of the study area.

3.4. Contributions of Climatic and Vegetation Factors to the GPP Variability

Using ridge regression, we evaluated the contributions of climate factors and changes in forest coverage to GPP in Northern China (Figure 9). Both factors were found to positively influence vegetation growth overall. Changes in forest coverage made the most significant contributions in the central and western regions of Northern China including the Loess Plateau, Inner Mongolian Plateau, and northern Xinjiang. In contrast, temperature had a notably weaker influence, particularly in the northern areas of the QTP. Solar radiation and precipitation had a more substantial impact on GPP than temperature, especially in the Loess Plateau and northeastern parts of the study area. The influence of precipitation, closely aligned with the effects of ecological engineering, was particularly pronounced around the Tianshan Mountains and the Mongolian Plateau, underscoring its substantial role alongside ecological engineering efforts in promoting vegetation growth.
Figure 10 illustrates the distribution of dominant factors contributing to vegetation greening in Northern China’s ecological restoration areas. Changes in forest coverage, which account for 39.0% of the area, were particularly prominent in the southern Tianshan Mountains, Loess Plateau, and Mongolian Plateau, underscoring their critical role in enhancing GPP in Northern China. Climate factors are also played a significant role, with solar radiation influencing 15.4% of the study area, notably on the Loess Plateau. Precipitation emerged as a key factor, driving GPP changes in 39.2% of the area, particularly across various dryland regions including the Inner Mongolian Plateau, Northeast Plain, and northern Xinjiang. Temperature contributed to 6.4% of the area, mainly affecting regions on the QTP.
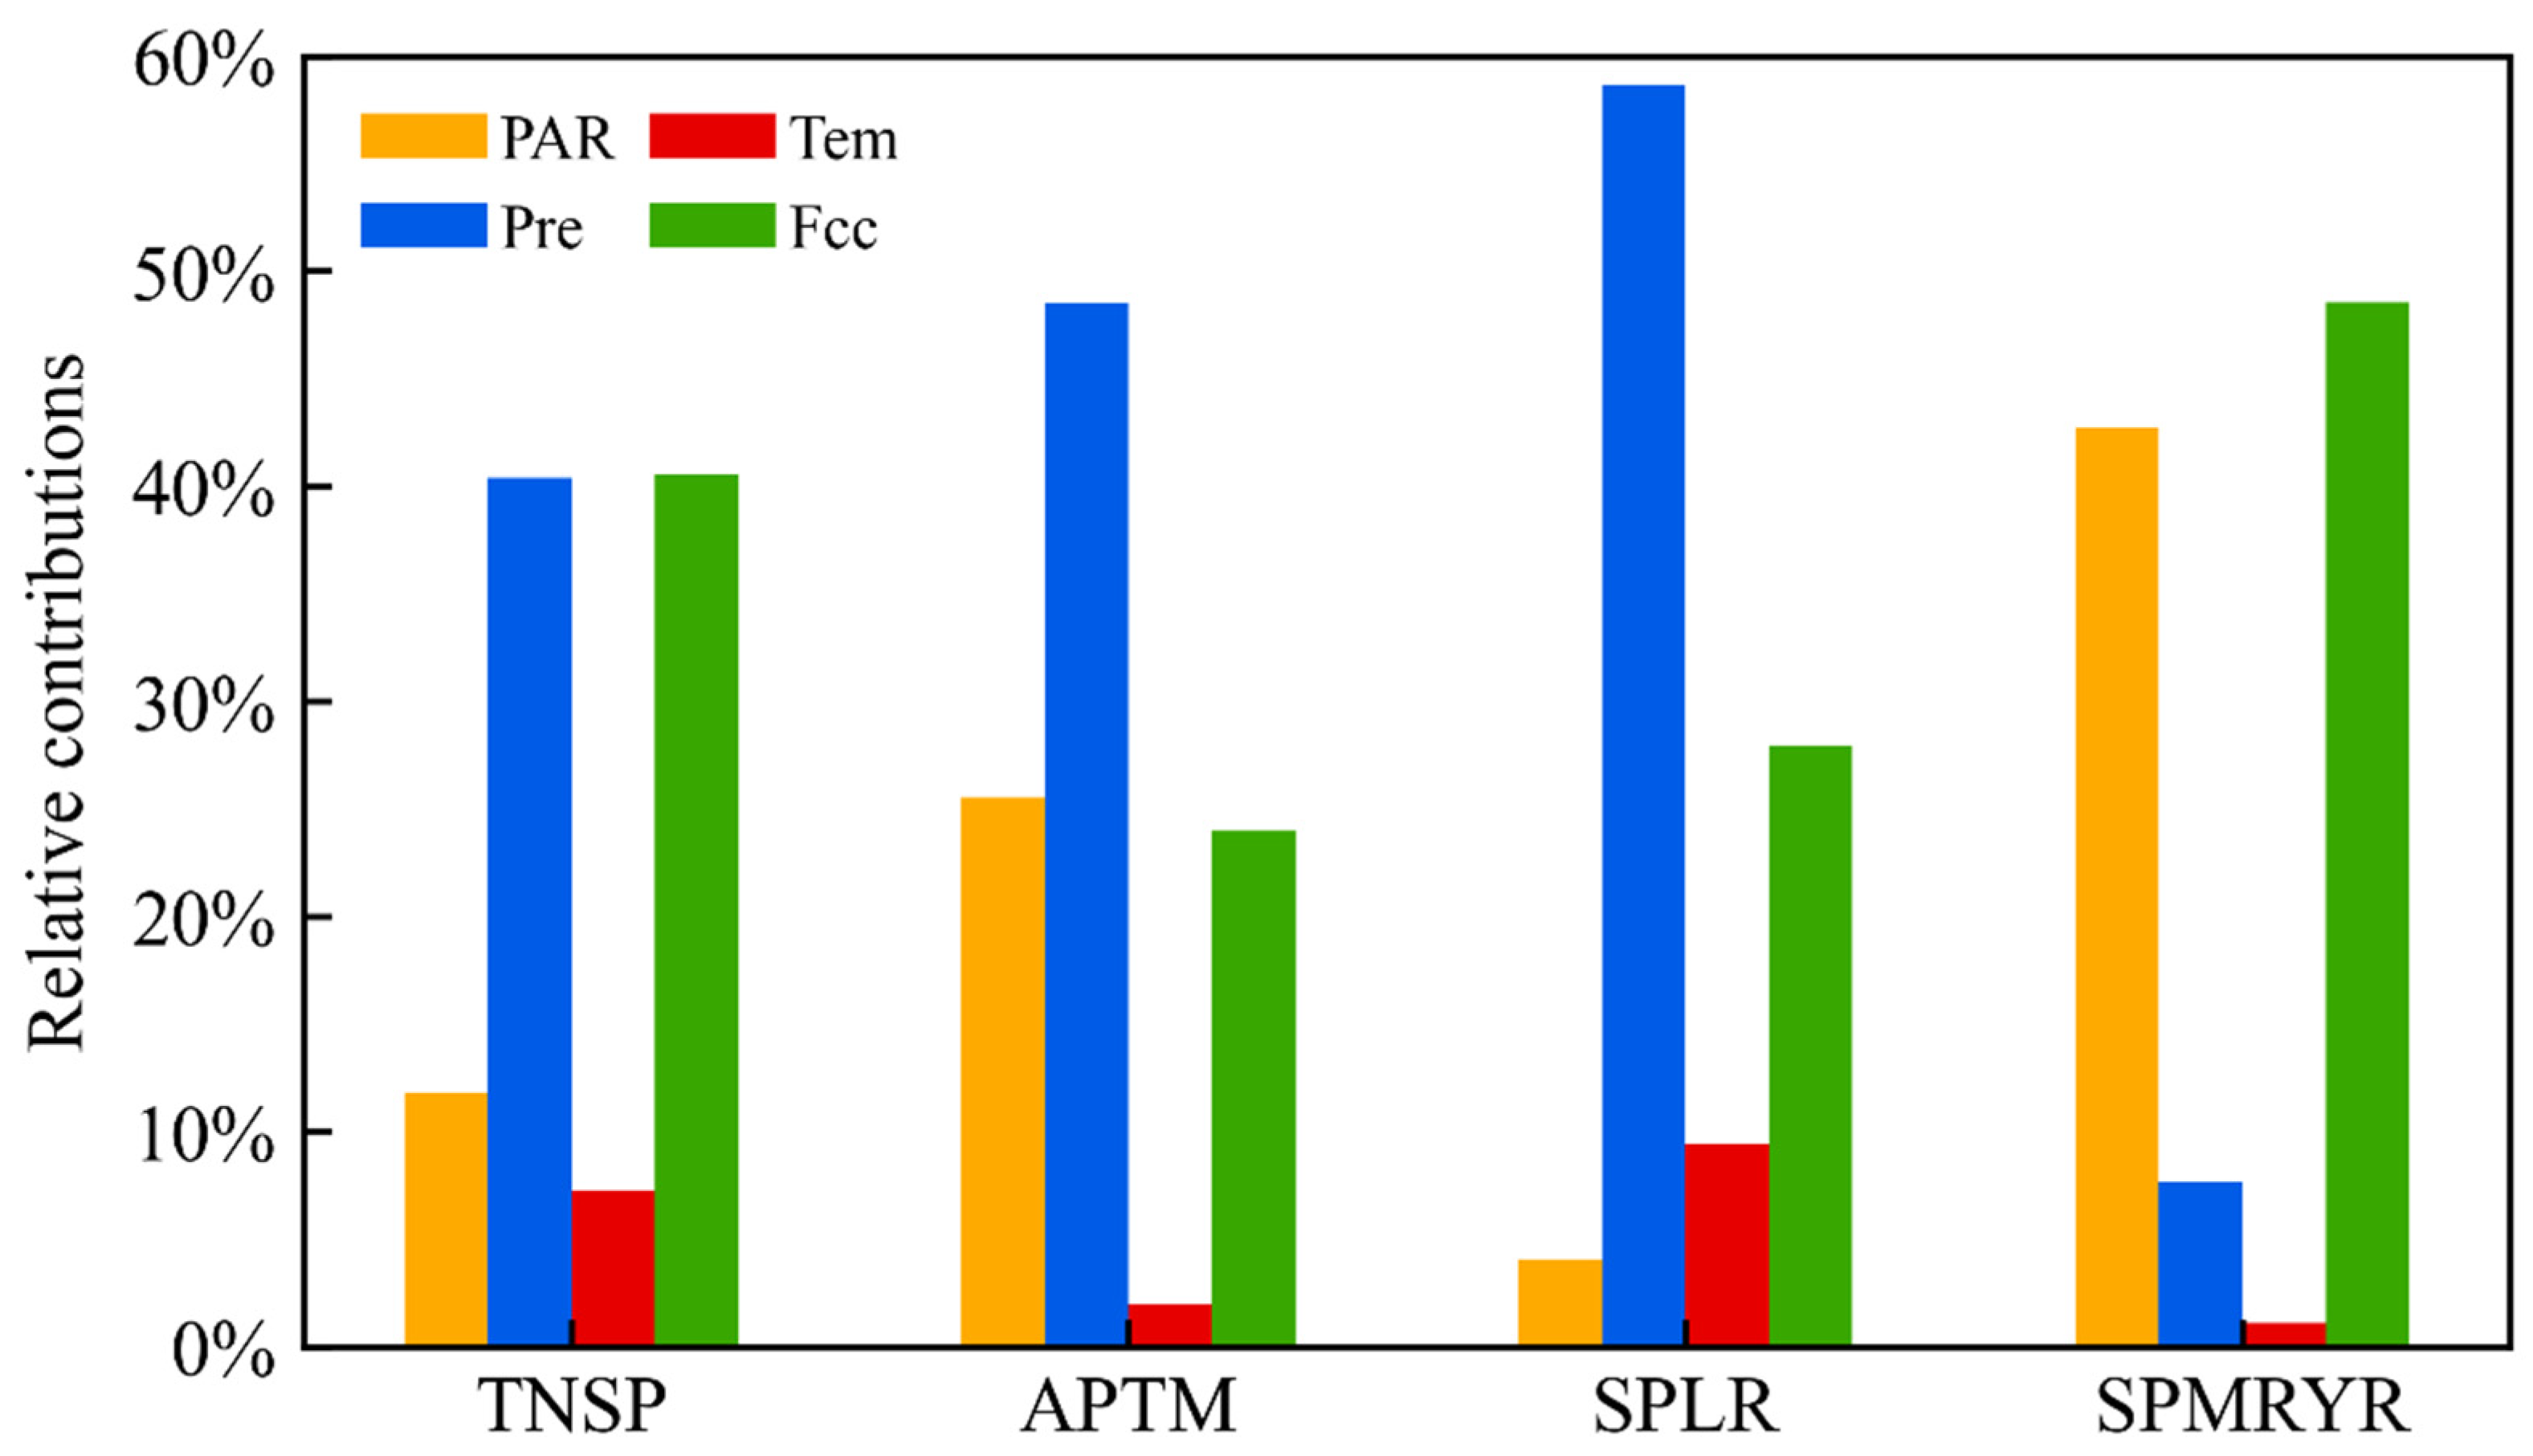
We further analyzed the impact of various factors in four key ecological engineering regions in Northern China, as shown in Figure 11. The influence of forest dynamics and climate factors on GPP varied across these regions. In the TNSP area, precipitation and forest dynamics contributed approximately 40.4% and 40.6%, respectively, to GPP changes. In contrast, the APTM and SPLR regions identified precipitation as the primary driver, with forest dynamics playing a minor role. Conversely, in the SPMRYR region, forest dynamics had the most significant impact, with radiation (42.7%) surpassing precipitation, highlighting its crucial role in influencing vegetation productivity on the Loess Plateau.

4. Discussions

4.1. GPP Variations and Driving Mechanisms of GPP Variation

Our findings revealed a significant greening trend in the study area from 2001 to 2020, with GPP increasing at an annual rate of 6.7 gC m−2, consistent with previous studies [15,38,39,40]. Previous studies have demonstrated that solar radiation, temperature, and precipitation significantly influence vegetation GPP variations, particularly in the context of climate change [34,41,42,43]. Since the comprehensive implementation of the TNSP in 1978, ecological engineering has emerged as a pivotal factor in vegetation greening and GPP enhancement [16,34,44]. The increase in GPP in China from 2001 to 2020 is attributed to both climate factors and afforestation efforts, with distinct spatial impacts. Solar radiation, in particular, enhances photosynthesis in arid and semi-arid regions, thereby boosting GPP in areas such as the Inner Mongolian Plateau and Loess Plateau [15,45]. It also promotes forest growth by providing the energy necessary for photosynthesis, particularly in the Northeast region [46]. Our study found that solar radiation is the primary driving factor for vegetation productivity in the high-mountain areas of the northeastern part of the study region, consistent with previous research [22]. Precipitation is crucial for vegetation growth in dryland regions such as the Mongolian Plateau, Loess Plateau, and the farming areas of the Northeast and North China Plain [34,44,47], although it may hinder vegetation productivity in northeast parts of the QTP [41,48]. Higher temperatures can stress vegetation in arid areas by increasing evapotranspiration, thereby reducing GPP [34,49]. However, in the cold such as the QTP, higher temperature can enhance vegetation growth by increasing water availability from ice and snow melt [11].
A strong positive correlation between forest coverage and GPP fluctuations was observed, as indicated with a Pearson correlation coefficient of 0.9. This study emphasizes the significant impact of increased forest coverage in boosting vegetation productivity across Northern China. The effect is particularly pronounced in central regions of Northeast China, the North China Plain, the Loess Plateau, the Inner Mongolia Plateau, and parts of Northwestern China [50], suggesting that GPP changes in these areas are primarily driven by variations in vegetation cover. Numerous ecological restoration initiatives, such as the conversion of cropland to forest, natural forest protection, and the extensive TNSP, are concentrated in these areas. These initiatives have substantially increased both vegetation cover and GPP [12]. These findings underscore the critical role of ecological engineering in enhancing vegetation cover [17,18], consequently improving the overall primary productivity of the region.
In this study, we evaluated the influence of climate factors and forest coverage changes on vegetation dynamics using ridge regression to determine their relative impacts. Our findings revealed that climate factors are the predominant contributors to GPP variations, aligning with previous research [15]. Climate factors accounted for about 61.04% of the influence on GPP, particularly in forested areas of the Northeast regions and the QTP. Conversely, changes in forest coverage contributed 38.96% to GPP growth, especially in the Loess Plateau, Inner Mongolia Plateau, and northern Xinjiang, highlighting the multifactorial influences on vegetation productivity in Northern China.

4.2. Implications for Ecological Projects

This study underscores the profound effects of climatic factors and vegetation changes on enhancing vegetation productivity in Northern China, which is critical for achieving China’s carbon neutrality goals [51]. Northern China, characterized by its fragile ecosystems and low vegetation coverage [52,53], stands to benefit significantly from extensive afforestation and reforestation efforts, which could substantially boost the region’s carbon sequestration capacity. Of course, in certain circumstances, afforestation does not necessarily provide an ecological boost as this depends on the situation, species composition, etc. [18]. The GPP of vegetation forms the foundation of energy flow within ecosystems and is closely linked to the maintenance of food webs, energy transfer, and ecological balance. These ecological projects not only enhance the overall vegetation productivity, but also support biodiversity recovery, ecosystem stability, and sustainable development. Additionally, addressing severe land degradation and desertification in Northern China through increased GPP could accelerate ecological restoration, improve soil quality, and enhance the sustainable use of land. The research highlights the essential role of climate and forest coverage changes in promoting vegetation productivity, with significant implications for environmental restoration and sustainable development toward carbon neutrality in Northern China.

4.3. Uncertainties and Limitations

This study acknowledges potential uncertainties, particularly regarding the use of MODIS GPP products, which are based on the light use efficiency algorithm for large-scale GPP assessment. Although MODIS GPP products are validated and widely applied across various ecosystems, they tend to underestimate GPP in arid cropland and forest ecosystems as well as overlook GPP values in desert ecosystems. These inherent uncertainties remain a concern [54]. Additionally, the use of multiple regression analysis in this study simplified the complex interactions between climate and forest coverage changes, potentially reducing the nonlinear relationships between GPP dynamics and climate-related factors to a linear framework [55]. This simplification could affect the accuracy of quantifying the relative contributions of these factors. Furthermore, changes in vegetation productivity are also influenced by other factors such as topographic and the atmospheric CO2 concentration. Additionally, other anthropogenic variables and ecological engineering activities besides afforestation, such as grassland restoration and wetland conservation, could also impact the GPP.

5. Conclusions

This study conducted a comprehensive assessment of the relative impacts of climate factors and vegetation changes on vegetation productivity in Northern China from 2001 to 2020. A significant correlation between forest coverage changes and GPP variability was identified, underscoring the positive effects of afforestation. The study also highlighted regional differences in the influence of various factors on GPP within ecological restoration areas. Forest coverage changes emerged as the primary driver of GPP in regions such as the Loess Plateau, western Inner Mongolia Plateau, and northern Xinjiang, while climate factors exerted a more substantial influence in areas like the eastern Inner Mongolia Plateau and northeastern regions. The findings emphasize the crucial role of forest changes, particularly through programs like the Three-North Shelterbelt Program, in enhancing vegetation productivity across Northwestern China, with the most significant impact observed in the Inner Mongolia Plateau and the Loess Plateau. In contrast, forest changes in the northeastern region had a lesser impact on GPP, where climate-related factors played a more dominant role. These results provide valuable insights for addressing desertification and inform decision-making for ecological restoration and sustainability efforts. Future research will aim to refine methodologies to further elucidate the contributions of these factors to vegetation productivities.

Author Contributions

Conceptualization, H.W. and K.L.; Methodology, H.W.; Formal analysis, H.W., X.W. and K.L.; Writing—original draft preparation, K.L. and H.W.; Writing—review and editing, H.W., X.W. and K.L.; Visualization, K.L. All authors have read and agreed to the published version of the manuscript.

Funding

This study was funded by the National Natural Science Foundation of China (Grant Nos. 42371405 and 41871250), the Key Research Program of Gansu Province (Grant No. 23ZDKA0004), and Youth Innovation Promotion Association CAS to X.W. (No. 2020422).

Data Availability Statement

The original contributions presented in the study are included in the article, further inquiries can be directed to the corresponding author.

Acknowledgments

We are very grateful to the National Tibetan Plateau Data Center and the Resource, China Flux Observation and Research Network (ChinaFLUX), National Ecosystem Science Data Center and Environmental Science and Data Center of the Chinese Academy of Sciences for the availability of data.

Conflicts of Interest

The authors declare no conflicts of interest.

References

  1. Piao, S.; Wang, X.; Park, T.; Chen, C.; Lian, X.; He, Y.; Bjerke, J.W.; Chen, A.; Ciais, P.; Tømmervik, H.; et al. Characteristics, Drivers and Feedbacks of Global Greening. Nat. Rev. Earth Environ. 2019, 1, 14–27. [Google Scholar] [CrossRef]
  2. Chen, C.; Park, T.; Wang, X.; Piao, S.; Xu, B.; Chaturvedi, R.K.; Fuchs, R.; Brovkin, V.; Ciais, P.; Fensholt, R.; et al. China and India Lead in Greening of the World through Land-Use Management. Nat. Sustain. 2019, 2, 122–129. [Google Scholar] [CrossRef] [PubMed]
  3. Feng, X.; Fu, B.; Piao, S.; Wang, S.; Ciais, P.; Zeng, Z.; Lü, Y.; Zeng, Y.; Li, Y.; Jiang, X.; et al. Revegetation in China’s Loess Plateau Is Approaching Sustainable Water Resource Limits. Nat. Clim. Chang. 2016, 6, 1019–1022. [Google Scholar] [CrossRef]
  4. Bryan, B.A.; Gao, L.; Ye, Y.; Sun, X.; Connor, J.D.; Crossman, N.D.; Stafford-Smith, M.; Wu, J.; He, C.; Yu, D.; et al. China’s Response to a National Land-System Sustainability Emergency. Nature 2018, 559, 193–204. [Google Scholar] [CrossRef] [PubMed]
  5. Cao, S. Impact of China’s Large-Scale Ecological Restoration Program on the Environment and Society in Arid and Semiarid Areas of China: Achievements, Problems, Synthesis, and Applications. Crit. Rev. Environ. Sci. Technol. 2011, 41, 317–335. [Google Scholar] [CrossRef]
  6. Menz, M.H.M.; Dixon, K.W.; Hobbs, R.J. Hurdles and Opportunities for Landscape-Scale Restoration. Science 2013, 339, 526–527. [Google Scholar] [CrossRef]
  7. Wang, B.; Gao, P.; Niu, X.; Sun, J. Policy-Driven China’s Grain to Green Program: Implications for Ecosystem Services. Ecosyst. Serv. 2017, 27, 38–47. [Google Scholar] [CrossRef]
  8. Wang, F.; Pan, X.; Gerlein-Safdi, C.; Cao, X.; Wang, S.; Gu, L.; Wang, D.; Lu, Q. Vegetation Restoration in N Orthern China: A Contrasted Picture. Land. Degrad. Dev. 2020, 31, 669–676. [Google Scholar] [CrossRef]
  9. Field, C.B.; Lobell, D.B.; Peters, H.A.; Chiariello, N.R. Feedbacks of Terrestrial Ecosystems to Climate Change. Annu. Rev. Environ. Resour. 2007, 32, 1–29. [Google Scholar] [CrossRef]
  10. Gang, C.; Zhang, Y.; Wang, Z.; Chen, Y.; Yang, Y.; Li, J.; Cheng, J.; Qi, J.; Odeh, I. Modeling the Dynamics of Distribution, Extent, and NPP of Global Terrestrial Ecosystems in Response to Future Climate Change. Glob. Planet. Chang. 2017, 148, 153–165. [Google Scholar] [CrossRef]
  11. Wang, S.; Zhang, B.; Yang, Q.; Chen, G.; Yang, B.; Lu, L.; Shen, M.; Peng, Y. Responses of Net Primary Productivity to Phenological Dynamics in the Tibetan Plateau, China. Agric. For. Meteorol. 2017, 232, 235–246. [Google Scholar] [CrossRef]
  12. Ma, J.; Xiao, X.; Miao, R.; Li, Y.; Chen, B.; Zhang, Y.; Zhao, B. Trends and Controls of Terrestrial Gross Primary Productivity of China during 2000–2016. Environ. Res. Lett. 2019, 14, 084032. [Google Scholar] [CrossRef]
  13. Zhou, X.; Yamaguchi, Y.; Arjasakusuma, S. Distinguishing the Vegetation Dynamics Induced by Anthropogenic Factors Using Vegetation Optical Depth and AVHRR NDVI: A Cross-Border Study on the Mongolian Plateau. Sci. Total Environ. 2018, 616–617, 730–743. [Google Scholar] [CrossRef]
  14. Zhang, Y.; Zhang, C.; Wang, Z.; Chen, Y.; Gang, C.; An, R.; Li, J. Vegetation Dynamics and Its Driving Forces from Climate Change and Human Activities in the Three-River Source Region, China from 1982 to 2012. Sci. Total Environ. 2016, 563–564, 210–220. [Google Scholar] [CrossRef]
  15. Ge, W.; Deng, L.; Wang, F.; Han, J. Quantifying the Contributions of Human Activities and Climate Change to Vegetation Net Primary Productivity Dynamics in China from 2001 to 2016. Sci. Total Environ. 2021, 773, 145648. [Google Scholar] [CrossRef] [PubMed]
  16. Zheng, K.; Wei, J.-Z.; Pei, J.-Y.; Cheng, H.; Zhang, X.-L.; Huang, F.-Q.; Li, F.-M.; Ye, J.-S. Impacts of Climate Change and Human Activities on Grassland Vegetation Variation in the Chinese Loess Plateau. Sci. Total Environ. 2019, 660, 236–244. [Google Scholar] [CrossRef]
  17. Cai, Y.; Zhang, F.; Duan, P.; Yung Jim, C.; Weng Chan, N.; Shi, J.; Liu, C.; Wang, J.; Bahtebay, J.; Ma, X. Vegetation Cover Changes in China Induced by Ecological Restoration-Protection Projects and Land-Use Changes from 2000 to 2020. CATENA 2022, 217, 106530. [Google Scholar] [CrossRef]
  18. Song, W.; Feng, Y.; Wang, Z. Ecological Restoration Programs Dominate Vegetation Greening in China. Sci. Total Environ. 2022, 848, 157729. [Google Scholar] [CrossRef]
  19. Du, J.; Fu, Q.; Fang, S.; Wu, J.; He, P.; Quan, Z. Effects of Rapid Urbanization on Vegetation Cover in the Metropolises of China over the Last Four Decades. Ecol. Indic. 2019, 107, 105458. [Google Scholar] [CrossRef]
  20. Liu, H.; Jiao, F.; Yin, J.; Li, T.; Gong, H.; Wang, Z.; Lin, Z. Nonlinear Relationship of Vegetation Greening with Nature and Human Factors and Its Forecast—A Case Study of Southwest China. Ecol. Indic. 2020, 111, 106009. [Google Scholar] [CrossRef]
  21. Monteith, J.L. Solar Radiation and Productivity in Tropical Ecosystems. J. Appl. Ecol. 1972, 9, 747. [Google Scholar] [CrossRef]
  22. Yao, Y.; Wang, X.; Li, Y.; Wang, T.; Shen, M.; Du, M.; He, H.; Li, Y.; Luo, W.; Ma, M.; et al. Spatiotemporal Pattern of Gross Primary Productivity and Its Covariation with Climate in China over the Last Thirty Years. Glob. Chang. Biol. 2018, 24, 184–196. [Google Scholar] [CrossRef]
  23. Zhao, Y.; Chen, Y.; Wu, C.; Li, G.; Ma, M.; Fan, L.; Zheng, H.; Song, L.; Tang, X. Exploring the Contribution of Environmental Factors to Evapotranspiration Dynamics in the Three-River-Source Region, China. J. Hydrol. 2023, 626, 130222. [Google Scholar] [CrossRef]
  24. Li, G.; Wu, C.; Chen, Y.; Huang, C.; Zhao, Y.; Wang, Y.; Ma, M.; Ding, Z.; Yu, P.; Tang, X. Increasing Temperature Regulates the Advance of Peak Photosynthesis Timing in the Boreal Ecosystem. Sci. Total Environ. 2023, 882, 163587. [Google Scholar] [CrossRef]
  25. Li, H.; Xu, F.; Li, Z.; You, N.; Zhou, H.; Zhou, Y.; Chen, B.; Qin, Y.; Xiao, X.; Dong, J. Forest Changes by Precipitation Zones in Northern China after the Three-North Shelterbelt Forest Program in China. Remote Sens. 2021, 13, 543. [Google Scholar] [CrossRef]
  26. Running, S.W.; Zhao, M. User’s Guide Daily GPP and Annual NPP (MOD17A2H/A3H) and Year-End Gap-Filled (MOD17A2HGF/A3HGF) Products NASA Earth Observing System MODIS Land Algorithm (For Collection 6), Version 4.0; MOD17 User’s Guide; LP DAAC: Sioux Falls, SD, USA, 2019. [Google Scholar]
  27. Yu, G.-R.; Wen, X.-F.; Sun, X.-M.; Tanner, B.D.; Lee, X.; Chen, J.-Y. Overview of ChinaFLUX and Evaluation of Its Eddy Covariance Measurement. Agric. For. Meteorol. 2006, 137, 125–137. [Google Scholar] [CrossRef]
  28. Hu, Z.; Chen, S.; Hao, Y. Carbon and Water Fluxes in Ecologically Vulnerable Areas in China. J. Plant Ecol. 2022, 15, 879–881. [Google Scholar] [CrossRef]
  29. Peng, S.; Ding, Y.; Liu, W.; Li, Z. 1 Km Monthly Temperature and Precipitation Dataset for China from 1901 to 2017. Earth Syst. Sci. Data 2019, 11, 1931–1946. [Google Scholar] [CrossRef]
  30. Ryu, Y.; Jiang, C.; Kobayashi, H.; Detto, M. MODIS-Derived Global Land Products of Shortwave Radiation and Diffuse and Total Photosynthetically Active Radiation at 5 Km Resolution from 2000. Remote Sens. Environ. 2018, 204, 812–825. [Google Scholar] [CrossRef]
  31. Geng, M.; Wang, K.; Yang, N.; Li, F.; Zou, Y.; Cheng, X.; Deng, Z.; Xie, Y. Evaluation and Variation Trends Analysis of Water Quality in Response to Water Regime Changes in a Typical River-Connected Lake (Dongting Lake), China. Environ. Pollut. 2021, 268, 115761. [Google Scholar] [CrossRef]
  32. Mann, H.B. Nonparametric Tests Against Trend. Econometrica 1945, 13, 245. [Google Scholar] [CrossRef]
  33. Mao, D.; Wang, Z.; Luo, L.; Ren, C. Integrating AVHRR and MODIS Data to Monitor NDVI Changes and Their Relationships with Climatic Parameters in Northeast China. Int. J. Appl. Earth Obs. Geoinf. 2012, 18, 528–536. [Google Scholar] [CrossRef]
  34. Luo, L.; Ma, W.; Zhuang, Y.; Zhang, Y.; Yi, S.; Xu, J.; Long, Y.; Ma, D.; Zhang, Z. The Impacts of Climate Change and Human Activities on Alpine Vegetation and Permafrost in the Qinghai-Tibet Engineering Corridor. Ecol. Indic. 2018, 93, 24–35. [Google Scholar] [CrossRef]
  35. Gu, Z.; Duan, X.; Shi, Y.; Li, Y.; Pan, X. Spatiotemporal Variation in Vegetation Coverage and Its Response to Climatic Factors in the Red River Basin, China. Ecol. Indic. 2018, 93, 54–64. [Google Scholar] [CrossRef]
  36. Marrelec, G.; Krainik, A.; Duffau, H.; Pélégrini-Issac, M.; Lehéricy, S.; Doyon, J.; Benali, H. Partial Correlation for Functional Brain Interactivity Investigation in Functional MRI. NeuroImage 2006, 32, 228–237. [Google Scholar] [CrossRef] [PubMed]
  37. Wu, D.; Zhao, X.; Liang, S.; Zhou, T.; Huang, K.; Tang, B.; Zhao, W. Time-Lag Effects of Global Vegetation Responses to Climate Change. Glob. Chang. Biol. 2015, 21, 3520–3531. [Google Scholar] [CrossRef]
  38. Piao, S.; Yin, G.; Tan, J.; Cheng, L.; Huang, M.; Li, Y.; Liu, R.; Mao, J.; Myneni, R.B.; Peng, S.; et al. Detection and Attribution of Vegetation Greening Trend in China over the Last 30 Years. Glob. Chang. Biol. 2015, 21, 1601–1609. [Google Scholar] [CrossRef] [PubMed]
  39. Zhang, Y.; Ye, A. Quantitatively Distinguishing the Impact of Climate Change and Human Activities on Vegetation in Mainland China with the Improved Residual Method. GISci. Remote Sens. 2021, 58, 235–260. [Google Scholar] [CrossRef]
  40. Zhou, Z.; Ding, Y.; Shi, H.; Cai, H.; Fu, Q.; Liu, S.; Li, T. Analysis and Prediction of Vegetation Dynamic Changes in China: Past, Present and Future. Ecol. Indic. 2020, 117, 106642. [Google Scholar] [CrossRef]
  41. Yang, Y.; Guan, H.; Shen, M.; Liang, W.; Jiang, L. Changes in Autumn Vegetation Dormancy Onset Date and the Climate Controls across Temperate Ecosystems in China from 1982 to 2010. Glob. Chang. Biol. 2015, 21, 652–665. [Google Scholar] [CrossRef]
  42. Qu, S.; Wang, L.; Lin, A.; Yu, D.; Yuan, M.; Li, C. Distinguishing the Impacts of Climate Change and Anthropogenic Factors on Vegetation Dynamics in the Yangtze River Basin, China. Ecol. Indic. 2020, 108, 105724. [Google Scholar] [CrossRef]
  43. Teng, M.; Zeng, L.; Hu, W.; Wang, P.; Yan, Z.; He, W.; Zhang, Y.; Huang, Z.; Xiao, W. The Impacts of Climate Changes and Human Activities on Net Primary Productivity Vary across an Ecotone Zone in Northwest China. Sci. Total Environ. 2020, 714, 136691. [Google Scholar] [CrossRef]
  44. Jiang, H.; Xu, X.; Guan, M.; Wang, L.; Huang, Y.; Jiang, Y. Determining the Contributions of Climate Change and Human Activities to Vegetation Dynamics in Agro-Pastural Transitional Zone of Northern China from 2000 to 2015. Sci. Total Environ. 2020, 718, 134871. [Google Scholar] [CrossRef] [PubMed]
  45. Pan, X.; Song, Y.-B.; Liu, G.-F.; Hu, Y.-K.; Ye, X.-H.; Cornwell, W.K.; Prinzing, A.; Dong, M.; Cornelissen, J.H.C. Functional Traits Drive the Contribution of Solar Radiation to Leaf Litter Decomposition among Multiple Arid-Zone Species. Sci. Rep. 2015, 5, 13217. [Google Scholar] [CrossRef] [PubMed]
  46. Yan, M.; Xue, M.; Zhang, L.; Tian, X.; Chen, B.; Dong, Y. A Decade’s Change in Vegetation Productivity and Its Response to Climate Change over Northeast China. Plants 2021, 10, 821. [Google Scholar] [CrossRef]
  47. Mo, K.; Chen, Q.; Chen, C.; Zhang, J.; Wang, L.; Bao, Z. Spatiotemporal Variation of Correlation between Vegetation Cover and Precipitation in an Arid Mountain-Oasis River Basin in Northwest China. J. Hydrol. 2019, 574, 138–147. [Google Scholar] [CrossRef]
  48. Luo, Z.; Wu, W.; Yu, X.; Song, Q.; Yang, J.; Wu, J.; Zhang, H. Variation of Net Primary Production and Its Correlation with Climate Change and Anthropogenic Activities over the Tibetan Plateau. Remote Sens. 2018, 10, 1352. [Google Scholar] [CrossRef]
  49. Tang, Z.; Ma, J.; Peng, H.; Wang, S.; Wei, J. Spatiotemporal Changes of Vegetation and Their Responses to Temperature and Precipitation in Upper Shiyang River Basin. Adv. Space Res. 2017, 60, 969–979. [Google Scholar] [CrossRef]
  50. Ren, M.; Chen, W.; Wang, H. Ecological Policies Dominated the Ecological Restoration over the Core Regions of Kubuqi Desert in Recent Decades. Remote Sens. 2022, 14, 5243. [Google Scholar] [CrossRef]
  51. Wang, H.; Li, X.; Xiao, J.; Ma, M.; Tan, J.; Wang, X.; Geng, L. Carbon Fluxes across Alpine, Oasis, and Desert Ecosystems in Northwestern China: The Importance of Water Availability. Sci. Total Environ. 2019, 697, 133978. [Google Scholar] [CrossRef]
  52. Wang, H.; Ma, M.; Geng, L. Monitoring the Recent Trend of Aeolian Desertification Using Landsat TM and Landsat 8 Imagery on the North-East Qinghai–Tibet Plateau in the Qinghai Lake Basin. Nat. Hazards 2015, 79, 1753–1772. [Google Scholar] [CrossRef]
  53. Wang, H.; Li, X.; Xiao, J.; Ma, M. Evapotranspiration Components and Water Use Efficiency from Desert to Alpine Ecosystems in Drylands. Agric. For. Meteorol. 2021, 298–299, 108283. [Google Scholar] [CrossRef]
  54. Wang, H.; Li, X.; Ma, M.; Geng, L. Improving Estimation of Gross Primary Production in Dryland Ecosystems by a Model-Data Fusion Approach. Remote Sens. 2019, 11, 225. [Google Scholar] [CrossRef]
  55. Chen, T.; Tang, G.; Yuan, Y.; Guo, H.; Xu, Z.; Jiang, G.; Chen, X. Unraveling the Relative Impacts of Climate Change and Human Activities on Grassland Productivity in Central Asia over Last Three Decades. Sci. Total Environ. 2020, 743, 140649. [Google Scholar] [CrossRef]
Figure 1. Geographical distribution of key ecological restoration programs in Northern China. The upper panel (a) displays land cover types and the shaded area is the boundary of key ecological restoration programs; the lower panel (b) represents digital elevation data. Abbreviations: TNSP, Three-North Shelterbelt Program; APTM, Afforestation Program for Taihang Mountain; SPLR, Shelterbelt Program for Liaohe River; SPMRYR, Shelterbelt Program for Middle Reaches of Yellow River).
Remotesensing 16 03813 g001
Figure 2. Evaluation of the MODIS GPP product by using the flux tower measurements of four ChinaFLUX sites (unit: gC m−2d−1). The black dotted line and red solid line are the 1:1 and linear regressed lines, respectively.
Remotesensing 16 03813 g002
Figure 3. Interannual variations of annual average GPP (unit: gC m−2). The trends of GPP dynamics from 2001 to 2020 (green solid line), 2001 to 2011 (blue dotted line), and 2011 to 2020 (red dotted line) were plotted.
Remotesensing 16 03813 g003
Figure 4. Spatial distribution patterns of GPP in the ecological restoration programs in 2001 and 2020. (a) GPP in 2001; (b) GPP in 2020; (c) difference of GPP between 2020 and 2001; (d) annual averaged GPP.
Remotesensing 16 03813 g004
Figure 5. Trends in gross primary productivity (GPP) (a) and their statistical significance (b) across the region’s vegetation.
Remotesensing 16 03813 g005
Figure 6. Interannual trends of climate factors (solar radiation (a), precipitation (c), and temperature (e)) and partial correlation coefficients between these climate factors (solar radiation (b), precipitation (d), and temperature (f)) and annual GPP, with only statistically significant values (p < 0.05) shown.
Remotesensing 16 03813 g006
Figure 7. Interannual variation of annual average forest coverage percentage and annual average GPP and their correlation in the study area.
Remotesensing 16 03813 g007
Figure 8. Interannual trends of forest coverage percentage (a) and its partial correlation coefficients with annual GPP (b), with only statistically significant values (p < 0.05) shown.
Remotesensing 16 03813 g008
Figure 9. Contributions of climate factors and forest coverage changes to GPP trends in China (2001–2020): (a) solar radiation, (b) precipitation, (c) temperature, and (d) forest coverage changes.
Remotesensing 16 03813 g009
Figure 10. Distribution of dominant factors (PAR: solar radiation, Pre: precipitation, Tem: temperature, and Fcc: forest coverage changes) in GPP change of the region.
Remotesensing 16 03813 g010
Figure 11. The relative contributions of various factors to GPP changes in the four major ecological engineering regions. Abbreviations—PAR: solar radiation; Pre: precipitation; Tem: temperature; Fcc: forest coverage changes; TNSP, Three-North Shelterbelt Program; APTM, Afforestation Program for Taihang Mountain; SPLR, Shelterbelt Program for Liaohe River; SPMRYR, Shelterbelt Program for Middle Reaches of Yellow River.
Remotesensing 16 03813 g011
Table 1. Site descriptions of the eddy covariance flux observation network.
Site NameLon (°N)Lat (°E)Time PeriodsVegetation Type
Changbai mountain128.1042.402003–2010Forestland
Haibei shrubland101.3337.672003–2010Shrubland
Inner Mongolia116.4043.332004–2010Grassland
Haibei wetland101.3237.602004–2009Wetland
Table 2. Distribution of GPP (gC m−2) in the TNSP, APTM, SPLR, and SPMRYR regions for the years 2001, 2020, and multi-year average from 2001 to 2020 (“mean”). “2020–2001” represents the GPP differences between 2020 and 2001. Abbreviations: TNSP, Three-North Shelterbelt Program; APTM, Afforestation Program for Taihang Mountain; SPLR, Shelterbelt Program for Liaohe River; SPMRYR, Shelterbelt Program for Middle Reaches of Yellow River.
TNSPAPTMSPLRSPMRYRThe Entire Areas
Mean355.1642.3527.5552.3422.0
2001273.7459.7432.3349.1316.7
2020400.7766.0577.8677.5483.3
2020–2001127.0306.3145.5328.4166.6
Disclaimer/Publisher’s Note: The statements, opinions and data contained in all publications are solely those of the individual author(s) and contributor(s) and not of MDPI and/or the editor(s). MDPI and/or the editor(s) disclaim responsibility for any injury to people or property resulting from any ideas, methods, instructions or products referred to in the content.