Abstract
The samples from lunar farside have great significance for the study of the Moon, and even the solar system. Chang’e-6 landed successfully on the southern mare of the Apollo basin and returned ~2 kg of samples from lunar farside. To provide a better understanding for the background of the returned samples, we conducted detailed crater size-frequency distribution (CSFD) measurements in the Chang’e-6 landing region, the southern mare of the Apollo basin. The southern mare is divided into the western mare (W region) and the eastern mare (E region), and then subdivided into five subunits (W1, W2, W3, W4, W5) and three units (E1, E2, E3), respectively, according to the elevation, TiO2, and FeO abundances. Within the W2 and W5 region, more detailed subunits were separated out. The results show that the southern mare surface was active during two epochs, the Imbrian period and the Eratosthenian period. The basalt eruption lasted for ~1.7 Ga, from 3.28 Ga of the eastern mare to 1.54 Ga of the western mare. The W region is younger than the E region, while the three units of the E region have an age of ~3.2 Ga. The ages of the western mare basalts range from 2.98 Ga to 1.54 Ga, lasting for 1.4 Ga. It is worth noting that the age of the basalt at the Chang’e-6 sampling site is ~1.68 Ga, indicating the samples returned may include components with this very young age.
1. Introduction
Chang’e-6 is the first mission to return samples from the lunar farside, designed to land on the southern mare of the Apollo basin, northeast of the South Pole–Aitken (SPA) Basin (Figure 1) [1,2]. Chang’e-6 successfully landed on the lunar farside (153.978°W, 41.625°S) and returned ~2 kg (1935.3 g) samples, both scooped samples and a drilling core, on 25 June 2024 [3]. The samples returned by Chang’e-6 have significant scientific values since they are the first samples returned from the lunar farside and also the first samples from the South Pole-Aitken Basin (SPA). These samples may contribute to solving significant problems such as the genesis of the lunar dichotomy, the volcanic activity and thermal history of the lunar farside, and the formation time and processes of the SPA basin [4,5,6]. Except for the local basalts, Chang’e-6 may return exotic materials from outside the mare, including from the Chaffee S crater [1,6]. Similar to the Chang’e-5 landing site, the Chang’e-6 landing site consists of moderate-Ti basalts (4–6 wt.%) [5].
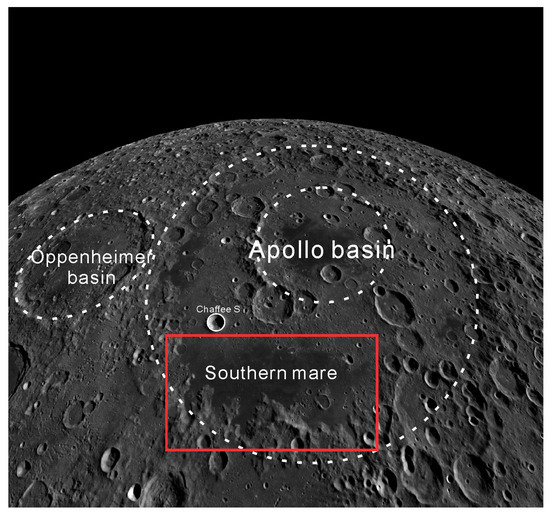
Figure 1.
Oblique view of the Apollo basin taken from QuickMap (https://quickmap.lroc.asu.edu/, accessed on 4 May 2024) based on the 100 m/pixel Lunar Reconnaissance Orbiter Camera (LROC) Wide Angle Camera (WAC) mosaic. The white dashed lines represent the basin rims. The southern mare of the Apollo basin is marked with a red rectangle. The crater marked with a white solid circle is the Chaffee S crater.
Determining the surface age of a region is an important step inunderstanding the geologic history of a planet. In general, there are three ways to obtain surface ages: (1) radioisotope ages of lunar samples or meteorites; however, the original location of the meteorites is generally unknown. (2) the absolute model age determined by crater size-frequency distribution (CSFD) measurements. (3) the absolute age estimated by degradation of simple crater morphology.
Crater morphology is an indicator of surface age. A huge amount of impactors have struck the lunar surface during its history. A fresh crater on the lunar surface is a relatively regular circle with a sharp rim and obvious ejecta rays [7]. As impactors continuously strike the lunar surface, their ejecta covers earlier impact craters, and the craters may overlap one another. Therefore, the impact crater morphology is changed. The crater rim is degraded, the inner part of the crater is filled by impact ejecta, and the regular circular shape may be lost by crater overlapping. Space weathering contributes to the disappearance of ejecta rays. Boyce and Dial [8] and Craddock and Howard [9] estimated the surface age by the degradation of simple craters. This method assumes a consistent erosion rate across the lunar surface. However, the erosion rates are different in different regions and for different crater sizes because of the complex geology of the lunar surface [10]. The incidence angle of image illumination and the image resolution may also affect the final results [10]. Therefore, the absolute age derived by degradation has a lot of uncertainties.
The radioisotope ages obtained from meteorites or samples returned from the lunar surface provide the most accurate results. Li et al. [11] concluded that the Chang’e-5 returned basalt has an age of 2030 ± 4 Ma by in situ Secondary Ion Mass Spectrometry (SIMS) Pb-Pb analysis, which has extended the known duration of lunar volcanism by more than 800 million years. By analyzing the 40Ar-39Ar of the impact-melting clasts in the meteorites, Cohen et al. [12] obtained the ages of different rocks ranging from 2.43 Ga~4.12 Ga, deepening our understanding about crystallization sequence of lunar rocks. However, lunar samples and meteorites are precious and difficult to obtain, and special minerals are required for the geochronology analysis. In addition, lunar meteorites may be contaminated on Earth, causing errors for the results of the isotope isochron dating analysis. It is hard to relate a meteorite age to a surface location since it is difficult to determine where the meteorite originated. CSFD measurements are one of the best choices to determine surface ages since the lunar samples are limited.
Understanding the ages of the basaltic terrain is the first step to make further analysis for the samples returned by Chang’e-6. Previous studies have dated the southern mare and obtained different results. According to the 1:5,000,000 scale geological map of the Apollo basin compiled by Ivanov et al. [13], the southern mare was classified into Late Imbrian-aged dark plains. Orgel et al. [4] agreed with Ivanov et al. [13] and classified the southern mare into Imbrian basaltic terrain. Haruyama et al. [14] considered the southern mare as a uniform mare unit and derived an age of 2.44 Ga. However, the eastern and western parts of the southern mare have different albedos and Ti/Fe abundances, indicating two dstinct units. Therefore, the results of Haruyama et al. [14] may represent the composite age of the two units. Pasckert et al. [15], Zeng et al. [2], and Qian et al. [5] divided the southern mare into two units (the western and eastern basaltic terrains, W and E regions). They obtained a similar age for the eastern part (3.45 Ga, [15]; 3.43 Ga, [2]; 3.34 Ga, [5]) but different ages for the W region. Pasckert et al. [15] and Qian et al. [5] believed that the basalts of the W region erupted shortly after those of the E region (3.31 Ga, [15]; 3.07 Ga, [5]). Zeng et al. [2] suggested that the western mare was ~1.0 billion years younger than the eastern mare. Yue et al. [6] obtained an age of 2.50 Ga for the western basaltic terrain.
Previous studies failed to reach an agreement on the ages of the W region. Besides, the variations in compositions may indicate basaltic terrains of different ages [16,17,18]. We observed the uneven composition of the southern mare, especially the W region, which may be connected with the different ages. Therefore, detailedCSFD measurements based on the detailed unit-divisions, which may help comprehensively understand the composition differences and ages of the southern mare, are needed.
In this study, we focus on the southern mare of the Apollo basin, the Chang’e-6 landing region, aiming to estimate the absolute model ages of the basaltic terrains. Firstly, we classified the southern mare into two units according to the TiO2 and FeO contents. Then, we divided these units into several subunits using the Digital Elevation Model (DEM) map. We counted the craters with a diameter over 100 m within each unit using Lunar Reconnaissance Orbiter (LRO) Narrow Angle Camera (NAC) images and analysed the population to get absolute model ages. Randomness analyses were applied to exclude poor-quality data and better constrain the results. Our results may provide further understanding of the Chang’e-6 landing site and its vicinity, such as the basalt evolution, giving a background geologic understanding for the experimental analysis of the Chang’e-6 samples.
2. Data and Methods
2.1. Data
A global mosaic created in June 2013 (https://astrogeology.usgs.gov/search/map/Moon/LRO/LROC_WAC/Lunar_LRO_LROC-WAC_Mosaic_global_100m_June2013, accessed on 4 October 2023) generated from the LROC WAC provides us with a global view with a spatial resolution of 100 m/pixel [19,20,21], used for geologic background analysis. A digital elevation model product (SLDEM2015) produced by merging the Lunar Orbiter Laser Altimeter (LOLA) data and Kaguya stereo-derived Terrain Camera (TC) DEM was used to analyze the topography of the southern mare [22]. The spatial resolution of the DEM product is ~59 m/pixel, and the vertical resolution is ~3–4 m. The TiO2 and FeO abundances were derived from datasets of the WAC reflectance mosaic and the Kaguya Multiband Imager (MI), respectively [23,24,25]. The spatial resolution of the TiO2 abundance map is ~400 m/pixel and that of the FeO abundance map is ~60 m/pixel. The details used to calculate the TiO2 and FeO contents can be found in Otake et al. [26] and Lemelin et al. [24], respectively.
LROC NAC images with resolution < 3 m were used as a basemap for crater mapping and measurements. Those high-resolution images were download from the Planetary Data System Geosciences Node (https://ode.rsl.wustl.edu/Moon/indexProductSearch.aspx, accessed on 4 March 2024). The details for generating the large-area DOM can be found in Di et al. [27].
We used Arcgis 10.6 to visualize and analyse the data used in this study.
2.2. Crater Size-Frequency Distribution Measurements
Estimating the absolute age of a planetary surface by analysing the crater density is an important technique for planetary geology [28]. The basic assumption of age dating based on the CSFD measurements is that the impact craters form independently and randomly and that the rate of the crater formation is much less than its destruction rate for larger craters [16]. Older regions have more and larger craters than the younger regions per unit area. Based on the CSFD and the absolute radioisotope ages from lunar samples, previous studies established quantitative relationships between crater density and the absolute radioisotope ages of the geologic units, which can be used to deduce the absolute model ages of other unsampled units [29,30].
Neukum [29] and Neukum et al. [30] employed a polynomial function to describe the relationship between the crater diameter (D) and cumulative frequency (Ncum), which is the production function. The equation is as follows:
where is the fit parameter (Table 1) [29]. The production function is a simple curve on a log Ncum vs. log D plot.

Table 1.
The values of the fit parameters in the production function.
Using the integrated LROC NAC images as the basemap, mapping the craters was done on the ArcGIS platform. The CraterTools was employed to manually map the craters since it is easy to locate the crater and measure the diameter [31]. A crater can be localized with three points on the crater rim. The property list generated by ArcGIS records the information about the longitude, the latitude, and the diameter of the crater. With this information, fitting the absolute model ages (AMAs) via Poisson timing analysis and randomness analysis with 3000 iterations is carried out with the program Craterstats [32,33,34]. CraterTools and Craterstats are available at http://hrscview.fu-berlin.de/software.html, accessed on 4 May 2024. Production function and chronology function by Neukum [29] were employed. The regions containing secondary craters (crater chains and crater clusters), residual basin floor, and wrinkle ridges/orthomorphies as well as the regions possibly affected by the basin rims are excluded. We used the differential plots of crater density to find an absolute model age. With the differential data presentation, we can better understand the partial resurfacing events.
3. Results
When the counting area is a uniform unit, the absolute model ages derived from the CSFD measurements are reasonable. For the southern mare of the Chang’e-6 landing region, it is obvious that the E and W regions have different albedos. According to the elevation, the titanium, and iron abundances, we divided the southern mare into two units and several subunits. Based on those units, we made CSFD measurements and obtained ages for each.
3.1. Mare Units
The southern mare is the largest mare terrain (~9329 km2) of the Apollo basin, located in the southern part [5]. The southern mare is relatively flat with an average slope of <8° [2]. The most obvious topography feature is the wrinkle ridge between the E and W region (Figure 2). Besides, another wrinkle ridge can be seen within the W region. Obvious crater clusters can be seen from the WAC mosaic, which are oriented north-south or northeast-southwest (Figure 2a). On the north part of the southern mare, some kipukas, residuals of the basin floor, are recognized and excluded from the crater count area.
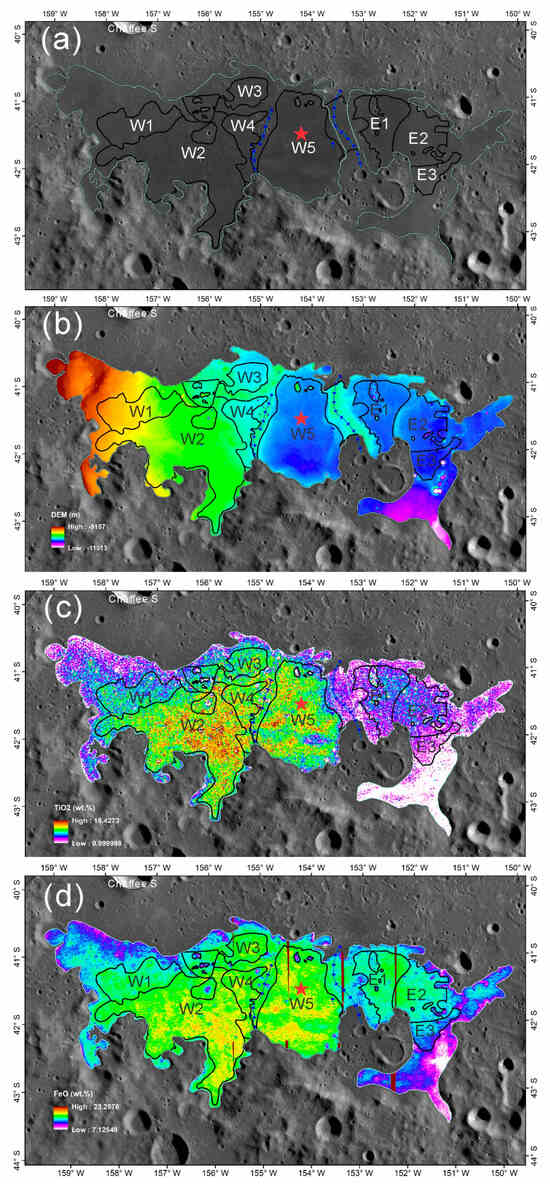
Figure 2.
The units of the southern mare. (a) WAC image (100 m/pixel, [19]). (b) SLDEM2015 (~59 m/pixel, [22]). (c) TiO2 abundance map derived from the WAC reflectance mosaics (~400 m/pixel, [23,26]). (d) Kaguya MI FeO map (~60 m/pixel, [24]). The black lines represent the boundary of each unit. The blue lines with diamonds represent the wrinkle ridges. The red star represents the landing site of the Chang’e-6. (b–d) are maps overlaid on the LROC WAC images.
The CSFD measurements require a unit of uniform formation age [34]. Therefore, subdivision of the basaltic terrain according to criteria which may differentiate them, including composition, is of great significance. TiO2 content is usually used as the primary division to divide the mare basalts (very low-Ti or VLT, low-Ti, and high-Ti). High-Ti basalt has a TiO2 content over 6 wt.%, and low-Ti basalt ranges from 1 wt.%–6 wt.%, while very low-Ti basalt is less than 1 wt.% [35]. TiO2 and FeO abundances are two important parametersto divide the mare basalts. Furthermore, topography may also influence the lava flows, with topographic obstacles potentially blocking later flows. In this study, we used the titanium and iron contents and elevation as three main indicators to divide the basaltic terrain in the Chang’e-6 landing region..
Qian et al. [5] divided the southern mare into two units (western basaltic terrain and eastern basaltic terrain) since the albedo, Ti, and Fe contents are different. There is an obvious and wide wrinkle ridge between the E region and the W region (Figure 2b). The E region is relatively flat. The maximum difference of the elevation is 1274 m, with a maximum, minimum, and average elevation of −10,243 m, −11,517 m, and −10,537 m, respectively. The E region has a lower abundance of TiO2, with an average value of 2.72 wt.%. For the W region, the elevation gradually decreases from west to east (Figure 2b). The average elevation of the W region is −10,248 m. The average TiO2 content of the W region is 5.38 wt.%, with a maximum and minimum content of 15.4 wt.% and 1.0 wt.%, respectively (Table 2). The TiO2 content is positively correlated with the FeO content (Figure 3).

Table 2.
The average, minimum, and maximum values of the elevation, TiO2, and FeO abundances of different units.
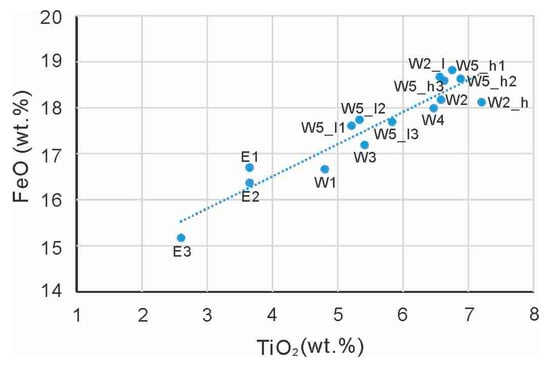
Figure 3.
Correlation of FeO with TiO2.
To obtain a better understanding of the basalt formation sequence, we further divided the basaltic terrains according to elevation, topographic barriers, and TiO2 and FeO contents. As for the E region, the boundary between E1 and E2 is a wrinkle ridge, and E2 and E3 are divided by the elevation, TiO2, and FeO contents. As the E3 is close to the basin rim, where mixing with materials from the basin rim may occur, the parts close to the basin rim have lower contents of titanium and iron. The W region may be affected by the ejecta from Chaffee S crater (Figure 2c,d). The northwestern part of the W region has lower Ti and Fe contents than the eastern part. We then divided the W region into five units (W1, W2, W3, W4, and W5) and the E region into three units (E1, E2, and E3) (Figure 2). The boundary between W1 and W3 is consistent with the crater ejecta from the Chaffee S crater. Some basin floor remnants of the Apollo basin seem to appear within the boundary of the W2 and W3 unit. The W4 and W5 regions are separated by a topographic barrier, which appears to be a wrinkle ridge. Table 2 shows the maximum, minimum, and average content of Ti and Fe content and the elevation of the five units of the W region. Although the unit boundaries are constrained by the three indicators, there is still inconsistency within a single unit (W2 and W5). Within W2, the part close to the boundary between W1 and W2 may be slightly affected by the ejecta, causing a lower Ti and Fe content. We then divided the W2 unit according to the relative contents of the TiO2 and FeO. The W2 unit was then divided into W2_l and W2_h, representing the region that has lower or higher Ti and/or Fe content. The higher Ti/Fe subunit may represent the relatively pure local basaltic terrain. Therefore, the CSFD results of the W2_h may represent the absolute age of the local mare. The situation is more complex within the W5 unit. An obvious albedo anomaly can be seen from the WAC image (Figure 2a and Figure 3a). The regions with lower albedo seem like distal radial ejecta. They have lower Ti and Fe abundances compared with the dark mare. Similar to the W2 unit, the W5 unit was divided into lower Ti/Fe subunits (W5_l1, W5_l2, and W5_l3) and higher Ti/Fe subunits (W5_h1, W5_h2, and W5_h3) (Figure 4). By more precise unit divisions, we can better constrain and understand the results.
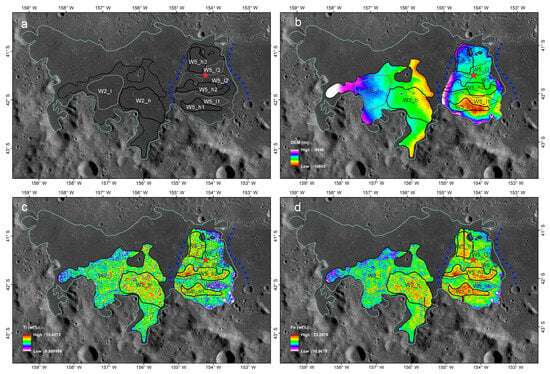
Figure 4.
The subunits within the W2 and W5 region. (a) WAC image (100 m/pixel, [19]). (b) SLDEM2015 (~59 m/pixel, [22]). (c) TiO2 abundance map derived from the WAC reflectance mosaics (~400 m/pixel, [23,26]). (d) Kaguya MI FeO map (~60 m/pixel, [24]). (b–d) are maps overlaid on the LROC WAC images. The black solid lines are the boundaries of the mare basalt with higher Ti and Fe contents, while the gray solid lines represent the lower Ti/Fe mare basalt. The blue lines with diamonds are wrinkle ridges. The red star represents the Chang’e-6 landing site.
3.2. CSFD Results
Chang’e-6 landed on the southern mare of the Apollo basin and returned ~2 kg samples from the lunar farside for the first time [6]. The ages play a crucial role in understanding the geologic background of the landing site. Based on the units divided by several factors (elevation, topographic barriers, and Ti and Fe contents), we conducted CSFD measurements to better constrain the absolute model ages. Areas with obvious secondary craters, basin floor remnants, and wrinkle ridges were excluded. It is obvious that the southern mare has at least two epochs of mare basalt emplacement (Figure 2). The E region of the southern mare is older than the W region. The E region has low-Ti basalt, while the W region has low-high Ti mare basalt (Table 2). We counted the craters in each unit and subunit of the E and W regions and made Poisson timing analyses and randomness analyses for them (Figure 5). The results are shown in Table 3.
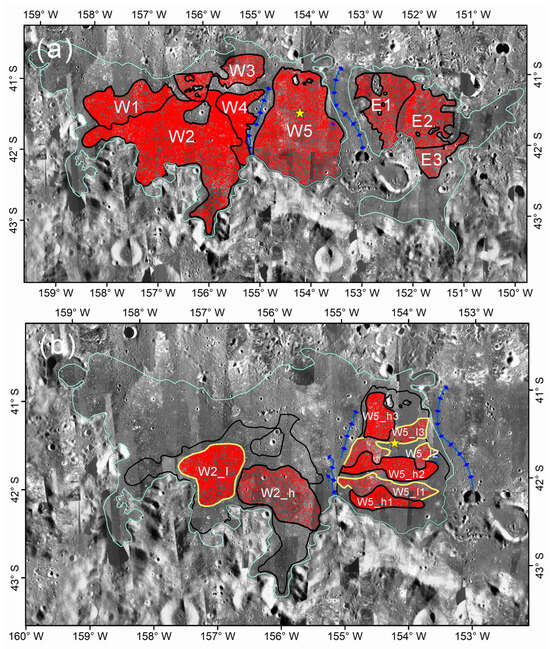
Figure 5.
Boundaries of the units and counted craters outlined in red. (a) The counted craters of the units within the W and E region. (b) The counted craters of the subunits within the W2 and W5 region. The blue lines with diamonds represent the wrinkle ridges. The yellow star represents the landing site of Chang’e-6.

Table 3.
The results of the CSFD measurements of different units.
As for the E region, the units are of the Imbrian period, with a similar age of ~3.2 Ga (E1 of Ga, E2 of Ga, and E3 of Ga) (Figure 6). The W region has a complex age assemblage with an age range of ~0.9 Ga, an oldest model age of Ga, and a youngest age of Ga. W1, W3, and W4 have ages of Ga, Ga, Ga (Figure 7a,e,f). W2 has two absolute model ages. One is Ga and the other is Ga (Figure 7b). When the lava flow is too thin to cover the older craters, a second older age of the underlying layer can be obtained in the crater counts [16]. That means the older age indicates another epoch/lava flow. The W2 region was divided into W2_ h and W2_ l since W2_ h has higher Fe and Ti abundances (Figure 4c,d). W2_ h has a relatively younger age of Ga and an older age of Ga, which may indicate two mare basalt epochs (Figure 7c). We used the younger age as the age of the W2_h unit. The older age may indicate the underlying basaltic terrain. W2_l is Ga. Since the W5 region has an albedo anomaly and Ti/Fe abundance differences, it was divided into three relatively higher Ti/Fe mare basalt units (W5_h1, W5_h2, and W5_h3) and three lower Ti/Fe basalt units (W5_l1, W5_l2, and W5_l3) (Figure 4). For the relatively higher Ti/Fe subunits, we obtained an age of ~1.68 Ga. The three W5_h subunits are quite consistent with one another. For three W5_l subunits, W5_l1 has an age of Ga, W5_l2 of Ga, and W5_l3 of Ga (Figure 8). They are all of the Eratosthenian period.
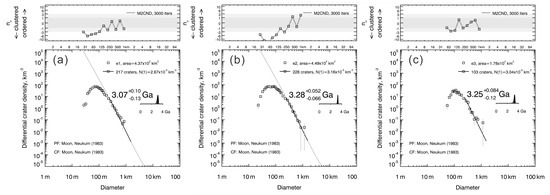
Figure 6.
Ages of the E region. (a–c) Ages of the E1, E2, and E3 units.

Figure 7.
Ages of the W region. (a,b,e,f) Ages of the W1, W2, W3, and E4 units. (c,d) Ages of the W2_h and W2_l subunits.
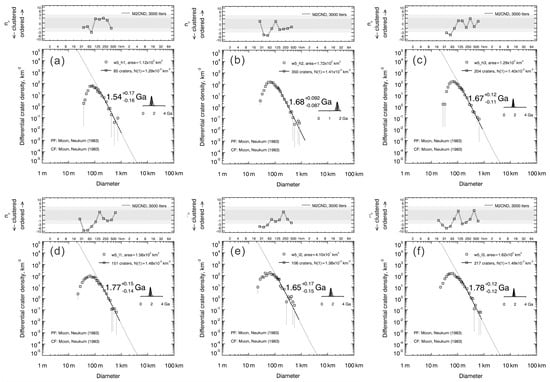
Figure 8.
Ages of the subunits within the W5 region. (a–c) Ages of the W5_h1, W5_h2, and W5_h3 subunits. (d–f) Ages of the W5_l1, W5_l2, and W5_l3 subunits.
The results of the absolute model ages are shown in Figure 6, Figure 7 and Figure 8. The E region has an age of ~3.2 Ga, of the late Imbrian period, while the W region is of the Eratosthenian period. The ages of the W region show a wide range, indicating that the mare basalt evolution is complex and that the underlying crater might emerge at the top. The W4 unit has the oldest age of the W region, ~3.0 Ga. The W5 unit has the youngest absolute model ages of ~1.6–1.7 Ga. Figure 9 shows that the units with lower Ti/Fe abundances are older than those with higher Ti/Fe abundances.
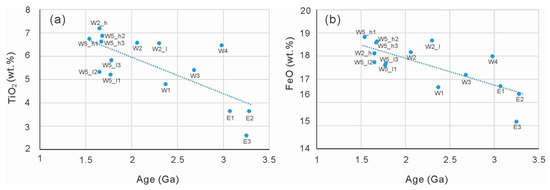
Figure 9.
The relationships between age and TiO2 and FeO abundances. (a) TiO2 vs. Age. (b) FeO vs. Age.
4. Discussion
4.1. Evolution of the Southern Mare
The duration of lunar volcanism reflects the thermal states inside the Moon and has been an open question for many years [36]. By investigating the ages of the mare basalts on the lunar nearside, Hiesinger et al. [16] found that lunar volcanism might start at ~3.9–4.0 Ga and cease at ~1.5–2.0 Ga. The samples returned from Apollo missions have indicated a peak of the volcanic activities at ~3.6–3.9 Ga [37,38]. Guo et al. [39] suggested that the Paleolunarisian era (4.22–3.16 Ga, including Aitkenian, Nectarian, and Imbrian) was dominated by both endogenic and exogenic processes. During the Paleolunarisian era, large impacts generated basins such as the SPA and the Apollo basin, and the Moon was active enough to generate large-scale lava flows. After the Paleolunarisian era, exogenic processes dominated the morphology of the lunar surface and the volcanic activities decreased significantly [39]. During the Eratosthenian period (3.16–0.8 Ga), only small-scale mare basalts erupted [5,14,15,39,40]. The samples returned from Chang’e-5 have an age of ~2.0 Ga [11], indicating that the Moon was still volcanically active at around 2.0 Ga.
SPA is the oldest, largest, and deepest impact basin on the Moon, which may have excavated materials from the lower lunar crust and even the upper mantle [6,41,42,43,44]. Outside the melt pool, the ejecta of SPA can be as thick as 30 km [44]. After then, a giant impact on the northeast of the SPA basin removed the SPA ejecta and formed the largest basin within the SPA, the Apollo basin [13,16,42,45]. The impacts forming the SPA and the Apollo basin thinned the lunar crust in their areas but increased its thickness by adding ejecta in the surroundings. Wieczorek et al. [46] modeled the crustal thickness of the Moon from GRAIL data and found that the Apollo basin has the lowest crustal thickness within SPA at <5 km. Fractures are the paths for basalt eruption, and they form more easily in the thinner crust. Six mare terrains have been identified within the Apollo basin [5]. The fractures formed by the impacts may be the transportation paths for the rising magma.
The southern mare occurs in the south of the Apollo basin, between the inner ring and the outer ring (Figure 1). The lunar volcanism of the southern mare was active for at least 1.6 Ga and showed a pattern of multiple eruptions. The southern mare can be divided into two units (E and W regions) by albedo, Ti, and Fe abundances [2,5]. The E region of the southern mare, with lower albedo and Ti and Fe abundances (average Ti abundance: 2.72 wt.%, average Fe abundance: 15.28 wt.%), is older than the W region (Table 2). The E region is of the Imbrian period (~3.2 Ga) and has low-Ti mare basalts, while the W region is of the Eratosthenian period (3.0–1.6 Ga) and has high-low mare basalts (Figure 2 and Figure 9). The Imbrian-aged low-Ti mare basalt erupted at ~3.2 Ga and covered the eastern part, forming a wrinkle ridge, which has become a topographic barrier to separate the western lava flows (Figure 2). It is likely to have older lava flows under the surface layers. An age of 3.57 Ga was obtained within the W2_h subunit, indicating the Imbrian-aged low-Ti lava may extend to the west (Figure 10). The ~3.2 Ga eruptive epoch (E region) may create more paths for other basalt lavas; that is, the rising magma produced fractures. The basalt eruptions are more complicated in the W region. Shortly after the Imbrian-aged low-Ti mare basalt eruption, the earliest Eratosthenian-aged (~2.98 Ga) high-Ti mare basalt (W4) erupted on the middle of the W region and opened the prelude to the eruption of basalts in the W region. The W4 high-Ti lava flow contracted and formed a wrinkle ridge (Figure 11). Immediately after the eruption of the W4 high-Ti mare basalt, another low-Ti mare basalt (W3) erupted at ~2.68 Ga and the difference of the Ti abundance is ~1.00 wt.%. Another low-Ti mare basalt (W1 and W2) erupted on the northeastern side of the W region and flowed to the east. The volume of the eruption was not large, and only a thin layer of low-Ti basalt covered the Apollo basin floor [43]. It is worth noting that the W1 and W2 low-Ti basalt is close to the Chaffee S crater, indicating that the basalt may be contaminated or covered by ejecta from the Chaffee S crater. We divided the W2 region into W2_l and W2_h subunits and found that the W2_h subunit is younger than the W2_l subunit, suggesting another lava flow erupted at ~1.65 Ga.
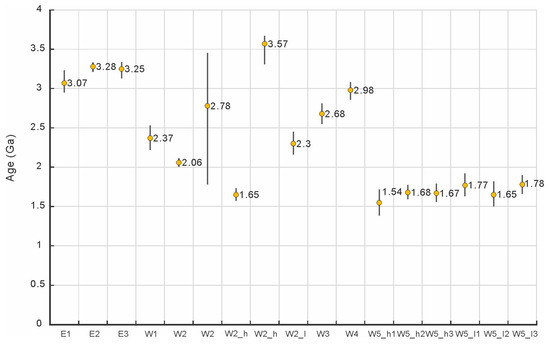
Figure 10.
Age relationships of different units.
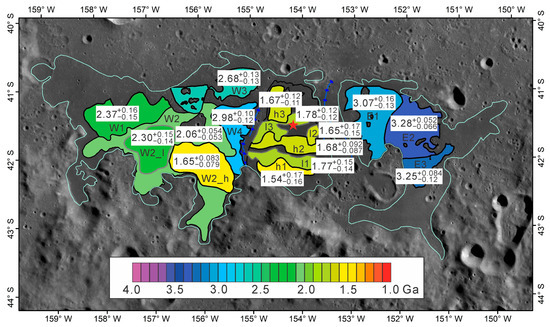
Figure 11.
Absolute model ages of different units. The blue lines with diamonds represent the wrinkle ridges. The red star represents the Chang’e-6 landing site.
Previous studies of Chang’e-5 samples believed that the medium-high Ti basalts in those samples evolved from low-Ti basalts [47,48,49]. Compared to the background of the Chang’e-5 landing site, the southern mare also has high-Ti basalts in the W region and low-Ti basalts in the E region. The units with lower Ti/Fe abundances are older than those with higher Ti/Fe abundances (Figure 9). Thus, the high-Ti mare basalts of the southern mare may also evolve from the low-Ti basalts; that is, those basalts may have the same magma source. The low-Ti basalts erupted first, and then the high-Ti basalts erupted.
The volcanic activity of the southern mare ceased at around 1.6 Ga (Figure 10 and Figure 11). The basaltic terrains of the W5 unit—where Chang’e 6 landed—have the youngest ages. The W5 unit was divided into W5_h (high-Ti mare basalt) and W5_l (low-Ti mare basalt) subunits (Table 2). All these subunits have a similar age of ~1.70 Ga although the W5_l subunits seem to be a bit older than the W5_h subunits (Figure 9 and Figure 10), indicating that the high-Ti mare basalts may evolve from the low-Ti basalts.
4.2. The Genesis of the Low-Ti Mare Basalt of the W5 Unit
Within the W5 unit, both high-Ti mare basalts and basalts with low Ti signature can be observed. The low-Ti subunits (W5_l1, W5_l2, and W5_l3) of the W5 unit appear as stripess/belt, with an E-W orientation (Figure 4). They look ejecta-like, but could also be mare flows. Orgel et al. [4] made a detailed geologic map of the southern mare and classified the low-Ti region as the Pre-Nectarian/Nectarian hummocky basin material unit, which represented the impact melt of basin formation. However, the low-Ti belts have no obvious elevated height, unlike those in the northern part of the W region. The basin remnants that appear at the north of the southern mare are isolated. Next to the E region, the basin remnants seem to have more craters. However, those low-Ti belts do not have those characteristics.
As for the genesis of the low-Ti subunits, we propose three possible explanations: (1) Ejecta. The high-Ti basalts might be covered by a discontinuous ejecta and then appear like low-Ti basalts from spectral images. The belt-like distribution and the higher albedo are the evidence. The discontinuous ejecta is contrasted to the continuous blanket, which concentrates near the crater rim and covers the preexisting terrain [50]. Discontinuous ejecta lies beyond a distance of four times of the crater radius and is radial with a higher albedo. When making crater counts, Zeng et al. [2] and Yue et al. [6] excluded those areas with a higher albedo. However, although other units of the W region are older than the W5 unit, no such ejecta has been found there. (2) Low-Ti mare basaltic terrains. W5_l subunits were slightly older than the W5_h subunits, indicating that the ejecta covered the W5_l subunits shortly after the high-Ti basalt formed. It is also possible that the W5_l subunits are low-Ti basaltic terrains, which have different or the same magma sources as the high-Ti basalts. The rising magma produced fractures, which acted as transportation paths for the lavas of the W5 region. The lava flows from different magma sources erupted and formed the low-Ti and high-Ti mare basalts. Basalts of different Ti abundances can also erupt from the same magma source. Similar to the Chang’e-5 landing region, the high-Ti basalts of the southern mare may evolve from the low-Ti basalts [47,48,49]. (3) Lunar swirls. Lunar swirls generally have higher albedos compared with the local mare basalts and co-locate with the crustal magnetic anomalies [51]. Swirls have different shapes, varying between diffuse patches and sinuous belts [52]. The magnetic anomaly can influence the spectral features by affecting space weathering. Therefore, it can influence the composition of the material of the top surface. The W5_l subunits are sinuous and have higher albedos, which are similar to magnetic swirls. However, the resolution of the instruments to detect the magnetic anomalies cannot detect the high-reflectance belts on the W5 region (~28 km) [53]. Further experimental analysis of the Chang’e-6 samples is needed to check these hypotheses.
In this study, we suggest that the low-Ti subunits are low-Ti basaltic terrains. The rising magma may produce fractures, which are the transportation paths for younger basalt eruptions. Small amounts of Eratosthenian basalt lavas are proven by the returned samples of Chang’e-5, a young volcanic eruption of ~2.0 Ga [11]. The ~1.7 Ga basaltic terrains of the southern mare could also be possible.
Further investigations and analysis, especially the sample analysis, are necessary to test these hypotheses.
5. Conclusions
We conducted detailed CSFD measurements on the southern mare to better understand the surroundings of the Chang’e-6 landing site. The southern mare of the Apollo basin has a long and continuously active volcanic history (~1.7 Ga), from 3.28 Ga to 1.54 Ga. Two main eruption epochs are identified, one of the Imbrian period and the other of the Eratosthenian period. The first episode of the low-Ti mare basalt eruption happened in the Imbrian period (3.0–3.2 Ga), on the eastern part. The W region experienced enduring basalt eruptions, from 2.98 Ga to 1.65 Ga. The low-Ti basaltic terrains on the northwest of the W region may be affected by the Chaffee S crater. The high-Ti basaltic terrains generally have a younger age, ~1.65 Ga, mainly distributed within the W2 and W5 region. The basaltic terrains of the W5 region have an age of ~1.7 Ga. The basaltic terrain of the Chang’e-6 landing site has an age of ~1.68 Ga, which means that the samples returned may include components with this very young age.
Author Contributions
Conceptualization, L.Z., G.M. and J.L.; Methodology, L.Z., J.L. and G.M.; Software, G.M. and C.W.; Validation, L.Z., G.M. and P.G.; Formal Analysis, L.Z.; Investigation, X.K.; Resources, J.L. and K.D.; Data Curation, G.M.; Writing—Original Draft Preparation, L.Z.; Writing—Review and Editing, G.M. and J.L.; Visualization, L.Z.; Supervision, J.L. and G.M.; Project Administration, J.L., P.G. and X.K.; Funding Acquisition, J.L. and K.Z. L.Z. and J.L. contributed equally to this paper. All authors have read and agreed to the published version of the manuscript.
Funding
This research was funded by the National Key Research and Development Program of China (Grant No. 2022YFF0503100); the National Natural Science Foundation of China (Grant No. 42202264); the Guizhou Provincial Science and Technology Projects (Grant No. QKHJC-ZK(2023)-478 and No. QKHZDZX-(2024)-016); the Key Research Program of the Chinese Academy of Sciences (Grant No. KGFZD-145-23-15); the Compilation of Chinese Regional Geological Chronicles and Series of Maps (Grant No. DD20221645).
Data Availability Statement
Optical image data from LROC WAC and DEM data from LROC and SELENE used in this study can be downloaded from the website of the United States Geological Survey at https://astrogeology.usgs.gov/search/map/Moon/LRO/LROC_WAC/Lunar_LRO_LROC-WAC_Mosaic_global_100m_June2013 (accessed on 4 October 2023). LROC NAC images with a resolution < 3 m were download from the PDS Geosciences Node (https://ode.rsl.wustl.edu/Moon/indexProductSearch.aspx, accessed on 4 March 2024).
Acknowledgments
We would like to thank and acknowledge the reviewers for their thoughtful comments that helped to significantly improve our manuscript. We are grateful for the discussion with Jingwen Liu, whose suggestions were very helpful for our research.
Conflicts of Interest
The authors declare no conflicts of interest.
References
- Jia, Z.; Chen, J.; Kong, J.Q.; Qiao, L.; Fu, X.; Ling, Z. Geologic context of Chang’e-6 candidate landing regions and potential non-mare materials in the returned samples. Icarus 2024, 416, 116107. [Google Scholar] [CrossRef]
- Zeng, X.; Liu, D.; Chen, Y.; Zhou, Q.; Ren, X.; Zhang, Z.; Yan, W.; Chen, W.; Wang, Q.; Deng, X.; et al. Landing site of the Chang’e-6 lunar farside sample return mission from the Apollo basin. Nat. Astron. 2023, 7, 1188–1197. [Google Scholar] [CrossRef]
- Liu, Z.; Peng, M.; Di, K.; Wan, W.; Liu, B.; Wang, Y.; Xie, B.; Kou, Y.; Wang, B.; Zhao, C.; et al. High-Precision Visual Localization of the Chang’e-6 Lander. Natl. Remote Sens. Bull. 2024, 28, 1649–1656. [Google Scholar] [CrossRef]
- Orgel, C.; Torres, I.; Besse, S.; van der Bogert, C.H.; Bahia, R.; Prissang, R.; Ivanov, M.A.; Hiesinger, H.; Michael, G.; Pasckert, J.H.; et al. Characterization of High-priority Landing Sites for Robotic Exploration Missions in the Apollo Basin, Moon. Planet. Sci. J. 2024, 5, 29. [Google Scholar] [CrossRef]
- Qian, Y.; Head, J.; Michalski, J.; Wang, X.; van der Bogert, C.H.; Hiesinger, H.; Sun, L.; Yang, W.; Xiao, L.; Li, X.; et al. Long-lasting farside volcanism in the Apollo basin: Chang’e-6 landing site. Earth Planet. Sci. Lett. 2024, 637, 118737. [Google Scholar] [CrossRef]
- Yue, Z.; Gou, S.; Sun, S.; Yang, W.; Chen, Y.; Wang, Y.; Lin, H.; Di, K.; Lin, Y.; Li, X.; et al. Geological context of Chang’e-6 landing area and implications for sample analysis. Innovation 2024, 5, 100663. [Google Scholar] [CrossRef]
- Henrik, H.; Kereszturi, Á. (Eds.) Encyclopedia of Planetary Landforms; Springer: New York, NY, USA, 2015; pp. 2389–2390. [Google Scholar]
- Boyce, J.M. Relative ages of flow units in the Mare Imbrium and Sinus Imbrium. In Lunar Science Conference, 6th, Houston, Tex., 17–21 March 1975, Proceedings; Merrill, R.B., Ed.; Pergamon Press: Houston, TX, USA, 1975; pp. 2585–2595. [Google Scholar]
- Craddock, R.A.; Howard, A.D. Simulated degradation of lunar impact craters and a new method for age dating farside mare deposits. J. Geophys. Res. 2000, 105, 20387–20401. [Google Scholar] [CrossRef]
- Xiao, Z.Y.; Robert, G.S.; Zeng, Z.X. Mistakes in using crater size-frequency distribution to estimate planetary surface ages. Earth Sci. 2013, 38, 145–160. [Google Scholar]
- Li, Q.; Zhou, Q.; Liu, Y.; Xiao, Z.; Lin, Y.; Li, J.; Ma, H.; Tang, G.; Guo, S.; Tang, X.; et al. Two-billion-year-old volcanism on the Moon from Chang’E-5 basalts. Nature 2021, 600, 54–58. [Google Scholar] [CrossRef]
- Cohen, B.A. Argon-40-Argon-39 geochronology of lunar meteorites impact melt clasts. Meteor. Planet. Sci. 2000, 35, A43. [Google Scholar]
- Ivanov, M.A.; Hiesinger, H.; van der Bogert, C.H.; Orgel, C.; Pasckert, J.H.; Head, J.W. Geologic history of the northern portion of the South Pole-Aitken basin on the Moon. J. Geophys. Res. Planets 2018, 123, 2585–2612. [Google Scholar] [CrossRef]
- Haruyama, J.; Ohtake, M.; Matsunaga, T.; Morota, T.; Honda, C.; Yokota, Y.; Abe, M.; Ogawa, Y.; Miyamoto, H.; Iwasaki, A.; et al. Long-lived volcanism on the lunar farside revealed by SELENE Terrain Camera. Science 2009, 323, 905–908. [Google Scholar] [CrossRef] [PubMed]
- Pasckert, J.H.; Hiesinger, H.; van der Bogert, C.H. Lunar farside volcanism in and around the South Pole–Aitken basin. Icarus 2018, 299, 538–562. [Google Scholar] [CrossRef]
- Hiesinger, H.; Jaumann, R.; Neukum, G.; Head, J.W. Ages of mare basalts on the lunar nearside. J. Geophys. Res. 2000, 105, 29239–29275. [Google Scholar] [CrossRef]
- Pieters, C.M.; Head, J.W.; Adams, J.B.; McCord, T.B.; Zisk, S.H.; Whitford-Stark, J.L. Late high-titanium basalts of the western maria: Geology of the Flamsteed region of Oceanus Procellarum. J. Geophys. Res. 1980, 85, 3913–3938. [Google Scholar] [CrossRef]
- Soderblom, L.A.; Arnold, J.R.; Boyce, J.M.; Lin, R.P. Regional variations in the lunar mafia: Age, remanent magnetism, and chemistry. In Proceedings of the 8th Lunar & Planetary Science Conference, Houston, TX, USA, 14–18 March 1977; pp. 1191–1199. [Google Scholar]
- Robinson, M.S.; Brylow, S.M.; Tschimmel, M.; Humm, D.; Lawrence, S.J.; Thomas, P.C.; Denevi, B.W.; Bowman-Cisneros, E.; Zerr, J.; Ravine, M.A.; et al. Lunar reconnaissance orbiter camera (LROC) instrument overview. Space. Sci. Rev. 2010, 150, 81–124. [Google Scholar] [CrossRef]
- Speyerer, E.; Robinson, M.; Denevi, B. Lunar Reconnaissance Orbiter Camera global morphological map of the Moon. In Proceedings of the 42th Lunar & Planetary Science Conference, Houston, TX, USA, 7–11 March 2011; p. 2387. [Google Scholar]
- Wagner, R.V.; Speyerer, E.J.; Robinson, M.S. New Mosaicked Data Products from the LROC Team. In Proceedings of the 46th Lunar & Planetary Science Conference, Houston, TX, USA, 16–20 March 2015; p. 1473. [Google Scholar]
- Barker, M.K.; Mazarico, E.; Neumann, G.A.; Zuber, M.T.; Haruyama, J.; Smith, D.E. A new lunar digital elevation model from the Lunar Orbiter Laser Altimeter and SELENE Terrain Camera. Icarus 2016, 273, 346–355. [Google Scholar] [CrossRef]
- Haruyama, J.; Matsunaga, T.; Ohtake, M.; Morota, T.; Honda, C.; Yokota, Y.; Torii, M.; Ogawa, Y.; LISM Working Group. Global lunar-surface mapping experiment using the Lunar Imager/ Spectrometer on SELENE. Earth Planets Space 2008, 60, 243–255. [Google Scholar] [CrossRef]
- Lemelin, M.; Lucey, P.G.; Song, E.; Taylor, G.J. Lunar central peak mineralogy and iron content using the Kaguya Multiband Imager: Reassessment of the compositional structure of the lunar crust. J. Geophys. Res. Planets 2015, 120, 869–887. [Google Scholar] [CrossRef]
- Sato, H.; Robinson, M.S.; Lawrence, S.J.; Denevi, B.W.; Hapke, B.; Jolliff, B.L.; Hiesinger, H. Lunar mare TiO2 abundances estimated from UV/VIS reflectance. Icarus 2017, 296, 216–238. [Google Scholar] [CrossRef]
- Ohtake, M.; Takeda, H.; Matsunaga, T.; Yokota, Y.; Haruyama, J.; Morota, T.; Yamamoto, S.; Ogawa, Y.; Hiroi, T.; Karouji, Y.; et al. Asymmetric crustal growth on the Moon indicated by primitive farside highland materials. Nat. Geosci. 2012, 5, 384. [Google Scholar] [CrossRef]
- Di, K.; Jia, M.; Xin, X.; Wang, J.; Liu, B.; Li, J.; Xie, J.; Liu, Z.; Peng, M.; Yue, Z.; et al. High-resolution large-area digital orthophoto map generation using LROC NAC images. Photogramm. Eng. Remote. Sens. 2019, 85, 481–491. [Google Scholar] [CrossRef]
- Arvidson, R.E.; Boyce, J. Standard techniques for presentation and analysis of crater size-frequency data. Icarus 1979, 37, 467–474. [Google Scholar]
- Neukum, G. Meteoriten Bombardement und Datierung Planetarer Oberflachen; Maximilians University: Munich, Germany, 1983. [Google Scholar]
- Neukum, G.; Ivanov, B.A.; Hartmann, W.K. Cratering records in the inner solar system in relation to the lunar reference system. In Chronology and Evolution of Mars; Kallenbach, R., Geiss, J., Hartmann, W.K., Eds.; Springer: Dordrecht, The Netherlands, 2001; pp. 55–86. [Google Scholar]
- Kneissl, T.; van Gasselt, S.; Neukum, G. Map-projection-independent crater size-frequency determination in GIS environments—New software tool for ArcGIS. Planet. Space Sci. 2011, 59, 1243–1254. [Google Scholar] [CrossRef]
- Michael, G.G.; Platz, T.; Kneissl, T.; Schmedemann, N. Planetary surface dating from crater size-frequency distribution measurements: Spatial randomness and clustering. Icarus 2012, 218, 169–177. [Google Scholar] [CrossRef]
- Michael, G.G.; Kneissl, T.; Neesemann, A. Planetary surface dating from crater size-frequency distribution measurements: Poisson timing analysis. Icarus 2016, 277, 279–285. [Google Scholar] [CrossRef]
- Michael, G.G.; Neukum, G. Planetary surface dating from crater size-frequency distribution measurements: Partial resurfacing events and statistical age uncertainty. Earth Planet. Sci. Lett. 2010, 294, 223–229. [Google Scholar] [CrossRef]
- Neal, C.R.; Taylor, L.A. Petrogenesis of mare basalts: A record of lunar volcanism. Geochim. Cosmochim. Acta 1992, 56, 2177–2211. [Google Scholar] [CrossRef]
- Head, J.W.; Wilson, L.; Hiesinger, H.; van der Bogert, C.; Chen, Y.; Dickson, J.L.; Gaddis, L.R.; Haruyama, J.; Jawin, E.R.; Jozwiak, L.M.; et al. Lunar mare basaltic volcanism: Volcanic features and emplacement processes. Rev. Miner. Geochem. 2023, 89, 453–507. [Google Scholar] [CrossRef]
- Nyquist, L.E.; Shih, C. The isotopic record of lunar volcanism. Geochim. Cosmochim. Acta 1992, 56, 2213–2234. [Google Scholar] [CrossRef]
- Snyder, G.A.; Borg, L.E.; Nyquist, L.E.; Taylor, L.A. Chronology and isotopic constraints on lunar origin and evolution. In Origin of the Earth and Moon; Canup, R.M., Righter, K., Eds.; University of Arizona Press: Tucson, AZ, USA, 2000; pp. 361–396. [Google Scholar]
- Guo, D.; Liu, J.; Head, J.W.; Zhang, F.; Ling, Z.; Chen, S.; Chen, J.; Ding, X.; Ji, J.; Ouyang, Z. A lunar time scale from the perspective of the Moon’s dynamic evolution. Sci. China Earth Sci. 2024, 67, 234–251. [Google Scholar] [CrossRef]
- Hiesinger, H.; Head, J.W.; Wolf, U.; Jaumann, R.; Neukum, G. Ages and stratigraphy of lunar mare basalts: A synthesis. In Recent Advances and Current Research Issues in Lunar Stratigraphy; Geological Society of America: Boulder, CO, USA, 2011; Volume 477, pp. 1–51. [Google Scholar]
- Garrick-Bethell, I.; Zuber, M.T. Elliptical structure of the lunar South Pole-Aitken basin. Icarus 2009, 204, 399–408. [Google Scholar] [CrossRef]
- Melosh, H.J.; Kendall, J.; Horgan, B.; Johnson, B.C.; Bowling, T.; Lucey, P.G.; Taylor, G.J. South Pole-Aitken basin ejecta reveal the Moon’s upper mantle. Geology 2017, 45, 1063–1066. [Google Scholar] [CrossRef]
- Smith, D.E.; Zuber, M.T.; Neumann, G.A.; Lemoine, F.G.; Mazarico, E.; Torrence, M.H.; McGarry, J.F.; Rowlands, D.D.; Head III, J.W.; Duxbury, T.H.; et al. Initial observations from the lunar orbiter laser altimeter (LOLA). Geophys. Res. Lett. 2010, 37, L18204. [Google Scholar] [CrossRef]
- Moriarty, D.P.; Watkins, R.N.; Valencia, S.N.; Kendall, J.D.; Evans, A.J.; Dygert, N.; Petroet, N.E. Evidence for a stratified upper mantle preserved within the south pole–Aitken Basin. J. Geophys. Res. Planets 2021, 121, e2020JE006589. [Google Scholar] [CrossRef]
- Potter, R.W.K.; Head, J.W.; Guo, D.; Liu, J.; Xiao, L. The Apollo peak-ring impact basin: Insights into the structure and evolution of the South Pole–Aitken basin. Icarus 2018, 306, 139–149. [Google Scholar] [CrossRef]
- Wieczorek, M.A.; Neumann, G.A.; Nimmo, F.; Kiefer, W.S.; Taylor, G.J.; Melosh, H.J.; Phillips, R.J.; Solomon, S.C.; Andrews-Hanna, J.C.; Asmar, S.W.; et al. The crust of the Moon as seen by GRAIL. Science 2013, 339, 671–675. [Google Scholar] [CrossRef]
- He, Q.; Li, Y.; Baziotis, I.; Qian, Y.; Xiao, L.; Wang, Z.; Luo, B.J.; Neal, C.R.; Day, J.M.D.; Pan, F.B.; et al. Detailed petrogenesis of the unsampled Oceanus Procellarum: The case of the Chang’e-5 mare basalts. Icarus 2022, 383, 115082. [Google Scholar] [CrossRef]
- Tian, H.C.; Wang, H.; Chen, Y.; Yang, W.; Zhou, Q.; Zhang, C.; Lin, H.L.; Xie, L.W.; Zhang, D.P.; Zhang, G.L.; et al. Non-KREEP origin for Chang’e-5 basalts in the Procellarum KREEP Terrane. Nature 2021, 600, 59–63. [Google Scholar] [CrossRef]
- Zhang, D.; Su, B.; Chen, Y.; Yang, W.; Mao, Q.; Jia, L.H. Titanium in olivine reveals low-Ti origin of the Chang’E-5 lunar basalts. Lithos 2022, 414, 106639. [Google Scholar] [CrossRef]
- Melosh, H.J. Impact Cratering: A geologic Process; Oxford University Press: New York, NY, USA; Clarendon Press: Oxford, UK, 1989; p. 90. [Google Scholar]
- Denevi, B.W.; Robinson, M.S.; Boyd, A.K.; Blewett, D.T.; Klima, R.L. The Distribution and Extent of Lunar Swirls. Icarus 2016, 273, 53–67. [Google Scholar] [CrossRef]
- Garrick-Bethell, I.; Head, J.W., III; Pieters, C.M. Spectral properties, magnetic fields, and dust transport at lunar swirls. Icarus 2011, 212, 480–492. [Google Scholar] [CrossRef]
- Tsunakawa, H.; Takahashi, F.; Shimizu, H.; Shibuya, H.; Matsushima, M. Surface vector mapping of magnetic anomalies over the Moon using Kaguya and Lunar Prospector observations. J. Geophys. Res. Planets 2015, 120, 1160–1185. [Google Scholar] [CrossRef]
Disclaimer/Publisher’s Note: The statements, opinions and data contained in all publications are solely those of the individual author(s) and contributor(s) and not of MDPI and/or the editor(s). MDPI and/or the editor(s) disclaim responsibility for any injury to people or property resulting from any ideas, methods, instructions or products referred to in the content. |
© 2024 by the authors. Licensee MDPI, Basel, Switzerland. This article is an open access article distributed under the terms and conditions of the Creative Commons Attribution (CC BY) license (https://creativecommons.org/licenses/by/4.0/).