Article

Detecting Drought-Related Temporal Effects on Global Net Primary Productivity

by
Min Luo
1,2,†,
Fanhao Meng
1,2,*,†,
Chula Sa
1,2,
Yuhai Bao
1,2,
Tie Liu
3 and
Philippe De Maeyer
4,5
1
College of Geographical Science, Inner Mongolia Normal University, Hohhot 010022, China
2
Inner Mongolia Key Laboratory of Remote Sensing and Geographic Information Systems, Inner Mongolia Normal University, Hohhot 010022, China
3
State Key Laboratory of Desert and Oasis Ecology, Xinjiang Institute of Ecology and Geography, Chinese Academy of Sciences, Urumqi 830011, China
4
Department of Geography, Ghent University, 9000 Ghent, Belgium
5
Sino-Belgian Joint Laboratory of Geo-Information, 9000 Ghent, Belgium
*
Author to whom correspondence should be addressed.
These authors contributed equally to this work.
Remote Sens. 2024, 16(20), 3787; https://doi.org/10.3390/rs16203787
Submission received: 18 August 2024 / Revised: 4 October 2024 / Accepted: 9 October 2024 / Published: 11 October 2024

Abstract

:
Drought has extensive, far-reaching, and long-lasting asymmetric effects on vegetation growth worldwide in the context of global warming. However, to date, few scholars have attempted the systematic quantification of the temporal effects of drought on global vegetation across various vegetation types and diverse climate zones. Addressing this gap, we quantitatively investigated the effects of drought on global vegetation growth under various scenarios, considering lagged and cumulative effects as well as combined effects in the 1982–2018 period. Our investigation was based on long-term net primary productivity (NPP) and two multiple-timescale drought indices: the standardised precipitation index (SPI) and the standardised precipitation and evapotranspiration index (SPEI). Our main findings were the following: (1) SPI and SPEI exhibited lagged effects on 52.08% and 37.05% of global vegetation, leading to average time lags of 2.48 months and 1.76 months, respectively. The cumulative effects of SPI and SPEI were observed in 80.01% and 72.16% of global vegetated areas, respectively, being associated with relatively longer cumulative timescales of 5.60 months and 5.16 months, respectively. (2) Compared to the scenario excluding temporal effects, there were increases in the explanatory powers of SPI and SPEI for variations in vegetation NPP based on the lagged, cumulative, and combined effects of drought: SPI increased by 0.82%, 6.65%, and 6.92%, respectively, whereas SPEI increased by 0.67%, 5.73%, and 6.07%, respectively. The cumulative effects of drought on global vegetation NPP were stronger than the lagged effects in approximately two-thirds (64.95% and 63.52% for SPI and SPEI, respectively) of global vegetated areas. (3) The effects of drought on vegetation NPP varied according to climate zones and vegetation types. Interestingly, vegetation in arid zones was the most sensitive and resilient to drought, as indicated by its rapid response to drought and the longest cumulative timescales. The vegetation NPP in tropical and temperate zones exhibited a relatively stronger response to drought than that in cold and polar zones. The strongest correlation of vegetation NPP with drought occurred in shrubland areas, followed by grassland, cropland, forest, and tundra areas. Moreover, for each vegetation type, the correlations between vegetation NPP and drought differed significantly among most climate zones. (4) The vegetation NPP in warming-induced drought regions displayed a higher correlation to drought than that in non-warming-induced drought regions, with shorter lagged and longer cumulative timescales. Our findings highlight the heterogeneity of the lagged, cumulative, and combined effects of drought across various climate zones and vegetation types; this could enhance our understanding of the coupling relationship between drought and global vegetation.

1. Introduction

Drought, one of the most severe and recurrent global disasters, is a climatic condition characterised by prolonged and significantly reduced water availability [1,2], which results in the failure to meet water resource demands for vegetation growth [2]. As water availability is fundamental for vegetation activity across the world [3], long-term water deficits have extensive and far-reaching effects on vegetation growth, potentially leading to vegetation death [4,5]. As an important indicator of vegetation activity, the net primary productivity (NPP) of vegetation refers to the total amount of carbon fixed by vegetation through photosynthesis per unit area and unit time, excluding respiration consumption [6]. Importantly, numerous studies have reported drought-induced reductions in regional vegetation productivity over the past three decades [2,7,8,9]. Owing to global climate warming, the frequency and intensity of droughts have been continually increasing, while the impacts of droughts on vegetation activity have also been worsening, particularly in the world’s arid and semi-arid regions [10]. In this context, monitoring the spatiotemporal variation in droughts and systematically analysing the effects of droughts on vegetation NPP across various climate zones is essential for addressing the adverse effects of climate change and implementing sustainable ecosystem development at a global level.
Drought monitoring is conducted using a set of drought indices that have been developed and widely used at regional and global scales [11] since their development. The most extensively used drought indices are the standardised precipitation index (SPI) [12] and the standardised precipitation evapotranspiration index (SPEI) [13], both of which possess multiscale characteristics and can reflect various types of drought [14,15]. SPI considers precipitation as the single most critical factor affecting drought intensity and duration [16]. However, SPEI, an extension of SPI, considers both precipitation and potential evapotranspiration in determining drought conditions [11]. By contextualising drought according to the concept of surface water balance (which assumes that droughts can be caused by both decreased precipitation and increased evapotranspiration induced by global warming) [10,17], SPEI can capture drought dynamics more effectively than SPI and is deemed more reliable with regard to drought monitoring [11,14]. Nevertheless, scholars still employ SPI in drought monitoring projects, as the causes of drought (i.e., decreased precipitation or increased temperature) can be discerned from differences in the results of drought monitoring by SPI and SPEI [18]; however, such differences have not yet been comprehensively evaluated on a global scale.
Here, it is important to note that the differences in vegetation responses to drought are likely effected by the primary drivers of drought [19,20]. For example, Chen et al. [21] reported that anomalies in precipitation, rather than temperature, are deemed the main driver of drought-induced stress on vegetation in the Northern Hemisphere. In fact, the increase in climate-warming-induced droughts has led to a considerable rise in the influence of droughts on vegetation productivity, with future predictions indicating an even greater magnitude of such influence [19,22].
Furthermore, one must bear in mind that drought tends to asymmetrically affect vegetation, either with or without lagged and cumulative effects [23]. The lagged timescale at which vegetation growth is primarily affected by droughts typically spans a certain previous month [7,24], reflecting the sensitivity of vegetation to drought [3]. On the other hand, cumulative timescales indicate that vegetation growth is predominantly influenced by cumulative droughts occurring in previous months, as well as the current month of a study [25]; measurements of such growth can be used to evaluate vegetation resistance and resilience to drought [2,26].
Many studies have investigated the temporal effects of drought on vegetation growth [10,27,28]. For instance, Wang et al. [28] revealed lagged and cumulative drought effects on 66.41% and 54.57% of the vegetation productivities in China, respectively. Moreover, Wei et al. [7] investigated the temporal effects of drought on global grassland productivity and found that 88.37% and 78.55% of global grassland areas have been affected, respectively, by the lagged and cumulative effects of drought (monitored through SPEI). The aforementioned studies have improved our understanding of the temporal effects of drought on vegetation growth and have emphasised the importance of further analysing these effects. However, most of these studies addressed the temporal effects of drought only at regional scales or based on specific vegetation types. Given that the vegetation–drought coupling relationship is substantially correlated with climatic conditions and vegetation types [26], there is an urgent need for a comprehensive global analysis of the temporal effects of drought on vegetation growth across different vegetation types and climate zones.
To this end, scholars have identified the coexistence of the lagged and cumulative effects of meteorological factors that affect vegetation growth [25,29]. The combined lagged and cumulative effects of climate on vegetation growth have been deemed significantly stronger than the individual effects [25]. Consequently, it has been argued that vegetation growth may be notably influenced by cumulative drought over certain consecutive previous months. However, existing studies on this topic have typically assessed the lagged and cumulative effects of drought separately, before comparing their differences. To date, the combined effects of drought on vegetation growth have not been systematically analysed at a global level. New studies must urgently fill this gap through comprehensive investigation.
In this light, our study attempted to systematically quantify the effects of drought on global vegetation NPP under various scenarios, including those without temporal effects as well as those with lagged, cumulative, and combined effects, across different vegetation types and diverse climate zones. We first examined the spatial patterns of changes in global vegetation NPP and drought, as monitored by SPI and SPEI, for a period lasting from 1982 to 2018. In addition, we distinguished regions specifically experiencing climate-warming-induced drought. Then, we determined and quantified the coupling relationship between vegetation NPP and drought under different scenarios (considering different vegetation types and climate zones) both without and with temporal effects (i.e., lagged, cumulative, and combined effects). We also investigated the optimal lagged and cumulative timescales of drought. Finally, we discussed the differences in vegetation responses to warming-induced drought. Our study’s findings can enhance the understanding of vegetation–drought interactions in the era of climate change dominated by global warming.

2. Data and Methods

2.1. Data

To gather relevant data, this study used a long-term global NPP dataset provided by the Global Land Surface Satellite (GLASS), spanning the 1982–2018 period. This (GLASS NPP) dataset, with a spatial resolution of 0.05° and eight-day intervals, was downloaded from the National Earth System Science Data Center (http://www.geodata.cn, accessed on 8 July 2023). Subsequently, we generated the monthly global vegetation NPP series by summing each specifically studied period of 1–12 months. Particularly, this dataset was estimated based on the GLASS Leaf Area Index and Fraction of Photosynthetically Active Radiation using the multi-source data synergised quantitative (MuSyQ) NPP algorithm [30]; notably, recent studies have indicated a high precision of such GLASS NPP datasets [30,31]. Moreover, global drought conditions were monitored using SPI and SPEI, which have been widely used to study meteorological droughts. The monthly SPEI (SPEIbase Version 2.8) dataset for the 1982–2018 period, based on scales of 1–12 months, was obtained from the Consejo Superior de Investigaciones Científicas (https://spei.csic.es/database.html, access on 18 July 2023). Notably, the SPEI dataset was calculated based on gridded precipitation and potential evapotranspiration data from the Climate Research Unit Time Series, Version 4.06 (CRU TS 4.06). The CRU TS, with a 0.5° monthly resolution, was developed by the University of East Anglia. Indeed, as gauge-interpolated products, CRU TS data are of good quality, being widely used in meteorological studies worldwide [14,32,33]. To reduce the uncertainty of the data sources, the precipitation data from CRU TS 4.06 were also adopted for the SPI calculation for the 1982–2018 period (at scales of 1–12 months) using the SPEI package in R (the programming language).
Among others, annual GLASS land-cover data spanning the 1982–2015 period (at a 5 km resolution) were used in this study (https://doi.org/10.1594/PANGAEA.913496). The average accuracy of these long-term land-cover data was 82.81%; they enabled a classification of the global land surface into seven categories: cropland, forest, grassland, shrubland, tundra, barren land, and snow/ice [34]. As shown in Figure S1, except for two non-vegetated land classes (barren land and snow/ice), the pixels that indicated changed vegetation types in the 1982–2015 period were also excluded to reduce the interference caused by vegetation cover change as much as possible. Moreover, a new global climate classification map (Köppen–Geiger’s climate zone data) at a 0.5° resolution was freely downloaded from the GLoH20 website (https://www.gloh2o.org/koppen/). This map included 30 climate subzones integrated into 5 climate zones: tropical, arid, temperate, cold, and polar (Figure S2); Beck et al. [35] provide more detailed information on such data. To match the SPI and SPEI data, all gridded products were upscaled to a 0.5° spatial resolution using the aggregate method in R (programming language).

2.2. Methods

2.2.1. Sen’s Slope Estimator and the Mann–Kendall (MK) Test

In this study, Sen’s slope estimation method was adopted to quantify the changing trends of vegetation NPP and drought indices. This method was advantageous due to its simplicity and robustness against outliers, which make it well suited for analysing long-term trends [36]. For the time series xt (t = 1, 2… n), the Sen’s slope of each pixel was calculated as follows:
β = M e d i a n x j x i j i , 1 i < j n
where x i and x j represent the values of the time series at times i and j, respectively, and β is the slope coefficient of the changes in the time series. If β > 0, an upward trend was identified in the time series, and vice versa.
Since Sen’s slope method lacked statistical significance testing, the MK test was subsequently used to evaluate the significance of the changing trend of the time series. The MK statistic S was calculated as follows:
S = i = 1 n 1 j = i + 1 n s g n ( x j x i )
s g n ( x j x i ) = + 1 , i f   x j x i > 0 0 , i f   x j x i = 0 1 , i f   x j x i < 0
As per Equation (2), when n  10, the statistic S would approximately equal the standard normal test statistic ( Z s ) value, which was computed in this study by using the following equation:
Z s = S 1 v a r ( S ) ,   S > 0 0 , S = 0 S + 1 v a r ( S ) ,   S < 0
v a r S = n n 1 2 n + 5 18
For a given significance level α , the existence of a significant trend could be accepted when Z s > Z 1 α / 2 . In this study, a significance level of 0.05 was selected, and a significant trend was detected if Z s > 1.96.

2.2.2. Division of Warming-Induced Drought Areas

To identify the contribution of warming to drought, the statistical results of SPI and SPEI obtained from the Sen’s slope estimator and MK tests were combined and classified, as shown in Table 1. The drought changes in the global land areas were subsequently divided into four types: non-warming-induced drought, mild warming-induced drought, moderate warming-induced drought, and severe warming-induced drought. For example, if SPI in a given pixel displayed a non-significant drought trend ( β < 0, Z s < 1.96) and SPEI displayed a significant drought trend ( β < 0, Z s < 1.96), this pixel was identified as a mild warming-induced drought pixel [37].

2.2.3. Analysis of the Temporal Effects of Drought Indices

To quantify the temporal effects of drought indices on global vegetation NPP, a linear regression analysis was performed, incorporating lagged and cumulative effects over a 12-month period. Before setting up the regression equation, the monthly NPP series were pre-processed by subtracting seasonal cycles, the latter being calculated based on the multi-year average of the raw NPP series data for each month [32,38]. Afterward, the monthly NPP series, with the seasonal cycles removed and with different drought indices, were further standardised as follows:
Z ( x ) = x x ¯ S ( x )
where x represents the time series of the variables, while x ¯ and S x indicate the average value and standard deviation of the corresponding series, respectively.
Then, the standardised time series were used to establish the following regression equation:
NPP t = a × D I - k t i + b
where a is the regression coefficient (RC) of NPP to the drought indices (DI), ranging from −1 to 1, and b is the constant term; i represents the lag timescales of the drought indices, ranging from 0 to 12; and k refers to the cumulative timescales of the drought indices, ranging from 1 to 12 [25]. Since all the time series were standardised in this study, the RC reflected the direct effects of SPI/SPEI on NPP. Differences in the coefficient of determination (R2) were also calculated to assess the extent to which drought effects may be underestimated when temporal effects are not considered. Based on the different combinations of i and k, the drought effects were classified into four scenarios: (1) when i = 0 and k = 1, only contemporaneous effects were considered (not temporal); (2) when i = 0 and k ranged from 1 to 12, only cumulative effects were considered; (3) when i ranged from 0 to 12 and k = 1, only lagged effects were considered; and (4) when i ranged from 0 to 12 and k ranged from 1 to 12, both lagged and cumulative effects were considered (Table 2). In turn, the optimal lagged and cumulative effects could be determined using the maximum RC of the abovementioned regression equation. The detailed procedure for determining the temporal effects of drought indices on vegetation NPP can be found in Figure S3.

2.2.4. Analysis of Variance (ANOVA)

In this study, the differences in the RC of vegetation NPP with regard to the drought indices (for different vegetation types and climate zones) were detected using ANOVA [26]. Notably, the response of vegetation NPP to drought (for different vegetation types and climate zones) statistically differed when their mean RCs were deemed significantly different (95% significance level). More details about this process can be found in the work of Rinnan et al. [39].

3. Results

3.1. Changing Trends of Global Vegetation NPP and Droughts

The spatial distribution of the changing trends of global vegetation NPP over the studied period is shown in Figure 1. The changing rates of vegetation NPP over this period ranged from –7.05 g C · m 2 · y r 1 to 9.01 g C · m 2 · y r 1 , with a global average vegetation NPP of 0.91 g C · m 2 · y r 1 (p < 0.05). Overall, the increasing trend accounted for a large percentage of global vegetated areas (79.48%), with 51.63% and 27.85% of the vegetated pixels displaying significant and insignificant upward trends over the studied period, respectively, thereby reaffirming the occurrence of global greening. The decreasing trend (20.52%) of global vegetation NPP was mainly distributed in western North America, Central Asia, and the equatorial region, being deemed significant in 7.69% of the vegetated areas (mainly located in northern South America). The average vegetation NPP increasing rate in the Northern Hemisphere (1.06 g C · m 2 · y r 1 ) was relatively higher than that in the Southern Hemisphere (0.44 g C · m 2 · y r 1 ). Moreover, all vegetation types exhibited a significant increasing trend in terms of NPP over the past 37 years (Figure S4): cropland had the highest upward rate (1.36 g C · m 2 · y r 1 ), followed by shrubland (1.19 g C · m 2 · y r 1 ), grassland (1.0 g C · m 2 · y r 1 ), tundra (0.86 g C · m 2 · y r 1 ), and forest (0.78 g C · m 2 · y r 1 ) regions.
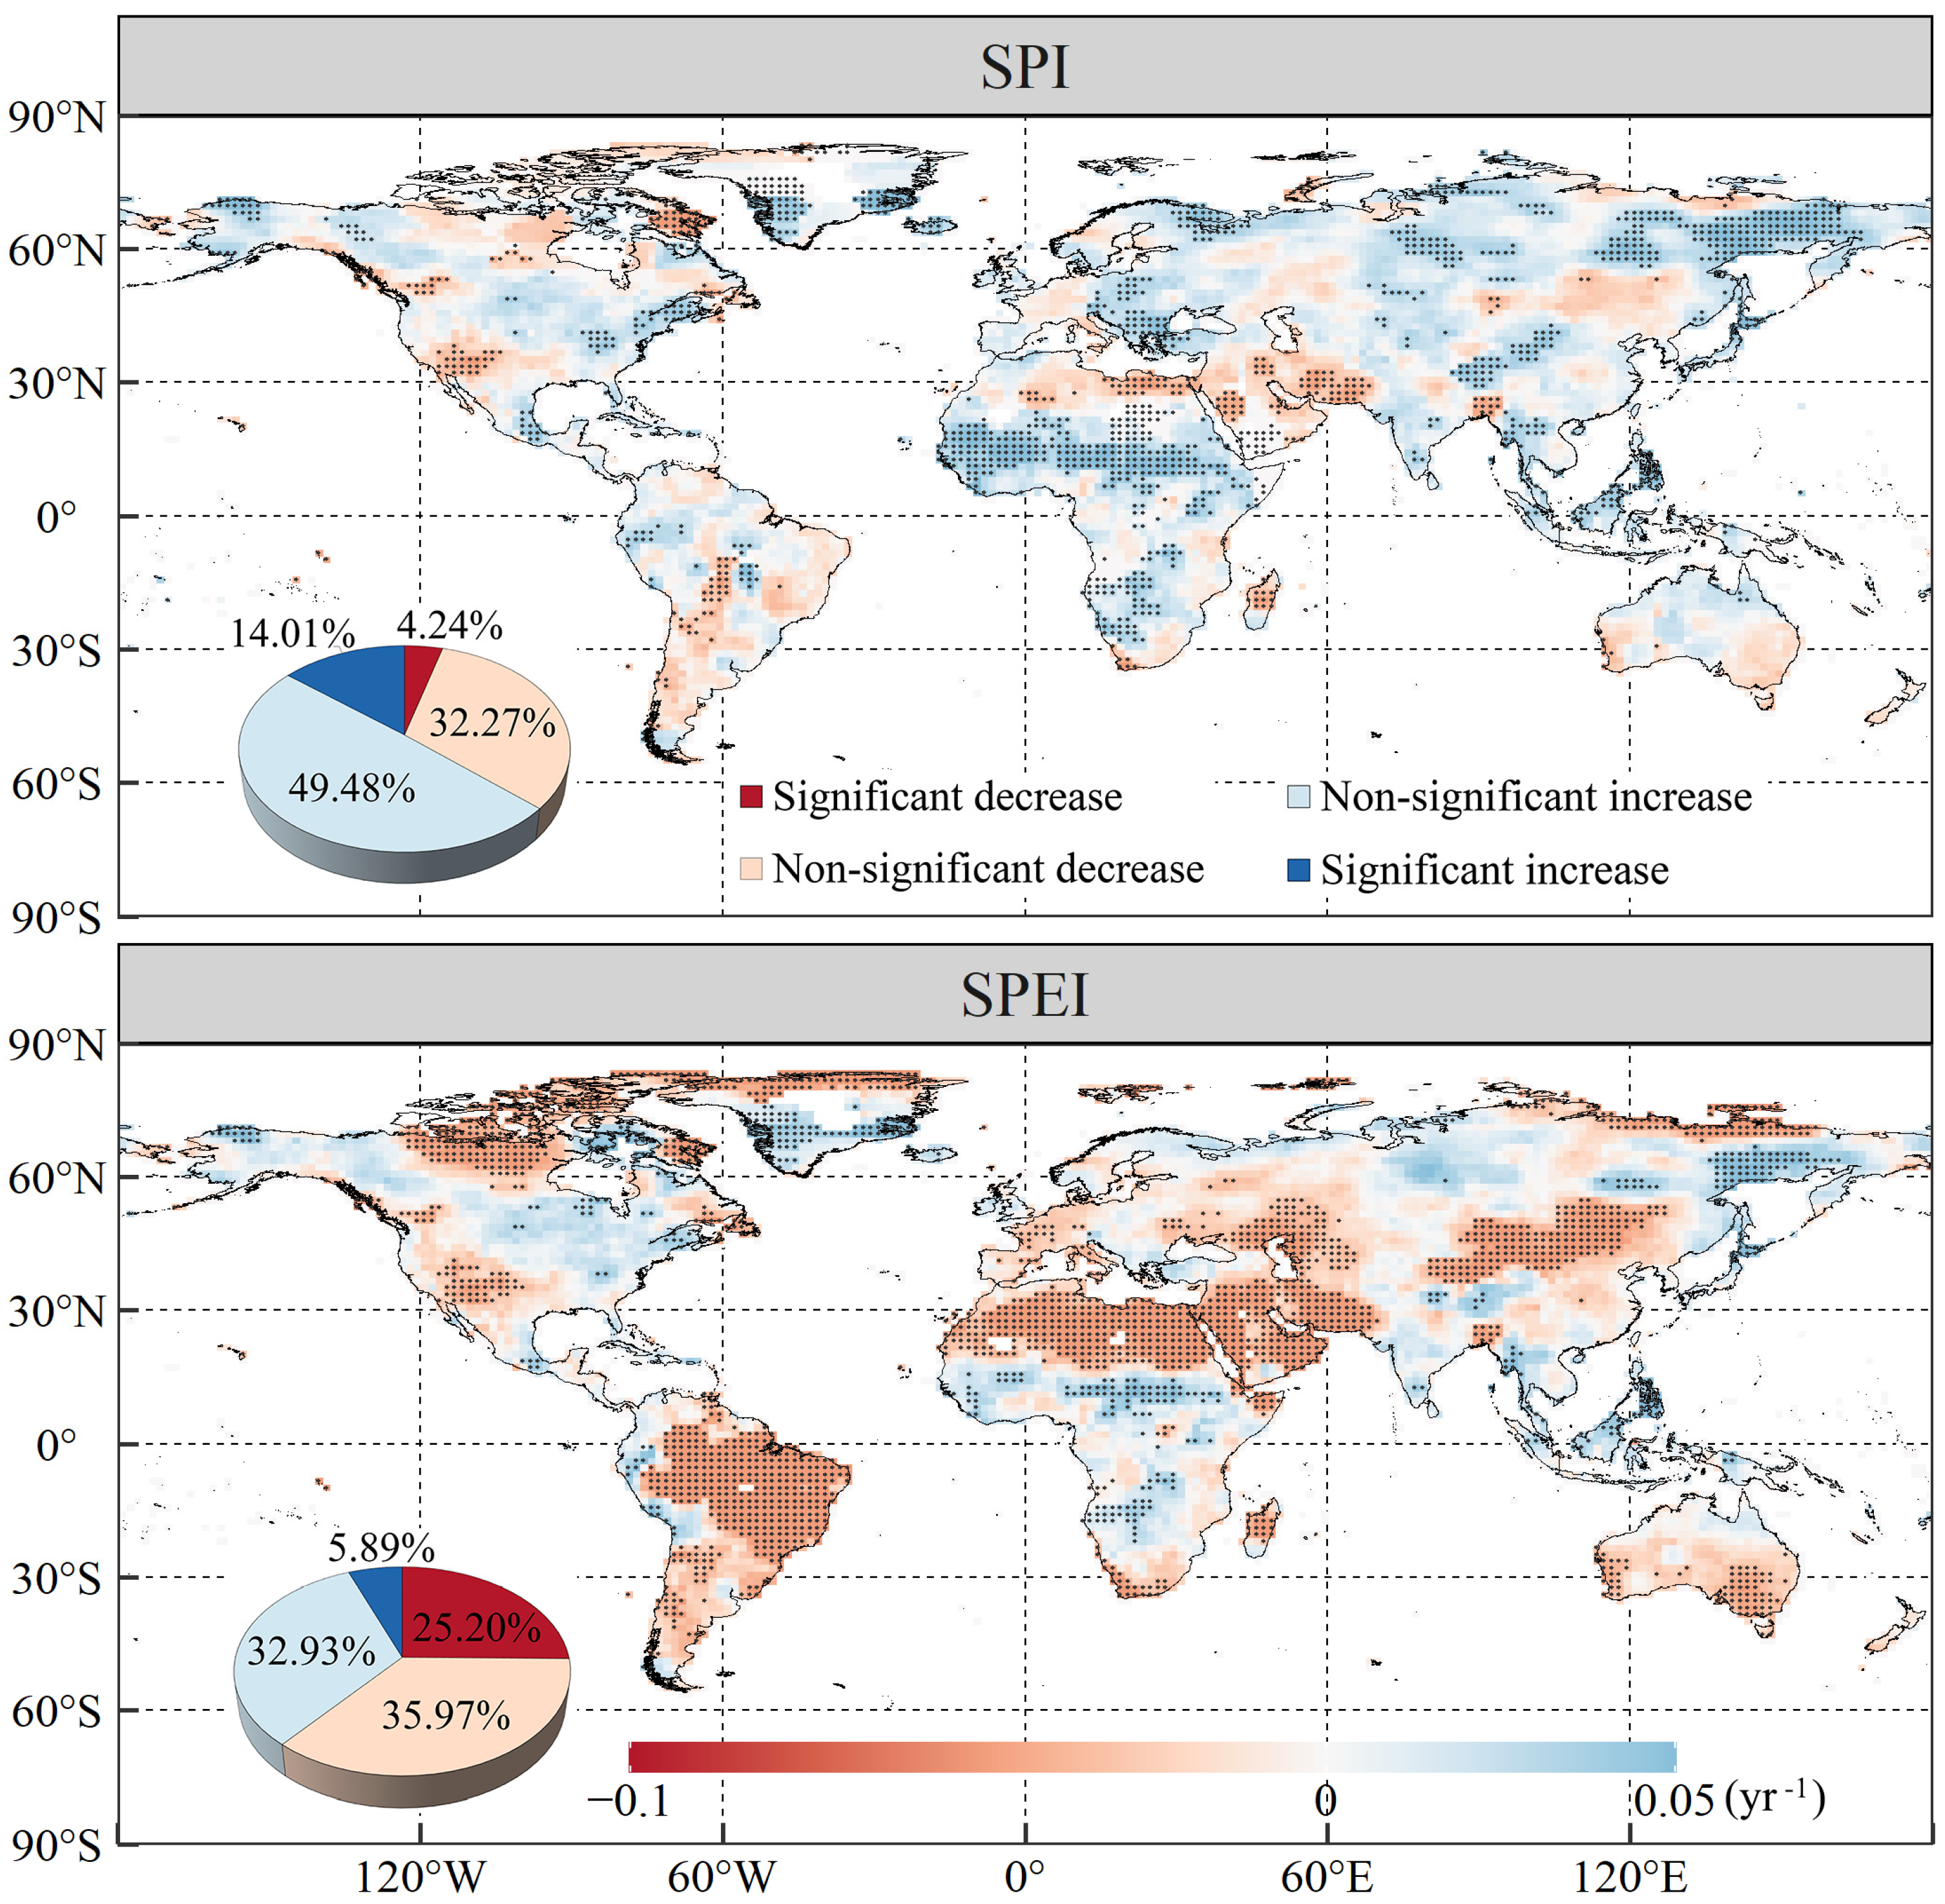
Global drought changes in the studied period, monitored by the corresponding 12-month cumulative SPI and SPEI, displayed a strong spatial heterogeneity (Figure 2). Generally, instances of global drought monitored by SPI were primarily characterised by humidity, while the opposite was true for droughts monitored by SPEI. As expected, the spatial pattern of SPI change was consistent with that of precipitation (Figure S5), with 63.49% of the entire global land area exhibiting an SPI wetting trend over the past 37 years and 14.01% displaying a significant SPI increase, particularly in Central Africa and Northeast Asia; only 4.24% of the 36.51% remaining global land area showed a significant decreasing trend in SPI.
With most global regions (98.32%) exhibiting trends of increasing temperature (Figure S5), a larger and more significant range of droughts was consequently detected by SPEI. Of the total global land area, 61.17% showed decreasing trends in terms of SPEI, 25.20% of which passed the significance test. However, almost a quarter (24.66 percentage points) of the SPEI-detected drought grids were not recognised as drought by the SPI. This analysis highlights the importance of investigating climate warming to detect meteorological droughts. To be precise, the significant drying trend of SPEI was mainly distributed in northern North America, South America, Northern Africa, and Central Asia. Regions with increasing SPEI accounted for 38.83% of the entire global land area, suggesting that the influences of climate warming on droughts are completely offset by increased precipitation. Additionally, only 5.89% of the entire global land area showed a significant increasing trend in terms of SPEI; unsurprisingly, these grids almost overlapped with areas where SPI had increased significantly.
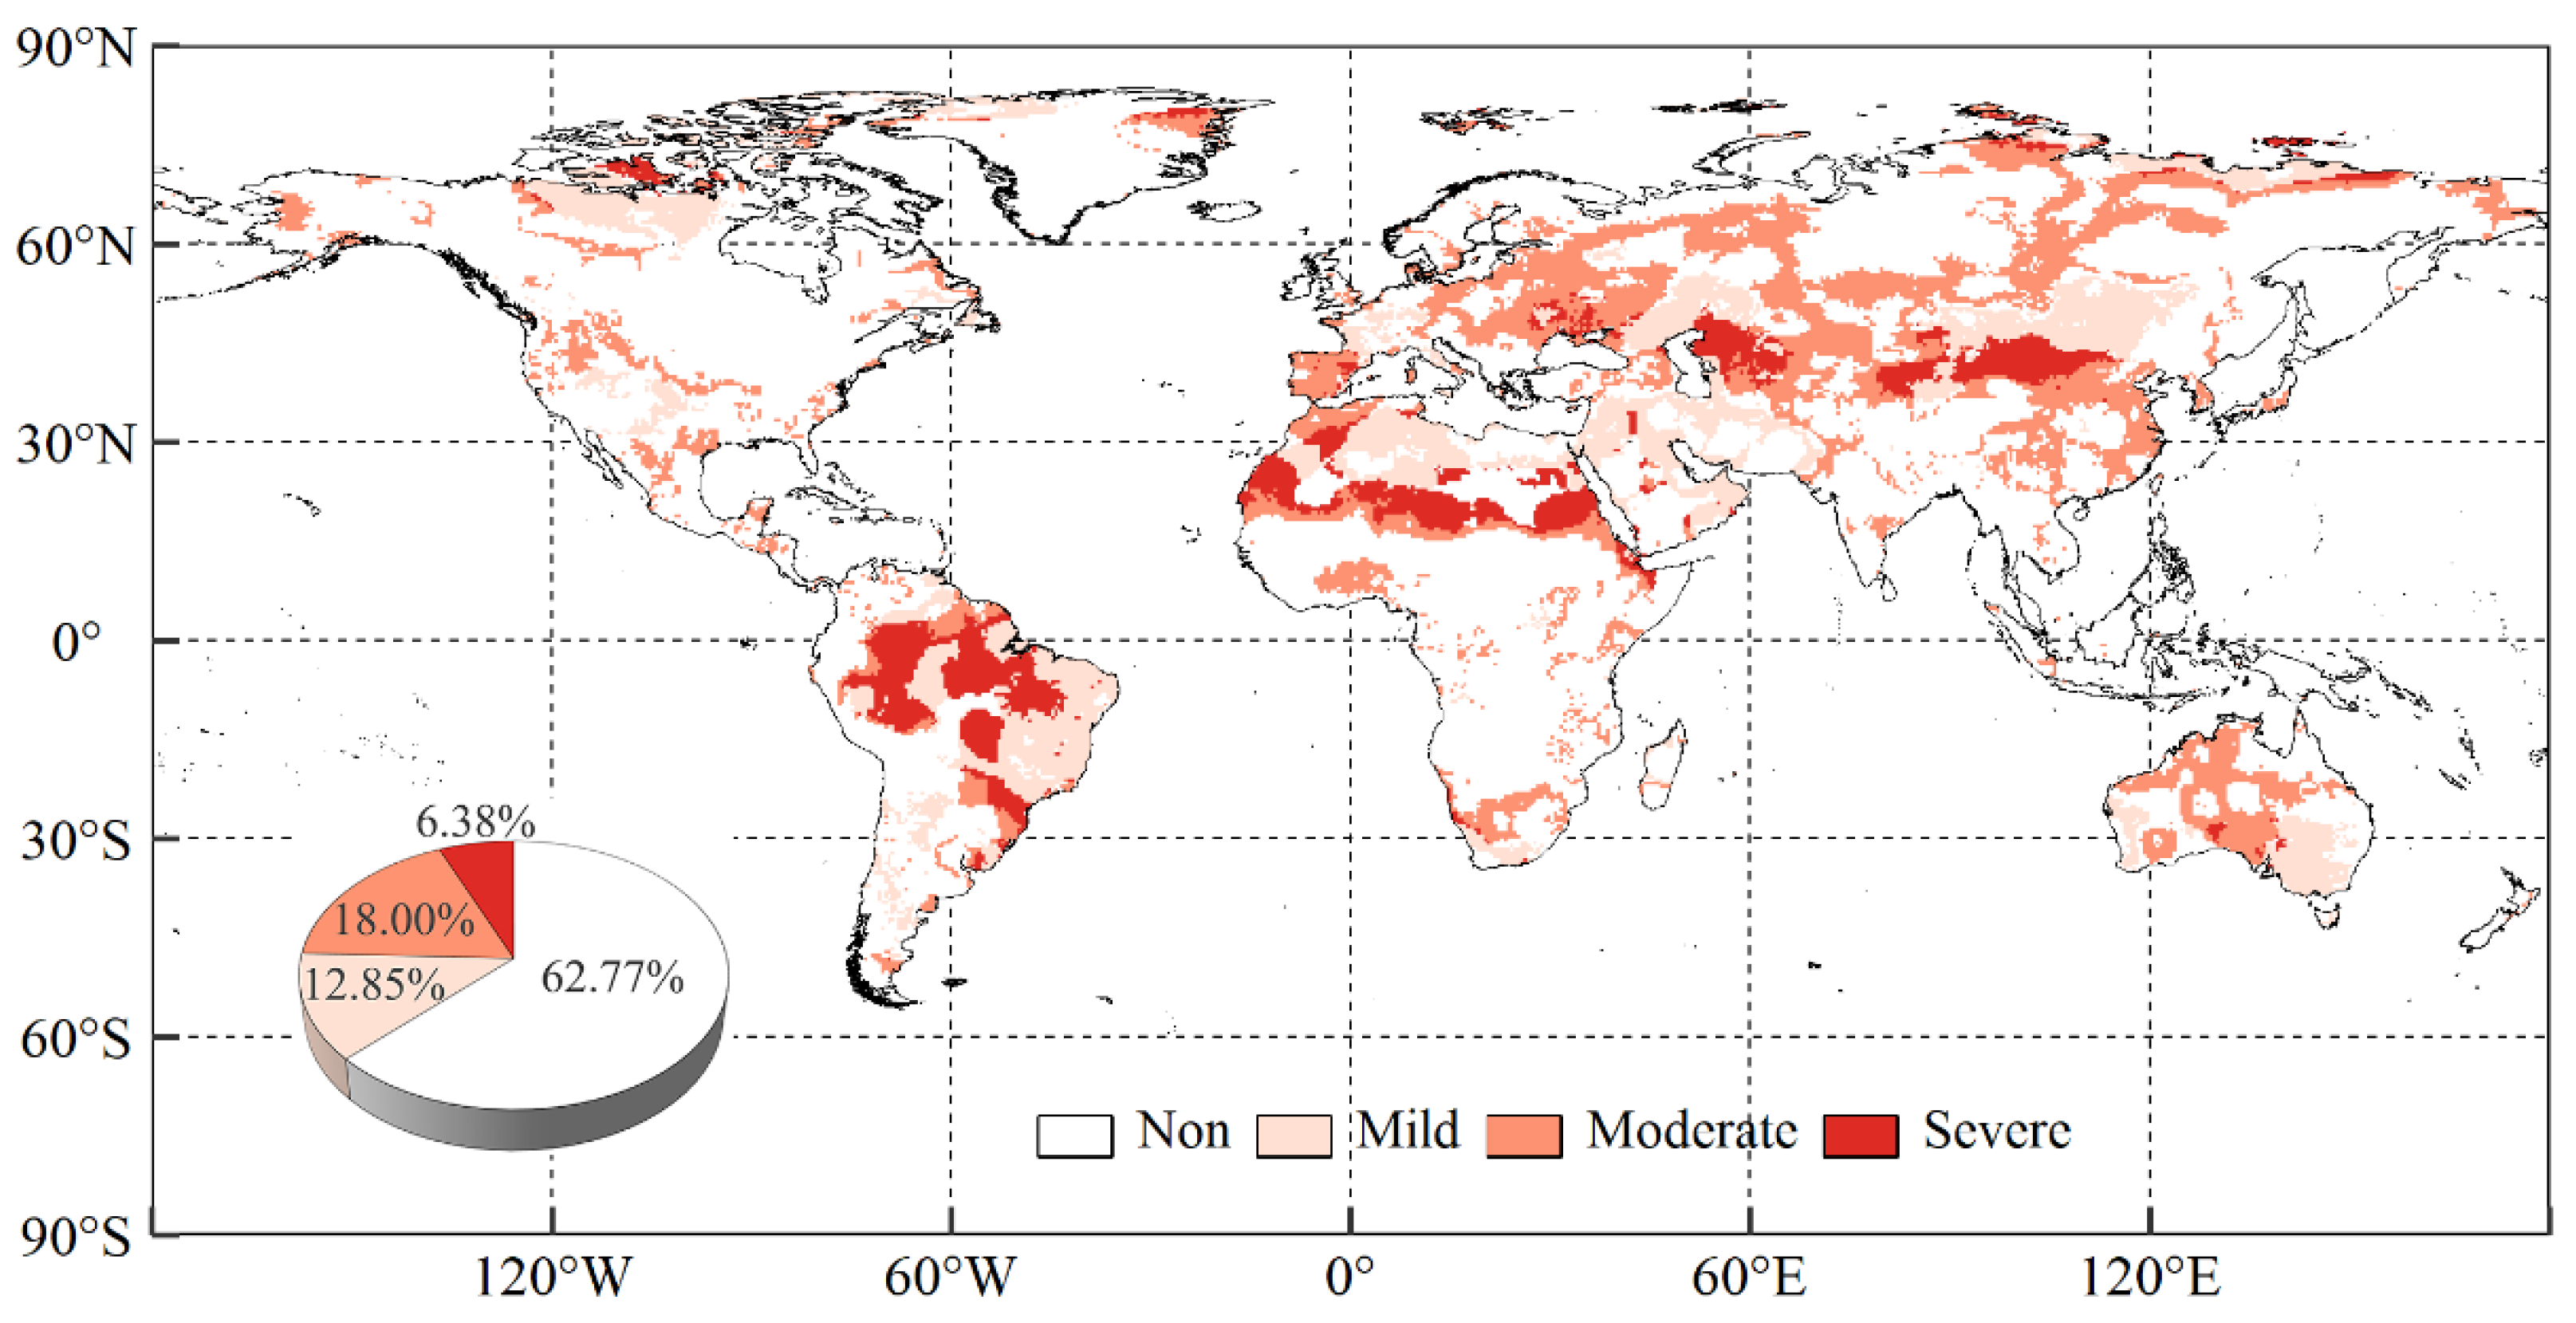
Further dividing the changing trends in SPI and SPEI, this study found that the varying severity of drought caused by climate warming affected 37.23% of the entire global land area in the study period. As shown in Figure 3, mild, moderate, and severe warming-induced drought conditions were found in 12.85%, 18.00%, and 6.38% of the entire global land area, respectively. In this studied period, the areas affected by severe warming-induced drought were mainly distributed in northern South America, the southern edge of the Sahara Desert, and Central Asia, while those affected by moderate warming-induced drought were mainly located in the middle- and high-latitude regions of Eurasia. Overall, 31.99% and 43.82% of the Northern and Southern Hemispheres, respectively, exhibited warming-induced drought conditions. From the perspective of climate zones, the highest percentage (41.52%) of areas facing warming-induced drought were arid zones (Figure S6), and the percentages of these areas in the other four climate zones did not differ significantly (37.82% in tropical climates, 35.07% in polar climates, 34.04% in temperate climates, and 32.82% in cold climates). Additionally, arid, temperate, and cold climate zones had the highest percentages (13.79–18.93%) of moderate warming-induced drought areas, followed by areas with mild (9.16–15.22%) and severe (4.73–8.55%) warming-induced drought. However, tropical and polar climate zones showed no significant differences regarding the percentage of areas affected by different levels of warming-induced drought.

3.2. Temporal Effects of Drought Indices on Global Vegetation NPP

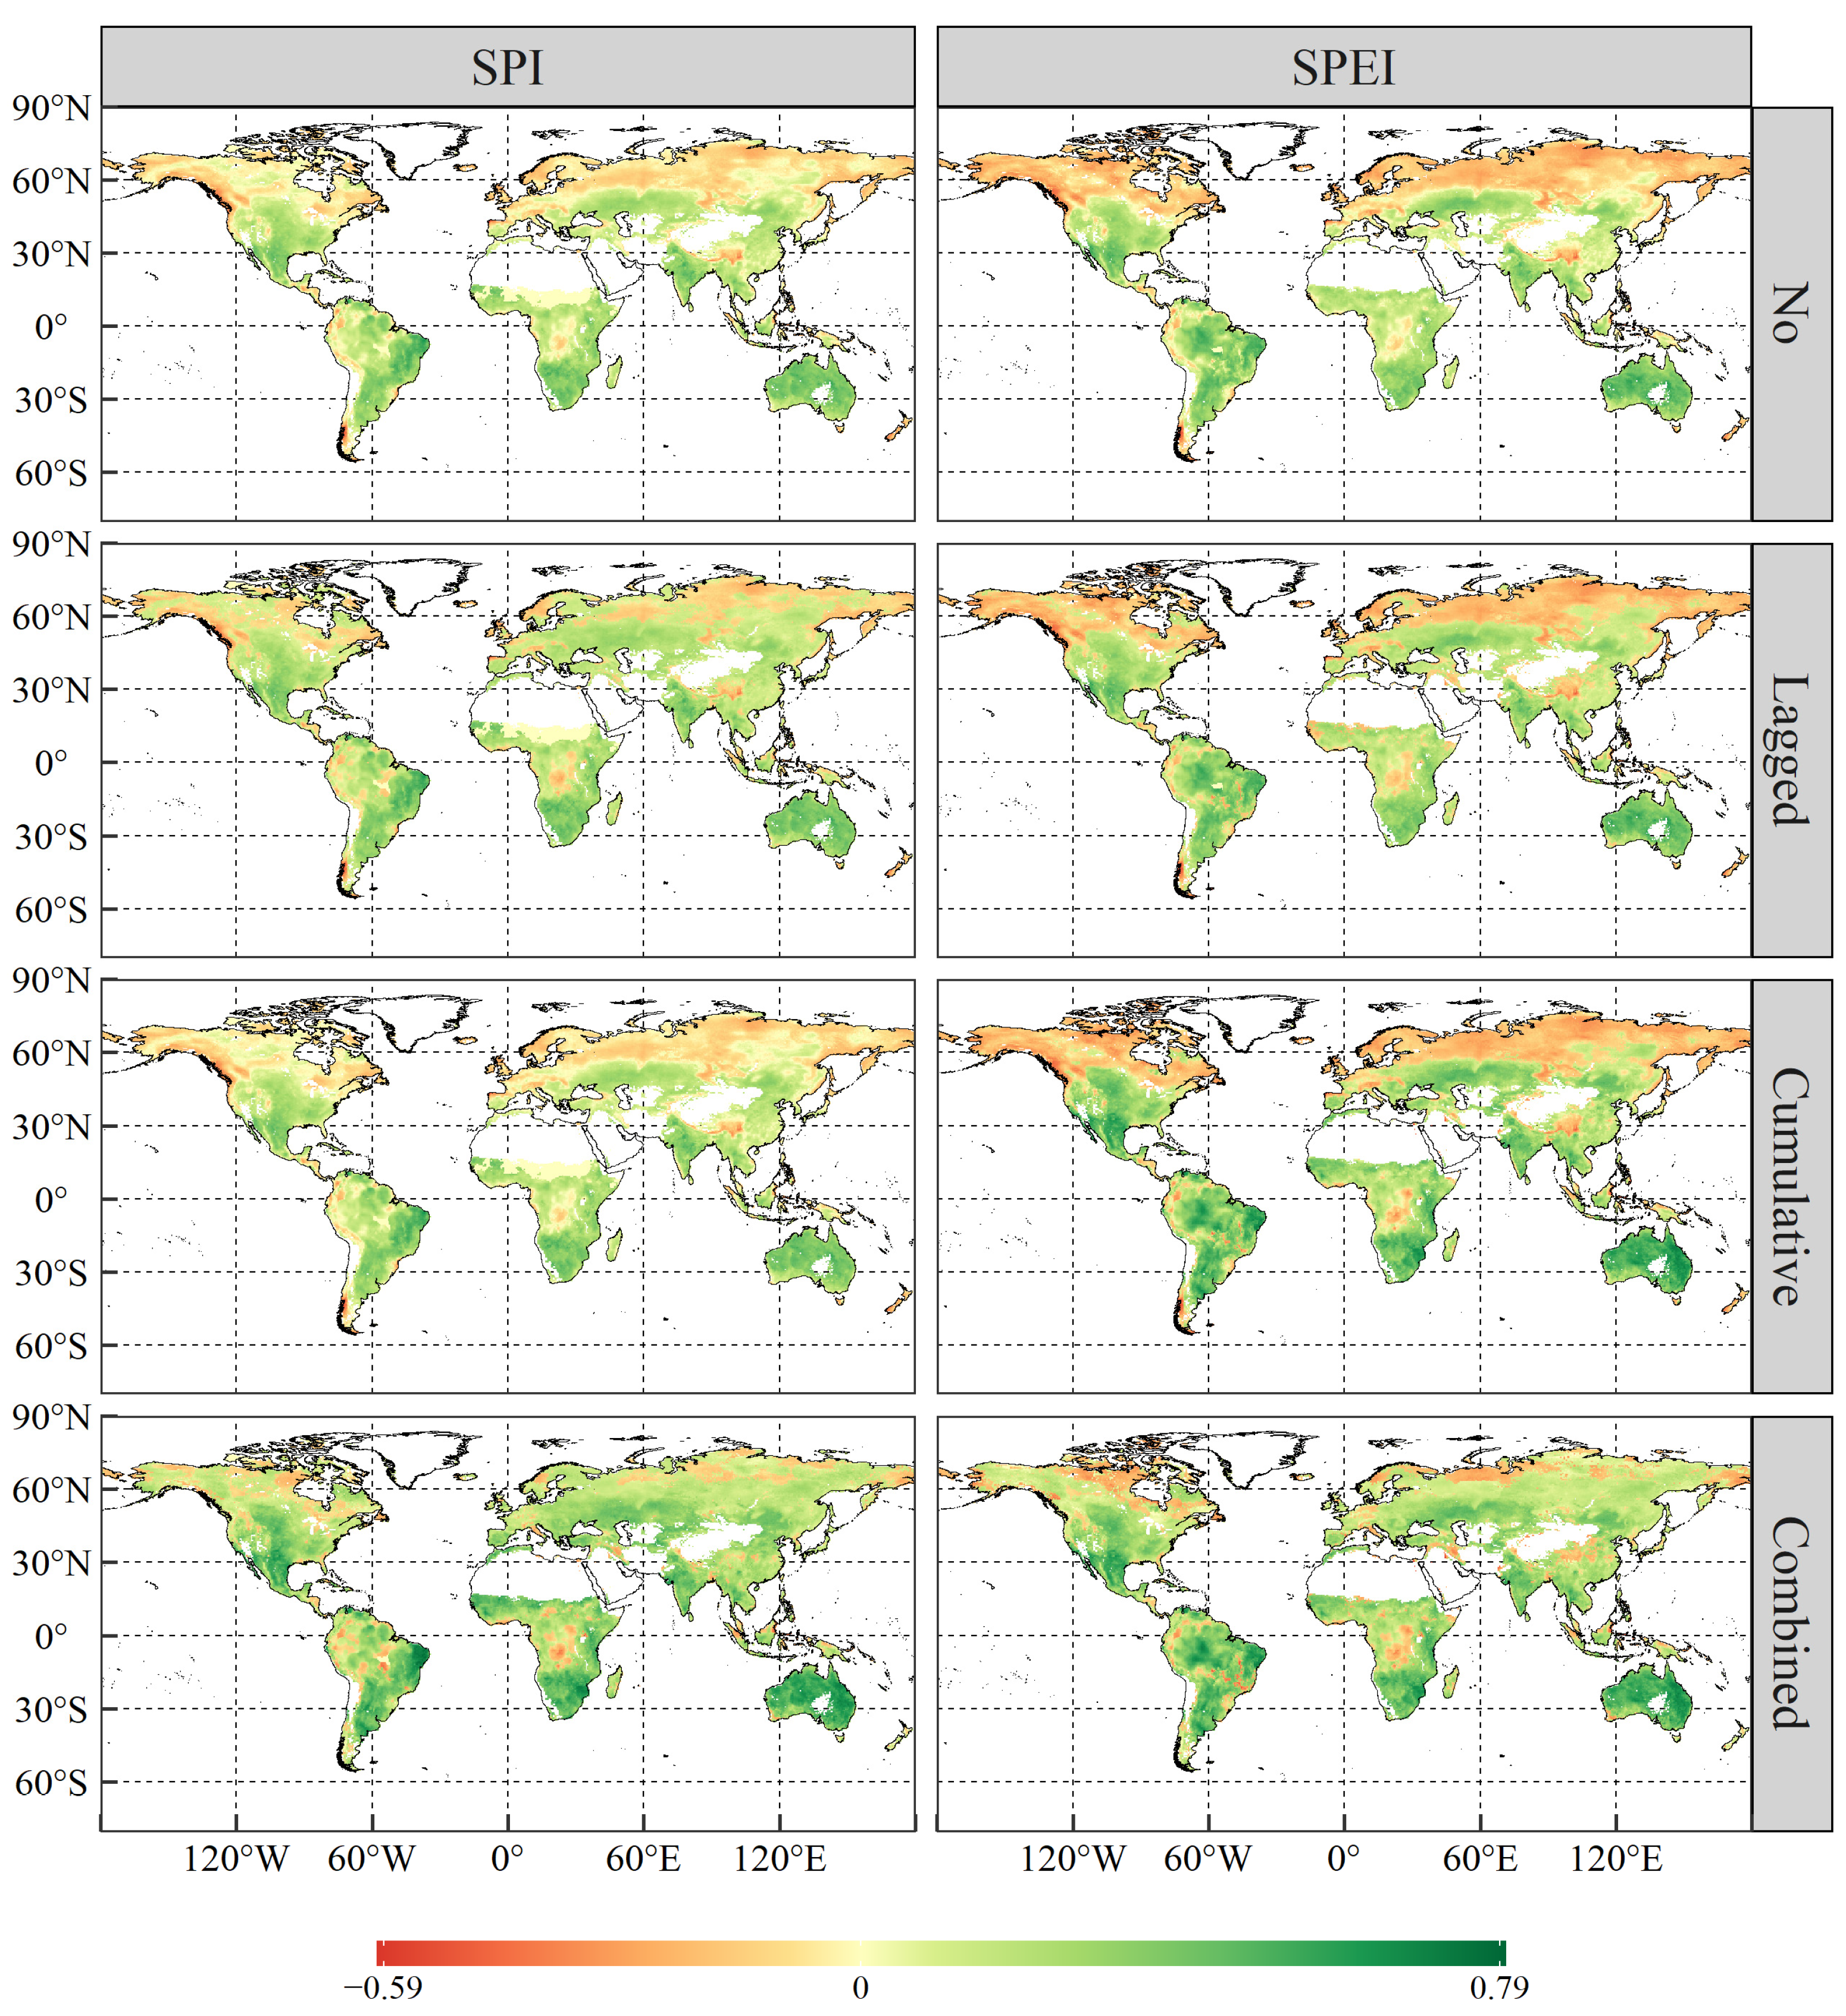
Figure 4 shows the spatial pattern of this study’s maximum regression coefficients (RC_max), with vegetation NPP as the dependent variable and SPI/SPEI as the independent variable. In terms of water-deficit levels, the higher the SPI and SPEI values (indicators), the lower the water limitation. Thus, vegetation was positively correlated with SPI and SPEI, accounting for 59.59–83.68% and 53.92–80.68% of global vegetated areas, respectively (Figure S7). Owing to the predominant role of precipitation in controlling moisture conditions in the world’s southern temperate zone, vegetation in the Southern Hemisphere was deemed more affected by drought. The RC_max values of SPI and SPEI without temporal effects were particularly positive in 59.59% and 53.92% of the entire global vegetated area, respectively, being mainly concentrated between 41°S and 53.5°N (Figure S8).
On the other hand, the pixels displaying a negative response of vegetation NPP to SPI and SPEI accounted for 40.41% and 46.08% of the total global vegetated area, respectively, and were primarily distributed in the western edge of South America, Central Africa, the Tibetan Plateau, and the high latitudes of the Northern Hemisphere. Notably, the effects of drought on NPP began to shift from negative to positive in the regions around 59°N and 54.5°N when the lagged/cumulative effects of SPI and SPEI were included, respectively. Meanwhile, the positive correlations of vegetation NPP to SPI and SPEI extended to regions other than those at latitudes greater than 74.5°N and 64°N. The pixels of SPI negatively correlated to vegetation NPP in the lagged-effect, cumulative-effect, and combined-effect scenarios accounted for 28.70%, 31.38%, and 16.32% of the total vegetated pixels on the map, respectively (Figure S7). Compared to the SPEI effects in the scenario without temporal effects, the negative effects of SPEI on vegetation NPP showed only meagre variations when either lagged (41.22%) or cumulative (41.27%) effects were considered separately. However, the percentage of pixels negatively correlated with the combined effects dropped to 19.32%, indicating complex synergistic interactions between the lagged response of vegetation to drought and the cumulative effects of drought on vegetation. In terms of various vegetation types, the maximum percentage of positive correlation with vegetation NPP was associated with shrubland, followed by cropland, grassland, forest, and tundra categories (Figure S9).
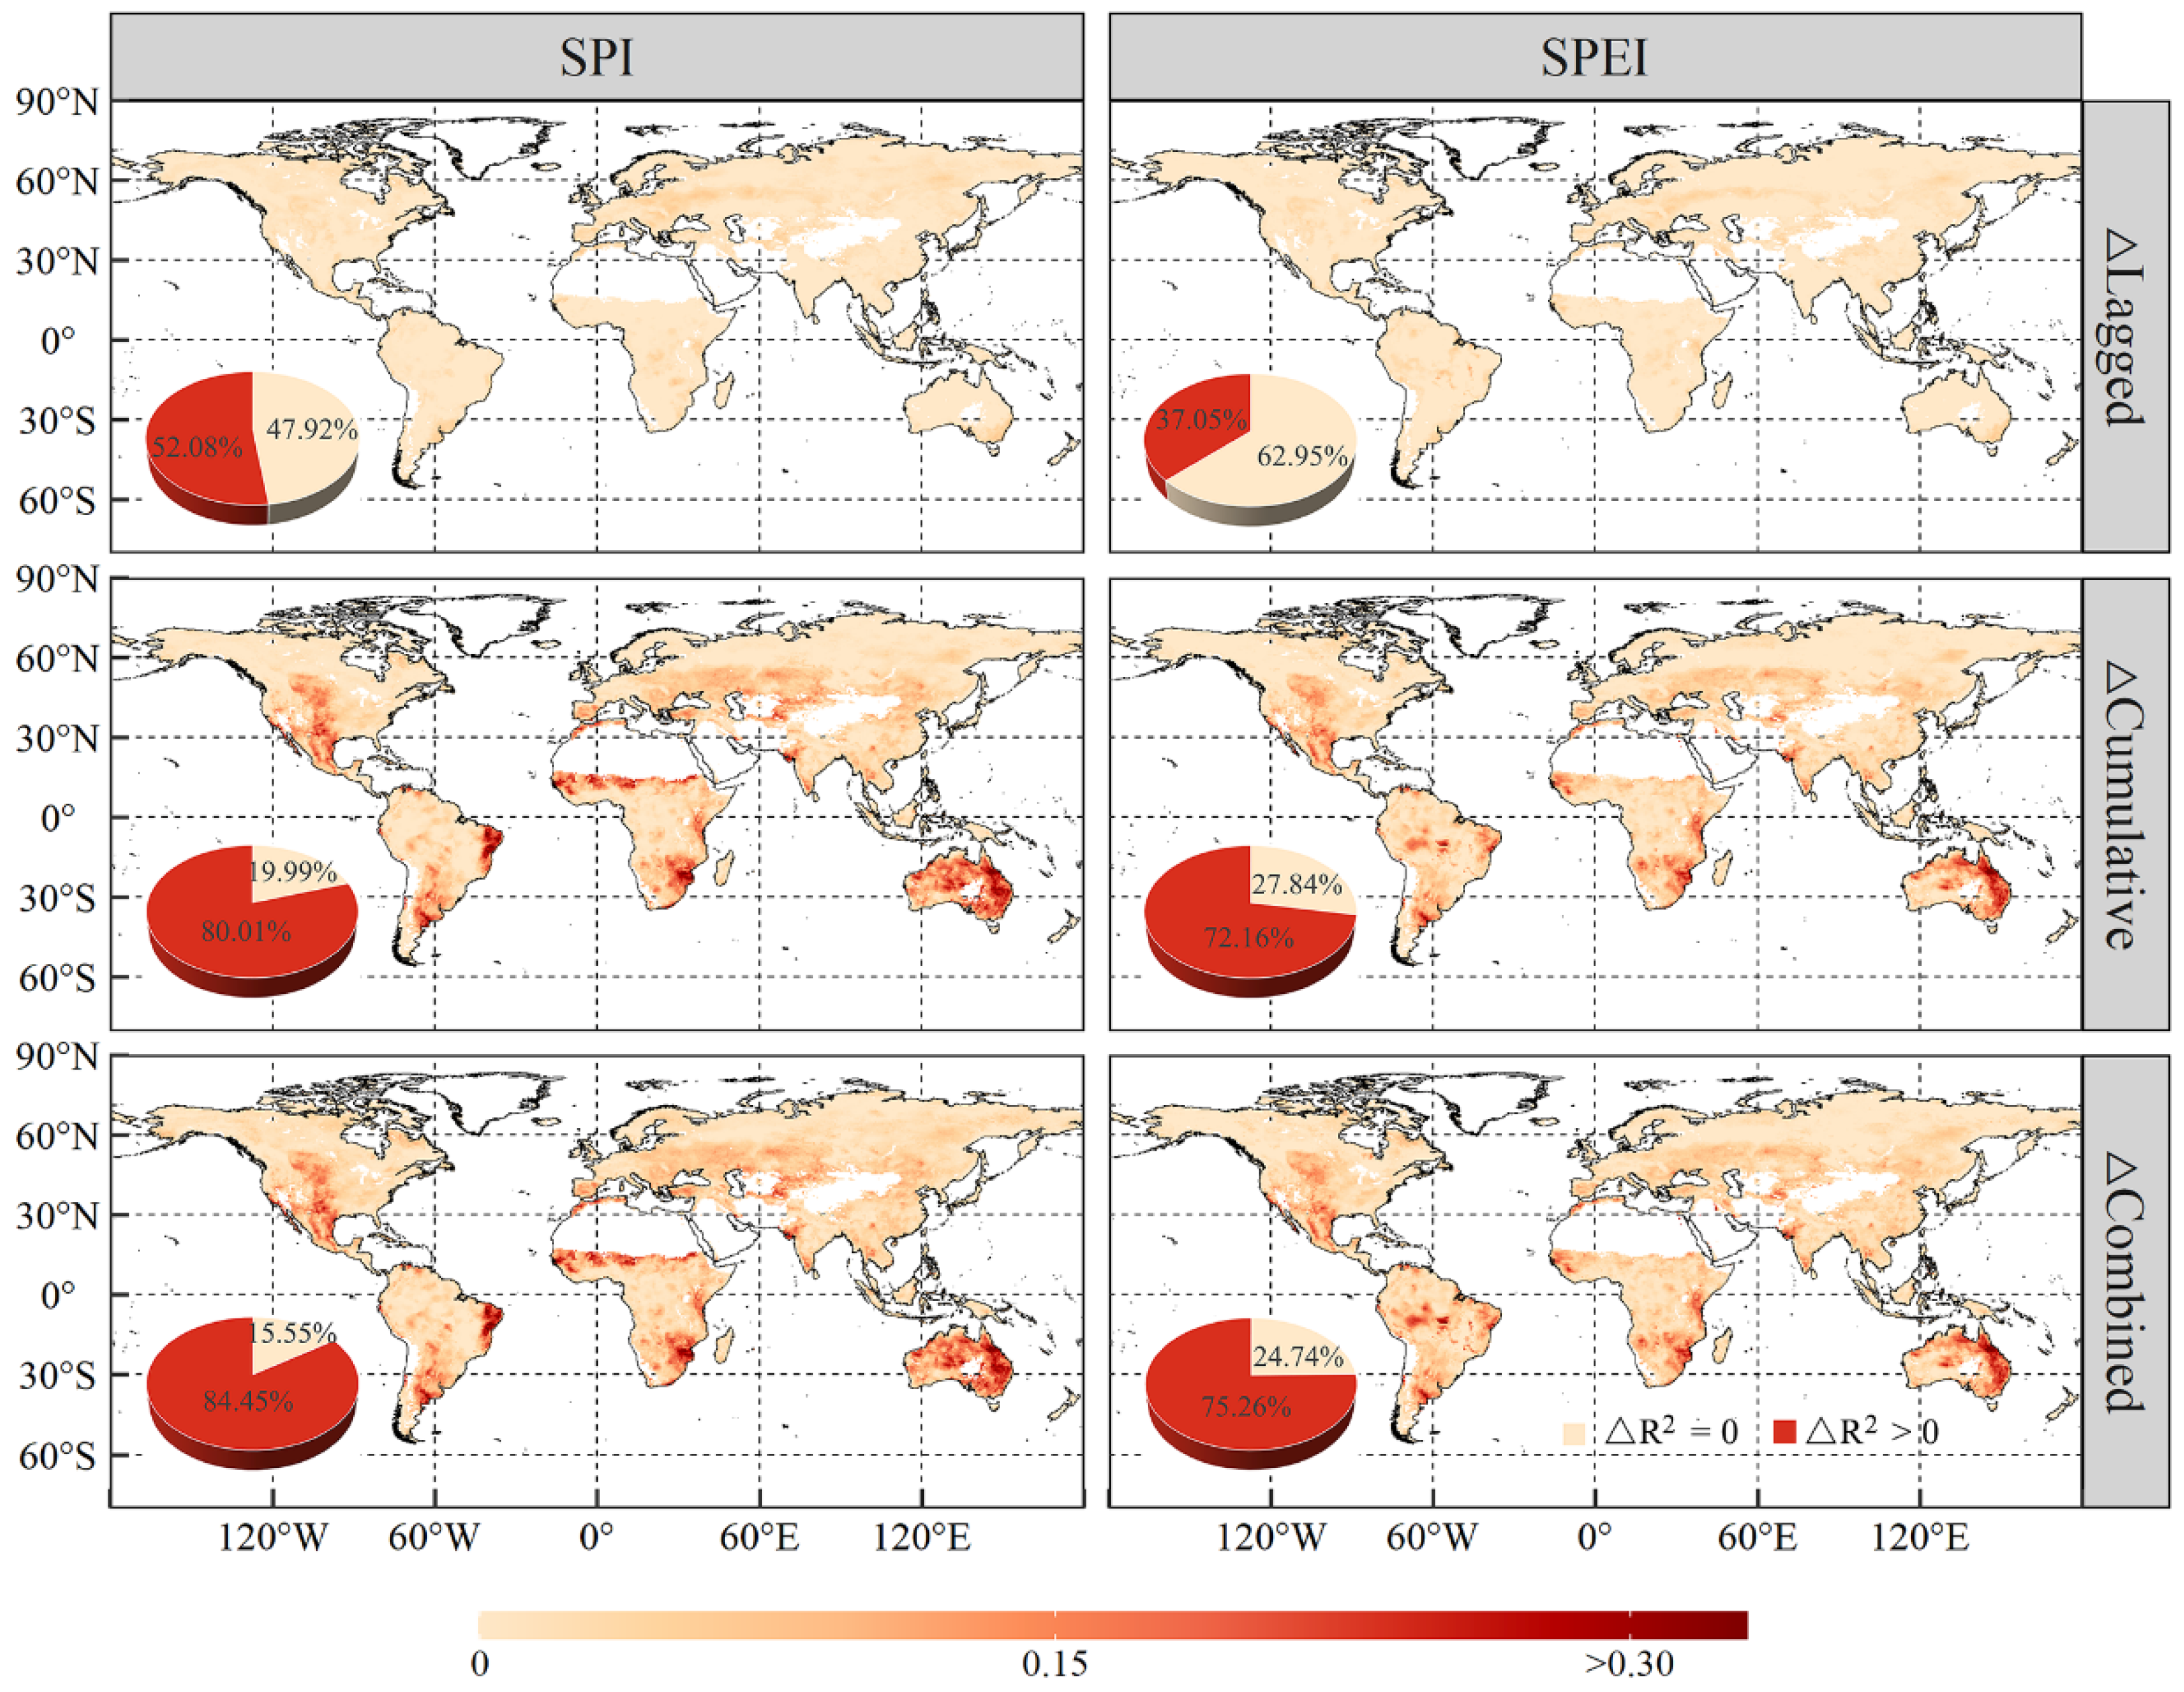
The R2 of the linear regression equation, for the instances when RC_max occurred, was used to quantify the contributions of the different drought indices to the variations in vegetation NPP over the studied period. As shown in Figure S10, the scenario combining lagged and cumulative effects with optimal lagged and cumulative timescales gave higher R2 values than the other three scenarios, further indicating the existence of both lagged and cumulative effects of droughts on global vegetation growth. Approximately 52.08% and 37.05% of the entire global vegetated area were affected by the lagged effects of SPI and SPEI, respectively, being mainly distributed in the low-to-middle-latitude regions; up to 9.48% and 11.98% of the respective vegetation NPP variations could have been underestimated due to the non-consideration of these time lag effects (Figure 5). Meanwhile, cumulative effects occurred in larger percentages of global vegetated areas, with 80.01% and 72.16% of the vegetated pixels experiencing the cumulative effects of SPI and SPEI, respectively. The cumulative effects of SPI and SPEI could also explain, respectively, the additional 6.65% and 5.73% average variations in global vegetation NPP. When combined (lagged and cumulative) effects were considered, it was found that more than three-quarters of the entire global vegetated area (84.45% and 75.26% for SPI and SPEI, respectively) suffered the temporal effects of drought in the study period. Compared to the scenario without temporal effects, the additional contributions of SPI and SPEI to the variations in global vegetation NPP rose to 40.92% and 38.34% under the combined scenario, respectively, with average contribution values of 6.90% and 6.10%, respectively. Notably, the cumulative drought effects were most prevalent in arid and semi-arid areas (e.g., Western America, Africa, Australia, and Central Asia), possibly being associated with the strong tolerance of vegetation to drought in these areas. However, SPI and SPEI did not exhibit any temporal effects on vegetation NPP on a monthly scale in 15.55% and 24.74% of the entire global vegetated area, respectively; the areas without these temporal effects were mainly distributed in the high-latitude regions of the Northern Hemisphere, the northeastern region of South America, and northern India. This suggests that the vegetation in these areas responds to droughts immediately and tolerates droughts poorly. Further, the areas where vegetation NPP was affected—whether without temporal effects, by only lagged effects, by only cumulative effects, or by their combination—were further identified based on the timing of the RC_max occurrence across the four different abovementioned scenarios. For example, if the RC_max attended a lag of 0 but an accumulation exceeding 1, the vegetation in that region was claimed to be influenced solely by the cumulative effects of drought (Figure S11). Notably, the cumulative and combined effects of drought were the most important temporal effects that influenced vegetation NPP at a global level. As shown in Figure S11, 47.64% and 33.90% of the entire global vegetated area exhibited both lagged and cumulative effects orchestrated by SPI and SPEI, respectively, indicating the coexistence of time-lag and cumulative drought effects. In fact, the areas exhibiting only the cumulative effects of SPI and SPEI accounted for 32.37% and 38.27% of the entire global vegetated area, respectively, while the areas exhibiting the lagged effects of both these drought indices did not exceed 5% of the entire global vegetated area.
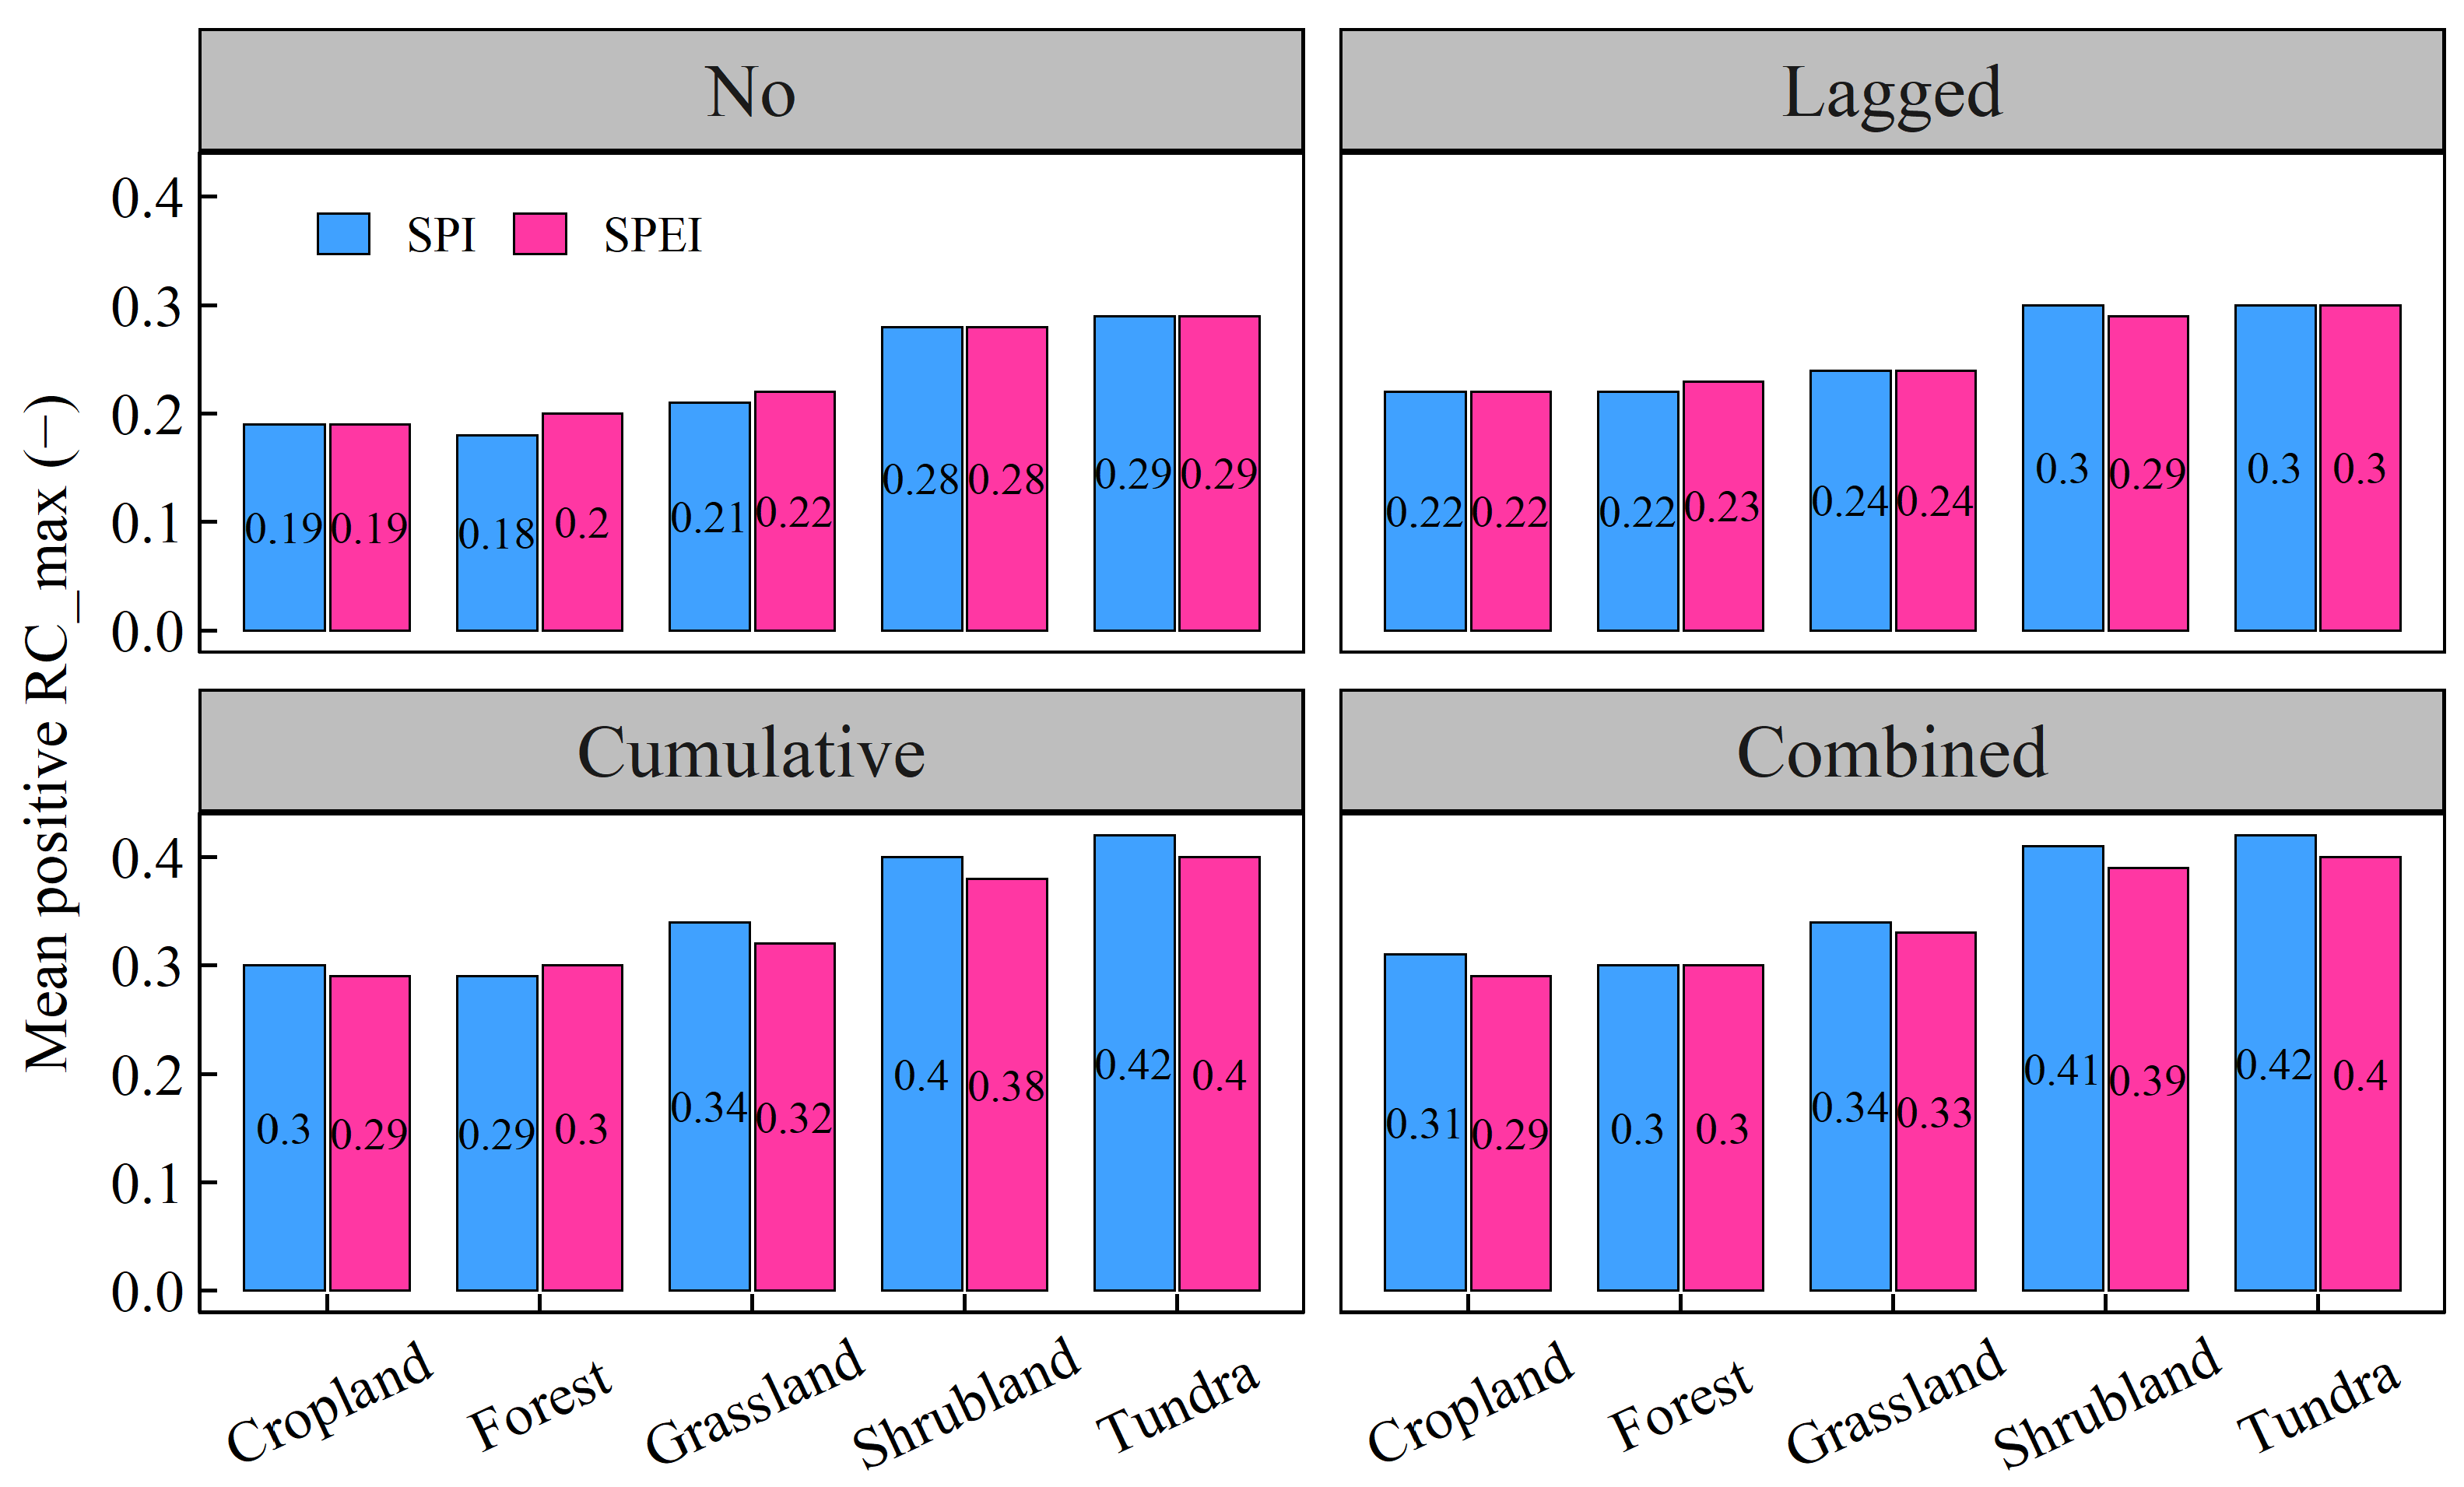
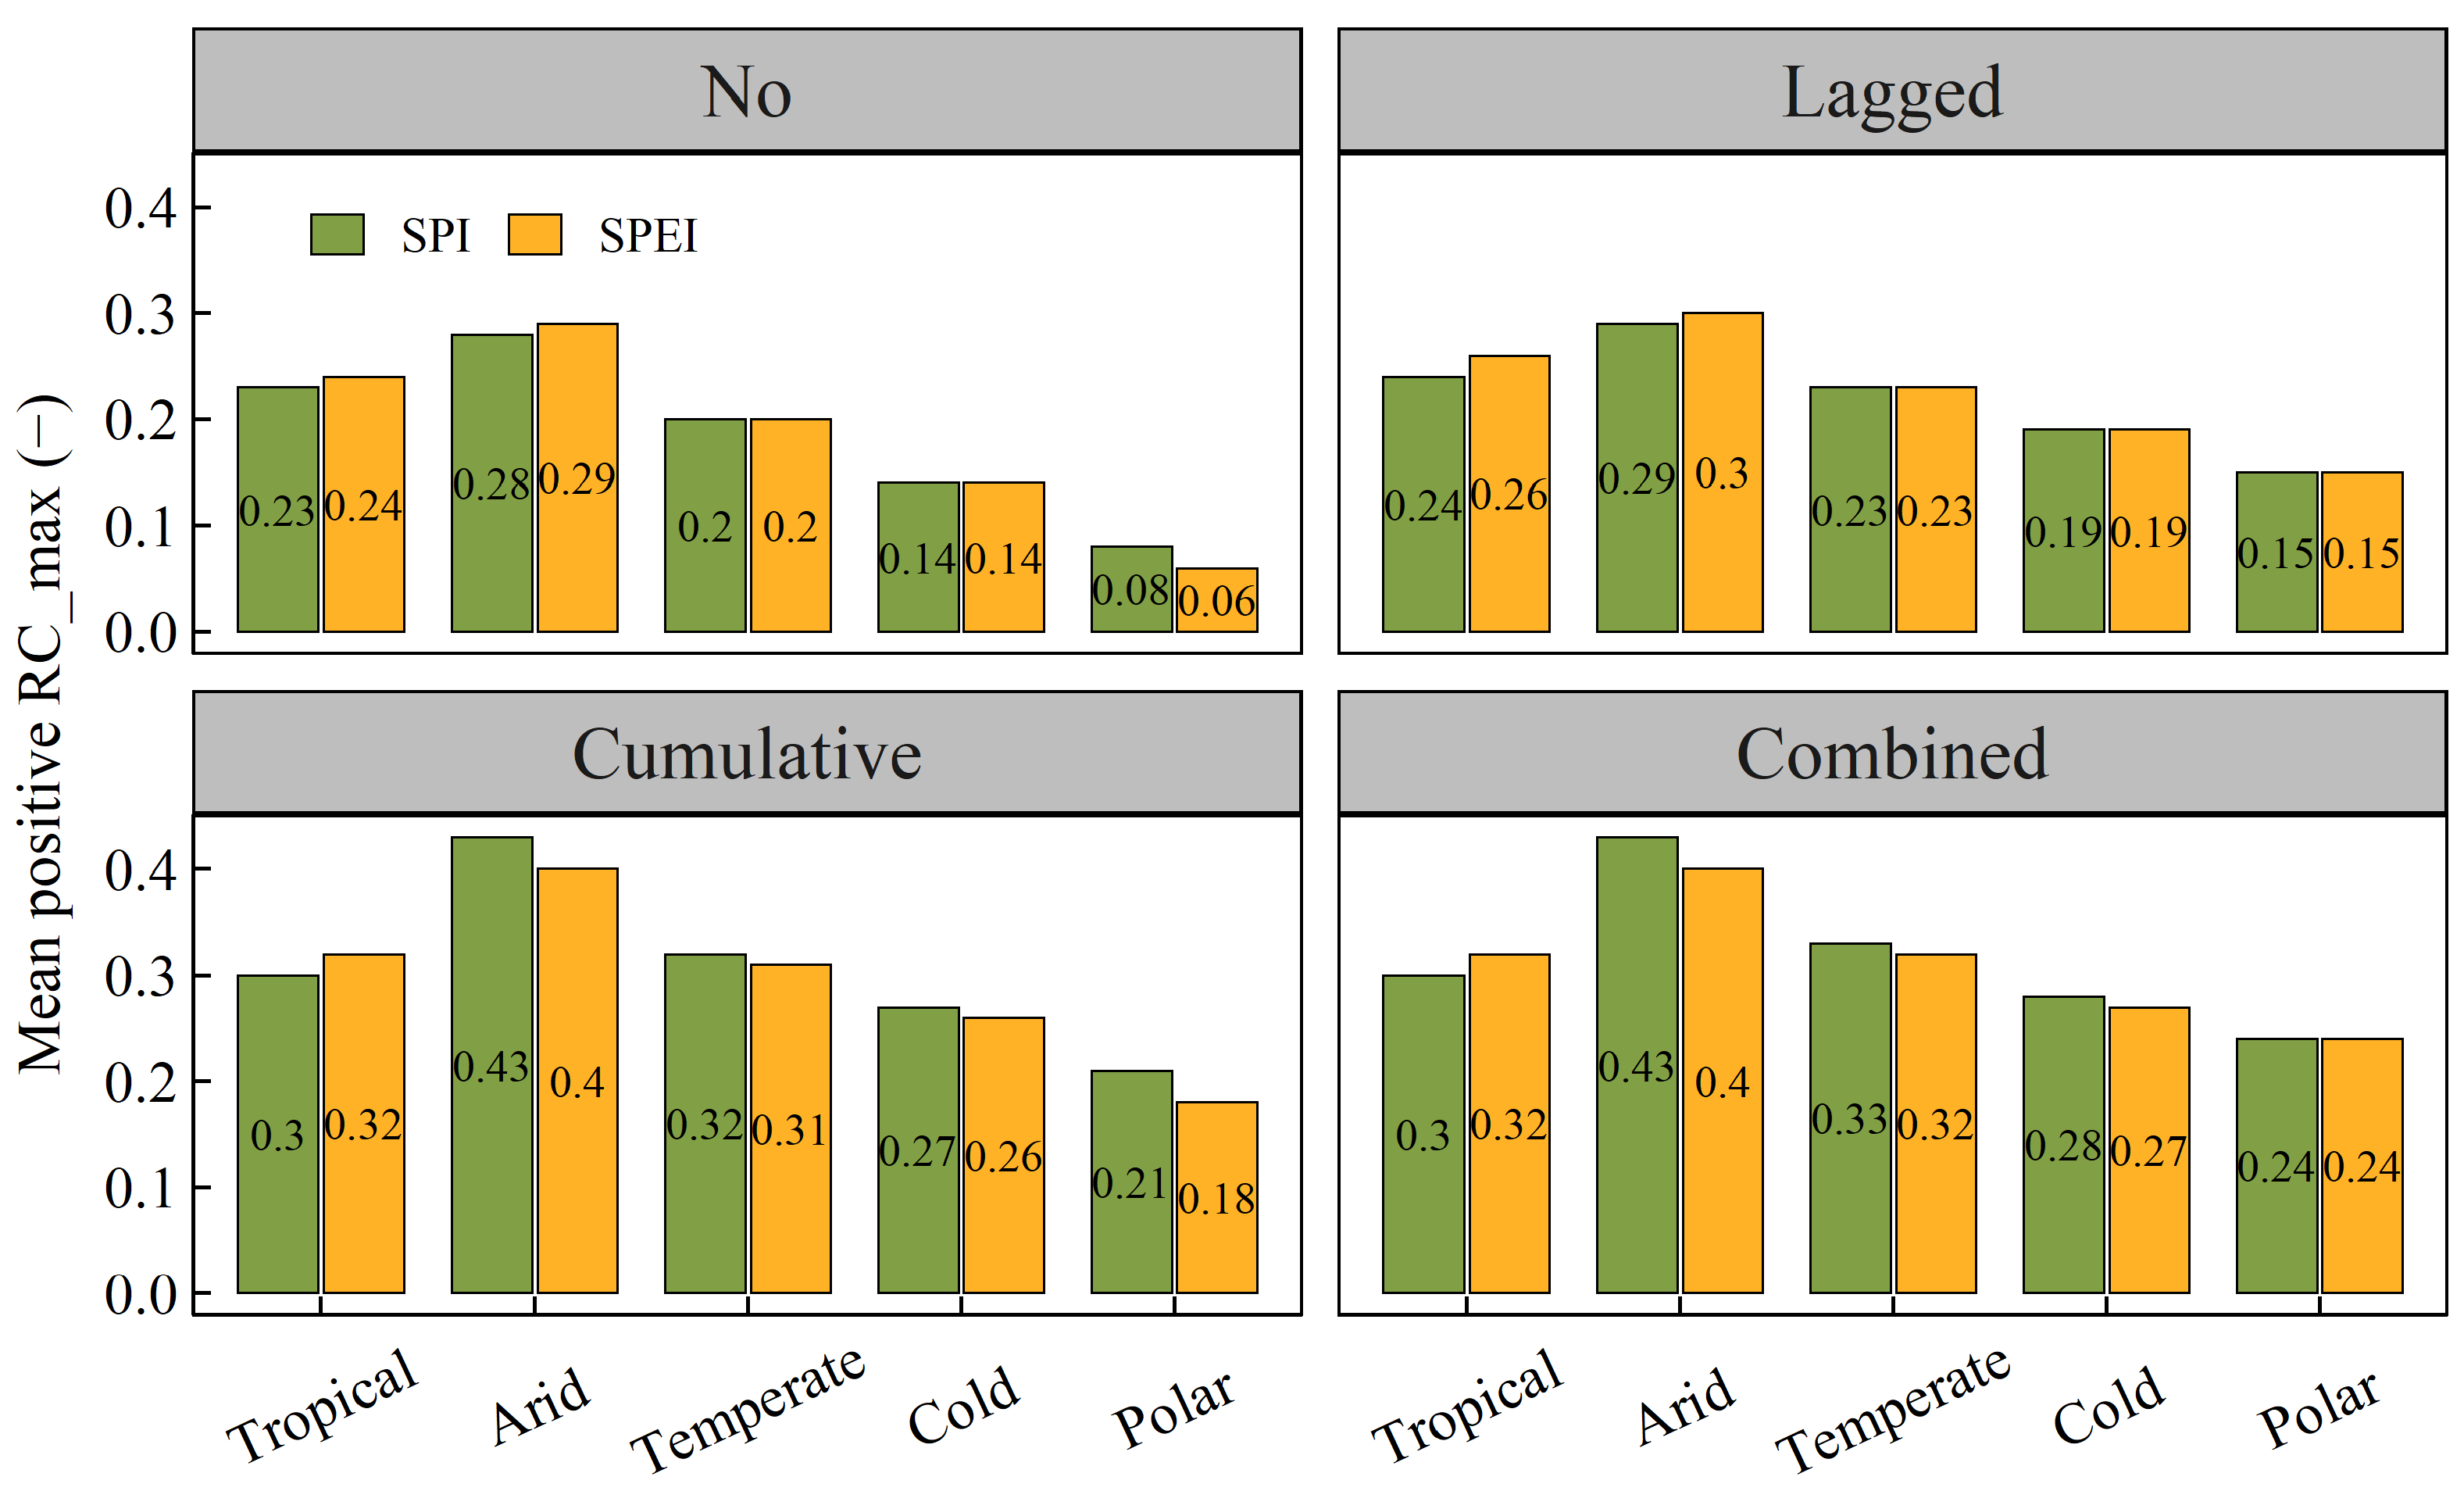
This study also analysed the differences in the relationships between vegetation NPP and the two drought indices among the diverse vegetation types that remained unchanged over the studied period (Figure 6). In general, shrubland was most commonly correlated to these drought indices, giving an average positive RC_max in different scenarios; it was followed by grassland. These vegetation types also differed significantly from the other vegetation types in terms of the statistical distribution of their positive RC_max to both drought indices (Figure S12). Both cropland and forest exhibited similar correlations with SPI and SPEI, with the average positive RC_max of both being nearly identical. Meanwhile, cropland and forest were not significantly different in terms of the statistical distribution of their positive RC_max to SPEI values when no temporal effects were considered or when only lagged effects were considered. Compared to the other vegetation regions, tundra was the least correlated to drought; however, it was not significantly different from the forest category in terms of the positive RC_max of the combined effects of its SPI values. In terms of climate zones, the highest positive RC_max of SPI and SPEI with regard to NPP appeared in arid regions under all four abovementioned scenarios, while the lowest positive RC_max appeared in cold regions (Figure 7). The differences in average positive RC_max among the climate zones were also considered significant, except for those of the cumulative and combined effects of SPEI between temperate and tropical climate zones (Figure S13).

3.3. The Lagged and Cumulative Timescales of Drought Indices to Vegetation NPP

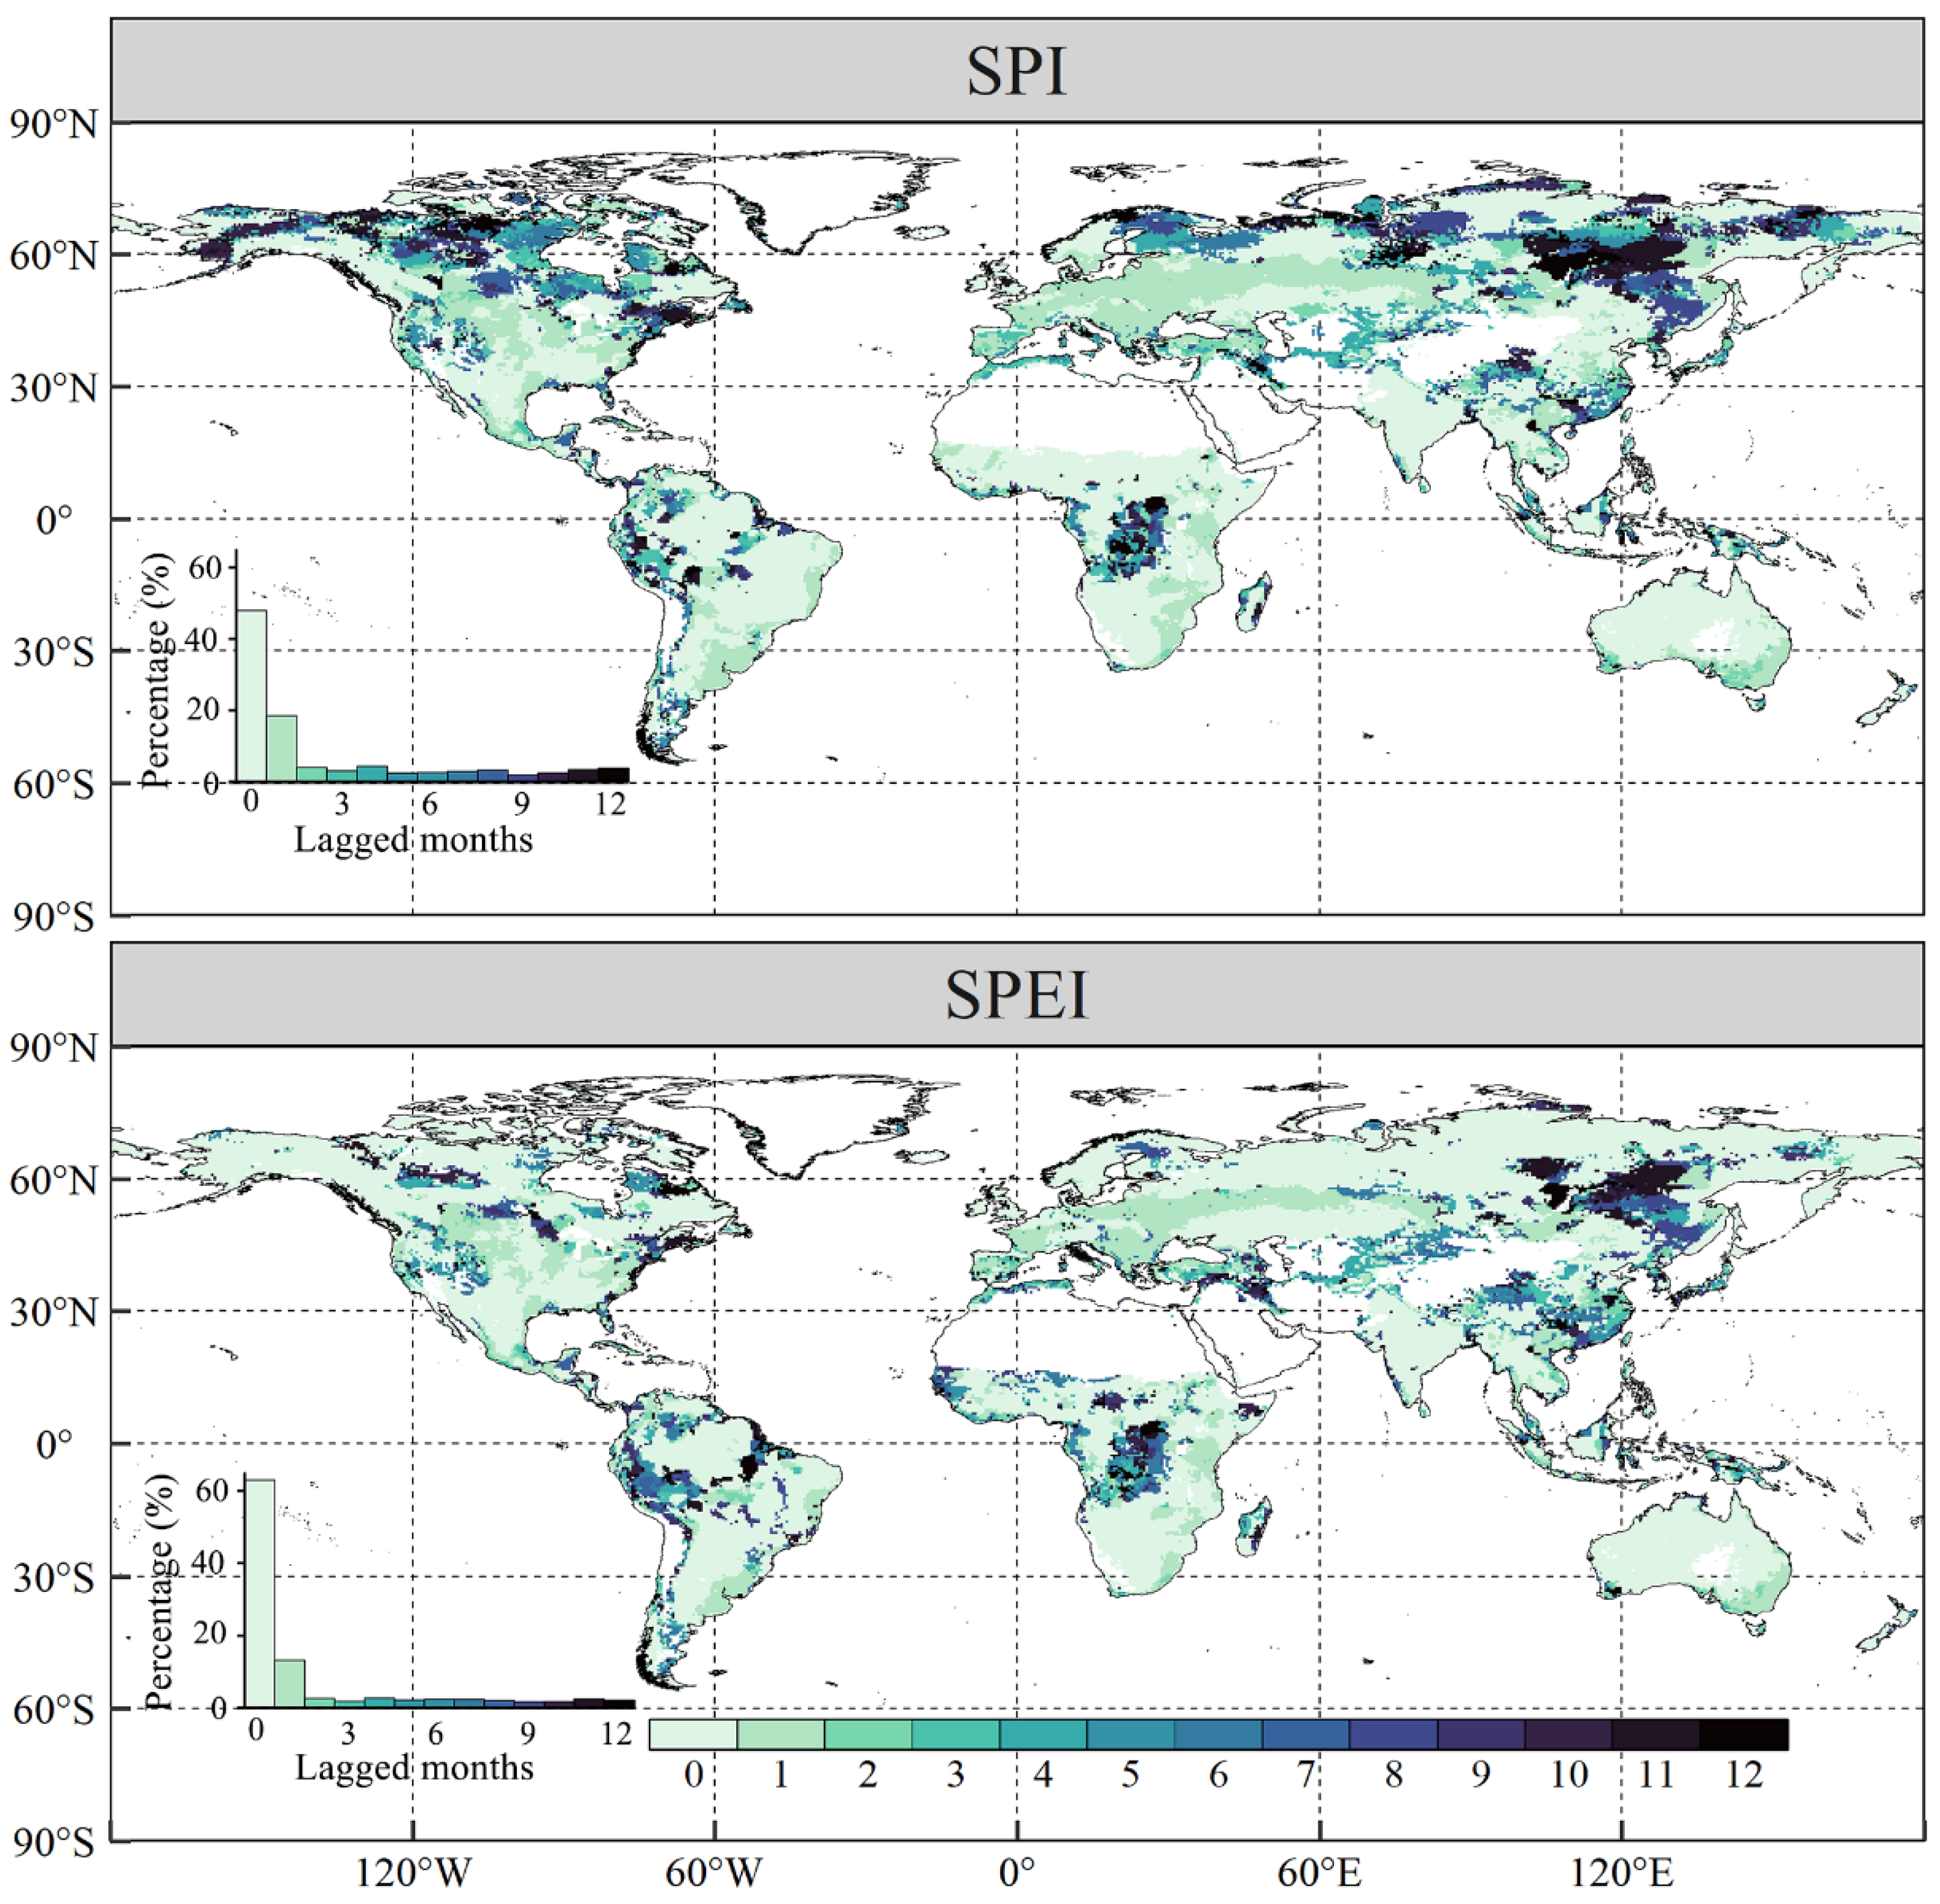
In this study, the lagged timescales of SPI were more pronounced than those of SPEI: the global average time lags of SPI and SPEI were 2.48 and 1.76 months, respectively (Figure 8). This result also implies that climate warming will increase the sensitivity of vegetation to water deficits, consequently reducing the response time of vegetation to drought. Overall, the response of vegetation NPP to the two different drought indices was rapid, with the highest area percentage values appearing at the 0-month timescale, followed by those at the 1-month timescale. The areas without time lags for SPI and SPEI accounted for 47.92% and 62.95% of the entire global vegetated area, respectively, while the areas with 1-month lags regarding SPI and SPEI accounted for 18.45% and 13.18% of the entire global vegetated area, respectively, both of them being mostly distributed in the middle-latitude region of the Northern Hemisphere. The percentages of areas with other lagged timescales ( 2 months) constituted less than 5% of the entire global vegetated area.
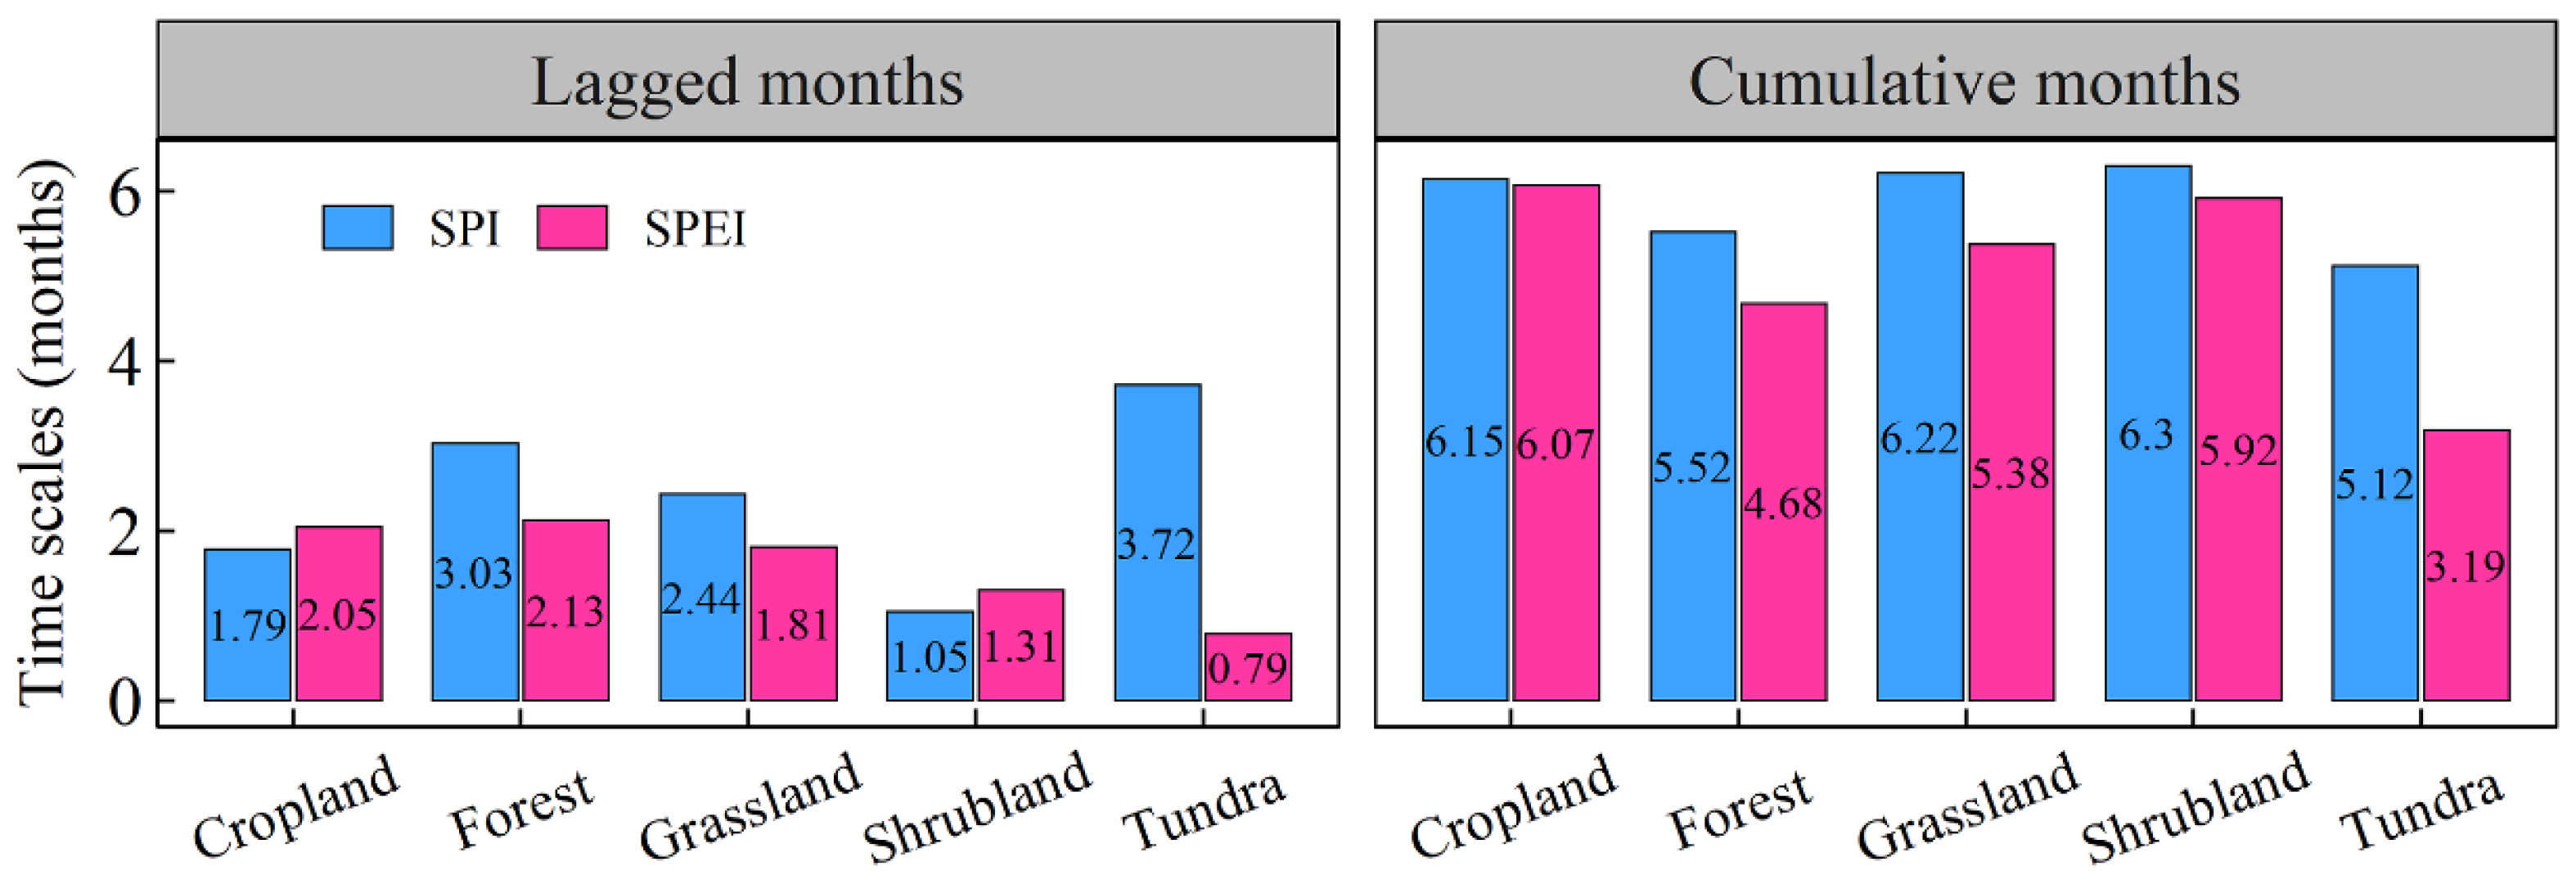
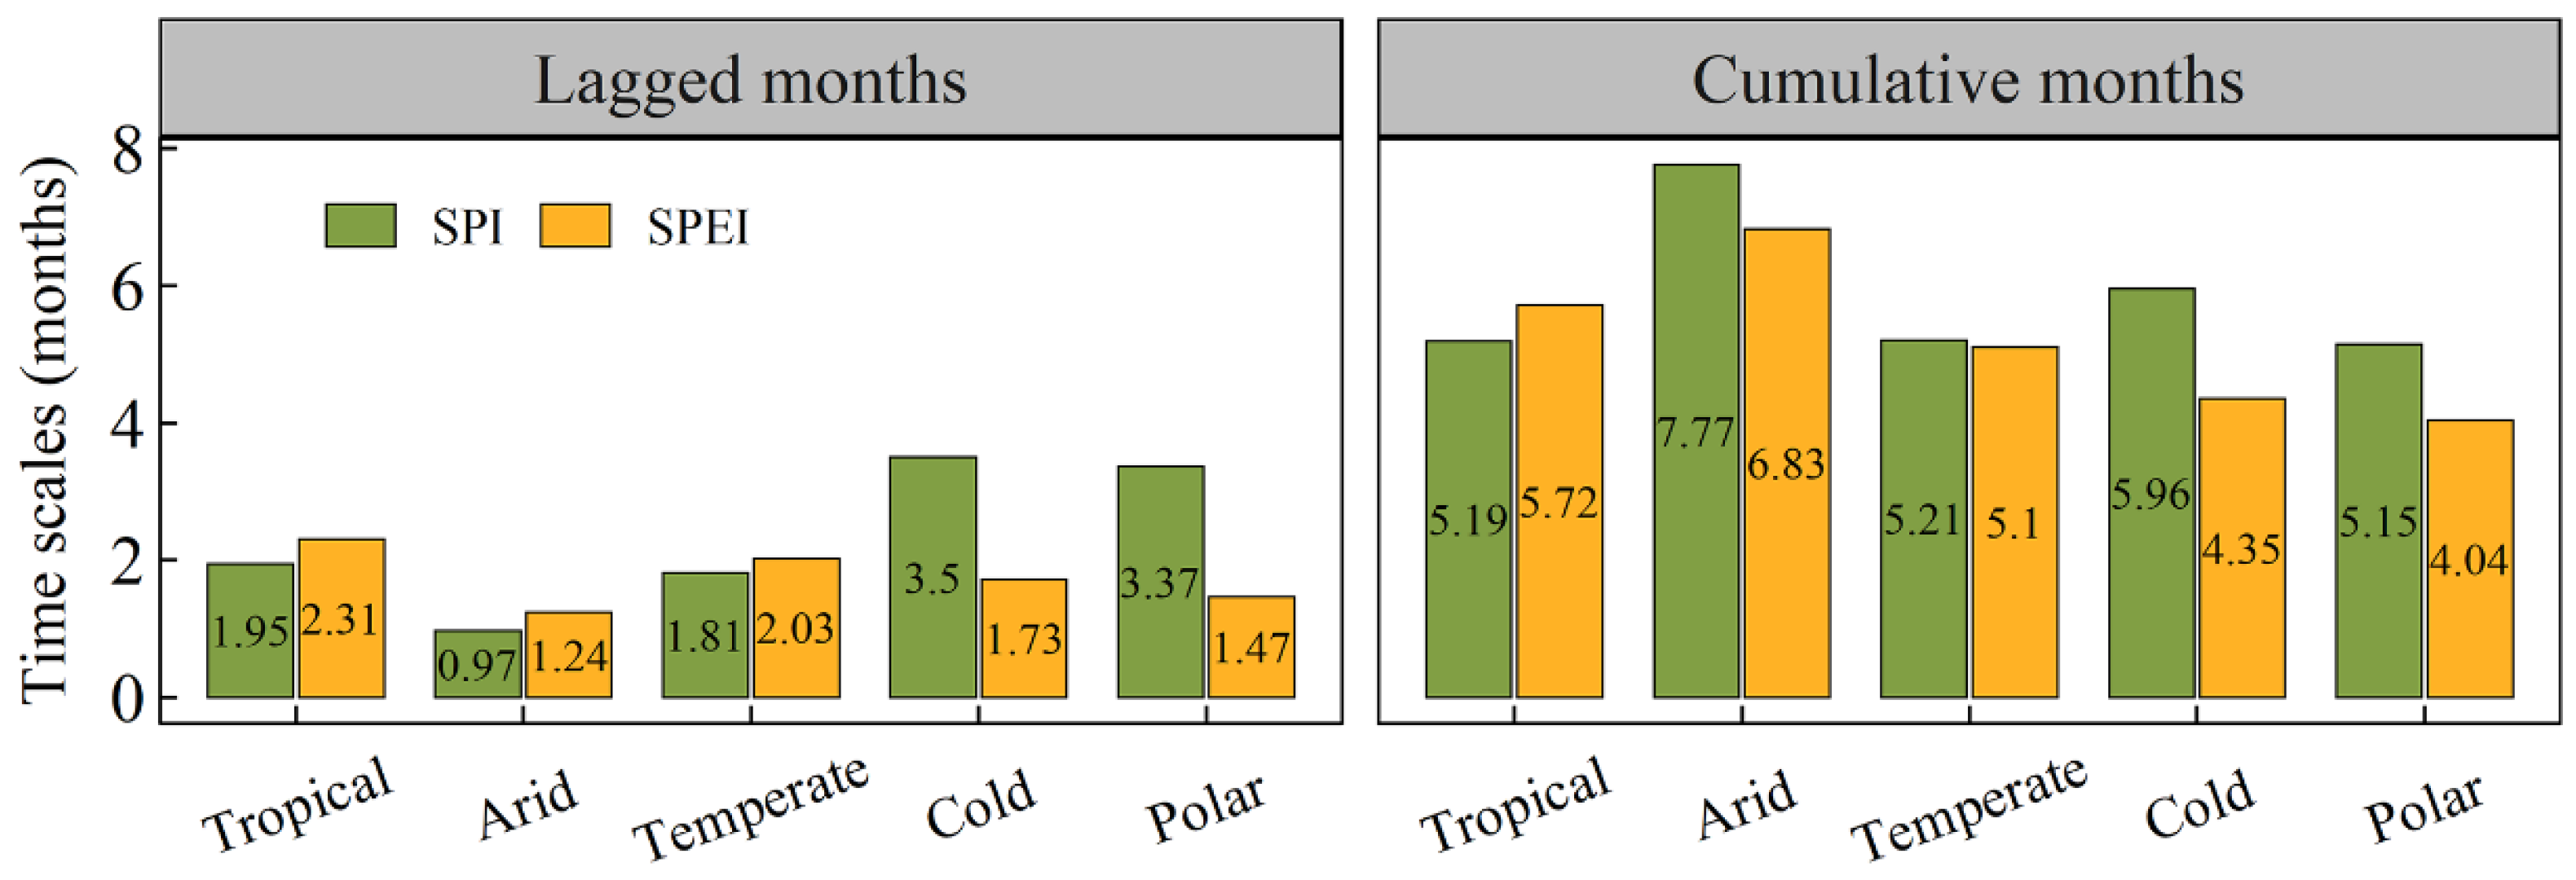
In terms of different vegetation types, tundra had the highest lagged timescales (3.72 months) with regard to SPI, while forest had the highest lagged timescales (2.13 months) with regard to SPEI (Figure 9). The lagged timescales were the lowest in shrubland (1.05 months) regarding SPI and in tundra (0.79 months) with regard to SPEI. After combining the sensitivity intensity (evaluated by RC_max) and lagged timescales of the different vegetation types mentioned above, we noted that the sensitivity intensity of vegetation NPP with respect to the different drought indices was not always inversely proportional to the length of the timescales. In terms of climate zones, vegetation in arid regions responded at the fastest pace to the different drought indices, with average lagged timescales of 0.97 months and 1.24 months regarding SPI and SPEI, respectively (Figure 10), which were clearly lower than the global average lagged timescales. Interestingly, the vegetation NPP in cold and polar climates had relatively longer lagged timescales compared to that in temperate and tropical climates with regard to SPI; the opposite was true with respect to SPEI.
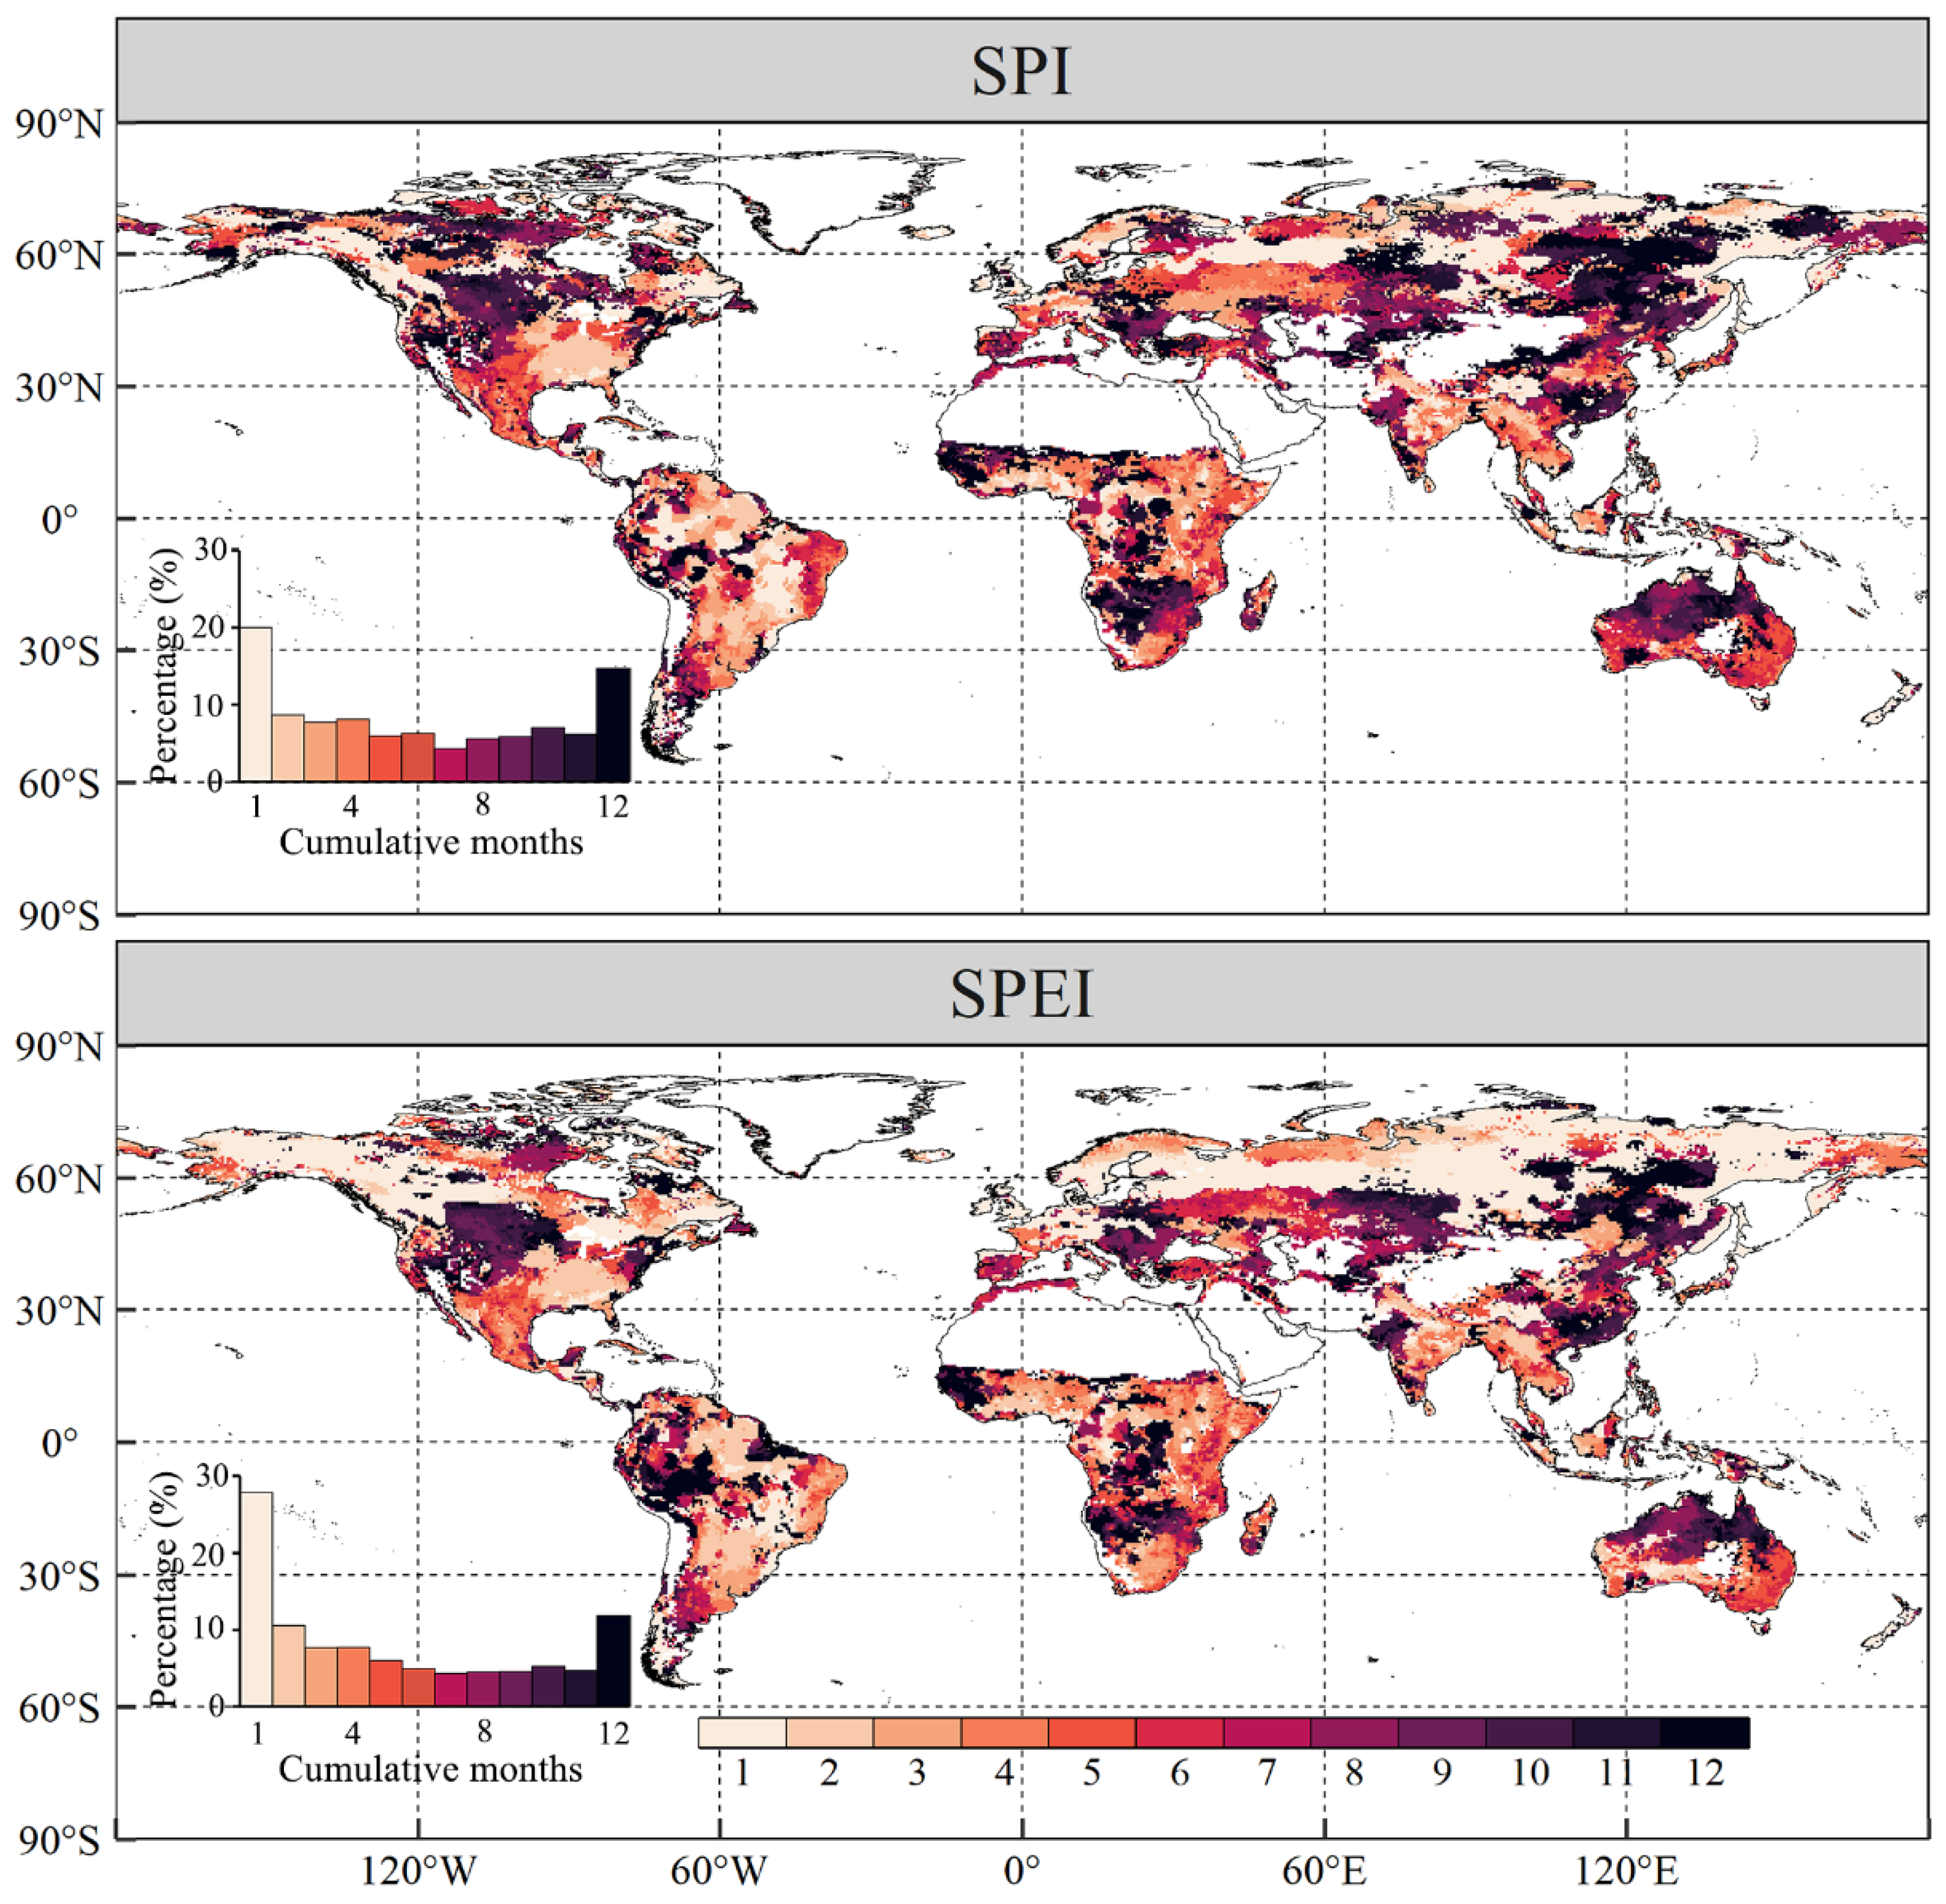
Regarding the cumulative timescales, the global averages of the SPI and SPEI timescales most relevant to vegetation NPP were 5.16 and 5.60 months, respectively (Figure 11). Notably, the spatial distribution of drought cumulative timescales was more heterogeneous than that of the lagged timescales. Generally, the 1-month cumulative effects (without time accumulation) of SPI and SPEI on vegetation NPP were observed in the largest swathes (19.99% and 27.84%, respectively) of the entire global vegetated area, primarily distributed in the high-latitude regions of the Northern Hemisphere where vegetation has a lower tolerance to drought. The 12-month cumulative effects of SPI and SPEI occurred over the second-largest swathes of the entire global vegetated area (14.68% and 11.84%, respectively), followed by the 2-month cumulative effects (affecting 8.65% and 10.58% of the entire global vegetated area, respectively). The other cumulative timescales gave similar global vegetated area percentages that did not exceed 8%. Spatially, the long-term cumulative effects of both drought indices were mainly found in the middle-latitude region (30°–60°N) of the Northern Hemisphere and the low-latitude region (0°–30°S) of the Southern Hemisphere.
Furthermore, we analysed the cumulative timescales of the drought indices among different vegetation areas (Figure 9). We found that the cumulative timescales of SPI among various vegetation areas did not differ significantly: 6.30 months for shrubland, 6.22 months for grassland, 6.15 months for cropland, 5.52 months for forest, and 5.12 months for tundra. In terms of SPEI, cropland involved the maximum cumulative timescales, with an average value of 6.07 months, followed by shrubland (5.92 months), grassland (5.38 months), forest (4.68 months), and tundra (3.19 months). Considering climate zones, the highest cumulative timescales of SPI appeared in arid climates, with an average value of 7.77 months (Figure 10). The average cumulative timescales of SPI among the other four climate zones did not differ significantly, with the differences not exceeding the span of one month (5.15–5.96 months). The highest cumulative timescales of SPEI were also observed in arid climates (6.83 months), followed by tropical climates (5.72 months). For the other three climate zones, the cumulative timescales were generally lower than the global average timescale level, ranging between 4.04 and 5.10 months.

3.4. Differences in Vegetation NPP’s Response to Drought among Diverse Warming-Induced Drought Areas

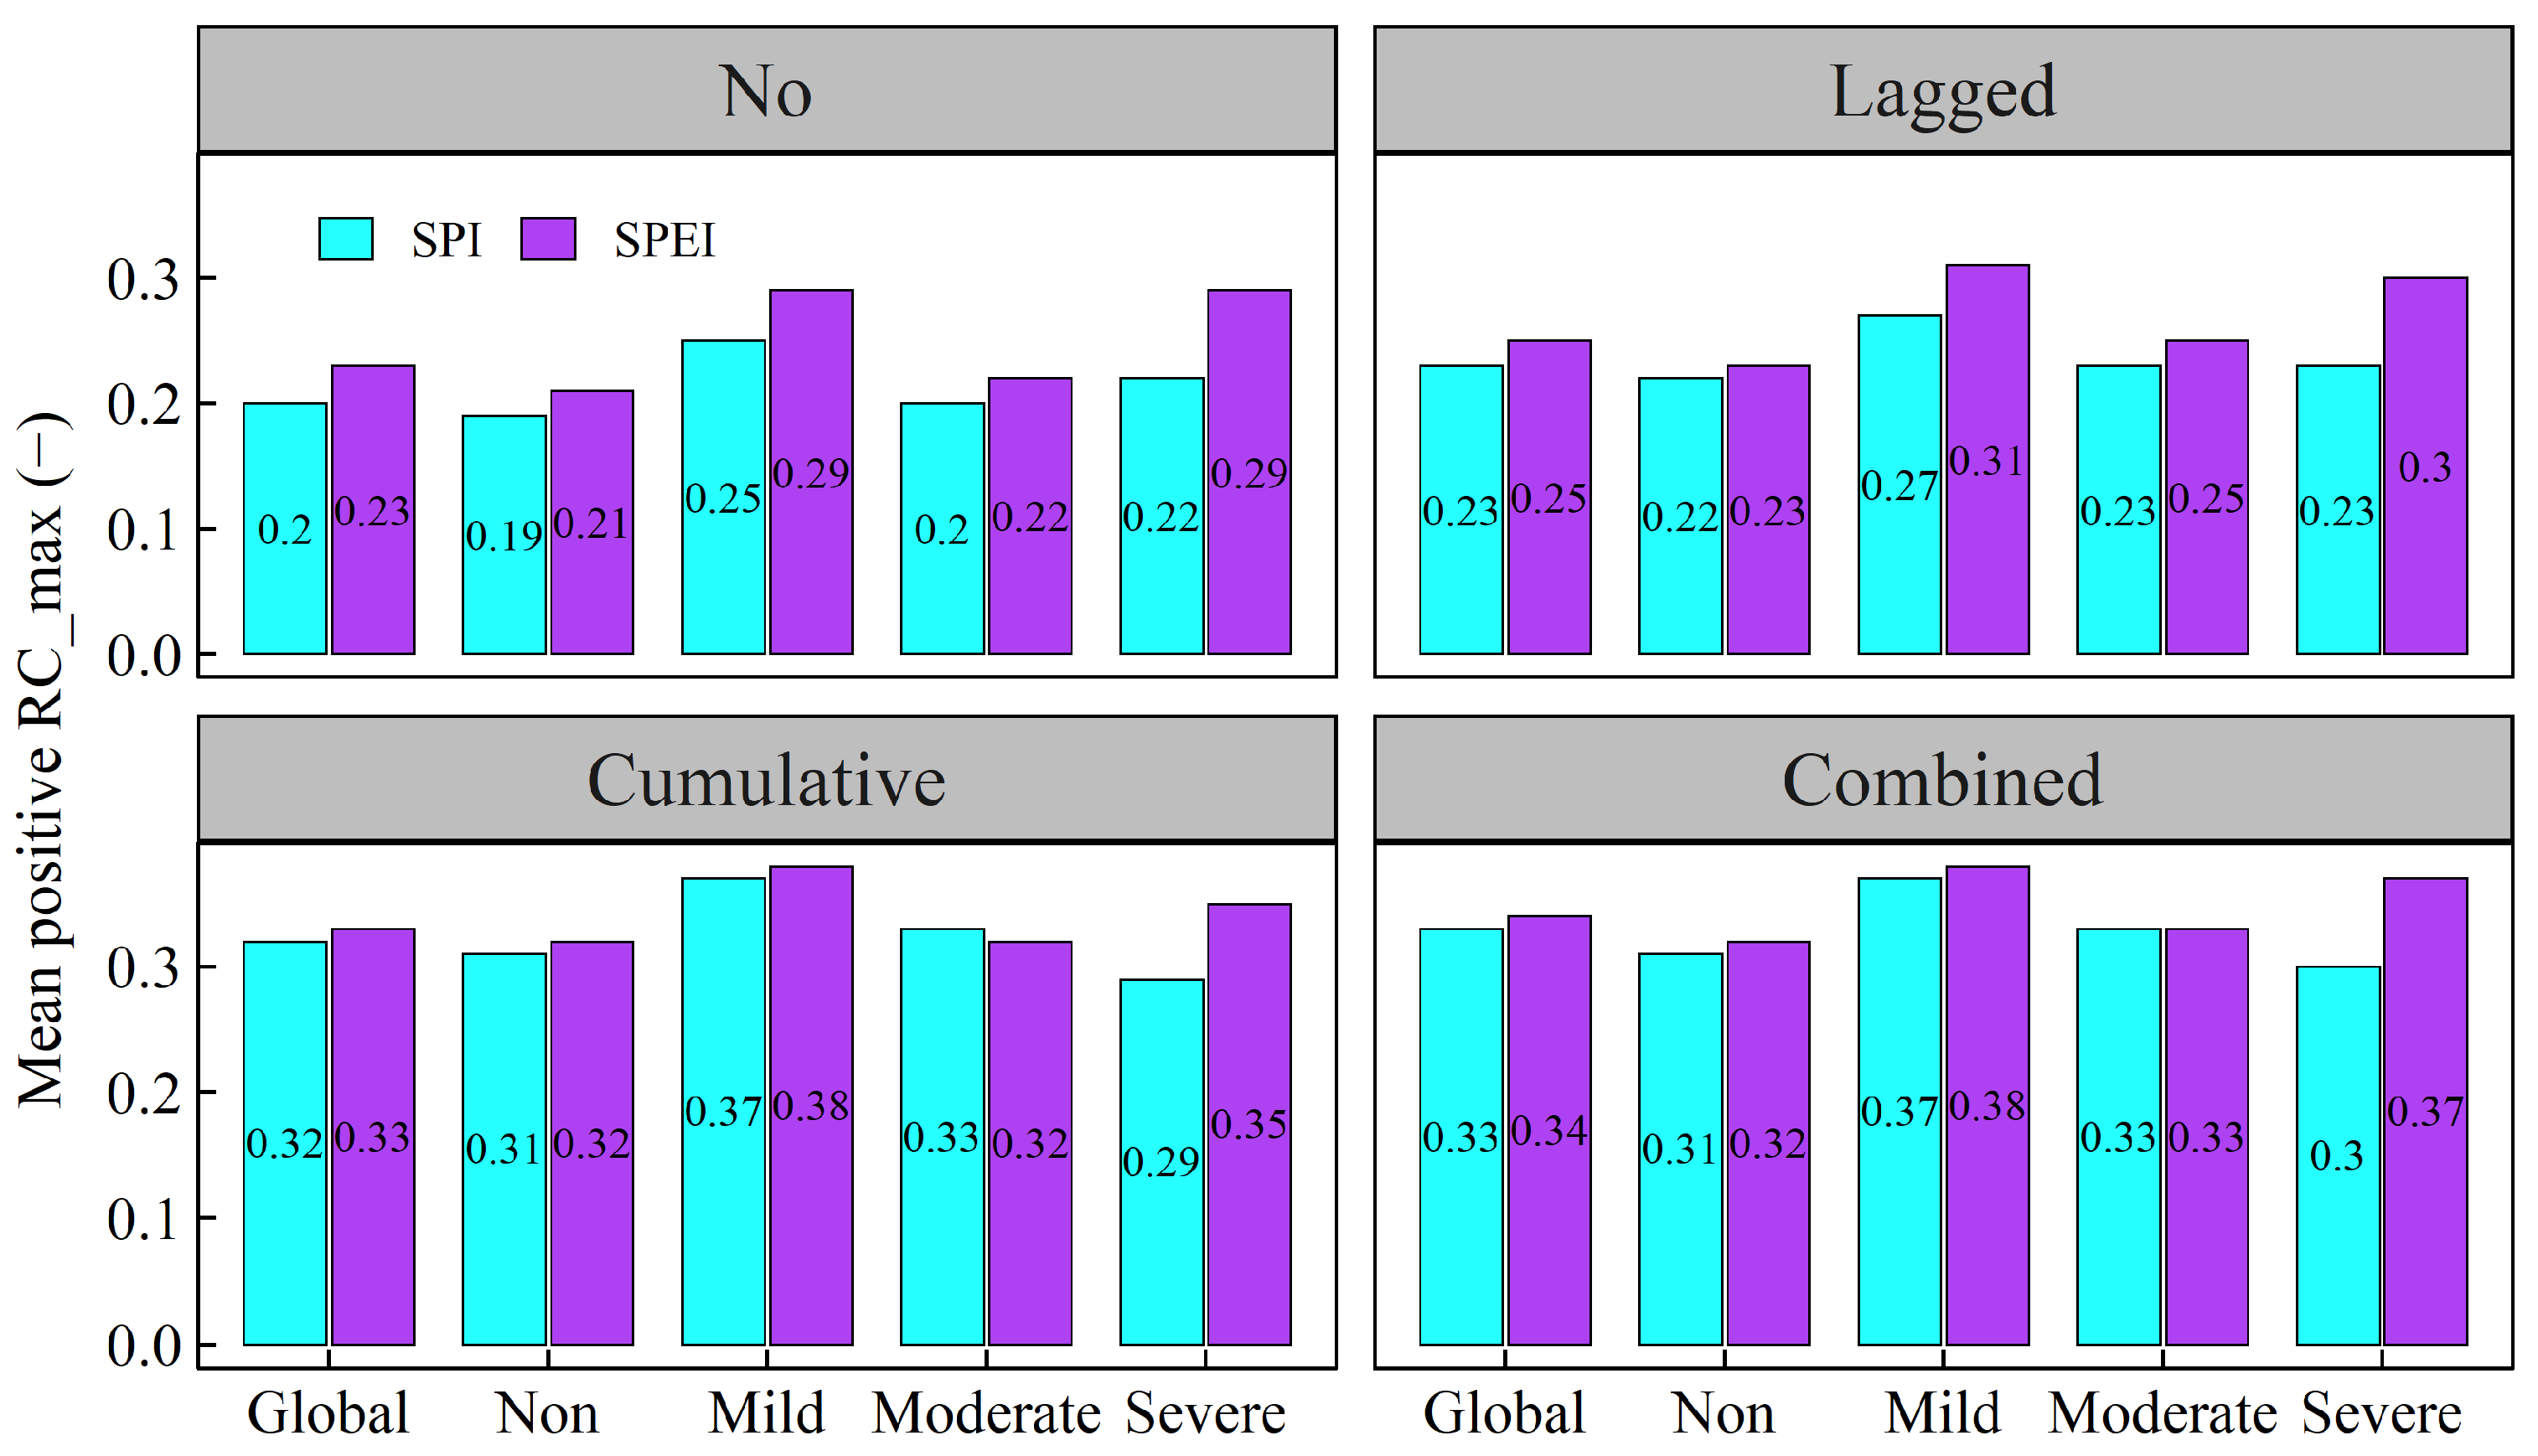
Based on the comparisons of the positive RC_max of vegetation NPP to drought indices among diverse warming-induced drought areas, we elucidated the possible influences of climate warming on vegetation NPP’s response to drought (Figure 12). We found that regardless of whether temporal effects were considered, the average positive RC_max of vegetation NPP with regard to SPI and SPEI was consistently lowest in regions with non-warming-induced drought regions, with the exception of SPI in areas with severe warming-induced drought under the cumulative- and combined-effects scenarios. In particular, the vegetation NPP in areas with mild warming-induced drought had a maximum RC_max with regard to SPEI, followed by the vegetation NPP in areas with severe and moderate warming-induced drought under all four temporal-effects scenarios. The highest correlation between vegetation NPP and SPI also occurred in areas with mild warming-induced drought under all four scenarios. In fact, the mean positive RC_max of vegetation NPP with regard to SPI in areas with severe warming-induced drought was higher than that in areas with moderate warming-induced drought under the scenario without temporal effects, was equal to that in areas with moderate warming-induced drought under the lagged effect scenario, and was lower than that in areas with moderate warming-induced drought under the cumulative- and combined-effects scenarios. These results indicated the following: global warming significantly affects the coupling relationship between drought and vegetation NPP, and the effects of such warming are not monotonic or linear; furthermore, vegetation NPP is more sensitive to SPEI than to SPI. As per this study, at a global average level, the mean positive RC_max of vegetation NPP with regard to SPEI was found to be 0.03 higher than NPP with regard to SPI without temporal effects; this difference decreased under the other three temporal-effects scenarios.
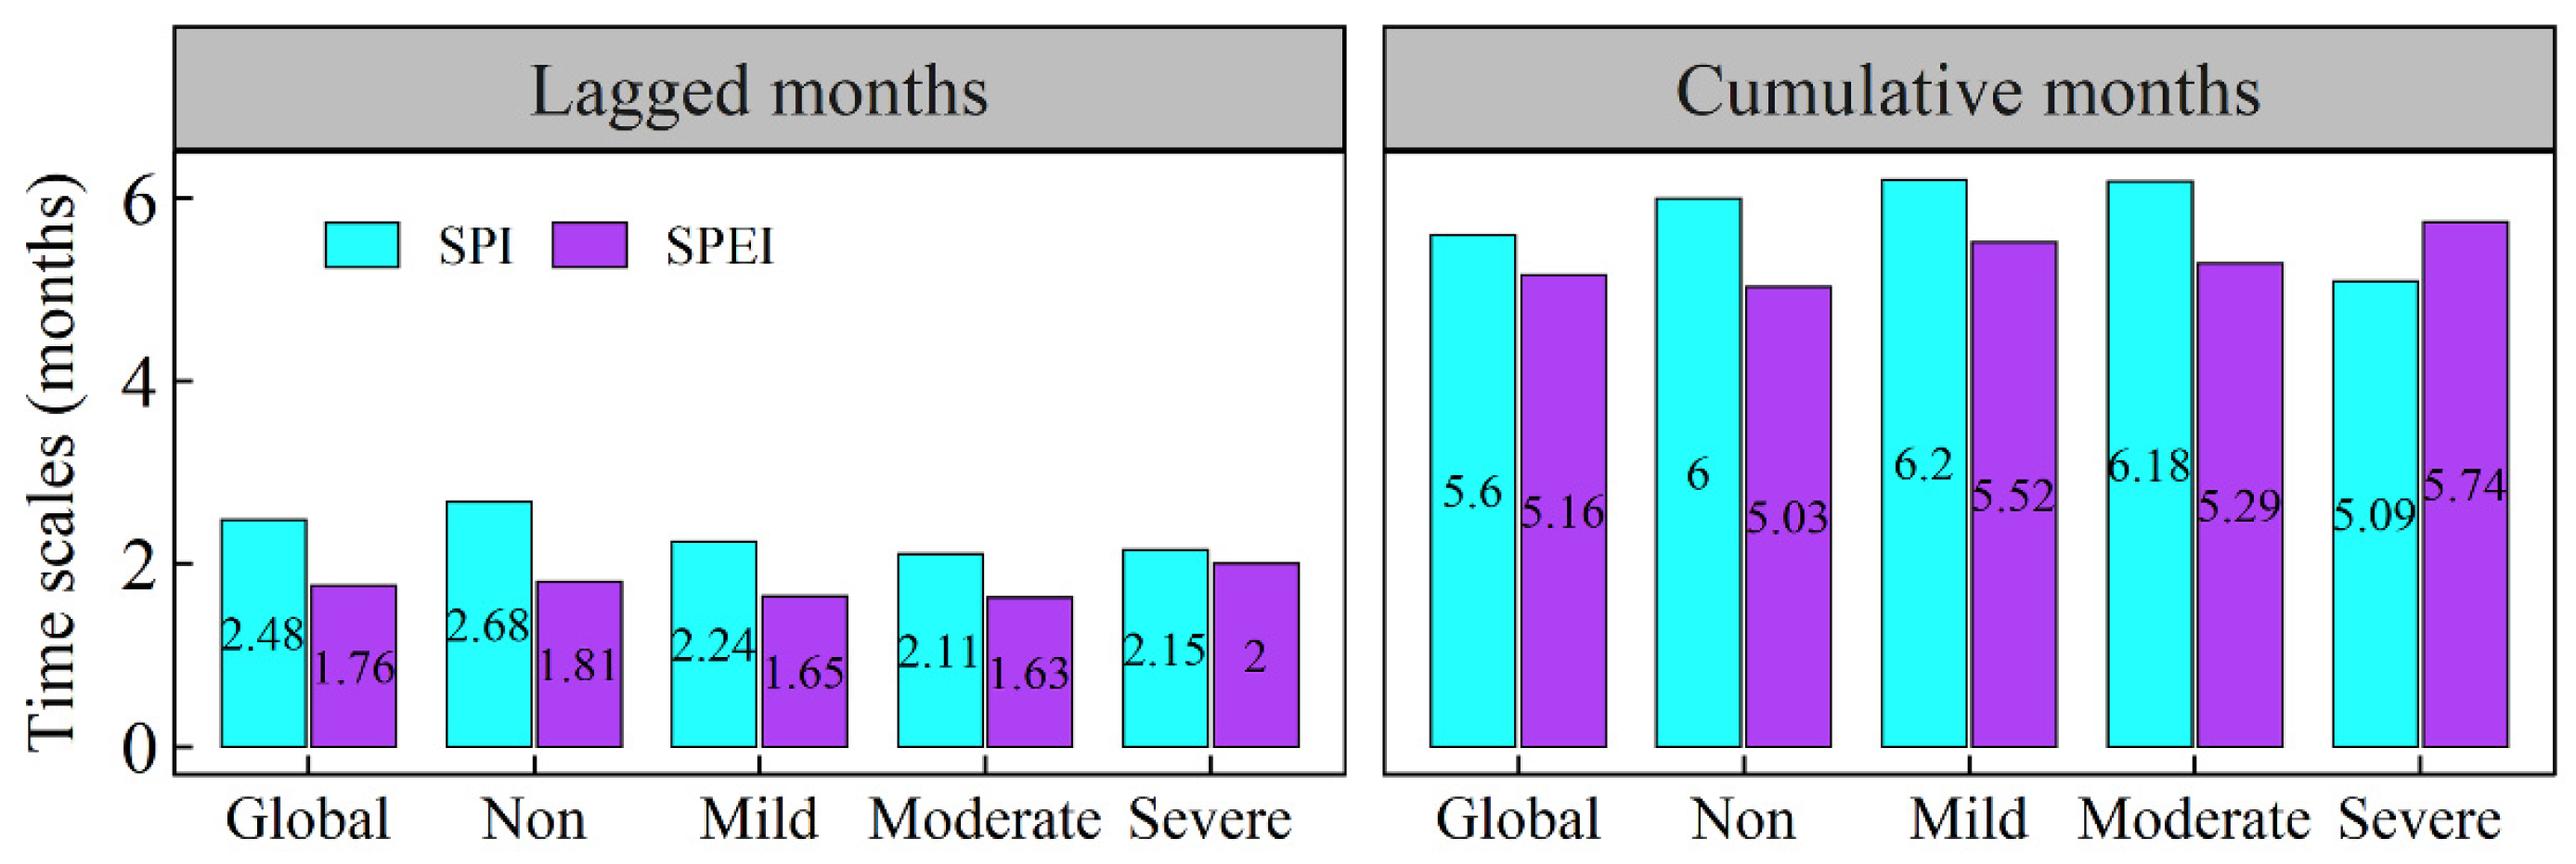
The differences in the optimal lagged and cumulative timescales among areas with varying levels of climate-warming-induced drought (Figure 13) were also investigated in this study. In turn, we found that except for the lagged timescales of SPEI in areas with severe warming-induced drought, warming significantly shortened the lagged times of vegetation NPP’s response to the two drought indices, especially in areas with moderate warming-induced drought. Conversely, the cumulative timescales of both SPI and SPEI, except those of SPI in areas with severe warming-induced drought, were clearly extended due to climate warming. More specifically, the cumulative timescales of SPI were most significantly prolonged in areas with mild warming-induced drought (6.20 months), followed by areas with moderate warming-induced drought (6.18 months). Regarding SPEI, however, it was found that areas with severe warming-induced drought had the highest cumulative timescales (5.74 months), followed by areas with mild (5.52 months) and moderate (5.29 months) warming-induced drought.

4. Discussion

4.1. The Temporal Effects of Drought on Global Vegetation NPP

Over the past 37 years, significant variations in global vegetation productivity have occurred. Over these years, regions with increases in vegetation NPP have accounted for 79.48% of the entire global vegetated area, while regions with decreases in vegetation NPP have come to comprise 20.52% of the entire global vegetated area, the latter being primarily located in the world’s equatorial regions. These results have confirmed the consensus that vegetation greenness has been increasing globally since the 1980s [40]. Given that drought has been shown to extensively and profoundly influence vegetation growth [7,26], this study advanced an analysis of the drought–vegetation coupling relationship by considering the lagged, cumulative, as well as combined effects of drought on vegetation NPP. We found that both SPI and SPEI contributed most significantly to variations in vegetation NPP when the combined effects of drought were considered, as compared to situations when the lagged or cumulative effects of drought were examined separately or when no temporal effects of drought were taken into account. Notably, when considering the temporal effects of drought, the areas exhibiting negative correlations between vegetation NPP and the drought indices decreased significantly in terms of proportion. Therefore, the findings of the current study highlight the asymmetric relationships between vegetation productivity and drought indices with regard to temporal effects [3,41].
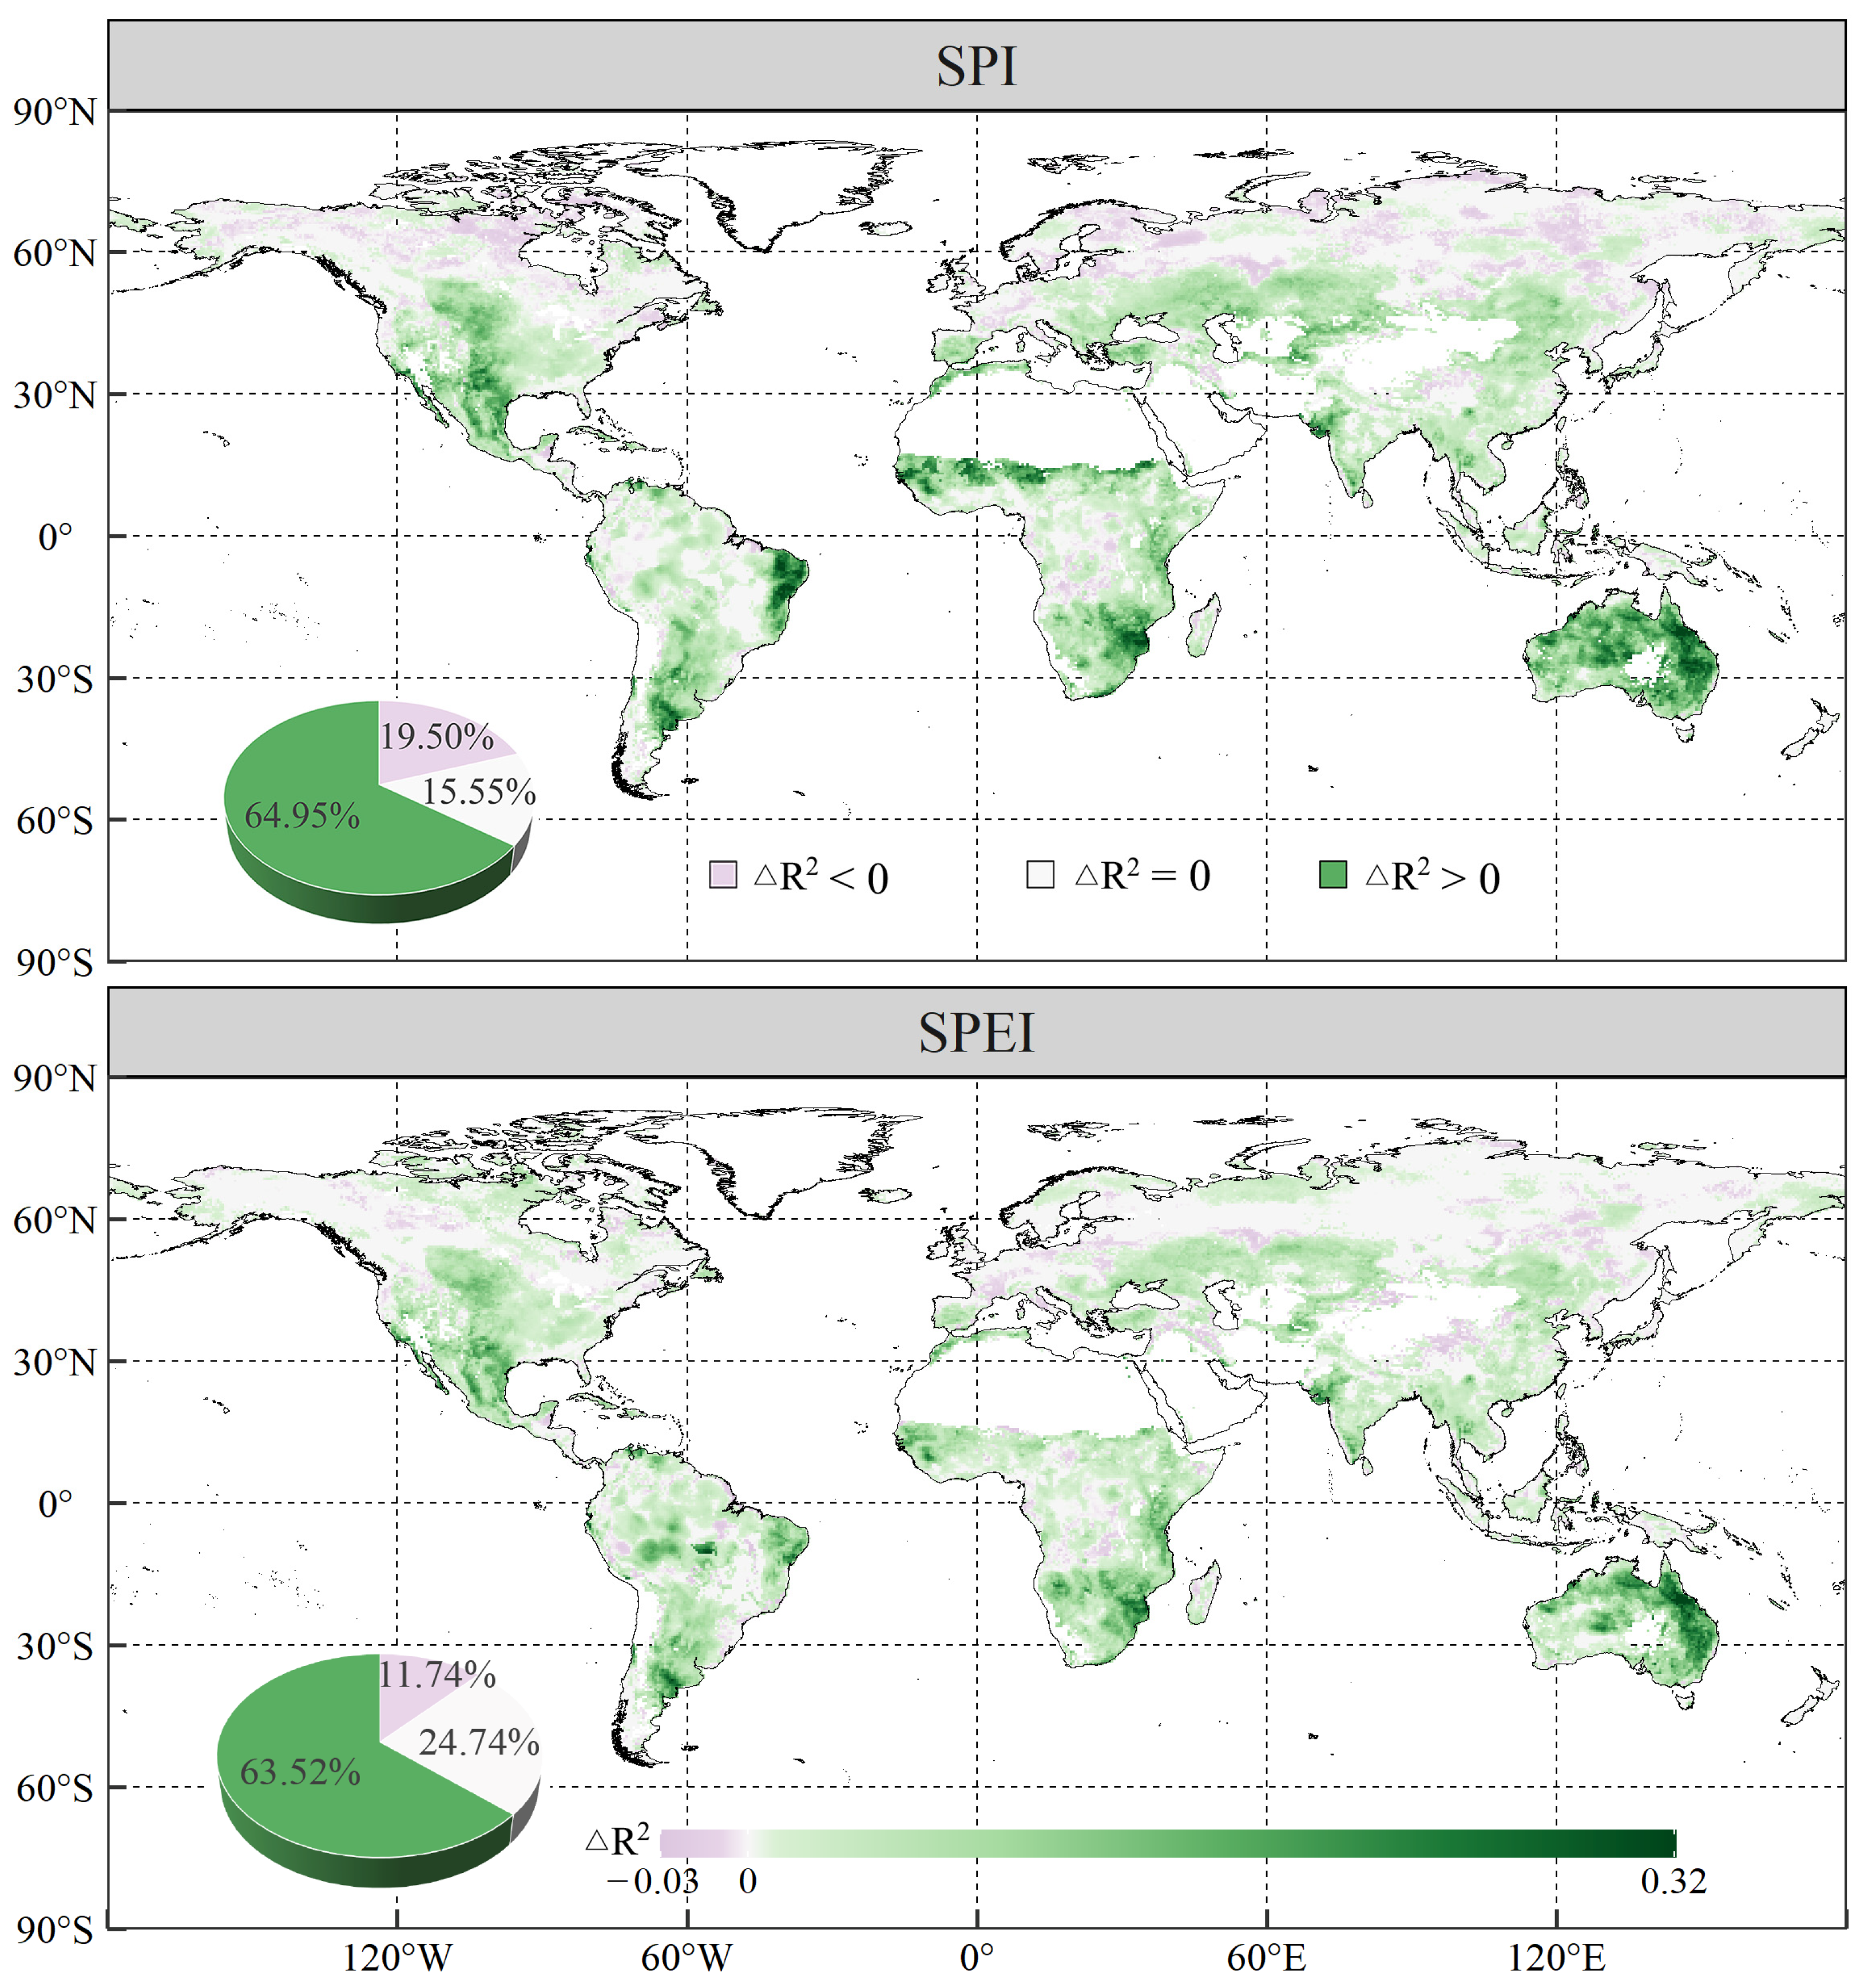
We also compared the lagged and cumulative effects of SPI and SPEI on global vegetation NPP (Figure 14), finding that the cumulative effects of both drought indices were stronger than their lagged effects in 64.95% and 63.52% of the entire global vegetated area, respectively. Numerous studies have hitherto compared the lagged and cumulative effects of drought on vegetation [7,10,42,43]. For instance, Wei et al. [7] pointed out that the cumulative effect of SPEI is stronger than its lagged effect in 74.83% of global grassland areas, while Yang et al. [43] found that the cumulative effect of drought is stronger than its lagged effect in 86.75% of the Central Asia region. Our results align with these recent findings. A possible explanation for the abovementioned phenomenon is straightforward: the effects of drought on vegetation growth can persist for several months [26]. The lagged effects of drought consider only the drought conditions at a specific month in the previous period, whereas the cumulative effects reflect the continuous impact of drought conditions over successive periods, from beginning to end [7,44]. Thus, as per our study, the areas where the lagged effects of SPI and SPEI were greater than or equal to their cumulative effects were primarily located in the high-latitude regions of the Northern Hemisphere, respectively accounting for 35.05% and 36.48% of the entire global vegetated area; additionally, we observed that global vegetation NPP predominantly exhibited a negative response to drought (Figure 4). These cold high-latitude regions are mainly covered by forest and tundra, characterised by abundant soil moisture and low temperatures; here, one must consider that thermal conditions are the most crucial limiting factor with regard to cold-land vegetation growth, which is less influenced by the cumulative effects of drought [45,46]. Furthermore, increased cloudiness in these cold regions reduces solar radiation, while precipitation lowers daytime temperatures by increasing evaporation, converting part of the incoming radiation into latent heat over time. These factors inhibit vegetation photosynthesis and significantly limit vegetation carbon sequestration [26,47].
According to our findings, 47.92% and 63.01% of the global vegetated area were generally not affected by the lagged effects of SPI and SPEI, respectively, on a monthly level. In fact, the dominant lagged timescales of both drought indices were primarily short (less than three months), confirming that vegetation activity generally responds quickly to drought [7]. However, the optimal response of vegetation NPP to SPI occurred at long-term time lags (7–12 months) in tropical areas near the equator (especially in the Congo and Peru), and in Central Eurasia at latitudes around 60°N. Forests, the main vegetation type in these areas, possess deep rooting systems and a high water storage capacity [3]. Consequently, they demonstrate low sensitivity to drought conditions and prolonged response times [27]. Regarding specific climatic conditions, we observe that soil moisture in the tropical rain belt is typically sufficient. Even if droughts occur here, a certain amount of soil moisture may still be available for plant growth, thereby diminishing the concomitant vegetation’s sensitivity to drought [48]. Moreover, in the cold climate zone of the Northern Hemisphere, which is covered by snow from October to April, vegetation growth primarily relies on the yearly supply of snowmelt, which may also contribute to the delayed response of vegetation to drought [27].
Coming back to our study, we determined the duration of the cumulative effects of drought by looking at the most relevant SPEI timescale for a given vegetation NPP. We found that the average cumulative timescales of SPI and SPEI were generally dispersed, with average values of 5.6 and 5.16 months, respectively. Similarly, Zhang et al. [26] claim that the cumulative timescales of SPEI related to vegetation NPP have an average value of 4.89 months. On our part, we found that 80.01% and 72.16% of the entire global vegetated area were affected by the cumulative effects of SPI and SPEI, respectively. In alignment with our study, a number of studies have previously highlighted that vegetation growth is strongly related to accumulated water supply [2,25,49], as moisture needs to be accumulated for conditions that initiate plant life cycles [50]. Additionally, atmospheric drought affects vegetation growth through hydrological cycling, initially resulting in a deficit in surface soil moisture, which is then gradually transferred to deep soil moisture; a considerable amount of time is required for such accumulation [3,51].
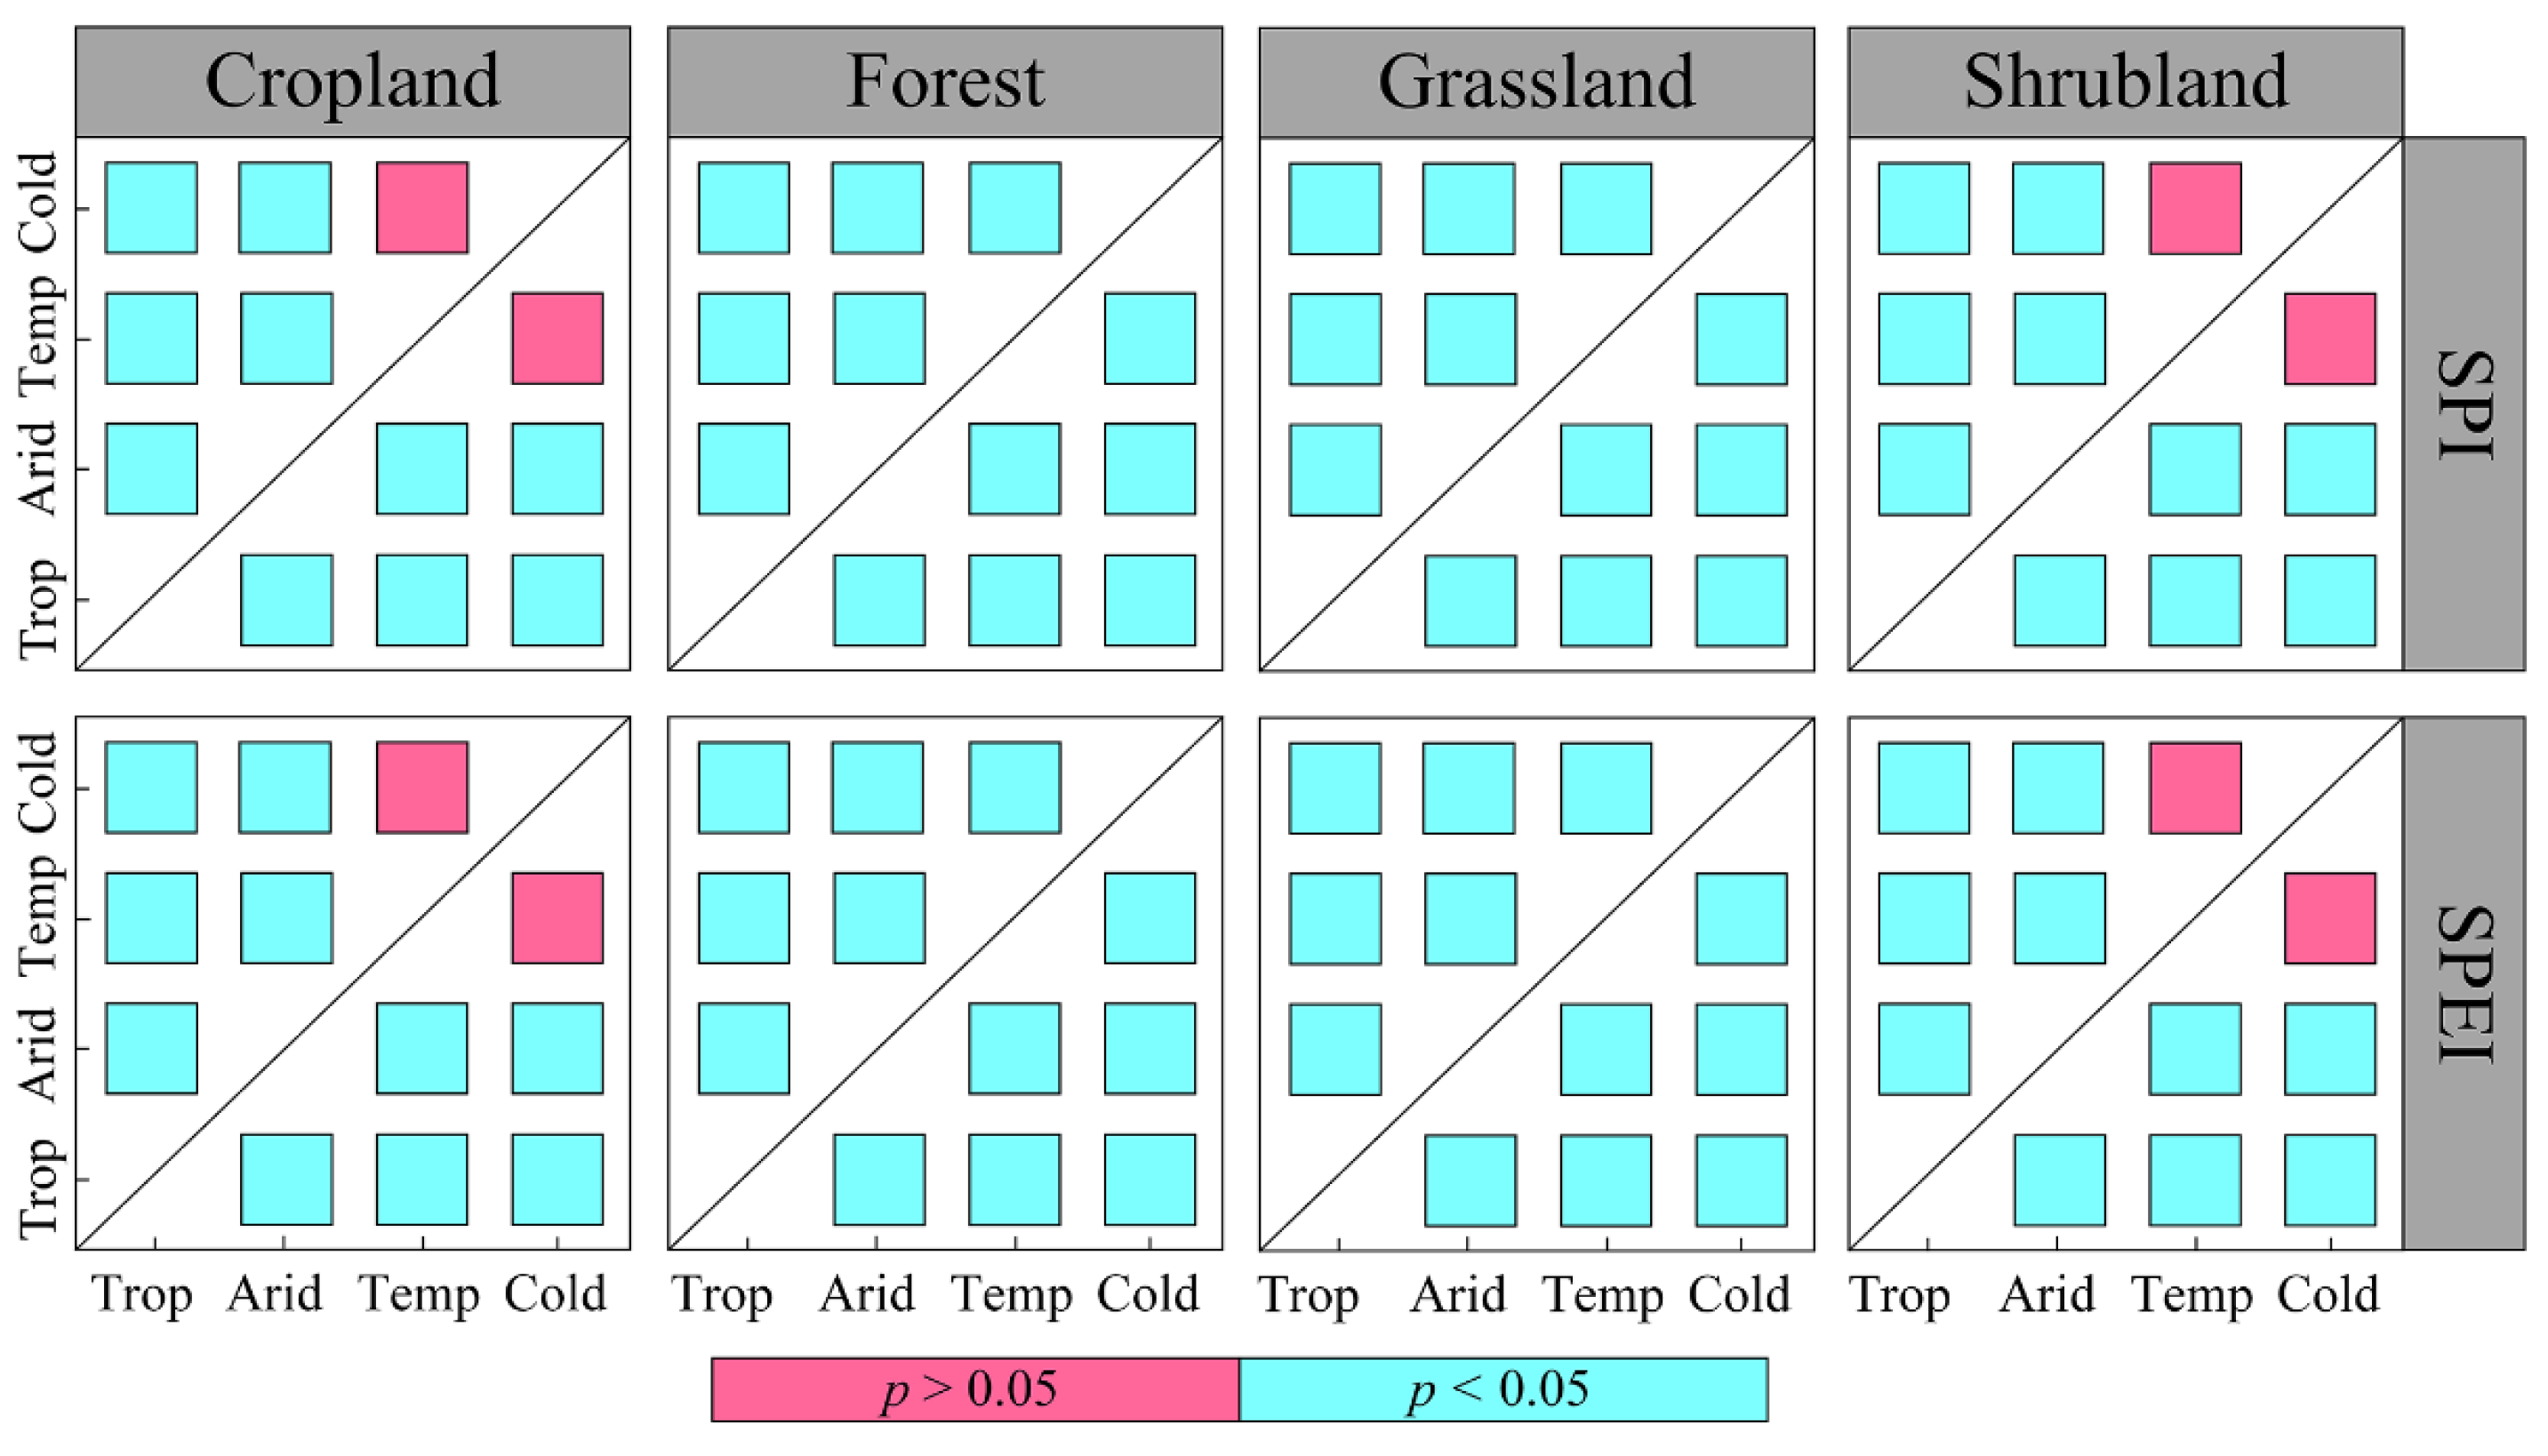
It is generally believed that grassland vegetation is the most sensitive to drought due to its shallow root systems and limited capacity to access deep groundwater [52,53]. In contrast, our analysis showed that the level of association of grassland with drought was higher than cropland, forest, and tundra, but lower than shrubland. Globally, shrubland is primarily located in tropical and arid climate regions, which exhibit a relatively higher dependence on moisture conditions than other climate zones (Figure 7). Thus, the inconsistency of our findings could be attributed to baseline climate conditions. Several previous studies have also reported that the effects of climate on vegetation growth exhibit complex spatial patterns that vary across regions, even if one considers similar vegetation types [19,25], reflecting the different strategies plants employ to cope with drought in diverse climate zones [3]. Based on this hypothesis and to aid our demonstration purposes, we further analysed the differences in the positive RC_max of cropland, forest, grassland, and shrubland areas of different climate zones under the combined effects of drought scenarios; since tundra vegetation is distributed only in cold and polar climate zones, we did not investigate its RC_max for different climate zones. In turn, as shown in Figure 15, the RC_max of the four considered vegetation types differed significantly across the four climate zones, with the exceptions of cropland and shrubland in the cold and temperate climate zones. The insignificant difference in RC_max in cropland areas within different climate zones could primarily be attributed to human activities, such as agricultural irrigation measures [49]. Additionally, this predicament of shrubland might be associated with the limited number of pixels (11) of shrubland in cold climate zones. It should also be noted that the high-latitude region of the Northern Hemisphere, characterised by tundra vegetation, is mainly negatively correlated with drought indices; in our study, the number of pixels where tundra was positively correlated with drought indices was small (45 pixels). Hence, the findings regarding the positive RC_max of tundra in relation to drought require further investigation.

4.2. Role of Climate Warming in Regulating the Effects of Drought on Vegetation NPP

In recent decades, global warming has become an undeniable reality. Yet, its impact on changes in dry and wet climatic conditions is rarely reported. By analysing the changing trends of SPI and SPEI at a global scale, the current study evaluated the contribution of warming to drought. Approximately 37.23% of the entire global area was identified as experiencing warming drought trends of varying levels (Figure 3), confirming the widespread influence of climate warming on global drought in recent decades [54,55,56]. This finding also indicated a heightened sensitivity of global vegetation in its response to drought and potentially adverse shifts in vegetation NPP, particularly over the Amazon plain and Central Asia (which exhibited severe warming-induced drought with a clear decrease in vegetation NPP). Gampe et al. [19] also emphasised that warmer temperatures have led to increasing extremes of negative vegetation productivity in the mid-latitudes of the Northern Hemisphere. Interestingly, the increasing response of global vegetation to drought, attributed to warming-induced drought, was deemed non-linear. The highest RC_max of vegetation NPP with regard to drought occurred in regions experiencing mild warming-induced drought. Considering this fact, the increasing extremes of negative vegetation productivity may be relevant to the differences in the causes of drought; indeed, decreased precipitation was only reported in the areas experiencing mild drought. This argument is supported by Chen et al. [21], who pointed out that anomalies in precipitation, rather than temperature, count as the dominant driver of drought stress on vegetation growth. Moreover, the global decline in the dependence of vegetation productivity on moisture conditions has also been shown to result from increases in precipitation post-2001, as per Zeng et al. [57]. Therefore, we have reason to believe that increased precipitation may have further mitigated the effects of climate warming on vegetation–drought interactions in areas experiencing moderate and severe warming-induced drought. To substantiate this point, we further explored the coupling relationship between vegetation NPP and drought indices in regions with increased as well as decreased precipitation. As shown in Figure S14, the mean positive RC_max of vegetation NPP, related to both SPI and SPEI in areas with increased precipitation, was approximately 0.03–0.04 lower than that in areas with decreased precipitation under all four scenarios, further confirming our aforementioned view.
Moreover, we found that the nonlinear shortening of both SPI and SPEI lagged timescales was affected by climate warming (Figure 13). These results suggest that warming accelerates vegetation responses to drought, in alignment with Gampe et al. [19] regarding the increasing sensitivity of vegetation to warm drought. Additionally, in our study, the drought tolerance of vegetation was significantly altered by climate warming. Overall, the averages of the SPI and SPEI timescales most relevant to vegetation NPP in the warming-induced drought regions tended to increase. This could be attributed to the adaptability of a given vegetation type in coping with water deficits. Many studies have hitherto demonstrated that a vegetation type’s drought resistance improves under long-lasting, high-magnitude droughts [3,10,58]. Furthermore, drought duration and magnitude are also related to the differences in cumulative timescales in warming-induced drought regions [7]. Interestingly, in our study, the lagged and cumulative timescales of vegetation in relation to SPEI in the severe warming-induced drought regions were longer compared to those relevant to the non-warming-induced drought regions. Notably, severe warming-induced drought was more pronounced in Central Asia and the Amazon rainforest, perhaps because the long-term high-temperature stress in these areas rendered vegetation growth less sensitive to and more tolerant of climate warming over the studied period [59].

4.3. Implications and Limitations

This study systematically and comprehensively analysed the lagged, cumulative, and combined effects of drought on global vegetation NPP. Furthermore, we investigated the differences in the spatiotemporal patterns of the vegetation–drought coupling relationship across vegetation types, climate zones, and warming-induced drought gradients. The main and novel findings of this study are given as follows: (1) Overall, we identified regions without temporal effects of drought, those with only lagged effects, those with only cumulative effects, and those with combined effects, identifying the dominant role of cumulative effects of drought in approximately two-thirds of the entire global vegetated area. (2) Warming-induced drought increased the association of vegetation NPP with droughts in a nonlinear fashion, accompanied by shorter time lags and longer cumulative timescales. (3) The positive RC_max of grassland areas was not the highest in any of the vegetation types considered, indicating that the correlation between grassland and drought may not be as high as claimed by previous studies. (4) The spatial distribution of RC_max for each vegetation type differed significantly in most of the studied climate zones.
These findings provide new insights into the effects of drought on vegetation NPP in the context of global warming. However, several limitations of this study need to be addressed in the future. First, owing to the high uncertainty regarding vegetation NPP simulation and the mismatch of the resolution with drought indices, this study’s reliance on a single NPP product to investigate the coupling relationship between vegetation and droughts could have led to further uncertainty in its results [60]. Using multi-source NPP products or conducting accuracy assessments prior to further application could potentially reduce the uncertainties in these results. Second, this study employed linear regression correlation analysis to quantify the vegetation–drought coupling relationship. Given that a complex nonlinear relationship exists between vegetation and climate change [38], our results may have underestimated the dependence of vegetation NPP on drought. Third, the interactions between vegetation and climate change may vary depending on the phase of vegetation growth [61,62]. However, since this study did not investigate the temporal effects of drought on vegetation NPP in different growth phases, the variations in these interactions could not be clarified. Finally, the interactions between vegetation and drought in the Northern and Southern Hemispheres displayed clear differences but were not further compared and analysed in this study. Future studies must address these limitations and refine these results.

5. Conclusions

This study evaluated the spatiotemporal patterns of drought-induced lagged, cumulative, and combined effects on global vegetation NPP during the period lasting from 1982 to 2018, based on long-term GLASS NPP data and multiscale SPI and SPEI values. It also compared the differences in the vegetation–drought coupling relationship across vegetation types, climate zones, and warming-induced drought gradients.
The main findings of the study are given as follows:
(1)
In general, more than three-quarters (79.48%) of global vegetation NPP exhibited increasing trends over the past 37 years, with decreasing trends (20.52%) primarily occurring in western North America, Central Asia, and the world’s equatorial region. Areas displaying drying trends accounted for 36.51% and 61.17% of the studied land areas, as indicated by concomitant SPI and SPEI values, respectively, while 37.23% of the land areas suffered warming-induced drought in the studied period. The positive correlation between vegetation NPP and SPI, as well as SPEI, accounted for 59.59–83.68% and 53.92–80.68% of global vegetated areas, respectively, under different scenarios.
(2)
Global vegetated areas were affected by the lagged effects of SPI and SPEI in 52.08% and 37.05% of cases, respectively, with mean lagged timescales of 2.48 and 1.76 months, respectively. Meanwhile, 80.01% and 72.16% of the vegetated pixels were influenced by the cumulative effects of SPI and SPEI, respectively, with corresponding mean cumulative timescales of 5.60 months and 5.16 months. More importantly, the cumulative effects of drought on vegetation NPP were stronger than the lagged effects in approximately two-thirds of the vegetated areas under study.
(3)
The combined effects of drought scenarios contributed most significantly to variations in vegetation NPP, with the explanatory power of vegetation NPP increasing by 6.92% and 6.07% for SPI and SPEI with combined effects, respectively, as compared to scenarios without temporal effects. Generally, vegetation NPP exhibited a stronger correlation with drought in the warming-induced drought areas, characterised by shorter lagged and longer cumulative timescales.
(4)
Shrubland areas demonstrated the strongest correlation with droughts, followed by grassland areas. In contrast, tundra areas exhibited the weakest correlation with droughts. Additionally, arid regions were most strongly correlated with drought, followed by tropical and temperate regions, which displayed similar correlations with drought. Polar and cold zones were comparatively less correlated with drought. The RC_max of NPP for each vegetation type also significantly varied across most climate categories.

Supplementary Materials

The following supporting information can be downloaded at: https://www.mdpi.com/article/10.3390/rs16203787/s1, Figure S1. Spatial distribution of vegetation covers that remained unchanged during 1982–2015. Figure S2. Spatial distribution of climate zones worldwide. Figure S3. A schematic illustrating the process for determining the temporal effects of various drought indices on vegetation NPP. Figure S4. The trend of vegetation NPP over the period 1982–2018. Figure S5. Spatial distribution of trends in precipitation and near-surface temperature during 1982–2018. Figure S6. The proportion of areas affected by warming-induced drought during 1982–2018 across various climate zones (Non, Mild, Moderate, and Severe represent the severity levels of warming-induced drought). Figure S7. Proportions of positive and negative effects of SPI and SPEI on vegetation NPP under various scenarios. Figure S8. The mean RC_max of vegetation NPP with regard to SPI and SPEI across different latitudes. Figure S9. Proportions of positive and negative effects of SPI and SPEI on vegetation NPP across various vegetation types under different scenarios (CL: cropland, FR: forest, GL: grassland, SL: shrubland, and TD: tundra). Figure S10. Spatial patterns of the coefficient of determination (R²) for the relationship between vegetation NPP and drought indices (No, Lagged, Cumulative, and Combined represent different types of temporal effects). Figure S11. Classification of various temporal effects of SPI and SPEI on vegetation NPP, based on the maximum regression coefficients. Figure S12. Differences in maximum positive drought regression coefficients on NPP among various vegetation types (CL: cropland, FR: forest, GL: grassland, SL: shrubland, and TD: tundra). Figure S13. Differences in maximum positive drought regression coefficients on vegetation NPP across various climate zones (Trop and Temp represent tropical and temperate zones, respectively). Figure S14. Differences in the strength of correlation between vegetation NPP and various drought indices in areas with increased and decreased precipitation (I_prep and D_prep denote increased and decreased precipitation, respectively).

Author Contributions

Conceptualization, P.D.M. and T.L.; methodology and software, M.L.; validation, F.M.; formal analysis, M.L. and P.D.M.; investigation, C.S. and T.L.; data curation, Y.B.; writing—original draft preparation, M.L. and F.M.; supervision, F.M.; funding acquisition, F.M. and T.L. All authors have read and agreed to the published version of the manuscript.

Funding

This research was funded by the National Natural Science Foundation of China (Grant No. 42361024, 42261079, and 42101030), the First-Class Discipline Research Special Project (Grant No. YLXKZX-NSD-029 and YLXKZX-NSD-033), the Central Government-Guided Local Science and Technology Development Fund Project (Grant No. 2024XY0035), Fundamental Research Funds for the Inner Mongolia Normal University (Grant No. 2022JBBJ014 and 2022JBQN093), the Third Xinjiang Scientific Expedition Program (Grant No. 2021xjkk1400), and the Talent Project of Science and Technology in Inner Mongolia (Grant No. NJYT22027 and NJYT23019).

Data Availability Statement

The data presented in this study are available on request from the corresponding author.

Conflicts of Interest

The authors declare no conflicts of interest.

References

  1. Mukherjee, S.; Mishra, A.; Trenberth, K.E. Climate change and drought: A perspective on drought indices. Curr. Clim. Chang. Rep. 2018, 4, 145–163. [Google Scholar] [CrossRef]
  2. Vicente-Serrano, S.M.; Gouveia, C.; Camarero, J.J.; Beguería, S.; Trigo, R.; López-Moreno, J.I.; Azorín-Molina, C.; Pasho, E.; Lorenzo-Lacruz, J.; Revuelto, J. Response of vegetation to drought time-scales across global land biomes. Proc. Natl. Acad. Sci. USA 2013, 110, 52–57. [Google Scholar] [CrossRef]
  3. Zhan, C.; Liang, C.; Zhao, L.; Jiang, S.; Niu, K.; Zhang, Y. Drought-related cumulative and time-lag effects on vegetation dynamics across the Yellow River Basin, China. Ecol. Indic. 2022, 143, 109409. [Google Scholar] [CrossRef]
  4. Whipple, A.V.; Cobb, N.S.; Gehring, C.A.; Mopper, S.; Flores-Rentería, L.; Whitham, T.G. Long-term studies reveal differential responses to climate change for trees under soil- or herbivore-related stress. Front. Plant Sci. 2019, 10, 132. [Google Scholar] [CrossRef]
  5. Zhao, J.; Feng, H.; Xu, T.; Xiao, J.; Guerrieri, R.; Liu, S.; Wu, X.; He, X.; He, X. Physiological and environmental control on ecosystem water use efficiency in response to drought across the northern hemisphere. Sci. Total Environ. 2021, 758, 143599. [Google Scholar] [CrossRef] [PubMed]
  6. Qi, S.; Zhang, H.; Zhang, M. Net Primary Productivity Estimation of Terrestrial Ecosystems in China with Regard to Saturation Effects and Its Spatiotemporal Evolutionary Impact Factors. Remote Sens. 2023, 15, 2871. [Google Scholar] [CrossRef]
  7. Wei, X.; He, W.; Zhou, Y.; Ju, W.; Xiao, J.; Li, X.; Liu, Y.; Xu, S.; Bi, W.; Zhang, X.; et al. Global assessment of lagged and cumulative effects of drought on grassland gross primary production. Ecol. Indic. 2022, 136, 108646. [Google Scholar] [CrossRef]
  8. Cao, D.; Zhang, J.; Han, J.; Zhang, T.; Yang, S.; Wang, J.; Prodhan, F.A.; Yao, F. Projected increases in global terrestrial net primary productivity loss caused by drought under climate change. Earth’s Future 2022, 10, e2022EF002681. [Google Scholar] [CrossRef]
  9. Zhao, M.; Running, S.W. Drought-induced reduction in global terrestrial net primary production from 2000 through 2009. Science 2010, 329, 940–943. [Google Scholar] [CrossRef]
  10. Xu, S.; Wang, Y.; Liu, Y.; Li, J.; Qian, K.; Yang, X.; Ma, X. Evaluating the cumulative and time-lag effects of vegetation response to drought in Central Asia under changing environments. J. Hydrol. 2023, 627, 130455. [Google Scholar] [CrossRef]
  11. Li, L.; She, D.; Zheng, H.; Lin, P.; Yang, Z.-L. Elucidating Diverse Drought Characteristics from Two Meteorological Drought Indices (SPI and SPEI) in China. J. Hydrometeorol. 2020, 21, 1513–1530. [Google Scholar] [CrossRef]
  12. McKee, T.B. Drought monitoring with multiple time scales. In Proceedings of the 9th Conference on Applied Climatology, Dallas, TX, USA, 15–20 January 1995; pp. 233–236. [Google Scholar]
  13. Vicente-Serrano, S.M.; Beguería, S.; López-Moreno, J.I. A multiscalar drought index sensitive to global warming: The standardized precipitation evapotranspiration index. J. Clim. 2010, 23, 1696–1718. [Google Scholar] [CrossRef]
  14. Guo, H.; Bao, A.; Felix, N.; Liu, T.; Guli, J.; El-Tantawi, A.M.; Philippe, D.M. Space-time characterization of drought events and their impacts on vegetation in Central Asia. J. Hydrol. 2018, 564, 1165–1178. [Google Scholar] [CrossRef]
  15. Mishra, A.K.; Singh, V.P. A review of drought concepts. J. Hydrol. 2010, 391, 202–216. [Google Scholar] [CrossRef]
  16. Ali, M.; Deo, R.C.; Maraseni, T.; Downs, N.J. Improving SPI-derived drought forecasts incorporating synoptic-scale climate indices in multi-phase multivariate empirical mode decomposition model hybridised with simulated annealing and kernel ridge regression algorithms. J. Hydrol. 2019, 576, 164–184. [Google Scholar] [CrossRef]
  17. Greve, P.; Orlowsky, B.; Mueller, B.; Sheffield, J.; Reichstein, M.; Seneviratne, S.I. Global assessment of trends in wetting and drying over land. Nat. Geosci. 2014, 7, 716–721. [Google Scholar] [CrossRef]
  18. Liu, C.; Yang, C.; Yang, Q.; Wang, J. Spatiotemporal drought analysis by the standardized precipitation index (SPI) and standardized precipitation evapotranspiration index (SPEI) in Sichuan Province, China. Sci. Rep. 2021, 11, 1280. [Google Scholar] [CrossRef] [PubMed]
  19. Gampe, D.; Zscheischler, J.; Reichstein, M.; O’Sullivan, M.; Smith, W.K.; Sitch, S.; Buermann, W. Increasing impact of warm droughts on northern ecosystem productivity over recent decades. Nat. Clim. Chang. 2021, 11, 772–779. [Google Scholar] [CrossRef]
  20. Li, D.; An, L.; Zhong, S.; Shen, L.; Wu, S. Declining coupling between vegetation and drought over the past three decades. Glob. Chang. Biol. 2024, 30, e17141. [Google Scholar] [CrossRef]
  21. Chen, J.; Liu, Z.; Zhou, P. Anomalies in precipitation rather than temperature as the dominant driver of drought stress on vegetation in the Northern Hemisphere. Glob. Ecol. Conserv. 2022, 40, e02311. [Google Scholar] [CrossRef]
  22. Cooley, S.S.; Williams, C.A.; Fisher, J.B.; Halverson, G.H.; Perret, J.; Lee, C.M. Assessing regional drought impacts on vegetation and evapotranspiration: A case study in Guanacaste, Costa Rica. Ecol. Appl. 2019, 29, e01834. [Google Scholar] [CrossRef] [PubMed]
  23. Liu, L.; Guan, J.; Zheng, J.; Wang, Y.; Han, W.; Liu, Y. Cumulative effects of drought have an impact on net primary productivity stability in Central Asian grasslands. J. Environ. Manag. 2023, 344, 118734. [Google Scholar] [CrossRef]
  24. Wu, X.; Liu, H.; Li, X.; Ciais, P.; Babst, F.; Guo, W.; Zhang, C.; Magliulo, V.; Pavelka, M.; Liu, S. Differentiating drought legacy effects on vegetation growth over the temperate Northern Hemisphere. Glob. Chang. Biol. 2018, 24, 504–516. [Google Scholar] [CrossRef] [PubMed]
  25. Ding, Y.; Li, Z.; Peng, S. Global analysis of time-lag and -accumulation effects of climate on vegetation growth. Int. J. Appl. Earth Obs. Geoinf. 2020, 92, 102179. [Google Scholar] [CrossRef]
  26. Zhang, Z.; Ju, W.; Zhou, Y.; Li, X. Revisiting the cumulative effects of drought on global gross primary productivity based on new long-term series data (1982–2018). Glob. Chang. Biol. 2022, 28, 3620–3635. [Google Scholar] [CrossRef] [PubMed]
  27. Peng, J.; Wu, C.; Zhang, X.; Wang, X.; Gonsamo, A. Satellite detection of cumulative and lagged effects of drought on autumn leaf senescence over the Northern Hemisphere. Glob. Chang. Biol. 2019, 25, 2174–2188. [Google Scholar] [CrossRef]
  28. Wang, Y.; Chen, T.; Wang, Q.; Peng, L. Time-lagged and cumulative effects of drought and anthropogenic activities on China's vegetation greening from 1990 to 2018. Int. J. Digit. Earth 2023, 16, 2233–2258. [Google Scholar] [CrossRef]
  29. Guo, L.; Cheng, J.; Luedeling, E.; Koerner, S.E.; He, J.-S.; Xu, J.; Gang, C.; Li, W.; Luo, R.; Peng, C. Critical climate periods for grassland productivity on China’s Loess Plateau. Agric. For. Meteorol. 2017, 233, 101–109. [Google Scholar] [CrossRef]
  30. Yu, T.; Sun, R.; Xiao, Z.; Zhang, Q.; Liu, G.; Cui, T.; Wang, J. Estimation of Global Vegetation Productivity from Global LAnd Surface Satellite Data. Remote Sens. 2018, 10, 327. [Google Scholar] [CrossRef]
  31. Cui, T.; Wang, Y.; Sun, R.; Qiao, C.; Fan, W.; Jiang, G.; Hao, L.; Zhang, L. Estimating Vegetation Primary Production in the Heihe River Basin of China with Multi-Source and Multi-Scale Data. PLoS ONE 2016, 11, e0153971. [Google Scholar] [CrossRef]
  32. Luo, M.; Meng, F.; Wang, Y.; Sa, C.; Duan, Y.; Bao, Y.; Liu, T. Quantitative detection and attribution of soil moisture heterogeneity and variability in the Mongolian Plateau. J. Hydrol. 2023, 621, 129673. [Google Scholar] [CrossRef]
  33. Zhu, X.; Zhang, S.; Liu, T.; Liu, Y. Impacts of Heat and Drought on Gross Primary Productivity in China. Remote Sens. 2021, 13, 378. [Google Scholar] [CrossRef]
  34. Liu, H.; Gong, P.; Wang, J.; Clinton, N.; Liang, S. Annual dynamics of global land cover and its long-term changes from 1982 to 2015. Earth Syst. Sci. Data 2020, 12, 1217–1243. [Google Scholar] [CrossRef]
  35. Beck, H.E.; Zimmermann, N.E.; McVicar, T.R.; Vergopolan, N.; Berg, A.; Wood, E.F. Present and future Köppen-Geiger climate classification maps at 1-km resolution. Sci Data 2018, 5, 180214. [Google Scholar] [CrossRef]
  36. Sen, P.K. Estimates of the Regression Coefficient Based on Kendall's Tau. J. Am. Stat. Assoc. 1968, 63, 1379–1389. [Google Scholar] [CrossRef]
  37. Zhao, X.; Luo, M.; Meng, F.; Sa, C.; Bao, S.; Bao, Y. Spatiotemporal changes of gross primary productivity and its response to drought in the Mongolian Plateau under climate change. J. Arid Land 2024, 16, 46–70. [Google Scholar] [CrossRef]
  38. Meng, F.; Luo, M.; Wang, Y.; Sa, C.; Bao, S.; Bao, Y.; Liu, T. Revisiting the main driving factors influencing the dynamics of gross primary productivity in the Mongolian Plateau. Agric. For. Meteorol. 2023, 341, 109689. [Google Scholar] [CrossRef]
  39. Rinnan, R.; Michelsen, A.; Bååth, E.; Jonasson, S. Fifteen years of climate change manipulations alter soil microbial communities in a subarctic heath ecosystem. Glob. Chang. Biol. 2007, 13, 28–39. [Google Scholar] [CrossRef]
  40. Piao, S.; Wang, X.; Park, T.; Chen, C.; Lian, X.; He, Y.; Bjerke, J.W.; Chen, A.; Ciais, P.; Tømmervik, H.; et al. Characteristics, drivers and feedbacks of global greening. Nat. Rev. Earth Environ. 2020, 1, 14–27. [Google Scholar] [CrossRef]
  41. Huang, M.; Wang, X.; Keenan, T.F.; Piao, S. Drought timing influences the legacy of tree growth recovery. Glob. Change Biol. 2018, 24, 3546–3559. [Google Scholar] [CrossRef]
  42. Zhao, A.; Yu, Q.; Feng, L.; Zhang, A.; Pei, T. Evaluating the cumulative and time-lag effects of drought on grassland vegetation: A case study in the Chinese Loess Plateau. J. Environ. Manag. 2020, 261, 110214. [Google Scholar] [CrossRef] [PubMed]
  43. Yang, M.; Zou, J.; Ding, J.; Zou, W.; Yahefujiang, H. Stronger cumulative than lagged effects of drought on vegetation in Central Asia. Forests 2023, 14, 2142. [Google Scholar] [CrossRef]
  44. Wen, Y.; Liu, X.; Xin, Q.; Wu, J.; Xu, X.; Pei, F.; Li, X.; Du, G.; Cai, Y.; Lin, K. Cumulative effects of climatic factors on terrestrial vegetation growth. J. Geophys. Res. Biogeosci. 2019, 124, 789–806. [Google Scholar] [CrossRef]
  45. Zhou, R.; Liu, Y.; Cui, M.; Lu, J.; Shi, H.; Ren, H.; Zhang, W.; Wen, Z. Global Assessment of Cumulative and Time-Lag Effects of Drought on Land Surface Phenology. Giscience Remote Sens. 2022, 59, 1918–1937. [Google Scholar] [CrossRef]
  46. Li, J.; Song, F.; Jin, Y.; Yun, R.; Chen, Z.; Lyu, Z.; Zhao, Y.; Cui, D. Critical temperatures controlling the phenology and radial growth of Pinus sylvestris var. Mongolica on the southern margin of a cold temperate coniferous forest. Ecol. Indic. 2021, 126, 107674. [Google Scholar] [CrossRef]
  47. Ge, W.; Deng, L.; Wang, F.; Han, J. Quantifying the contributions of human activities and climate change to vegetation net primary productivity dynamics in China from 2001 to 2016. Sci. Total Environ. 2021, 773, 145648. [Google Scholar] [CrossRef]
  48. Sun, S.; Du, W.; Song, Z.; Zhang, D.; Wu, X.; Chen, B.; Wu, Y. Response of gross primary productivity to drought time-scales across China. J. Geophys. Res. Biogeosci. 2021, 126, e2020JG005953. [Google Scholar] [CrossRef]
  49. Gu, X.; Guo, E.; Yin, S.; Wang, Y.; Mandula, N.; Wan, Z.; Yun, X.; Li, H.; Bao, Y. Differentiating cumulative and lagged effects of drought on vegetation growth over the Mongolian Plateau. Ecosphere 2022, 13, e4289. [Google Scholar] [CrossRef]
  50. Zhang, H.; Liu, S.; Regnier, P.; Yuan, W. New insights on plant phenological response to temperature revealed from long-term widespread observations in China. Glob. Chang. Biol. 2018, 24, 2066–2078. [Google Scholar] [CrossRef]
  51. Xu, H.; Wang, X.; Zhao, C.; Yang, X. Assessing the response of vegetation photosynthesis to meteorological drought across northern China. Land Degrad. Dev. 2020, 32, 20–34. [Google Scholar] [CrossRef]
  52. Li, C.; Leal Filho, W.; Yin, J.; Hu, R.; Wang, J.; Yang, C.; Yin, S.; Bao, Y.; Ayal, D.Y. Assessing vegetation response to multi-time-scale drought across Inner Mongolia Plateau. J. Clean. Prod. 2018, 179, 210–216. [Google Scholar] [CrossRef]
  53. Zhang, Q.; Kong, D.; Singh, V.P.; Shi, P. Response of vegetation to different time-scales of drought across China: Spatiotemporal patterns, causes and implications. Glob. Planet. Chang. 2017, 152, 1–11. [Google Scholar] [CrossRef]
  54. Vicente-Serrano, S.M.; Quiring, S.M.; Pena-Gallardo, M.; Yuan, S.; Dominguez-Castro, F. A review of environmental droughts: Increased risk under global warming? Earth-Sci. Rev. 2020, 201, 102953. [Google Scholar] [CrossRef]
  55. Naumann, G.; Alfieri, L.; Wyser, K.; Mentaschi, L.; Betts, R.A.; Carrao, H.; Spinoni, J.; Vogt, J.; Feyen, L. Global changes in drought conditions under different levels of warming. Geophys. Res. Lett. 2018, 45, 3285–3296. [Google Scholar] [CrossRef]
  56. Wu, G.; Chen, J.; Shi, X.; Kim, J.S.; Xia, J.; Zhang, L. Impacts of global climate warming on meteorological and hydrological droughts and their propagations. Earth’s Future 2022, 10, e2021EF002542. [Google Scholar] [CrossRef]
  57. Zeng, X.; Hu, Z.; Chen, A.; Yuan, W.; Hou, G.; Han, D.; Liang, M.; Di, K.; Cao, R.; Luo, D. The global decline in the sensitivity of vegetation productivity to precipitation from 2001 to 2018. Glob. Chang. Biol. 2022, 28, 6823–6833. [Google Scholar] [CrossRef]
  58. Deng, H.; Yin, Y.; Han, X. Vulnerability of vegetation activities to drought in Central Asia. Environ. Res. Lett. 2020, 15, 084005. [Google Scholar] [CrossRef]
  59. Wu, D.; Zhao, X.; Liang, S.; Zhou, T.; Huang, K.; Tang, B.; Zhao, W. Time-lag effects of global vegetation responses to climate change. Glob. Chang. Biol. 2015, 21, 3520–3531. [Google Scholar] [CrossRef] [PubMed]
  60. Xie, X.; Li, A.; Tan, J.; Lei, G.; Jin, H.; Zhang, Z. Uncertainty analysis of multiple global GPP datasets in characterising the lagged effect of drought on photosynthesis. Ecol. Indic. 2020, 113, 106224. [Google Scholar] [CrossRef]
  61. Liu, Q.; Fu, Y.H.; Zeng, Z.; Huang, M.; Li, X.; Piao, S. Temperature, precipitation, and insolation effects on autumn vegetation phenology in temperate China. Glob. Chang. Biol. 2016, 22, 644–655. [Google Scholar] [CrossRef]
  62. Papagiannopoulou, C.; Miralles, D.G.; Dorigo, W.A.; Verhoest, N.E.C.; Depoorter, M.; Waegeman, W. Vegetation anomalies caused by antecedent precipitation in most of the world. Environ. Res. Lett. 2017, 12, 074016. [Google Scholar] [CrossRef]
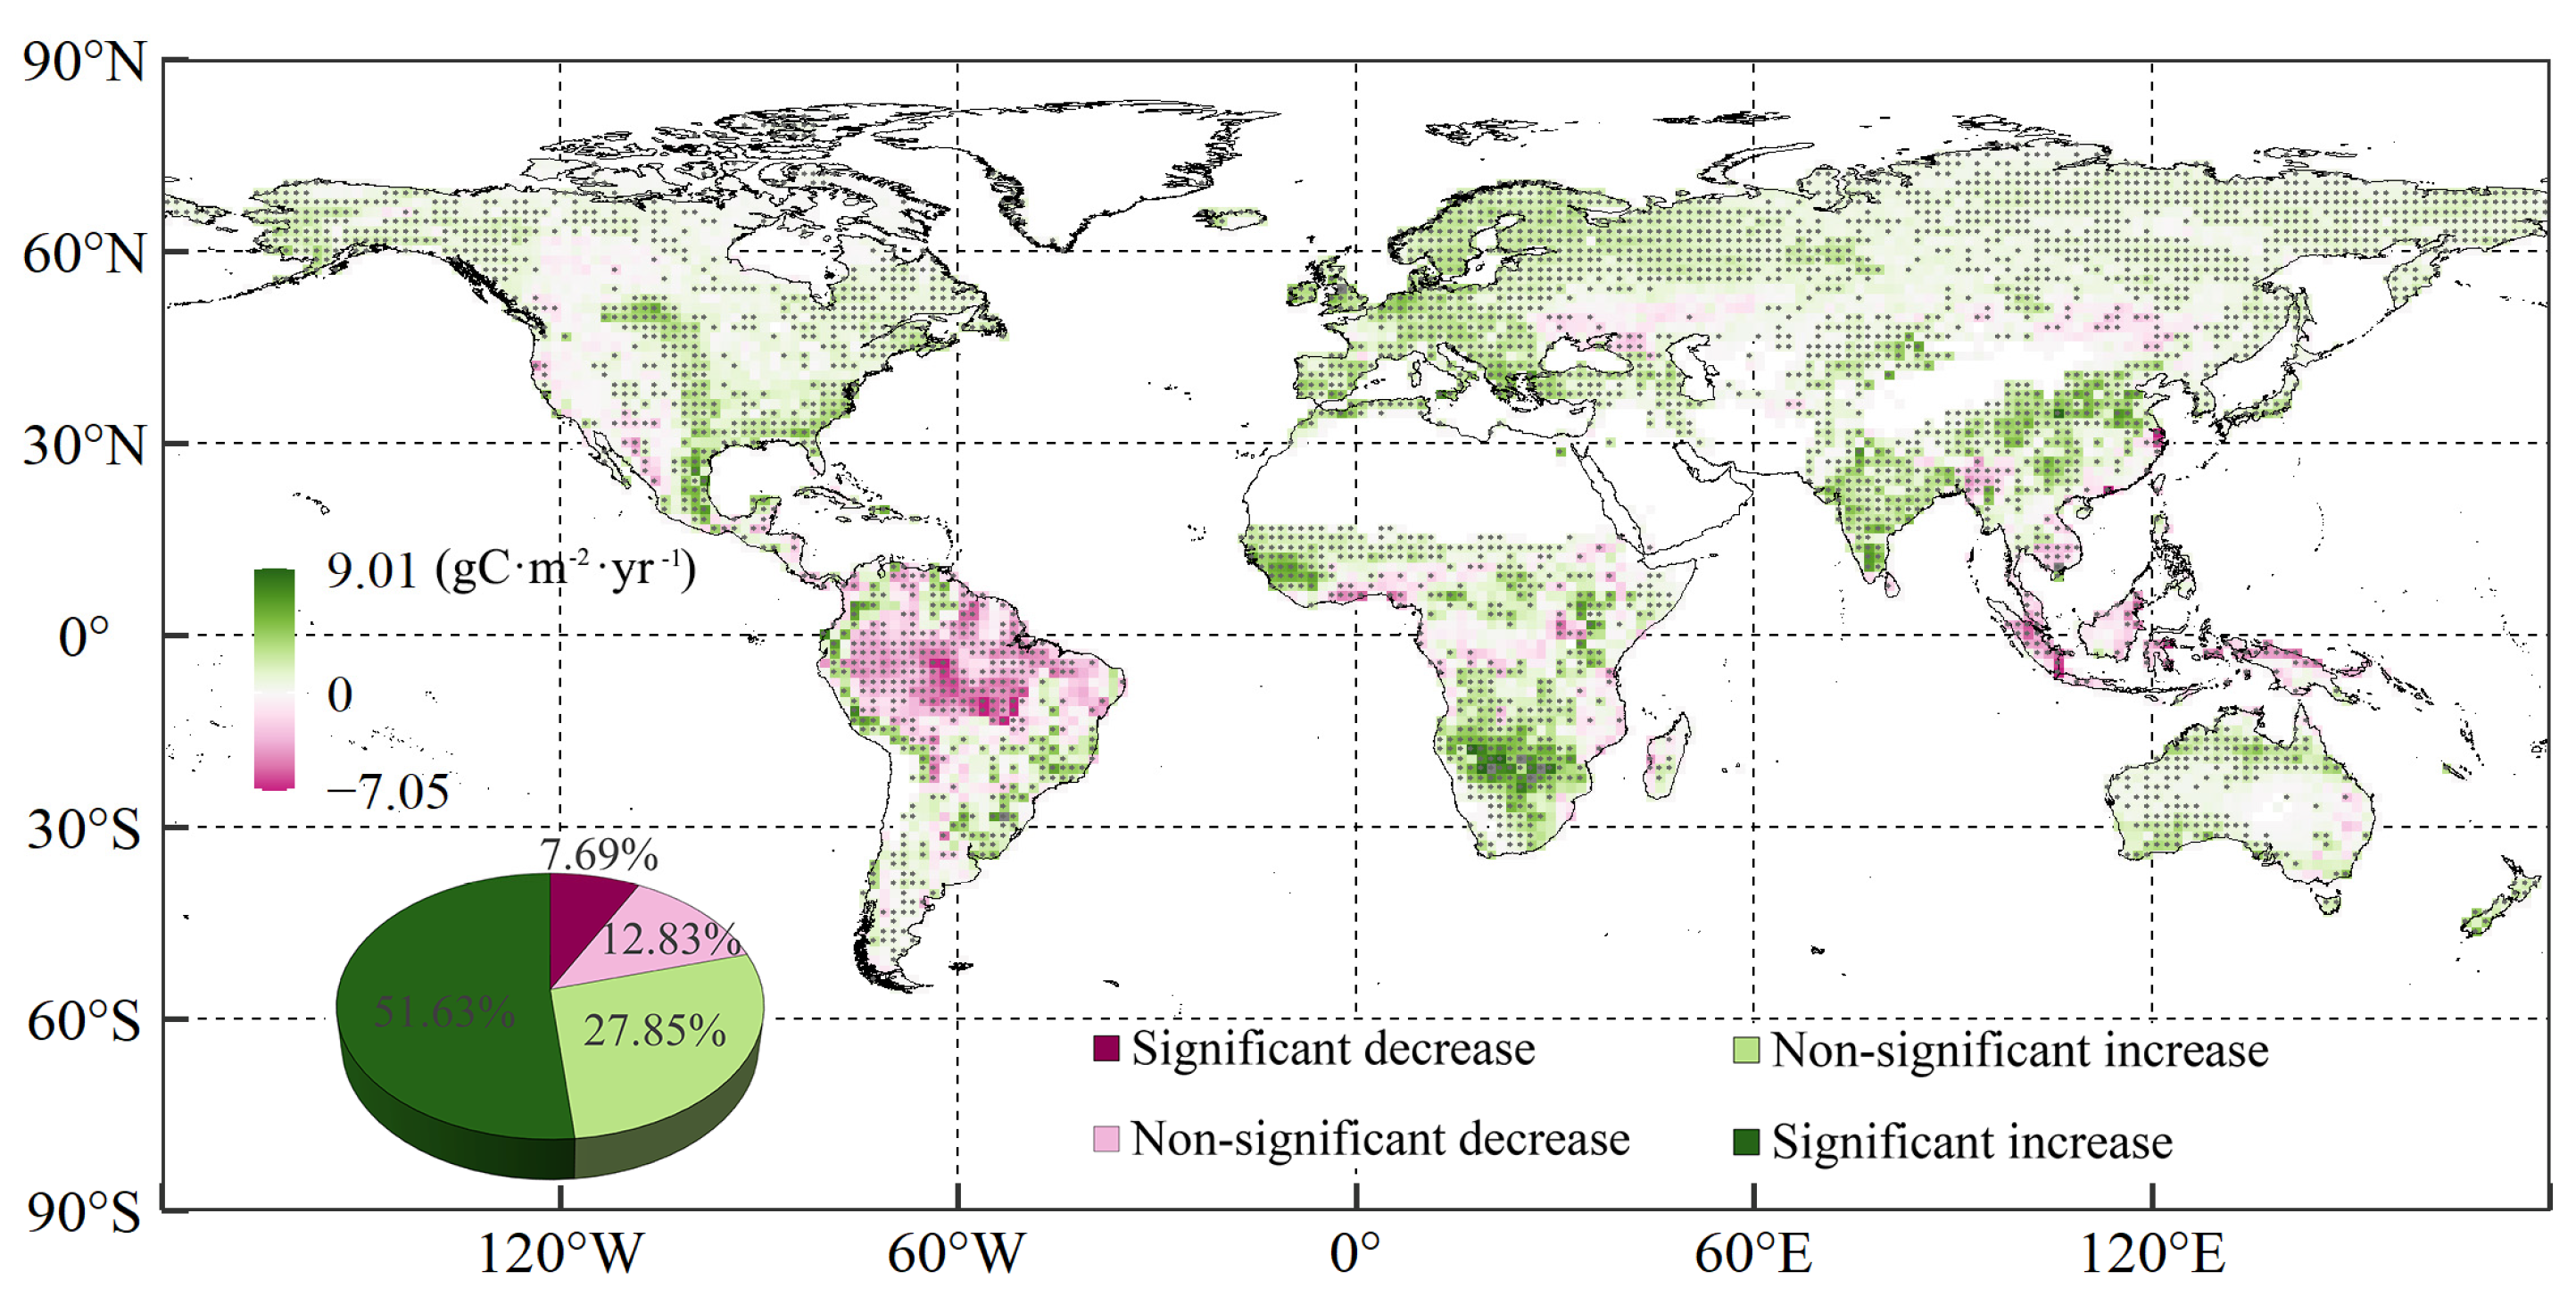
Figure 1. Spatial patterns of the changing trends of global vegetation NPP from 1982 to 2018 (areas covered in black points indicate that the changing trend passed the 95% significance test).
Remotesensing 16 03787 g001
Figure 2. Spatial patterns of the changing trends of drought indices from 1982 to 2018 on a 12-month scale (areas covered in black points indicate that the changing trend passed the 95% significance test).
Remotesensing 16 03787 g002
Figure 3. Spatial patterns of the warming-induced drought from 1982 to 2018 (the terms Non, Mild, Moderate, and Severe represent the different levels of warming-induced drought).
Remotesensing 16 03787 g003
Figure 4. Spatial distribution of the maximum regression coefficients of vegetation NPP with regard to drought indices (the terms No, Lagged, Cumulative, and Combined represent the types of temporal effects).
Remotesensing 16 03787 g004
Figure 5. Differences in the coefficient of determination (△R2) between R2 with the lagged effects of drought and without temporal effects (△Lagged), between R2 with cumulative effects and without temporal effects (△Cumulative), and between R2 with combined effects and without temporal effects (△Combined).
Remotesensing 16 03787 g005
Figure 6. The mean positive RC_max of vegetation NPP with regard to SPI and SPEI for different vegetation types.
Remotesensing 16 03787 g006
Figure 7. The mean positive RC_max of vegetation NPP with regard to SPI and SPEI for different climate zones.
Remotesensing 16 03787 g007
Figure 8. Spatial distribution of the lagged months at which the highest coefficient of determination (R2) between vegetation NPP and the two drought indices was found.
Remotesensing 16 03787 g008
Figure 9. The lagged and cumulative timescales for different vegetation types.
Remotesensing 16 03787 g009
Figure 10. The lagged and cumulative timescales for different climate zones.
Remotesensing 16 03787 g010
Figure 11. Spatial distribution of the cumulative months when the maximum coefficient of determination (R2) between vegetation NPP and the two drought indices was found.
Remotesensing 16 03787 g011
Figure 12. Differences in the correlation of vegetation NPP to different drought indices in areas with varying levels of climate-warming-induced drought.
Remotesensing 16 03787 g012
Figure 13. Differences in the optimal lagged and cumulative timescales of the effects of drought indices on vegetation NPP in areas with varying levels of climate-warming-induced drought.
Remotesensing 16 03787 g013
Figure 14. Differences in the coefficient of determination (△R2) between cumulative and lagged effects.
Remotesensing 16 03787 g014
Figure 15. Differences in the maximum positive regression coefficients of drought in terms of the net primary productivity of cropland, forest, grassland, and shrubland in different climate zones under the combined-effects scenarios.
Remotesensing 16 03787 g015
Table 1. Classification results of climate-warming-induced drought areas. (Non, Mild, Moderate, and Severe represent non-warming-induced drought, mild warming-induced drought, moderate warming-induced drought, and severe warming-induced drought, respectively).
ClassificationDrought Index β Z s
MildSPI<0<1.96
SPEI<0>1.96
ModerateSPI>0
SPEI<0<1.96
SevereSPI>0
SPEI<0>1.96
NonRegions other than the above three
Table 2. Different effects of drought on vegetation.
Scenarioski
No temporal effect10
Lagged effect10–12
Cumulative effect1–120
Combined effect1–120–12
Disclaimer/Publisher’s Note: The statements, opinions and data contained in all publications are solely those of the individual author(s) and contributor(s) and not of MDPI and/or the editor(s). MDPI and/or the editor(s) disclaim responsibility for any injury to people or property resulting from any ideas, methods, instructions or products referred to in the content.