Article

Ice Sheet Mass Changes over Antarctica Based on GRACE Data

1
School of Mathematics, Lanzhou Jiaotong University, Lanzhou 730070, China
2
Key Laboratory of Cryospheric Science and Frozen Soil Engineering, Northwest Institute of Eco-Environment and Resources, Chinese Academy of Sciences, Lanzhou 730000, China
3
University of Chinese Academy of Sciences, Beijing 100049, China
4
Heihe Remote Sensing Experimental Research Station, Key Laboratory of Remote Sensing of Gansu Province, Northwest Institute of Eco-Environment and Resources, Chinese Academy of Sciences, Lanzhou 730000, China
*
Author to whom correspondence should be addressed.
Remote Sens. 2024, 16(20), 3776; https://doi.org/10.3390/rs16203776
Submission received: 10 September 2024 / Revised: 6 October 2024 / Accepted: 8 October 2024 / Published: 11 October 2024

Abstract

:
Assessing changes of the mass balance in the Antarctic ice sheet in the context of global warming is a key focus in polar study. This study analyzed the spatiotemporal variation in the Antarctic ice sheet’s mass balance, both as a whole and by individual basins, from 2003 to 2016 and from 2018 to 2022 using GRACE RL06 data published by the Center for Space Research (CSR) and ERA-5 meteorological data. It explored the lagged relationships between mass balance and precipitation, net surface solar radiation, and temperature, and applied the random forest method to examine the relative contributions of these factors to the ice sheet’s mass balance within a nonlinear framework. The results showed that the mass loss rates of the Antarctic ice sheet during the study periods were −123.3 ± 6.2 Gt/a and −24.8 ± 52.1 Gt/a. The region with the greatest mass loss was the Amundsen Sea in West Antarctica (−488.8 ± 5.3 Gt/a and −447.9 ± 14.7 Gt/a), while Queen Maud Land experienced the most significant mass accumulation (44.9 ± 1.0 Gt/a and 30.0 ± 3.2 Gt/a). The main factors contributing to surface ablation of the Antarctic ice sheet are rising temperatures and increased surface net solar radiation, each showing a lag effect of 1 month and 2 months, respectively. Precipitation also affects the loss of the ice sheet to some extent. Over time, the contribution of precipitation to the changes in the ice sheet’s mass balance increases.

1. Introduction

As the largest land glacier on Earth, even minor changes in the Antarctic ice sheet’s mass balance can have profound effects on the global water cycle and play a crucial role in regulating the global climate and sea level fluctuations [1,2]. The mass balance of the Antarctic ice sheet has become a major scientific concern in polar studies. Studies have indicated that a complete loss of the Antarctic ice sheet could lead to an average global sea level rise of 58.3 m [3]. Recent exacerbations in global warming have accelerated the loss of the Antarctic ice sheet, contributing to rising sea levels that threaten to disrupt natural ecosystems, such as bays and estuaries, and pose potential risks to human survival [4,5]. Therefore, studying the changes in the Antarctic ice sheet’s mass and their attribution is crucial for improving our understanding of polar cryosphere dynamics.
There is a complex relationship between changes in the Antarctic ice sheet’s mass balance and the climate. The ice sheet both influences and is influenced by various components of the Earth’s climate system through its interactions with the atmosphere and ocean. Short-term climate changes, particularly extreme temperature and precipitation events, can impact the stability of the ice sheet and lead to significant alterations in its mass balance. Rising temperatures cause the ice sheet to lose mass, reducing its albedo and accelerating the loss process. Currently, the loss season of the Antarctic ice sheet is being delayed, leading to a higher albedo and less solar energy absorption. This delay somewhat slows the loss of the ice sheet [6]. Precipitation, particularly snowfall, can significantly increase the albedo, thereby partially offsetting the impact of rising temperatures [7].
However, due to Antarctica’s remoteness and vastness, obtaining data on changes in the mass balance of its ice sheet is challenging. Researchers have conducted extensive studies on this topic. Currently, there are three primary methods for studying changes in the Antarctic ice sheet’s mass balance: the input–output method, the altimetry method, and the gravity measurement method. The input–output method, also known as the component estimation method, estimates changes in the ice sheet’s mass by separately calculating the input flux and output flux, then subtracting the output flux from the input flux. The input flux primarily consists of the cumulative snowfall accumulation, while the output flux mainly includes meltwater runoff and the ice volume of glaciers or ice flows crossing the grounding line [8]. The traditional input–output method has provided long-term estimates of grounding line ice flux and mass balance changes since 1963 [9]. However, this method has significant uncertainties in its assessment results. By employing an improved input–output method, it was estimated that the overall mass loss of the Antarctic ice sheet from 2013 to 2018 was approximately 1069 Gt [10]. Since the input–output method cannot accurately measure the accumulation and loss of ice and snow over large areas, it is more suitable for small-scale studies.
Altimetry estimates changes in ice sheet mass by examining the relationship between elevation, ice thickness, and volume change. It is categorized into laser altimetry and radar altimetry. When studying changes in the Antarctic ice sheet’s mass, ICESat satellite altimetry data are widely used. Results from using these data to estimate the Antarctic ice sheet’s mass balance indicate that from 2003 to 2008, the overall mass change trend was −82 ± 25 Gt/a [11]. However, calculations of ice and snow mass changes in Antarctica during these five years yielded a mass change rate of −44 ± 21 Gt/a [12]. This discrepancy arises because the altimetry method for studying mass changes can exhibit significant slope errors and lower accuracy in marginal areas and regions with steep slopes [13].
Since its launch in 2002, the GRACE (Gravity Recovery and Climate Experiment) satellite has played a crucial role in monitoring the mass balance of the polar ice sheets. The time-varying gravity field it provides directly reflects surface mass migration, making it highly sensitive to changes in ice sheet mass. Estimates of Antarctic ice and water mass changes from 2002 to 2016 using GRACE satellite data reveal a clear ablation signal of the Antarctic ice sheet [14]. Satellite data analysis also indicates that the loss of the Antarctic ice sheet is primarily concentrated in the Antarctic Peninsula and the coastal regions of West Antarctica [15]. However, the choice of different GIA (Glacial Isostatic Adjustment) models can significantly impact the accuracy of estimated changes in the Antarctic ice sheet’s mass [4]. Different GIA models were used to analyze the error in Antarctic ice sheet loss estimates. After accounting for model errors, it was found that the Antarctic ice sheet lost mass at a rate of −81.5 ± 4.2 Gt/a during 2003–2013 [5]. At the same time, results from different laboratories show variations. Comparative studies have found that data from the CSR (Center for Space Research) and JPL (Jet Propulsion Laboratory) laboratories exhibit good consistency in the time series of Antarctic ice sheet mass changes, whereas GFZ (GeoFoschungsZentrum Potsdam) data show lower accuracy [16]. Using data from JPL and CSR to estimate the Antarctic ice sheet’s mass change trend from 2002 to 2020, the resulting rates were −119 ± 23 Gt/a and −259 ± 20 Gt/a, respectively [17]. This indicates an accelerating trend in the overall loss of the Antarctic ice sheet.
Each of these three methods has its own advantages and disadvantages, but there is good consistency among them [18]. All are suitable for estimating the mass balance of polar ice sheets and can provide valuable references for future studies on ice sheet mass balance [19]. When estimating the mass balance of the Antarctic ice sheet, significant differences can arise between techniques due to factors such as uncertainties in assessing the East Antarctic ice sheet. Combining multiple independent satellites and climate models can further validate and complement observations on ice sheet thickness, mass balance changes, and other parameters [18].
This study primarily examines changes in the Antarctic ice sheet’s mass balance as independently derived from GRACE and GRACE Follow-On satellite data. It utilizes the newly released GRACE RL06 monthly gravity field model data from CSR. Based on these data, this study estimates the mass change trends of the Antarctic ice sheet both as a whole and across nine basins (see Figure 1 for basin distribution) from 2003 to 2017 and from 2018 to 2022. Additionally, it provides a detailed analysis of the spatiotemporal distribution characteristics of ice sheet mass changes in typical areas of each Antarctic basin. Finally, by combining precipitation, surface net solar radiation, and 2 m temperature data from the ERA-5 reanalysis dataset, this study discusses the lagged relationships between Antarctic ice sheet mass changes and these three climate factors. Additionally, it explores the relative contributions of these factors to the nonlinear changes in the ice sheet’s mass balance using the random forest method. On the one hand, this study provides effective supporting data for understanding the loss rate of the Antarctic ice sheet; on the other hand, it offers a scientific reference for understanding how mass changes in the Antarctic ice sheet respond to climate change.

2. Data and Methods

2.1. Study Area

The Antarctic ice sheet is the world’s largest land glacier, covering an area of approximately 1398 × 10 4   km 2 with an average thickness ranging from 2000 to 2500 m, accounting for about 98% of the Antarctic continent. It holds 90% of the world’s land ice and contains 70% of the world’s total freshwater resources. The Antarctic ice sheet has higher elevations in the continental interior and lower elevations along its edges, with the East Antarctica area being higher and the West Antarctica area being lower. Most of the ice sheet is located within the Antarctic Circle, where the average annual temperature is around −25 °C. Antarctica experiences two seasons each year: the warm season from November to March and the cold season from April to October. This study combines the sub-basins into nine main basins based on their characteristics (see Figure 1). Basin 9 covers the Antarctic Peninsula, Basins 1 and 6–8 cover the West Antarctic, and Basins 2–5 cover the East Antarctic. The basin division includes the main body of the ice sheet as well as the ice caps and glaciers on the outer islands.

2.2. Data Sources

2.2.1. GRACE Satellite Data

The GRACE satellite is a collaborative project between NASA and the German Aerospace Center. Launched in July 2002, it operated until its decommissioning in 2017. Its successor, GRACE-FO, was launched in 2018 and has been operational since then. Both satellites are used to monitor changes in the Earth’s gravity field. The time-varying Earth gravity field signal reflects mass changes and migration processes within the Earth system. Variations in the gravity field can be used to infer changes in groundwater levels. There are two main types of inverted GRACE satellite data: spherical harmonic coefficient products and Mascon products. Since Mascon data are more convenient and do not require complex reprocessing [20], this study uses the RL06_Mascons (V2.0) data provided by the Center for Space Research (CSR) at the University of Texas, USA. The dataset includes GRACE data from January 2003 to December 2016 and GRACE-FO data from June 2018 to October 2022, covering a total of 202 months. One year of data is missing due to the satellite mission’s interruption, but the missing 1 or 2 months of data during each satellite mission have been filled by linear interpolation. The data are recorded as equivalent water height (EWH, unit: cm), with a spatial resolution of 0.25 × 0.25 (GRACE/GRACE-FO—Gravity Recovery and Climate Experiment (utexas.edu)).

2.2.2. ERA-5 Reanalysis of Meteorological Data Sets

The ERA-5 dataset is the fifth generation of atmospheric reanalysis data from the European Centre for Medium-Range Weather Forecasts (ECMWF), covering global climate from 1940 to the present [21]. ERA-5 provides hourly estimates of atmospheric, land, and ocean climate variables. This study utilizes monthly average data for precipitation (P), surface net solar radiation (SSR), and 2 m temperature (T2M) from January 2003 to October 2022. The spatial resolution of the meteorological data is 0.25 × 0.25 (ERA5 monthly averaged data on single levels from 1940 to present (copernicus.eu)).

2.3. Research Methods

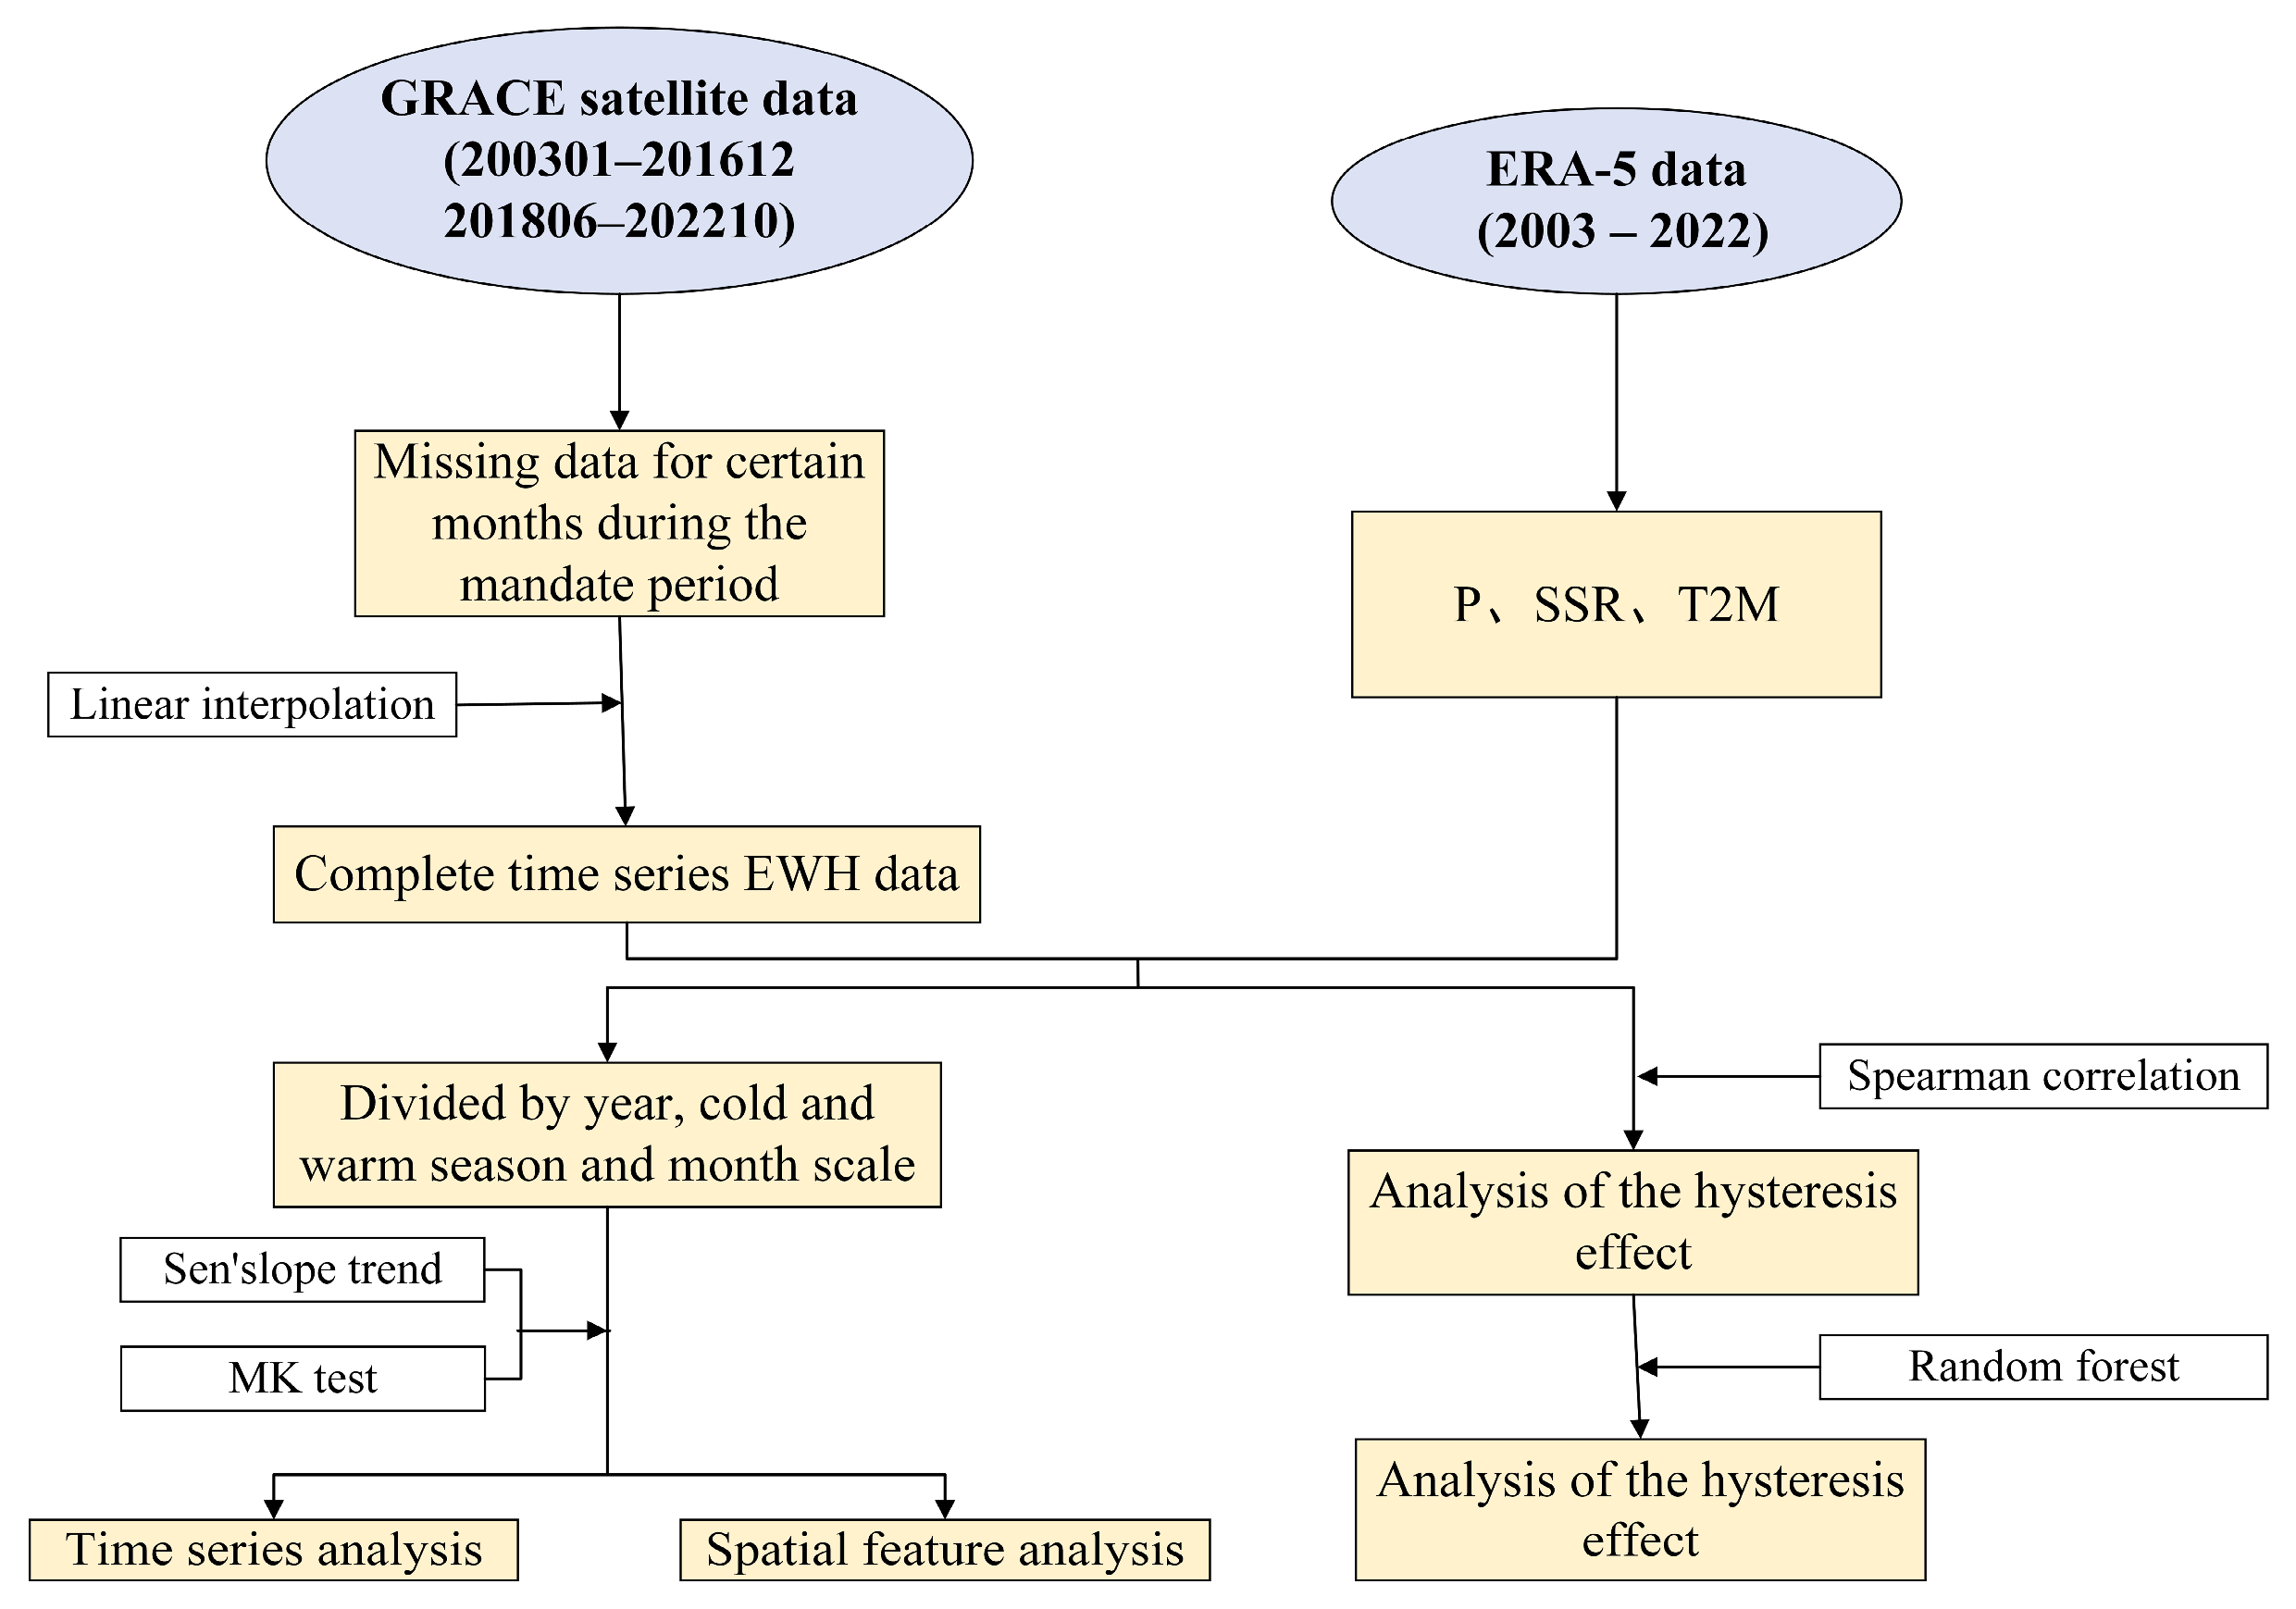
The article’s process is illustrated in Figure 2. This study is divided into two main parts. The first part estimates the mass balance trend of the Antarctic ice sheet using GRACE satellite data. The second part explores the relationship between changes in the ice sheet’s mass balance and the climate variables P (precipitation), SSR (surface net solar radiation) and T2M (2 m temperature). The primary study methods employed include the Sen’s slope estimation method, Spearman correlation, and random forest.

2.3.1. Sen Slope Trend Estimation and MK Test

To explore the rate of change in the Antarctic ice sheet’s mass, this study employs the Sen slope estimation method. This robust, non-parametric statistical technique is less sensitive to measurement errors and outliers, making it suitable for analyzing the time series data of the Antarctic ice sheet. It offers greater accuracy compared to linear regression. The calculation formula is as follows:
s l o p e = M e d i a n ( E W H j E W H i j i   )                           j > i ,
The Median represents the median value, while EWHi represents the EWH of the ith month. A positive slope (slope > 0) indicates an increasing trend in Antarctic ice sheet mass accumulation, whereas a negative slope (slope < 0) suggests a loss trend of the Antarctic ice sheet.
Additionally, the Mann–Kendall (MK) method is used to assess the significance of the trend. The MK test is a non-parametric method for detecting trends in time series data and is robust to missing values and outliers, making it well-suited for hydrological series trends. It is appropriate for long-term series data. If the p-value from the test is less than the significance level, the trend in the Antarctic ice sheet’s mass change is considered significant.

2.3.2. Spearman Correlation Analysis

This study uses the Spearman correlation coefficient to quantify the impact of precipitation, surface net solar radiation, and temperature on ice sheet mass changes. This approach allows for the assessment of the lagged response of Antarctic ice sheet mass changes to these climate factors. The formula for calculating the Spearman correlation coefficient is as follows:
r x y = i = 1 n ( E W H i E W H ¯ ) ( x i x ¯ ) i = 1 n ( E W H i E W H ¯ ) 2 i = 1 n ( x i x ¯ ) 2   ,
The variable “rxy” represents the correlation coefficient quantifying the relationship between changes in Antarctic ice sheet mass and climate factors. EWHi represents the EWH in the ith year, E W H ¯ denotes the mean value of EWH, xi denotes the precipitation (net surface solar radiation, air temperature) in the ith year, and x ¯ denotes the mean value of the precipitation (net surface solar radiation, air temperature). A positive correlation is indicated when rxy > 0, while a negative correlation is indicated when rxy < 0. The significance of the correlation is determined through the utilization of a t-test.

2.3.3. Random Forest Model

To further explore the impact of precipitation, net surface solar radiation, and temperature on Antarctic ice sheet mass changes, this study employs the random forest model to quantitatively assess the relative contributions of each influencing factor [22]. The random forest model is a nonlinear supervised machine learning algorithm that combines multiple decision trees using ensemble learning techniques. It effectively handles nonlinear relationships between ice sheet mass changes and various influencing factors, offers good tolerance for outliers and noise, and addresses multicollinearity issues. The random forest model provides a better simulation of the statistical relationships between climate data (such as precipitation and temperature) and GRACE data [23].
The operating principle of the random forest model is as follows: After setting the sampling parameters, the system randomly extracts a subset of samples from the dataset with replacement. Nonlinear regression is then performed to model the relationship between ice sheet mass changes and each influencing factor for each sample set, with the fitting result serving as the predicted value of ice sheet mass changes. Each influencing factor contributes to the predicted value, and this contribution is quantified as the importance score. The model provides an average importance score for each factor, reflecting its relative contribution to the predicted changes in ice sheet mass. A higher importance score indicates a greater relative contribution to the changes observed in the ice sheet data. To quantitatively evaluate each factor’s contribution, this study divides the dataset into a training set and a test set in a 7:3 ratio, normalizes the importance scores, and represents the relative contributions as percentages.

3. Results

3.1. Interannual Variations in the Mass Balance of the Antarctic Ice Sheet

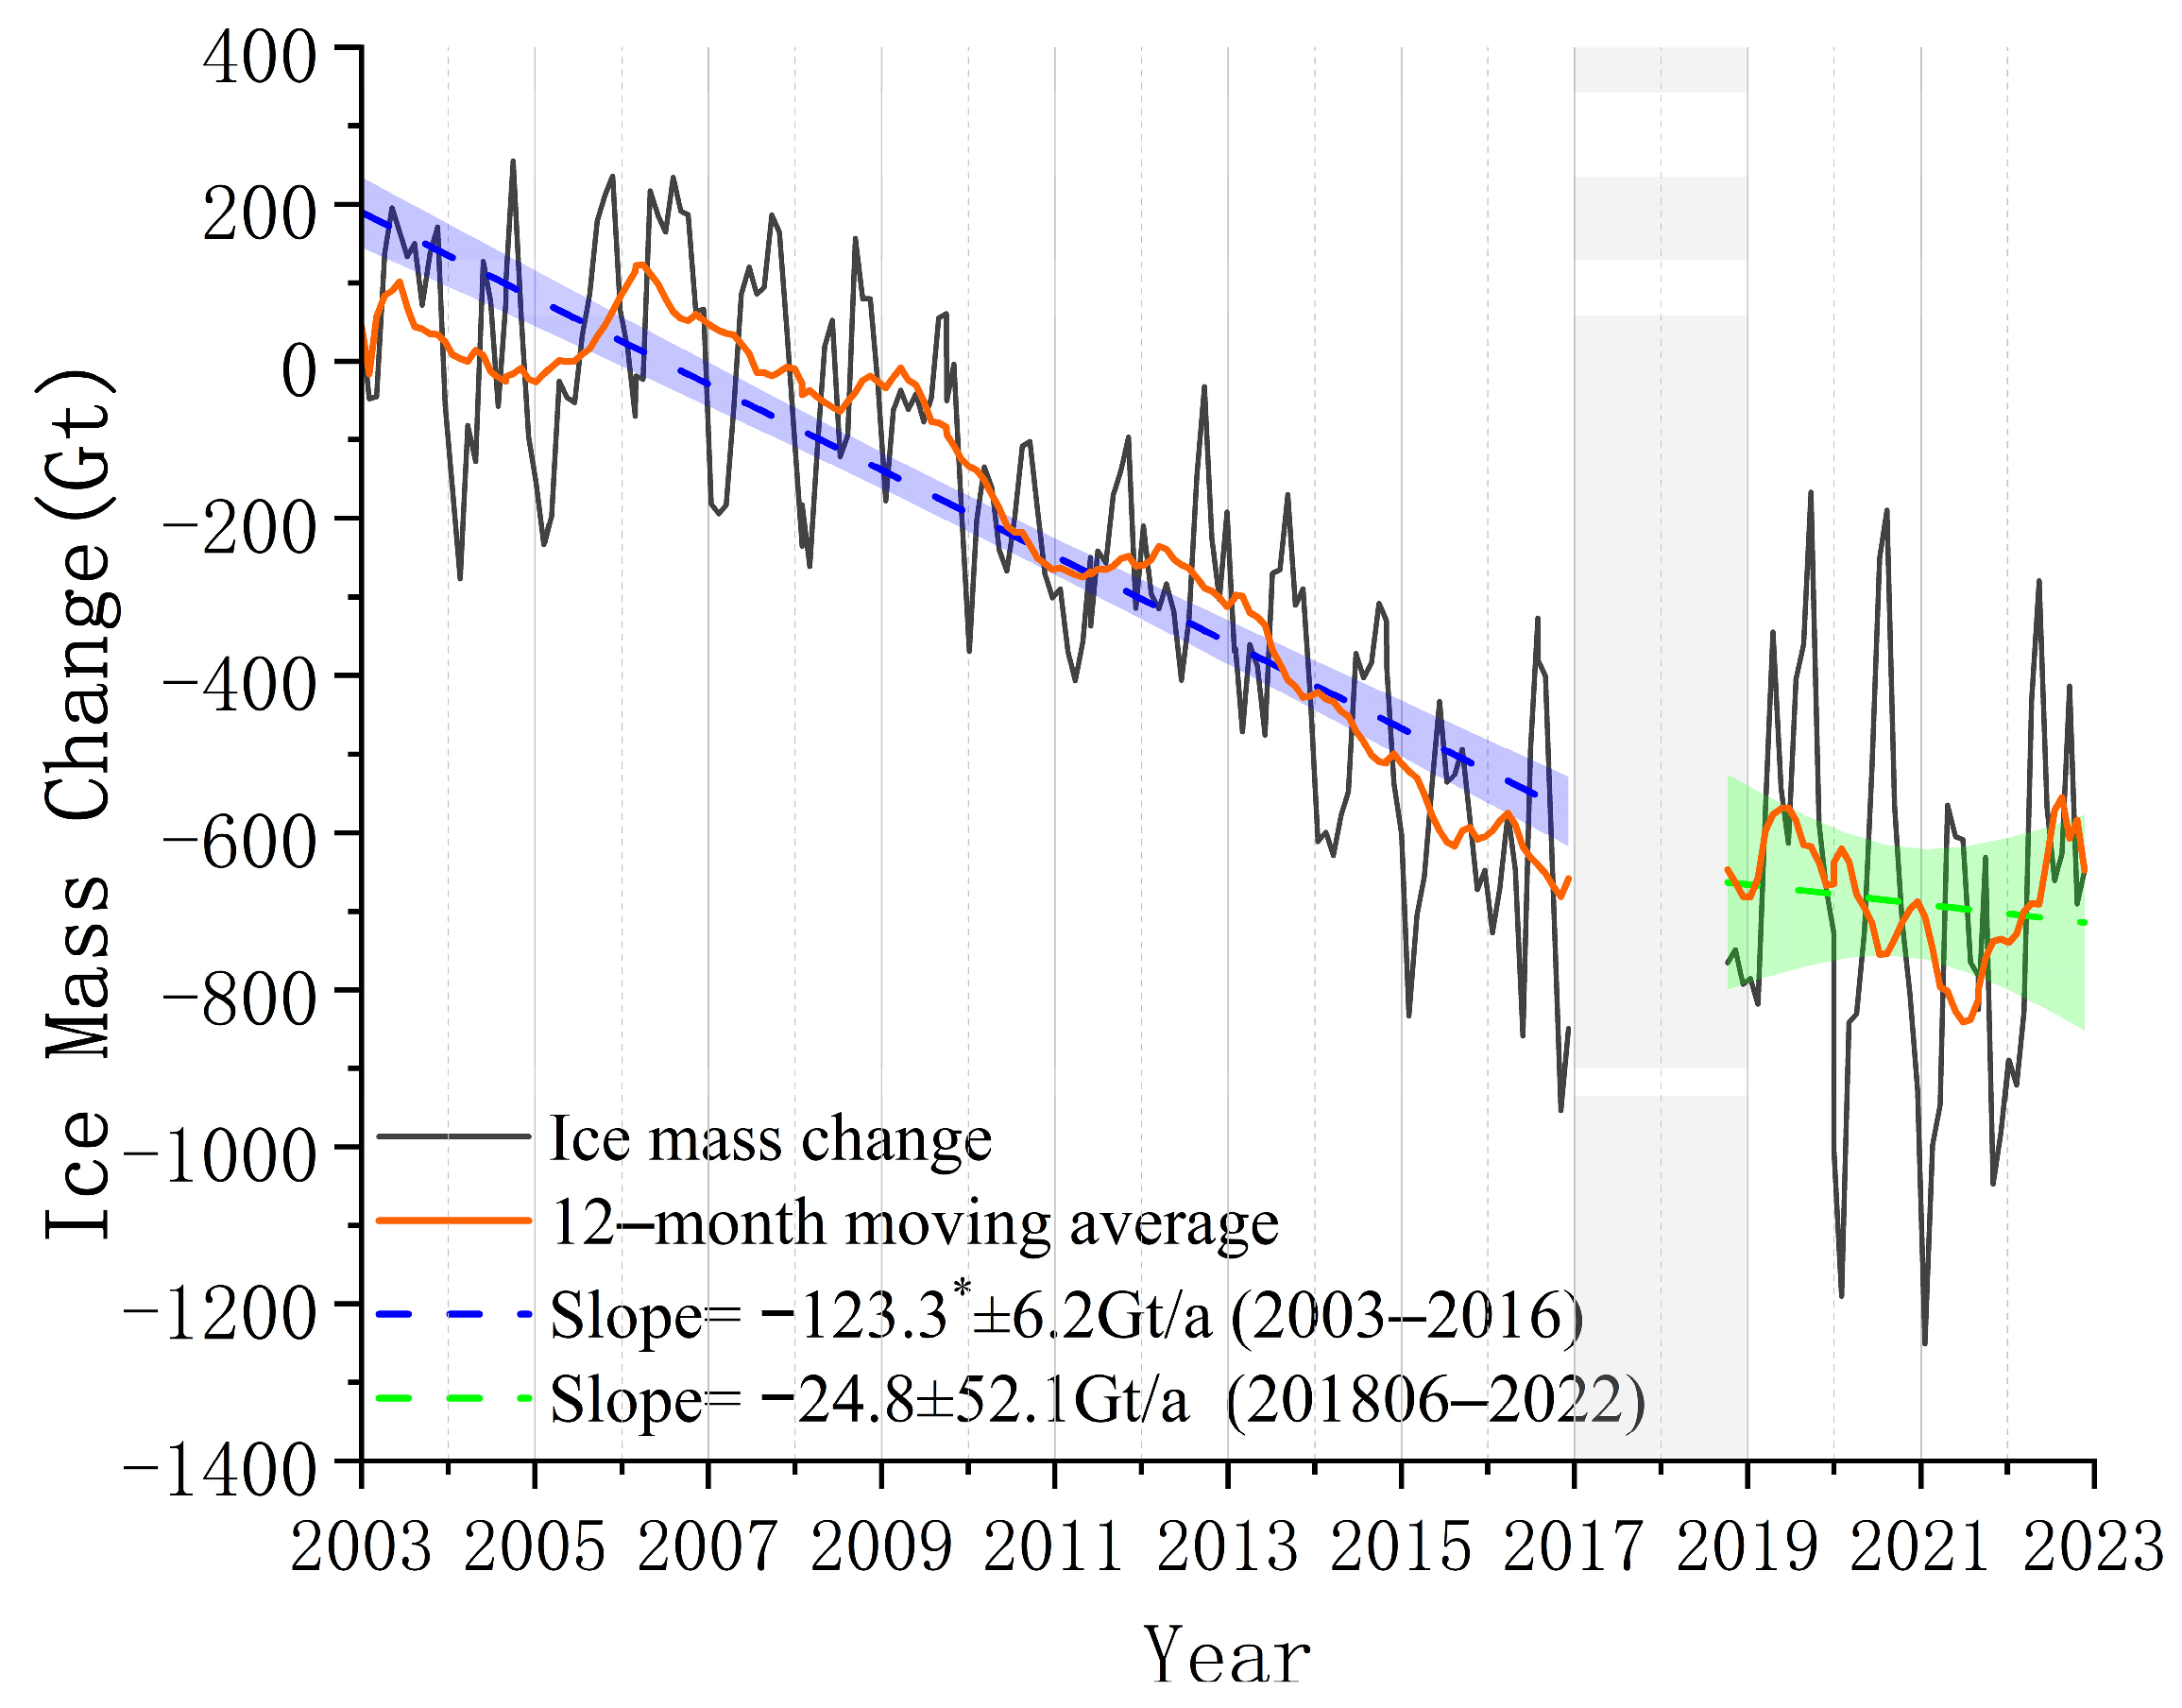
Figure 3 displays the time series of the Antarctic ice sheet mass changes calculated from GRACE gravity satellite data for the period 2003 to 2022. To analyze the interannual variation characteristics of these changes, the 12-month sliding average method is applied to illustrate annual fluctuations. Overall, from 2003 to 2022, the Antarctic ice sheet experienced a noticeable loss trend. The loss rate of ice sheet mass from 2003 to 2016 was −123.3 ± 6.2 Gt/a (p < 0.05, R2 = 0.70), indicating a significant mass loss. Analysis with the sliding average method reveals that from 2003 to 2007, the ice sheet mass change was relatively stable with a slight loss. However, from 2008 to 2011, the ice sheet lost mass dramatically, and the loss intensified further from 2012 to 2015, with a loss rate of −185.6 ± 24.6 Gt/a (p < 0.05). In 2016, the rate of loss decreased, and the accelerated loss trend came to a halt. From 2018 to 2022, the rate of Antarctic ice sheet mass loss slowed down, but the short time interval makes this change not statistically significant. During this period, the loss of the ice sheet extended inland, leading to substantial interannual fluctuations in ice sheet mass changes. Overall, the losses remain severe, with the maximum ice sheet mass loss reaching 1250 Gt in January 2021.
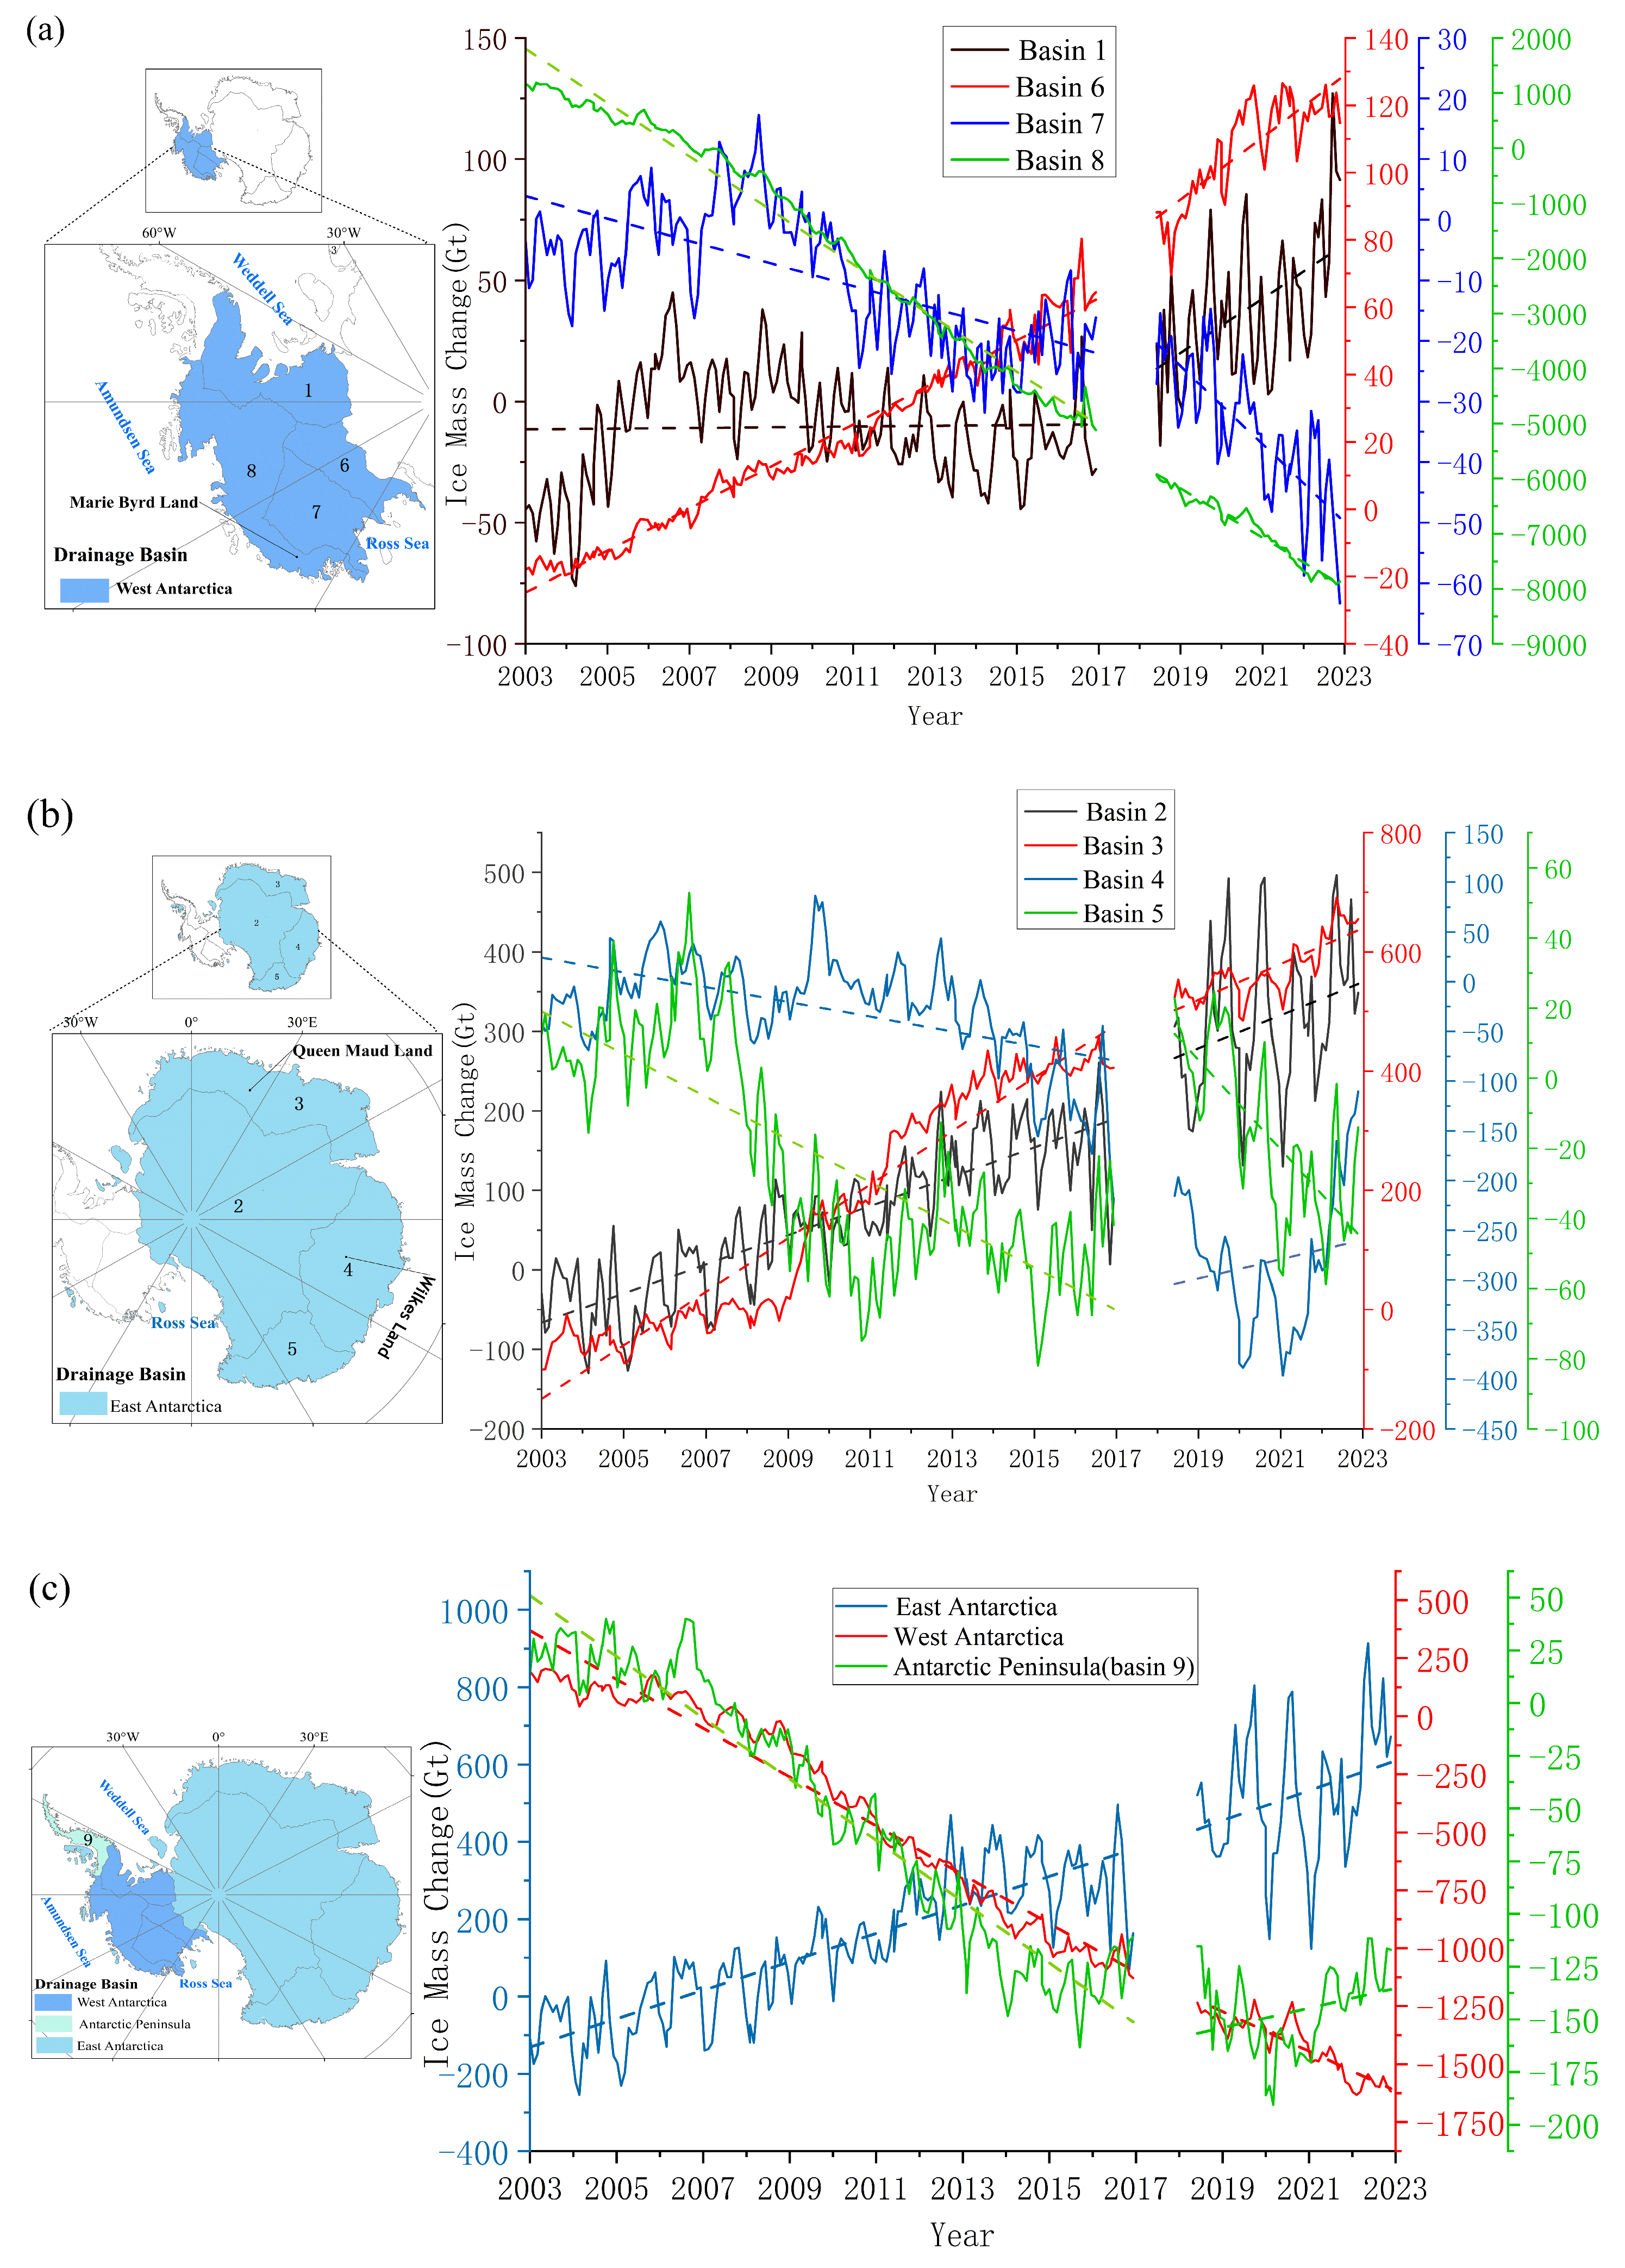
The trends in ice sheet mass changes across nine basins from 2003 to 2022 were estimated at the basin scale, as shown in Figure 4. Moreover, the changing trends of ice sheet mass balance in each basin are given in Table 1. The calculation results reveal that West Antarctica is one of the regions with significant Antarctic ice sheet mass loss. Within this region, the most severe lose mass occurs in the Amundsen Bay area (Basin 8), where many glaciers flow and lose mass rapidly [24]. From 2003 to 2016, the rate of ice sheet mass change in this area was −488.79 ± 5.26 Gt/a (p < 0.05). The change in ice sheet mass was relatively mild with a slight downward trend from 2003 to 2006. However, starting in 2007, the trend intensified significantly, with a marked increase in loss. This phenomenon is likely linked to multiple large-scale glacier calving events in the area and substantial mass loss [8]. From 2003 to 2016, the rate of ice sheet mass change in East Antarctica was 36.77 ± 1.71 Gt/a (p < 0.05), indicating a slight upward trend. However, in Wilkes Land (Basin 4), with a mass loss rate of −7.45 ± 0.85 Gt/a (p < 0.05) during the same period. From 2003 to 2008, mass changes in the East Antarctic ice sheet were relatively stable. However, from 2010 to 2016, a significant loss trend emerged. The loss intensified further from 2018 to 2022, reaching a peak of −400 Gt in 2021. Following this peak, mass loss gradually decreased, but the overall state of the ice sheet remains in a condition of ablation. The Antarctic Peninsula (Basin 9) also experienced significant ice sheet mass loss, with a rate of −14.52 ± 0.31 Gt/a (p < 0.05) in its ice sheet mass balance between 2002 and 2016. The mass change was relatively stable from 2003 to 2007. Loss intensified between 2008 and 2014, but the loss rate gradually slowed down afterward, leading to a relatively stable loss trend thereafter. Compared to the period from 2003 to 2016, ice sheet mass loss in the Antarctic Peninsula increased significantly from 2019 to 2022. Although there was a slight upward trend starting in 2020, the mass loss level returned to that of 2016 by the end of 2022. These observations are consistent with the findings of Isabella Velicogna and John Wahr (2020) [16]. Aside from the previously mentioned areas, most other regions of Antarctica show a significant increasing trend in ice sheet mass. Notable increases are observed in the Weddell Coast (Basin 1) and Camp Basin (Basin 6) in West Antarctica, as well as in the Antarctic Continent (Basin 2) and Queen Maud Land (Basin 3) in East Antarctica. In Queen Maud Land, a sudden increase in snowfall in 2009 resulted in substantial ice sheet accumulation [25]. Although this accumulation helps offset some losses in specific areas, the Antarctic ice sheet overall still exhibits a significant mass loss trend.

3.2. Spatial Changes in the Mass Balance of the Antarctic Ice Sheet

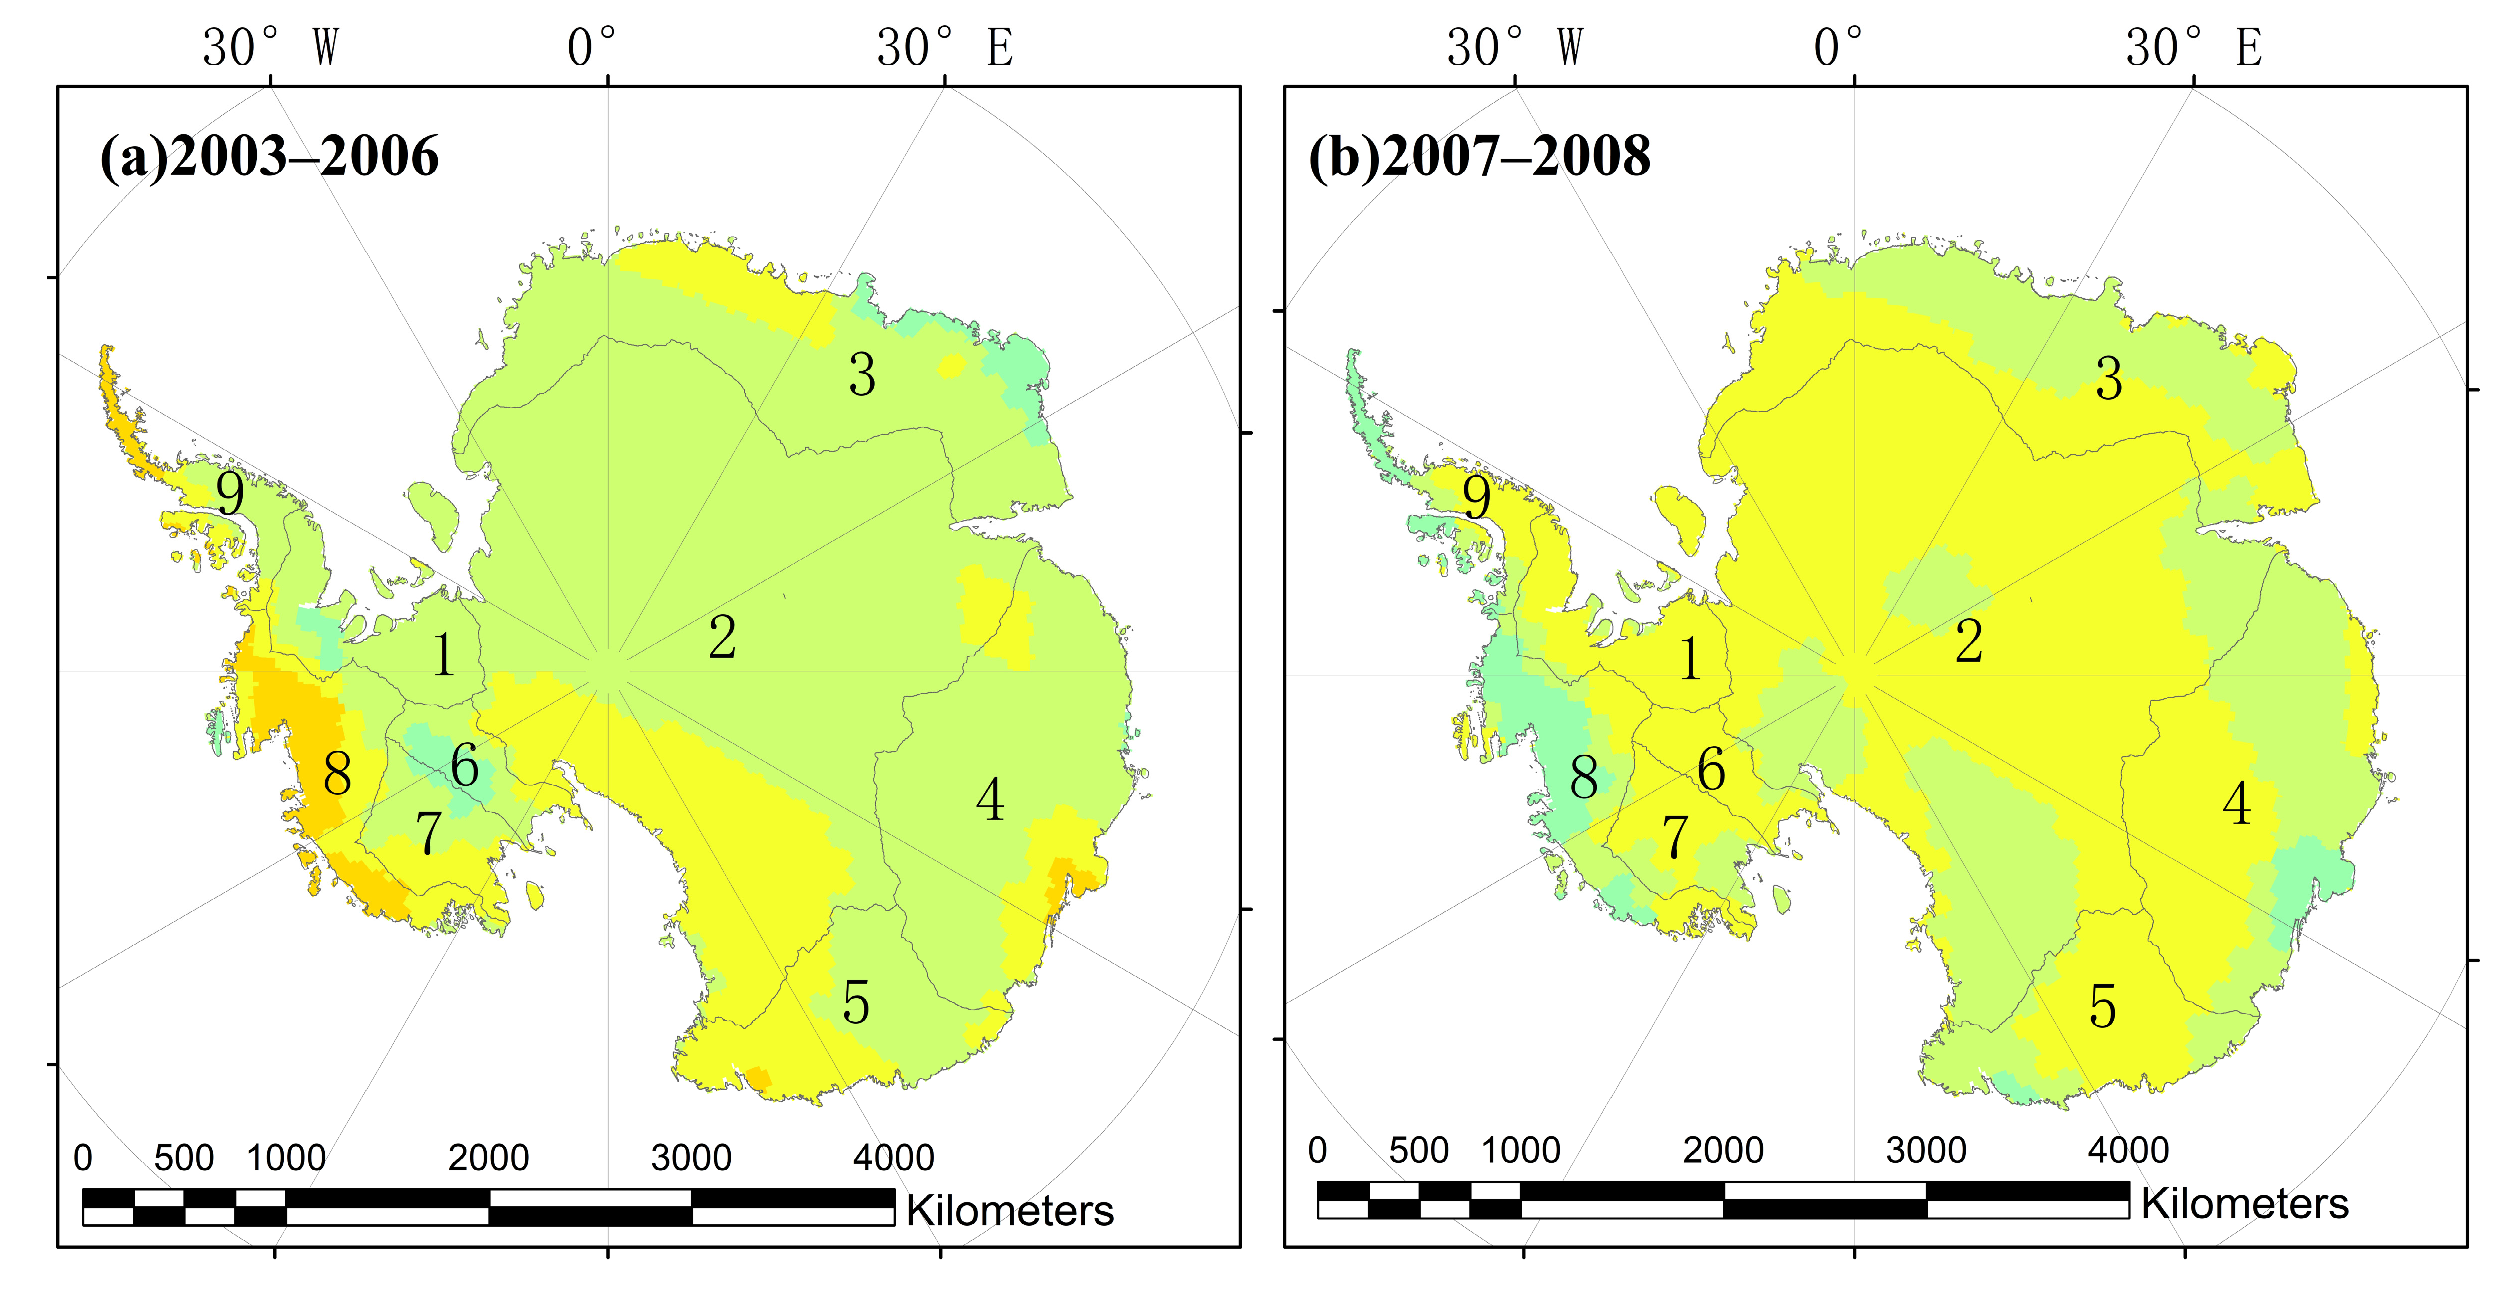
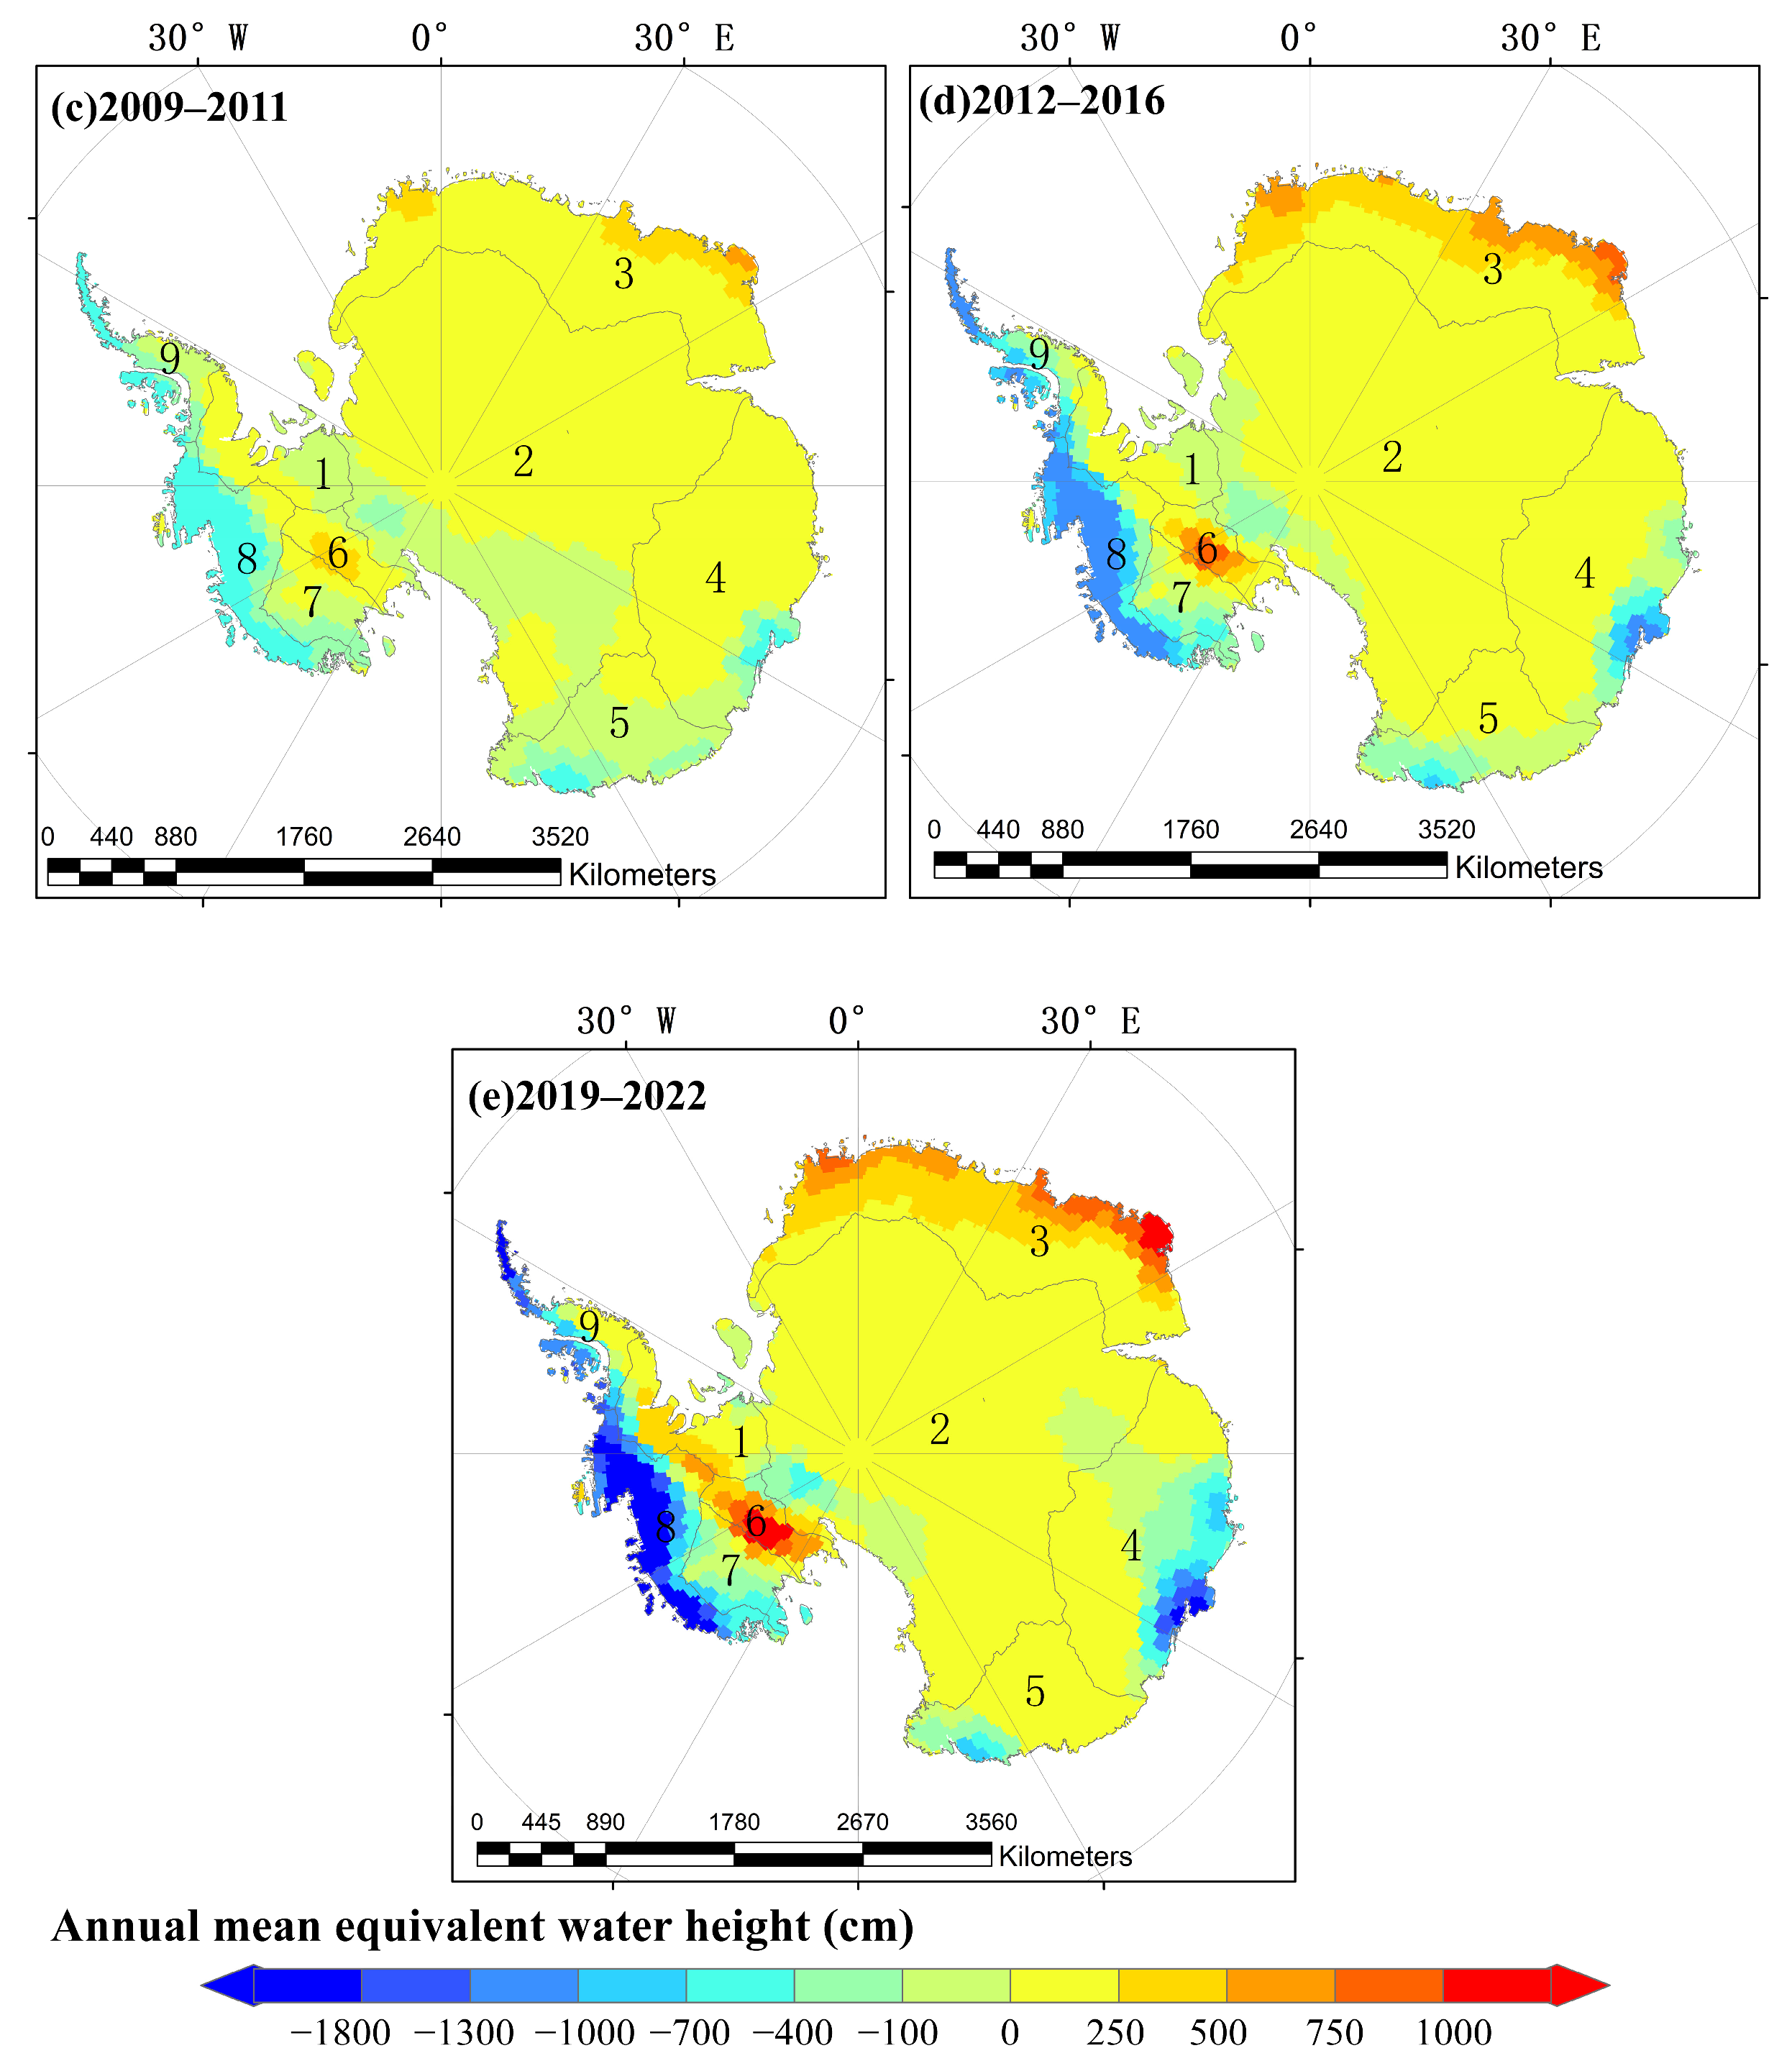
Figure 5 illustrates the spatial distribution of the annual average equivalent water height for the mass balance of the Antarctic ice sheet across each basin over different time periods. From 2003 to 2022, the mass balance trend shifted from “accumulation in West Antarctica and loss in East Antarctica” to “loss in West Antarctica and accumulation in East Antarctica” over the years. From 2003 to 2006, the ice sheet in the Amundsen Sea in West Antarctica and the area near the Drake Passage on the Antarctic Peninsula experienced accumulation. However, starting in 2007, these areas began to show losses, with these losses intensifying year by year after 2009, making them the largest contributors to mass loss in the Antarctic ice sheet. The increased intrusion of warm circumpolar deep water, the retreat of the glacier grounding lines, and accelerated glacier instability have led to large-scale losses of the Amundsen coastal ice sheet [16].
During 2003–2006, the ice sheet in the coastal area of Wilkes Land in East Antarctica experienced a slight accumulation. However, from 2007 to 2016, the loss of the ice sheet gradually intensified and expanded. As the acceleration of ice flow outpaced the ability to maintain equilibrium and the intrusion of warm circumpolar deep water increased, this region became one of the main areas of Antarctic ice sheet loss from 2019 to 2022 [16]. In contrast, the ice sheets in the Antarctic Plateau and Queen Maud Land in East Antarctica experienced a slight loss from 2003 to 2006, followed by a period of accumulation starting in 2007. From 2009 to 2011, over 85% of the total ice sheet area in the Antarctic Plateau was in a state of accumulation, with the accumulated area expanding each year. Snowfall in Queen Maud Land surged suddenly in 2009 and has continued to increase each year [26]. This resulted in a significant mass accumulation in the ice sheet in this area, particularly pronounced in the marginal ice sheet from 2012 to 2016. Between 2019 and 2022, this region emerged as the area with the highest mass accumulation in the Antarctic ice sheet. Similarly, the Camp Flow area in West Antarctica experienced a slight loss between 2003 and 2006. Since 2007, mass accumulation has occurred in this region, with the accumulation intensifying from 2012 to 2016. From 2019 to 2022, this area also became one of the main regions of mass accumulation in the Antarctic ice sheet.
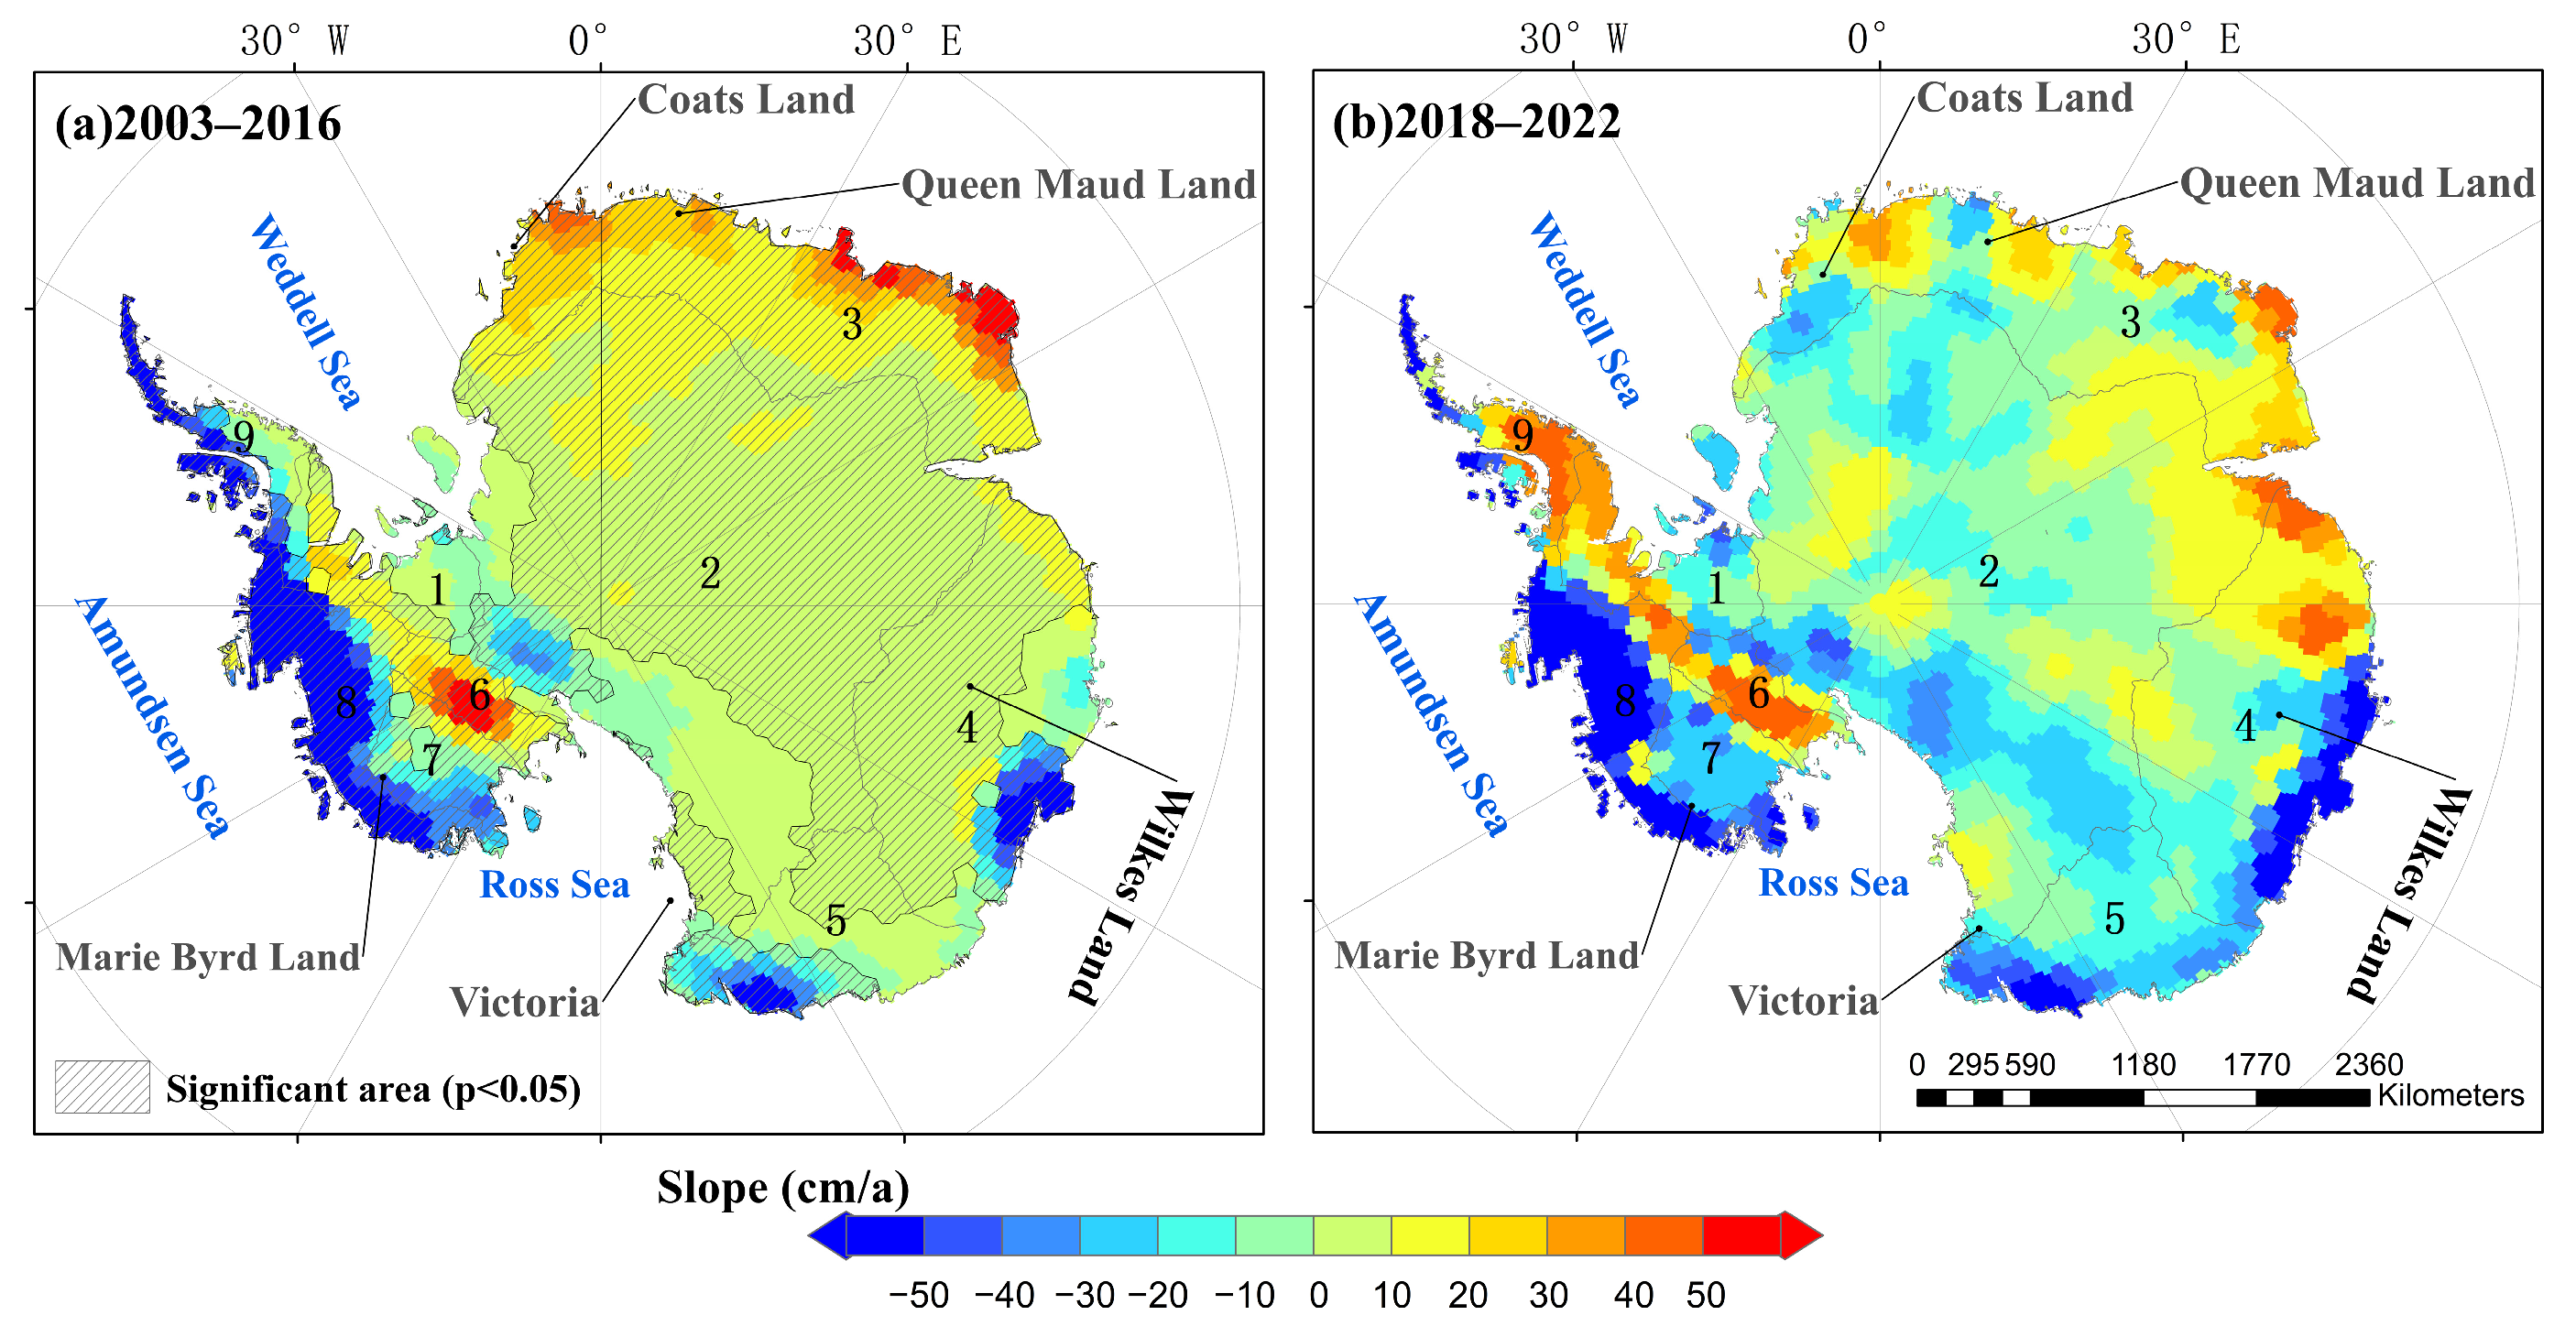
The spatial distribution of the equivalent water height (EWH) for the Antarctic ice sheet’s mass balance changes from 2003 to 2016 and from 2018 to 2022 was analyzed based on the change rate (Figure 6). Compared to the 2003–2016 period, there were more areas with increased mass loss rates in the Antarctic ice sheet from 2018 to 2022. However, due to the short duration of the 2018–2022 period, the change trend failed to pass the significance test. Overall, there are clear regional differences in the rate of Antarctic ice sheet mass changes. Areas with more pronounced changes generally have higher rates and are more likely to pass significance tests. The rate of ice sheet loss is notably faster along the edge of West Antarctica compared to East Antarctica, reflecting a spatial distribution that decreases from the coast to the inland plateau, similar to the elevation distribution in Antarctica. The slower ice flow speed in the Antarctic interior and the accelerated flow at the edges contribute to this spatial pattern [27]. In the Antarctic interior, the rate of change remains relatively stable, with a weak upward trend and significant accumulation near the Camp Flow. The primary loss areas include West Antarctica, the Drake Passage on the Antarctic Peninsula, and the coastal regions of Wilkes Land in East Antarctica. The Amundsen Sea in West Antarctica exhibits the fastest loss rate of the entire Antarctic ice sheet. In contrast, the Wilkes Land and Victoria Land ice sheets in East Antarctica show a slower trend in mass loss, while Queen Maud Land’s edge area demonstrates a significant trend in mass accumulation.

3.3. Temporal and Spatial Characteristics of Seasonal Variations in the Mass Balance of the Antarctic Ice Sheet

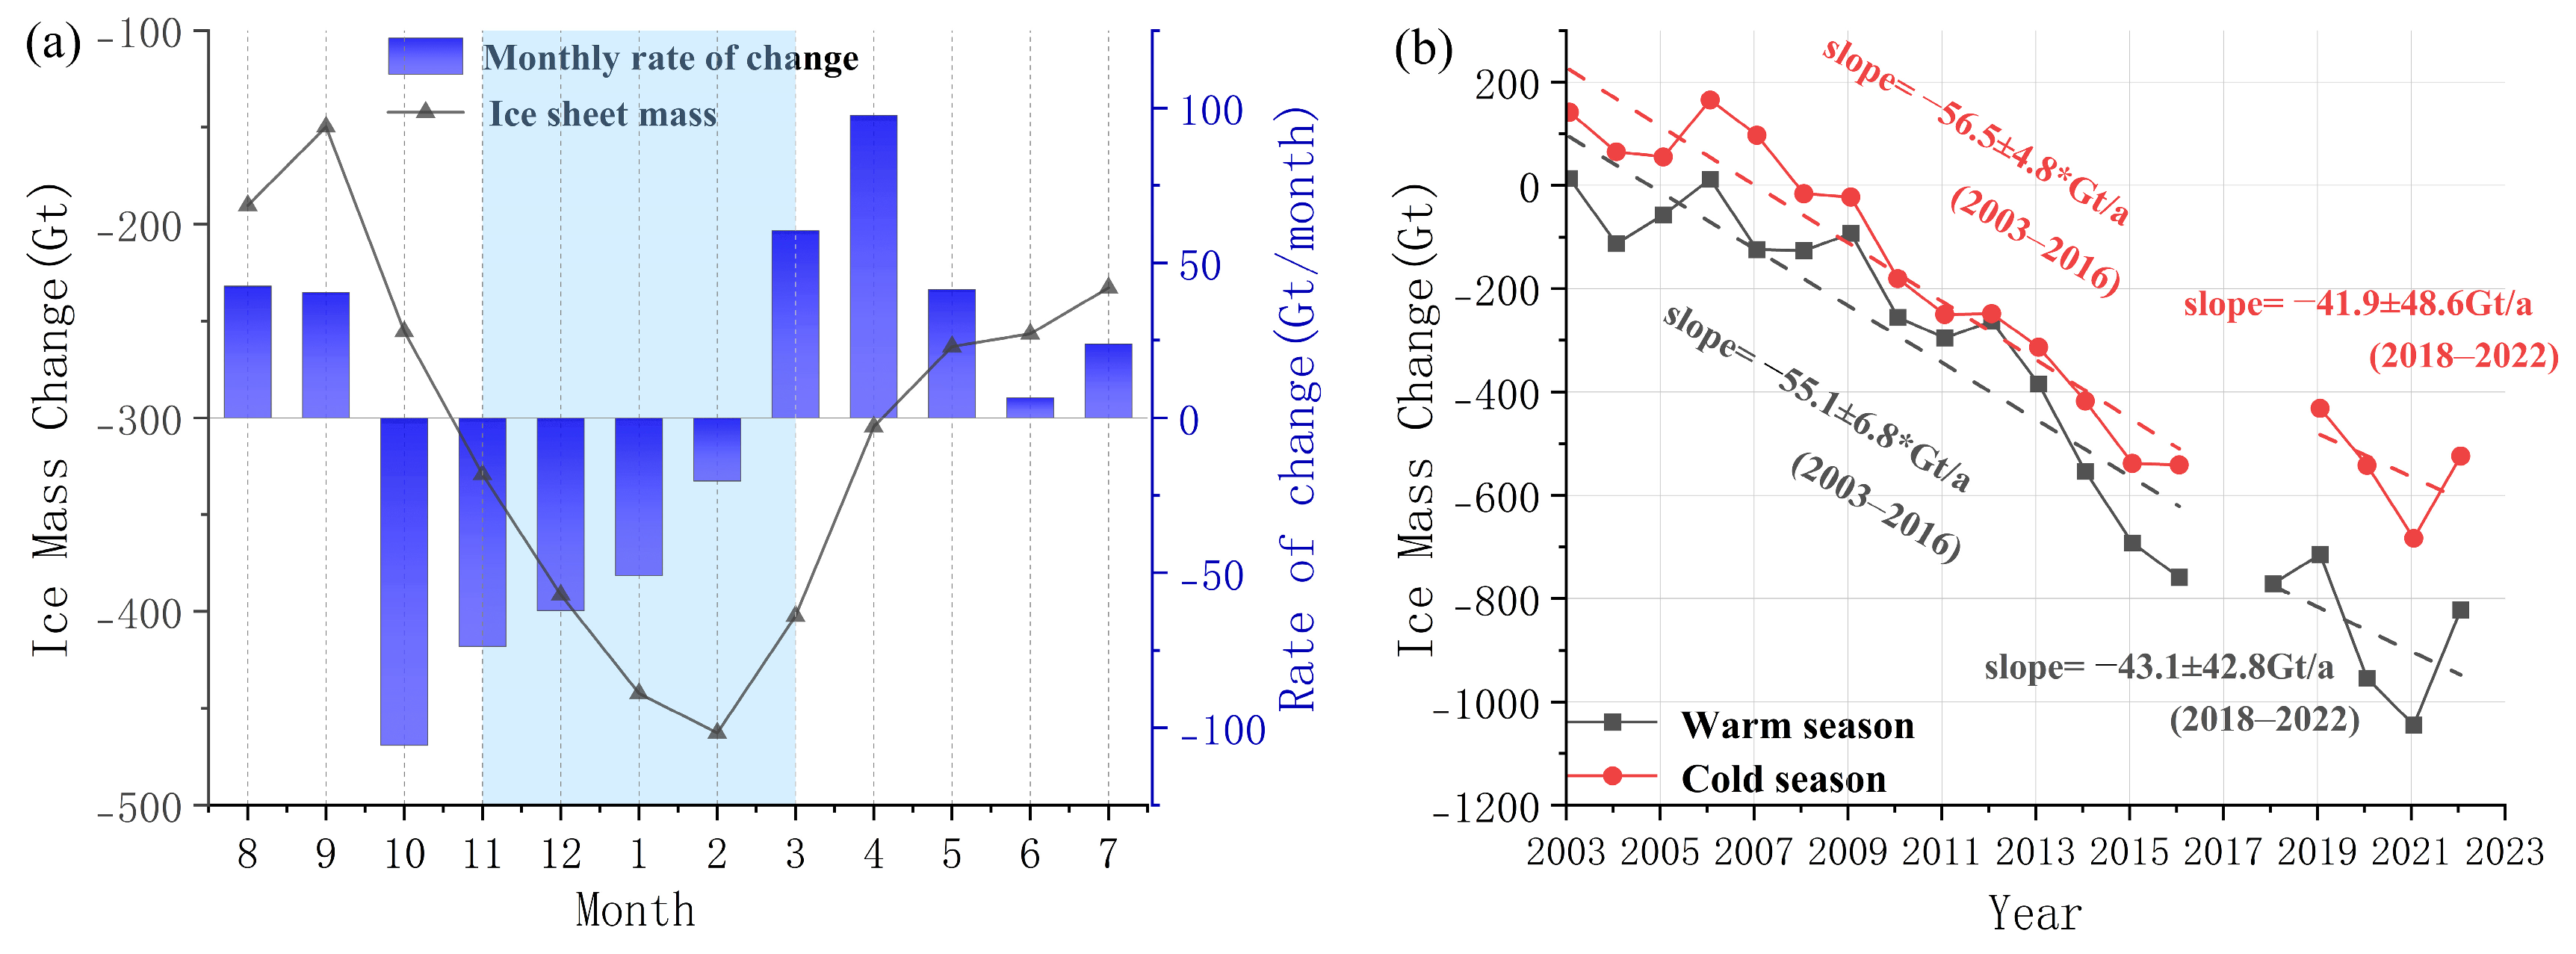
From the time series diagrams of Antarctica and its various basins, it is evident that the mass balance of the Antarctic ice sheet exhibits periodic fluctuations with distinct seasonal variations. Figure 7 presents the multi-year monthly average of the mass balance changes in the Antarctic ice sheet, along with the time series for both the cold and warm seasons. This study reveals that the ice sheet experiences loss throughout the year, with similar loss rates observed during both cold and warm seasons. Large-scale continuous loss predominantly occurs during the warm season, which is linked to the intensification of temperature, precipitation, and net surface solar radiation during this period. The rate of mass loss in the Antarctic ice sheet is highest during the transition between cold and warm seasons. As the warm season approaches, rising temperatures causes the loss rate to peak. Beginning in November, with the onset of the warm season, the ice sheet’s mass loss continues to increase, although the loss rate slows down. The maximum mass loss, recorded in February of the following year, is −462.7 Gt. As the cold season approaches, temperatures gradually decrease, and the positive rate of change in the ice sheet’s mass balance reaches its peak, leading to a slowdown in loss. The time series results (Figure 7b) also indicate a significant loss trend of the Antarctic ice sheet during both cold and warm seasons, with notable seasonal differences (p < 0.05). Over the entire observation period, the warm season shows a relatively higher rate of ice sheet mass loss, with change rates of −55.1 ± 6.8 Gt/a and −43.1 ± 42.8 Gt/a during the periods 2003–2016 and 2018–2022, respectively. Although temperatures in Antarctica’s cold season are cooler compared to the warm season, the ice sheet is still affected by factors such as warm ocean currents eroding the ice from below, continuous basal loss driven by geothermal heat, rising atmospheric temperatures due to global warming, and ice loss from calving glaciers. As a result, the Antarctic ice sheet continues to experience significant loss during the cold season, with change rates of −56.5 ± 4.8 Gt/a and −41.9 ± 48.6 Gt/a for the periods 2003–2016 and 2018–2022, respectively. Both the cold and warm seasons have shown intensified loss since 2009, peaking in 2021.
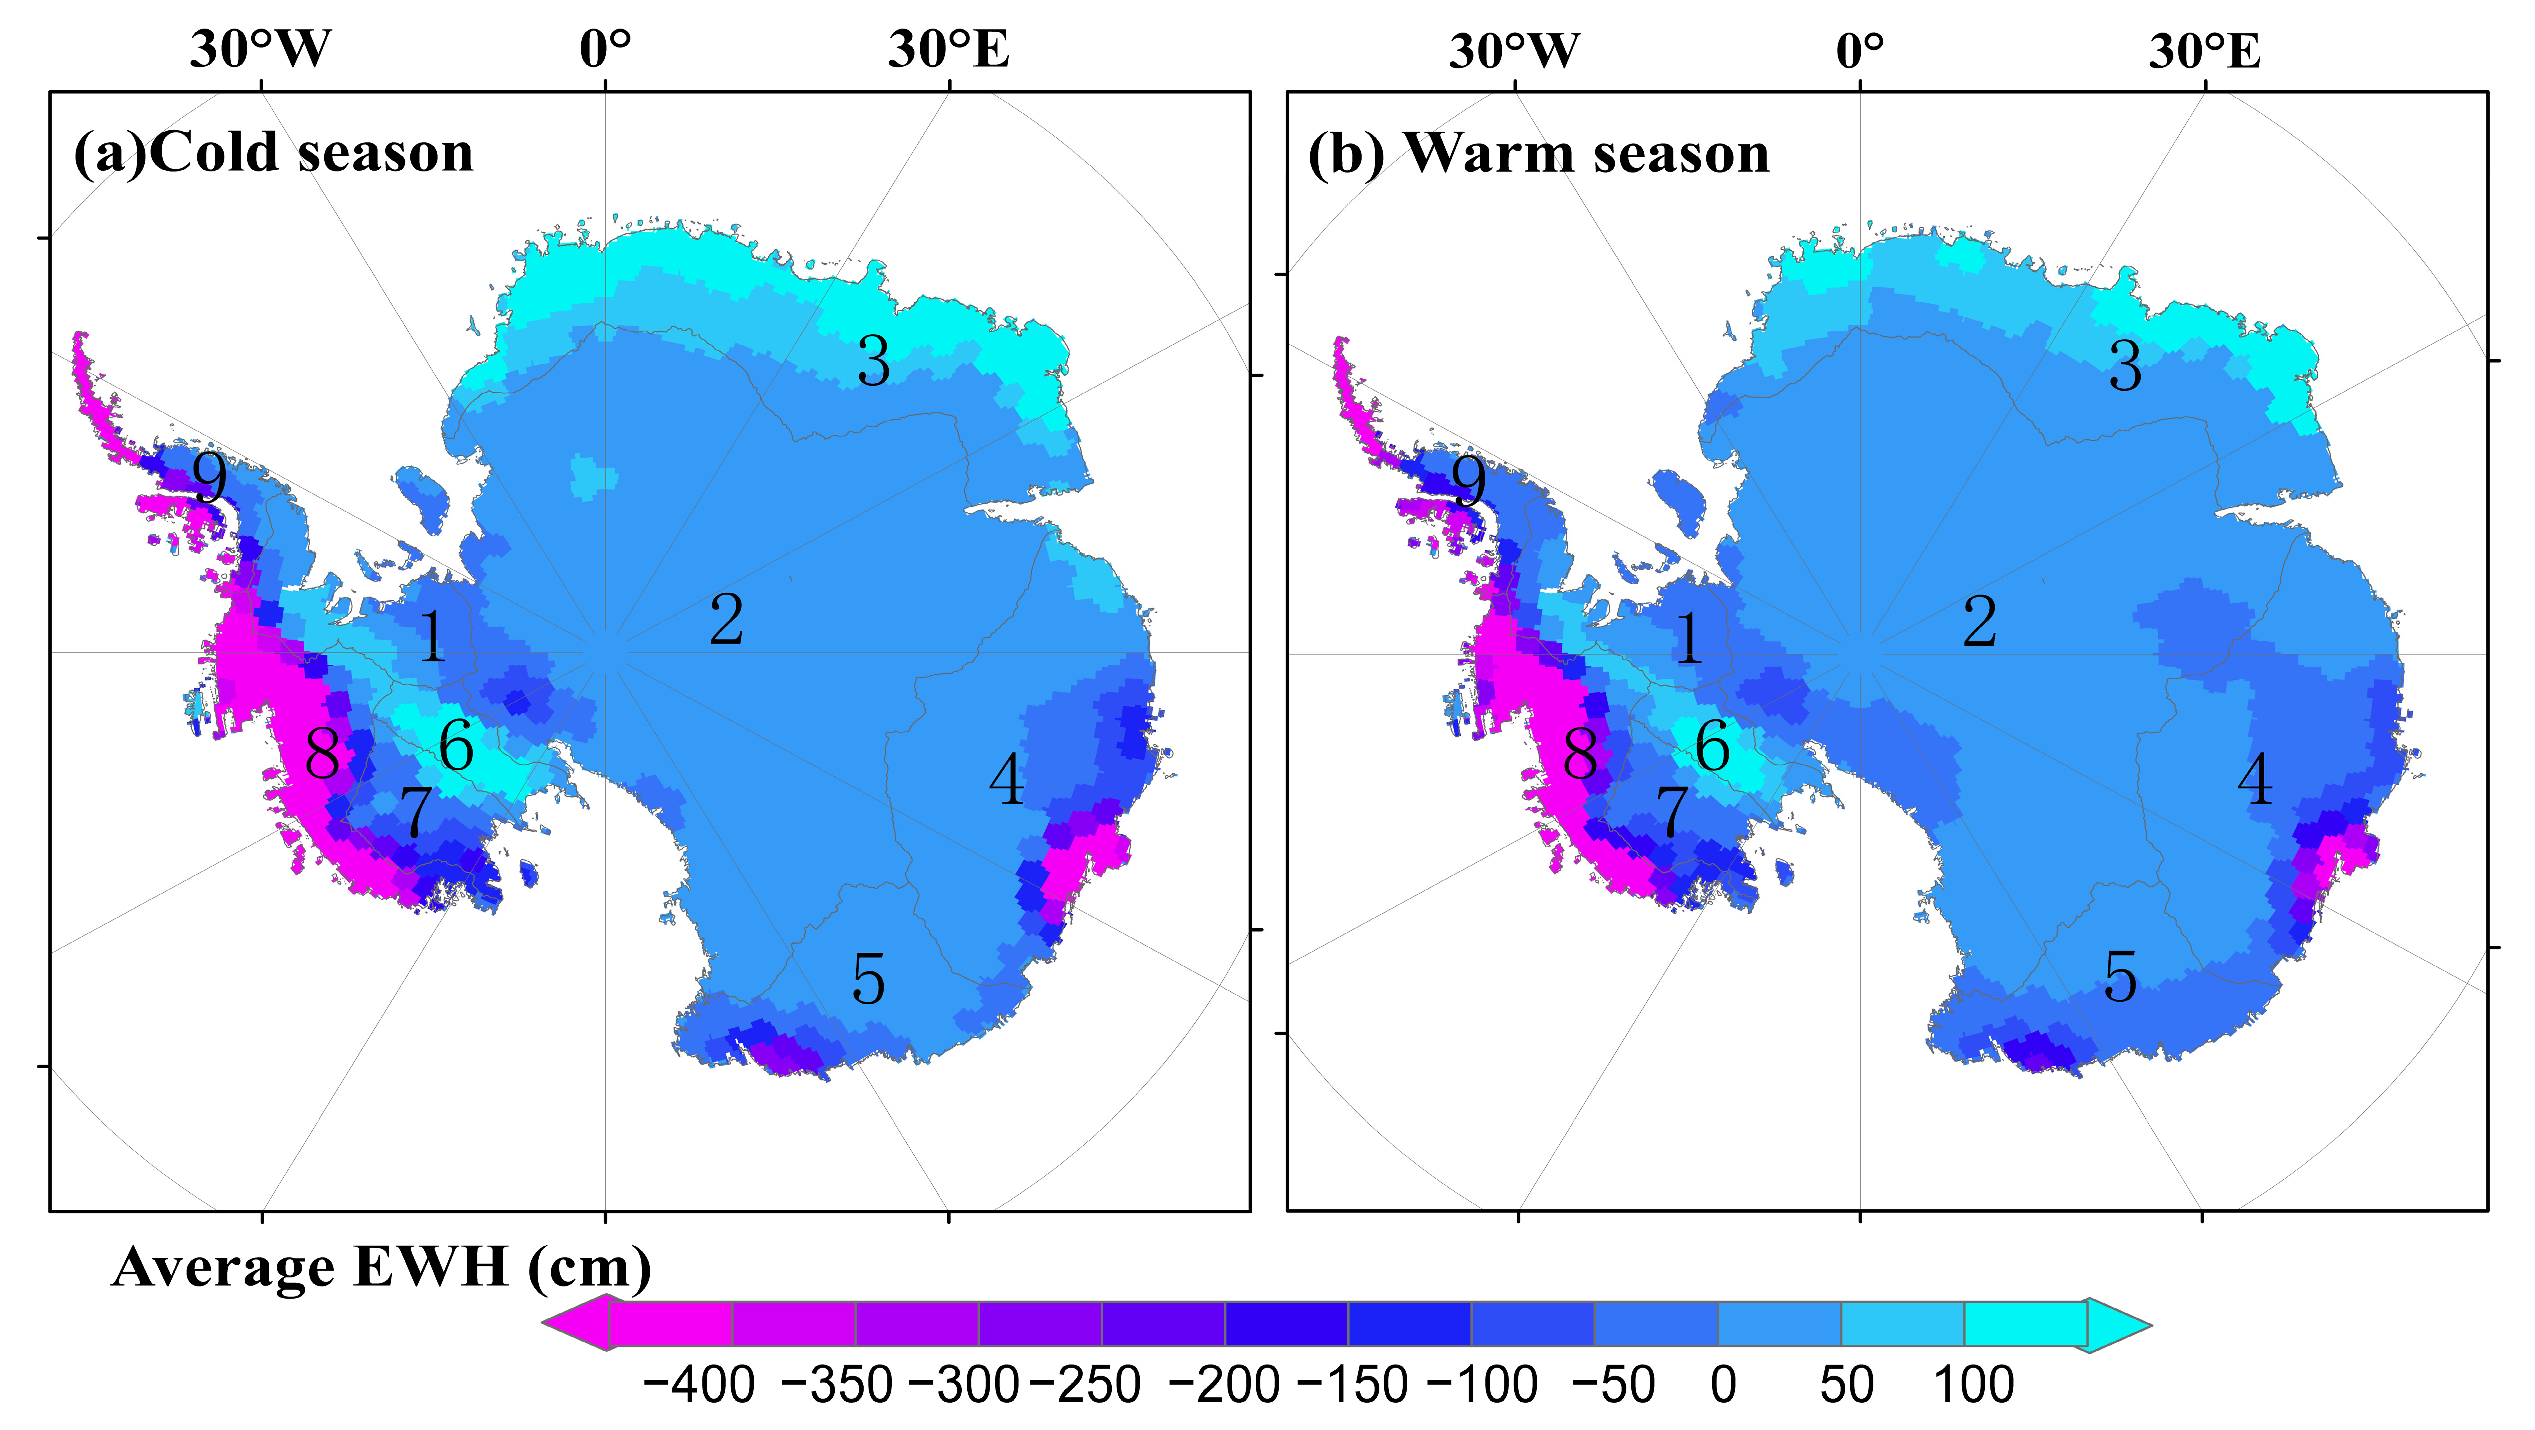
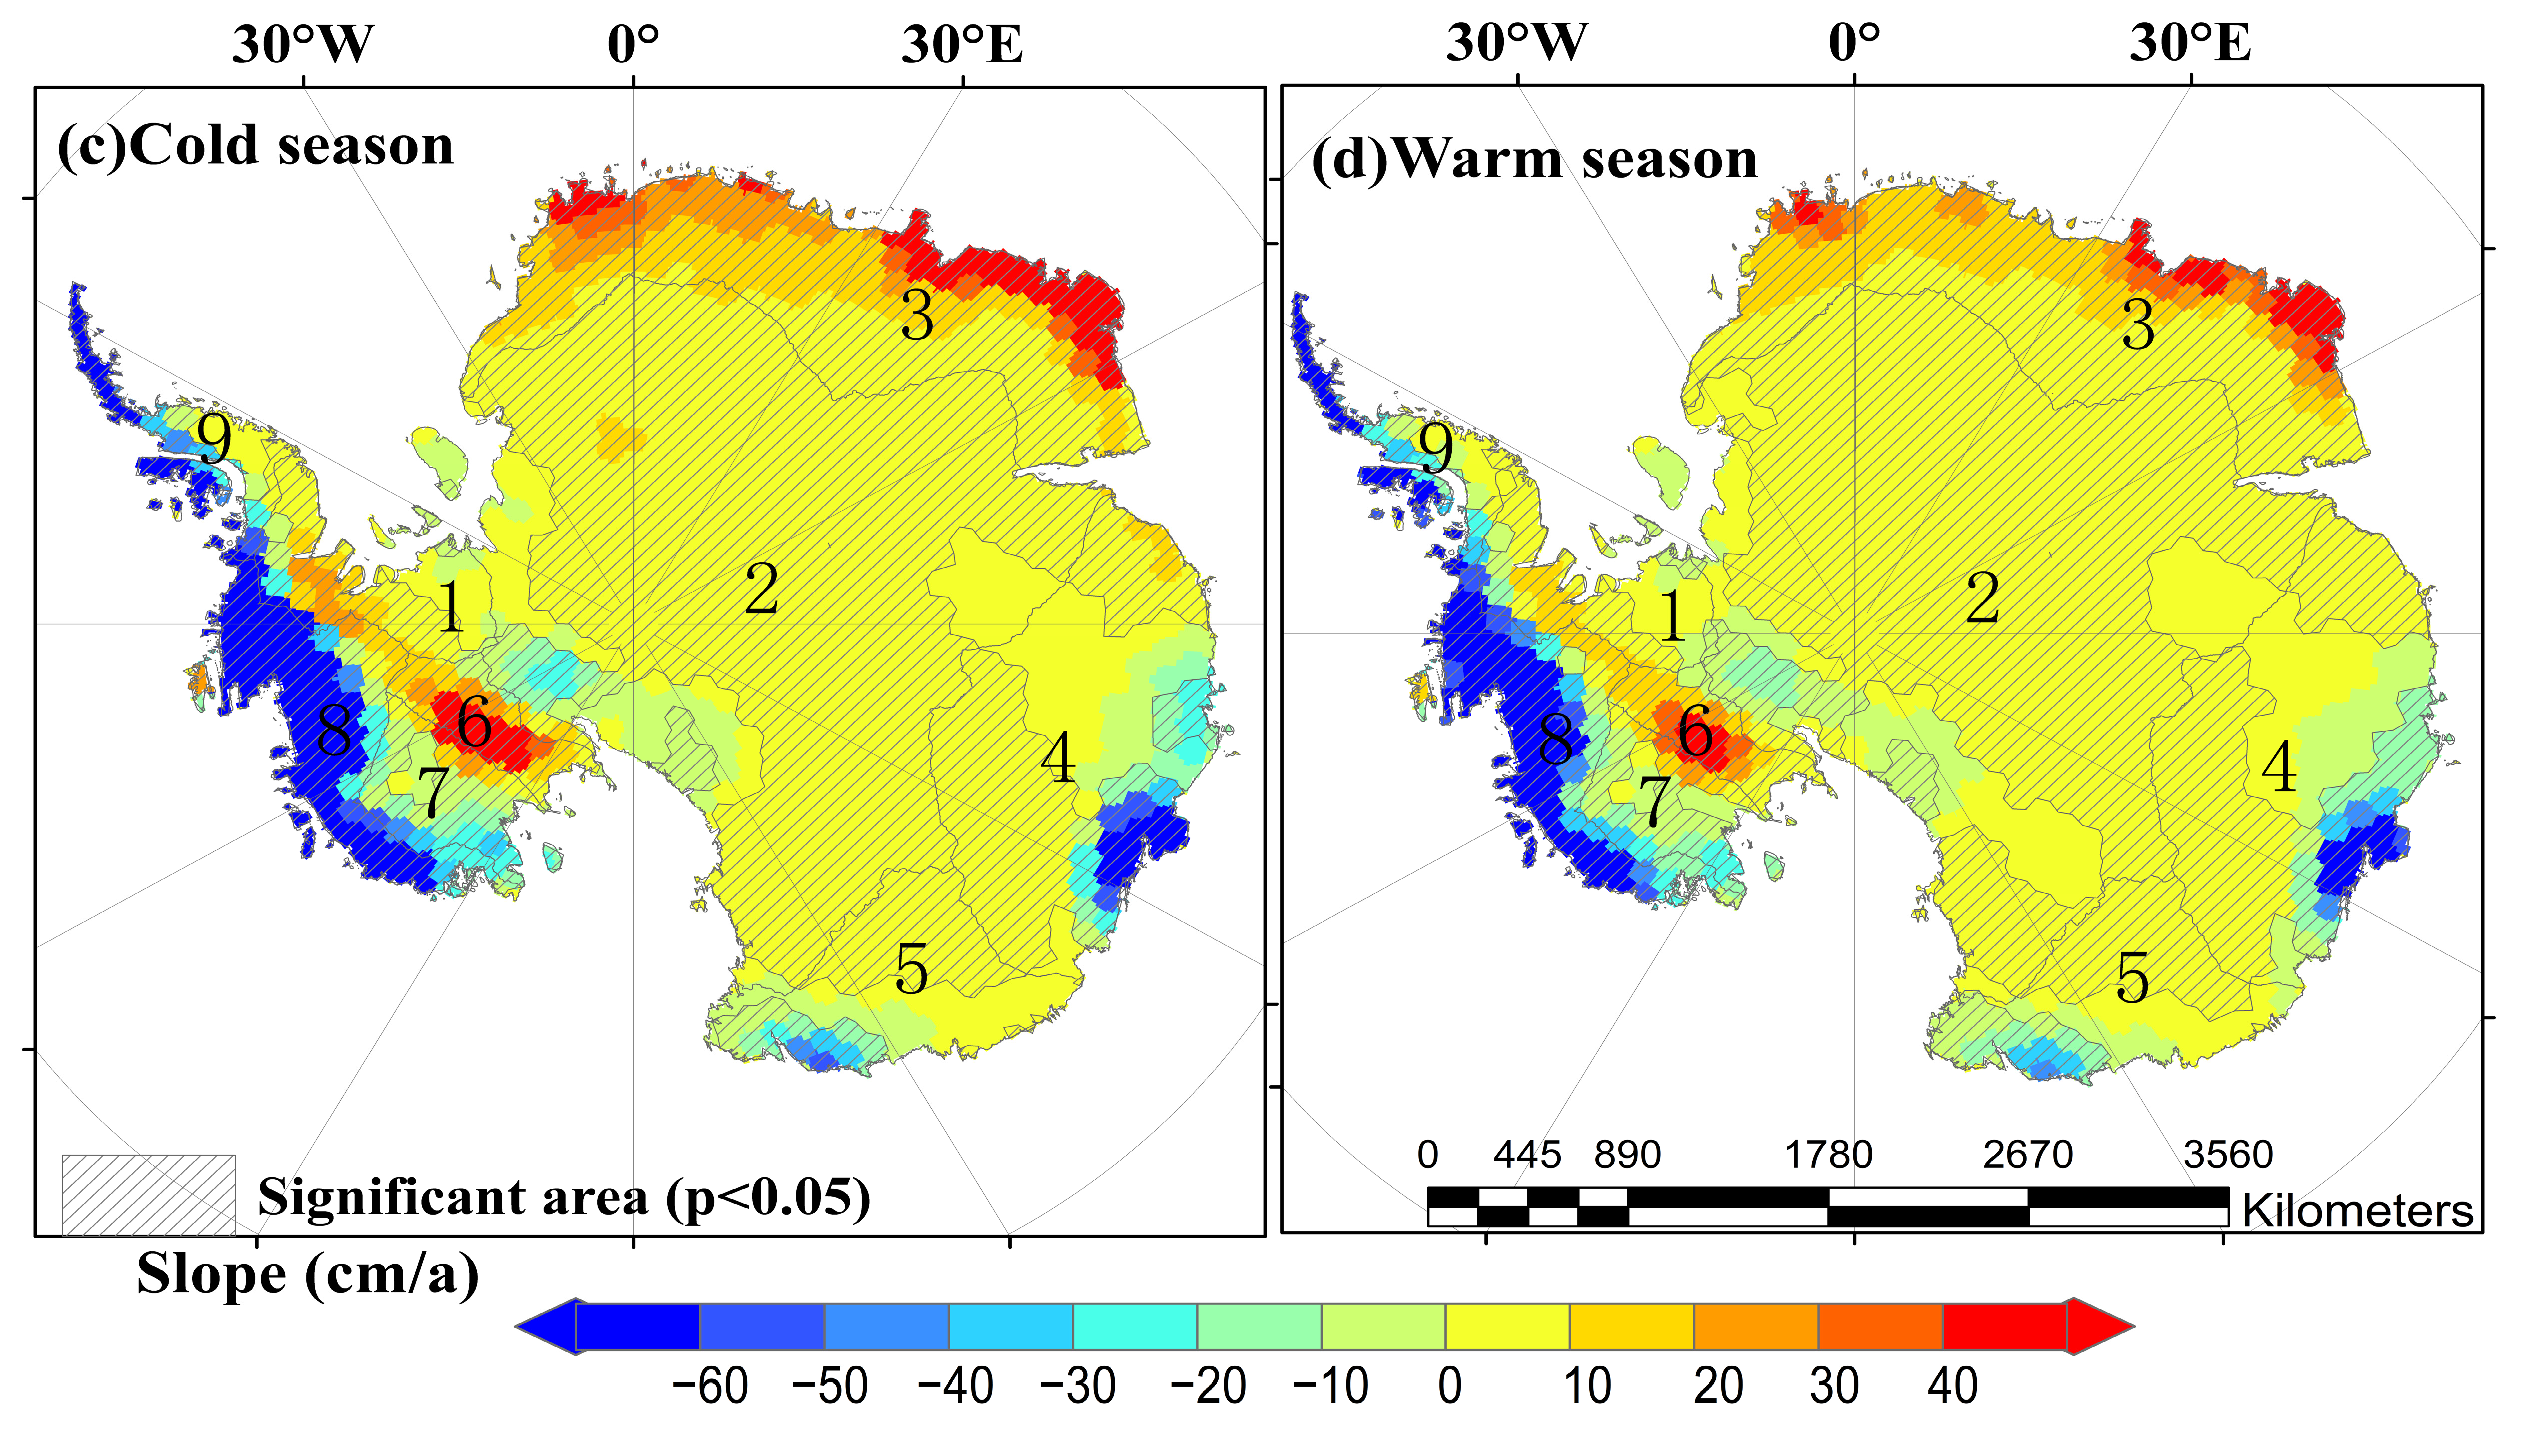
Since Section 4.2 demonstrates that the spatial change rate of the Antarctic ice sheet from 2018 to 2022 is not significant, this section focuses on exploring the spatial distribution, change trends, and significance tests of the annual average mass balance changes during the cold and warm seasons from 2016 to 2022. The results are presented in Figure 8. The figure shows that the spatial distribution of the Antarctic ice sheet mass changes during the cold and warm seasons is generally consistent with the overall spatial distribution of mass balance changes across the entire period, with no major differences between the two seasons. Most regions of the Antarctic ice sheet experience accumulation in both the cold and warm seasons, exhibiting a weak yet significant upward trend. The ice sheets along the coast of Queen Maud Land and the Camp Flow area show clear mass accumulation in both the cold and warm seasons, with the amount of accumulation increasing year by year, indicating a significant upward trend. However, the accumulation during the warm season is notably lower than that during the cold season. The ice sheets near the Amundsen Coast and the Drake Passage coast of the Antarctic Peninsula show the opposite trend, with significant ice loss occurring in both cold and warm seasons, and this loss continues to progress. In Wilkes Land and Victoria Land, ice accumulation is minimal during the cold season, but during the warm season, ice mass accumulation decreases significantly, leading to an expansion of the ice sheet’s mass loss area.

3.4. Spatiotemporal Variations of P, SSR, and T2M over the Antarctic Ice Sheet

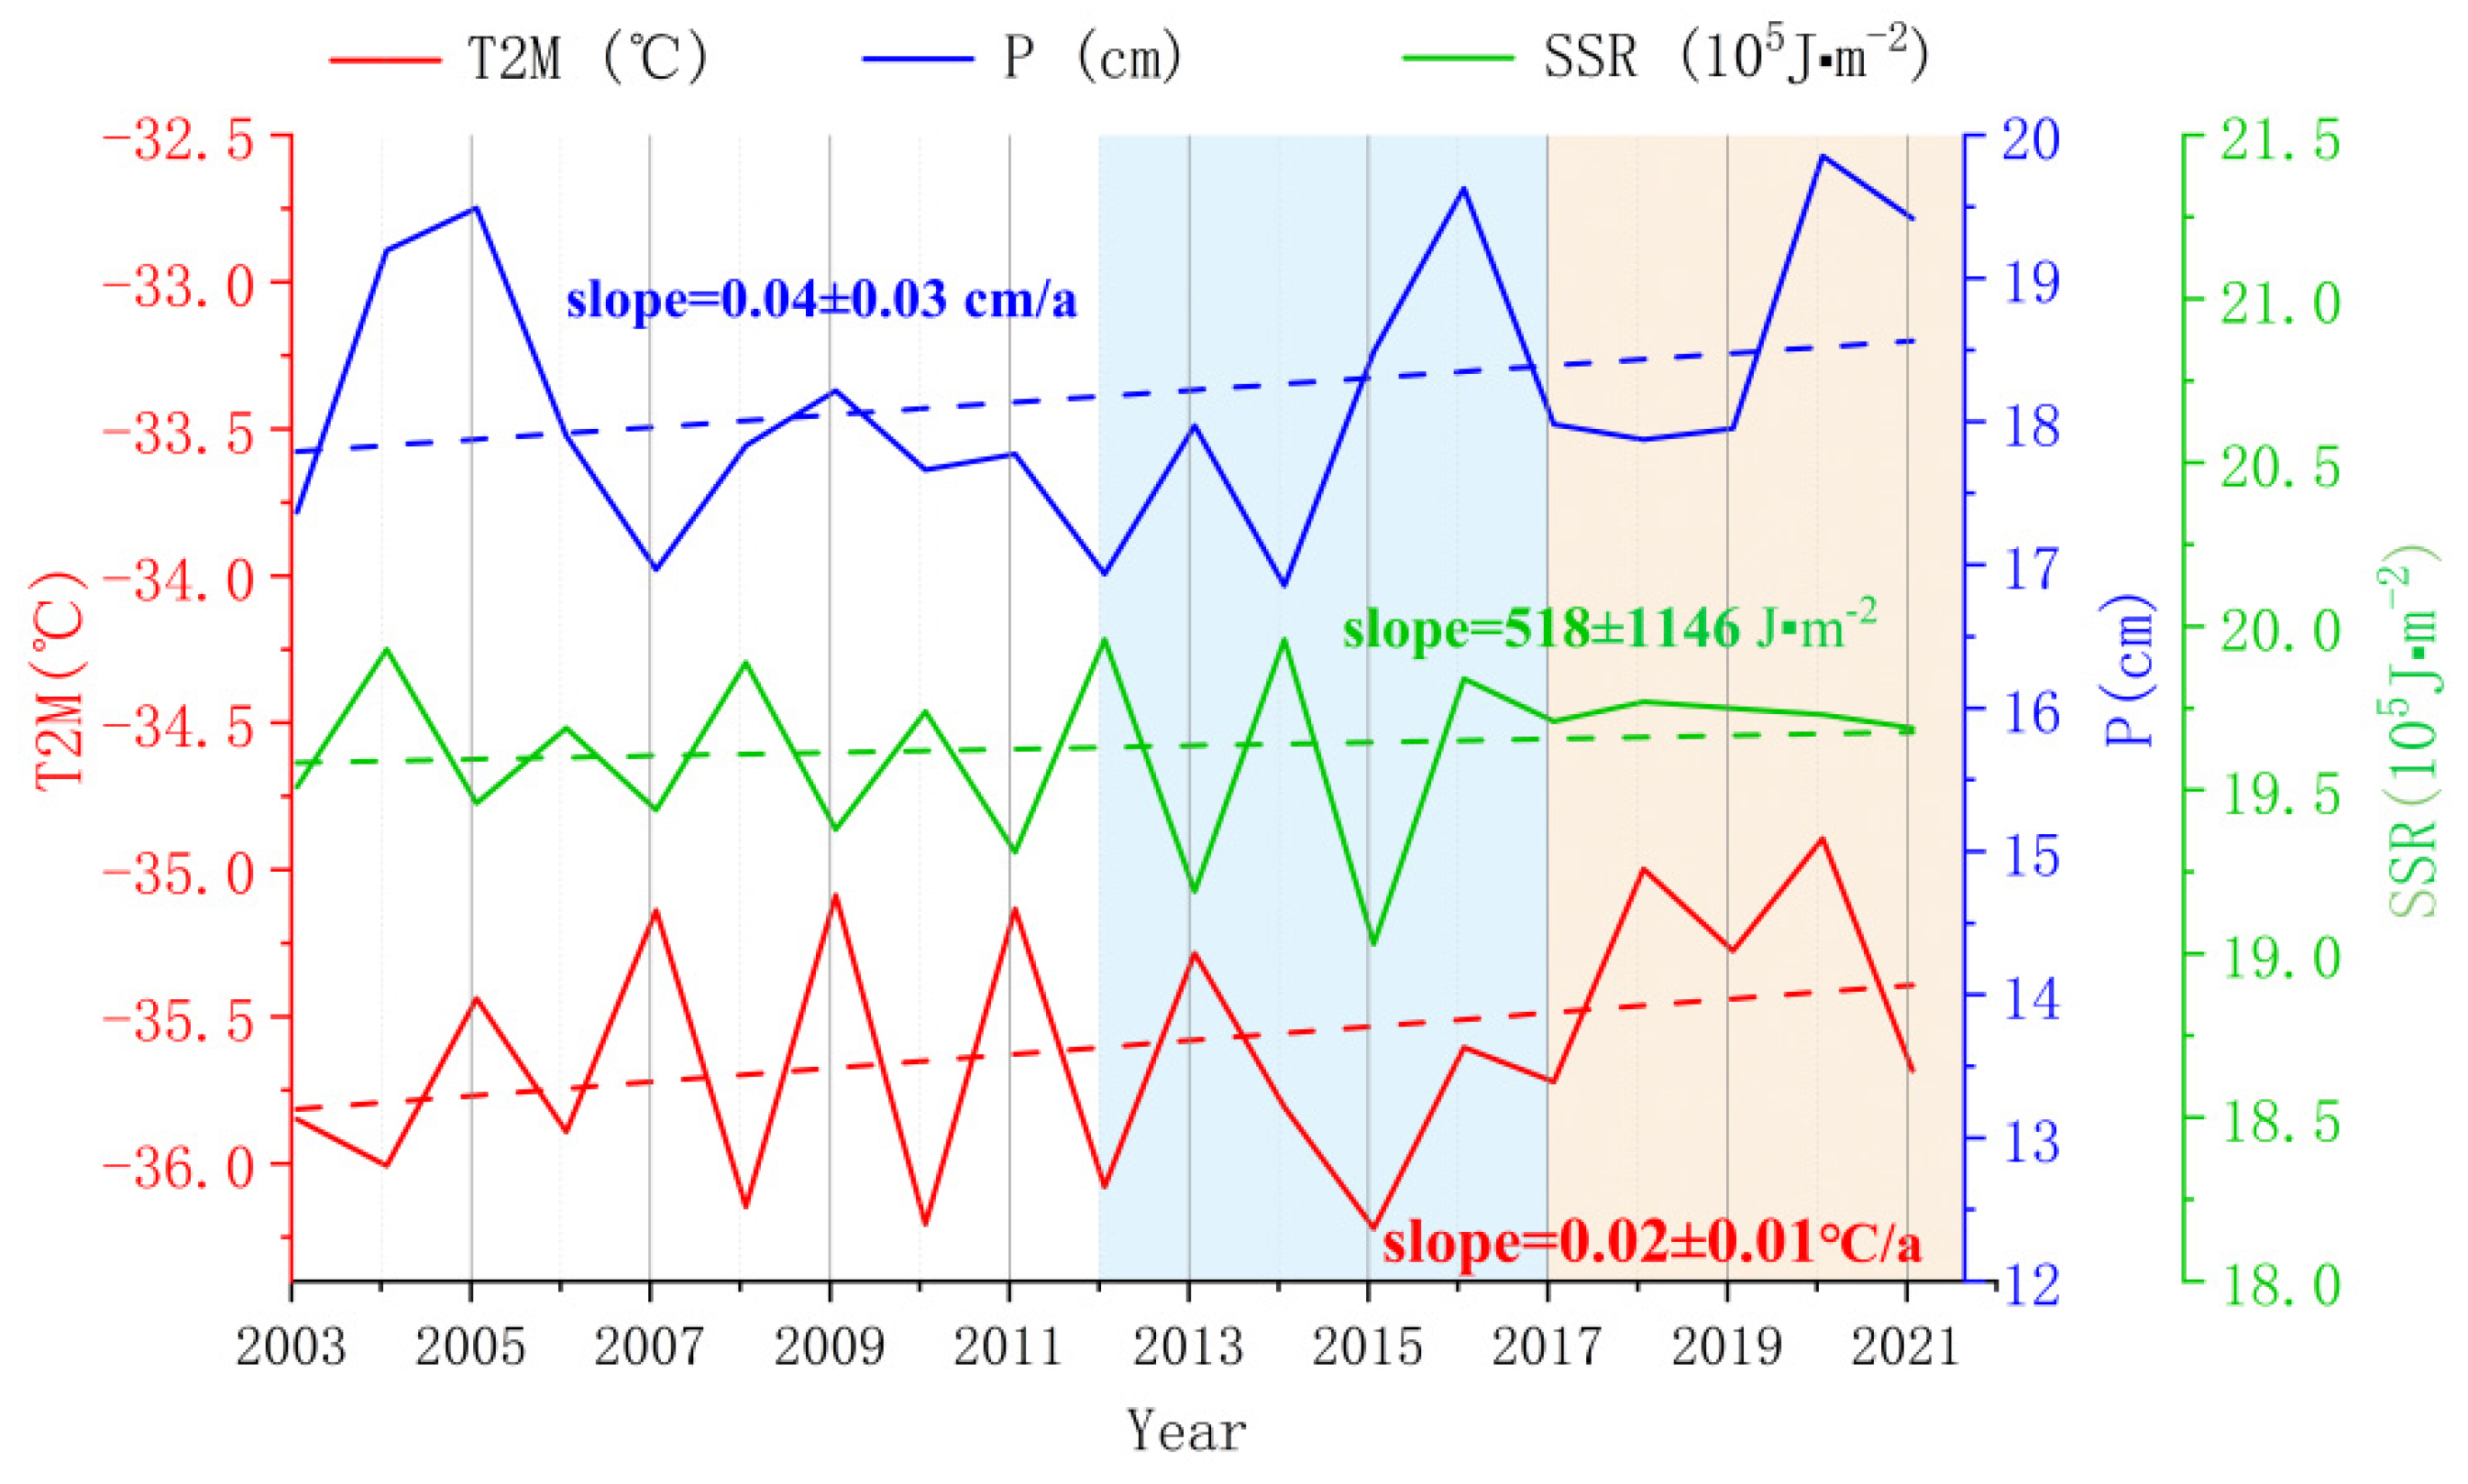
The Antarctic ice sheet lies within the Antarctic Circle, and human activities have minimal direct impact on its mass balance. Changes in the ice sheet’s mass balance are primarily influenced by climate factors [28]. Its loss is largely governed by changes in temperature and precipitation. Rising temperatures lead to increased surface loss, water runoff, and solid ice discharge, while abnormal precipitation can also contribute to ice sheet mass loss. This section examines the trends in precipitation, surface net solar radiation, and temperature in the Antarctic ice sheet region from 2003 to 2022. The results are illustrated in Figure 9. From a temporal perspective, all three meteorological factors exhibit an insignificantly slight upward trend. Specifically, the rate of increase in precipitation is 0.04   cm / a , the rate of increase in surface net solar radiation is 518   J · m 2 / a , and the rate of increase in temperature is 0.2 °C/10a. The interannual precipitation over the Antarctic ice sheet increased significantly from 2003 to 2005, followed by a sharp decline from 2005 to 2007. Between 2008 and 2014, precipitation fluctuated within a narrow range at lower levels, reaching a minimum of 16.9 cm in 2014. From 2015 to 2022, total precipitation increased significantly, peaking at 19.9 cm in 2020. The net surface solar radiation over the Antarctic ice sheet remained relatively stable from 2003 to 2010. From 2011 to 2015, the amplitude of fluctuations increased annually, peaking in 2012. From 2016 to 2022, net solar radiation remained at elevated levels. However, due to the delayed loss season on the ice sheet, high-albedo conditions persisted beyond the peak solar radiation period, making the overall trend of increasing net solar radiation less pronounced [6]. Temperature and net surface solar radiation followed a similar trend between 2003 and 2017, with initial increases followed by declines. From 2018 to 2022, temperatures rose significantly, reaching an annual average high of −34.9 °C in 2020. Precipitation, surface net solar radiation, and temperature showed pronounced fluctuations during the “accelerated ice sheet loss period” (2012–2016) and increased notably during the “dramatic ice sheet loss period” (2017–2022).
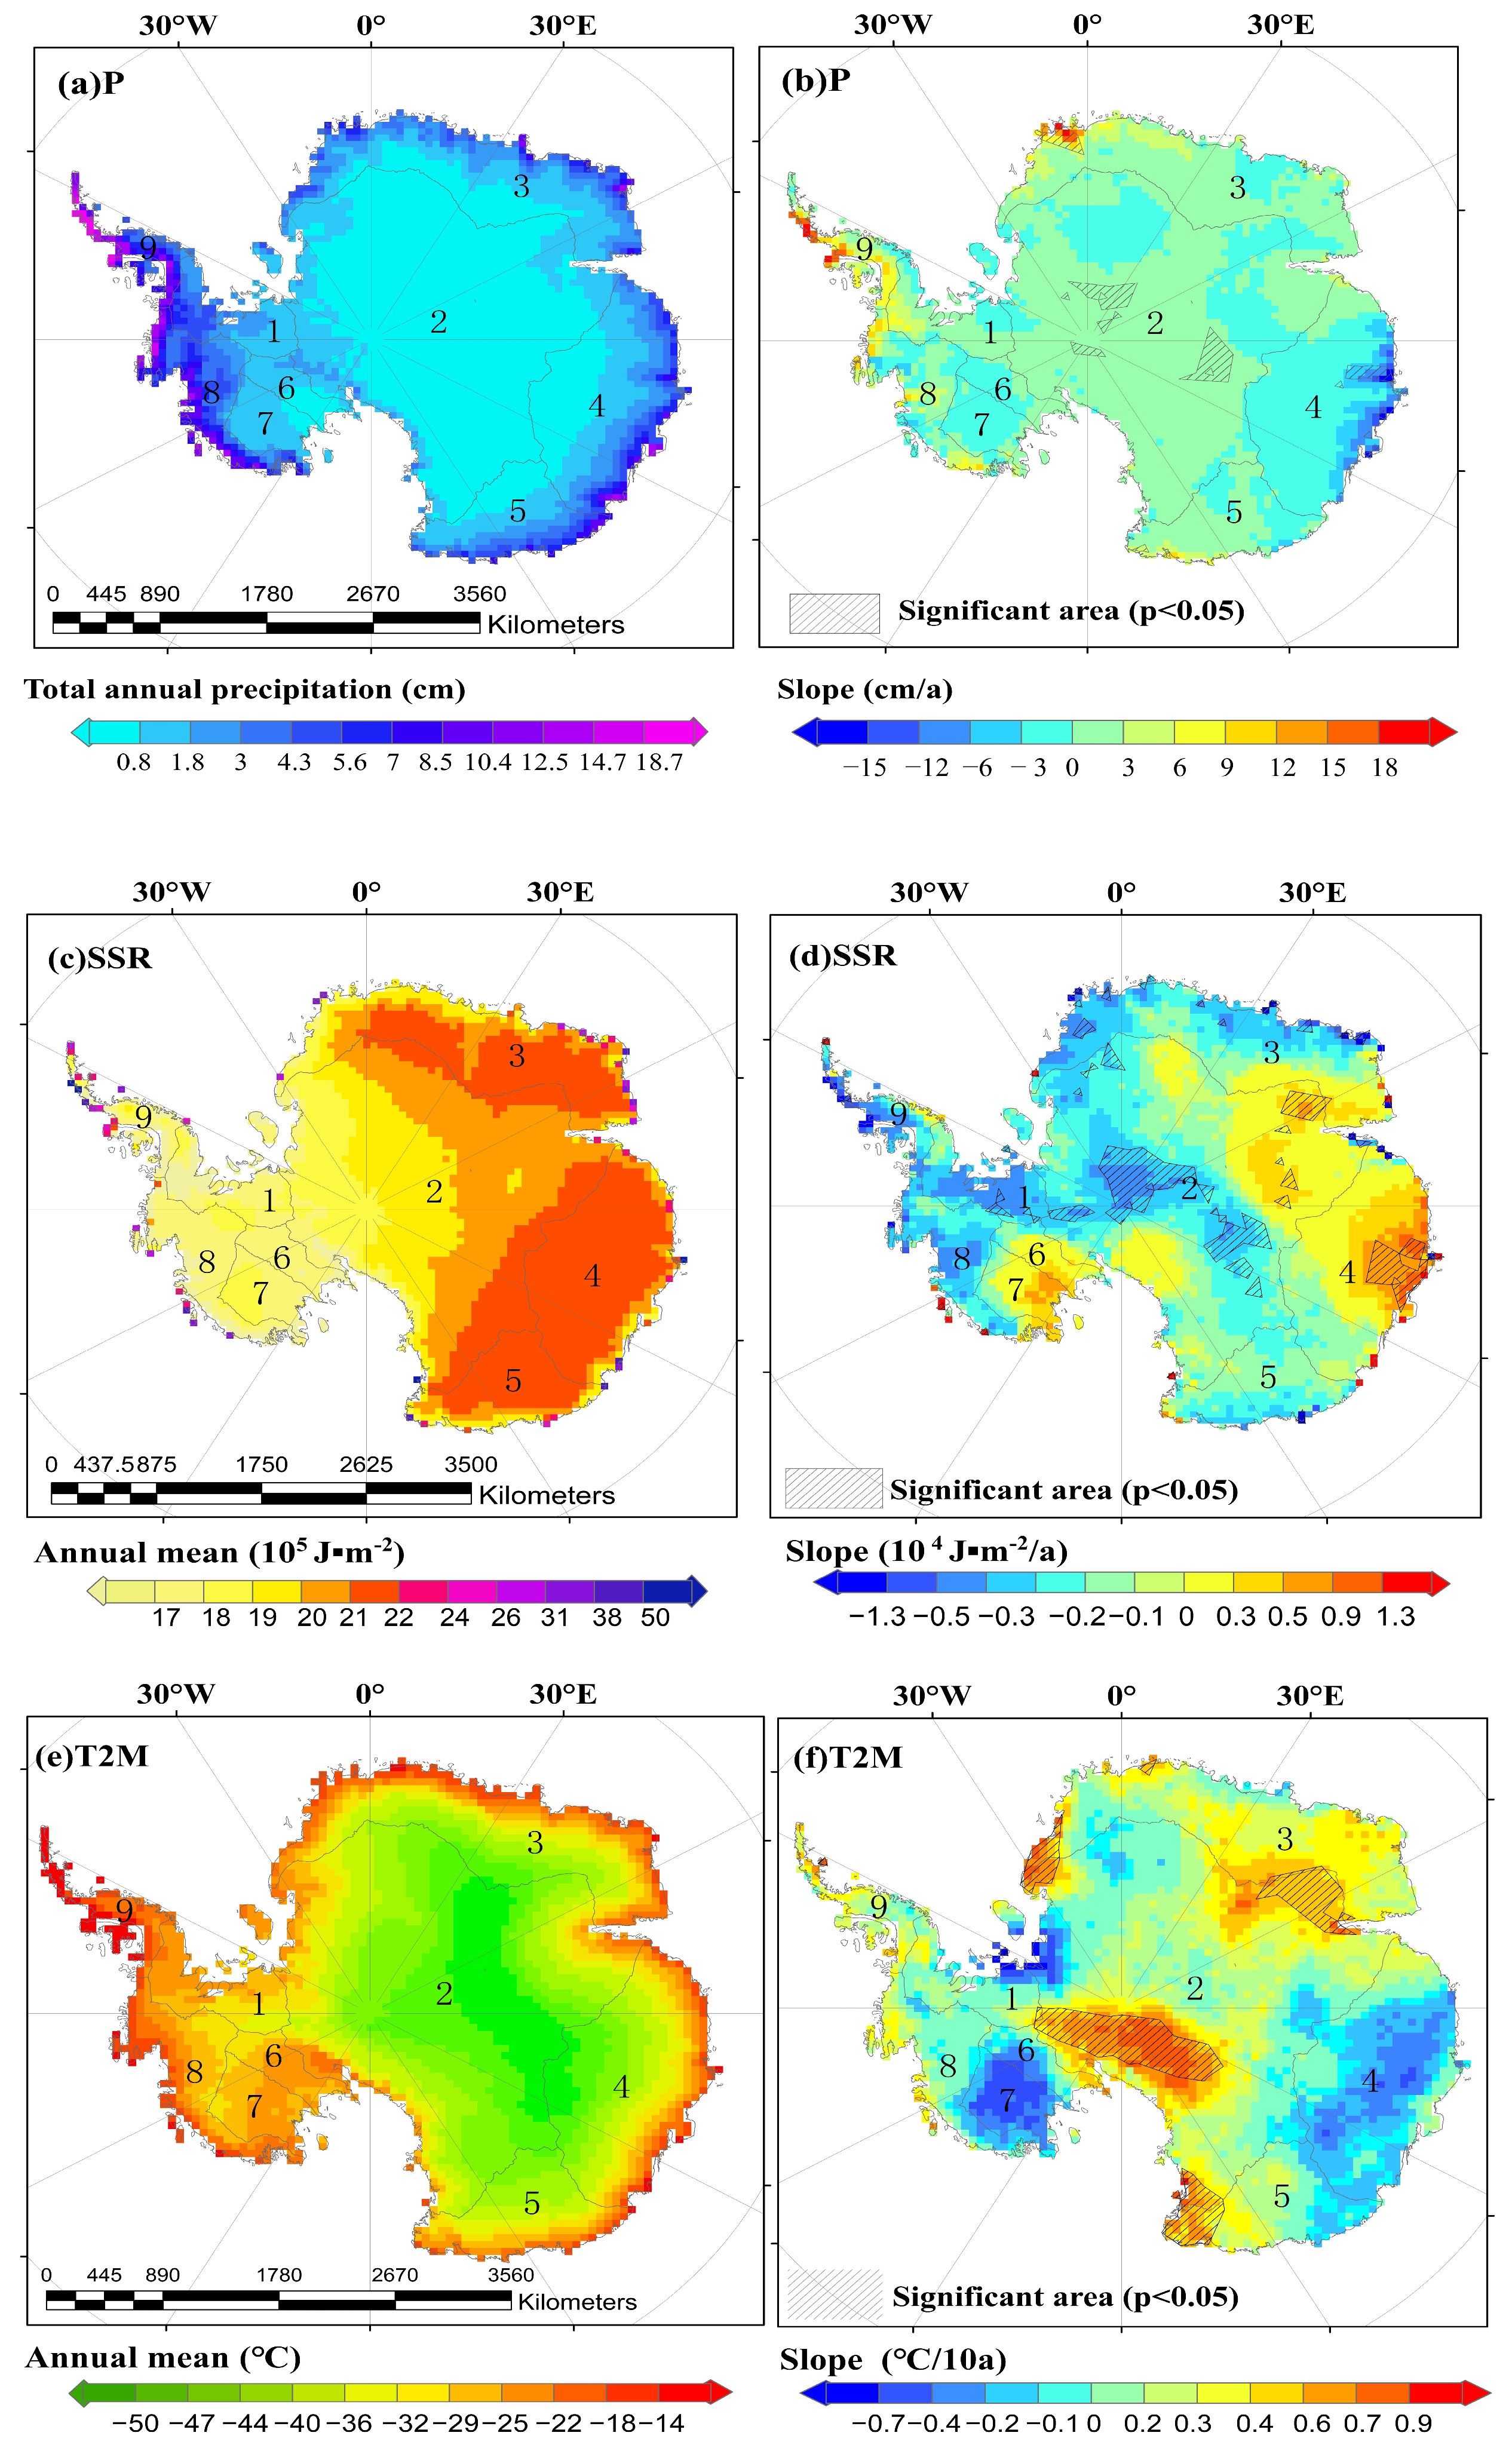
This study also examines the annual average spatial distribution and spatial change trends of Antarctic ice sheet precipitation, surface net solar radiation, and temperature from 2003 to 2022 (Figure 10). As shown in the figure, these three climate factors exhibit clear spatial differences. Most regions of the Antarctic ice sheet experience low precipitation, with a gradual increasing trend. However, this trend is only pronounced in a small area near the South Pole. Areas with higher precipitation are primarily located along the coast, with the Antarctic Peninsula receiving the most precipitation, followed by the Amundsen Coast. These two regions also exhibit faster rates of precipitation increase. Consequently, the ice sheet mass loss in these areas may be linked to the abnormal rise in precipitation. The annual average distribution of net surface solar radiation over the Antarctic ice sheet follows a “high in East Antarctica, low in West Antarctica” pattern, where the intensity decreases from East Antarctica to West Antarctica. This pattern aligns with the elevation gradient of the Antarctic ice sheet, which also shows “high in East Antarctica, low in West Antarctica” characteristics. The significant decrease in net surface solar radiation over the Antarctic ice sheet is mainly concentrated in the central Antarctic Plateau and the eastern Transantarctic Mountains. In contrast, areas showing a marked increase in net solar radiation are primarily around Wilkes Land. Additionally, this region experiences relatively strong net solar radiation, suggesting that ice sheet loss in this basin may be linked to both the high levels and the increasing trend of annual surface net solar radiation.
The temperature over the Antarctic ice sheet follows a spatial pattern of “high along the coast and low inland” consistent with the “warm peninsula–cold continent” distribution highlighted in Antarctic temperature assessments [29]. This pattern is inversely related to elevation, with higher altitudes corresponding to lower temperatures. Coastal areas, particularly the edges of the ice sheet, are influenced by warm ocean currents, contributing to this temperature distribution [30]. West Antarctica, shaped like a peninsula and surrounded by ocean, is heavily influenced by the marine climate, making it milder compared to East Antarctica [31]. The temperature trend over the Antarctic ice sheet predominantly shows warming, making it one of the fastest-warming regions globally [32]. Areas with significant temperature increases are mainly found in the Hengduan Mountains of the Antarctic Plateau, Coates Land in East Antarctica, and the McRoberts entry area in the northeast. This pattern aligns with the spatial distribution of Antarctic temperature trends from 1999 to 2019, as reconstructed by Zhang [30]. In coastal areas, ice sheet temperatures are higher and most ice sheets exhibit a loss trend. However, in Queen Maud Land in East Antarctica, the trend of ice sheet mass accumulation is linked to a sudden increase in snowfall in 2009 and a continued rise in snowfall after 2016.

4. Discussion

4.1. The Response of the Antarctic Ice Sheet Mass Balance to Changes in P, SSR, and T2M

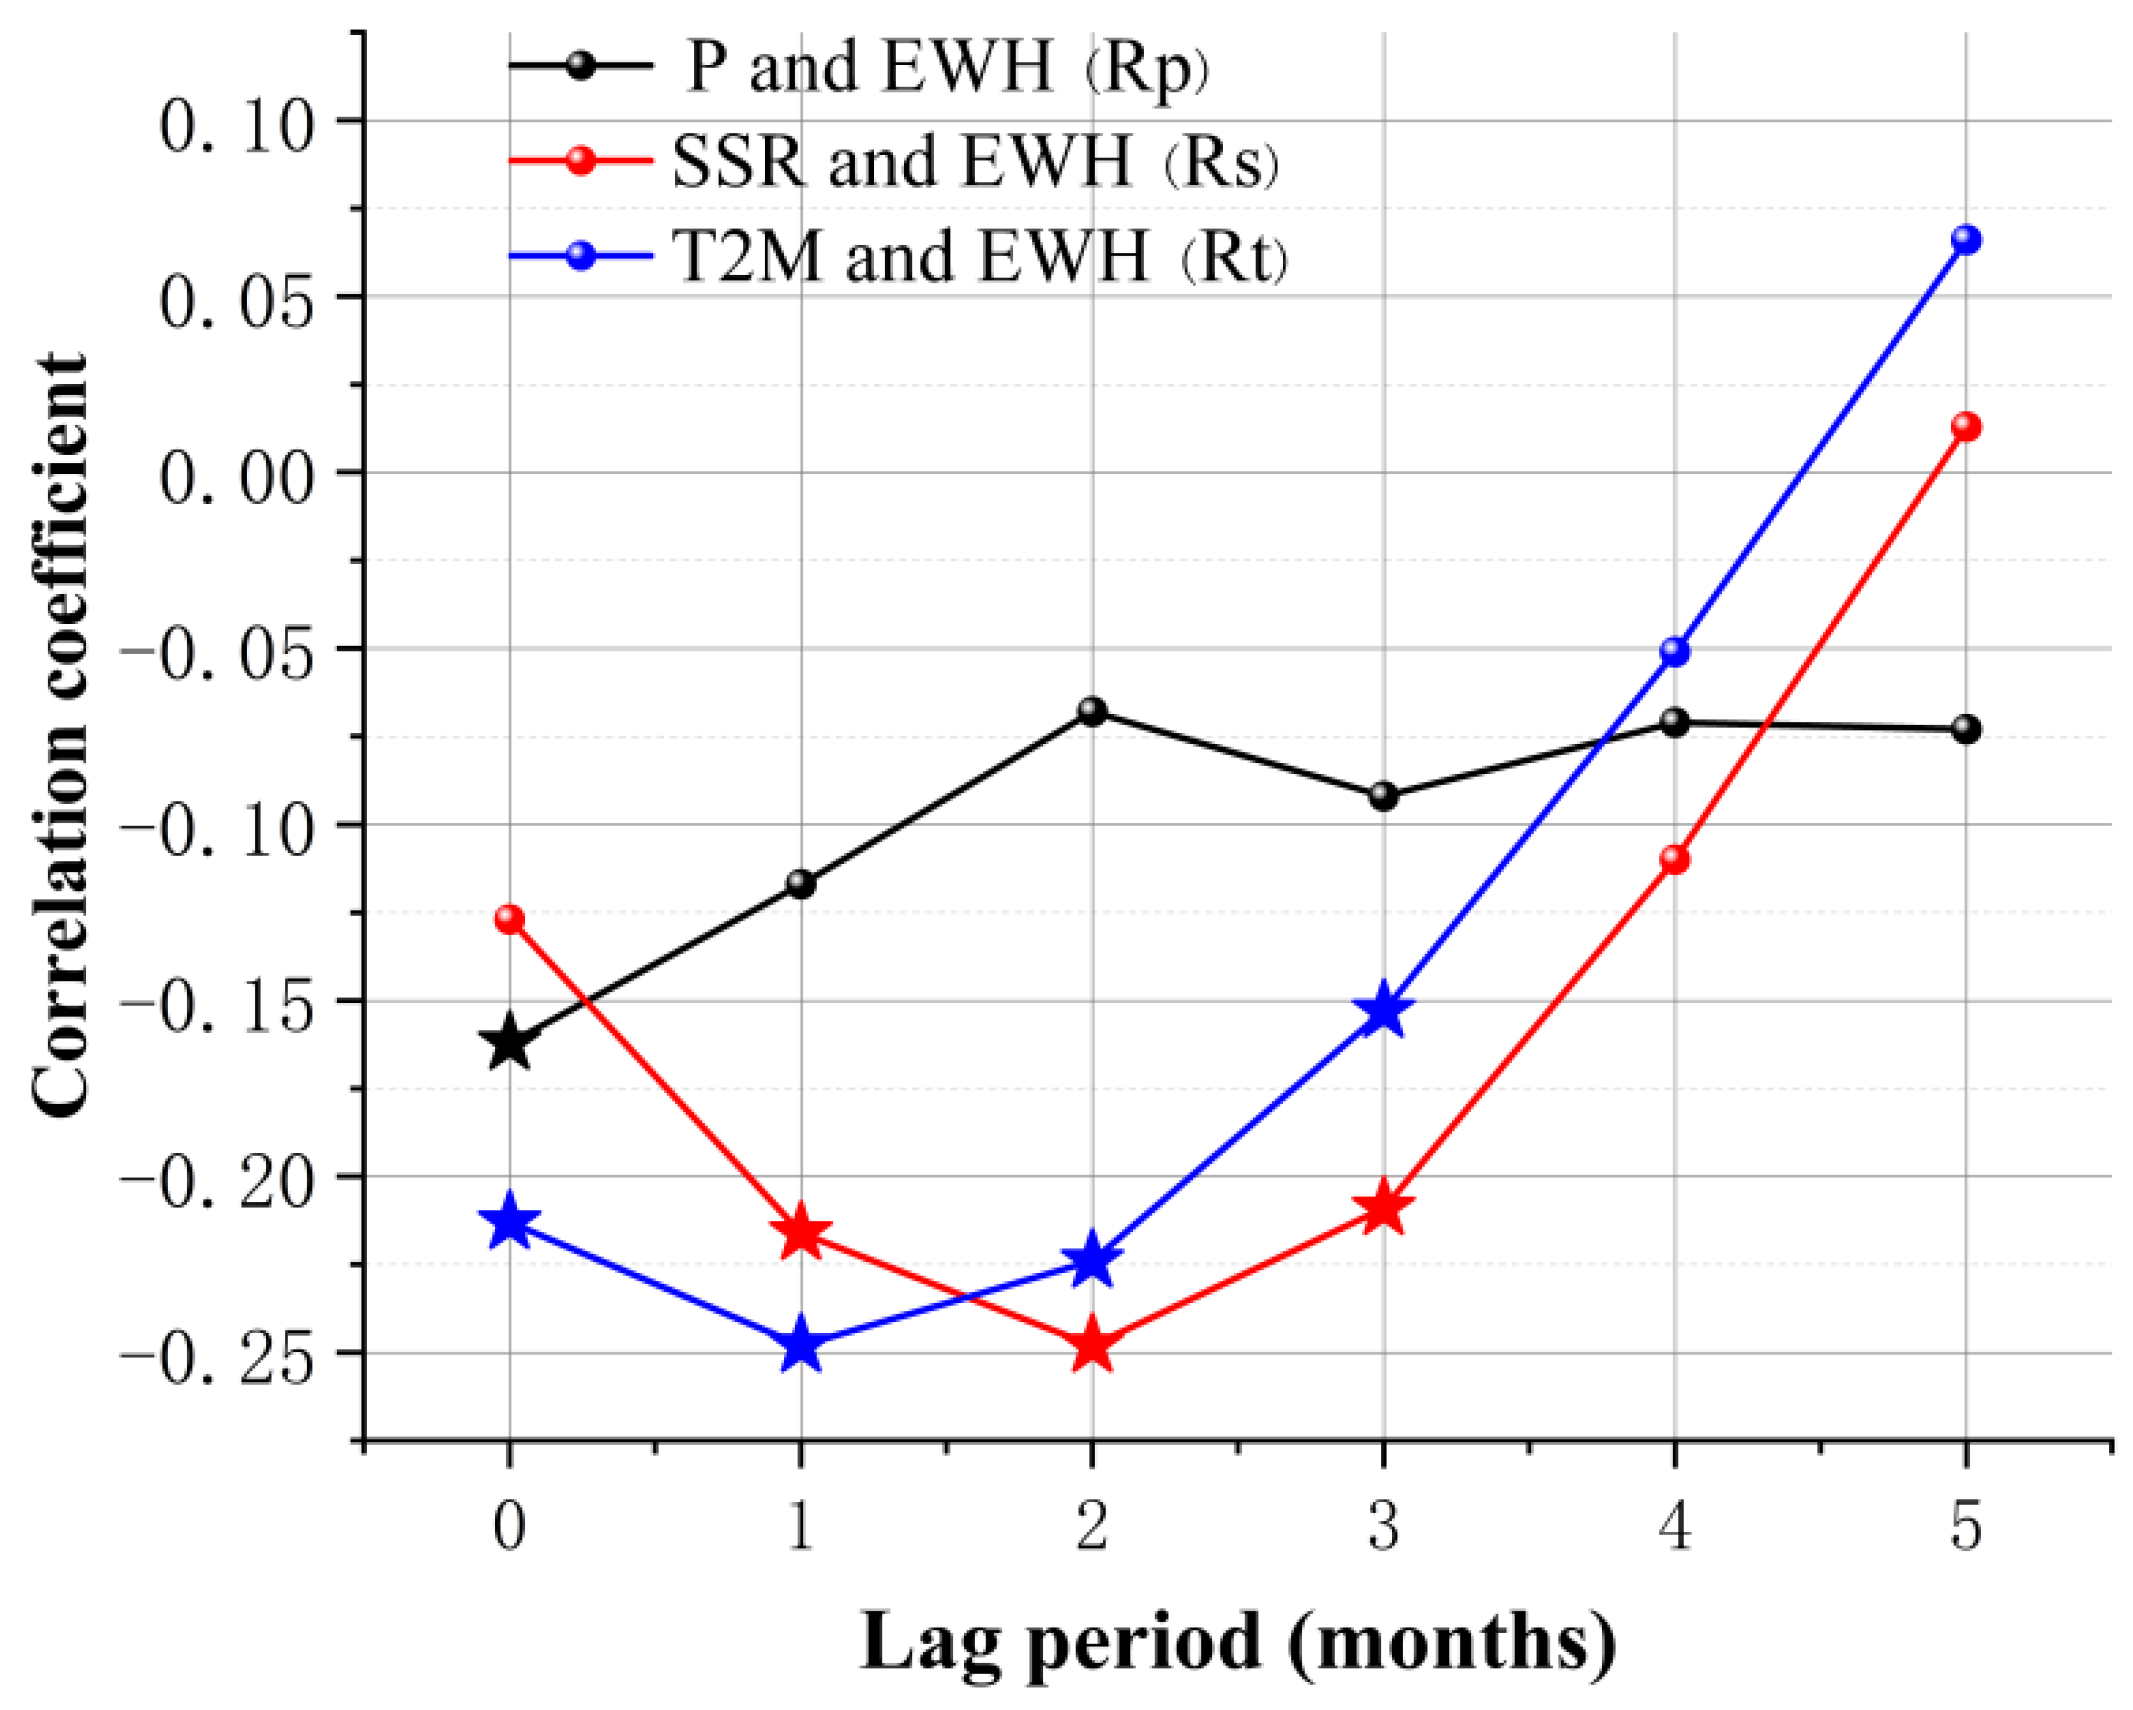
By comparing the changes in the Antarctic ice sheet’s mass balance with the spatiotemporal variations in precipitation, net surface solar radiation, and temperature, a noticeable lag effect is evident. The correlation coefficients for different lag periods are shown in Figure 11. The contemporaneous correlation coefficient (lag period of 0) reflects the relationship between the influencing factor and the ice sheet mass change within the same month, and so on. Overall, changes in the Antarctic ice sheet’s mass do not show a significant lag effect relative to precipitation. The linear correlation between these factors during the same period is −0.162 (p < 0.05), and the correlation coefficient decreases as the lag period increases, indicating that precipitation has a relatively minor impact on ice sheet mass changes. Surface net solar radiation does not significantly influence ice sheet mass changes in the same period but shows a delayed effect on ice accumulation and loss with a lag of 1 to 3 months. The correlation peaks at a lag of 2 months with a correlation coefficient of −0.248 (p < 0.01). Temperature changes also exhibit a lag effect, influencing the ice sheet’s mass with a delay of 1 to 2 months. At a 1-month lag, temperature has the most significant impact on ice sheet loss, with a correlation coefficient of −0.248 (p < 0.01).
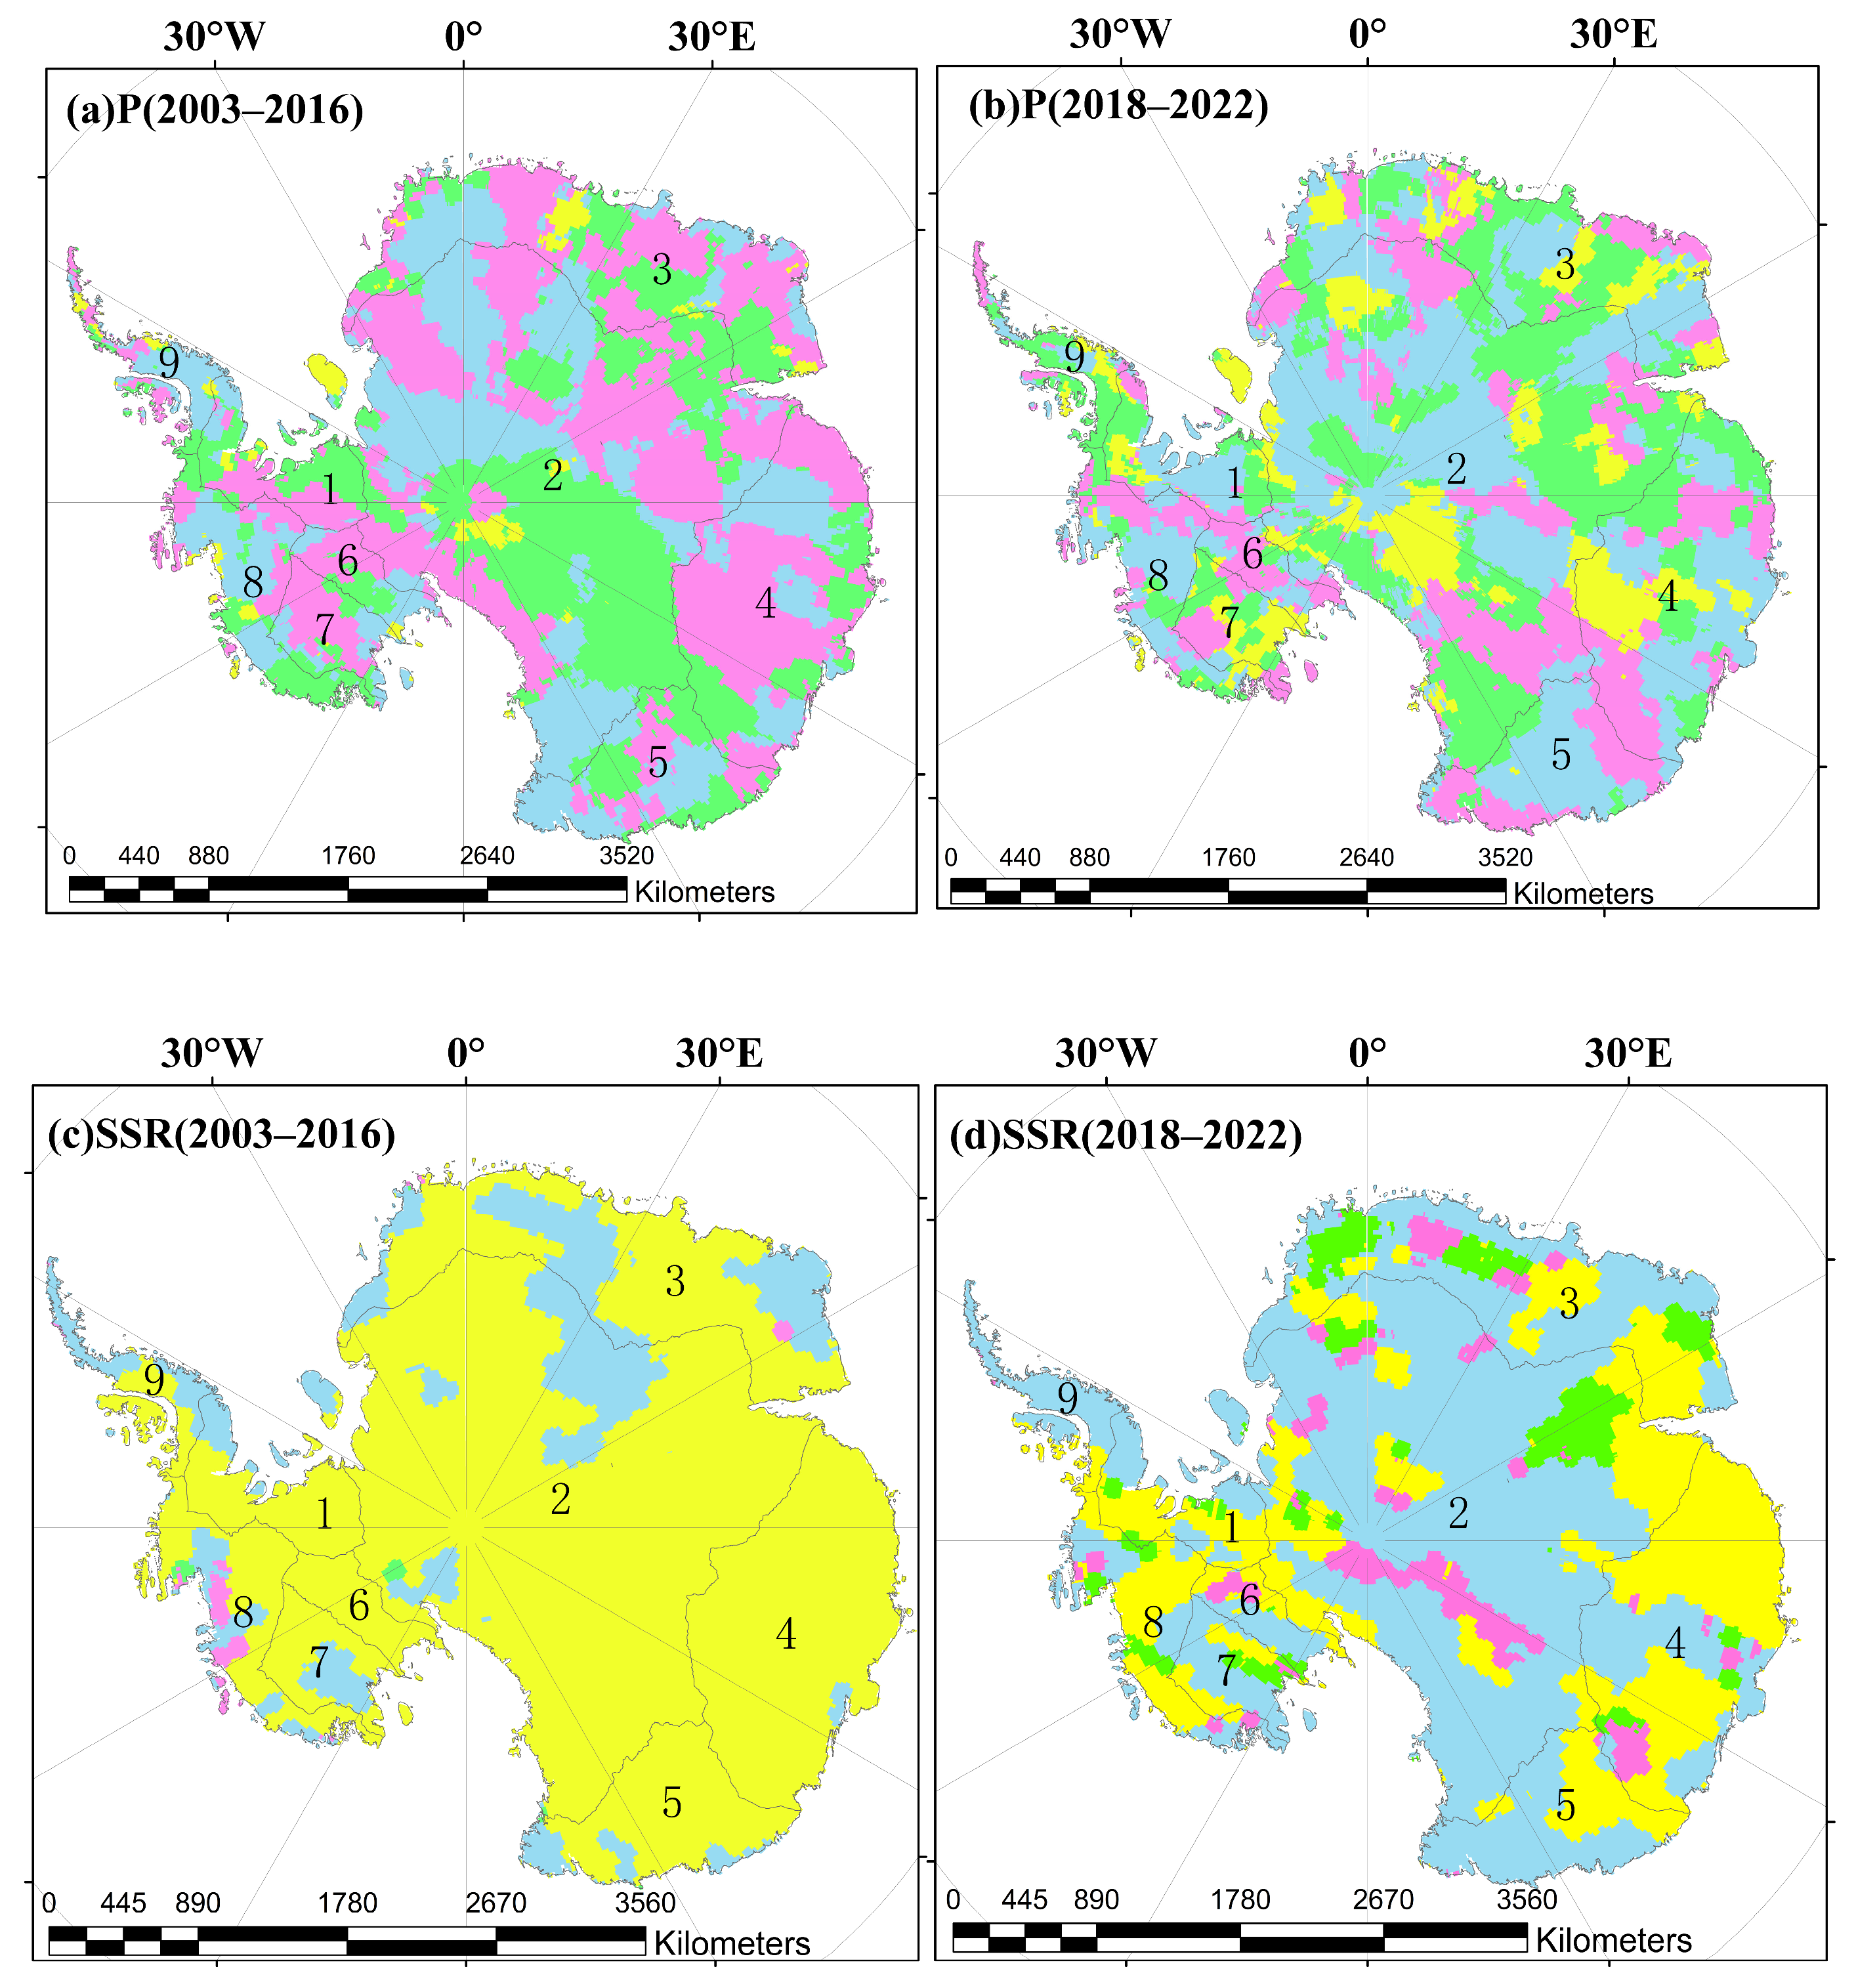
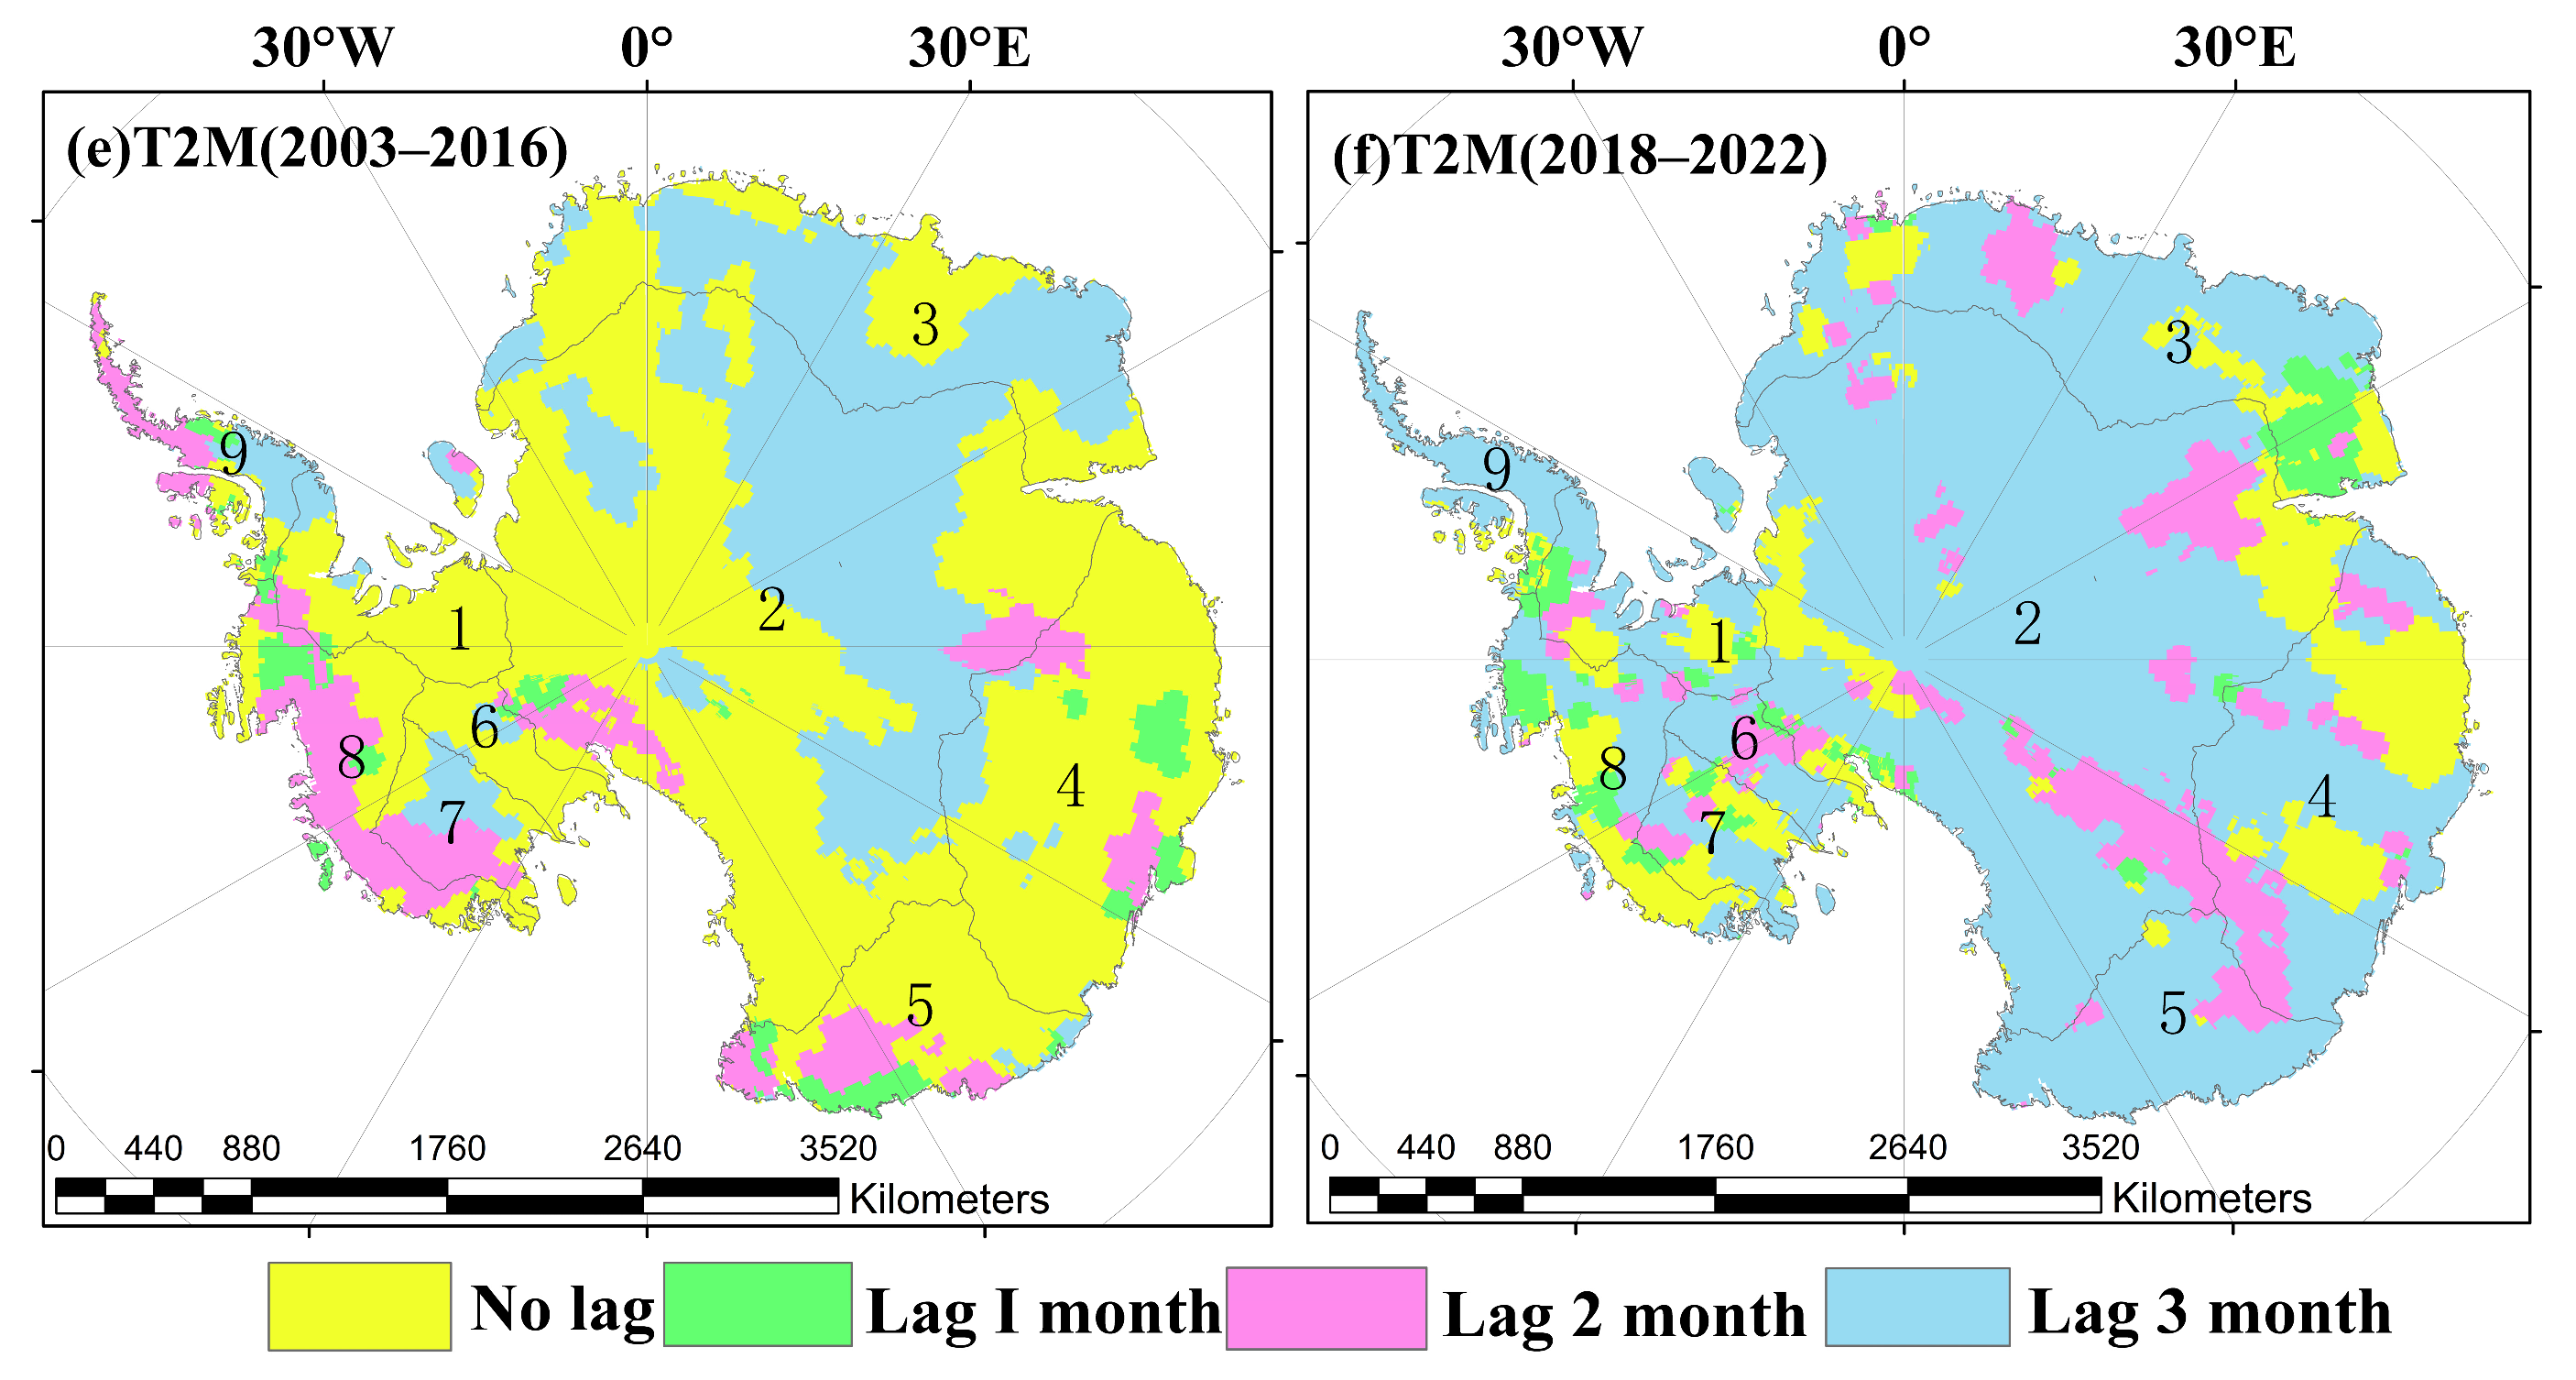
Given the vastness of the Antarctic ice sheet and its significant regional climate variability, the response of the ice sheet mass balance to changes in the three climate factors is typically concentrated within 0–3 months. This section calculates the correlation between the ice sheet mass balance in each region and the changes in each influencing factor at lag periods of 0, 1, 2 and 3 months. The lag period with the highest absolute correlation coefficient is considered to represent the lag period of the ice sheet mass balance in that region relative to the changes in the influencing factors. Figure 12 illustrates the spatial distribution of lag periods for the Antarctic ice sheet mass balance in response to changes in various climate factors. The spatial distribution revealed notable differences in how different regions of the Antarctic ice sheet responded to the three climate factors on a monthly scale during the periods 2003–2006 and 2019–2022. Comparative analysis indicated that the response of Antarctic ice sheet mass changes to precipitation was relatively scattered from 2003 to 2016. However, from 2019 to 2022, the response became more concentrated, with a significant reduction in areas showing a lag of 1–2 months. This suggested a weakening of the correlation between precipitation and ice sheet mass changes within the next 1–2 months. Although there was an expansion of areas with a lag of 3 months during this period, most of these correlations were not statistically significant. From 2003 to 2016, the Antarctic ice sheet mass balance predominantly responded to changes in surface net solar radiation in the same period. However, from 2019 to 2022, the response lag to surface net solar radiation increased, primarily extending to three months. This suggested a more prolonged impact of surface net solar radiation on ice sheet mass changes. Notably, in some areas of Queen Maud Land in East Antarctica and near Camp Stream, the response lag was shorter, typically around one month. Between 2003 and 2016, the response of the Antarctic ice sheet mass balance to temperature changes typically had a 2-month lag in regions such as the Amundsen Sea, Marie Byrd Land, and near the Drake Passage on the Antarctic Peninsula, with most other areas showing no significant lag. From 2019 to 2022, this lag increased, indicating a delayed impact of temperature on the Antarctic ice sheet mass balance during this later period.
Taking the Amundsen Coast ice sheet as an example which has experienced the highest loss rates, the loss rate accelerated sharply in 2006 due to increased precipitation. This was followed by a further intensification in 2007, associated with a significant rise in temperature. In 2011, the loss rate saw a notable increase, linked to a sharp rise in net solar radiation. The ongoing rapid loss of the ice sheet in this region can be attributed to the combined effects of increased precipitation, a warming trend, and delayed responses.

4.2. Contribution of P, SSR, and T2M Changes to the Mass Change of the Antarctic Ice Sheet

To quantitatively analyze the contributions of precipitation, surface net solar radiation, and temperature to the mass changes of the Antarctic ice sheet, this study employed the random forest nonlinear fitting method. The relative contributions of these three climate factors at different lag periods are detailed in Figure 13 and Table 2. Among the influencing factors during the same period, precipitation had the smallest relative contribution to the mass changes of the Antarctic ice sheet, at 15.09%. In contrast, air temperature and surface net solar radiation had nearly equivalent contributions, at 41.46% and 43.45%, respectively. Therefore, thermal conditions emerged as the primary factors affecting the mass balance of the Antarctic ice sheet. When the Antarctic enters the cold season, the relative contribution degree of precipitation to the Antarctic ice sheet material change further decreases to 10.38%, the relative contribution degree of temperature decreases to 36.56%, and the relative contribution degree of surface solar net radiation increases to 53.15%, which becomes the main factor affecting the material change of the Antarctic ice sheet. When entering the warm season, the relative contribution of precipitation to the ice sheet mass change decreased to 9.39%, while the relative contribution of surface solar net radiation decreased to 43.15%. At this time, the temperature of the Antarctic ice sheet became the main factor affecting its mass change.
As the lag time progresses, the relative contribution of precipitation to the ice sheet mass changes increases in both the cold and warm seasons, rising by 22.16% and 35.71%, respectively, within a 2-month lag. Conversely, the relative contribution of surface net solar radiation decreases, dropping by 17.19% and 21.75% in the cold and warm seasons, respectively, over the same lag period. The relative contribution of temperature exhibits different trends: in the cold season, it gradually decreases, while in the warm season, it first decreases and then increases. Overall, the relative contribution of temperature decreases by 5.06% and 13.96% within a 2-month lag in the cold and warm seasons, respectively. Overall, despite the gradual increase in the relative contribution of precipitation to ice sheet mass changes, thermal conditions remain the primary factor influencing the mass balance of the Antarctic ice sheet.

4.3. Data Uncertainty and Comparative Analysis

The advancement of space geodetic observation technologies, including gravity satellites and altimetry satellites, has significantly enhanced the accuracy of monitoring polar ice sheet mass changes. Additionally, various methods for deducing equivalent water height have offered multiple perspectives for studying the mass balance of polar ice sheets. The results of this study are compared with existing literature studies in Table 3. Using the GRACE satellite CSR RL06 Mascon version data, this study estimates the Antarctic ice sheet mass loss rate from 2003 to 2016 to be −123.3 ± 6.2 Gt/year. This result is consistent with the change rate of −109.1 ± 2.3 Gt/year obtained from the flux method for the Antarctic ice sheet mass balance from 2005 to 2016 [8] and aligns with the mass change rates of −118.6 ± 16.3 Gt/year and −101.3 ± 7.1 Gt/year estimated from CSR RL06 data for 2003 to 2016 and 2002 to 2016, respectively. However, there is some overestimation, which can be attributed to differences in data types and the selection of the GIA model [33,34]. The mass change rate of the Antarctic ice sheet from 2003 to 2013 in this study is −82.9 ± 7.4 Gt/year, which is consistent with the result of −90 ± 27 Gt/year obtained for the period from 2003 to 2012 using CSR RL06 Mascon version data [17]. By comparing the results of this study with those of existing studies (Table 2), it is evident that differences in methods, data sources, and GIA models account for the slight variations in the estimated trends of Antarctic ice sheet mass changes. However, the differences between this study’s results and those from other studies are relatively small, indicating a certain degree of reliability. Thus, the findings of this study offer a valuable scientific reference for understanding changes in Antarctic ice sheet mass.

5. Conclusions

Based on GRACE satellite CSR RL06 version data and ERA-5-provided data on precipitation, surface net solar radiation, and temperature, this study analyzes the spatiotemporal variation characteristics of the Antarctic ice sheet’s mass balance both globally and by basin. It also explores the relationship between ice sheet mass changes and climate factors. The main conclusions are as follows:
(1)
From 2003 to 2016, the overall Antarctic ice sheet mass loss rate was −123.3 ± 6.2 Gt/year. Although the mass loss rate slowed down from 2019 to 2022, the ice sheet ablation area extended inland with significant interannual fluctuations, resulting in a relatively severe overall loss. The loss of the Antarctic ice sheet exhibits distinct seasonal characteristics, with mass loss being significantly greater in the warm season compared to the cold season. The rate of ice sheet mass change is highest during the transition between the cold and warm seasons.
(2)
Mass changes in the Antarctic ice sheet exhibit pronounced regional differences, with losses predominantly occurring in West Antarctica and the Antarctic Peninsula. From 2003 to 2016, the mass change rate for the West Antarctic ice sheet was −105.29 ± 1.74 Gt/year, while the Antarctic Peninsula ice sheet experienced a mass change rate of −14.52 ± 0.31 Gt/year, with the most significant loss concentrated in the Amundsen Sea region of West Antarctica. In contrast, East Antarctica is generally in a positive equilibrium state, with a mass change rate of 36.77 ± 1.71 Gt/year from 2003 to 2016 and 45.57 ± 19.68 Gt/year from 2018 to 2022. However, significant ice sheet loss is observed in Wilkes Land and Victoria Land. Notably, increases in Antarctic ice sheet mass are concentrated in Queen Maud Land, East Antarctica, with a change rate of 44.90 ± 0.96 Gt/year from 2003 to 2016, primarily due to a sudden increase in snowfall in 2009 and a continuing rise in snowfall thereafter.
(3)
From 2003 to 2016, precipitation, surface net solar radiation, and temperature all showed insignificant increasing trends. Precipitation and temperature exhibit a spatial pattern of “high along the coast and low in the interior”, while surface net solar radiation follows a “high in the east–low in the west” pattern, which is similar to the elevation distribution of the Antarctic ice sheet. Thermal factors are the primary drivers of mass changes in the Antarctic ice sheet, with most of the increased loss being attributed to rising temperatures and increased surface net solar radiation. Both temperature and surface net solar radiation have lag effects on ice sheet ablation, with lag periods of 1 month and 2 months, respectively. Although the contribution of precipitation to changes in ice sheet mass gradually increases with lag time, thermal conditions remain the dominant influence on the mass balance of the Antarctic ice sheet.
The Antarctic ice sheet, situated in the harsh environment of the Antarctic Circle, presents significant challenges in obtaining mass balance data. For future studies, combining multi-source satellite images with deep learning techniques may offer a more effective approach. Exploring new models and data combinations could enhance data availability and accuracy. At the same time, the findings based on GRACE satellite data in this study also provide a robust scientific reference for understanding changes in the cryosphere.

Author Contributions

Conceptualization, M.X.; Data curation, R.Z.; Formal analysis, R.Z.; Supervision, M.X.; Writing—original draft, R.Z.; Writing—review and editing, M.X., T.C., W.G. and X.L. All authors have read and agreed to the published version of the manuscript.

Funding

This research was funded by the International Partnership Program of Chinese Academy of Sciences (No.121362KYSB20210024).

Data Availability Statement

The data are all from the official website (the URL introduced in the data introduction part of the article).

Acknowledgments

The authors are grateful to NASA and the German Aerospace Center for the GRACE satellite data.

Conflicts of Interest

The authors declare no conflicts of interest.

References

  1. Ding, M.H. An up to date review on the mass balance over Antarctica. Prog. Geophys. 2013, 28, 24–35. [Google Scholar]
  2. Thomas, E.R.; Van Wessem, J.M.; Roberts, J.; Isaksson, E.; Schlosser, E.; Fudge, T.J.; Vallelonga, P.; Medley, B.; Lenaerts, J.; Bertler, N.; et al. Regional Antarctic Snow Accumulation Over the Past 1000 Years. Clim. Past. 2017, 13, 1491–1513. [Google Scholar] [CrossRef]
  3. Bamber, J.L.; Westaway, R.M.; Marzeion, B.; Wouters, B. The Land Ice Contribution to Sea Level during the Satellite Era. Environ. Res. Lett. 2018, 13, 063008. [Google Scholar] [CrossRef]
  4. Wang, Z.M.; He, J.; Yang, Y.D. Evaluation of Mass Balance in the Antarctic Ice Sheet from New GRACE Data. Geoinf. Surv. Mapp. 2017, 42, 1–5. [Google Scholar] [CrossRef]
  5. Yang, H.G.; You, W. Variations of antarctic ice-sheet mass measured by satellite gravity. Sci. Surv. Mapp. 2017, 42, 121–126+131. [Google Scholar] [CrossRef]
  6. Liang, L.; Guo, H.; Liang, S.; Li, X.; Moore, J.C.; Li, X.; Cheng, X.; Wu, W.; Liu, Y.; Rinke, A.; et al. Delayed Antarctic loss season reduces albedo feedback. Natl. Sci. Rev. 2023, 10, nwad157. [Google Scholar] [CrossRef]
  7. Brandt, R.E.; Warren, S.G.; Worby, A.P.; Grenfell, T.C. Surface Albedo of the Antarctic Sea Ice Zone. J. Clim. 2005, 18, 3606–3622. [Google Scholar] [CrossRef]
  8. Lin, Y.J.; Yu, Z.T.; Liu, Y.; Cheng, X.; Shen, Q.; Zhao, L.Y. Fine Assessment of Mass Balance of Antarctic Ice Sheet from 2005 to 2016. J. Remote Sens. 2023, 27, 318–334. [Google Scholar] [CrossRef]
  9. Cheng, Y.; Li, X.; Qiao, G.; Ye, W.; Huang, Y.; Li, Y.; Wang, K.; Tian, Y.; Tong, X.; Li, R. Ice Flow Velocity Mapping of East Antarctica from 1963 to 1989. Int. Arch. Photogramm. Remote Sens. Spat. Inf. Sci. 2019, XLII-2/W13, 1735–1739. [Google Scholar] [CrossRef]
  10. Cheng, Y.; Hai, G.; Cui, X.B.; Lv, D.; Qiao, G.; Li, R. Mass Balance Assessment of the Antarctic Ice Sheet from 2013 to 2018 based on Input-output Method. Science in China. Earth Sci. 2023, 53, 1490–1505. [Google Scholar]
  11. Zwally, H.J.; Li, J.; Robbins, J.W.; Saba, J.L.; Yi, D.; Brenner, A.C. Mass Gains of the Antarctic Ice Sheet Exceed Losses. J Glaciol. J. Glaciol. 2015, 61, 1019–1036. [Google Scholar] [CrossRef]
  12. Li, F.; Yuan, L.X.; Zhang, S.K.; Yang, Y.D.; E, D.C.; Hao, W.F. Mass change of the Antarctic ice sheet derived from ICESat laser altimetry. Chin. J. Geophys. 2016, 59, 93–100. [Google Scholar]
  13. E, D.C.; Yang, Y.D.; Chao, D.B. The sea level change from the Antarctic ice sheet based on GRACE. Chin. J. Geophys. 2009, 52, 2222–2228. [Google Scholar]
  14. Tapley, B.D.; Watkins, M.M.; Flechtner, F. Contributions of GRACE to Understanding Climate Change. Nat. Clim. Chang. 2019, 9, 358–369. [Google Scholar] [CrossRef]
  15. Berthier, E.; Floriciou, D.; Gardne, A.S.; Gourmelen, N.; Jakob, L.; Paul, F.; Treichler, D.; Wouters, B.; Belart, J.M.C.; Dehec, A.; et al. Measuring Glacier Mass Changes from Space a Review. Rep. Prog. Phys. 2023, 86, 036801. [Google Scholar] [CrossRef]
  16. Velicogna, I.; Mohajerani, Y.; A, G.; Landerer, F.; Mouginot, J.; Noel, B.; Rignot, E.; Sutterley, T.; van den Broeke, M.; van Wessem, M.; et al. Continuity of Ice Sheet Mass Loss in Greenland and Antarctica from the GRACE and GRACE Follow-On missions. Geophys. Res. Lett. 2020, 47, e2020GL087291. [Google Scholar] [CrossRef]
  17. Chen, W.; Zhong, M.; Feng, W.; Wang, C.; Li, W.; Liang, L. Using GRACE/GRACE-FO and Swarm to estimate ice-sheets mass loss in Antarctica and Greenland during 2002–2020. Chin. J. Geophys. 2022, 65, 952–964. [Google Scholar]
  18. Otosaka, I.N.; Shepherd, A.; Ivins, E.R.; Schlegel, N.-J.; Amory, C.; van den Broeke, M.R.; Horwath, M.; Joughin, I.; King, M.D.; Krinner, G.; et al. Mass balance of the Greenland and Antarctic ice sheets from 1992 to 2020. Earth Syst. Sci. Data 2023, 15, 1597–1616. [Google Scholar] [CrossRef]
  19. Ye, Y.; Cheng, X.; Liu, Y.; Yang, Y.D.; Zhao, L.Y.; Lin, Y.J.; Qu, Y.T. Antarctic and Greenland Ice Sheet mass Balance Research Progress. J. Polar Res. 2020, 32, 571–585. [Google Scholar]
  20. Hao, W.F.; Yang, Y.D.; Liu, P.C.; Gao, S.J.; Cheng, Q. Research progress in the reconstruction of GRACE and GRACE-FO missing data. Prog. Geophys. 2024, 1–16. Available online: http://kns.cnki.net/kcms/detail/11.2982.P.20240315.1521.042.html (accessed on 9 September 2024).
  21. Hersbach, H.; Bell, B.; Berrisford, P.; Hirahara, S. The ERA5 global reanalysis. Q. J. R. Meteorol. Soc. 2020, 146, 1999–2049. [Google Scholar] [CrossRef]
  22. Breiman, L. Random Forests. Mach. Learn. 2001, 45, 5–32. [Google Scholar] [CrossRef]
  23. Chu, J.D.; Su, X.L.; Zhang, T.; Lei, Y.S.; Jiang, T.L.; Wu, J.H.; Wang, Q.Y. Comparison of three spatial downscaling concepts of GRACE data using random forest model. J. Lake Sci. 2024, 36, 951–962. [Google Scholar]
  24. Scambos, T.A. Application of Image Cross-correlation to the Measurement of Glacier Velocity Using Satellite Image Data. Remote Sens. Environ. 1992, 42, 177–186. [Google Scholar] [CrossRef]
  25. Velicogna, I.; Wahr, J. Measurements of Time-variable Gravity Show Mass Loss in Antarctica. Science 2006, 311, 1754–1756. [Google Scholar] [CrossRef]
  26. Medley, B.; McConnell, J.; Neumann, T.A.; Reijmer, C.H.; Chellman, N.; Sigl, M.; Kipfstuhl, S. Temperature and Snowfall in Western Queen Maud Land Increasing Faster than Climate Model Projections. Geophys. Res. Lett. 2018, 45, 1472–1480. [Google Scholar] [CrossRef]
  27. Li, R.X.; Xia, M.L.; Xie, H.; Hao, T.; Qiao, G.; Liu, S.J.; Feng, T.T.; Tian, Y.X.; An, L.; Tong, X.H.; et al. Advances in satellite remote sensing monitoring of Antarctic Ice Sheet mass changes. Chin. J. Geophys. 2023, 66, 3115–3143. [Google Scholar] [CrossRef]
  28. Yang, Q.M. Research on Antarctic ice sheet changes and influencing factors based on satellite altimetry technology. Acta Geod. Cartogr. Sin. 2023, 52, 2008. [Google Scholar]
  29. Wild, M.; Calanca, P.; Scherrer, S.C.; Ohmura, A. Effects of Polar Ice Sheets on Global Sea Level in High-resdution Greenhouse Scenarios. J. Geophys. Res. Atmos. 2003, 108, 4165. [Google Scholar] [CrossRef]
  30. Zhang, X.Y.; Wang, Y.T.; Ning, W.T.; Zhang, W.; Dong, X. Spatiotemporal Variations of Near-surface Air Temperature over the Antarctic Ice Sheet in the past 60 years. Quat. Sci. 2021, 41, 739–751. [Google Scholar]
  31. Chen, J.; Ke, C.Q. Review of Surface Ice Velocity Studies in Antarctic Ice Sheet. Polar Res. 2015, 27. [Google Scholar] [CrossRef]
  32. Jones, J.M.; Gille, S.T.; Goosse, H.; Abram, N.J.; Canziani, P.O.; Charman, D.J.; Clem, K.R.; Crosta, X.; de Lavergne, C.; Eisenman, I.; et al. Assessing Recent Trends in High-atitude Southern Hemisphere Surface Climate. Nat. Clim. Chang. 2016, 6, 917–926. [Google Scholar] [CrossRef]
  33. Gao, C.C.; Lu, Y.; Shi, H.L.; Zhang, Z.; Xu, C.; Tan, B. Detection and analysis of ice sheet mass changes over 27 Antarctic drainage systems from GRACE RL06 data. Chin. J. Geophys. 2019, 62, 864–882. [Google Scholar]
  34. Cui, L.L.; Zhang, C.; Zou, Z.B.; Li, P.; Li, Q.; Wang, X.L. The Mass Change in the Antarctic Ice Sheet Recovered from Gravity Satellite in 2003-2016. Sci. Technol. Eng. 2021, 21, 27–31. [Google Scholar]
  35. Schrama, E.J.; Wouters BRietbroek, R. A Mascon Approach to Assess Ice Sheet and Glacier Mass Balances and Their Uncertainties from GRACE Data. J. Geophys. Res. Solid Earth 2014, 119, 6048–6066. [Google Scholar] [CrossRef]
  36. Watkins, M.M.; Wiese, D.N.; Yuan, D.; Boening, C.; Landerer, F.W. Improved Methods for Observing Earth’s Time Variable Mass Distribution with GRACE Using Spherical Cap Mascons. J. Geophys. Res. Solid Earth 2015, 120, 2648–2671. [Google Scholar] [CrossRef]
  37. Harig, C.; Simons, F.J. Ice Mass Loss in Greenland, the Gulf of Alaska, and the Canadian Archipelago: Seasonal Cycles and Decadal Trends. Geophys. Res. Lett. 2016, 43, 3150–3159. [Google Scholar] [CrossRef]
  38. Mu, D.P.; Yan, H.M.; Feng, W.; Peng, P. GRACE Leakage Error Correction with Regularization Technique: Case Studies in Greenland and Antarctica. Geophys. J. Int. 2017, 208, 1775–1786. [Google Scholar] [CrossRef]
  39. The IMBIE Team. Mass balance of the Antarctic Ice Sheet from 1992 to 2017. Nature 2018, 558, 219–222. [Google Scholar] [CrossRef]
  40. Groh, A.; Horwath, M.; Horvath, A.; Meister, R.; Sørensen, L.S.; Barletta, V.R.; Forsberg, R.; Wouters, B.; Ditmar, P.; Ran, J.; et al. Evaluating GRACE Mass Change Time Series for the Antarctic and Greenland Ice Sheet Methods and Results. Geosciences 2019, 9, 415. [Google Scholar] [CrossRef]
  41. Groh, A.; Horwath, M. Antarctic ice mass change products from GRACE/GRACE-FO using tailored sensitivity kernels. Remote Sens. 2021, 13, 1736. [Google Scholar] [CrossRef]
  42. Yang, T.; Liang, Q.; Zheng, L.; Li, T.; Chen, Z.; Hui, F.; Cheng, X. Mass Balance of the Antarctic Ice Sheet in the Early 21st Century. Remote Sens. 2023, 15, 1677. [Google Scholar] [CrossRef]
  43. Willen, M.O.; Horwath, M.; Buchta, E.; Scheinert, M.; Helm, V.; Uebbing, B.; Kusche, J. Globally consistent estimates of high-resolution Antarctic ice mass balance and spatially resolved glacial isostatic adjustment. Cryosphere 2024, 18, 775–790. [Google Scholar] [CrossRef]
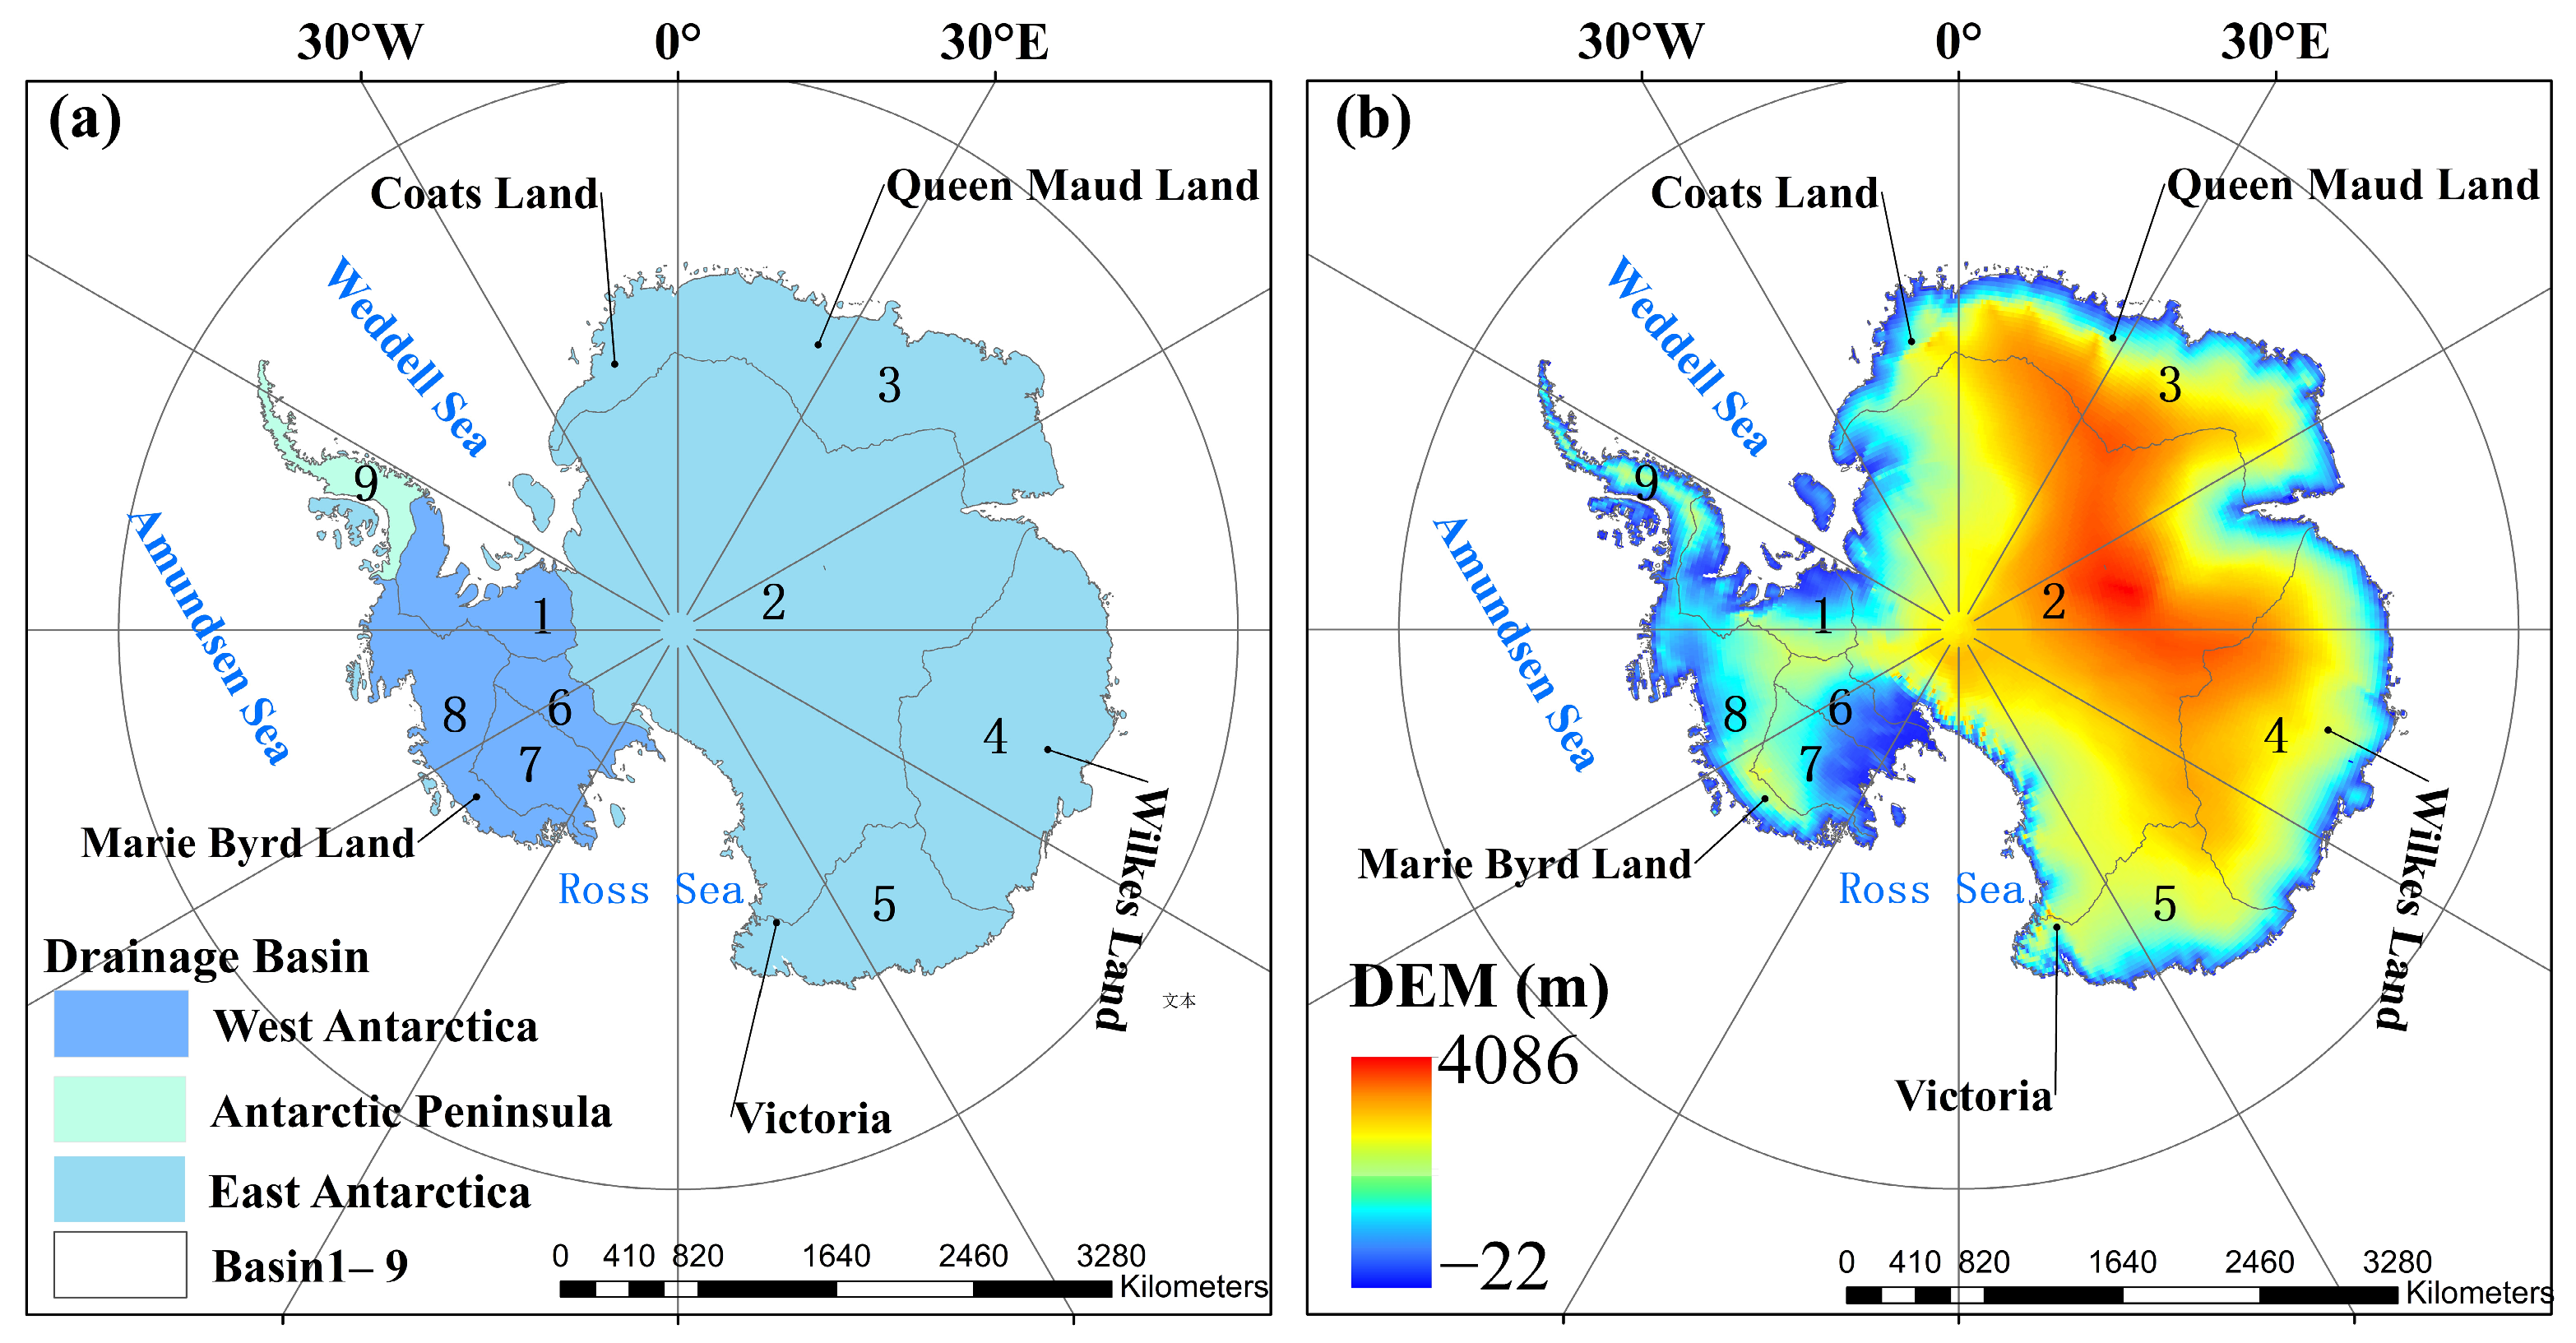
Figure 1. The Antarctic ice sheet and the sub-basin mapping areas. (a) is the region of the Antarctic ice sheet; (b) is the elevation of the Antarctic ice sheet.
Remotesensing 16 03776 g001
Figure 2. Flow chart.
Remotesensing 16 03776 g002
Figure 3. Time series of changes in Antarctic ice sheet mass balance. Time series of mass change in the Antarctic ice sheet, trend significance test p value less than 0.05 is indicated as *, and the change obtained by the 12-month moving average method is shown by the red line.
Remotesensing 16 03776 g003
Figure 4. Time series of ice sheet mass balance changes in various Antarctic regions. (a) is the West Antarctica and each river basin; (b) is the East Antarctica and each river basin; and (c) is the three Antarctic continents, of which the Antarctic Peninsula and Basin 9 are in the same area. The dotted lines are the ice cover in each basin between 2003–2016 and 201806–2022 fitted trend line.
Remotesensing 16 03776 g004
Figure 5. Spatial distribution of annual mean equivalent water height of ice sheet mass change at each stage during 2003–2022. (a) 2003–2006; (b) 2007–2008; (c) 2009–2011; (d) 2012–2016; (e) 2019–2022.
Remotesensing 16 03776 g005aRemotesensing 16 03776 g005b
Figure 6. Spatial distribution of mass balance equivalent water height trend in Antarctic ice sheet (a) 2003–2016; (b) 2018–2022. The shaded areas represent where the trend significance test has p < 0.05.
Remotesensing 16 03776 g006
Figure 7. Time series of monthly and quarterly changes in Antarctic ice sheet mass balance. (a) Multi-year monthly mean of Antarctic ice sheet mass change (blue areas are warm seasons); (b) Time series of ice sheet mass balance changes during the Antarctic warm and cold seasons.
Remotesensing 16 03776 g007
Figure 8. The spatial distribution and trend of the annual mass balance of the Antarctic ice sheet during the cold and warm seasons from 2003 to 2016.
Remotesensing 16 03776 g008aRemotesensing 16 03776 g008b
Figure 9. Time series of precipitation, net surface solar radiation, and air temperature in the Antarctic ice sheet region, 2003–2022. The dashed lines are the fitting trend lines for each climate factor during 2003–2022. The blue area represents the accelerated ice sheet loss period (2012–2016), while the red area indicates the dramatic ice sheet loss period (2017–2022).
Remotesensing 16 03776 g009
Figure 10. The spatial distribution of annual mean and variability trends in precipitation, net surface solar radiation, and air temperature over the Antarctic ice sheet is examined for the period from 2003 to 2022.
Remotesensing 16 03776 g010
Figure 11. The correlation coefficient between the equivalent water height of the Antarctic ice sheet mass balance and different lag periods of precipitation, net solar radiation, and air temperature on a monthly scale. Points marked with five-pointed stars in the figure have passed the significance test (p < 0.05).
Remotesensing 16 03776 g011
Figure 12. Spatial distribution of the number of lag periods of Antarctic ice sheet mass balance on precipitation, surface net solar radiation and temperature change.
Remotesensing 16 03776 g012aRemotesensing 16 03776 g012b
Figure 13. The relative contribution of climatic factors to the mass balance of the Antarctic ice sheet at the monthly scale. (a) Relative contribution in the same period; (b) Relative contribution of lag 1 period; (c) Relative contribution of lag 2 period. The value represents the proportion of the contribution degree of each influencing factor in that month, and the blue shaded area represents the warm season.
Remotesensing 16 03776 g013
Table 1. Rate of change of Antarctic ice sheet mass balance in each basin (trend significance test p values less than 0.05 are indicated as *).
BasinSlope (Gt/a)
2003–2016201806–2022
Basin 10.15 ± 0.4311.16 ± 2.59 *
Basin 218.37 ± 0.89 *20.59 ± 9.08 *
Basin 344.90 ± 0.96 *29.99 ± 3.20 *
Basin 4−7.45 ± 0.85 *9.77± 7.50
Basin 5−6.08 ± 0.37 *−12.82 ± 1.71 *
Basin 66.25 ± 0.09 *9.21 ± 0.87 *
Basin 7−1.86 ± 0.16 *−6.44 ± 0.76 *
Basin 8−488.79 ± 5.26 *−447.86 ± 14.67 *
Basin 9 (Antarctic Peninsula)−14.52 ± 0.31 *4.66 ± 1.96 *
East Antarctica36.77 ± 1.71 *45.57 ± 19.68 *
West Antarctica−105.29 ± 1.74 *−85.69 ± 6.88 *
Table 2. Relative contribution of climate factors to the mass balance of the Antarctic ice sheet at different scales.
Relative Contribution (%)AverageCold Season Warm Season
PSSRT2MPSSRT2MPSSRT2M
the same period (no lag)15.0943.4541.4610.3853.1536.569.3943.1547.46
lag 1 month34.3632.6932.9531.432.8635.7438.5332.4329.04
lag 2 month37.7829.8932.3332.5435.9631.5045.1021.4033.50
Table 3. Results of a study on the rate of change of Antarctic ice sheet loss mass (unit: Gt/a).
ReferencesData SourceTime QuantumRate
Schrama et al. (2014) [35]CSR RL052003–2013−91 ± 26
Watkins et al. (2015) [36]JPLM RL052003–2013−121 ± 29
Harig et al. (2016) [37]CSR RL052003–2014−92 ± 10
Mu et al. (2017) [38]CSR RL052003–2012−107 ± 34
Shepherd et al. (2018) [39]Combine Satellite1992–2017−104.62 ± 53.08
Gao Chunchun et al. (2019) [33]CSR RL062002–2016−118.6 ± 16.3
Groh et al. (2019) [40]Synthetic Data Sets 2003–2013−99 to −108
Cui Lilu et al. (2021) [34]CSR RL062003–2016−101.3 ± 7.1
Chen Wei et al. (2022) [17]CSRM RL06 v22003–2012−90 ± 27
JPLM RL06 v22003–2013−98 ± 27
CSR/GFZ/JPL RL062003–2014−108 ± 26
Groh A and Horwath M. (2021) [41]CSR RL062002–2020−90.9 ± 43.5
Yang, T.; Liang, Q et al. (2023) [42] MEaSUREs 2000–2020−89 ± 99
Yang Quanming et al. (2023) [28]Envisat GDR3.02002–2019−142 ± 4.3
I.N. Otosaka, et al. (2023) [18]Combining multiple data2002–2006−62 ± 41
2007–2011−130 ± 45
2012–2016−150 ± 43
Willen, M. O. et al. (2024) [43]ITSG-Grace20182011–2020−144 ± 27
This StudyCSRM RL062003–2013−82.9 ± 7.4
2003–2016−123.3 ± 6.2
Disclaimer/Publisher’s Note: The statements, opinions and data contained in all publications are solely those of the individual author(s) and contributor(s) and not of MDPI and/or the editor(s). MDPI and/or the editor(s) disclaim responsibility for any injury to people or property resulting from any ideas, methods, instructions or products referred to in the content.