Article

Individual Tree-Scale Aboveground Biomass Estimation of Woody Vegetation in a Semi-Arid Savanna Using 3D Data

1
Department for Earth Observation, Friedrich Schiller University Jena, Löbdergraben 32, 07743 Jena, Germany
2
Department of Organismic and Evolutionary Biology, Harvard University, Cambridge, MA 02138, USA
3
Department of Physical Geography, Friedrich Schiller University Jena, Löbdergraben 32, 07743 Jena, Germany
4
Unit of Computing Sciences, Tampere University, Korkeakoulunkatu 1, 33720 Tampere, Finland
5
Scientific Services, Savanna and Grassland Research Unit, South African National Parks (SANPARKs), Skukuza 1350, South Africa
6
School of Natural Resource Management, Nelson Mandela University, George Campus, George 6530, South Africa
7
Team Geoinformation, Department for Urban Development and Environment, City of Jena, Am Anger 26, 07743 Jena, Germany
*
Author to whom correspondence should be addressed.
Remote Sens. 2024, 16(2), 399; https://doi.org/10.3390/rs16020399
Submission received: 16 October 2023 / Revised: 15 December 2023 / Accepted: 16 January 2024 / Published: 19 January 2024
(This article belongs to the Section Forest Remote Sensing)

Abstract

:
Allometric equations are the most common way of assessing Aboveground biomass (AGB) but few exist for savanna ecosystems. The need for the accurate estimation of AGB has triggered an increase in the amount of research towards the 3D quantification of tree architecture through Terrestrial Laser Scanning (TLS). Quantitative Structure Models (QSMs) of trees have been described as the most accurate way. However, the accuracy of using QSMs has yet to be established for the savanna. We implemented a non-destructive method based on TLS and QSMs. Leaf-off multi scan TLS point clouds were acquired in 2015 in Kruger National Park, South Africa using a Riegl VZ1000. The 3D data covered 80.8 ha with an average point density of 315.3 points/m2. Individual tree segmentation was applied using the comparative shortest-path algorithm, resulting in 1000 trees. As 31 trees failed to be reconstructed, we reconstructed optimized QSMs for 969 trees and the computed tree volume was converted to AGB using a wood density of 0.9. The TLS-derived AGB was compared with AGB from three allometric equations. The best modelling results had an RMSE of 348.75 kg (mean = 416.4 kg) and a Concordance Correlation Coefficient (CCC) of 0.91. Optimized QSMs and model repetition gave robust estimates as given by the low coefficient of variation (CoV = 19.9% to 27.5%). The limitations of allometric equations can be addressed by the application of QSMs on high-density TLS data. Our study shows that the AGB of savanna vegetation can be modelled using QSMs and TLS point clouds. The results of this study are key in understanding savanna ecology, given its complex and dynamic nature.

Graphical Abstract

1. Introduction

Savanna ecosystems are characterized by the co-dominance of a continuous grass layer and variable tree layer [1,2]. Savannas cover 20% of the land surface and play an important role in the global carbon cycle by contributing 30% to gross primary productivity [3]. However, the inherent heterogeneity of savanna ecosystems due to the co-dominance of different physiognomies poses a challenge in accurately quantifying the carbon contribution of savanna ecosystems to the global carbon pool, and their carbon sequestration potential remains underestimated [4,5,6].
Aboveground biomass (AGB) is defined as “the total amount of oven-dried biological material present above the surface in an area” [7] (p. 1). The AGB of savannas varies spatially and temporally because of complex interactions of both biotic and abiotic drivers. As a result, the vegetation structure in savannas is described as a function of rainfall patterns combined with the effects of fire and herbivory [2,4,8,9]. Given the complex and dynamic nature of savannas, it is therefore critical to find an efficient way to regularly monitor and quantify AGB.
AGB across savannas is quantified by field measurements, which typically involve allometric equations [10,11]. However, few allometric equations exist for savannas. Allometric equations are mostly derived by measuring the diameter at breast height (DBH) and tree height and seldomly include wood density [4,10,12]. Recent studies across tropical and savanna ecosystems have shown that the inclusion of crown diameter in the development of allometric equations provides more accurate estimates [11,13]. However, crown measurements are difficult to acquire due to inaccuracies and the processes being labour-intensive and therefore are mostly omitted [14]. It is therefore critical to understand the variation in individual tree architecture, especially in savanna biomes, because tree crown structure varies significantly for a given DBH [15]. Allometries also have a limitation in that they rely on data generated through destructive sampling and large trees are usually underrepresented in the sample [16,17,18]. Accordingly, they underestimate the actual biomass [19]. Furthermore, allometries assume that the AGB depends directly on tree height and/or DBH, which is not the case [20]. Thus, trees with the same DBH can have significantly different biomass, especially in savannas where herbivory and other disturbances shape trees.
Terrestrial Laser Scanning (TLS) is an active remote sensing technology that uses a laser to characterise vegetation structure at unprecedented scales [21,22]. TLS enables estimates of individual tree and plot AGB which are independent of allometry, less biased to tree size and reduce uncertainty in AGB estimation [23]. TLS scans collected over large areas enable the calibration and validation of remote sensing AGB products. TLS has been endorsed as crucial for the calibration of remote sensing biomass products [24]. TLS also allows the improvement in allometric equations. For example, Lau et al. (2019) [13] and Momo Takoudjou et al. (2018) [25] both developed allometric equations without destructive sampling for tropical forests that countered the limitations of allometric equations, especially for large trees, using TLS data with Quantitative Structural Models (QSMs). The ability to collect multi-temporal TLS scans makes it possible to assess the growth and evolution of stands over time [26,27]. Thus, TLS offers a non-destructive approach and provides accurate 3D information about vegetation structure that is difficult to obtain with traditional methods [26,28].
The high-density point cloud together with reconstruction algorithms such as TreeQSM has been used to quantify AGB with success in an Australian Savanna [29], boreal forest of China [30], tropical forests of Peru, Indonesia and Guyana [31], and tropical forests of eastern Cameroon [25] and to assess structural change [32,33]. QSMs are geometrical models consisting of a collection of cylinders that describe a tree in a hierarchical order and they can be used to reconstruct a 3D model of trees using point clouds to extract various attributes [34,35]. QSMs have been described as the most accurate way to estimate vegetation structure, volume and AGB as these are independent of tree size or shape [31]. QSMs have been shown to estimate AGB to within 10% accuracy as compared to destructive data [36,37].
Zimbres et al. (2020) [38] highlighted that building volume models such as QSMs for savanna vegetation is a promising method to improve predictive models because an accurate 3D volume fit of trees can be achieved which enables the shift from field estimates or LiDAR metrices still dependent on calibration from allometric equations. Also, allometric equations account for biomass of a certain DBH, usually 5 cm in savanna woodland, whilst the application of TLS-QSM approach captures the whole structure [38], including large trees which are usually not harvested resulting in large absolute errors [29]. Thus, the TLS-QSM approach allows for the generation of biomass models for whole plots [38].
QSMs are the key to improving savanna tree allometries and non-destructively assessing biomass and how it changes over time [38]. They do not require DBH information and show better agreement with reference data [13]. The QSM method does not rely on a relationship with field data but it uses volume estimates based on 3D data and wood density to derive AGB [29]. It, thus, allows AGB estimation based on the modelling of single trees rather than using allometric models, which are based on empirical relationships from a small sample of trees with limited structural parameters [31]. However, the accuracy of using volume reconstruction algorithms for biomass estimation in African savannas has yet to be established [39].
In this contribution, we aim to non-destructively estimate the woody biomass of savanna vegetation through high-density TLS point clouds and QSMs. In addition, we also establish the reliability of using QSMs in estimating the AGB by deriving the sensitivity of the estimated volume for each reconstructed tree. This enables us to quantify and identify the biases of working with TLS data in deriving AGB in African savannas which is critical when scaling up to satellite AGB products. We present a workflow based on TLS as an approach to estimate AGB of savanna vegetation with the potential of developing accurate allometric equations for the savanna ecosystem. The main objectives of the study are the following:
  • To derive the AGB of savanna trees through a non-destructive TLS-QSM based volume approach;
  • To quantify the uncertainty of our approach;
  • To compare the TLS-QSM approach with results from allometric equations.

2. Materials and Methods

2.1. Study Site

The study was conducted in the Kruger National Park (KNP), an extensive protected area in the Lowveld located in the North East of South Africa (Figure 1) and was focussed on a test site around the Skukuza eddy covariance (EC) flux tower (23°98′S, 31°55′E, 365 m a.s.l.). The flux tower was set up in the year 2000 to investigate the land–atmosphere interactions in a pristine savanna environment [40]. The landscape is undulating and climate is semi-arid with summer rains occurring from late October to February, with a mean of around 550 mm/yr [41]. Soils throughout the study area are derived from granite and are characterized as nutrient-poor, coarse-textured, sandy soils [41]. The open savanna vegetation is characterised by shrubs interspersed with taller trees. The most common shrubs, woody plants greater than 0.5 m but less than 2.5 m tall, at the site are Grewia flavescens, Grewia bicolor, Euclea natalensis, Euclea divinorum and Ormocarpum trichocarpum and the tree community is dominated by Combretum, Sclerocarya [40] and Vachellia and Senegalia species [42,43].

2.2. Three-Dimensional Vegetation Structure Data and Pre-Processing

The vegetation was mapped with multiple return TLS on five days in September 2015 using a Riegl VZ 1000 [45]. TLS derived AGB estimates require wood only points [25,46] because it does not model foliage or needles, so in that regard we scanned in the late dry season in 2015 to ensure reliable volume estimates and QSMs.
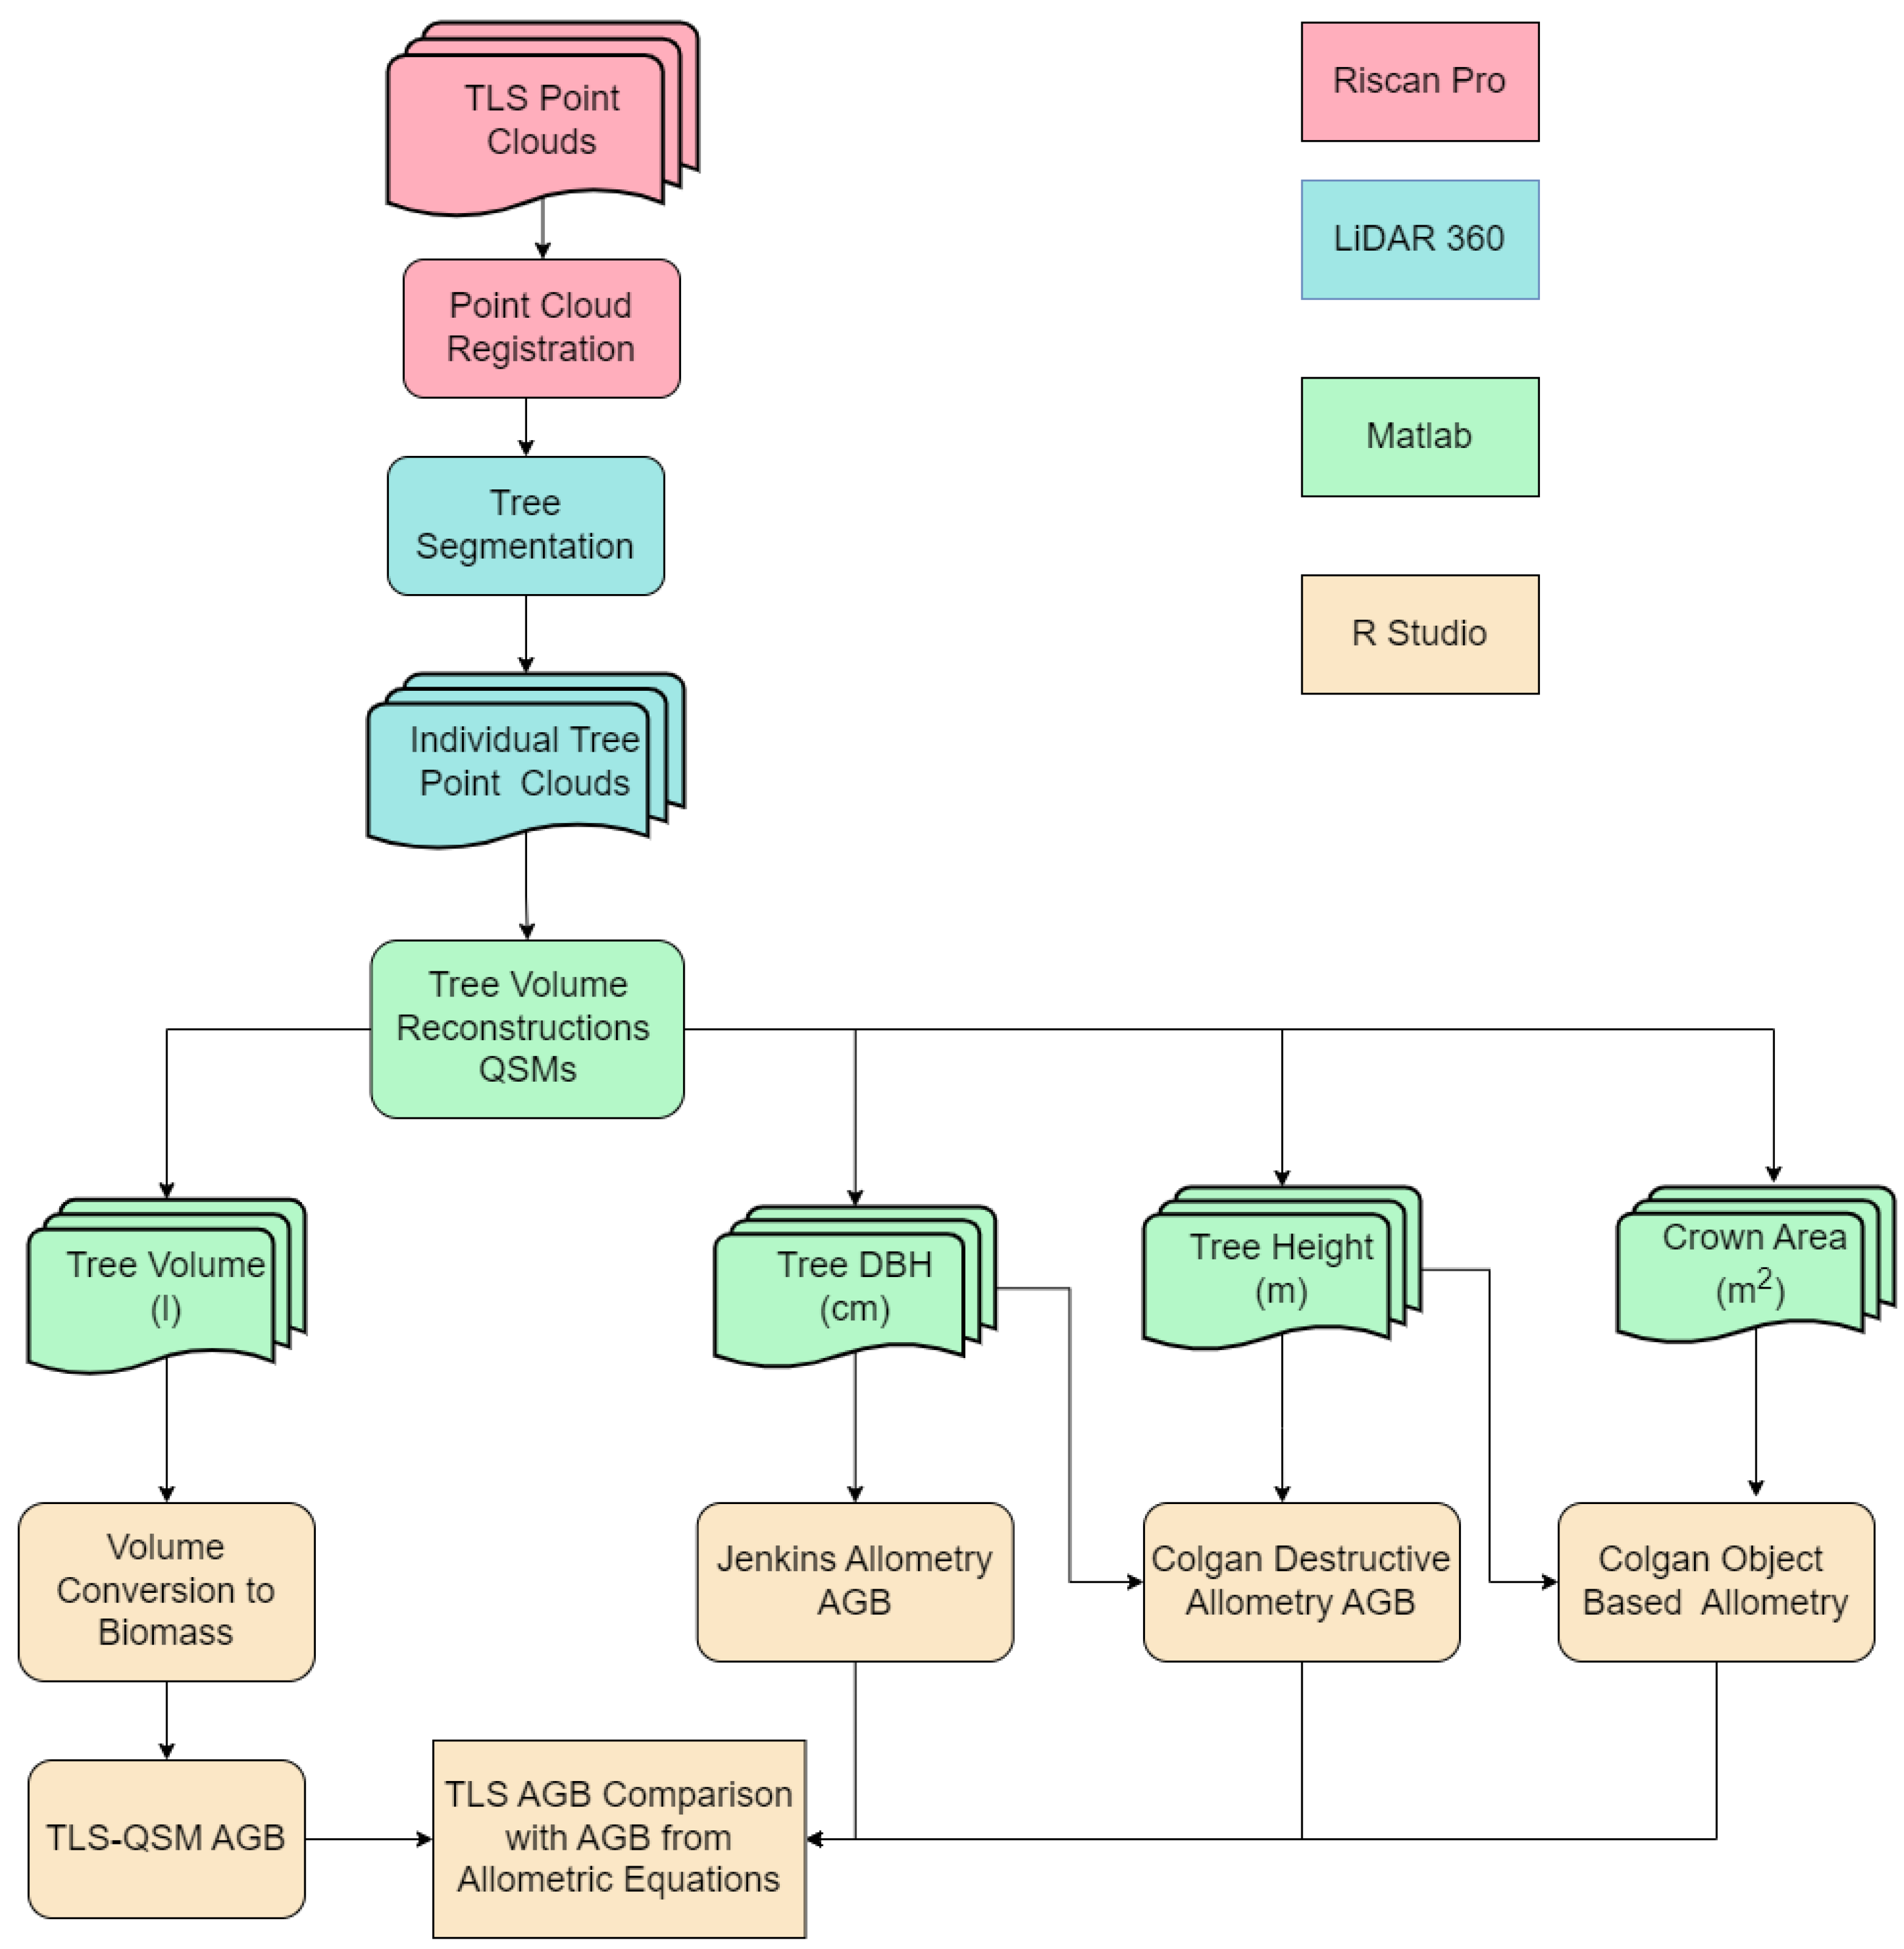
The TLS was mounted on a tripod, 2 m above ground and—where available—on termite mounds to increase the elevation above the terrain, and data were collected using angular sampling of 0.04° and 0.015°. The Riegl VZ 1000 uses the near-infrared wavelength and has an accuracy of 8 mm and a precision of 5 mm which ensures high accuracy. TLS scans were collected from 28 scan positions arranged in a circular pattern around the Skukuza Flux Tower covering 80.8 ha. A total of 81 temporary tie points (white reflectors) were used for the precise georeferencing of the scans based on differential Global Navigation Satellite System (dGNSS) position determinations using a Leica Viva GNSS GS10 base station and a GS15 Rover (Leica, Wetzlar, Germany) tied to the South African Trignet of permanently recording receiving stations. The 3D uncertainty of dGNSS point measurements ranged between 0.008 and 0.02 m with a mean of 0.012 ± 0.003 m. The number of tie points for single scan positions varied between zero and seven. Thus, a few scan positions had to be coregistered with the other point clouds using the Riegl RISCAN PRO Multi Station Adjustment (MSA) tool. The overall co-registration accuracy was 0.03 m. Finally, the point cloud was filtered to remove isolated points, georeferenced to the WGS84/UTM 36S coordinate system and exported to LAS format for further analysis in LiDAR 360 software (v 5.4) (Green Valley International © 2022, Berkeley, CA, USA). Figure 2 shows the detailed workflow of the 3D TLS point cloud data processing.

2.3. Tree Segmentation

Individual tree segmentation was applied to the point cloud using the comparative shortest-path (CSP) algorithm [47] implemented in LiDAR 360 (v 5.4). The study area was divided into 21 subplots of approximately 250 × 250 m2. The segmentation process involved classification of ground points using the triangulation interpolation algorithm [48]. To eliminate the difference in vegetation height caused by elevation, classified ground points were used to normalize the point cloud to height above ground. Automatic tree segmentation was conducted on the normalised point cloud using a minimum tree height of 1.5 m and DBH of 2 cm. The resulting segments were manually edited to correct for any under or over-segmentation [49,50,51]. After manual segmentation, individual tree attributes were recalculated, and the individual trees were extracted by Tree ID. The individual trees were further processed in Cloud Compare (v 2.12.4) [52] to convert the global coordinates to local coordinates before structural modelling.

2.4. QSM Reconstruction of Individual Trees

The woody volume of the trees was derived using the TreeQSM (v 2.4.0) developed by Raumonen et al. (2013) [53] and implemented in MATLAB (v 2019a). The QSM method is described in [30,31,54]. The algorithm covers the point cloud with small subsets (surface patches) for branch segmentation. The patch sizes are chosen based on the tree size, complexity and point density and they are defined by three parameters: PD1 (=PatchDiam1), PD2Min (=PatchDiam2Min), and PD2Max (=PatchDiam2Max). For each tree, optimum values for these three parameters need to be selected, and we used three different values for PD2Max and PD1 and four values for PD2Min, resulting in 36 combinations of parameters. PD2Min is usually the most sensitive parameter and thus its value needs to be optimized best. In this study, the values for PD1 and PD2Max were determined using a rough estimate of the tree DBH, with an increment of 0.02 m. The values of PD2Min used ranged from 0.02 to 0.05 m based on the minimum resolution of the point cloud, which was 0.01 m, with an increment of 0.01 m (Table 1). The criterion trunk + branch_mean_distance was used for the optimization as it includes all parts of the tree in modelling but gives more weight to the trunk which ensures the trunk of the tree is modelled accurately. This criterion minimizes the distance between the cylinder surfaces and the point cloud by computing the mean distance between a cylinder and the points closest to it so that the weighted average over all the cylinders is minimized.
To estimate the variability in the resulting QSMs due to the stochastic behaviour of the TreeQSM, ten repeated QSMs were reconstructed for the different parameter combinations resulting in 360 QSMs per tree. The volumes and other attributes computed from the QSMs are the means over the ten repeated QSMs with the optimal inputs. The uncertainty in the ten model runs per tree was analysed by dividing the trees into three size classes based on DBH; small (DBH ≤ 25 cm), medium (25 cm < DBH ≤ 50 cm) and large (DBH > 50 cm). The uncertainty was then estimated by the average Coefficient of Variation (CoV) of the total volume per diameter class.
The sensitivity of the optimal QSMs in terms of volumes to the choice of the optimal PatchDiam-parameters was also estimated. Specifically, how robust would the resulting volumes be if the values of the PatchDiam-parameters were chosen differently. For example, if PD1 had values of [0.1 0.2 0.3 0.4 0.5] and the optimal value was 0.4, the values 0.3 and 0.5 are selected as they are closest to 0.4. The relative change in the input was (0.5 − 0.4)/0.4 = (0.4 − 0.3)/0.4 = 0.1/0.4 = 0.25 = 25%. Then, the change in the attribute was calculated, e.g., if Vol_0.3 = 1000 L and Vol_0.5 = 1100 L and Vol_opt = Vol_0.4 = 1060 L, the absolute changes were 1060 − 1000 = 60 and 1100 − 1060 = 40, and in this case 60 is greater. Relative to the optimal value, 60/1060 = 5.66% was the relative change in volume. The sensitivity is then the quotient of the two relative changes (relative change in the volume/relative change in the input parameter) expressed as a percentage.
If 1.1% is the relative sensitivity of total volume to PD1 and the total volume of the optimal QSMs is 1010 L, it means the total volume changes by 1.1% (or 11 L) when the PD1 value changes by 100% (e.g., from 0.1 to 0.2). Therefore, low sensitivity implies that the results are robust and vice versa. QSMs are data-driven, meaning that low-quality point cloud data (low density) will result in badly reconstructed QSMs and thus inaccurate volume estimates. Data quality is mainly affected by increasing beam size and decreasing coverage with increasing distance from the scanner. Figure 3 shows examples of different sizes, qualities and structures of savanna tree point clouds and the resulting QSMs.

2.5. Selection of Wood Density

In order to convert the derived volume using the QSMs to AGB, we used a mean wood density value of 0.9 recommended for common species found in KNP and representative of species found at our test site. No species data were collected to enable us to use species-specific estimates of wood density. Nonetheless, these too would have been limited due to the tree internal variation of wood density in individual trees [55]. The value of 0.9 was used for modelling because, in line with Colgan et al. (2013) [10], a mean wood density of 0.9 ± 0.02 (mean ± SE; n = 88 samples) was determined using a total harvested wood dry mass from more than 3000 stems. The mean wood density varied between species from 0.55 for Sclerocarya birrea to 1.20 for Combretum imberbe. Thus, we considered using the reported mean of Colgan’s large sample as a workable solution for the value of wood density, since he worked just outside KNP, which has comparable environmental conditions to our test site.

2.6. Allometric Equations for Tree AGB Estimation

The individual AGB of each reconstructed tree was estimated using three allometric equations. The first equation (Equation (1), Colgan destructive allometry) relates the dry mass weight of trees to the stem diameter and tree height [10]. This equation was inferred from destructive sampling in a savanna area adjacent to Kruger National Park. The tree species sampled for this allometry were representative of the species found at our test site with a defined wood density of 0.9 [10]:
m = 0.109 D 1.39 + 0.14 I n D H 0.73 ρ 0.80
where m (kg) is the tree dry mass, D (cm) is the field-measured basal stem diameter measured at 10 cm above the ground, H (m) is the tree height and ρ is the wood-specific gravity of 0.9. In this study, DBH was used because it could be easily measured from the point cloud as the diameter of a cylinder fitted at 1.3 m above ground. Both the DBH and tree height were estimated based on the QSMs. The substitution of the basal stem diameter by DBH in Equation (1) implies an underestimation of tree dry mass calculated from this allometric equation.
In addition, we used object-based allometry (Equation (2)) [10]. This function was initially developed for airborne LiDAR and was used with TLS in this study:
I n   ( m ) = β 0 + β 1 I n A o b j + β 2 I n A o b j 2 + β 3   I n H o b j  
where m (kg) is tree dry mass, Aobj (m2) is the projected crown area of a tree, Hobj (m) is the maximum tree height, β0 is 0.115, β1 is 0.161, β2 is 0.252 and β3 is 1.73. Aobj and Hobj were estimated using the QSMs. βx are linear model coefficients with β0 also including the correction factor.
The third equation (Equation (3)) was developed by Jenkins et al. (2003) [56] for temperate hardwoods with a maximum diameter of 230 cm. It was specifically designed for use in large-scale forest carbon budget inventories:
A G B = e 2.01 D B H 2.43 × e 0.236 2 2  
where AGB is aboveground woody plant dry mass (kg), DBH is the diameter at breast height (cm) and e 0.236 2 2 is the error in the estimation of the logged woody biomass.
The individual tree AGB calculated from the three allometric equations was compared to the TLS-QSM method, which is explained in the following.

2.7. TLS-QSM Derived AGB

The volume of individual trees (in litres) was derived through the reconstruction of QSMs. The total volume was the average of the ten QSMs reconstructions. To obtain individual-tree AGB (in kg), the resulting tree volume was multiplied by wood density. In this study, a mean wood density value of 0.9 was used [10]. The derived TLS-QSM AGB was compared against the allometric equations by calculating the R2 of the linear regression model, the root-mean-square error (RMSE) to the 1:1-line, and the Concordance Correlation Coefficient (CCC) [57], which computes the agreement of two different methods on a continuous scale and ranges from perfect agreement (+1) to perfect disagreement (−1) [29].

3. Results

3.1. Statistical Relationships of Tree Parameters Derived from QSM Reconstruction

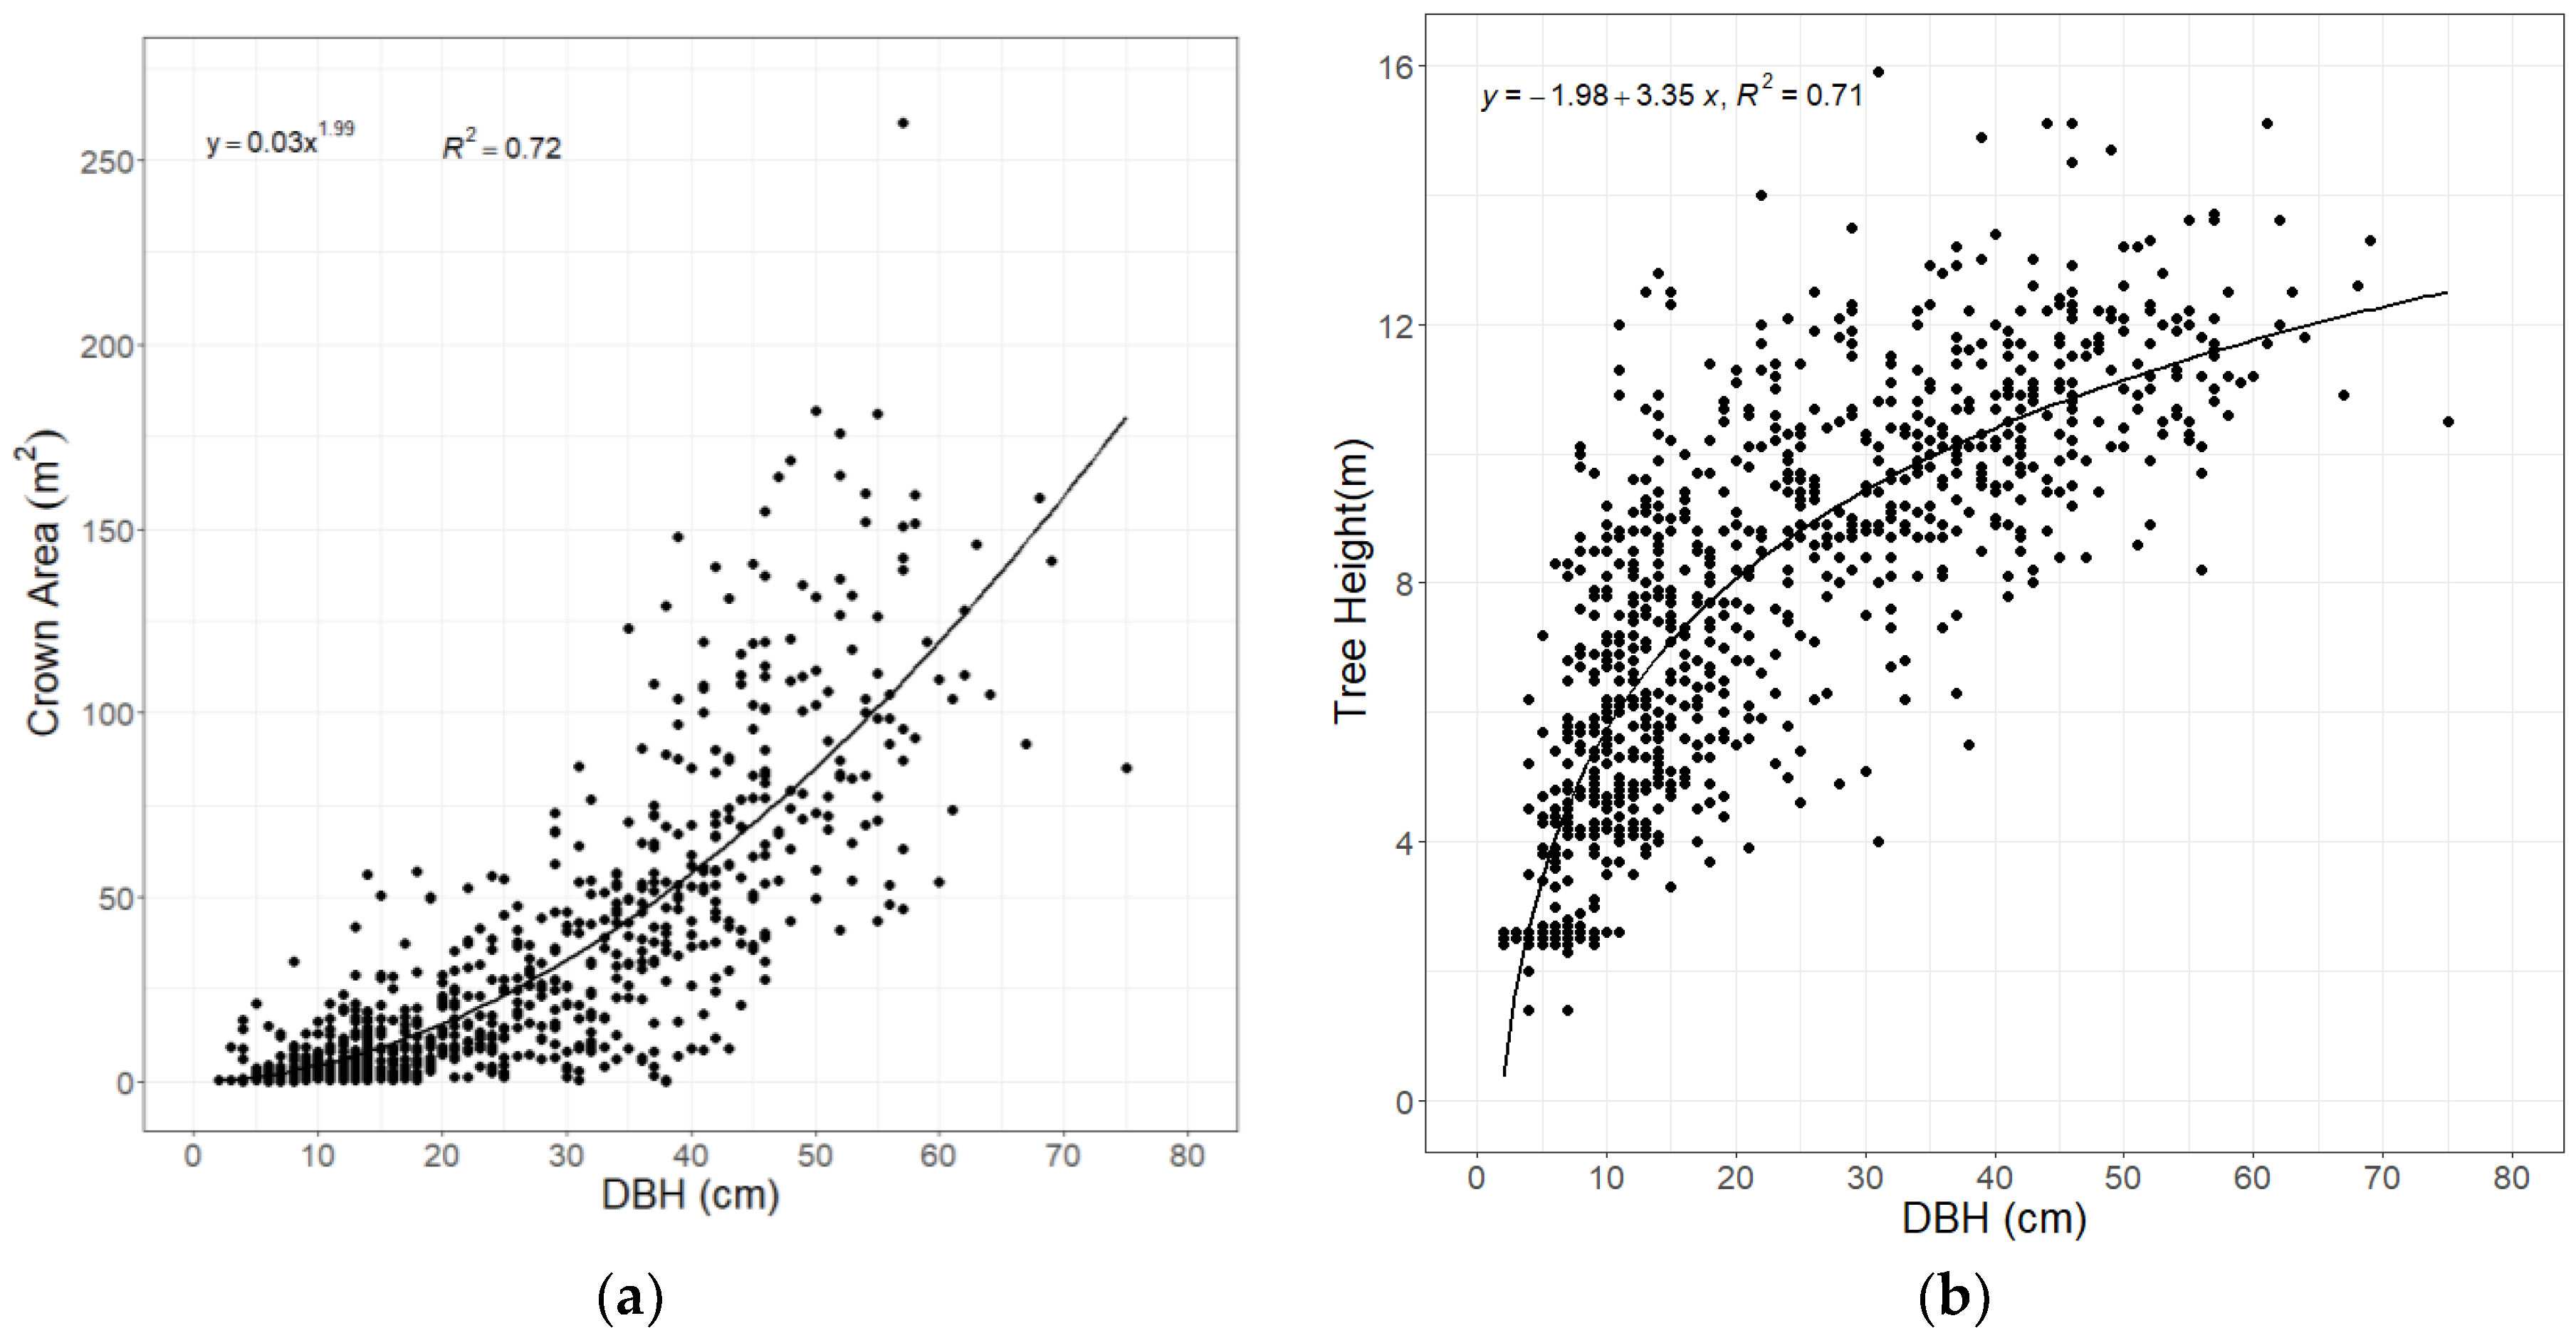
The relationship between DBH and Crown Area and DBH and Tree Height is shown in Figure 4a,b, respectively. The relationship between DBH and crown area had an R2 of 0.72 whilst the relationship between DBH and tree height had an R2 of 0.71.

3.2. Relationship between Tree Parameters and AGB

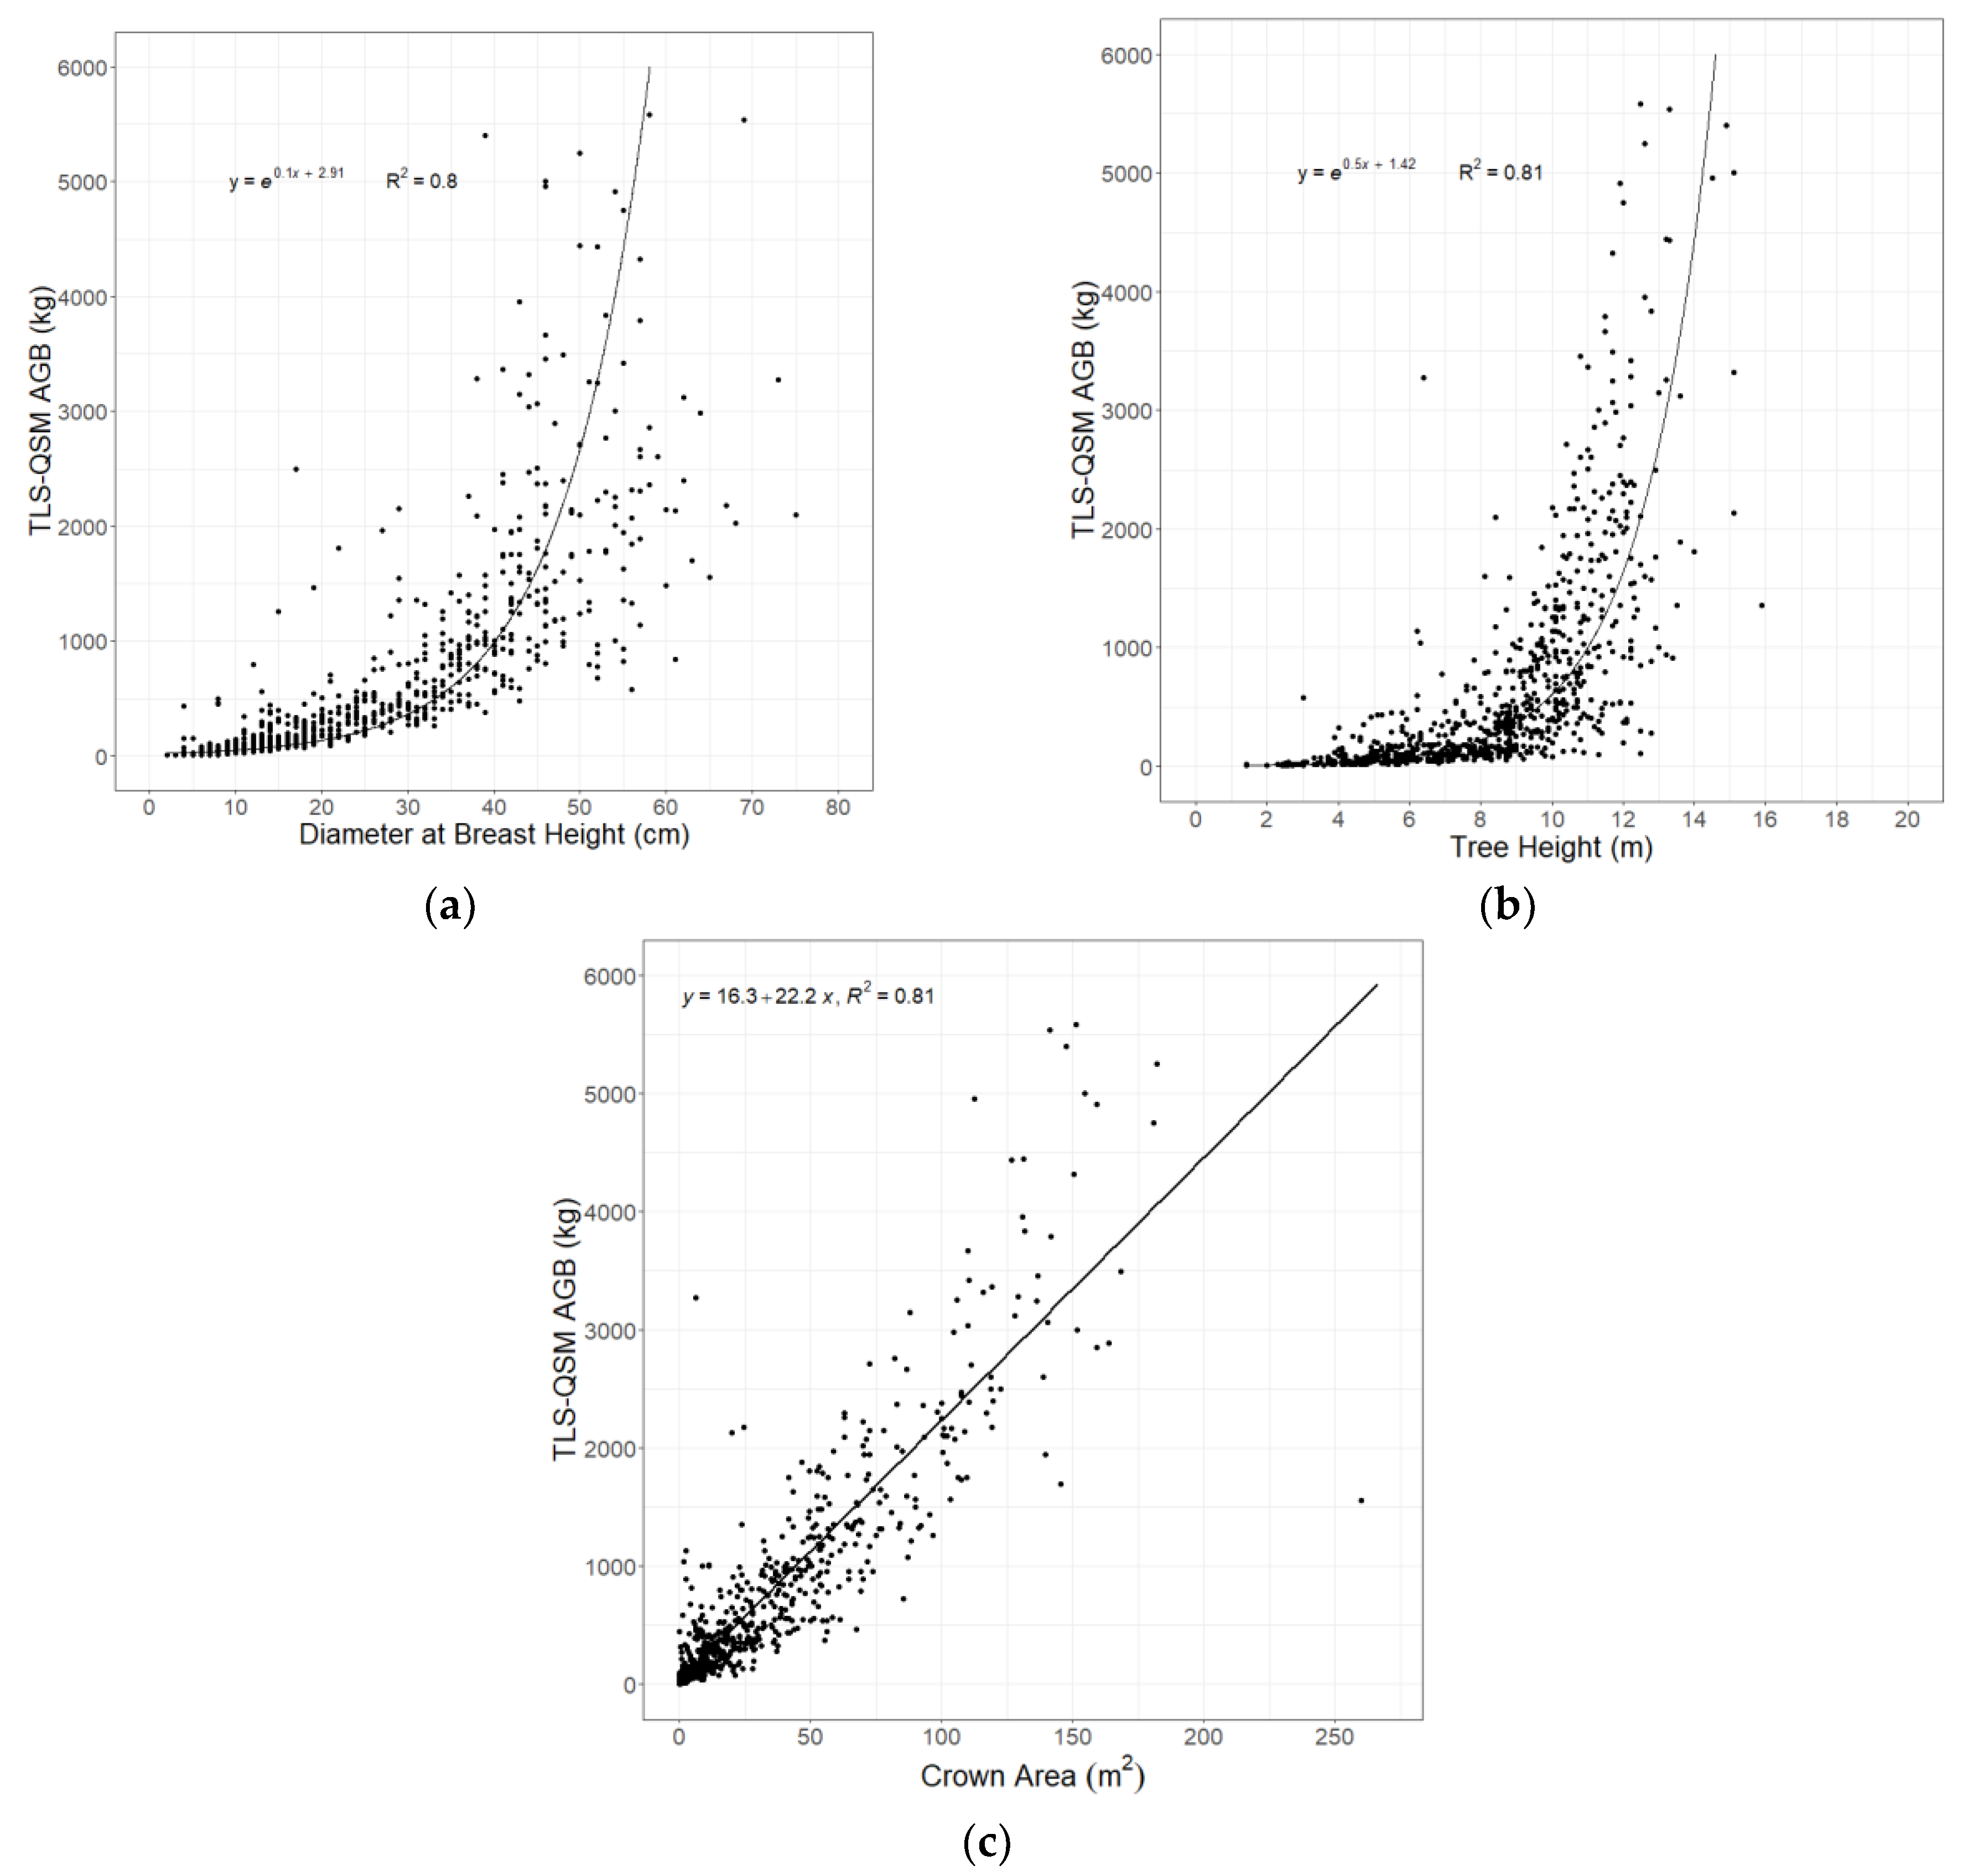
Testing the tree attributes commonly used to develop allometric equations and analysing their relationship with the derived AGB from the TLS-QSM method showed exponential relationships of 0.80 and 0.81 R2 for DBH and height, respectively (Figure 5a,b). However, the crown area showed a positive linear relationship, with an R2 of 0.81 (Figure 5c). Trees above 40 cm in DBH had large crowns (Figure 4a) and were taller (Figure 4b); thus, this explains the high correlation between the tree parameters and the predicted AGB.

3.3. Sensitivity of the QSMs to the Input Parameters

Sensitivity of the QSMs to the input parameters was modelled for all the 969 reconstructed trees. A small value/low sensitivity implies the modelled volume changes by a small magnitude if the value of the optimum parameter setting changes. Low sensitivity thus implies a good estimate of the modelled volume for the individual tree and robust results. The general observation is that trees with low point density showed the highest sensitivity whilst trees with high point density showed low sensitivity.
Table 2 shows the average point densities and sensitivities per tree parameter class. The tree parameters analysed were DBH, tree height, crown area and crown volume. The sensitivity per input parameter is inversely related to the average point density for all tree parameters. The sensitivity is generally high for the input parameter PD2Min which is the most sensitive parameter for all tree parameters. The general observation is that the medium and large trees among the different tree parameters had low sensitivity as compared to the small trees.
Dividing our data into quartiles based on point density (Table 3), we were able to further analyse the reliability of our method in estimating AGB of savanna trees. We observed that point density is inversely related to the sensitivity, as we expected. Data quality determines the quality of the QSMs generated. The most reliable estimates were derived from trees with the highest point density. From Table 2 above, the large and medium trees exhibited the lowest sensitivity regardless of the tree parameter class because bigger objects would receive more hits from the laser as compared to smaller objects. A big and a small tree at equal distances from the scanner would result in high point density from the big tree as compared to the smaller tree and the point density decreases significantly for the small trees with increasing distance from the scanner.

3.4. Uncertainty of QSM Reconstruction

The uncertainty of the ten repeated models was analysed and Table 4 shows the uncertainty per size class. The CoV for all the diameter classes was generally low, implying that our results are robust. However, the average CoV increased with a decrease in the diameter with small trees showing the highest CoV values, whilst the medium and large trees had the lowest.

3.5. Aboveground Biomass Estimation

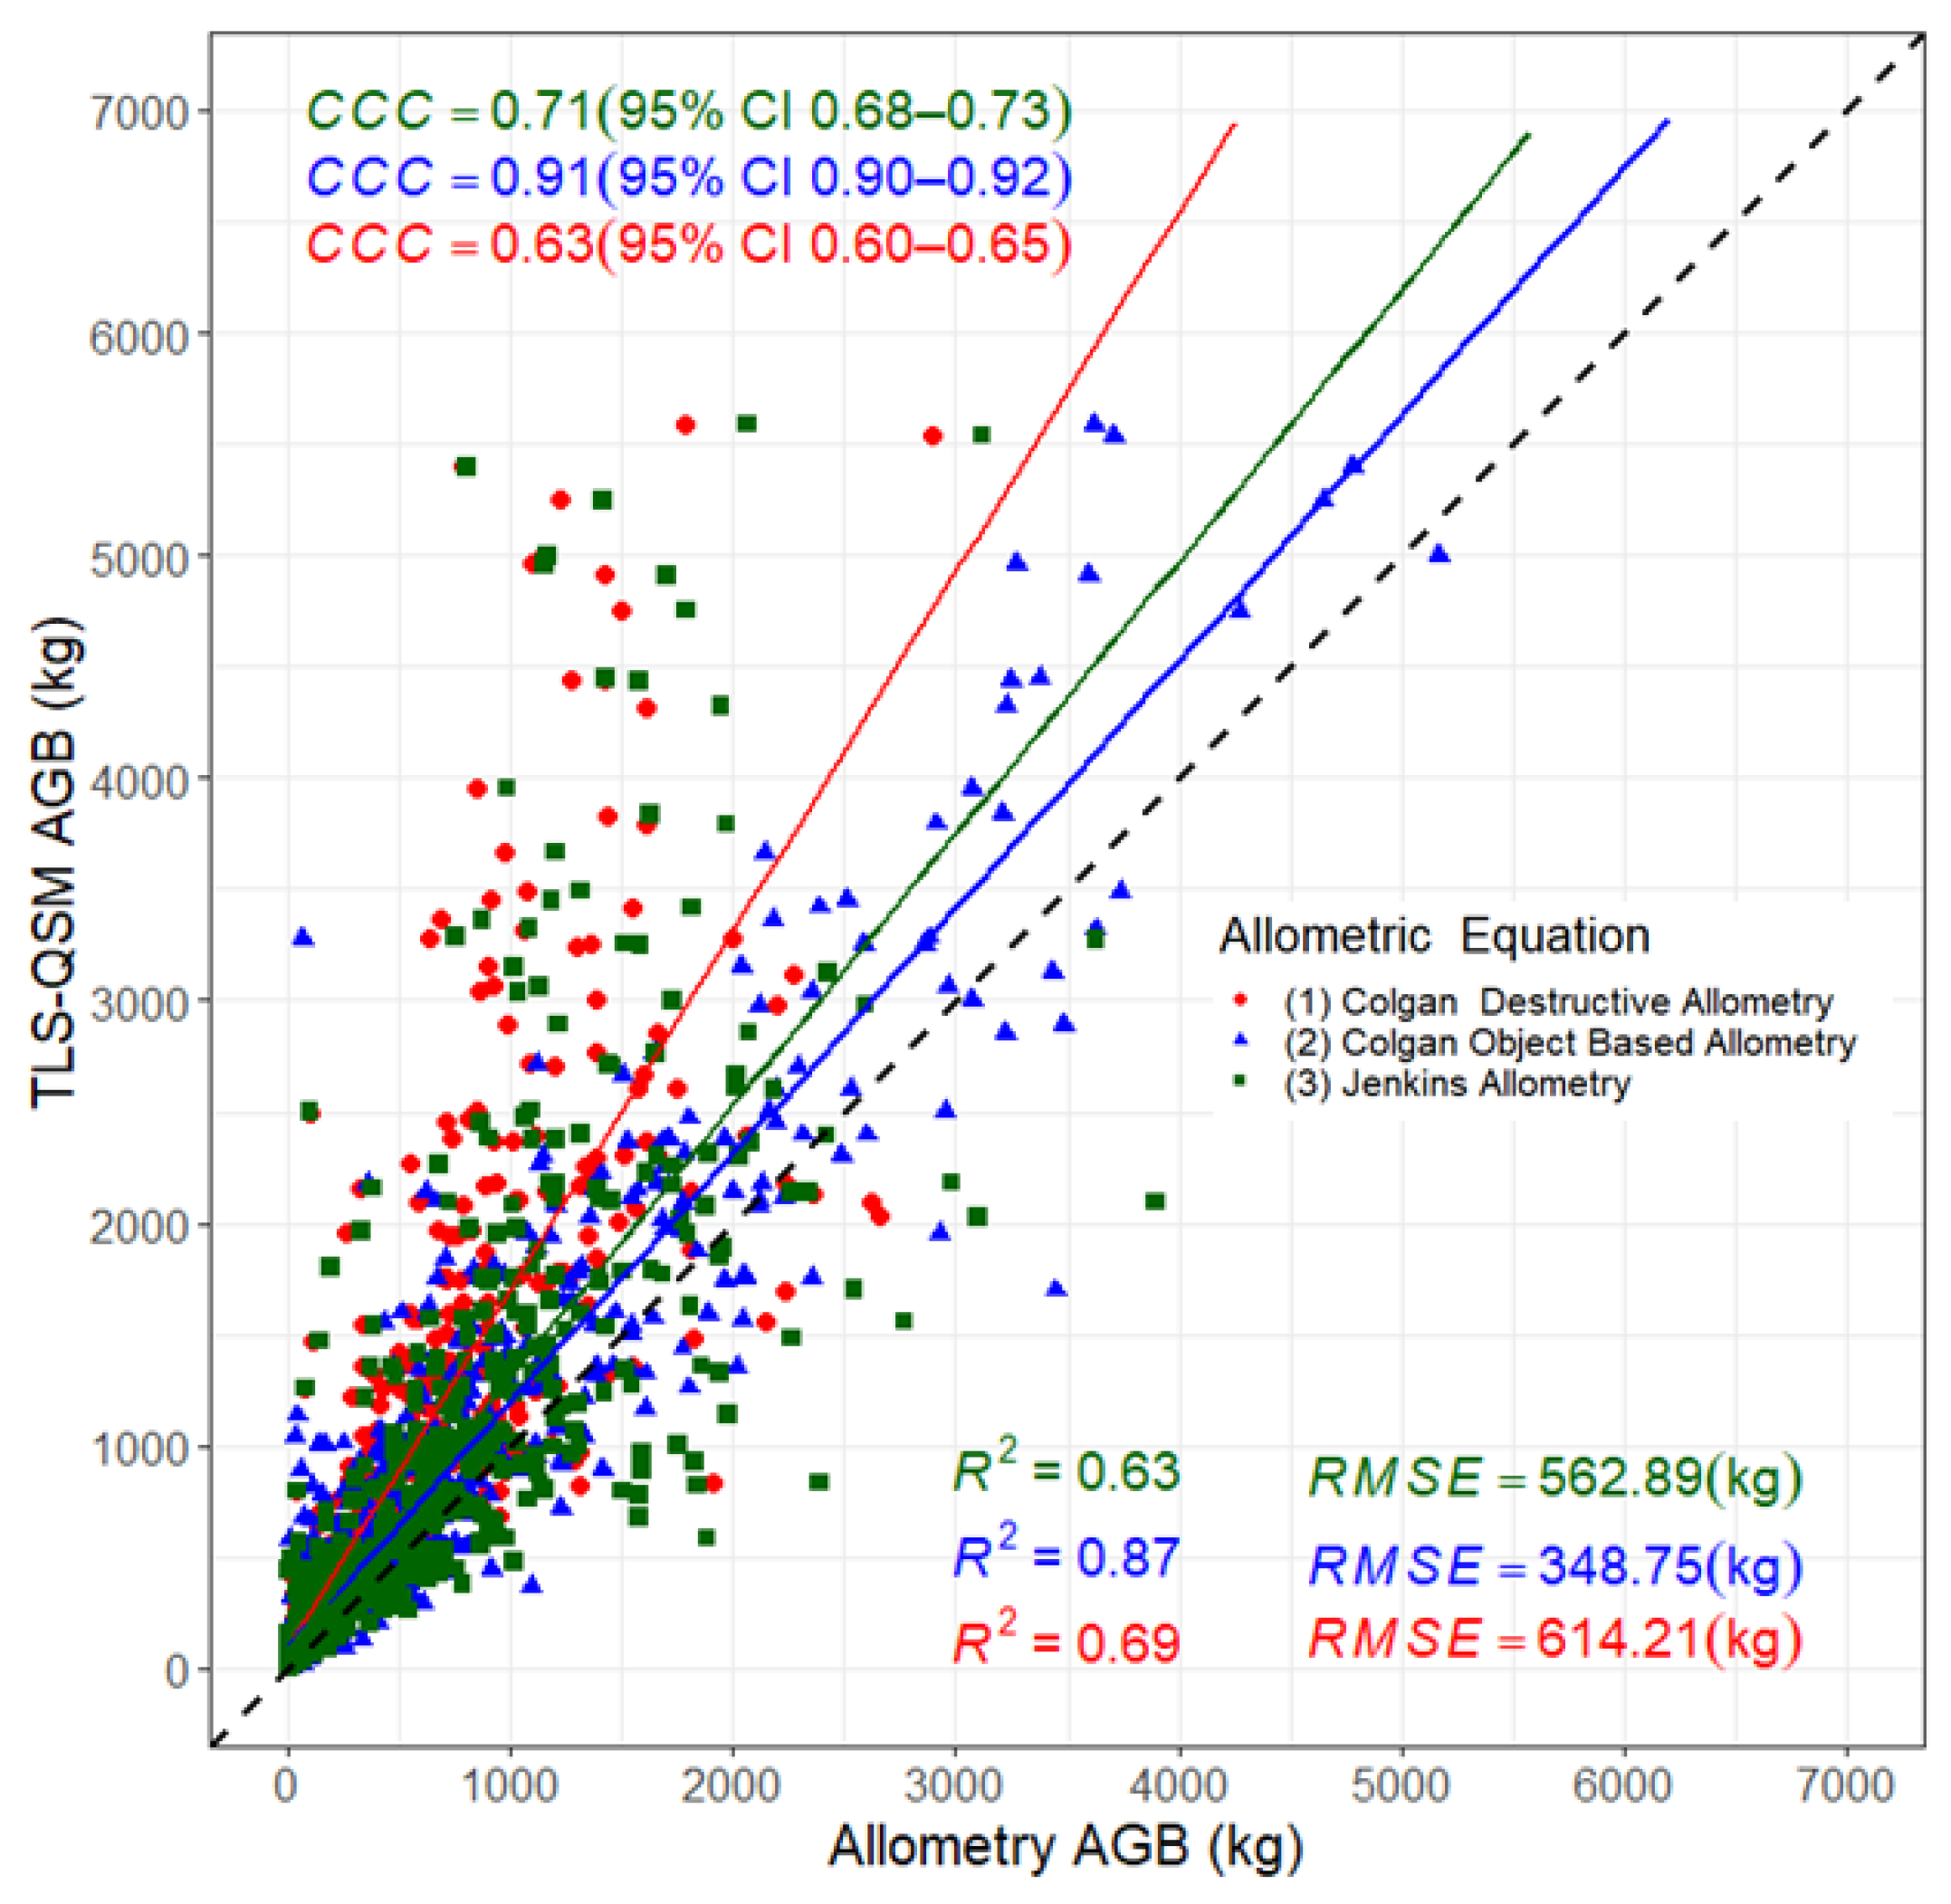
Of the 1000 trees segmented, 31 failed to reconstruct mainly due to low point density, resulting in 969 successful TLS-QSM reconstructions. Using simple linear regression and CCC, we compared the TLS-QSM-derived AGB to three allometric equations. The results indicate that all allometric equations underestimated the AGB as compared to the TLS-QSM method (Figure 6). Comparing individual allometric equations to the TLS-QSM-derived AGB (mean = 556.6 kg), the best modelling results were achieved with the Colgan object-based allometry (Equation (2)) (mean = 416.4 kg) (RMSE = 348.75 kg) and a CCC of 0.91. Comparison with the Jenkins allometry (Equation (3)), (mean = 384.6 kg) resulted in an RMSE of 562.89 kg and a CCC of 0.71. The lowest agreement was found in the comparison with Colgan destructive allometry (Equation (1)), (mean = 288.3 kg), with an RMSE of 614.21 kg and a CCC of 0.63. With respect to the 1:1 line (Figure 6), most observations fell above, showing an underestimation of the AGB by allometric equations especially for the large trees when using Colgan destructive and Jenkins allometry. The results indicated fewer deviations of the small trees from the reference as compared to the large trees.
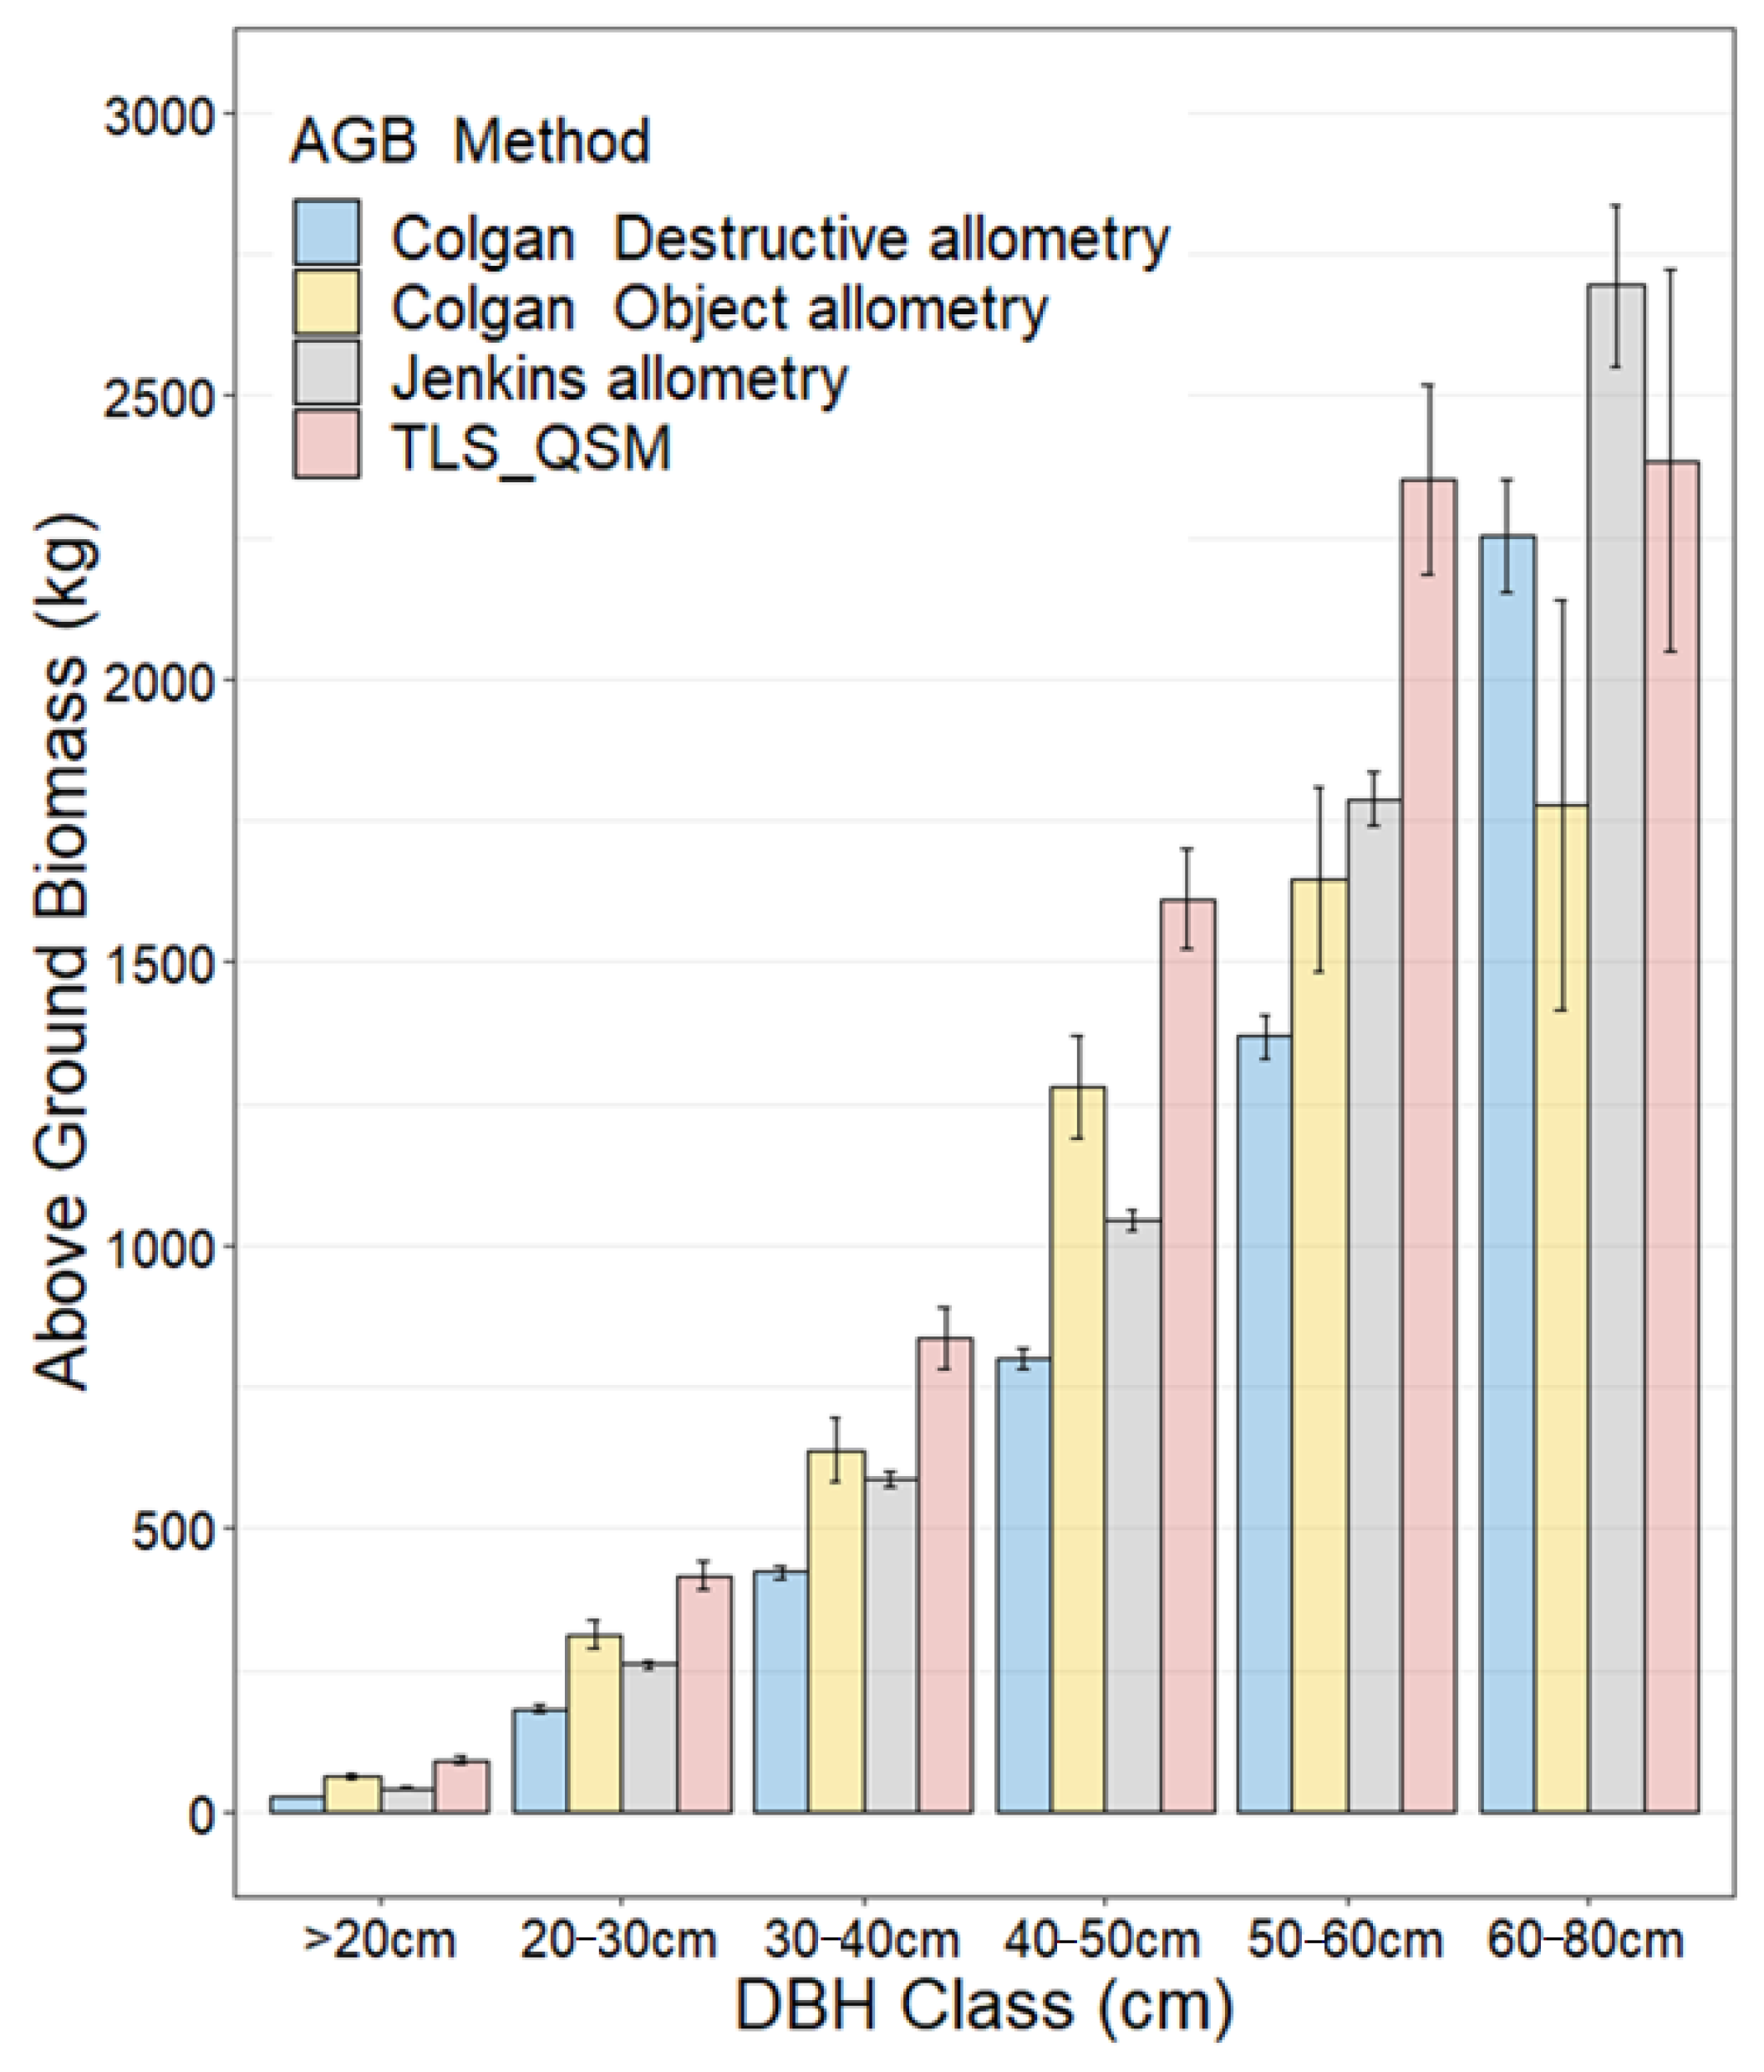
We compared the average AGB per DBH class for all the four methods used in AGB estimation (Figure 7). It was observed that the TLS-QSM method estimated more biomass for all the DBH classes except for the diameter class 60–80 cm. Jenkins allometry (Equation (3)) predicted the most biomass for the DBH-class 60–80 cm because the allometry was built to estimate the biomass of large trees with a maximum DBH of 230 cm. Colgan destructive allometry (Equation (1)) predicted significantly high biomass for the 60–80 cm DBH class because it was developed from a sample of trees with the largest having a diameter of 79.3 cm; in this study, the largest DBH tree was 75 cm. Colgan Object allometry (Equation (2)) consistently predicted biomass in all DBH classes and performed relatively similarly to the TLS-QSM method because the allometry was developed using the crown area as a predictor variable, and thus, it was able to account for the biomass in the tree canopy.
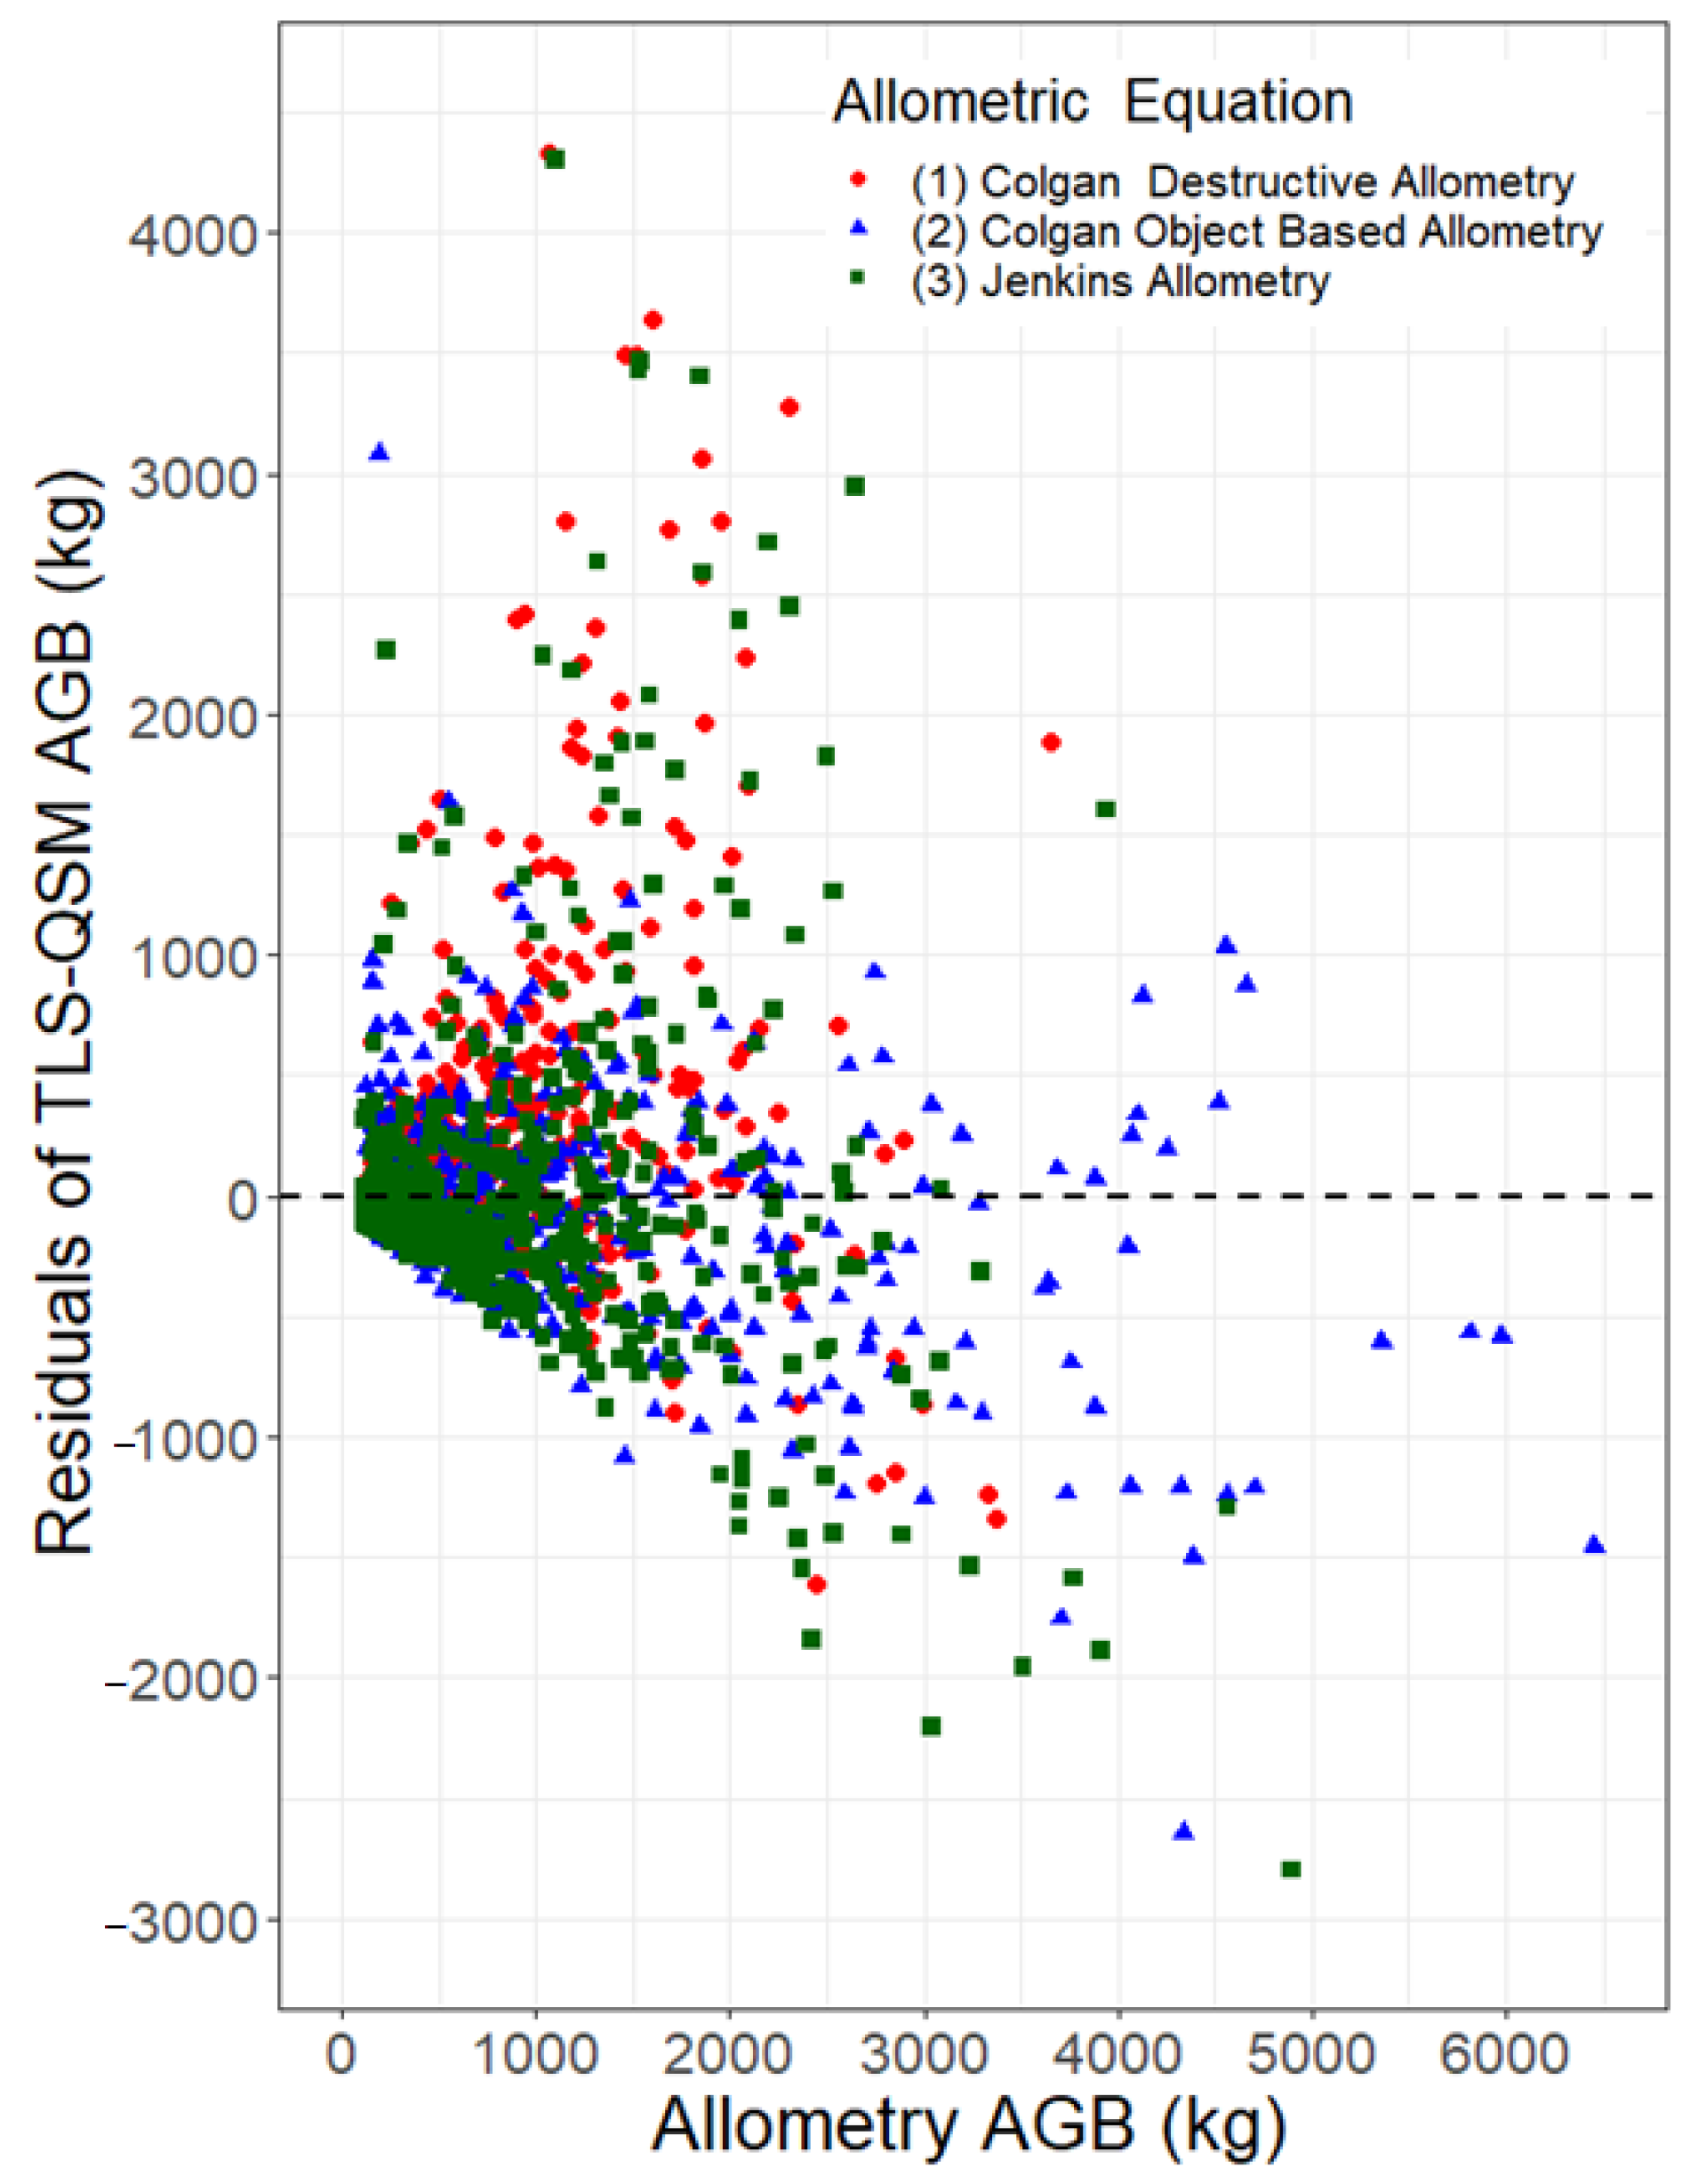
The residuals ranged from −3000 kg to 4500 kg (the distribution of the AGB residuals is shown in Figure 8). The residuals were close to the y = 0 line for small (<1000 kg) AGB trees and as the AGB increased, the residuals deviated from the line. For the large (>2000 kg) AGB trees, the residuals for the Colgan object-based allometry (Equation (2)) showed a smaller deviation from the line y = 0, indicating an agreement between the TLS-QSM derived AGB with this allometry.
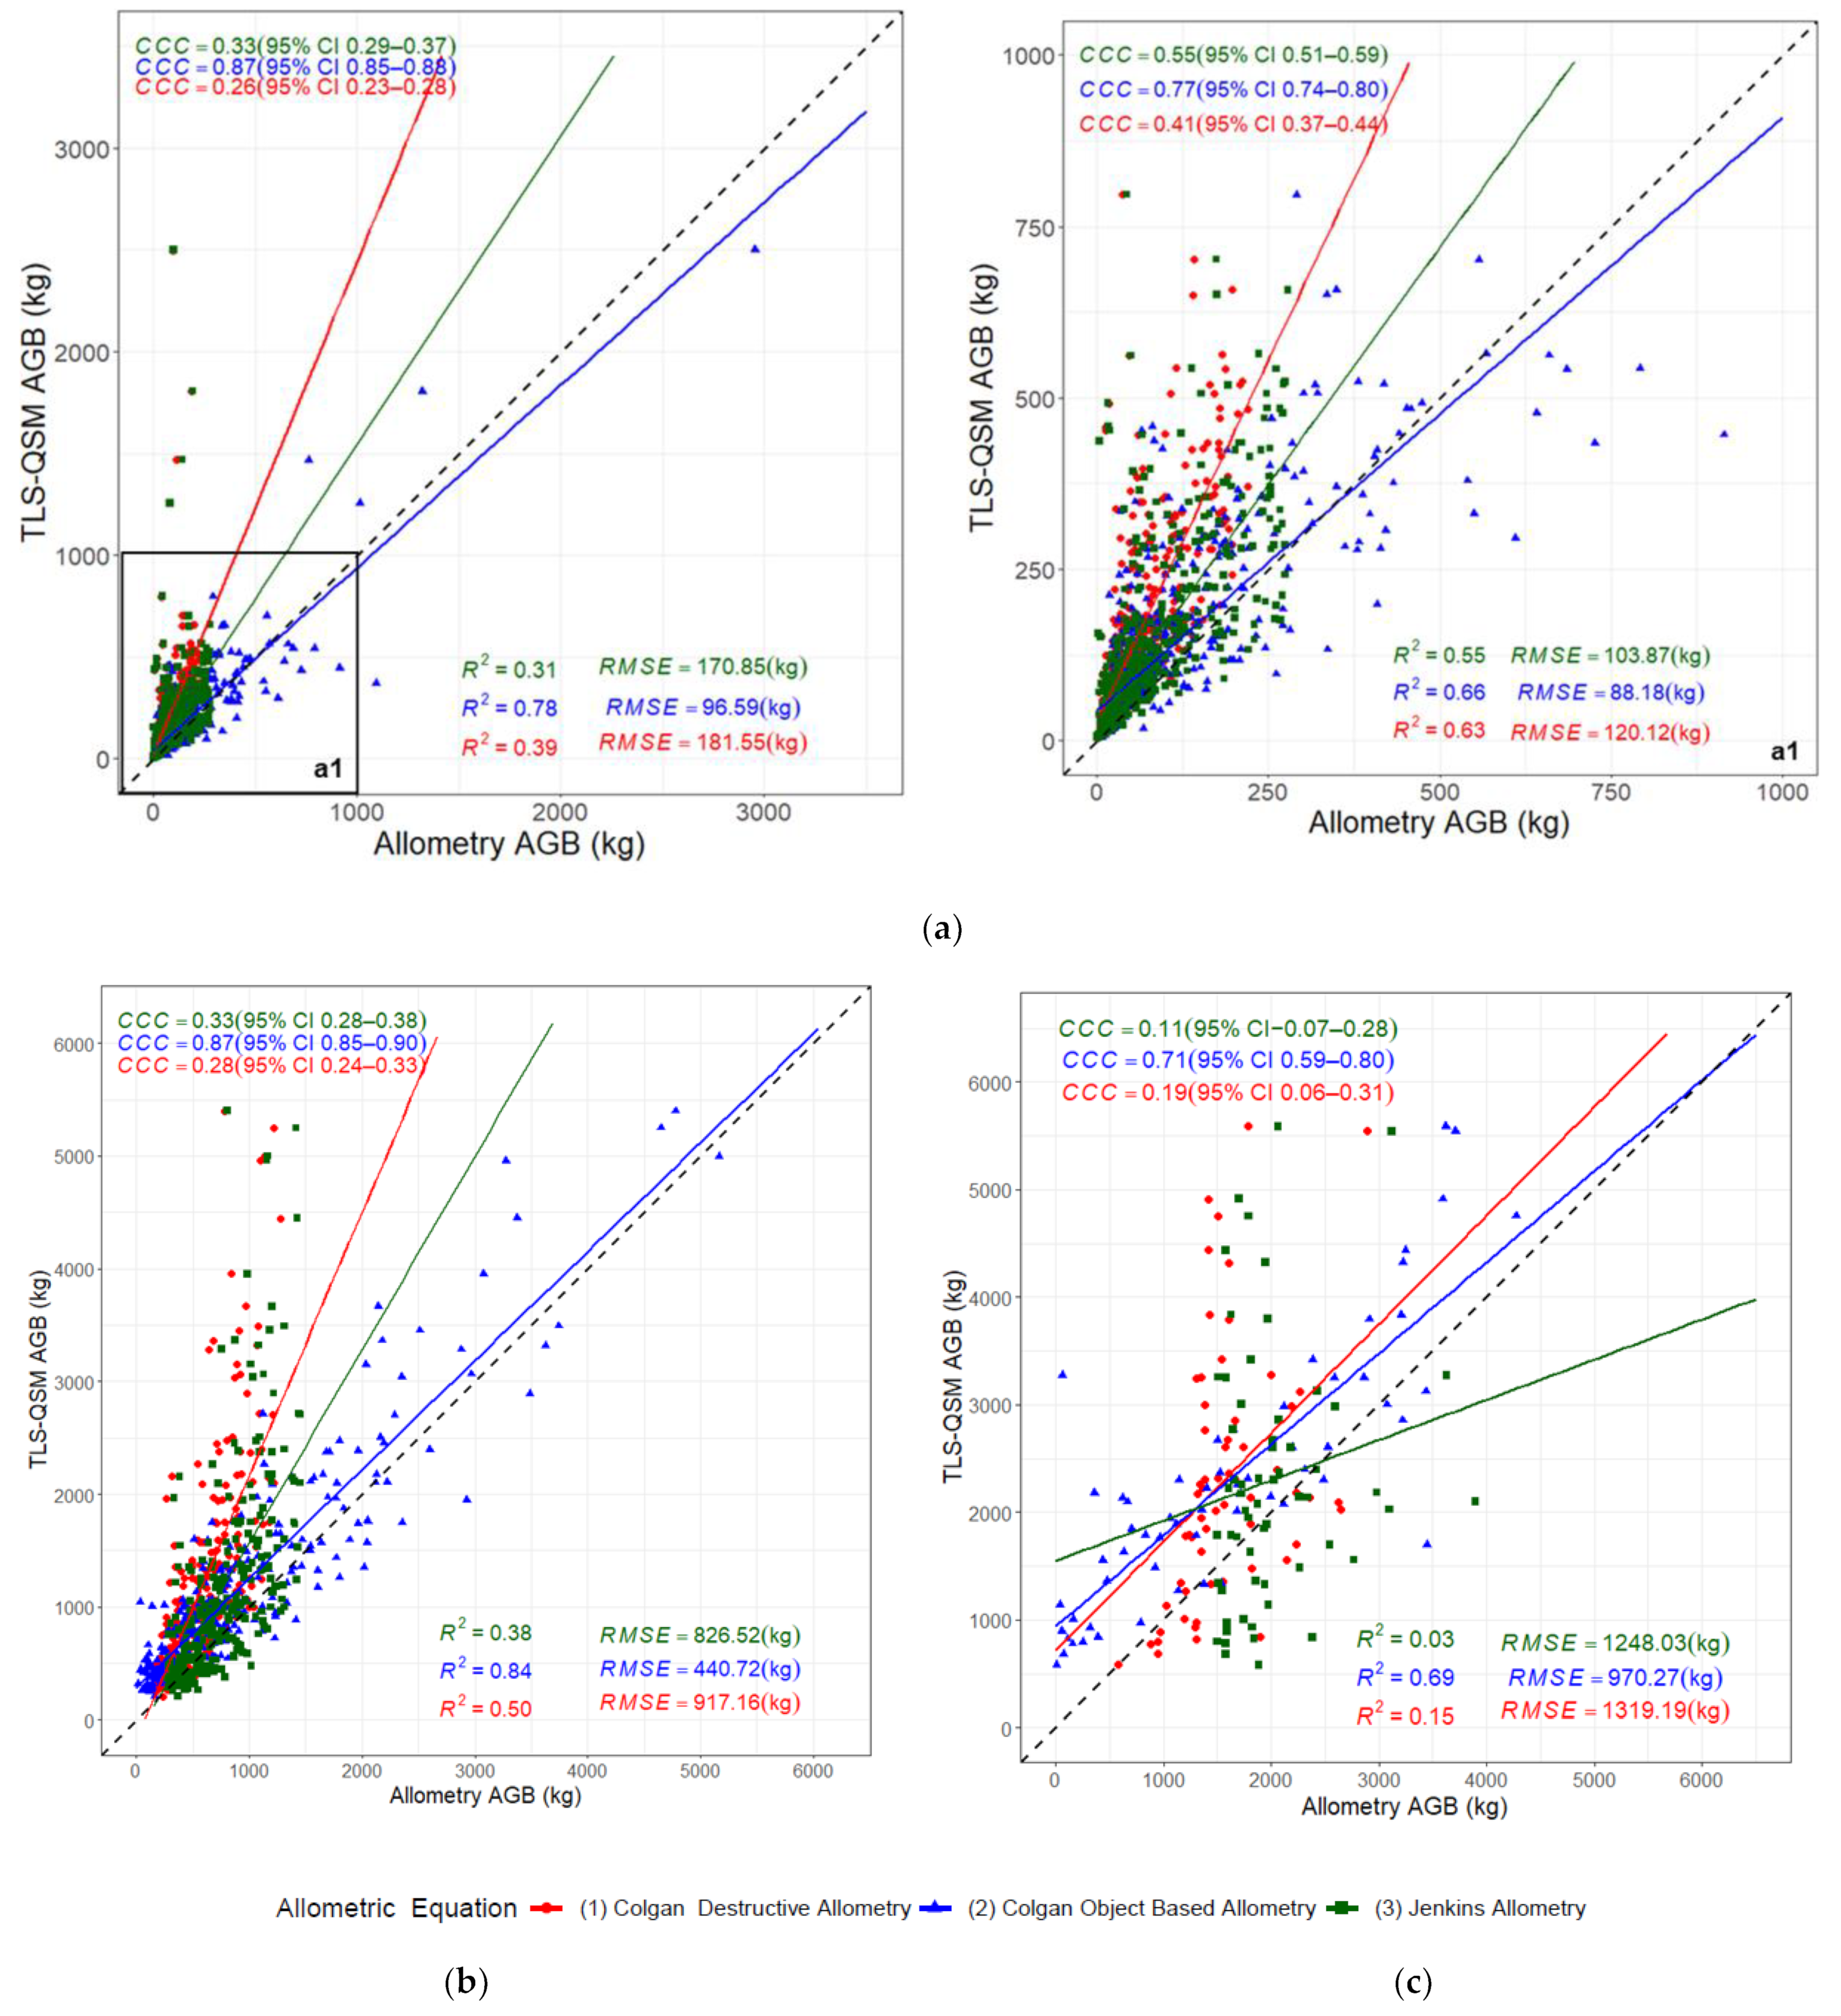
The TLS-QSM-derived AGB was compared to three allometric equations for the three diameter classes to establish the performance of the model for the size classes. The best modelling results were achieved for medium trees (Figure 9b). Colgan object-based allometry (Equation (2)) gave the best results, with an RMSE of 440.72 kg, (mean = 872.2 kg) and a CCC of 0.87 for the medium trees. Jenkins (Equation (3)) and Colgan’s destructive allometry (Equation (1)) did not explain the variability in the estimated biomass, especially for the large trees (Figure 9c), with R2 of 0.03 and 0.15 and CCC of 0.11 and 0.19, respectively. Most of the points fell above the 1:1 line, indicating an underestimation of the AGB by the allometric equations, although most points for the Colgan object-based allometry (Equation (2)) fell below the 1:1 line, indicating an overestimation for the small trees (Figure 9a). For the three size classes, Colgan object-based allometry (Equation (2)) gave the best results.
We analysed the impact of parameter errors on the derived AGB using allometric equations, since the three allometric equations use DBH, height and crown area as parameters. The DBH, tree height and crown area were derived from the QSM approach in this study. The estimated errors for these parameters provided in the literature were 3% for DBH [29], 5% for tree height and 16% for crown area [58]. Crown area had a high error of 16% because ground-based lidar in a relatively high-density stand would not give good estimates of crown area predictions, because the clumped canopy reduces the laser penetration to higher tree levels and thus results in large errors in estimating crown area [58].
We calculated the change in the parameters, given the error margins for each of the 969 reconstructed trees (please refer to Supplementary Materials) and used these values to compute the allometric equation predictions for the AGB. We observed that the predicted biomass for all the three allometric equations was lower than the predicted AGB using the TLS-QSM approach (Table 5), implying that the TLS-QSM approach consistently predicts more AGB as compared to the three allometric equations.
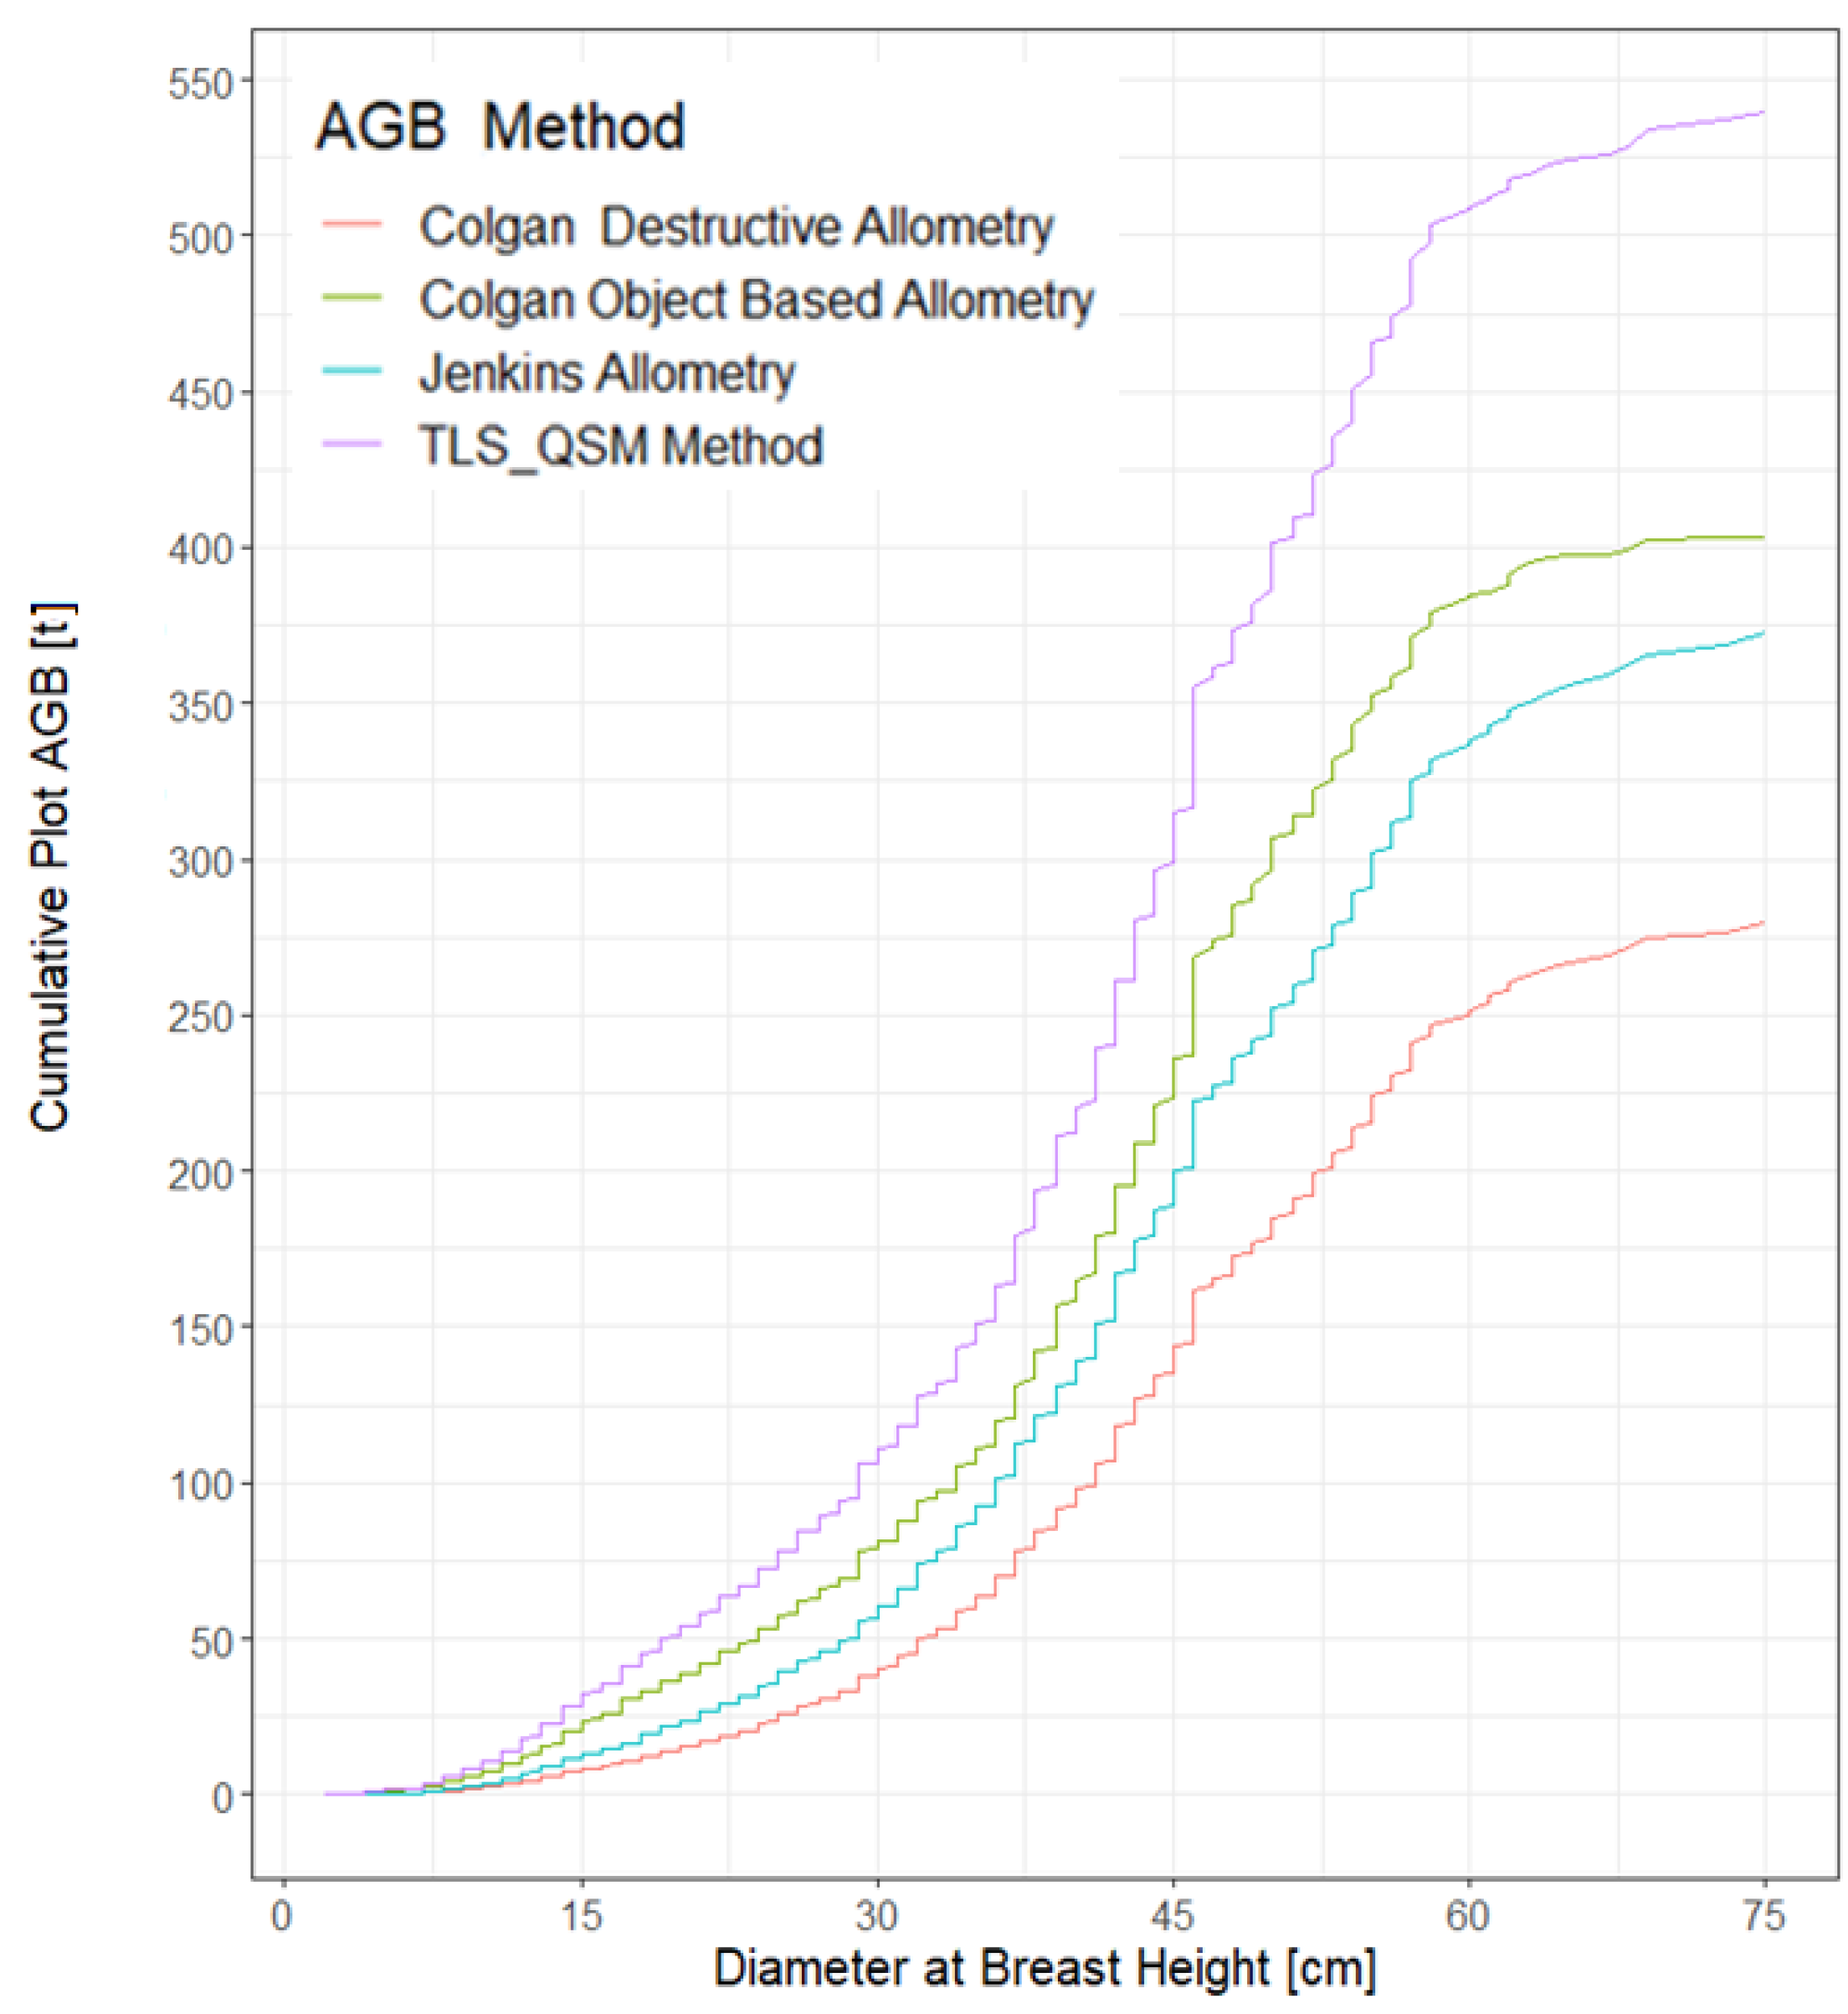
The cumulative plot of AGB derived from the 969 trees using the four different methods is shown in Figure 10. The cumulative biomass using the TLS-QSM method sums up to over 500 t, whilst 400 t, 375 t and 275 t were calculated using Colgan object-based (Equation (2)), Jenkins (Equation (3)) and Colgan destructive (Equation (1)) allometries, respectively. The AGB estimation methods showed a small deviation for the small trees (DBH ≤ 25 cm). However, the deviation started to increase from trees with a DBH of 30–50 cm. The deviation was even greater for trees, with a DBH of >50 cm, and an increasing gap was observed when comparing the TLS-QSM method with the allometric equations.

4. Discussion

4.1. Uncertainty and Limitations of the Approach

The TLS-QSM approach was not validated with destructive biomass estimates because the investigation was conducted in the Kruger National Park, South Africa, a protected conservation area. This induces unknown uncertainty because the AGB calculated using the TLS-QSM method cannot be compared to an actual value since true validation can only be achieved by destructive sampling [23]. Acquiring destructive data is time-consuming, expensive or in this case, not allowed. As a result, to date, very few studies have compared TLS-QSM AGB with destructive estimates [59,60,61]. Demol et al. (2022) [37] reported plot bias of ≤10% from eleven studies that compared TLS-QSM-derived AGB, with destructive data across various scanning conditions, scanner types and reconstruction algorithms with eight of the studies reporting a bias of ≤5% [36,37]. This confirms that the TLS-QSM derived estimates agree with destructive estimates. In that regard, in the absence of destructive data as in this study, TLS seems to be the best non-destructive estimate of individual tree AGB [36].
The QSM approach has an inherent uncertainty in its stochastic behaviour [61] and this means that the QSM is random in model fitting and thus it is carried out multiple times and the derived volume is the mean across several QSMs with an associated uncertainty [23,36].
TLS measurements also bring uncertainty in the modelled volume using QSMs; for example, the quality of the point cloud or movement due to wind when scanning can lead to uncertainty in the modelled volume. In particular, small branches in the crown whose diameters are below 5 cm can be challenging for the TLS-QSM approach, which tends to overestimate the volume modelled in the crown [62,63]. This is because a large laser beam footprint produces uncertain hits that make the branches appear larger in the point cloud than they truly are. A Riegl VZ 1000 used in this study has a beam divergence of 0.35 mrad and an exit diameter of 7 mm, which results in approximately 21 mm beam at 40 m from the scanner. Therefore, we can expect some overestimation of the volume and biomass of smaller branches.
Another source of error is when the QSM-derived volume is converted to biomass using wood density. In this study, we used the mean wood density of 0.9 recommended for common species found in Kruger National Park [10] because no in-situ information was available for the trees in our study area. Wood density varies both within and between species, region and also with height in individual trees [55]. Basic density also varies within the tree according to structure and size because density tends to be lower for smaller DBH and higher for larger DBH [29]. Using species-specific wood density values seems like an option but is also limited due to the tree internal variation of wood density in individual trees [55].
The substitution of basal stem diameter with DBH for the estimation of AGB using Colgan destructive allometry (Equation (1)) affects the estimation accuracy of the AGB derived because basal stem diameters measured at 10 cm above the ground tend to yield larger estimates as compared to measurements conducted at diameter at breast height [64]. However, for comparison purposes, it is recommended to convert all diameter data to a common measurement point [64]. Thus, we used the diameter of the cylinder fitted at 1.3 measured from the point cloud using QSMs.
Field data, such as DBH, tree height, crown area and species information were not collected in this study and thus posses a limitation in our approach. In particular, the variation in species found in the study area would have been critical in the identification of species-specific allometric equations and species-specific wood density values. However, studies conducted in sparse environments have shown that TLS is able to retrieve tree parameters with accuracy [65]. For deriving forest structural metrics, TLS has been discussed as a potential new standard [50] and was confirmed as an ideal data source for forest AGB validation [66]. TLS-based AGB estimation is limited due to the variation in wood density [55] and accurate volume estimation of small branches [37]; however, despite these shortcomings, it is argued that in the absence of direct, destructive measurements, TLS appears to be the best non-destructive estimate for individual tree AGB to date [36]. Demol et al. (2022) [37] also reported a plot bias of ≤10% from eleven studies that compared TLS-QSM-derived AGB with destructive data and this confirms that the TLS-QSM-derived estimates agree with destructive data and, in the absence of destructive data, TLS seems to be the best non-destructive estimate of individual-tree AGB. Also, to add, regarding field measurements, as always the truth may also be misleading and the validity of field measurements should be carefully confirmed [67]. For example, practical difficulties when measuring tree height, crown area and DBH lead to both systematic and random errors in the data derived from field measurements [68,69]. However, Disney et al. (2018) [23] emphasised that the true validation of tree estimates (volume, AGB, and tree and wood components) can be achieved only by destructive sampling.
Individual-tree-based modelling is more valuable because they provide tree structural and demographic information as compared to area plot-based approaches [70]. When scaling up to total biomass at the plot level, the total AGB counting by individual trees gives a better understanding of the sources of error and uncertainty. This is because the errors in individual-tree identification and the extraction of tree parameters is transferred into the AGB estimated at the plot level and results in systematic errors [71]. Thus, the error is propagated as a result of errors from the tree parameter measurements and the errors inherent in the allometric equations [70]. However, AGB estimation from individual trees reduce the bias arising from spatial and temporal heterogeneity, making species-specific biomass estimation possible [72], which is not possible in area-based approaches.

4.2. Terrestrial Laser Scanning and Tree Point Clouds

The trees with the lowest point density exhibited the largest sensitivity (Table 2 and Table 3). These discrepancies can be explained by the difference in point cloud density, noise, tree structure and size (Figure 3). Moreover, the point density decreases and beam size increases with an increase in distance from the scanner [73]. TLSs are limited in representing small objects with an increase in distance from the scanner due to exit diameter and beam divergence [74].
The accuracy of deriving DBH from the point clouds also decreases with point density due to the distance of the tree from the scanner or as a result of occlusions. Calders et al. (2015) [29] highlighted that accurate DBH estimation depends on partial occlusions of the tree stems, which is the case in open savannas. Occlusions mainly stem from understory vegetation and are inherent to the static nature of the TLS when collecting data and cannot be completely removed [67,75]. Comparison of field the measured and TLS derived DBH estimates have been established [65] and errors as less as 3% have been reported. Demol et al. (2022) [24] further emphasized that where destructive measurements are undesirable or impossible (urban and heritage trees, and protected or remote areas), TLS is the only tested alternative to allometric scaling models. However, in this study, we accounted for this error of deriving DBH from TLS by calculating how the error estimate deviates from the best mean estimate (Table 5).

4.3. Comparison of the TLS-QSM Approach with Allometric Equations

Our study evaluated the performance of the TLS-QSM-based vegetation volume approach for the estimation of biomass and demonstrates that the AGB of savanna trees can be estimated using a non-destructive TLS-QSM approach. Optimized QSMs estimate the biomass with reasonable accuracy and show a positive correlation with estimates based on selected allometric equations. The AGB derived through a non-destructive TLS-QSM approach was compared with allometric equations and demonstrates an underestimation of biomass, especially for the large trees by the allometric equations. The Colgan object-based allometry (Equation (2)) gave the best results compared to the TLS-QSM approach (Figure 9), supporting the results by [13,76] who concluded that allometric models that included crown diameter provide more accurate AGB estimates and are especially accurate for large trees (Figure 6 and Figure 8). Colgan et al. (2013) [10] also mention that the object-based allometry gave more accurate predictions of biomass at plot level as compared to field measurements because in open savannas tree height and crown parameters can be estimated accurately with airborne lidar.
TLS has been established as a reference to extract structural information on forests and trees. Several studies have confirmed the accuracy of using the TLS-QSM approach for quantifying AGB [25,31,61]. In all these studies, it was established that the TLS-derived estimates provided better estimates as compared to allometric equations. Kükenbrink et al. (2021) [61] achieved an RMSE of 556 kg when using the TLS-derived method, compared to an RMSE of 1159 kg with species-specific allometric equations. This is in line with results from other studies showing that allometries have a limitation in that they rely on destructive data and large trees are usually underrepresented in the sample [13,17]. In our comparison, the use of Colgan destructive allometry (Equation (1)) provided the largest deviation from the TLS-QSM approach. This might be explained by the observation that large uncertainties in AGB are introduced in allometric equations because of the lack of large trees in the underlying samples [23]. This was also suggested by Chave et al. (2004) [16] and Colgan et al. (2013) [10], who stated that an allometric model can only accurately predict biomass within the range of the largest tree harvested. However, Jenkins allometry (Equation (3)) was developed using a comprehensive sample of large trees (maximum DBH = 230 cm) [56] but its weakness lies in that only DBH is used, resulting in underestimations because the biomass in the tree crown is not accounted for. This also confirms a study by Nickless et al. (2011) [19] which showed that allometric equations always underestimate biomass when compared to destructive estimates.
We successfully showed that the AGB of savanna trees can be modelled accurately with QSMs. This was achieved on 969 trees. The optimized reconstruction of the QSMs and ten repeated model runs showed that our results were robust as shown by the low CoV and sensitivity (Table 2, Table 3 and Table 4), implying better precision and less uncertainty in the modelled volume using the QSM approach.
Our method was successful in the reconstruction of savanna trees, especially those with a high point density. We have shown that volume reconstructions of TLS point clouds are key to improving tree allometries and non-destructively estimate biomass. We have also successfully established the reliability of our method in estimating the AGB of savanna trees by quantifying the sensitivity of the modelled volume.

4.4. Future Outlook

The accurate estimation of AGB is pertinent for the savanna because the estimation of AGB in the savanna still heavily relies on allometric equations, which have several limitations. The shortage of large trees in allometric equations leads to large uncertainties in AGB; thus, the application of TLS counters this limitation by providing estimates across all tree sizes [23].
Using TLS and QSMs, future work should look at the development of species-specific allometric equations for the African savanna. This can be achieved by developing allometric equations based on tree height, crown diameter and DBH, and establishing the tree-specific gravity of the species following the methods of [13,25], which have been successful in tropical forests but have not been tested in open savannas.
The advancement of tree segmentation algorithms [47] makes the process of tree segmentation faster and more accurate to segment large TLS scanned plots. The ability to quantify the sensitivity of the modelled volume using the QSMs allows for fast accurate estimation of AGB, with the aim being eventually to replace allometries with QSMs. However, more research needs to be conducted to determine whether TLS always provides accurate AGB estimates and whether it could actually substitute destructive sampling with time [13].

5. Conclusions

We demonstrate that we can successfully estimate the AGB of savanna trees through the application of TLS point clouds and QSMs. We compared the derived AGB from the TLS-QSM method with three allometric equations. The allometric equation that included crown area as one parameter performed the best. Although we did not have destructive validation data, TLS provides the best non-destructive option to estimate individual-tree AGB without destructive sampling. The use of high-density TLS with QSMs for quantifying AGB has the potential of improving savanna tree allometries by incorporating big samples and large trees. Given the dynamic nature of savanna ecosystems, the employment of multi-temporal TLS scans with QSMs will allow the quantification of structural gains and losses that could arise as a result of fire, drought, herbivory and other abiotic and biotic drivers/disturbances.

Supplementary Materials

The following supporting information can be downloaded at: https://www.mdpi.com/article/10.3390/rs16020399/s1, Workbook S1: Impact of parameter errors on the derived AGB using allometric equations.

Author Contributions

T.P.M.: conceptualization, methodology, data processing and analysis, writing—original draft. J.S.: conceptualization, supervision, reviewing and editing. J.B.: conceptualization, TLS data acquisition and pre-processing, supervision, reviewing and editing. P.R.: methodology, software, reviewing and editing. C.C.: reviewing and editing. C.T.: conceptualization, reviewing and editing. C.S.: conceptualization, supervision. All authors have read and agreed to the published version of the manuscript.

Funding

This study was made possible by funding from the Deutscher Akademischer Austauschdienst: (DAAD) Ref No. SPACES II.2 CaBuDe 57531823 to T.P. Muumbe and the Bundesministerium für Bildung und Forschung (BMBF) through the projects ArsAfrica, South African Land Degradation Monitor (SALDi, Grant No. 01LL1701A, and Ecosystem Management Support for Climate Change in Southern Africa (EMSAfrica, Grant No. 01LL1801D). Fieldwork in Kruger National Park was conducted under the SANParks research permit KNP Erosion, Ref. No. BAAJ1127. We acknowledge support by the German Research Foundation (DFG) Project number- 512648189 and the Open Access Publication Fund of the Thueringer Universitaets- und Landesbibliothek Jena.

Data Availability Statement

The data presented in this study are available on request from the corresponding author ([email protected]). The data are not publicly available due to the study being carried out in a protected area.

Acknowledgments

We acknowledge the support by South African National Parks (SANParks) Scientific Services in Skukuza and Game Guards during fieldwork in the Kruger National Park.

Conflicts of Interest

The authors declare no conflicts of interest.

References

  1. Scholes, R.J.; Archer, S.R. Tree-grass interactions in Savannas. Annu. Rev. Ecol. Syst. 1997, 28, 517–544. [Google Scholar] [CrossRef]
  2. Sankaran, M.; Hanan, N.P.; Scholes, R.J.; Ratnam, J.; Augustine, D.J.; Cade, B.S.; Gignoux, J.; Higgins, S.I.; Le Roux, X.; Ludwig, F.; et al. Determinants of woody cover in African savannas. Nature 2005, 438, 846–849. [Google Scholar] [CrossRef] [PubMed]
  3. Grace, J.; José, J.S.; Meir, P.; Miranda, H.S.; Montes, R.A. Productivity and carbon fluxes of tropical savannas. J. Biogeogr. 2006, 33, 387–400. [Google Scholar] [CrossRef]
  4. Luck, L.; Hutley, L.B.; Calders, K.; Levick, S.R. Exploring the variability of tropical savanna tree structural allometry with terrestrial laser scanning. Remote Sens. 2020, 12, 3893. [Google Scholar] [CrossRef]
  5. Staver, A.C. Prediction and scale in savanna ecosystems. New Phytol. 2018, 219, 52–57. [Google Scholar] [CrossRef] [PubMed]
  6. Zhou, Y.; Bomfim, B.; Bond, W.J.; Boutton, T.W.; Case, M.F.; Coetsee, C.; Davies, A.B.; February, E.C.; Gray, E.F.; Silva, L.C.R.; et al. Soil carbon in tropical savannas mostly derived from grasses. Nat. Geosci. 2023, 16, 710–716. [Google Scholar] [CrossRef]
  7. Drake, J.B.; Knox, R.G.; Dubayah, R.O.; Clark, D.B.; Condit, R.; Blair, J.B.; Hofton, M. Above-ground biomass estimation in closed canopy Neotropical forests using lidar remote sensing: Factors affecting the generality of relationships. Glob. Ecol. Biogeogr. 2003, 12, 147–159. [Google Scholar] [CrossRef]
  8. Colgan, M.S.; Asner, G.P.; Levick, S.R.; Martin, R.E.; Chadwick, O.A. Topo-edaphic controls over woody plant biomass in South African savannas. Biogeosciences 2012, 9, 1809–1821. [Google Scholar] [CrossRef]
  9. Levick, S.R.; Asner, G.P. The rate and spatial pattern of treefall in a savanna landscape. Biol. Conserv. 2013, 157, 121–127. [Google Scholar] [CrossRef]
  10. Colgan, M.S.; Asner, G.P.; Swemmer, T. Harvesting tree biomass at the stand level to assess the accuracy of field and airborne biomass estimation in savannas. Ecol. Appl. 2013, 23, 1170–1184. [Google Scholar] [CrossRef]
  11. Nyamukuru, A.; Whitney, C.; Tabuti, J.R.S.; Esaete, J.; Low, M. Allometric models for aboveground biomass estimation of small trees and shrubs in African savanna ecosystems. Trees For. People 2023, 11, 100377. [Google Scholar] [CrossRef]
  12. Colgan, M.S.; Swemmer, T.; Asner, G.P. Structural relationships between form factor, wood density, and biomass in African savanna woodlands. Trees-Struct. Funct. 2014, 28, 91–102. [Google Scholar] [CrossRef]
  13. Lau, A.; Calders, K.; Bartholomeus, H.; Martius, C.; Raumonen, P.; Herold, M.; Vicari, M.; Sukhdeo, H.; Singh, J.; Goodman, R.C. Tree biomass equations from terrestrial LiDAR: A case study in Guyana. Forests 2019, 10, 527. [Google Scholar] [CrossRef]
  14. Jucker, T.; Caspersen, J.; Chave, J.; Antin, C.; Barbier, N.; Bongers, F.; Dalponte, M.; van Ewijk, K.Y.; Forrester, D.I.; Haeni, M.; et al. Allometric equations for integrating remote sensing imagery into forest monitoring programmes. Glob. Chang. Biol. 2017, 23, 177–190. [Google Scholar] [CrossRef] [PubMed]
  15. Williams, R.J.; Zerihun, A.; Montagu, K.D.; Hoffman, M.; Hutley, L.B.; Chen, X. Allometry for estimating aboveground tree biomass in tropical and subtropical eucalypt woodlands: Towards general predictive equations. Aust. J. Bot. 2005, 53, 607–619. [Google Scholar] [CrossRef]
  16. Chave, J.; Condit, R.; Aguilar, S.; Hernandez, A.; Lao, S.; Perez, R. Error propagation and sealing for tropical forest biomass estimates. Philos. Trans. R. Soc. B Biol. Sci. 2004, 359, 409–420. [Google Scholar] [CrossRef] [PubMed]
  17. Disney, M.; Burt, A.; Wilkes, P.; Armston, J.; Duncanson, L. New 3D measurements of large redwood trees for biomass and structure. Sci. Rep. 2020, 10, 16721. [Google Scholar] [CrossRef]
  18. Djomo, A.N.; Ibrahima, A.; Saborowski, J.; Gravenhorst, G. Allometric equations for biomass estimations in Cameroon and pan moist tropical equations including biomass data from Africa. For. Ecol. Manag. 2010, 260, 1873–1885. [Google Scholar] [CrossRef]
  19. Nickless, A.; Scholes, R.J.; Archibald, S. A method for calculating the variance and confidence intervals for tree biomass estimates obtained from allometric equations. S. Afr. J. Sci. 2011, 107, 1–10. [Google Scholar] [CrossRef]
  20. Stephenson, N.L.; Das, A.J.; Condit, R.; Russo, S.E.; Baker, P.J.; Beckman, N.G.; Coomes, D.A.; Lines, E.R.; Morris, W.K.; Rüger, N.; et al. Rate of tree carbon accumulation increases continuously with tree size. Nature 2014, 507, 90–93. [Google Scholar] [CrossRef]
  21. Liang, X.; Kankare, V.; Hyyppä, J.; Wang, Y.; Kukko, A.; Haggrén, H.; Yu, X.; Kaartinen, H.; Jaakkola, A.; Guan, F.; et al. Terrestrial laser scanning in forest inventories. ISPRS J. Photogramm. Remote Sens. 2016, 115, 63–77. [Google Scholar] [CrossRef]
  22. Calders, K.; Adams, J.; Armston, J.; Bartholomeus, H.; Bauwens, S.; Bentley, L.P.; Chave, J.; Danson, F.M.; Demol, M.; Disney, M.; et al. Terrestrial laser scanning in forest ecology: Expanding the horizon. Remote Sens. Environ. 2020, 251, 112102. [Google Scholar] [CrossRef]
  23. Disney, M.I.; Boni Vicari, M.; Burt, A.; Calders, K.; Lewis, S.L.; Raumonen, P.; Wilkes, P. Weighing trees with lasers: Advances, challenges and opportunities. Interface Focus 2018, 8, 20170048. [Google Scholar] [CrossRef]
  24. Demol, M.; Verbeeck, H.; Gielen, B.; Armston, J.; Burt, A.; Disney, M.; Duncanson, L.; Hackenberg, J.; Kükenbrink, D.; Lau, A.; et al. Estimating forest above-ground biomass with terrestrial laser scanning: Current status and future directions. Methods Ecol. Evol. 2022, 13, 1628–1639. [Google Scholar] [CrossRef]
  25. Momo Takoudjou, S.; Ploton, P.; Sonké, B.; Hackenberg, J.; Griffon, S.; de Coligny, F.; Kamdem, N.G.; Libalah, M.; Mofack, G.; Le Moguédec, G.; et al. Using terrestrial laser scanning data to estimate large tropical trees biomass and calibrate allometric models: A comparison with traditional destructive approach. Methods Ecol. Evol. 2018, 9, 905–916. [Google Scholar] [CrossRef]
  26. Dassot, M.; Constant, T.; Fournier, M. The use of terrestrial LiDAR technology in forest science: Application fields, benefits and challenges. Ann. For. Sci. 2011, 68, 959–974. [Google Scholar] [CrossRef]
  27. Liang, X.; Hyyppä, J.; Kaartinen, H.; Holopainen, M.; Melkas, T. Detecting changes in forest structure over time with bi-temporal terrestrial laser scanning data. ISPRS Int. J. Geo-Inf. 2012, 1, 242. [Google Scholar] [CrossRef]
  28. Sheppard, J.; Morhart, C.; Hackenberg, J.; Spiecker, H. Terrestrial laser scanning as a tool for assessing tree growth. IForest 2017, 10, 172–179. [Google Scholar] [CrossRef]
  29. Calders, K.; Newnham, G.; Burt, A.; Murphy, S.; Raumonen, P.; Herold, M.; Culvenor, D.; Avitabile, V.; Disney, M.; Armston, J.; et al. Nondestructive estimates of above-ground biomass using terrestrial laser scanning. Methods Ecol. Evol. 2015, 6, 198–208. [Google Scholar] [CrossRef]
  30. Chen, S.; Feng, Z.; Chen, P.; Khan, T.U.; Lian, Y. Nondestructive estimation of the above-ground biomass of multiple tree species in boreal forests of china using terrestrial laser scanning. Forests 2019, 10, 936. [Google Scholar] [CrossRef]
  31. Gonzalez de Tanago, J.; Lau, A.; Bartholomeus, H.; Herold, M.; Avitabile, V.; Raumonen, P.; Martius, C.; Goodman, R.C.; Disney, M.; Manuri, S.; et al. Estimation of above-ground biomass of large tropical trees with terrestrial LiDAR. Methods Ecol. Evol. 2018, 9, 223–234. [Google Scholar] [CrossRef]
  32. Srinivasan, S.; Popescu, S.C.; Eriksson, M.; Sheridan, R.D.; Ku, N.W. Multi-temporal terrestrial laser scanning for modeling tree biomass change. For. Ecol. Manag. 2014, 318, 304–317. [Google Scholar] [CrossRef]
  33. Olivier, M.D.; Robert, S.; Richard, A.F. A method to quantify canopy changes using multi-temporal terrestrial lidar data: Tree response to surrounding gaps. Agric. For. Meteorol. 2017, 237–238, 184–195. [Google Scholar] [CrossRef]
  34. Qi, Y.; Coops, N.C.; Daniels, L.D.; Butson, C.R. Comparing tree attributes derived from quantitative structure models based on drone and mobile laser scanning point clouds across varying canopy cover conditions. ISPRS J. Photogramm. Remote Sens. 2022, 192, 49–65. [Google Scholar] [CrossRef]
  35. Luck, L.; Kaestli, M.; Hutley, L.B.; Calders, K.; Levick, S.R. Reduced model complexity for efficient characterisation of savanna woodland structure using terrestrial laser scanning. Int. J. Appl. Earth Obs. Geoinf. 2023, 118, 103255. [Google Scholar] [CrossRef]
  36. Brede, B.; Terryn, L.; Barbier, N.; Bartholomeus, H.M.; Bartolo, R.; Calders, K.; Derroire, G.; Krishna Moorthy, S.M.; Lau, A.; Levick, S.R.; et al. Non-destructive estimation of individual tree biomass: Allometric models, terrestrial and UAV laser scanning. Remote Sens. Environ. 2022, 280, 113180. [Google Scholar] [CrossRef]
  37. Demol, M.; Wilkes, P.; Raumonen, P.; Moorthy, S.M.K.; Calders, K.; Gielen, B.; Verbeeck, H. Volumetric overestimation of small branches in 3D reconstructions of Fraxinus excelsior. Silva Fenn. 2022, 56, 10550. [Google Scholar] [CrossRef]
  38. Zimbres, B.; Shimbo, J.; Bustamante, M.; Levick, S.; Miranda, S.; Roitman, I.; Silvério, D.; Gomes, L.; Fagg, C.; Alencar, A. Savanna vegetation structure in the Brazilian Cerrado allows for the accurate estimation of aboveground biomass using terrestrial laser scanning. For. Ecol. Manag. 2020, 458, 117798. [Google Scholar] [CrossRef]
  39. Muumbe, T.P.; Baade, J.; Singh, J.; Schmullius, C.; Thau, C. Terrestrial laser scanning for vegetation analyses with a special focus on savannas. Remote Sens. 2021, 13, 507. [Google Scholar] [CrossRef]
  40. Scholes, R.J.; Gureja, N.; Giannecchinni, M.; Dovie, D.; Wilson, B.; Davidson, N.; Piggott, K.; McLoughlin, C.; Van der Velde, K.; Freeman, A.; et al. The environment and vegetation of the flux measurement site near Skukuza, Kruger National Park. Koedoe 2001, 44, 73–84. [Google Scholar] [CrossRef]
  41. MacFadyen, S.; Zambatis, N.; Van Teeffelen, A.J.A.; Hui, C. Long-term rainfall regression surfaces for the Kruger National Park, South Africa: A spatio-temporal review of patterns from 1981 to 2015. Int. J. Climatol. 2018, 38, 2506–2519. [Google Scholar] [CrossRef]
  42. Kyalangalilwa, B.; Boatwright, J.S.; Daru, B.H.; Maurin, O.; van der Bank, M. Phylogenetic position and revised classification of Acacia s.l. (Fabaceae: Mimosoideae) in Africa, including new combinations in Vachellia and Senegalia. Bot. J. Linn. Soc. 2013, 172, 500–523. [Google Scholar] [CrossRef]
  43. Dyer, C. New names for the African Acacia species in Vachellia and Senegalia. South. For. 2014, 76, iii. [Google Scholar] [CrossRef]
  44. Heckel, K.; Urban, M.; Bouffard, J.-S.; Baade, J.; Boucher, P.; Davies, A.; Hockridge, E.G.; Lück, W.; Ziemer, J.; Smit, I.; et al. Sub-Meter Resolution Digital Elevation Models and Orthomosaics of the Kruger National Park, South Africa, v1.0, September–October 2018. NERC EDS Centre for Environmental Data Analysis, 28 September 2021. Available online: https://catalogue.ceda.ac.uk/uuid/deab4235f1ef4cd79b73d0cbf2655bd7 (accessed on 15 December 2023).
  45. RIEGL Laser Measurements Systems. RIEGL VZ-1000 High-Resolution and Accurate 3D Measurements. Data Sheet. 2017, pp. 1–4. Available online: http://www.riegl.com/uploads/tx_pxpriegldownloads/DataSheet_VZ-1000_2017-06-14.pdf (accessed on 15 December 2023).
  46. Calders, K.; Wilkes, P.; Disney, M.I.; Armston, J.; Schaefer, M.; Woodgate, W. Terrestrial LiDAR for measuring above-ground biomass and forest structure. In Effective Field Calibration and Validation Practices; TERN: Indooroopilly, QLD, Australia, 2018. [Google Scholar]
  47. Tao, S.; Wu, F.; Guo, Q.; Wang, Y.; Li, W.; Xue, B.; Hu, X.; Li, P.; Tian, D.; Li, C.; et al. Segmenting tree crowns from terrestrial and mobile LiDAR data by exploring ecological theories. ISPRS J. Photogramm. Remote Sens. 2015, 110, 66–76. [Google Scholar] [CrossRef]
  48. Zhao, X.; Guo, Q.; Su, Y.; Xue, B. Improved progressive TIN densification filtering algorithm for airborne LiDAR data in forested areas. ISPRS J. Photogramm. Remote Sens. 2016, 117, 79–91. [Google Scholar] [CrossRef]
  49. Fan, G.; Nan, L.; Chen, F.; Dong, Y.; Wang, Z.; Li, H.; Chen, D. A new quantitative approach to tree attributes estimation based on LiDAR point clouds. Remote Sens. 2020, 12, 1779. [Google Scholar] [CrossRef]
  50. Levick, S.R.; Whiteside, T.; Loewensteiner, D.A.; Rudge, M.; Bartolo, R. Leveraging tls as a calibration and validation tool for mls and uls mapping of savanna structure and biomass at landscape-scales. Remote Sens. 2021, 13, 257. [Google Scholar] [CrossRef]
  51. Dong, Y.; Fan, G.; Zhou, Z.; Liu, J.; Wang, Y.; Chen, F. Low cost automatic reconstruction of tree structure by adqsm with terrestrial close-range photogrammetry. Forests 2021, 12, 1020. [Google Scholar] [CrossRef]
  52. Girardeau-Montaut, D. CloudCompare. Paris, France. 2022. Available online: https://github.com/CloudCompare (accessed on 15 December 2023).
  53. Raumonen, P.; Kaasalainen, M.; Åkerblom, M.; Kaasalainen, S.; Kaartinen, H.; Vastaranta, M.; Holopainen, M.; Disney, M.; Lewis, P.; Markku, Å.; et al. Fast Automatic Precision Tree Models from Terrestrial Laser Scanner Data. Remote Sens. 2013, 5, 491–520. [Google Scholar] [CrossRef]
  54. Reckziegel, R.B.; Larysch, E.; Sheppard, J.P.; Kahle, H.P.; Morhart, C. Modelling and comparing shading effects of 3D tree structures with virtual leaves. Remote Sens. 2021, 13, 532. [Google Scholar] [CrossRef]
  55. Demol, M.; Calders, K.; Krishna Moorthy, S.M.; Van den Bulcke, J.; Verbeeck, H.; Gielen, B. Consequences of vertical basic wood density variation on the estimation of aboveground biomass with terrestrial laser scanning. Trees-Struct. Funct. 2021, 35, 671–684. [Google Scholar] [CrossRef]
  56. Jenkins, J.C.; Chojnacky, D.C.; Heath, L.S.; Birdsey, R.A. National-scale biomass estimators for United States tree species. For. Sci. 2003, 49, 12–35. [Google Scholar]
  57. Lin, L.I. A Concordance Correlation Coefficient to Evaluate Reproducibility. Biomatrics 1989, 45, 255–268. Available online: https://www.jstor.org/stable/2532051 (accessed on 15 December 2023). [CrossRef]
  58. Fekry, R.; Yao, W.; Cao, L.; Shen, X. Ground-based/UAV-LiDAR data fusion for quantitative structure modeling and tree parameter retrieval in subtropical planted forest. For. Ecosyst. 2022, 9, 100065. [Google Scholar] [CrossRef]
  59. Hackenberg, J.; Wassenberg, M.; Spiecker, H.; Sun, D. Non Destructive Method for Biomass Prediction Combining TLS Derived Tree Volume and Wood Density. Forests 2015, 6, 1274–1300. [Google Scholar] [CrossRef]
  60. Burt, A.; Boni Vicari, M.; Da Costa, A.C.L.; Coughlin, I.; Meir, P.; Rowland, L.; Disney, M. New insights into large tropical tree mass and structure from direct harvest and terrestrial lidar. R. Soc. Open Sci. 2021, 8, 201458. [Google Scholar] [CrossRef]
  61. Kükenbrink, D.; Gardi, O.; Morsdorf, F.; Thürig, E.; Schellenberger, A.; Mathys, L. Above-ground biomass references for urban trees from terrestrial laser scanning data. Ann. Bot. 2021, 128, 709–724. [Google Scholar] [CrossRef] [PubMed]
  62. Wilkes, P.; Shenkin, A.; Disney, M.; Malhi, Y.; Patrick Bentley, L.; Boni Vicari, M. Terrestrial laser scanning to reconstruct branch architecture from harvested branches. Methods Ecol. Evol. 2021, 12, 2487–2500. [Google Scholar] [CrossRef]
  63. Abegg, M.; Bösch, R.; Kükenbrink, D.; Morsdorf, F. Tree volume estimation with terrestrial laser scanning—Testing for bias in a 3D virtual environment. Agric. For. Meteorol. 2023, 331, 109348. [Google Scholar] [CrossRef]
  64. Chojnacky, D.C.; Rogers, P. Converting tree diameter measured at root collar to diameter at breast height. West. J. Appl. For. 1999, 14, 14–16. [Google Scholar] [CrossRef]
  65. Bogdanovich, E.; Perez-Priego, O.; El-Madany, T.S.; Guderle, M.; Pacheco-Labrador, J.; Levick, S.R.; Moreno, G.; Carrara, A.; Pilar Martín, M.; Migliavacca, M. Using terrestrial laser scanning for characterizing tree structural parameters and their changes under different management in a Mediterranean open woodland. For. Ecol. Manag. 2021, 486, 118945. [Google Scholar] [CrossRef]
  66. Duncanson, L.; Armston, J.; Disney, M.; Avitabile, V.; Barbier, N.; Calders, K.; Carter, S.; Chave, J.; Herold, M.; Crowther, T.W.; et al. The Importance of Consistent Global Forest Aboveground Biomass Product Validation. Surv. Geophys. 2019, 40, 979–999. [Google Scholar] [CrossRef] [PubMed]
  67. Pitkänen, T.P.; Raumonen, P.; Liang, X.; Lehtomäki, M.; Kangas, A. Improving TLS-based stem volume estimates by field measurements. Comput. Electron. Agric. 2021, 180, 105882. [Google Scholar] [CrossRef]
  68. Wang, Y.; Pyörälä, J.; Liang, X.; Lehtomäki, M.; Kukko, A.; Yu, X.; Kaartinen, H.; Hyyppä, J. In situ biomass estimation at tree and plot levels: What did data record and what did algorithms derive from terrestrial and aerial point clouds in boreal forest. Remote Sens. Environ. 2019, 232, 111309. [Google Scholar] [CrossRef]
  69. Bragg, D.C. Accurately measuring the height of (real) forest trees. J. For. 2014, 112, 51–54. [Google Scholar] [CrossRef]
  70. Campbell, M.J.; Eastburn, J.F.; Mistick, K.A.; Smith, A.M.; Stovall, A.E.L. Mapping individual tree and plot-level biomass using airborne and mobile lidar in piñon-juniper woodlands. Int. J. Appl. Earth Obs. Geoinf. 2023, 118, 103232. [Google Scholar] [CrossRef]
  71. Cao, L.; Gao, S.; Li, P.; Yun, T.; Shen, X.; Ruan, H. Aboveground biomass estimation of individual trees in a coastal planted forest using full-waveform airborne laser scanning data. Remote Sens. 2016, 8, 729. [Google Scholar] [CrossRef]
  72. Xu, D.; Wang, H.; Xu, W.; Luan, Z.; Xu, X. LiDAR applications to estimate forest biomass at individual tree scale: Opportunities, challenges and future perspectives. Forests 2021, 12, 550. [Google Scholar] [CrossRef]
  73. Wilkes, P.; Lau, A.; Disney, M.; Calders, K.; Burt, A.; Gonzalez de Tanago, J.; Bartholomeus, H.; Brede, B.; Herold, M. Data acquisition considerations for Terrestrial Laser Scanning of forest plots. Remote Sens. Environ. 2017, 196, 140–153. [Google Scholar] [CrossRef]
  74. Abegg, M.; Boesch, R.; Schaepman, M.E.; Morsdorf, F. Impact of Beam Diameter and Scanning Approach on Point Cloud Quality of Terrestrial Laser Scanning in Forests. IEEE Trans. Geosci. Remote Sens. 2021, 59, 8153–8167. [Google Scholar] [CrossRef]
  75. Bazezew, M.N.; Hussin, Y.A.; Kloosterman, E.H. Integrating Airborne LiDAR and Terrestrial Laser Scanner forest parameters for accurate above-ground biomass/carbon estimation in Ayer Hitam tropical forest, Malaysia. Int. J. Appl. Earth Obs. Geoinf. 2018, 73, 638–652. [Google Scholar] [CrossRef]
  76. Kuyah, S.; Muthuri, C.; Jamnadass, R.; Mwangi, P.; Neufeldt, H.; Dietz, J. Crown area allometries for estimation of aboveground tree biomass in agricultural landscapes of western Kenya. Agrofor. Syst. 2012, 86, 267–277. [Google Scholar] [CrossRef]
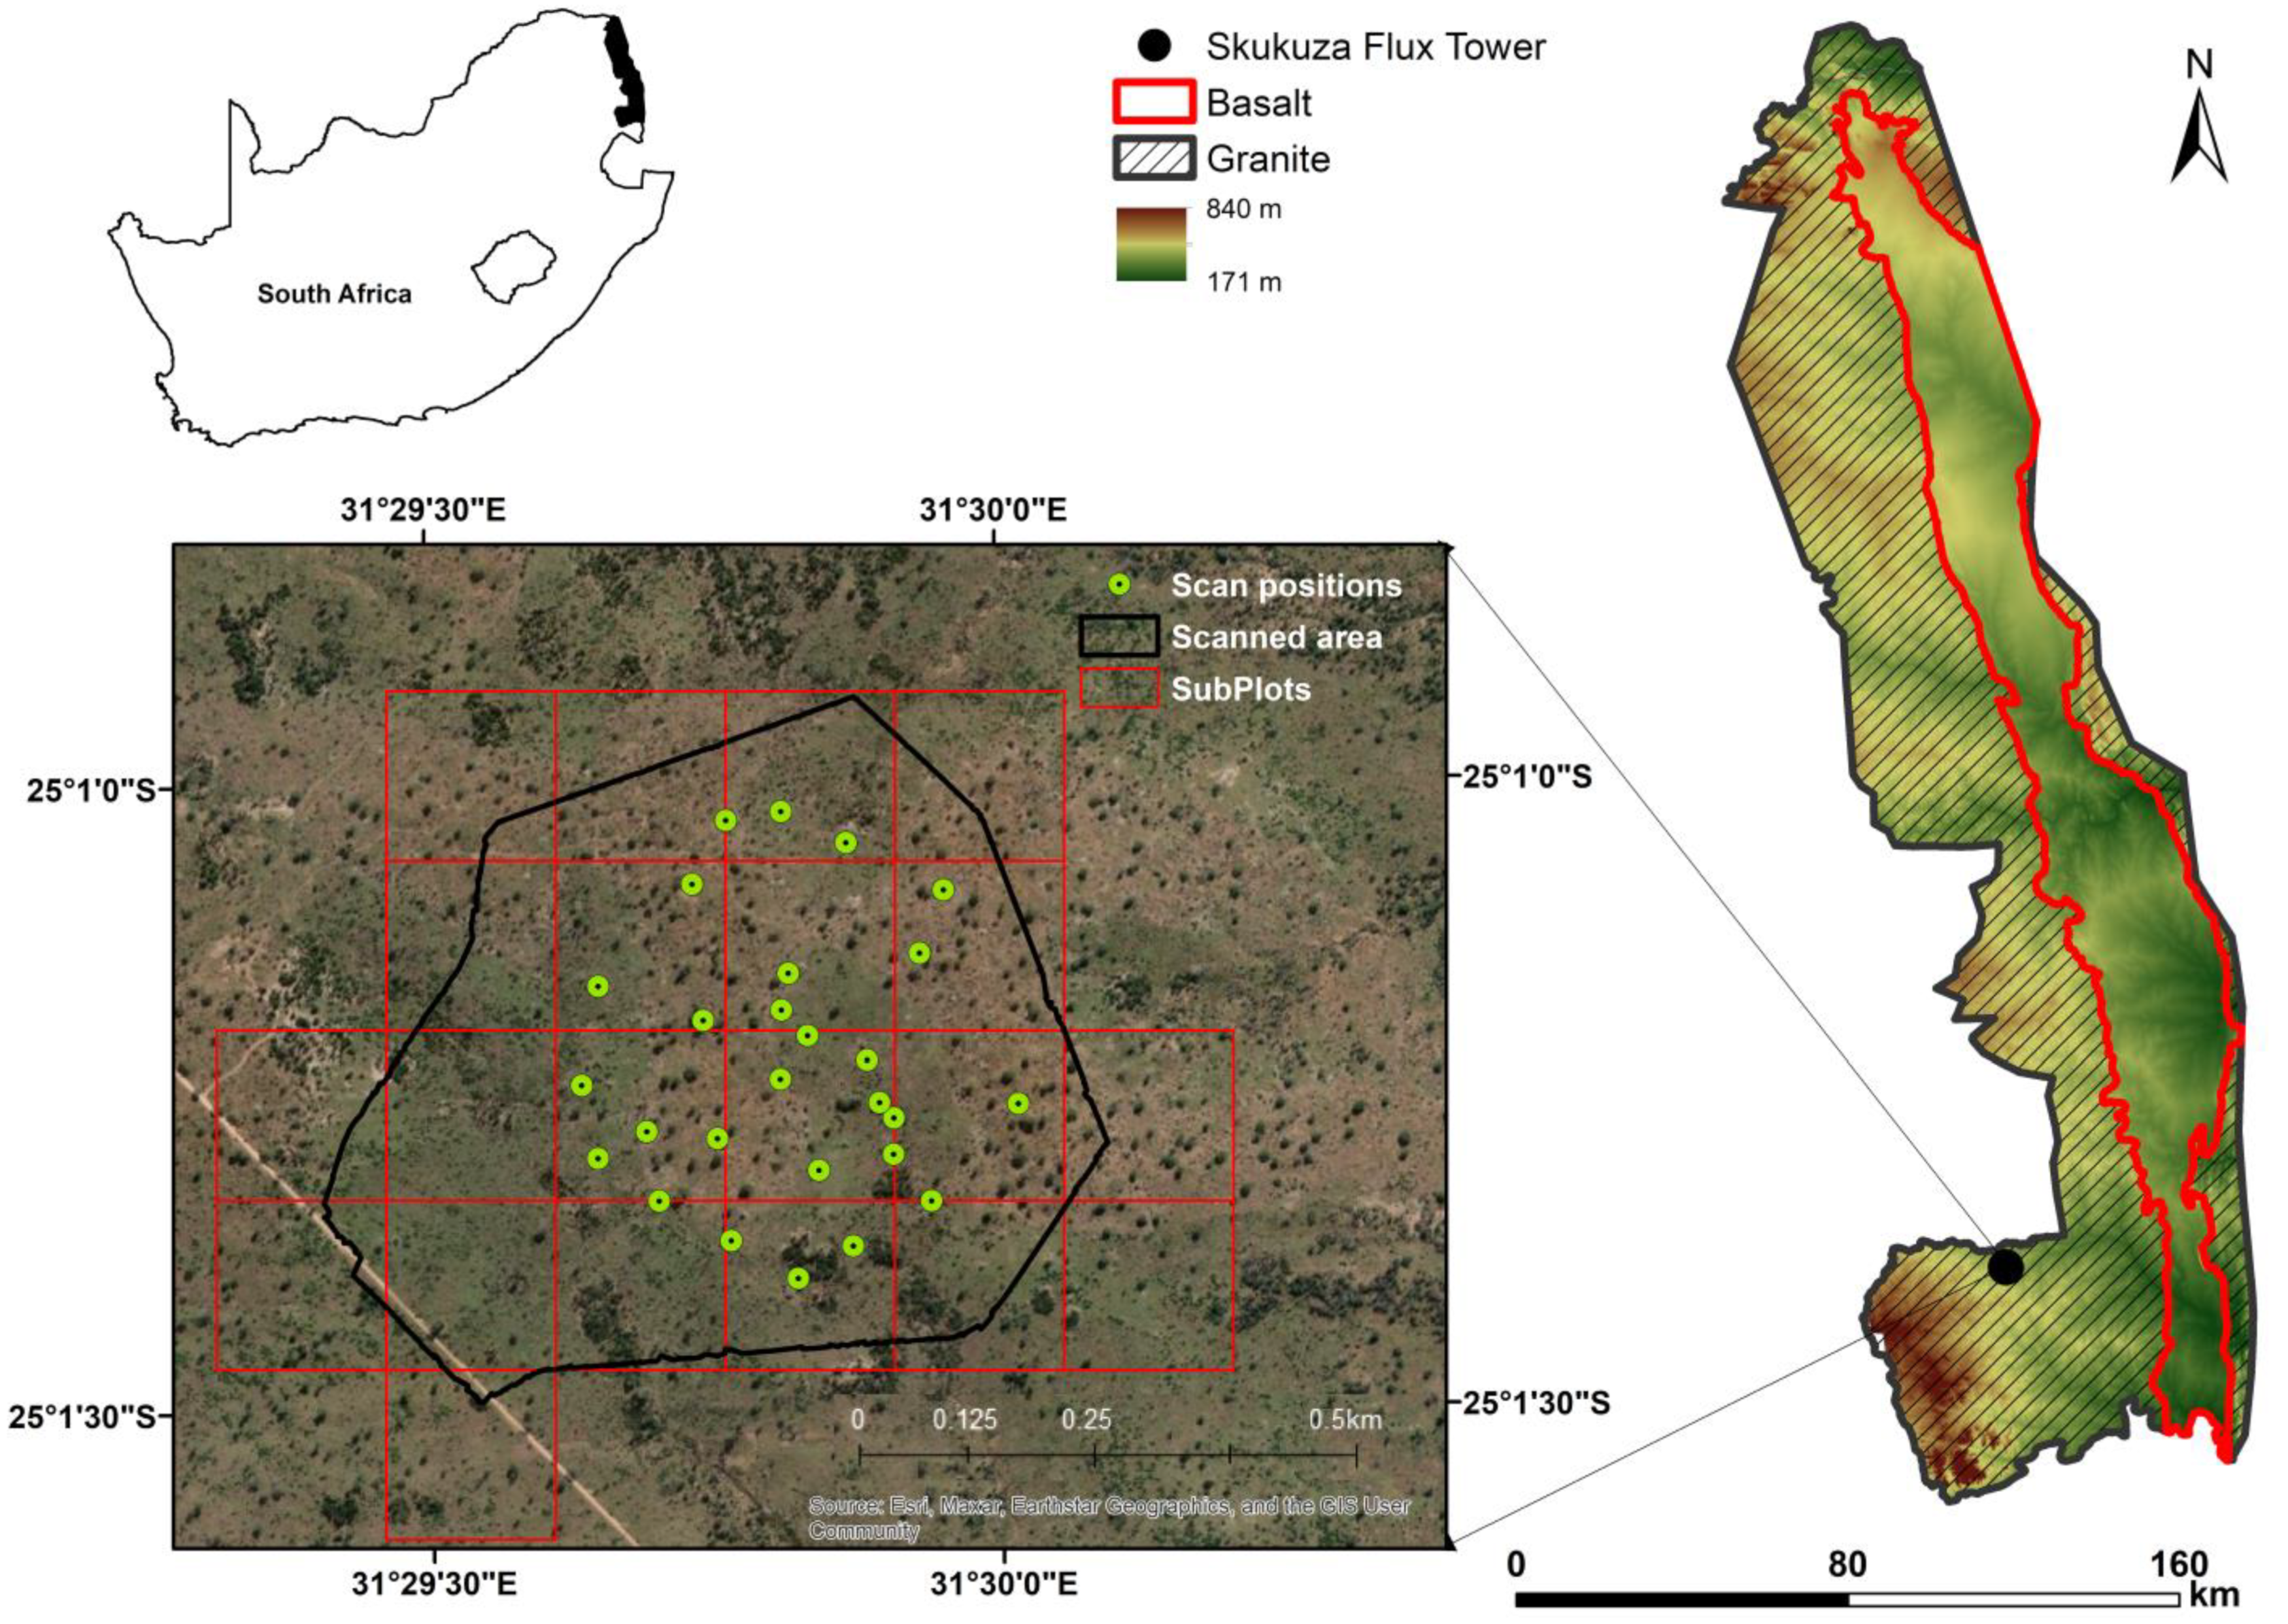
Figure 1. Study area in the Lowveld of NE South Africa. Lidar data collected in September 2015 by Jussi Baade; elevation data from Heckel et al. (2021) [44], Copyright provided under Creative Commons BY 4.0; https://creativecommons.org/licenses/by/4.0/ (accessed on 15 December 2023); GIS data from SANParks Data Repository.
Remotesensing 16 00399 g001
Figure 2. Detailed workflow for the processing of TLS point cloud data.
Remotesensing 16 00399 g002
Figure 3. Examples of different point clouds and the resulting QSMs. Tree 788: 448.93 points/m2 (a); Tree 784: 452.51 points/m2 (b) Tree 875: 2140.94 points/m2 (c). On the QSM models, blue represents the stem, green represents the 1st order branches, red represents 2nd order branches, etc.
Remotesensing 16 00399 g003
Figure 4. Statistical relationships: (a) DBH and Crown Area; (b) DBH and Tree Height.
Remotesensing 16 00399 g004
Figure 5. TLS-QSM derived AGB as a function of (a) DBH, (b) tree height and (c) crown area.
Remotesensing 16 00399 g005
Figure 6. Comparison of the TLS-QSM-derived AGB with AGB estimates from three allometric equations for 969 reconstructed trees.
Remotesensing 16 00399 g006
Figure 7. Aboveground biomass per DBH class for the four biomass methods.
Remotesensing 16 00399 g007
Figure 8. Residuals of tree AGB from 969 reconstructed trees showing less deviation of the large AGB trees from the y = 0 line for Colgan Object-Based Allometry (Equation (2)).
Remotesensing 16 00399 g008
Figure 9. Comparison of the TLS-QSM derived AGB with AGB estimates from three allometric equations for different size classes: (a) small trees (DBH ≤ 25 cm) (left—all small trees, right—square a1 enlarged showing trees with an AGB of 1000 kg); (b) medium Trees (25 cm < DBH ≤ 50 cm); and (c) large trees (DBH > 50 cm).
Remotesensing 16 00399 g009
Figure 10. Cumulative Plot AGB of the 969 reconstructed trees.
Remotesensing 16 00399 g010
Table 1. Examples of patch sizes used in the reconstruction for selected trees. Values for PD1 and PD2Max were derived by dividing the tree DBH by 6 and 4, respectively.
Tree IDDBH (cm)PD1 (m)PD2Min (m)PD2Max (m)
210460.06
0.08
0.10
0.02
0.03
0.04
0.05
0.10
0.12
0.14
2108540.07
0.09
0.11
0.02
0.03
0.04
0.05
0.11
0.13
0.15
2139170.02
0.03
0.04
0.02
0.03
0.04
0.05
0.02
0.04
0.06
2154370.04
0.06
0.08
0.02
0.03
0.04
0.05
0.07
0.09
0.11
2160620.08
0.10
0.12
0.02
0.03
0.04
0.05
0.13
0.15
0.17
Table 2. Average sensitivity per tree parameter class. DBH, TH, CA, and CV represent diameter at breast height, tree height, crown area and crown volume, respectively.
Tree Parameter
Class
No of TreesAverage
Point Density
(points/m2)
Average
Sensitivity
PD1
%
Average Sensitivity
PD2Min
(%)
Average Sensitivity
PD2Max
(%)
Small
(DBH ≤ 25 cm)
60570966.647972.70
Medium
(25 cm < DBH ≤ 50 cm)
29786156.2976.9876.52
Large
(DBH > 50 cm)
6770162.3661.6087.79
Small
(TH ≤ 5 m)
27072374.7972.0976.80
Medium
(5 m < TH ≤ 10 m)
43967468.5987.0279.38
Large
(TH > 10 m)
26092541.9666.1765.41
Small
(CA ≤ 86.7 m2)
88572965.4079.0276.18
Medium
(86.7 m2 < CA ≤ 173.4 m2)
80104941.1257.8461.40
Large
(CA > 173.4 m2)
457711.757965.25
Small
(CV ≤ 448 m3)
90872665.3378.2876.72
Medium
(448 m3 < CV ≤ 896 m3)
56122632.0360.4047.23
Large
(CV > 896 m3)
575619.282.256
Table 3. Point density and sensitivity. The values are the average values per quartile.
Point Density
(Points/m2)
No of TreesSens
PD1
Sens
PD2Min
Sens
PD2Max
QSM-AGB (kg)Destructive Allometry (kg)Object-Based (kg)Jenkins
Allometry (kg)
114.572429088.999.9244.35170.70122.18258.63
289.4324368.786.893.1413.5279.94311.02371.28
525.6624249.970.461.6682.64356.59557.44469.38
2091.7224243.962.944.9886.39346.06675.42439.20
Table 4. Uncertainty derived from tenfold modelling runs on the QSM-predicted volume.
Diameter ClassTotal
Volume
(L)
Average Volume
(L)
Average
Coefficient of
Variation (%)
Small
(DBH ≤ 25 cm)
94,05915227.5
Medium
(25 cm < DBH ≤ 50 cm)
364,522124419.9
Large
(DBH > 50 cm)
151,891257421.3
Table 5. Impact of parameter errors on the derived AGB using allometric equations. The predicted AGB is the average per AGB method for the 969 reconstructed trees.
Colgan Destructive Allometry (Equation (1))Colgan Object-Based Allometry (Equation (2))Jenkins Allometry (Equation (3))QSM-AGB
Positive error in parameters320.20 kg530.27 kg413.25 kg556.57 kg
Negative error in parameters257.18 kg316.72 kg357.17 kg556.57 kg
Best mean estimate287.50 kg416.22 kg384.61 kg556.57 kg
Disclaimer/Publisher’s Note: The statements, opinions and data contained in all publications are solely those of the individual author(s) and contributor(s) and not of MDPI and/or the editor(s). MDPI and/or the editor(s) disclaim responsibility for any injury to people or property resulting from any ideas, methods, instructions or products referred to in the content.