Abstract
Water ice has been found in the permanently shadowed regions of impact craters around the lunar South Pole, which makes them ideal areas for in situ exploration missions. However, near the rim of impact craters, construction and exploration activities may cause slope instability. As a result, a better understanding of the shear strength of lunar soil under higher stress conditions is required. This paper mainly uses the finite element method to analyze slope stability to determine the position and shape of the slip surface and assess the safety factor. The height and gradient of the slope, the shear strength of lunar soil, and the lunar surface mission all influence the stability of the slope. We also analyze the soil mechanical properties of a soil slope adjacent to the traverse path of the Chang’E-4 Yutu-2 rover. Determining the stability of the slope at the lunar South Pole impact crater under various loading conditions will enhance the implementation of the lunar surface construction program. In this respect, this paper simulates a lunar mission landing at the Shackleton and Shoemaker craters and indicates that areas with higher cohesion lunar soil may be more stable for exploration in the more complex terrain of the South Pole.
1. Introduction
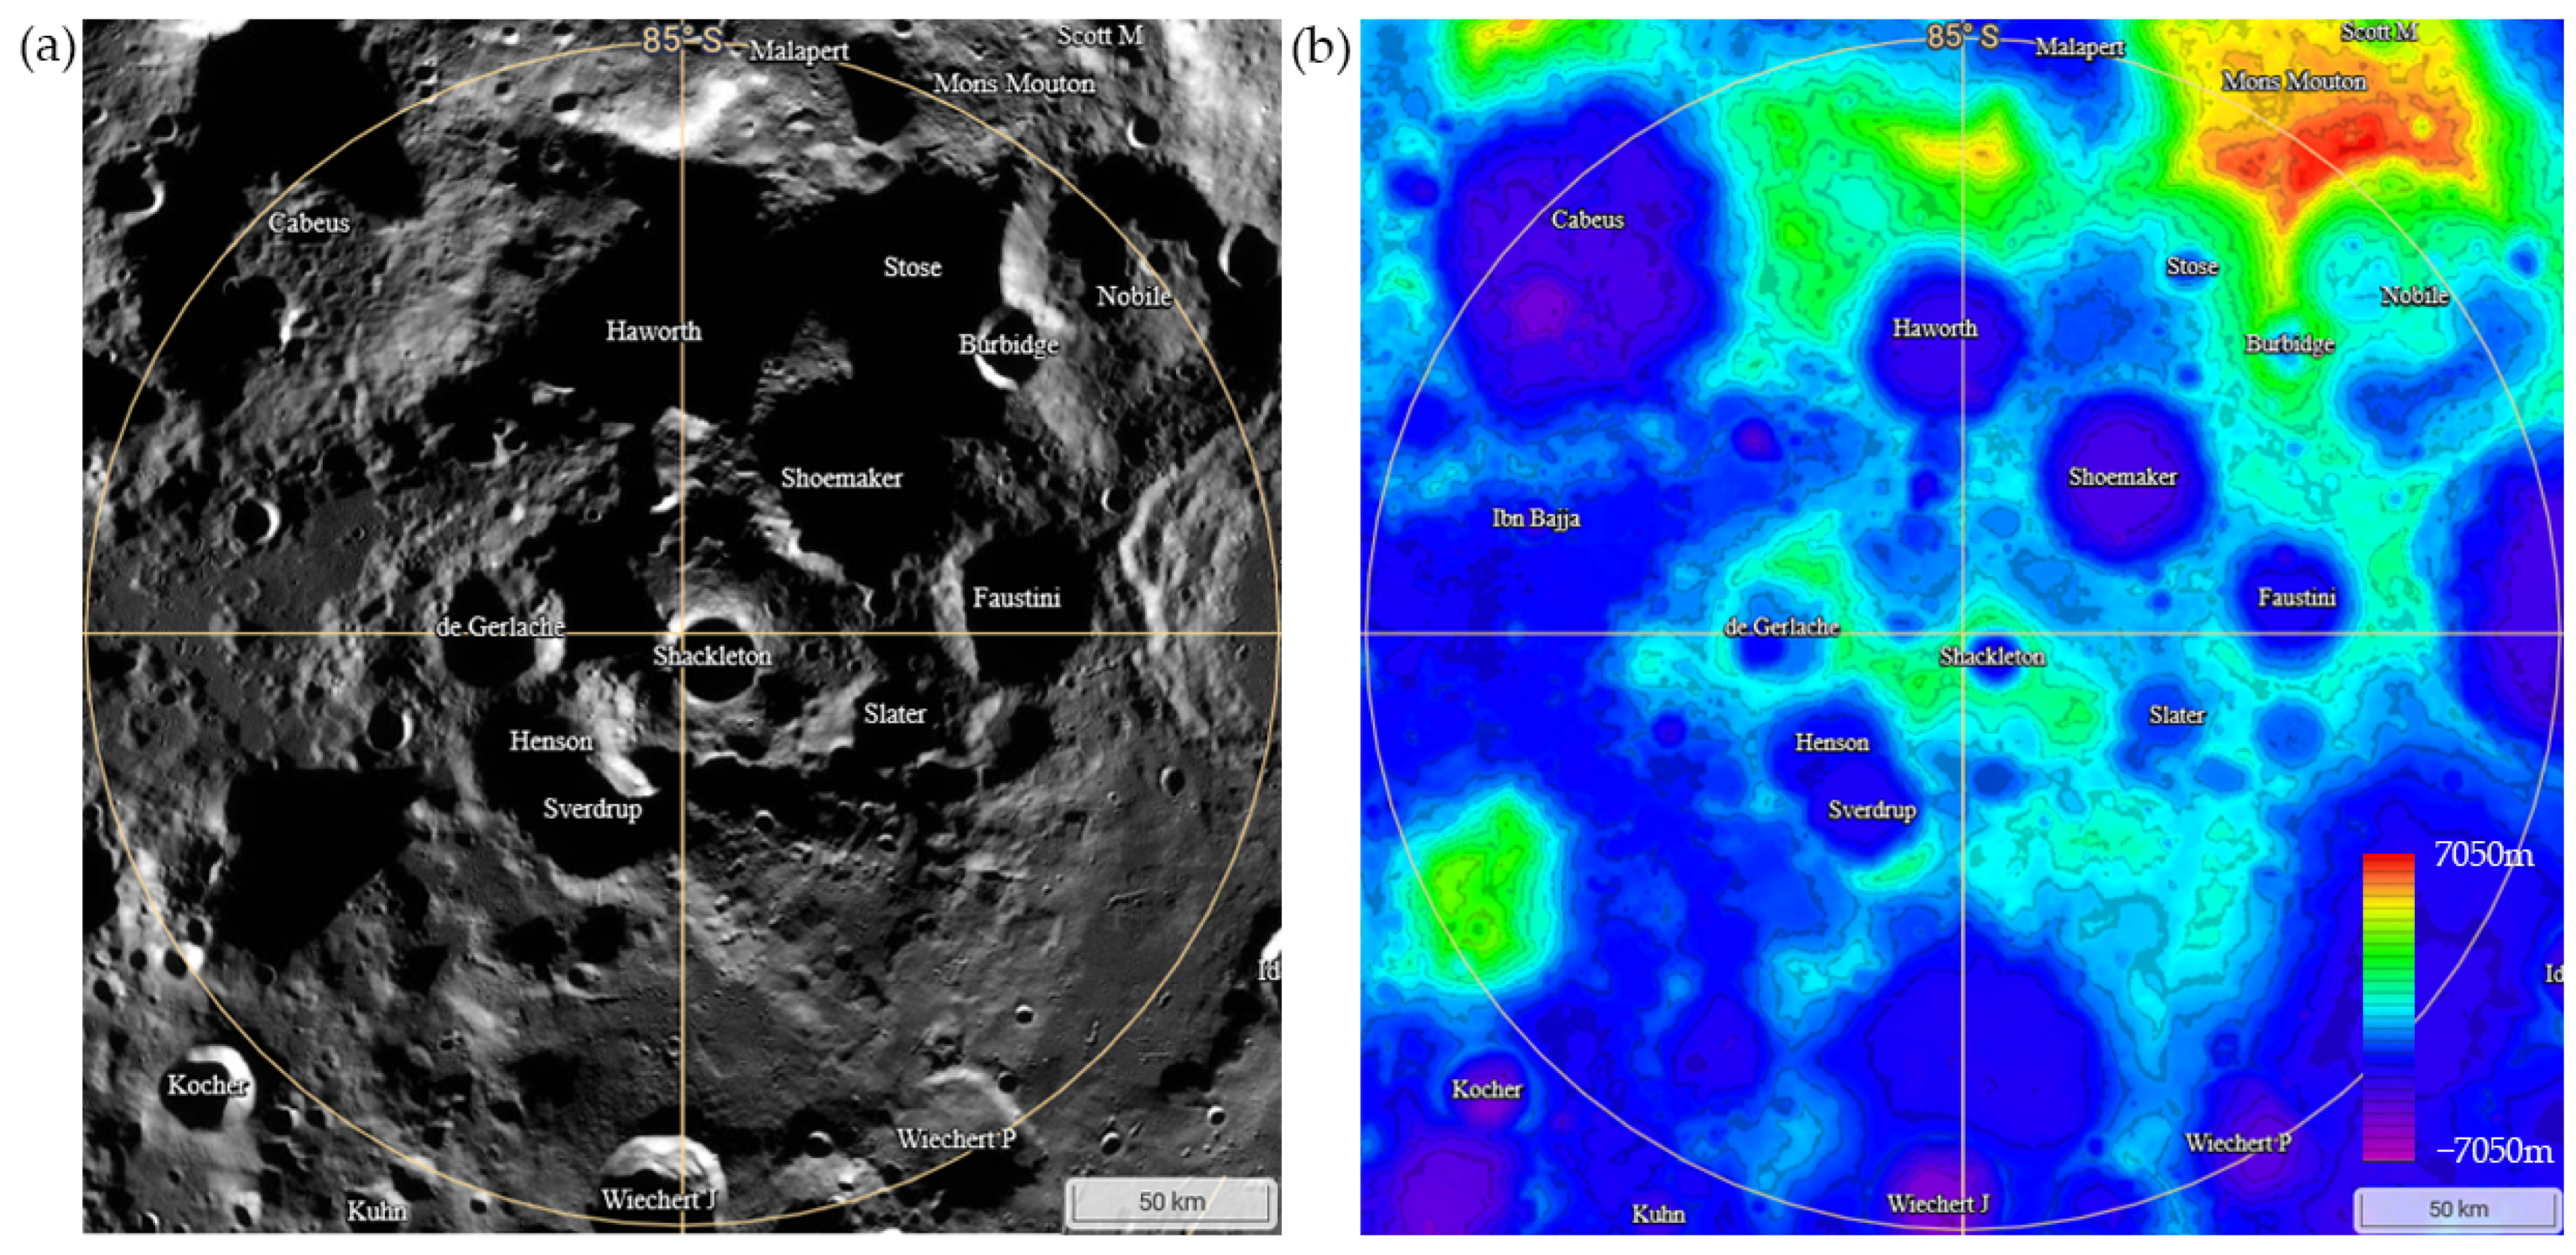
Radar measurements from the Clementine mission have revealed the possibility of water ice in a permanently shadowed region of the lunar South Pole [1]. Neutron spectrometers on the Lunar Reconnaissance Orbiter (LRO) detected abundant hydrogen in permanently shadowed regions (PSRs), which were also able to infer the presence of water ice [2]. The discovery of water ice in PSRs is of great significance for understanding the formation and evolution of the Moon and, even, the Earth. Therefore, more and more national space agencies plan to launch a series of missions to detect near-surface volatiles at the lunar South Pole in the future. For example, China’s Chang’E-7 mission is expected to land at the lunar South Pole to conduct polar environmental and resource surveys, and Russia’s Luna-25 and Luna-26 missions also target this region [3]. Knowledge of the lunar South Pole environment and the physical mechanics is essential for subsequent landing and sampling missions. A feature of the lunar polar regions is complex terrain and many permanently shadowed impact craters that may contain water ice. For example, the polar region has dozens of distributed impact craters, most of which have a diameter of more than 10 km and a depth of about 3 km, as shown in Figure 1.

Figure 1.
(a) The map from LROC NAC; high-resolution images (0.5 m/pixel) of the lunar South Pole (85°S to South Pole). (b) The LOLA South Pole DEM (20 m/pixel).
The lunar polar region has another unique environmental condition: persistent solar illumination for more than 100 days [4]. Persistent solar illumination is required to provide a continuous solar energy supply, maintain a suitable thermal environment, and carry out complex exploration activities for long-term in situ missions targeting impact craters around the lunar South Pole. As determined in previous studies, high crater rims close to the poles generally receive better illumination than other regions. Therefore, in order to complete the landing of the scientific detection mission and the water ice detection mission, the landing area should be selected as a high elevation from the continuous light area, and, under this premise, should be as close as possible to the PSRs to facilitate the implementation of the water ice detection mission. In addition, the crater rim is a good choice, which not only satisfies the above conditions, but is also relatively flat and higher than the surrounding terrain to avoid blocking the sun. For example, the Russian lunar Earth mission and the Chinese Chang’E-7 mission have chosen the crater rim as a candidate landing area [5]. However, the crater wall adjacent to the rims is steeply sloped and covered by fine, loose soils, which frequently results in landslides and slope collapses [6,7,8], posing a great challenge to exploration activities. Therefore, it is of great significance to study the physical and mechanical properties of the lunar regolith at the South Pole and the stability of the impact crater slope to evaluate the safety of the pre-selected landing zone. In this paper, we will evaluate the safety of a landing mission by simulating loadings on the rims of polar impact crater slopes using the finite element method, so as to provide a reference on the physical properties of the lunar regolith for future projects.
In this paper, based on high-resolution Digital Elevation Model (DEM) data and narrow-angle camera (NAC) images from the Lunar Reconnaissance Orbiter Camera (LROC) [9], we used the finite element method (FEM) to study the slope stability of the crater slope in the lunar South Pole. In Section 2, the principle of the finite element strength reduction method is provided and we introduce the selection of the model parameters. In Section 3, the relationships between the angles, height of the crater slope, shear strength, and surface loadings with slope stability are discussed. In Section 4, an impact crater near the actual patrol path of the Yutu-2 rover is selected to establish a two-dimensional slope stability model. Then, the physical characteristics of lunar soil in the Chang’E-4 landing area are studied. In the last section, based on the high-resolution DEM data, the two-dimensional slope stability models are established at the Shoemaker and Shackleton impact crater slopes to evaluate the influence of the weight of the scientific research station on the stability of the impact crater slope.
2. Materials and Methods
The surface and body force system applied to the internal slope of the impact crater can cause changes in the stresses and strains inside the crater, even to the limit of its shear strength, resulting in irreversible plastic deformation. Failure of a slope frequently takes the form of quite a large sliding of the deformation part, resulting in a lower boundary deep within the soil mass, called the failure surface. The study of slope stability mainly focuses on the failure surface of the slope and the corresponding factor of slope safety.
2.1. Data
In June 2009, the National Aeronautics and Space Administration (NASA) launched the Lunar Reconnaissance Orbiter (LRO), which is still orbiting the Moon at an altitude of 50–200 km. The LROC is a three-camera system mounted on the LRO that can be used to capture high-resolution black-and-white images and medium-resolution multispectral images of the lunar surface [9]. In Figure 1a, most of the map is drawn using high-resolution images, and the blanks are supplemented by medium-resolution images. The NAC images around the Chang’E-4 landing area were used for obtaining information on the impact crater slope that can be downloaded from the website https://wms.lroc.asu.edu/lroc/view_lroc/LRO-L-LROC-3-CDR-V1.0/M1303619844LC (accessed on 28 December 2021).
The Yutu-2 rover carries a panoramic stereo camera (Pancam) to acquire three-dimensional terrain information, which can deliver a high-resolution DEM (0.5 m/pixel) of the Chang’E-4 landing site [10]. The DEM (0.5 m/pixel) from the Pancam was used for extracting the height and angle of a soil slope adjacent to the Yutu-2 rover traverse path, as detailed in Section 4. LOLA is a lunar orbital laser altimeter that provides high-resolution DEM images to determine the global topography of the lunar surface. The LOLA DEM of 20 m/pixel, as shown in Figure 1b, was used to describe the DEM map from 85°S to 90°S. The LOLA DEM at the 5 m pixel scale, as the highest spatial resolution, was used for extracting the slope angles of the Shoemaker and Shackleton craters.
2.2. Finite Element Strength Reduction Method
Slope stability analysis has always been a particularly complicated and important issue in geotechnical engineering on Earth. The traditional method of slope stability analysis needs to assume a reasonable failure surface, divide the rock and soil mass on the failure surface into multiple soil strips, establish a balance equation on the force and moment between the soil strips, and obtain the factor of safety (FoS) corresponding to the failure surface [11]. It is necessary to assume multiple failure surfaces and then find a particular surface for which the FoS is the smallest [12]. Recently, the FEM has also helped solve slope stability analysis; the concept of the FoS has a certain significance in the strength of the reserves. According to the Mohr–Coulomb criterion and Bishop’s definition [11,12,13,14], the FoS can be expressed as:
Divide both sides of Equation (1) by the FoS:
where , . Where σ is positive stress, and τ is the shear strength. Where c and φ are the actual shear strength parameters of the soil body, which are the cohesion and internal friction angle, respectively. In addition to this, c′ and φ′ are the shear strength parameters of the lunar soil body when it reaches the limit state and are the cohesion and internal friction angle after reduction.
As early as 1975, Zienkiewice et al. proposed the strength reduction method (SRM) for slope stability analysis [13]. Later, it was used for applying different FoS to the c′ and tan φ′ terms [15]. According to the SRM procedure, c′ and tan φ′ are progressively reduced using the strength reduction factor (SRF) until the ultimate damage state is reached. When reaching the limit state, the node of the model displacement increases sharply. At this time, the corresponding SRF is the minimum FoS in the whole slope, as shown by Equation (3):
When the FoS equals 1, the slope is in a critical equilibrium state. When the FoS is greater than 1, the slope is damaged. When the FoS is less than 1, the slope does not change compared with the initial state.
2.3. Two-Dimensional Model of Slope Stability of Lunar Impact Crater
On Earth, the FEM is very commonly and widely used to study the stability of a soil slope [16] and has been verified using experiments [17]. This method can be applied to the complex geological activity of soil composition and the terrain environment [17,18,19,20,21]. With the development of the network combined with deep learning, it predicts engineering safety and disaster impacts [22]. In this study, finite element software was applied to establish the stability model of the impact crater slope at the lunar South Pole. The first step is to construct a geometric model that takes into account the shape of the crater. The topography of the Moon is predominantly characterized by impact craters, which exhibit variations in terms of size, depth, and slope. Additionally, the crater is coated with a layer of loose, fine-grained regolith. Bart et al. (2011) found that the depth of the lunar regolith is typically 2–8 m [23]. Li et al. (2020) unveiled that the ejecta deposit covering the von Kármán impact crater can reach 12 m, using data from the Chang’E-4 Lunar Penetrating Radar [24]. Thus, the determination of the slope height for the model requires consideration of the thickness of the lunar soil on the slope of the impact crater.
The physical parameters and mechanical properties of lunar soil differ significantly from those of Earth soil. When the finite element analysis method is used to solve the slope stability problem on the Moon, the accuracy and rationality of the physical and mechanical parameters of the lunar soil should be considered to reduce the error caused by the SRM. The gravity on the lunar surface is only 1/6 that of the Earth. When using finite element software, it is necessary to set not only the gravity condition of the whole model, but also the bulk density of the lunar soil. According to previous studies, the bulk density of lunar soil varies with the depth and position, and the range is about 1.3–2.4 g/cm3 [25]. The bulk density of lunar soil at a depth of 5.8 m was 1.9 g/cm3 and 1.67 g/cm3, respectively, in the patrol path measured by the Yutu-2 radar [26]. Therefore, the lunar soil bulk density is selected as 1.9 g/cm3 in the stability analysis of the lunar soil slope in our models. In addition, the stiffness parameters of soil, including Young’s modulus and Poisson’s ratio, are also very important to analyze in the model. Young’s modulus and Poisson’s ratio, obtained using the triaxial test, range from 10.3 to 80.8 MPa and 0.43 to 0.47, respectively [25]. Therefore, when establishing the model, the values of Young’s modulus and Poisson’s ratio are selected as 10 MPa and 0.47.
The shear resistance of lunar soil must be considered in the study of slope instability. The shear resistance of lunar soil particles is determined by the internal friction angle (φ) and cohesion (c). According to extensive field tests conducted during the Apollo missions by the United States and the Luna program, as well as tests on actual lunar soil samples brought back to Earth, the internal friction angle (φ) in real lunar soil is 25–50°, and the cohesion c is 0.26–1.80 kPa [25]. The cohesion of simulated basalt in the Chang’E-5 mission, which simulates lunar soil on Earth, ranges from 2.08 to 5.5 kPa [27]. The influence of the internal friction angle and cohesion on slope stability are discussed in the following section.
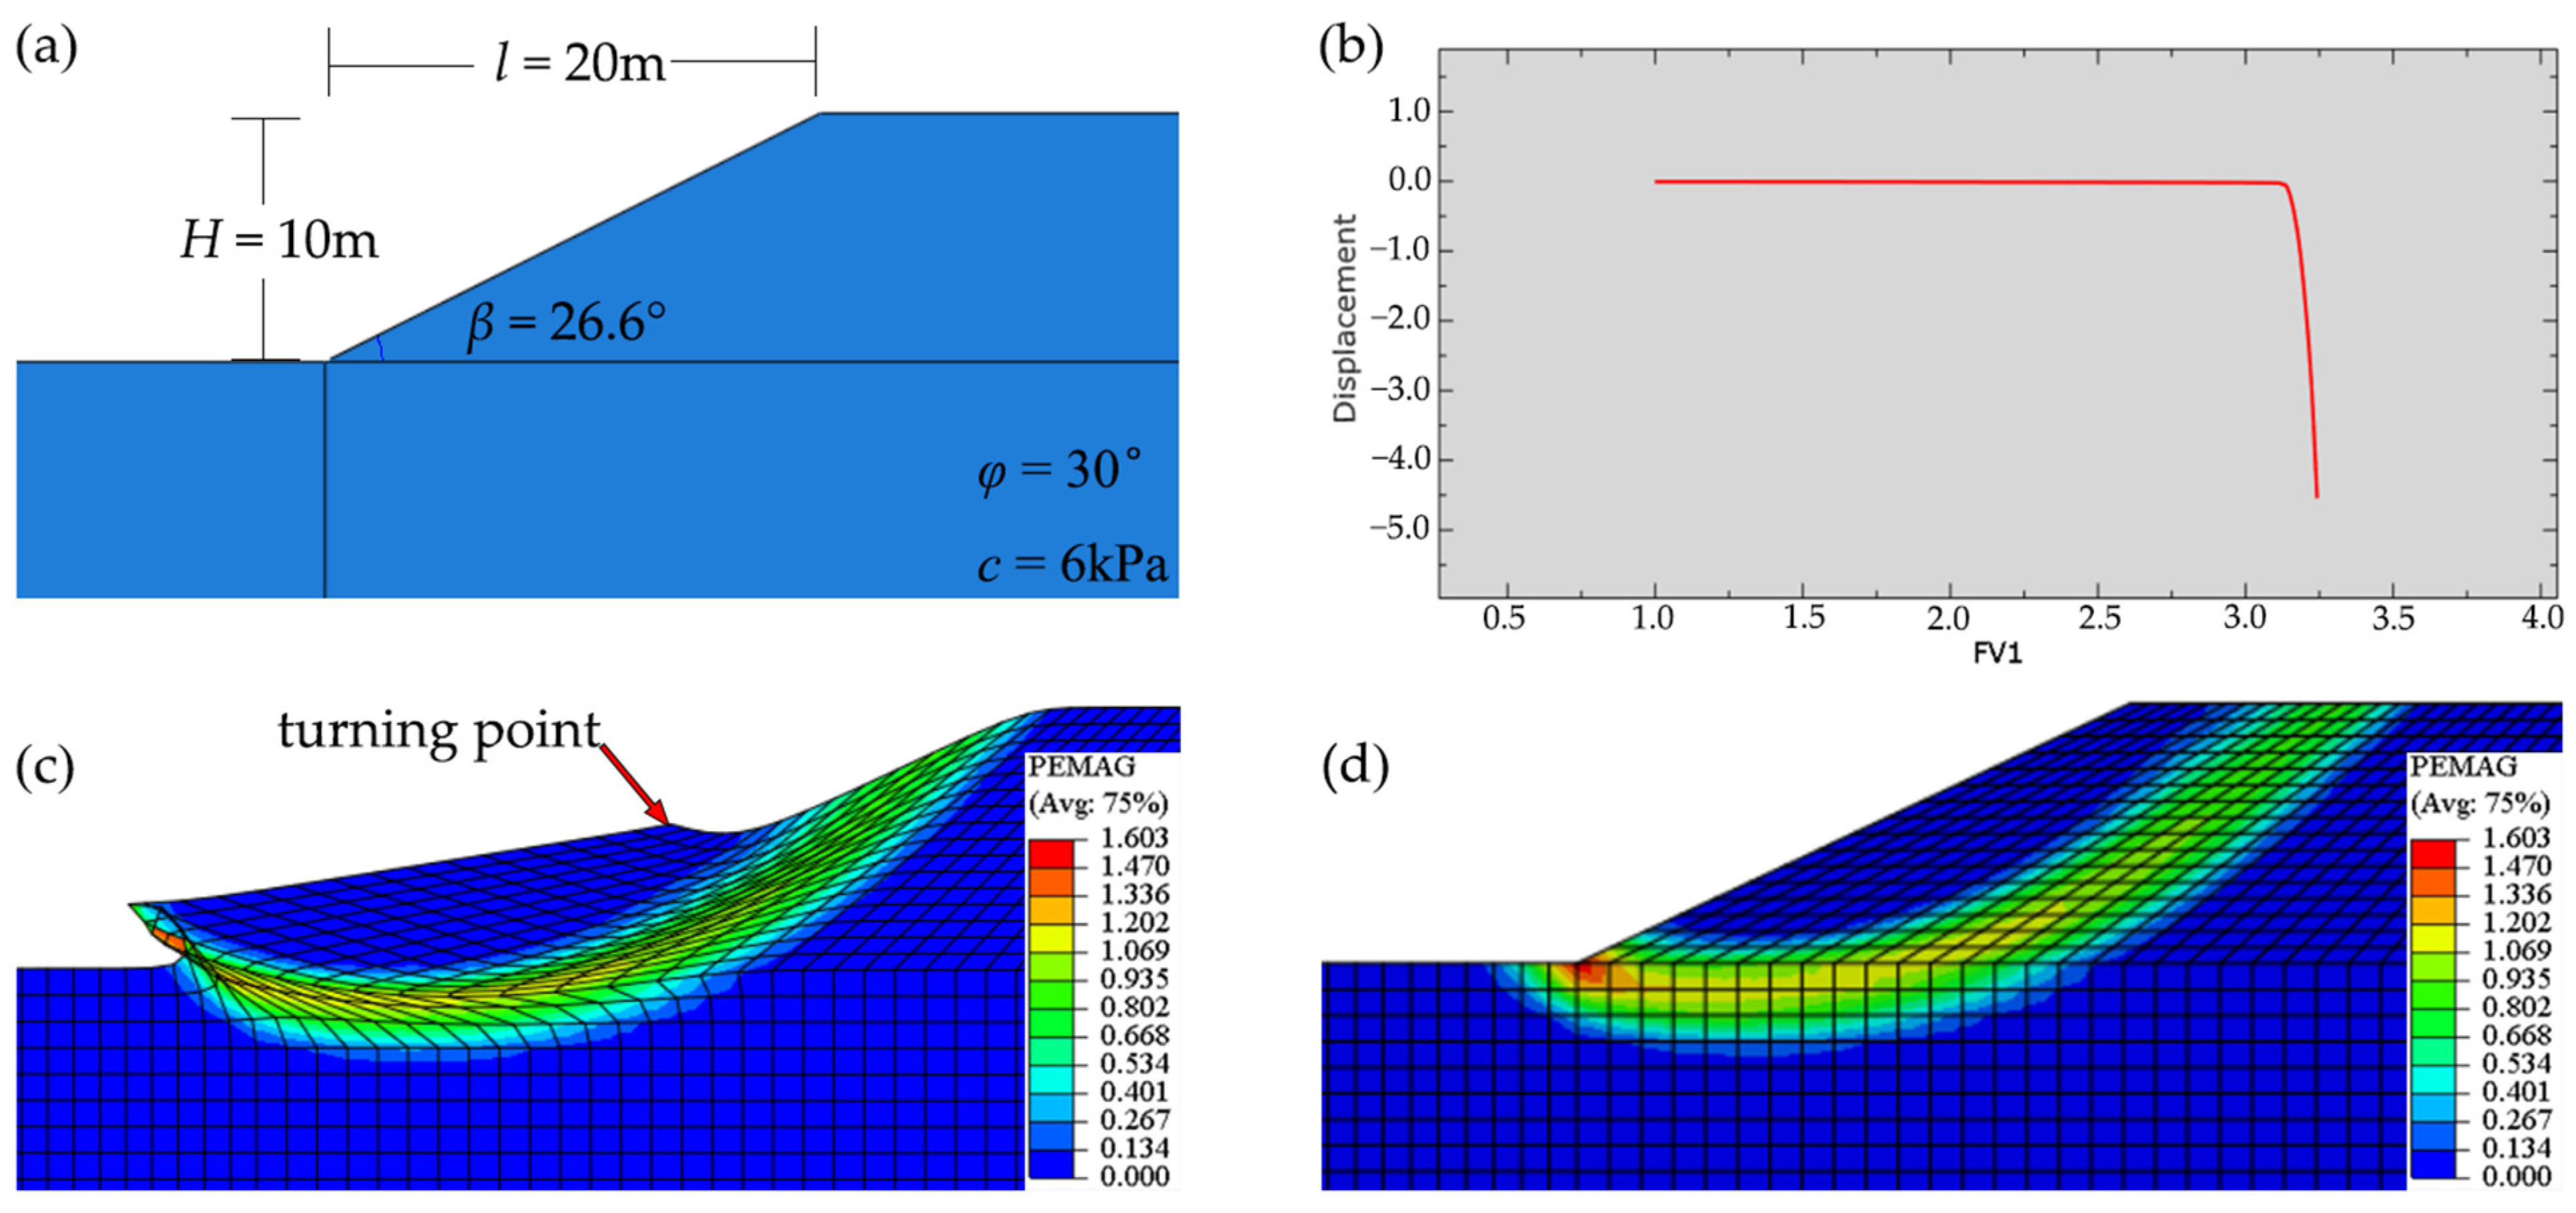
A simple two-dimensional lunar impact crater slope model was established to show the process for determining the slope stability of the impact crater, as shown in Figure 2. For example, 2D slope model 1, shown in Figure 3a, is a homogeneous soil slope in a hypothetical lunar impact crater. The thickness (H) of the lunar soil on the set slope is 10 m, and the slope angle of the crater (β) is 26.6°. Based on the SRM, model 1 calculated the slope stability in which Poisson’s ratio is 0.47, the elastic modulus is 10 MPa, the cohesion (c) is 6 kPa, and the internal friction angle (φ) is 30°. When FV1 is 3.2, the displacement of the turning point, shown by the arrow in Figure 3c, takes a dramatic turn that indicates the slope has suffered from instability, as shown in Figure 3b. At this time, the output result (FoS) of the model is 3.2, which indicates the initial state of the slope is stable. Figure 3c shows the slope landslide simulation result. It can be clearly seen in Figure 3c that the failure surface penetrates from the foot of the slope to the top of the slope. The green–yellow–red areas in Figure 3d represent the location of the failure surface during the critical state of the slope. The red area represents the location of the most drastic change in displacement within the slope. The safety of the impact crater slope can then be determined based on these results. According to equation 3, the cohesion c′ is 1.875 and the internal friction angle φ′ is 10.2° when the slope instability occurs. Therefore, when the shear strength of the real lunar regolith is higher than that of c′ and φ′, the slope remains stable.
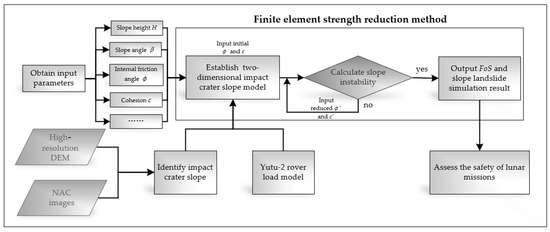
Figure 2.
Process for determining the slope stability of the impact crater in the lunar South Pole.
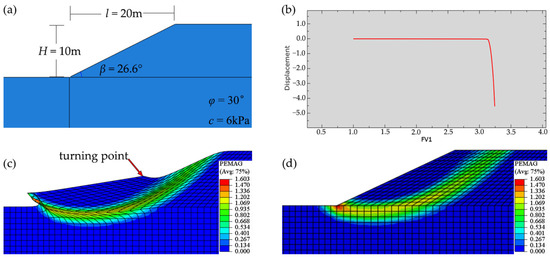
Figure 3.
(a) Two-dimensional geometric slope model 1. H is the slope height and β is the slope angle. (b) A schematic diagram of the relationship between characteristic point displacement and reduction coefficient. FV1 is the SRF of the model, and displacement is the deformation of the turning point. (c) In a schematic diagram of slope deformation, PEMGA is the value of the deformation of the turning point; the red area represents the location of the most drastic change in displacement within the slope. (d) A cloud diagram of equivalent plastic strain.
3. Stability Analysis on Soil Slope of Lunar Impact Crater
Instability in the soil slope of lunar impact craters can occur in two situations: (1) shear strength reduction in the impact crater’s soil slope without load, such as the lunar rover; (2) stress balance failure of the impact crater’s soil slope influenced by load pressure and distance from the load to the slope top. In this section, we assess the FoS and the stability of unloaded/loaded soil slopes in impact craters under different parameters.
3.1. Stability Analysis of Unloaded Soil Slopes
The stability of an unloaded soil slope of an impact crater depends on its shear strength, which is affected by many factors, such as the slope angle, slope height, cohesion, and internal friction angle. In this paper, a two-dimensional geometric model was established of an unloaded soil slope and used to assess how these factors affect the FoS and slope stability.
3.1.1. Slope Stability Affected by Different Slope Angles
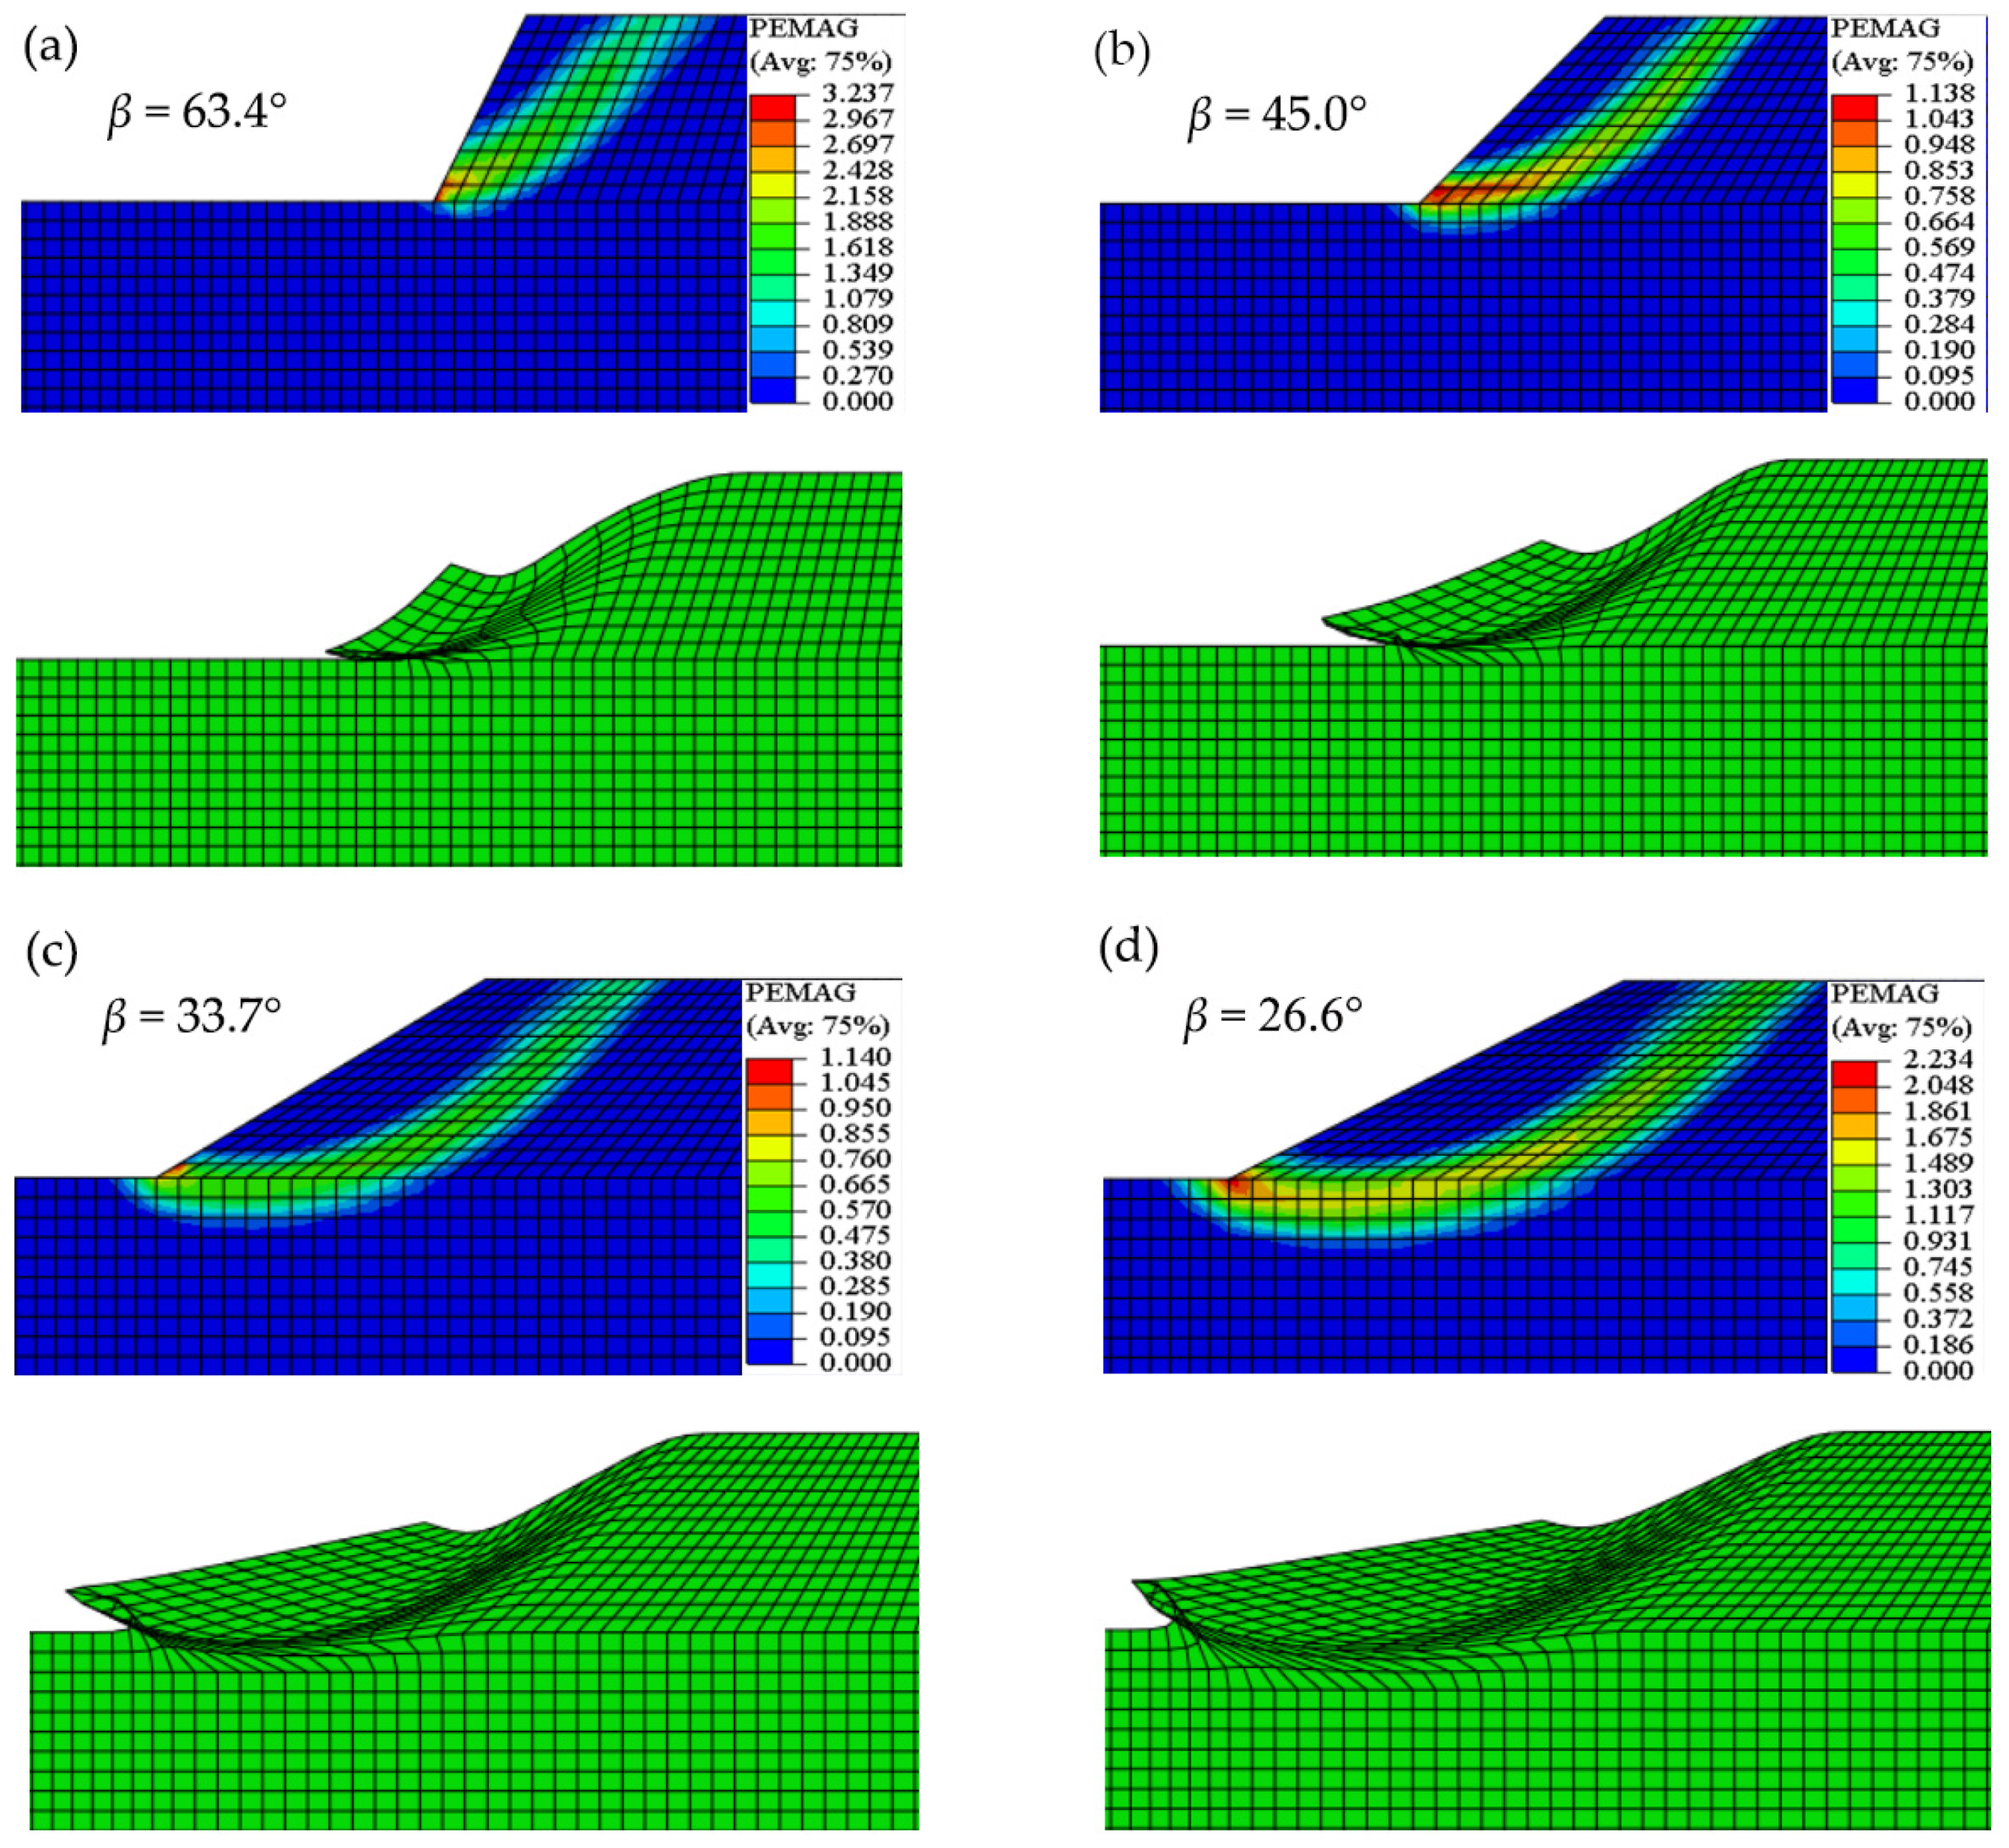
This section studies the stability of unloaded soil slopes at different slope angles, while keeping the slope height, cohesion, and the internal friction angle at certain values. Firstly, a two-dimensional geometric model is established of an unloaded soil slope, in which the slope height (H) is 10 m, the cohesion (c) is 6 kPa, and the internal friction angle (φ) is 30°. Then, the FoS of the slopes are calculated at slope angles of 63.4°, 45°, 31°, and 26.6°, respectively (Table 1). The results show that the FoS is lower when increasing the slope angle, indicating that the slope tends toward instability.

Table 1.
FoS for different slope angles, slope heights, levels of cohesion, and friction angles.
The failure surfaces of unloaded soil slopes at different slope angles are shown in Figure 4. We can see that the green–yellow–red areas, representing the location of the failure surface, developed from the toe to the shoulder of the slope. The failure surfaces move deeper and away from the toe of the slopes, and their areas become larger with a decreasing slope angle.
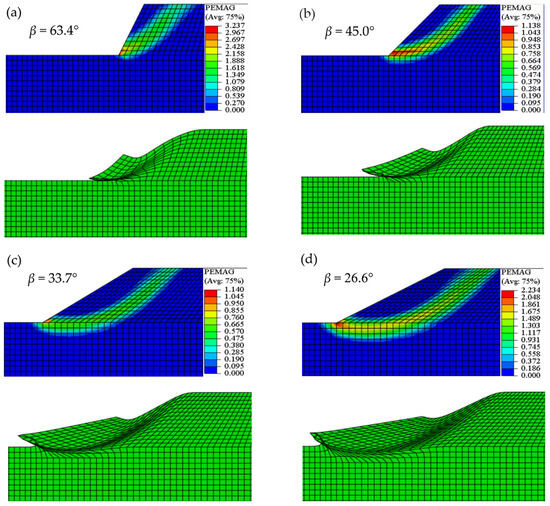
Figure 4.
Failure surfaces (shown in green–yellow–red) and mesh deformation of unloaded soil slopes at slope angles of 63.4° (a), 45° (b), 31° (c), and 26.6° (d).
3.1.2. Slope Stability Affected by Different Slope Heights
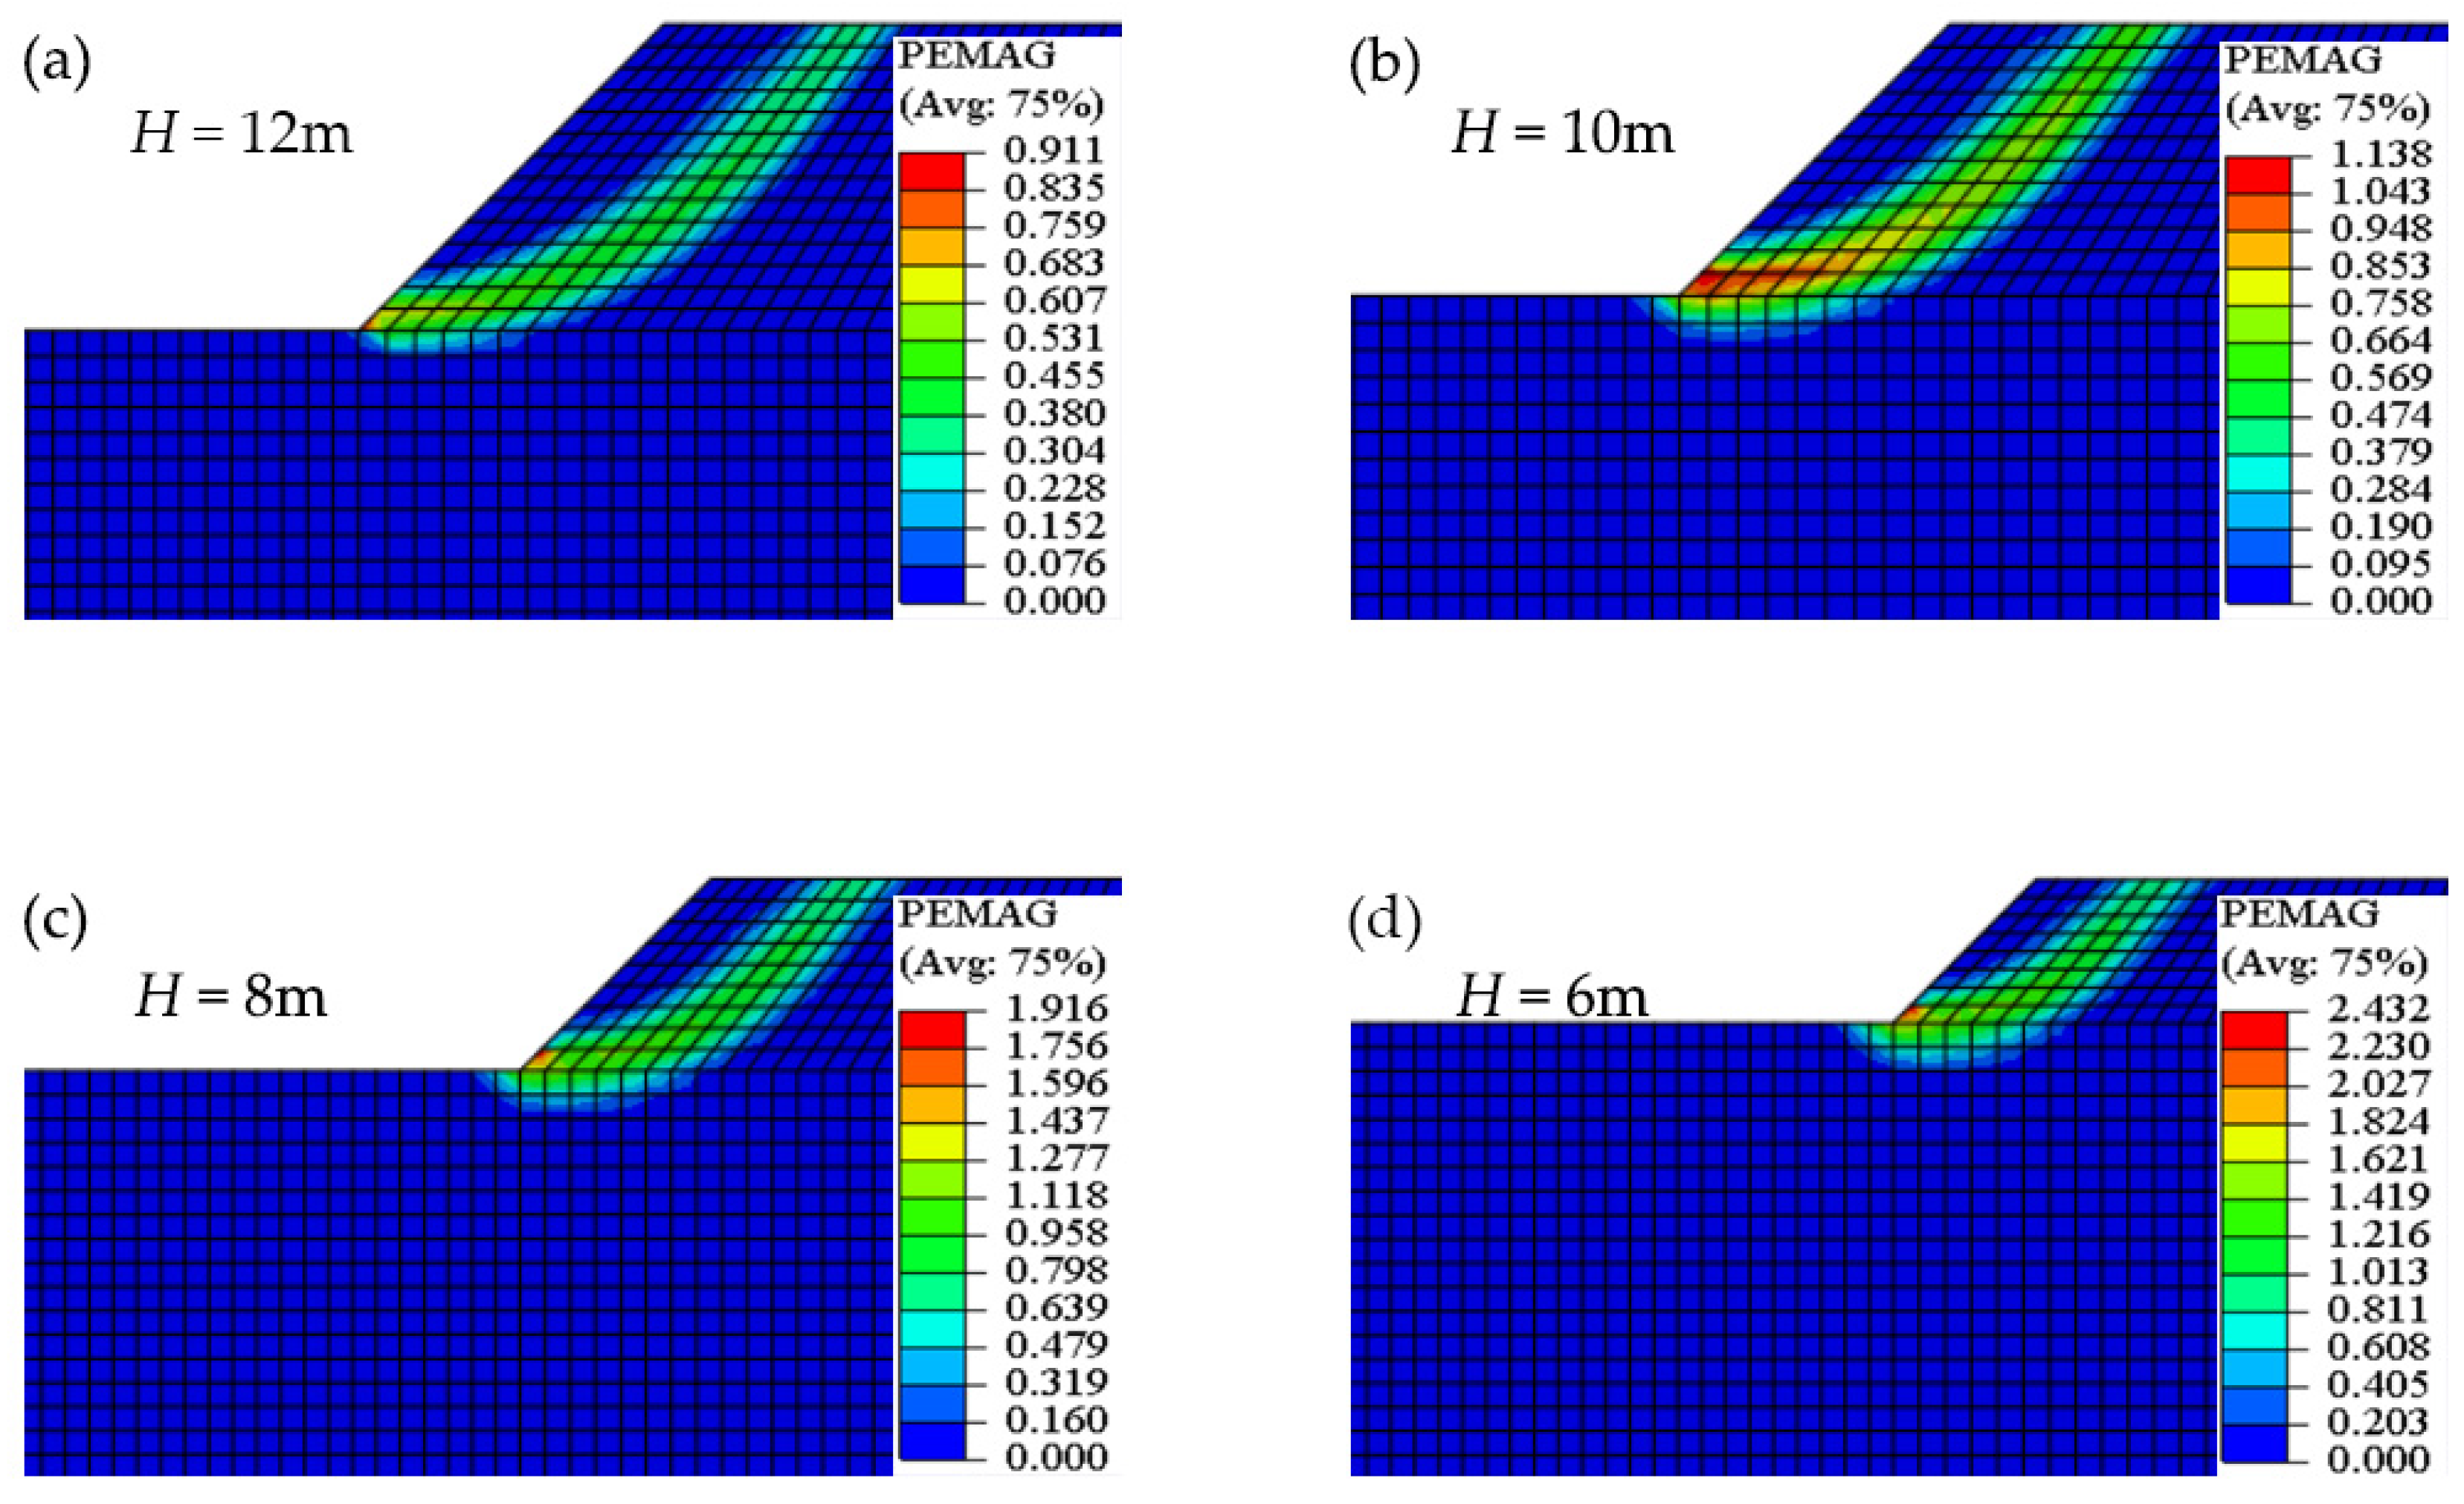
This section studies the stability of unloaded soil slopes with different slope heights, while keeping the slope angle, cohesion, and internal friction angle at certain values. A two-dimensional geometric model is established of an unloaded soil slope, in which the slope angle (β) is 45°, the cohesion (c) is 6 kPa, and the internal friction angle (φ) is 30°. The lunar regolith thickness has been studied by drilling, microwave remote sensing, and topography and spectral statistics of small crater ejecta, revealing a range from 2 m in young maria to more than 10 m in old highlands [26,28,29,30]. Therefore, the slope heights selected in this section are 12 m, 10 m, 8 m, and 6 m, for which the FoS are calculated, respectively (Table 1). The results show that the FoS is lower when increasing the slope height, indicating that the slope is more prone to instability. The failure surfaces of unloaded soil slopes with different slope heights are shown in Figure 5. We can see that the failure surfaces move deeper and away from the toe of the slopes with decreasing soil thickness.
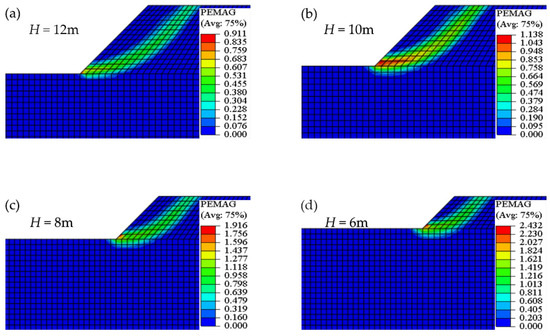
Figure 5.
Failure surfaces (shown in green–yellow–red) of unloaded soil slopes, with a soil thickness of 12 m (a), 10 m (b), 8 m (c), and 6 m (d).
3.1.3. Slope Stability Affected by Different Soil Cohesion and Internal Friction Angles
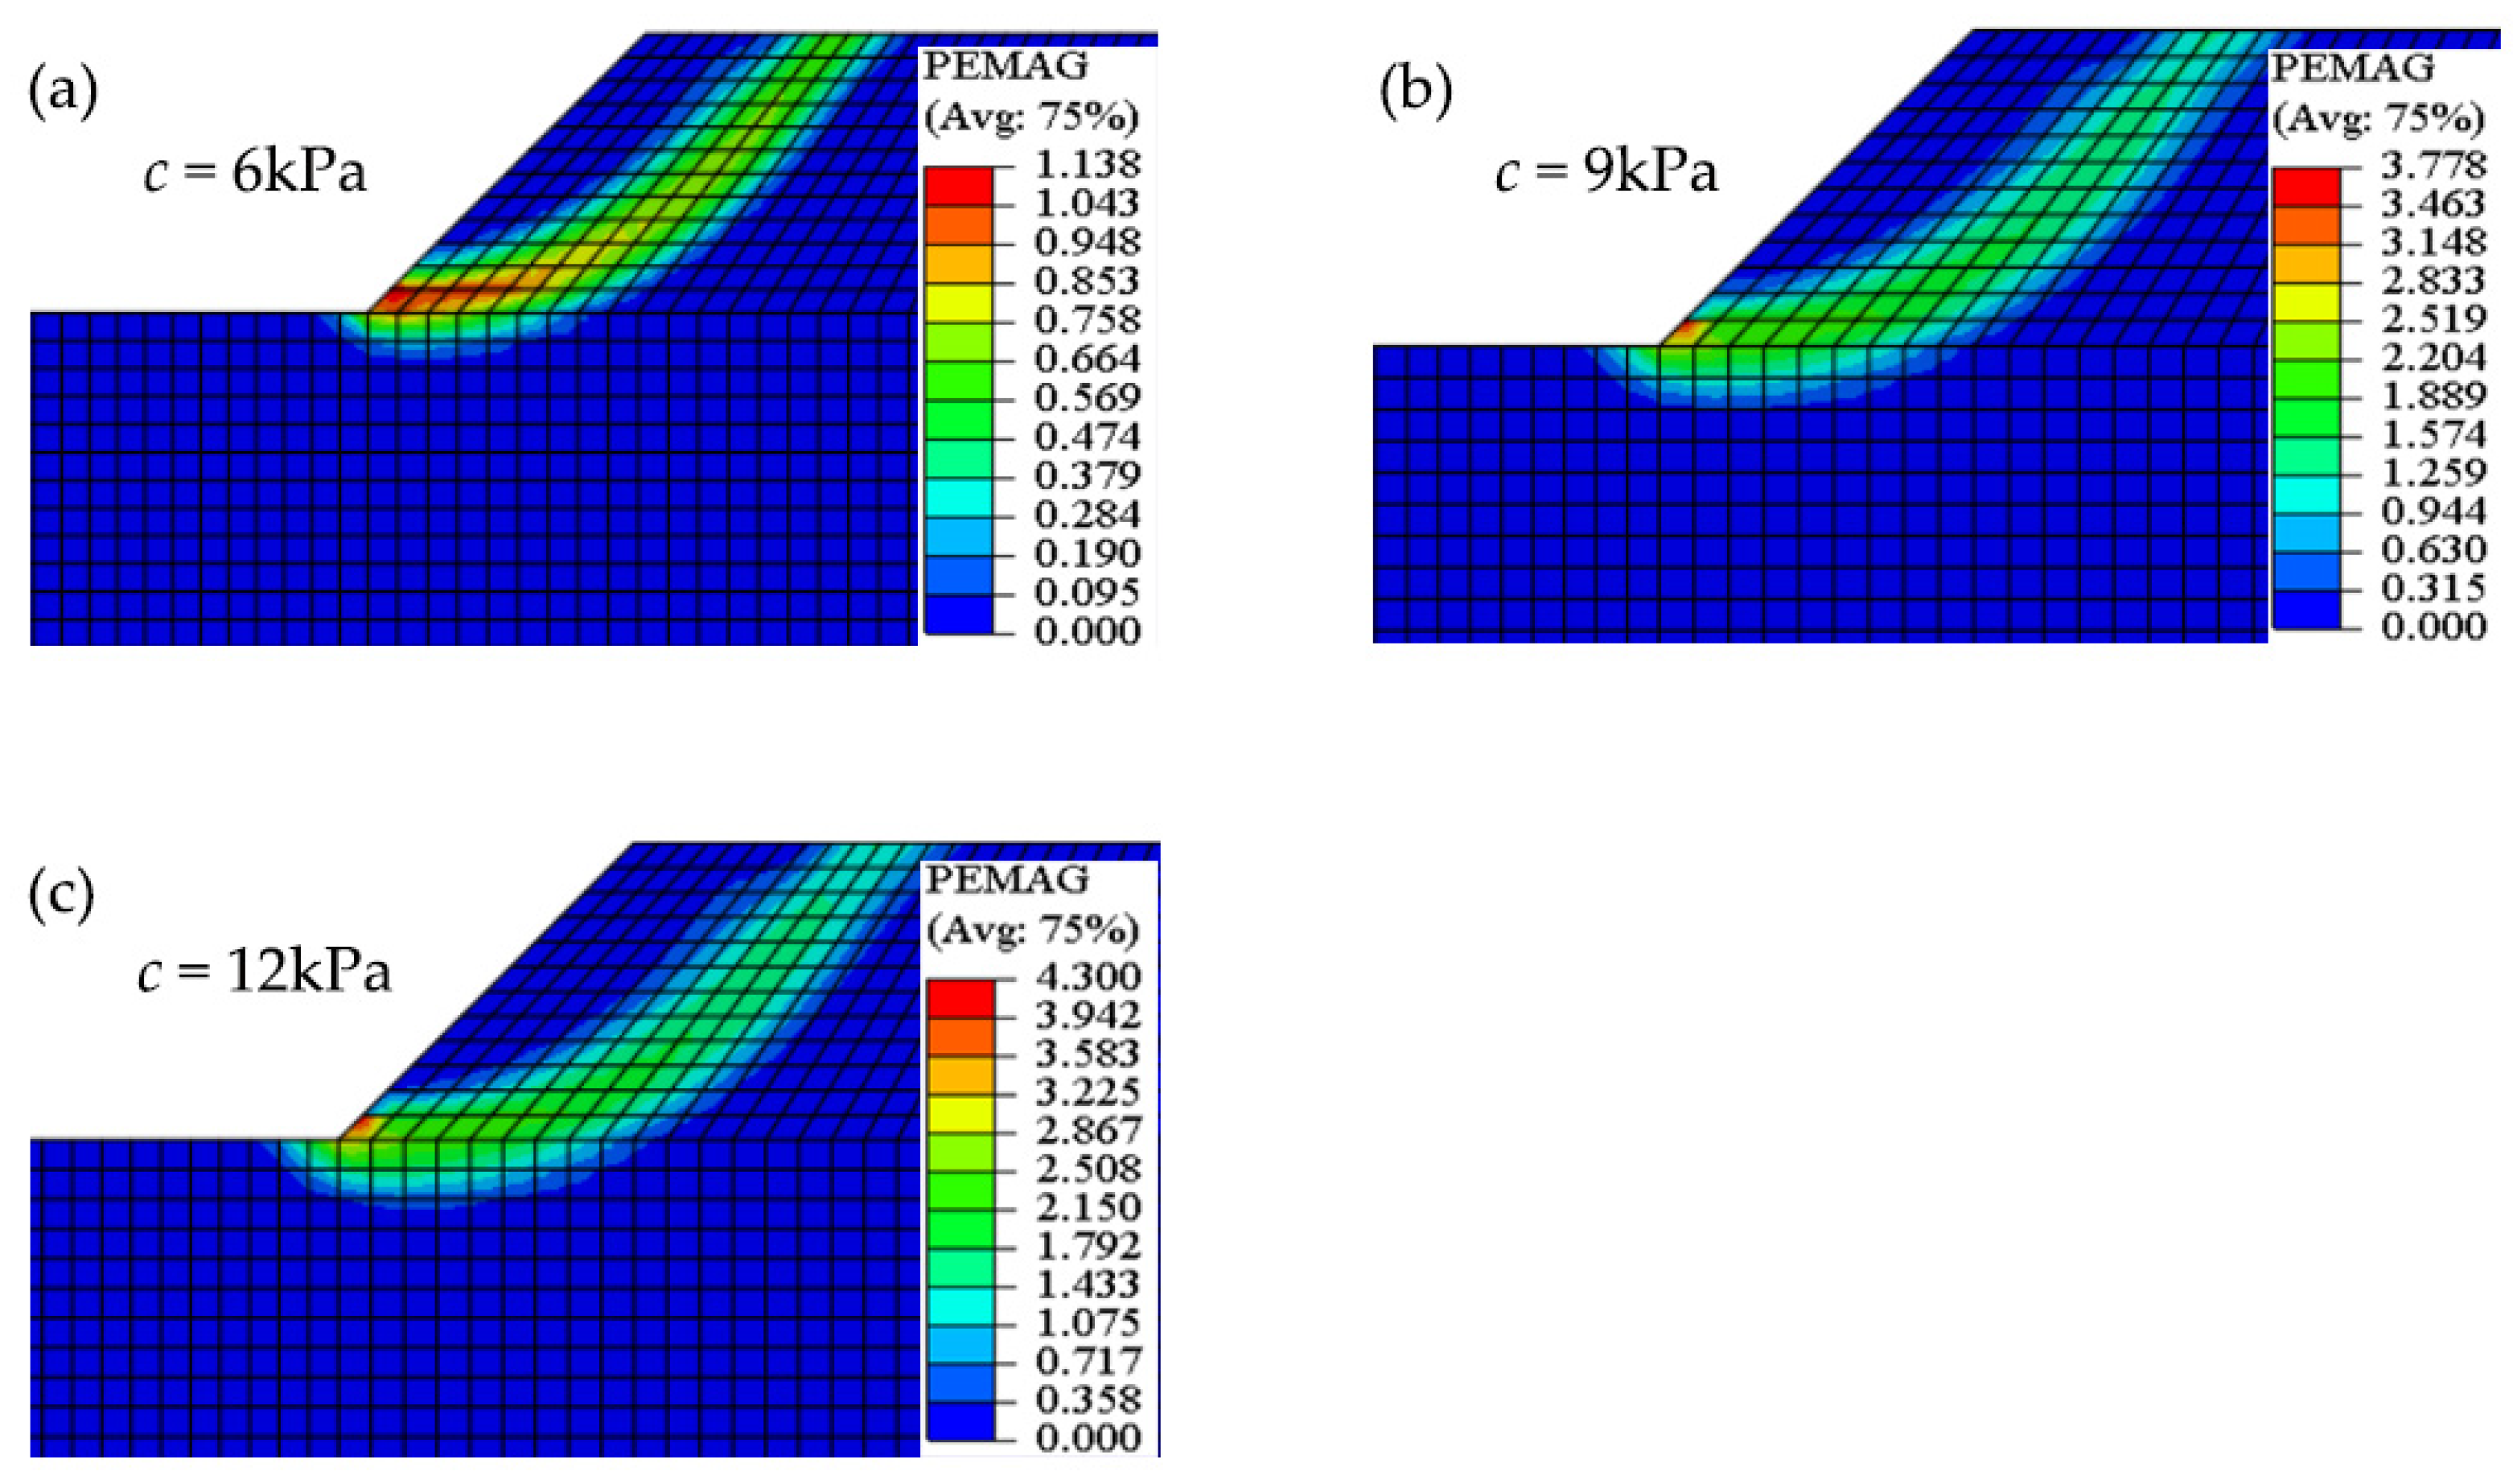
This section will study the stability of unloaded soil slopes with different cohesion and friction angles, while keeping the slope angle and soil thickness at certain values. A two-dimensional geometric model is established of an unloaded soil slope, in which the slope angle (β) is 45° and the slope height (H) is 10 m. The FoS are calculated at an internal friction angle of 30° and at cohesion values of 6 kPa, 9 kPa, and 12 kPa, respectively (Table 1). The FoS is higher when the cohesion is increased, indicating the slope is more stable. The failure surfaces of unloaded soil slopes with different levels of soil cohesion are shown in Figure 6. They move deeper and away from the toe and the shoulder of the slopes with increasing soil cohesion.
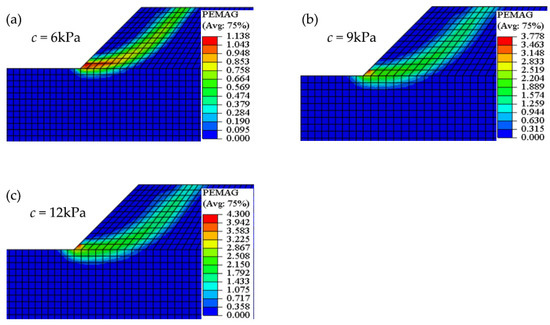
Figure 6.
Failure surfaces (shown in green–yellow–red) of unloaded soil slopes, with a cohesion of 6 kPa (a), 9 kPa (b), and 12 kPa (c).
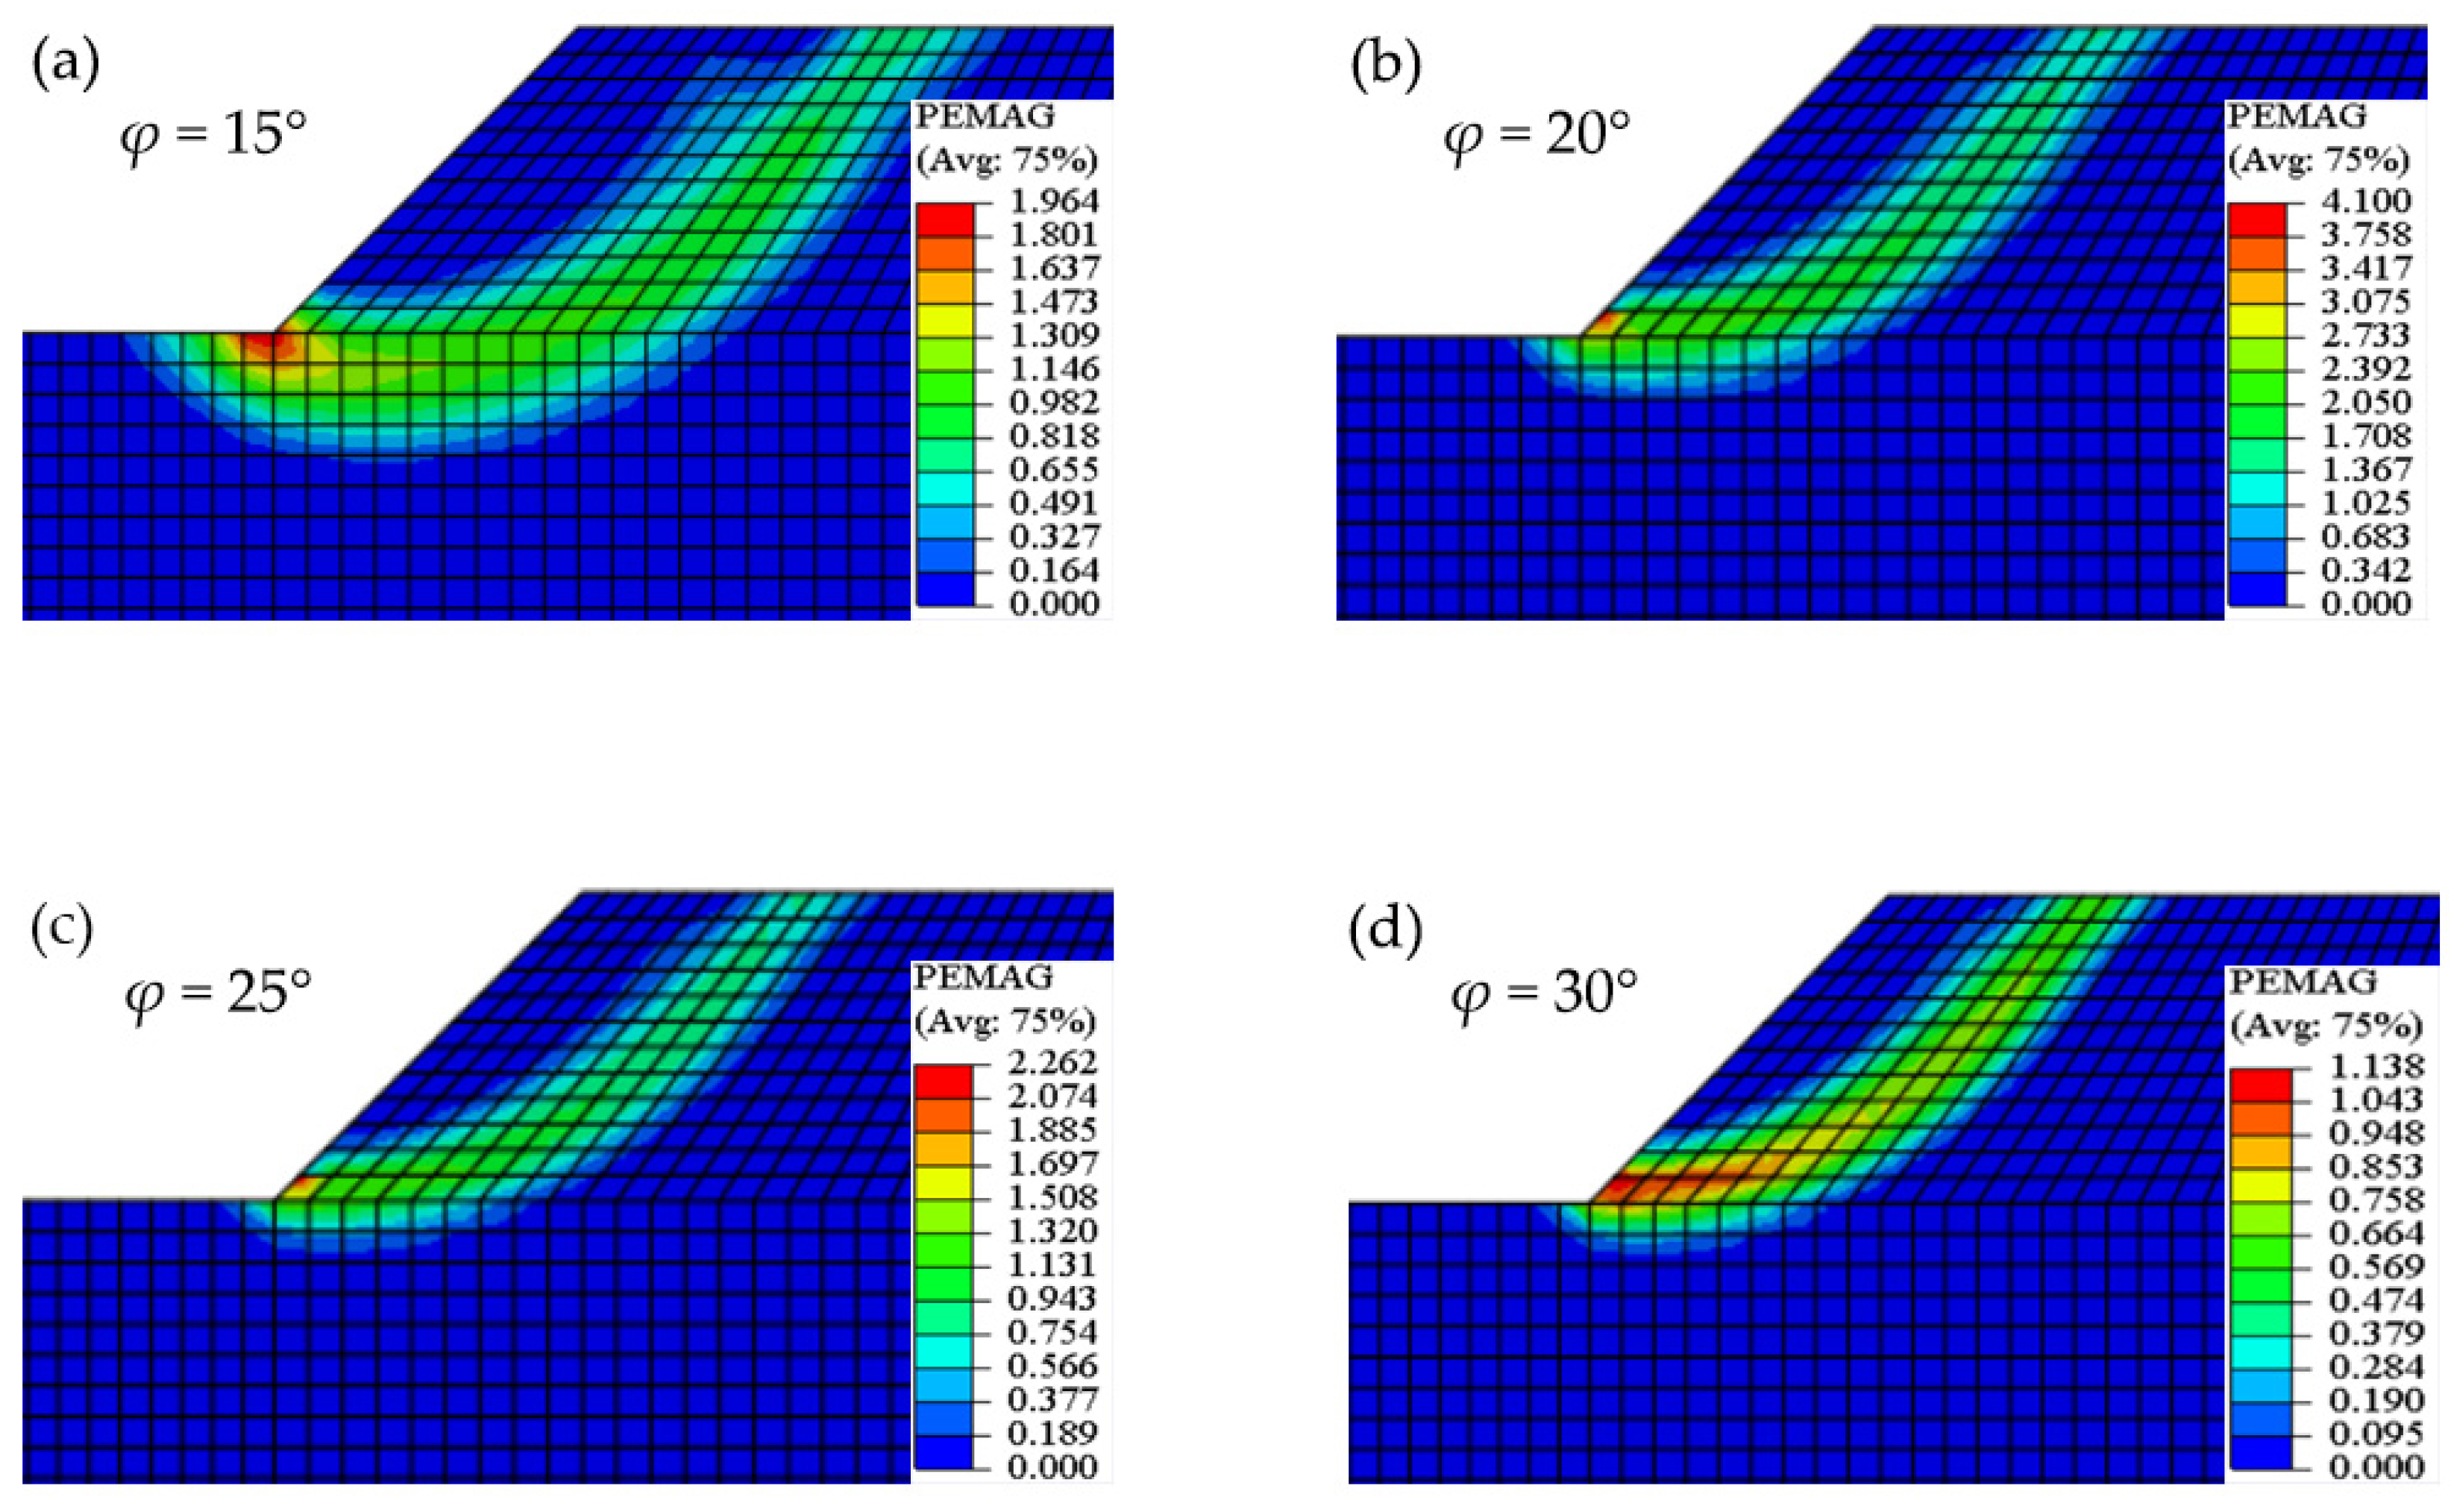
A two-dimensional geometric model is established of an unloaded soil slope, in which the slope angle (β) is 45° and the slope height (H) is 10 m. Then, the FoS is calculated at a cohesion of 6 kPa and at internal friction angle values of 15°, 20°, 25°, and 30°, respectively (Table 1). It can be seen in Table 1 that the FoS is higher when increasing the internal friction angle, indicating that the slope is more stable. The failure surfaces of unloaded soil slopes with different internal friction angles are shown in Figure 7. The failure surfaces move upwards and towards the slope surface when increasing the soil’s internal friction angle.
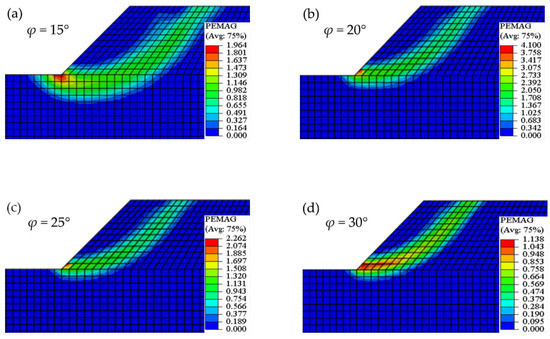
Figure 7.
Failure surfaces (shown in green–yellow–red) of unloaded soil slopes at internal friction angles of 15° (a), 20° (b), 25° (c), and 30° (d).
3.2. Stability Analysis of Loaded Soil Slopes
The stability of a loaded soil slope of an impact crater is affected by the load pressure and loading position. We will also establish a two-dimensional geometric model of a loaded soil slope and a simplified model of the Chang’E-4 Yutu-2 rover as a load and, then, evaluate how the load pressure and loading position affect the safety factor and slope stability.
The Yutu-2 rover has a mass of 135 kg and employs a six-wheel drive, each of which is 0.3 m in diameter and 0.15 m wide. The three wheels on the left or right side are evenly separated at a distance of 0.75 m [31]. The effective wheel/regolith contact surface area S can be estimated by the wheel diameter D, width d, and sinkage z using Equation (4):
The load pressure exerted on the slope surface by each wheel is:
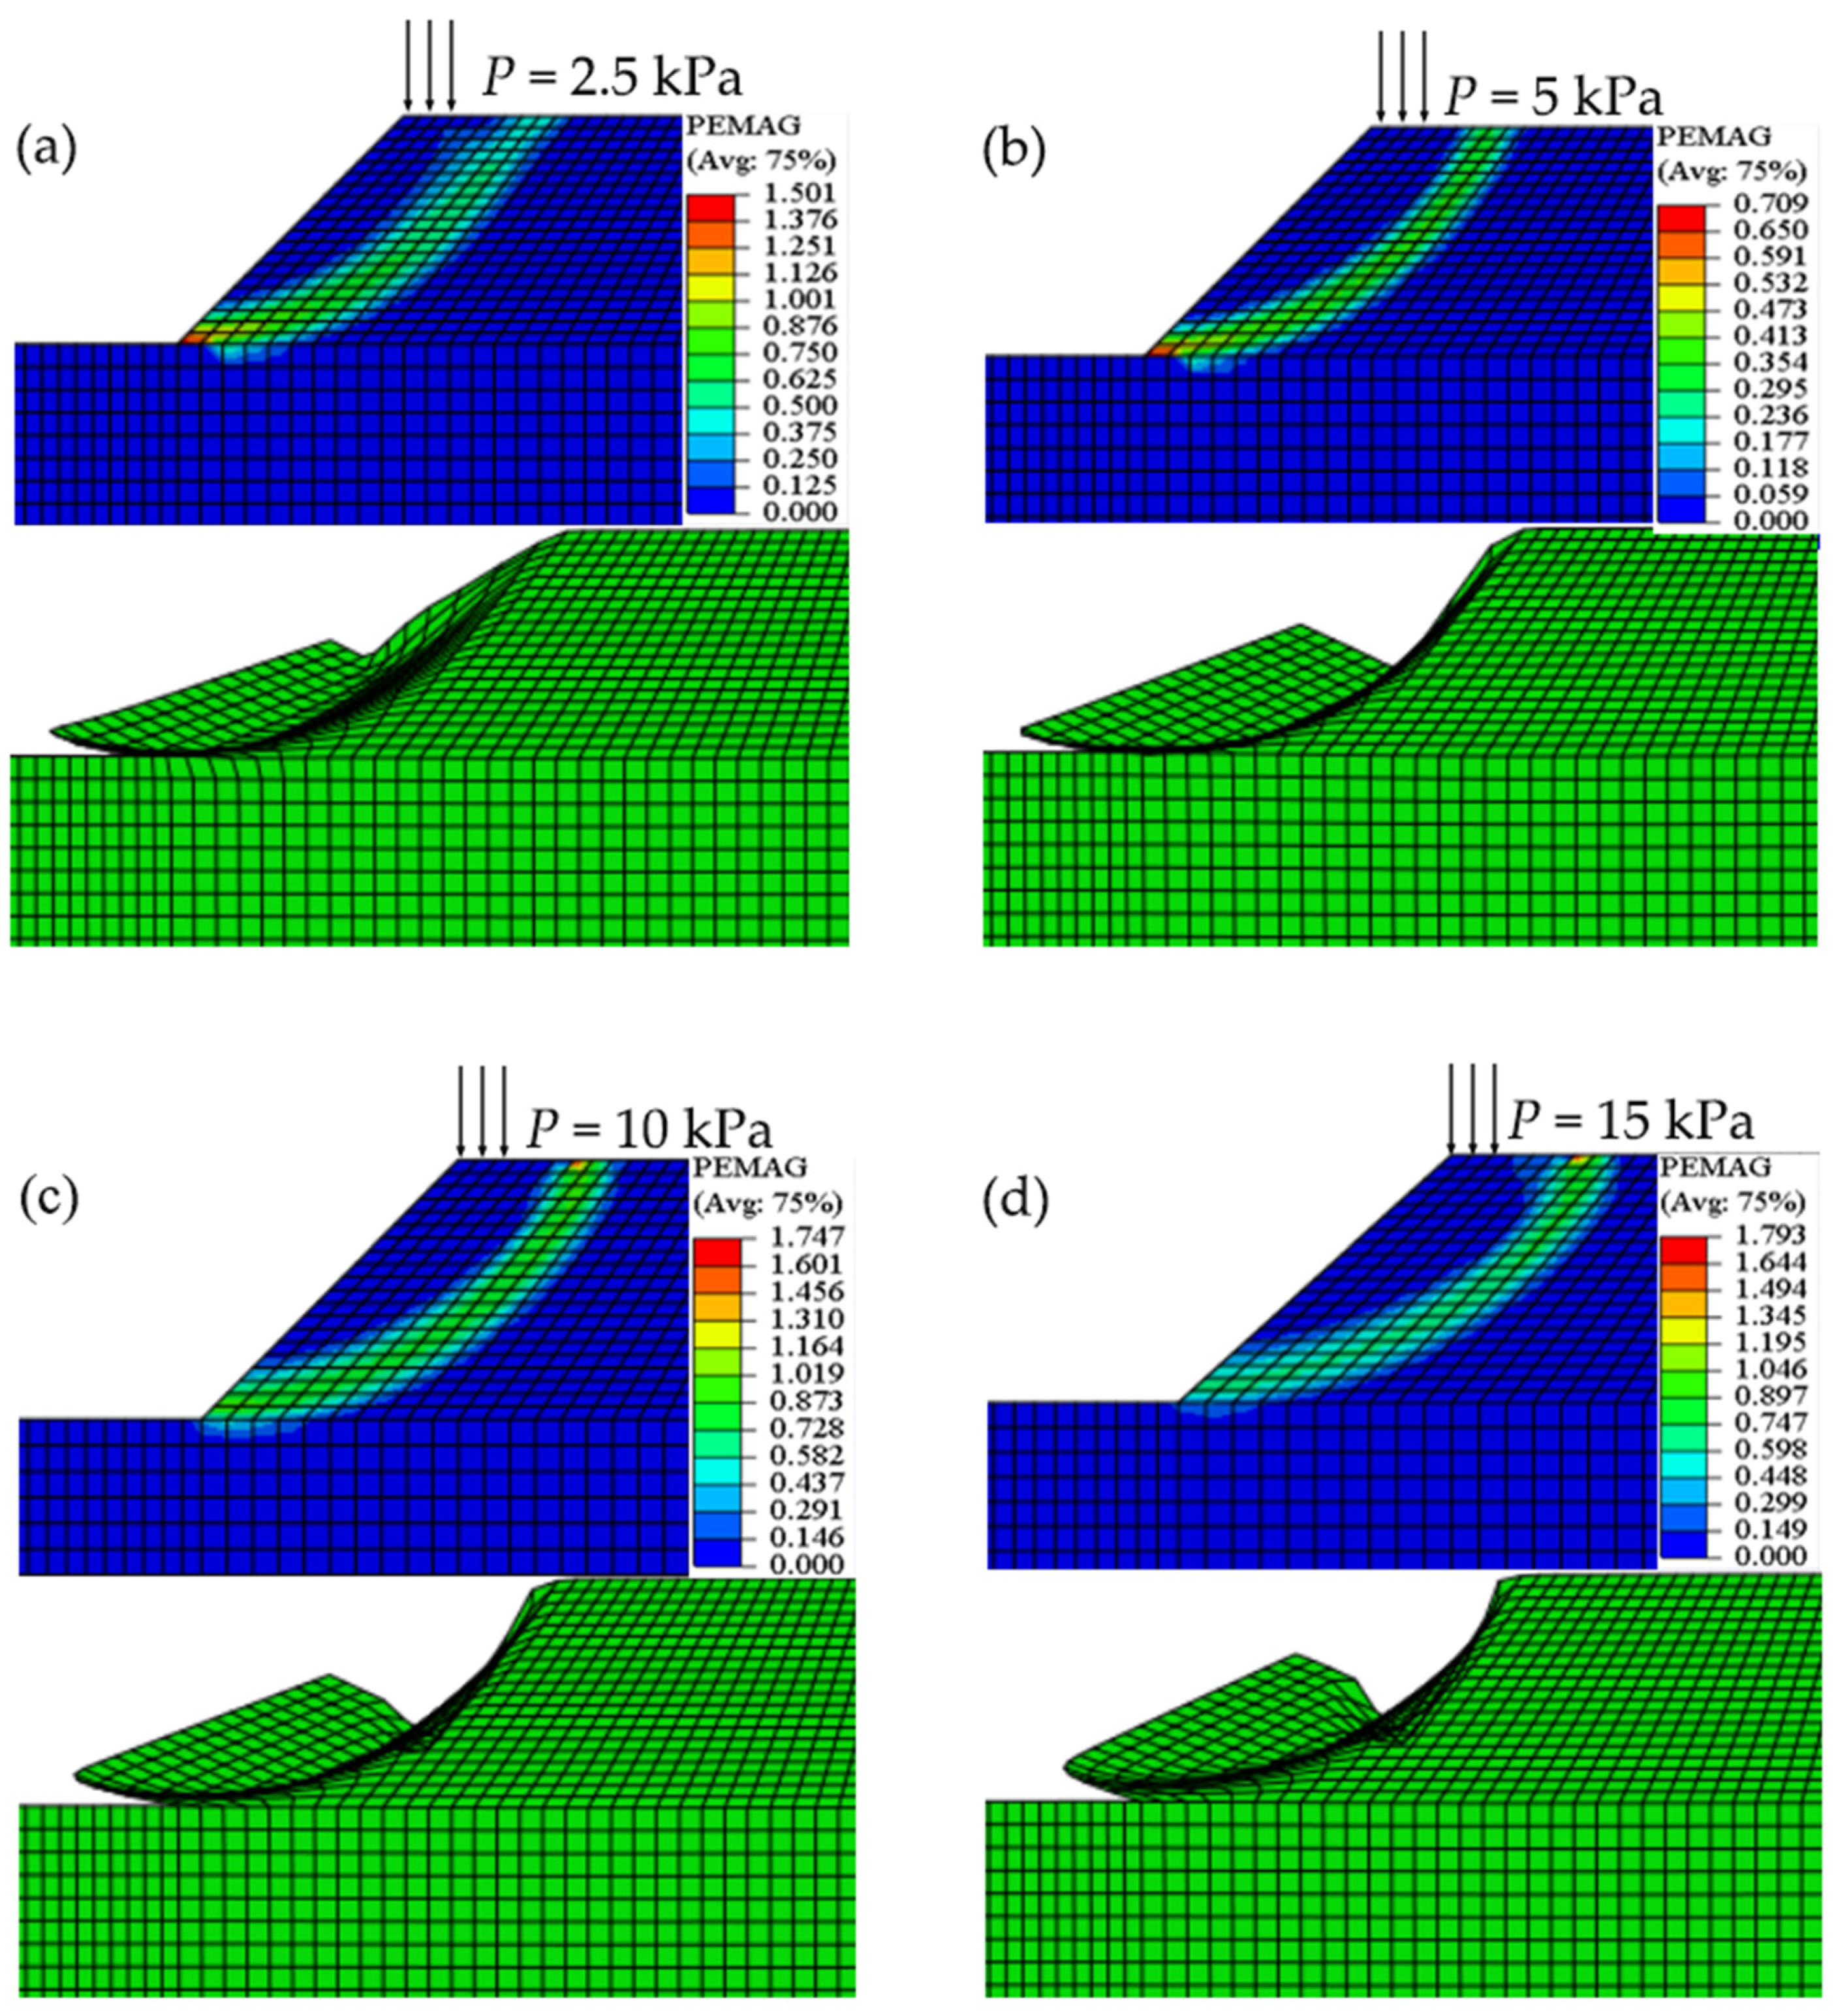
where m is the rover mass and g (1.63 m/s2) is the acceleration of gravity on the Moon. Using the wheel sinkage z (0.78 m) from Tang (2020) [31], the load pressure P is about 2.5 kPa. In a two-dimensional geometric model of a loaded soil slope, the contact points between the three wheels on the same side and the lunar regolith are loading positions, as shown by the arrows in Figure 8a.
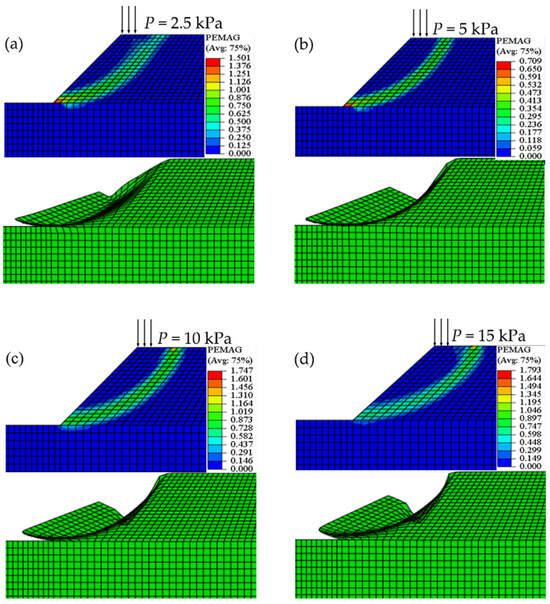
Figure 8.
Failure surfaces (shown in green–yellow–red) and mesh deformation of loaded soil slopes under load pressures of 2.5 kPa (a), 5 kPa (b), 10 kPa (c), and 15 kPa (d), the black arrows indicate the loading model.
3.2.1. Slope Stability Analysis Using Different Loading Pressures
Firstly, the stability of a loaded soil slope of an impact crater with different load pressures was discussed. A two-dimensional geometric model is established of the loaded soil slope of an impact crater, in which Poisson’s ratio is 0.47, the elastic modulus is 10 MPa, the cohesion (c) is 6 kPa, the internal friction angle (φ) is 30°, the slope angle (β) is 45°, and the slope height (H) is 10 m. Assuming the front wheels of the Yutu-2 rover stop on the top of the slope, the FoS is calculated at load pressures of 2.5 kPa, 5 kPa, 10 kPa, and 15 kPa, respectively (Table 2).
Table 2.
FoS for different load pressures and load positions.
The FoS is lower when the load pressure is increased, indicating the slope tends toward instability (Table 2). The failure surfaces of loaded soil slopes under different load pressures are shown in Figure 8. The maximum strain in the plastic zone shifts from the toe of the slope toe to the loading position, while increasing the load pressure. Meanwhile, the top of the slope is damaged more severely, causing subsidence of the slope shoulder.
3.2.2. Slope Stability Analysis Using Different Loading Positions
In this section, the stability of loaded soil slopes in impact craters for different loading positions is discussed, which are defined as the distance between the front wheels of the rover and the top of the slope in an impact crater. A two-dimensional geometric model is established of a loaded soil slope, in which Poisson’s ratio is 0.47, the elastic modulus is 10 MPa, the cohesion (c) is 6 kPa, the internal friction angle (φ) is 30°, the slope angle (β) is 45°, the slope height (H) is 10 m, and the load pressure (P) of the Yutu-2 rover is 2.5 kPa. The FoS is calculated at loading positions of 0 m, 3 m, and 6 m, respectively (Table 2).
As the rover moves away from the top of the slope, the FoS is higher, and the slope is more stable (Table 2). Meanwhile, the failure point on the shoulder moves away from the top of the slope, which causes subsidence of the failure surface and an increase in the landslide volume (Figure 9).
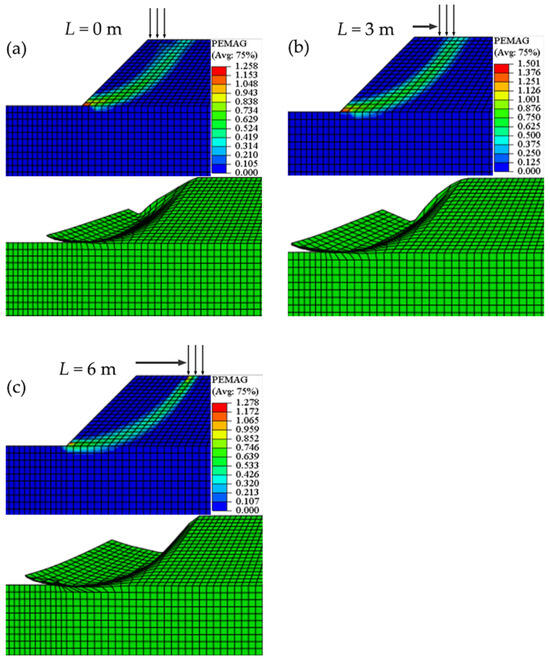
Figure 9.
Failure surfaces (shown in green–yellow–red) and mesh deformation of loaded soil slopes, with loading positions of 0 m (a), 3 m (b), and 6 m (c), the black arrows indicate the loading model.
4. Soil Mechanical Properties Estimation of a Soil Slope Adjacent to the Traverse Path of the Chang’E-4 Yutu-2 Rover
The Chang’E-4 mission landed in the Von Kármán crater on the far side of the Moon on 3 January 2019 [32]. Most of the landing area is flat, with a slope less than 15° [28]. Without a dedicated payload on the Yutu-2 rover, it is hard to directly obtain the soil shear strength of the flat area. However, we can establish a two-dimensional geometric model of the slope of a real lunar impact crater in the portal area of the Yutu-2 rover and estimate the lower limits of the cohesion and internal friction angle of the lunar soils.
The Chang’E-4 landing area and the traverse path of the Yutu-2 rover are shown in Figure 10a. There are fresh craters with sharp rim structures and highly degraded craters that are nearly beyond recognition. We selected a soil slope with a flat shoulder in a crater adjacent to the traverse path (Figure 10b), with a slope angle of 18.4° and a height of 2 m. A two-dimensional geometric model is established of the soil slope, in which Poisson’s ratio is 0.47, the elastic modulus is 10 MPa, the load pressure P of the Yutu-2 rover is 2.5 kPa, and the loading position is 0 m (Figure 10c).
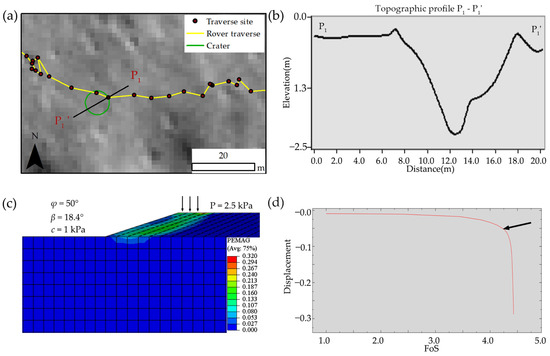
Figure 10.
(a) The Yutu-2 rover’s traverse path map, with a center coordinate of 177°34′E, 45°27′S. The base map can be downloaded from https://wms.lroc.asu.edu/lroc/view_lroc/LRO-L-LROC-3-CDR-V1.0/M1303619844LC (accessed on 28 December 2021). (b) Topographic profile of P1-P1’. (c) Failure surfaces’ (shown in green–yellow–red) plastic cloud, the black arrows indicate the loading model and (d) schematic diagram of relationship between feature point displacement and FoS, the black arrow indicates the turning point of displacement.
Based on the best estimates of the Apollo model [25], the internal friction angles of lunar soils range from 30° to 50°, and the cohesion of lunar soils is from 0.1 kPa to 1 kPa. Therefore, the stability of a soil slope with internal friction angles φ of 30°, 40°, and 50° and a cohesion c of 0.3 kPa, 0.5 kPa, and 1 kPa, will be discussed. As shown in Table 3, the FoS derived from these parameter values are all greater than 1, indicating that the Yutu-2 rover can pass by the slope safely, like in real situations.
Table 3.
FoS with the friction angle and cohesion of instability (φ′ and c′) for different friction angles (c) and levels of cohesion (φ).
In our model, the closer the initial value is set to the real situation, the closer the simulated result is to the real situation when the slope is unstable, and the more likely a relatively small range in the lower limit value of the internal friction angle can be obtained. Guo et al. showed that the Chang’E-4 landing site has the same bulk chemical composition in the regolith (i.e., FeO and Th) as the Apollo 15 soil, among the Apollo and Luna mission regolith samples [33,34,35]. Tang et al. also suggested that the Chang’E-4 landing site has greater soil strength and is close to the Apollo 15 landing site in this regard [31]. In the Apollo 15 missions, self-recording penetrometer (SRP) measurement and simulation studies indicated that higher cohesion should apply to higher internal friction angles; for example, the cohesion would have to be 1 kPa for a friction angle of 50° [25]. It can be seen in Figure 10d that the FoS is 4.524 at the turning point of feature point displacement. Table 3 shows that at this initial value, when the slope fails, the cohesion is 0.235 kPa, and the angle of internal friction is 15.658°. Both values, as two lower limits, are far lower than the Apollo 15 soil values. As a highly degraded impact crater, the impact crater has a small slope angle and height, which may lead to the stability of the slope.
5. Stability Analysis of Loaded Slopes in Potential Landing Regions of the Lunar South Pole
Recently, several lunar exploration missions have been planned to investigate the permanently shadowed regions in the southern polar regions, such as NASA’s Artemis and the Chinese Chang’E-7 missions. The Artemis I mission plans to land around the lunar South Pole in 2024, for which a total of 13 candidate landing regions have been selected along the rims and exterior regions of impact craters, namely, the Faustini, Shackleton, de Gerlache, Kocher, Haworth, Malapert, Nobile, and Amundsen craters [36]. Zhang et al. (2020) proposed 10 candidate landing areas located in four craters (the Shackleton, Haworth, Shoemaker, and Cabeus craters) [37]. As case studies, two slopes located at the Shackleton and Shoemaker craters were selected to evaluate their stability, the results of which can be used in future lunar polar exploration missions.
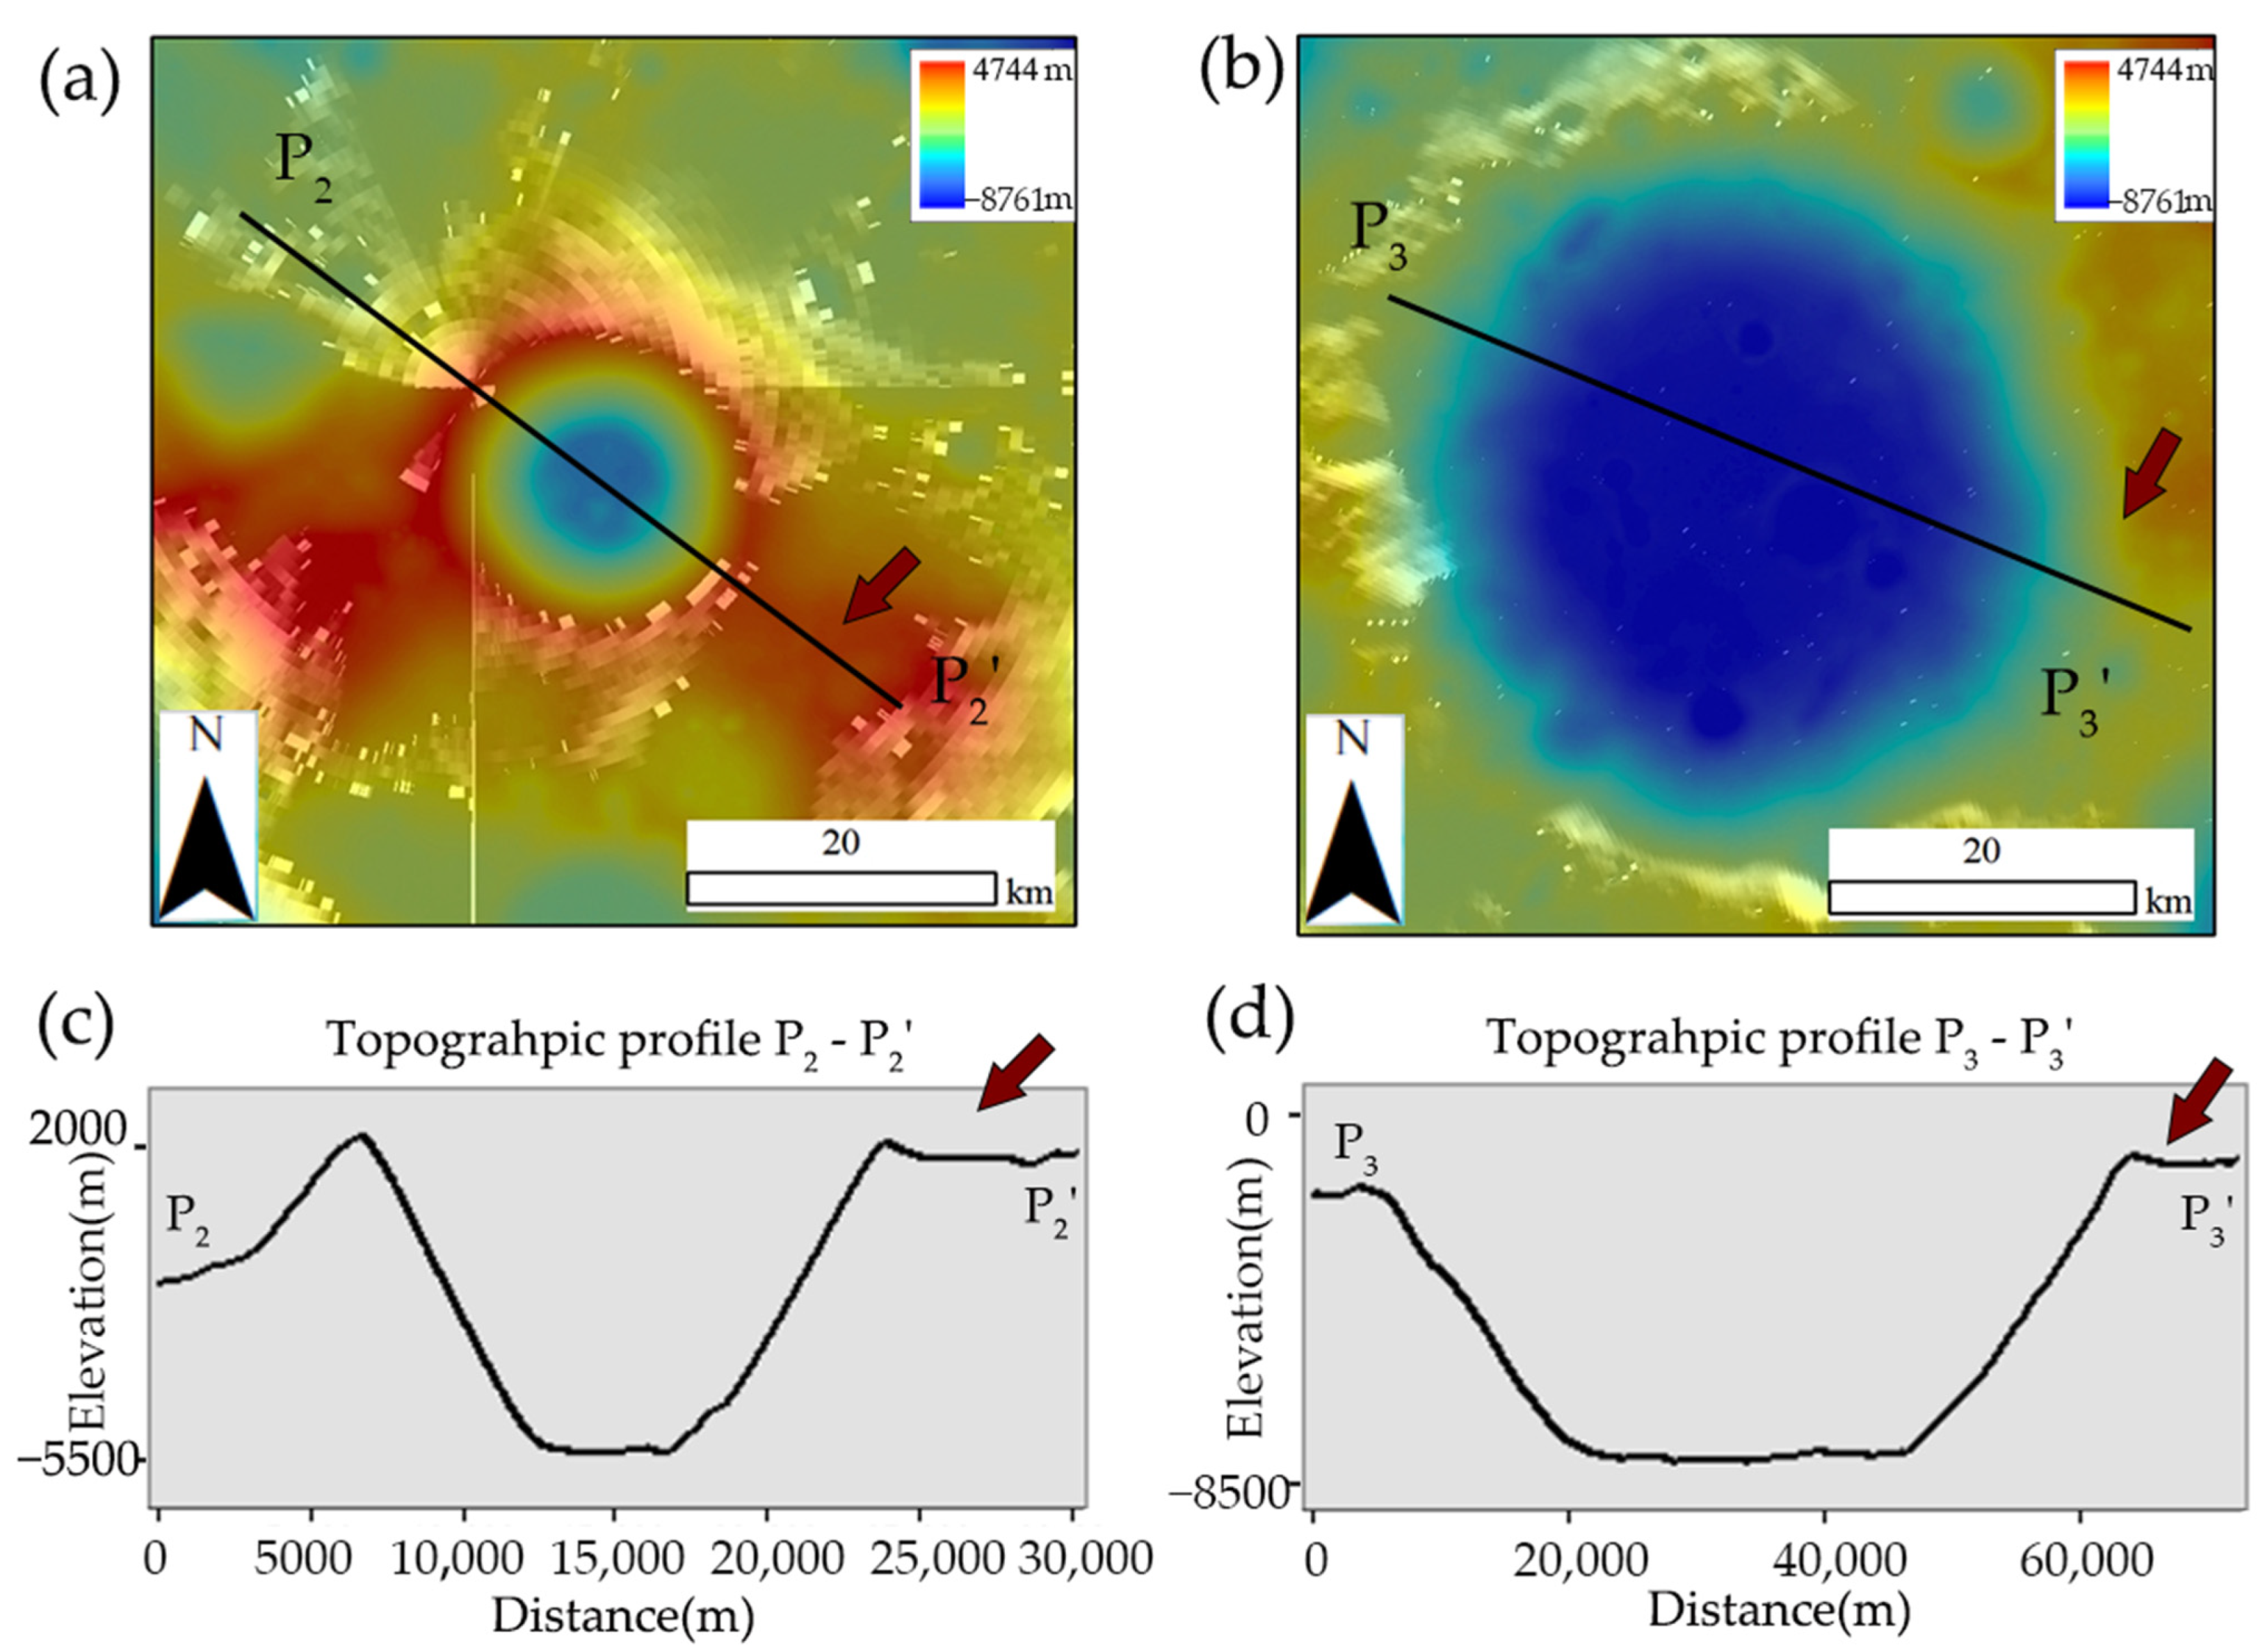
For a lunar mission landing at the Shackleton and Shoemaker craters, continuous solar illumination is needed to provide an energy supply and to maintain a suitable thermal environment. Therefore, flat areas on crater rims are preferred candidate landing sites, as they are higher than the surrounding terrain and are safe for landing [4]. The two slopes selected for stability analysis are adjacent to flat crater rims, as shown in Figure 11. However, the two craters have a diameter of more than 10 km and a depth of more than 5 km. Due to the limited research on the structure of lunar regolith at the lunar South Pole, we have made a reasonable assumption that the slope height of the models is 10 m based on the previous studies that large impact craters have thicker lunar regolith.

Figure 11.
(a) The base map is the WAC_morphology_globe_June2013_dd0_100m from LOLA, and the elevation data are also from LRO NAC DEM. The area is the Shackleton crater, with central coordinates of 128.5°E and 89.3°S. The base map in (b) has the same data source, and the area is the Shoemaker crater, with the central coordinates of 45.1°E and 88.5°S. (c) is the topographic profiles of P2-P2′, and (d) is the topographic profiles of P3-P3′. The red arrows indicate the crater slopes we selected.
In the flat area on the rim of the Shackleton crater, the slope angle is 45°, as calculated using the topographic profile in Figure 11c. A two-dimensional geometric model of the soil slope is established, in which Poisson’s ratio is 0.47, the elastic modulus is 10 MPa, the cohesion c is 6 kPa, and the internal friction angle φ is 30°. The load pressure, increasing from 1.5 kPa to 9.0 kPa, is applied at three positions, separated by a distance of 1.5 m. The resulting FoS lookup table is shown in Table 4. For instance, the slope can hold its stability when the lunar soil cohesion is greater than 2.673 kPa and the internal friction angle is greater than 14.430°, as the load pressure is 1.5 kPa. As the load pressure increases, the factor of safety decreases, while the corresponding critical cohesion and internal friction angle increase.
Table 4.
FoS with the friction angle (φ′) and cohesion (c′) of instability for different loading pressures at the Shackleton crater.
In the flat area on the rim of the Shoemaker crater, the slope angle is 26.6°, as calculated using the topographic profile in Figure 11d. A two-dimensional geometric model of the soil slope is established, in which Poisson’s ratio is 0.47, the elastic modulus is 10 MPa, the cohesion c is 2 kPa, and the internal friction angle φ is 30°. The load pressure, increasing from 1.5 kPa to 9.0 kPa, is applied at three positions, separated by a distance of 1.5 m. The resulting FoS lookup table is shown in Table 5. For instance, the slope can stabilize when the lunar soil cohesion is greater than 0.996 kPa, and the internal friction angle is greater than 16.042°, as the load pressure is 1.5 kPa. As the load pressure increases, the FoS decreases, while the corresponding critical cohesion and internal friction angle increase.
Table 5.
FoS with the friction angle (φ′) and cohesion (c′) of instability for different loading pressures at the Shoemaker crater.
As can be seen in the two tables, the internal friction angle of the two crater slopes in the critical state is within 14–16°, while the internal friction angle of the previous exploration to the Moon is in the range of 25° to 50° [25]. Further, the cohesion of the two crater slopes in the critical state is within 1–3 kPa, while the estimates of the cohesion are 0.1–2 kPa using data from the Apollo and Lunokhod missions [25]. In this case, the cohesion of the lunar soil at the landing sites must be a higher value to maintain slope stability. Existing studies on the lunar surface show that the regolith has low cohesion and high friction angles, but different water ice contents and lunar soil particle compositions at the lunar South Pole have different effects on the slope stability of the impact crater. In future studies, we will add more details on the load sequence and lunar soil simulation and conduct a 3D model simulation, so as to more accurately simulate the impact of exploration missions on the lunar surface.
6. Conclusions
Future rovers patrolling the rim of the lunar South Pole to detect water ice could face more difficulties than the Chang’E-4 mission. In this study, we evaluate landing safety in the candidate landing area based on remote sensing data, using the finite element method. We conclude the following:
- (1)
- With the increase in slope angle and slope height, the slope tends to be unstable. With the increase in cohesion and the internal friction angle of lunar soil, the slope becomes more stable. The analysis results of the soil slope model under load conditions show that the soil slope tends to be unstable with the increase in load pressure. When the rover is in different positions, the further the rover is from the top of the slope, the more stable the slope.
- (2)
- The model result based on the true soil slope adjacent to the traverse path shows that the rover can pass by the slope safely, which is consistent with the facts. This provides a basis for the application of the FEM on the Moon. The calculated cohesion and internal friction angles, as two lower limits, are far lower than the Apollo 15 soil values. As a highly degraded impact crater, the impact crater has a small slope angle and height, which may lead to the stability of the slope.
- (3)
- Two-dimensional loaded models based on the Shoemaker and Shackleton craters were established and FoS lookup tables were created. Based on the FoS lookup tables for the Shoemaker and Shackleton crater slopes, the ultimate shear strength of the soil under different load pressures can be found. These will help to better assess the safety of future missions to explore the Moon. In addition, a higher level of cohesion of the lunar soil at the landing site is more conducive to maintaining the stability of the slope.
Author Contributions
Conceptualization, B.L. and J.Z.; methodology, B.L. and Y.H.; software, Y.H., S.C. and J.Z.; validation, S.C.; resources, S.C.; writing—original draft preparation, Y.H. and J.Z.; writing—review and editing, B.L. and S.C.; project administration, B.L.; funding acquisition, S.C. All authors have read and agreed to the published version of the manuscript.
Funding
This work is supported by the National Key Research and Development Project (2019YFE0123300, 2022YFF0711400, 2022YFF0503100), the National Natural Science Foundation (42372277, 41772346), the Shandong Provincial Natural Science Foundation (ZR2023MD010), and the Strategic Leading Science and Technology Special Project of the Chinese Academy of Sciences (XDB41000000).
Data Availability Statement
The NAC and WAC images used in this paper are available at https://wms.lroc.asu.edu/lroc (accessed on 28 December 2021).
Acknowledgments
The efforts by the science and engineering teams behind all the datasets used in this study, particularly the LRO mission and NAC and WAC instruments, are gratefully acknowledged.
Conflicts of Interest
The authors declare no conflicts of interest.
References
- Nozette, S.; Lichtenberg, C.L.; Spudis, P.; Bonner, R.; Ort, W.; Malaret, E.; Robinson, M.; Shoemaker, E.M. The Clementine bistatic radar experiment. Science 1996, 274, 1495–1498. [Google Scholar] [CrossRef]
- Feldman, W.C.; Maurice, S.; Binder, A.B.; Barraclough, B.L.; Elphic, R.C.; Lawrence, D.J. Fluxes of fast and epithermal neutrons from lunar prospector: Evidence for water ice at the lunar poles. Science 1998, 281, 1496–1500. [Google Scholar] [CrossRef] [PubMed]
- Ivanov, M.A.; Abdrakhimov, A.M.; Basilevsky, A.T.; Demidov, N.E.; Guseva, E.N.; Head, J.W.; Hiesinger, H.; Kohanov, A.A.; Krasilnikov, S.S. Geological characterization of the three high-priority landing sites for the Luna-Glob mission. Planet. Space Sci. 2018, 162, 190–206. [Google Scholar] [CrossRef]
- Mazarico, E.; Neumann, G.A.; Smith, D.E.; Zuber, M.T.; Torrence, M.H. Illumination conditions of the lunar polar regions using LOLA topography. Icarus 2011, 211, 1066–1081. [Google Scholar] [CrossRef]
- Zhang, L.; Li, J.; Zeng, Z.; Xu, Y.; Liu, C.; Chen, S. Stratigraphy of the Von Kármán Crater Based on Chang’E-4 Lunar Penetrating Radar Data. Geophys. Res. Lett. Geophys. Res. Lett. 2020, 47, e2020GL088680. [Google Scholar] [CrossRef]
- Kokelaar, B.P.; Bahia, R.S.; Joy, K.H.; Viroulet, S.; Gray, J.M.N.T. Granular avalanches on the Moon: Mass-wasting conditions, processes, and features. J. Geophys. Res. Planets 2017, 122, 1893–1925. [Google Scholar] [CrossRef]
- Senthil Kumar, P.; Keerthi, V.; Senthil Kumar, A.; Mustard, J.; Gopala Krishna, B.; Amitabh; Ostrach, L.R.; Kring, D.A.; Kiran Kumar, A.S.; Goswami, J.N. Gullies and landslides on the Moon: Evidence for dry-granular flows. J. Geophys. Res. Planets 2013, 118, 206–223. [Google Scholar] [CrossRef]
- Xiao, Z.; Zeng, Z.; Ding, N.; Molaro, J. Mass wasting features on the Moon—How active is the lunar surface? Earth Planet. Sci. Lett. 2013, 376, 1–11. [Google Scholar] [CrossRef]
- Robinson, M.S.; Brylow, S.M.; Tschimmel, M.; Humm, D.; Lawrence, S.J.; Thomas, P.C.; Denevi, B.W.; Bowman-Cisneros, E.; Zerr, J.; Ravine, M.A.; et al. Lunar Reconnaissance Orbiter Camera (LROC) Instrument Overview. Space Sci. Rev. 2010, 150, 81–124. [Google Scholar] [CrossRef]
- Di, K.; Zhu, M.H.; Yue, Z.; Lin, Y.; Wan, W.; Liu, Z.; Gou, S.; Liu, B.; Peng, M.; Wang, Y.; et al. Topographic Evolution of Von Kármán Crater Revealed by the Lunar Rover Yutu-2. Geophys. Res. Lett. 2019, 46, 12764–12770. [Google Scholar] [CrossRef]
- Scott, C.R. An Introduction to Soil Mechanics and Foundations, 3rd ed.; Chapman & Hall: Boca Raton, FL, USA, 1994. [Google Scholar]
- Bishop, A.W. The use of the Slip Circle in the Stability Analysis of Slopes. Geotechnique 1955, 5, 7–17. [Google Scholar] [CrossRef]
- Zienkiewicz, O.C.; Humpheson, C.; Lewis, R.W. Associated and non-associated visco-plasticity and plasticity in soil mechanics. Geotechnique 1975, 25, 671–689. [Google Scholar] [CrossRef]
- Potts, D.M.; Zdravkovic, L. Finite Element Analysis in Geotechnical Engineering Application; Thomas Telford: London, UK, 2001. [Google Scholar]
- Dawson, E.M.; Roth, W.H.; Drescher, A. Slope stability analysis by strength reduction. Geotechnique 1999, 49, 835–840. [Google Scholar] [CrossRef]
- Tschuchnigg, F.; Schweiger, H.F.; Sloan, S.W. Slope stability analysis by means of finite element limit analysis and finite element strength reduction techniques. Part II: Back analyses of a case history. Comput. Geotech. 2015, 70, 178–189. [Google Scholar] [CrossRef]
- Jiang, T.; He, T.; Liu, C.; Li, L. Soil deformation under cyclic horizontal load in sand: Insights from experiments. J. Eng. Res. 2023, in press. [Google Scholar] [CrossRef]
- Xia, C.; Shi, Z.; Li, B.; Liu, M. A discontinuous smooth particle hydrodynamics method for modeling deformation and failure processes of fractured rocks. J. Rock Mech. Geotech. Eng. 2023, in press. [Google Scholar] [CrossRef]
- Harnett, C.E.; Watson, R.A.; Holohan, E.P.; Schöpfer, M.P.J. Collapse caldera walls: Mechanical controls on slope failure and morphology. J. Volcanol. Geotherm. Res. 2023, 442, 107893. [Google Scholar] [CrossRef]
- Yang, Z.; Cheng, X. High fill slope collapse: Stability evaluation based on finite element limit analyses. Transp. Geotech. 2024, 44, 101156. [Google Scholar] [CrossRef]
- Xu, C.; Liu, Q.; Tang, X.; Sun, L.; Deng, P.; Liu, H. Dynamic stability analysis of jointed rock slopes using the combined finite-discrete element method (FDEM). Comput. Geotech. 2023, 160, 105556. [Google Scholar] [CrossRef]
- Huang, P.-C. An innovative partition method for predicting shallow landslides by combining the slope stability analysis with a dynamic neural network model. Catena 2022, 217, 106480. [Google Scholar] [CrossRef]
- Bart, G.D.; Nickerson, R.D.; Lawder, M.T.; Melosh, H.J. Global survey of lunar regolith depths from LROC images. Icarus 2011, 215, 485–490. [Google Scholar] [CrossRef]
- Li, C.; Su, Y.; Pettinelli, E.; Xing, S.; Ding, C.; Liu, J.; Ren, X.; Lauro, S.E.; Soldovieri, F.; Zeng, X.; et al. The Moon’s farside shallow subsurface structure unveiled by Chang’E-4 Lunar Penetrating Radar. Sci. Adv. 2020, 6, eaay6898. [Google Scholar] [CrossRef] [PubMed]
- Heiken, G.H.V.; David, T.; French, B.M. Lunar Sourcebook, a User’s Guide to the Moon; Cambridge University Press: Cambridge, UK, 1991. [Google Scholar]
- Qiao, L.; Ling, Z.; Fu, X.; Li, B. Geological characterization of the Chang’e-4 landing area on the lunar farside. Icarus 2019, 333, 37–51. [Google Scholar] [CrossRef]
- Qian, Y.; Xiao, L.; Yin, S.; Zhang, M.; Zhao, S.; Pang, Y.; Wang, J.; Wang, G.; Head, J.W. The regolith properties of the Chang’e-5 landing region and the ground drilling experiments using lunar regolith simulants. Icarus 2020, 337, 113508. [Google Scholar] [CrossRef]
- Wu, B.; Li, F.; Hu, H.; Zhao, Y.; Wang, Y.; Xiao, P.; Li, Y.; Liu, W.C.; Chen, L.; Ge, X.; et al. Topographic and Geomorphological Mapping and Analysis of the Chang’E-4 Landing Site on the Far Side of the Moon. Photogramm. Eng. Remote Sens. 2020, 86, 247–258. [Google Scholar] [CrossRef]
- Xiao, Z.; Ding, C.; Xie, M.; Cai, Y.; Cui, J.; Zhang, K.; Wang, J. Ejecta from the Orientale Basin at the Chang’E-4 Landing Site. Geophys. Res. Lett. 2021, 48, e2020GL090935. [Google Scholar] [CrossRef]
- Zhang, J.; Zhou, B.; Lin, Y.; Zhu, M.-H.; Song, H.; Dong, Z.; Gao, Y.; Di, K.; Yang, W.; Lin, H.; et al. Lunar regolith and substructure at Chang’E-4 landing site in South Pole–Aitken basin. Nat. Astron. 2020, 5, 25–30. [Google Scholar] [CrossRef]
- Tang, Z.; Liu, J.; Wang, X.; Ren, X.; Chen, W.; Yan, W.; Zhang, X.; Tan, X.; Zeng, X.; Liu, D.; et al. Physical and Mechanical Characteristics of Lunar Soil at the Chang’E-4 Landing Site. Geophys. Res. Lett. 2020, 47, e2020GL090935. [Google Scholar] [CrossRef]
- Liu, J.; Ren, X.; Yan, W.; Li, C.; Zhang, H.; Jia, Y.; Zeng, X.; Chen, W.; Gao, X.; Liu, D.; et al. Descent trajectory reconstruction and landing site positioning of Chang’E-4 on the lunar farside. Nat. Commun. 2019, 10, 4229. [Google Scholar] [CrossRef]
- Guo, D.; Fa, W.; Zeng, X.; Du, J.; Liu, J. Geochemistry of the Von Kármán crater floor and thickness of the non-mare ejecta over the Chang’e-4 landing area. Icarus 2021, 359, 114327. [Google Scholar] [CrossRef]
- Hou, J.; Li, L.; Li, S. Analysis of Topography and Composition of the Von Kármán Impact Crater. IOP Conf. Ser. Earth Environ. Sci. 2021, 658, 012049. [Google Scholar] [CrossRef]
- Lai, J.; Xu, Y.; Zhang, X.; Xiao, L.; Yan, Q.; Meng, X.; Zhou, B.; Dong, Z.; Zhao, D. Comparison of Dielectric Properties and Structure of Lunar Regolith at Chang’e-3 and Chang’e-4 Landing Sites Revealed by Ground-Penetrating Radar. Geophys. Res. Lett. 2019, 46, 12783–12793. [Google Scholar] [CrossRef]
- Around the Moon with NASA’s First Launch of SLS with Orion. Available online: https://www.nasa.gov/missions/artemis/around-the-moon-with-nasas-first-launch-of-sls-with-orion/ (accessed on 17 July 2022).
- Zhang, H.; Du, Y.; Li, F.; Zhang, H.; Ma, J.; Sheng, L.; Wu, K. Proposals for lunar south polar region soft landing sites selection. J. Deep Space Explor. 2020, 7, 232–240. [Google Scholar] [CrossRef]


Disclaimer/Publisher’s Note: The statements, opinions and data contained in all publications are solely those of the individual author(s) and contributor(s) and not of MDPI and/or the editor(s). MDPI and/or the editor(s) disclaim responsibility for any injury to people or property resulting from any ideas, methods, instructions or products referred to in the content. |
© 2024 by the authors. Licensee MDPI, Basel, Switzerland. This article is an open access article distributed under the terms and conditions of the Creative Commons Attribution (CC BY) license (https://creativecommons.org/licenses/by/4.0/).