Abstract
Accurately predicting the condition rating of a bridge deck is crucial for effective maintenance and repair planning. Despite significant research efforts to develop deterioration models, the efficacy of Random Forest, eXtreme Gradient Boosting (XGBoost), and Artificial Neural Network (ANN) in predicting the condition rating of the nation’s bridge decks has remained unexplored. This study aims to assess the effectiveness of these algorithms for deck condition rating prediction at the national level. To achieve this, the study collected bridge data, which includes National Bridge Inventory (NBI), traffic, and climate regions gathered using Geospatial Information Science (GIS) and remote sensing techniques. Two datasets were collected: bridge data for a single year of 2020 and historical bridge data covering a five-year period from 2016 to 2020. Three models were trained using 319,404 and 1,246,261 bridge decks in the single-year bridge data and the five-year historical bridge data, respectively. Results show that the use of historical bridge data significantly improves the performance of the models compared to the single-year bridge data. Specifically, the Random Forest model achieved an overall accuracy of 83.4% and an average F1 score of 79.7%. In contrast, the XGBoost model achieved an overall accuracy of 79.4% and an average F1 score of 77.5%, while the ANN model obtained an overall accuracy of 79.7% and an average F1 score of 78.4%. Permutation-based variable importance reveals that NBI, traffic, and climate regions significantly contribute to model development. In conclusion, the Random Forest, XGBoost, and ANN models, trained using updated historical bridge data, provide useful tools for accurately predicting the condition rating of bridge decks in the United States, allowing infrastructure managers to efficiently schedule inspections and allocate maintenance resources.
1. Introduction
Bridges are critical infrastructures in the U.S. transportation system that make movement possible between different geographical areas [1], and their performance affects the operating capacity of the system in terms of safety, efficiency, and economy [2]. According to the annual analysis by the American Road and Transportation Builders Association (ARTBA), 36% or nearly 224,000 of the nation’s bridges, encompassing deck, superstructure, and substructure components, need structural repair, rehabilitation, or replacement [3]. However, they still serve more than 167.5 million daily trips across the country. If placed end-to-end, these bridges stretch over 6100 miles, long enough to cross the country from Los Angeles to Portland, Maine and back again. A study by the American Society of Civil Engineers (ASCE) found that the average age of the nation’s bridges increased to 44 years. Most of the country’s bridges were designed for a life span of 50 years, so an increasing number of bridges will soon need major rehabilitation or retirement. Therefore, continuous planning of maintenance, repair, and rehabilitation is required to ensure public safety [4].
Typically, bridges located on public roads with lengths more than 6.1 m (20 feet) are visually inspected at least once every 2 years to monitor their deterioration, resulting in a very costly process of more than $2.7 billion per year [5]. However, the availability of historical bridge data and environmental data has presented unprecedented opportunities to develop deterioration models that accurately predict the future condition rating of a bridge. These models can assist infrastructure managers in scheduling inspections and making informed decisions regarding repair strategies [6,7]. There are various types of deterioration models such as deterministic, probabilistic, and artificial intelligence (AI) and machine learning (ML) models [7,8,9,10].
Deterministic models assume that the deterioration process is certain and do not account for random errors or uncertainty in their predictions [11,12]. In contrast, probabilistic models are used to capture the stochastic nature of bridge deterioration and are commonly applied when uncertain deterioration occurs due to random factors such as traffic loads, climate conditions, structural attributes, and material properties [13,14,15]. Markovian methods, which are widely used probabilistic models for the analysis of bridge deterioration [7,16,17], have been criticized for their memoryless nature. This assumption implies that the prediction of the future condition rating solely depends on the current condition rating and ignores its history [18]. In contrast, AI and ML models have been increasingly utilized to predict the future condition rating of bridges, surpassing the restrictions of deterministic and probabilistic models [19,20,21,22,23,24,25,26]. Deterioration models can be developed for either the entire bridge or its various components, such as deck, superstructure, and substructure. Nevertheless, researchers have paid more attention to the deck compared to other components due to its exposure to heavy traffic, varying temperatures, deicing salts, and abrasive forces [27,28].
To this end, Kong, Li, Zhang, and Das [22] demonstrated the ability of eXtreme Gradient Boosting (XGBoost) in binary classification of 152,714 bridge decks into young bridges with poor condition ratings and old bridges with good condition ratings, that achieved 91% overall accuracy. Similar overall accuracy was achieved by the XGBoost model when trained using 152,714 bridge decks. In a separate study, the historical National Bridge Inventory (NBI) and traffic data of Michigan bridges were utilized to develop ML models for predicting deck condition rating, and the k-nearest neighbors (KNN) model was the second optimal model, after Artificial Neural Network (ANN), with an overall accuracy of 89% [20]. Assaad and El-adaway [29] developed ANN and KNN models by studying 19,269 bridges in Missouri. The authors identified the best subset of ten predictor variables that affect the classification of deck condition rating and reported 91.44% accuracy obtained by the ANN model.
In 2021, a non-linear regression model was developed on Michigan bridge deck condition rating data over 25 years [30]. Deck age or the number of years since the last major reconstruction was the only parameter incorporated into the model. Then, the impact of Average Daily Traffic (ADT), age, and deck area on concrete bridge deck deterioration was evaluated using deterioration curves. Liu, Nehme, and Lu [31] employed deep learning models to estimate parameters within a Markov chain using maximum likelihood training. The likelihood function is based on observed transitions between different condition ratings. The authors applied this approach to historical NBI data spanning from 1993 to 2019. They utilized a Convolutional Neural Network (CNN) as the deep learning model and showcased its performance by achieving a low prediction error, with a maximum mean-squared-error near 0.5 in a 26-year forecast.
The impact of climate data on prediction performance of deterioration models was evaluated by Liu and El-Gohary [32]. To this end, 1078 bridge instances in nine states were incorporated to develop different ANN models, trained with and without climate data. The experimental results indicate the marginal positive effect of climate data on the prediction performance of deterioration models. In another study, Nguyen and Dinh [33] utilized Forward Neural Network (FNN) to predict the future deck condition rating of highway bridges in Alabama using eight predictor variables. Among the predictor variables, age had a significant effect on the ANN’s performance, followed by design load and main structure design. The results indicate that the obtained ANN model trained by 2572 bridges achieved an accuracy of 73.6%. Manafpour, Guler, Radlińska, Rajabipour, and Warn [34] analyzed 30 years of 22,000 bridges in Pennsylvania using a Semi-Markov time-based model and estimated the transition probabilities of those bridges for the deterioration of concrete bridge decks. The study found that the following predictor variables significantly influence the deck condition rating: type of rebar protection, continuous versus supported spans, deck length, number of spans, bridge location, and whether the bridge is part of the interstate system or not.
Radovic, Ghonima, and Schumacher [35] removed the effect of climate data by analyzing the 9809 concrete highway bridge decks located in the Northeast climate region using the clustering technique. In another study conducted for the Michigan Department of Transportation (MDOT), Winn and Burgueno [36] developed ANN models for predicting the deck condition rating of bridge decks using 1956 bridges in Michigan. By utilizing bridge condition data spanning from 2006 to 2010 from three transportation agencies, Bektas, Carriquiry, and Smadi [27] developed classification and regression trees (CARTs) to predict deck, substructure, and superstructure condition ratings. Deterioration curves of Nebraska bridges were developed using NBI condition ratings, spanning from 1998 to 2010, by Hatami and Morcous [37]. The authors placed 15,568 bridges in families based on predictor variables including structure type, deck type, wearing surface, deck protection, ADT, ADTT, functional classification, type of service, and highway agency district, and modeled the condition rating as a function of age only. One year earlier, Huang [9] developed an ANN model on 1241 bridges in Wisconsin to predict the condition rating of bridge decks. The model not only learns from NBI and traffic data such as design load, deck length, skew angle, maximum span length, and the number of spans, but also learns from climate data by introducing region divisions.
The regression methodology was adopted by Hong, Chung, Han, and Lee [38], which presented a model based on the deterioration rate for predicting the end of service life of concrete bridge decks. Individual regression models for 30 departments of transportation, containing 23,404 concrete bridge decks, were developed using age as the most correlated predictor variable with condition rating as the response variable. NBI and traffic data of concrete bridge decks in Quebec, Canada, and their associated regions were utilized to develop decision trees for modeling deck deterioration and evaluating their performance [39]. In another study, 18 predictor variables of a subset of 222 bridges in Kansas were used to examine the extent to which wrapper methods could improve the prediction accuracy of the decision tree algorithm for the application of bridge decks [40]. The experiments revealed that the bagged decision tree yielded a better accuracy of 73.4% compared to 67.7% obtained from the decision tree. The evaluation indicates a slight increment in the prediction accuracy over the Markov chain developed using the same dataset. Morcous, Rivard, and Hanna [11] applied an AI technique to the real-world data from 521 bridges obtained from the Canadian Province of Quebec. The developed case-based reasoning (CBR) application in considering the effects of NBI and traffic data along with regions yielded 70% correctness.
Despite extensive research efforts to develop accurate predictive models for bridge deck deterioration, the effectiveness of Random Forest, XGBoost, and ANN in predicting the condition rating of the nation’s bridge decks has remained unexplored. This gap in exploration is primarily attributed to the fact that existing models have been trained using a relatively small sample of bridge decks, mainly from one state, which may not be representative of the entire population of over 460,000 bridge decks in the United States. Therefore, this study contributes to the body of knowledge by assessing how well the Random Forest, XGBoost, and ANN algorithms perform in classifying the condition rating of the nation’s bridge decks. Conducting a nationwide investigation is crucial due to significant variations of bridge deck characteristics, climate, and traffic across the United States. This investigation enables the study to effectively identify influential variables essential for developing national predictive models. The subsequent sections of this study outline the research methodology, including data preparation, model development and evaluation, as well as the results obtained from the training and evaluation of models. This study reports outcomes from two experiments, each involving the development of three models using two distinct datasets: the bridge data of 2020 and the five-year historical bridge data (2016–2020). Subsequently, the models are compared, and the findings are discussed. Finally, this study provides concluding remarks, and offers recommendations for further research.
2. Research Methodology
This study employed a three-step research methodology:
- Data preparation: This study developed two sets of national bridge data by incorporating NBI, traffic, and climate regions. One dataset is for the year 2020 and another encompasses five years (2016–2020) of historical bridge data.
- Model development and evaluation: Each dataset was preprocessed and divided into an 80% training set and a 20% test set. Subsequently, three models including Random Forest, XGBoost, and ANN were trained and evaluated based on overall accuracy and average F1 score on the test set. To address the imbalance in bridge deck condition rating across ten categories, separate F1 scores were computed for each condition rating to comprehensively assess models’ performance. Meanwhile, a permutation-based approach was employed to identify important features, among NBI, traffic, and climate regions, for development of the ML models.
- Model selection and discussion: The effectiveness of the developed models was examined using training time, overall accuracy, and average F1 score.
3. Data Preparation
The bridge data in the United States were developed through several essential steps. First, NBI, including traffic data, was collected and only the potential predictor variables influencing deterioration were retained. Second, bridges were spatially located using latitude and longitude information provided in the NBI data, and their locations were verified using remote sensing technology. Finally, the appropriate climate region was assigned to each bridge using its location by Geospatial Information Science (GIS) technology. The following subsections provide a detailed description of bridge data development. By following the same procedure, bridge data in one year can be established and by including multiple bridge data, historical bridge data can be developed.
3.1. NBI and Traffic Data Collection
The annually submitted NBI data comprises a considerable amount of information about the United States’ bridge network. It contains 116 coded items to describe each bridge, including basic design information, current service, condition ratings, etc. [41]. Table 1 represents the description of a bridge deck in different condition ratings.

Table 1.
The description of a bridge deck in different condition ratings.
Out of 35 potential predictor variables of NBI data, which were initially selected based on existing studies [29,32,33,34,36,39,42], only 19 variables were retained using engineering judgments. Table 2 lists the identified NBI predictor variables. It is worth noting that the NBI and traffic data were collected from the U.S. Department of Transportation website [43].

Table 2.
The identified NBI predictor variables.
As can be seen in Table 2, the five following predictor variables were calculated by integrating several items in the NBI data.
- “Reconstructed”: zero, if “year reconstructed” (item 106) is zero, otherwise one.
- “Age”: subtraction of “year built” (item 27) from “year of inspection” (two last digits of item 90), if “Reconstructed” is zero, otherwise subtraction of “year reconstructed” (item 106) from “year of inspection” (two last digits of item 90). Note that for a reconstructed bridge “Age” would be equivalent to the number of years since the last major reconstruction.
- ADT: is computed using Equation (1).
- 4.
- Curb_Width: sum of the “left curb width” (item 50A) and the “right curb width” (item 50B).
- 5.
- Deck_Area: multiplying the “structure length” (item 49) and the “deck width” (item 52).
3.2. Spatially Locating Bridges
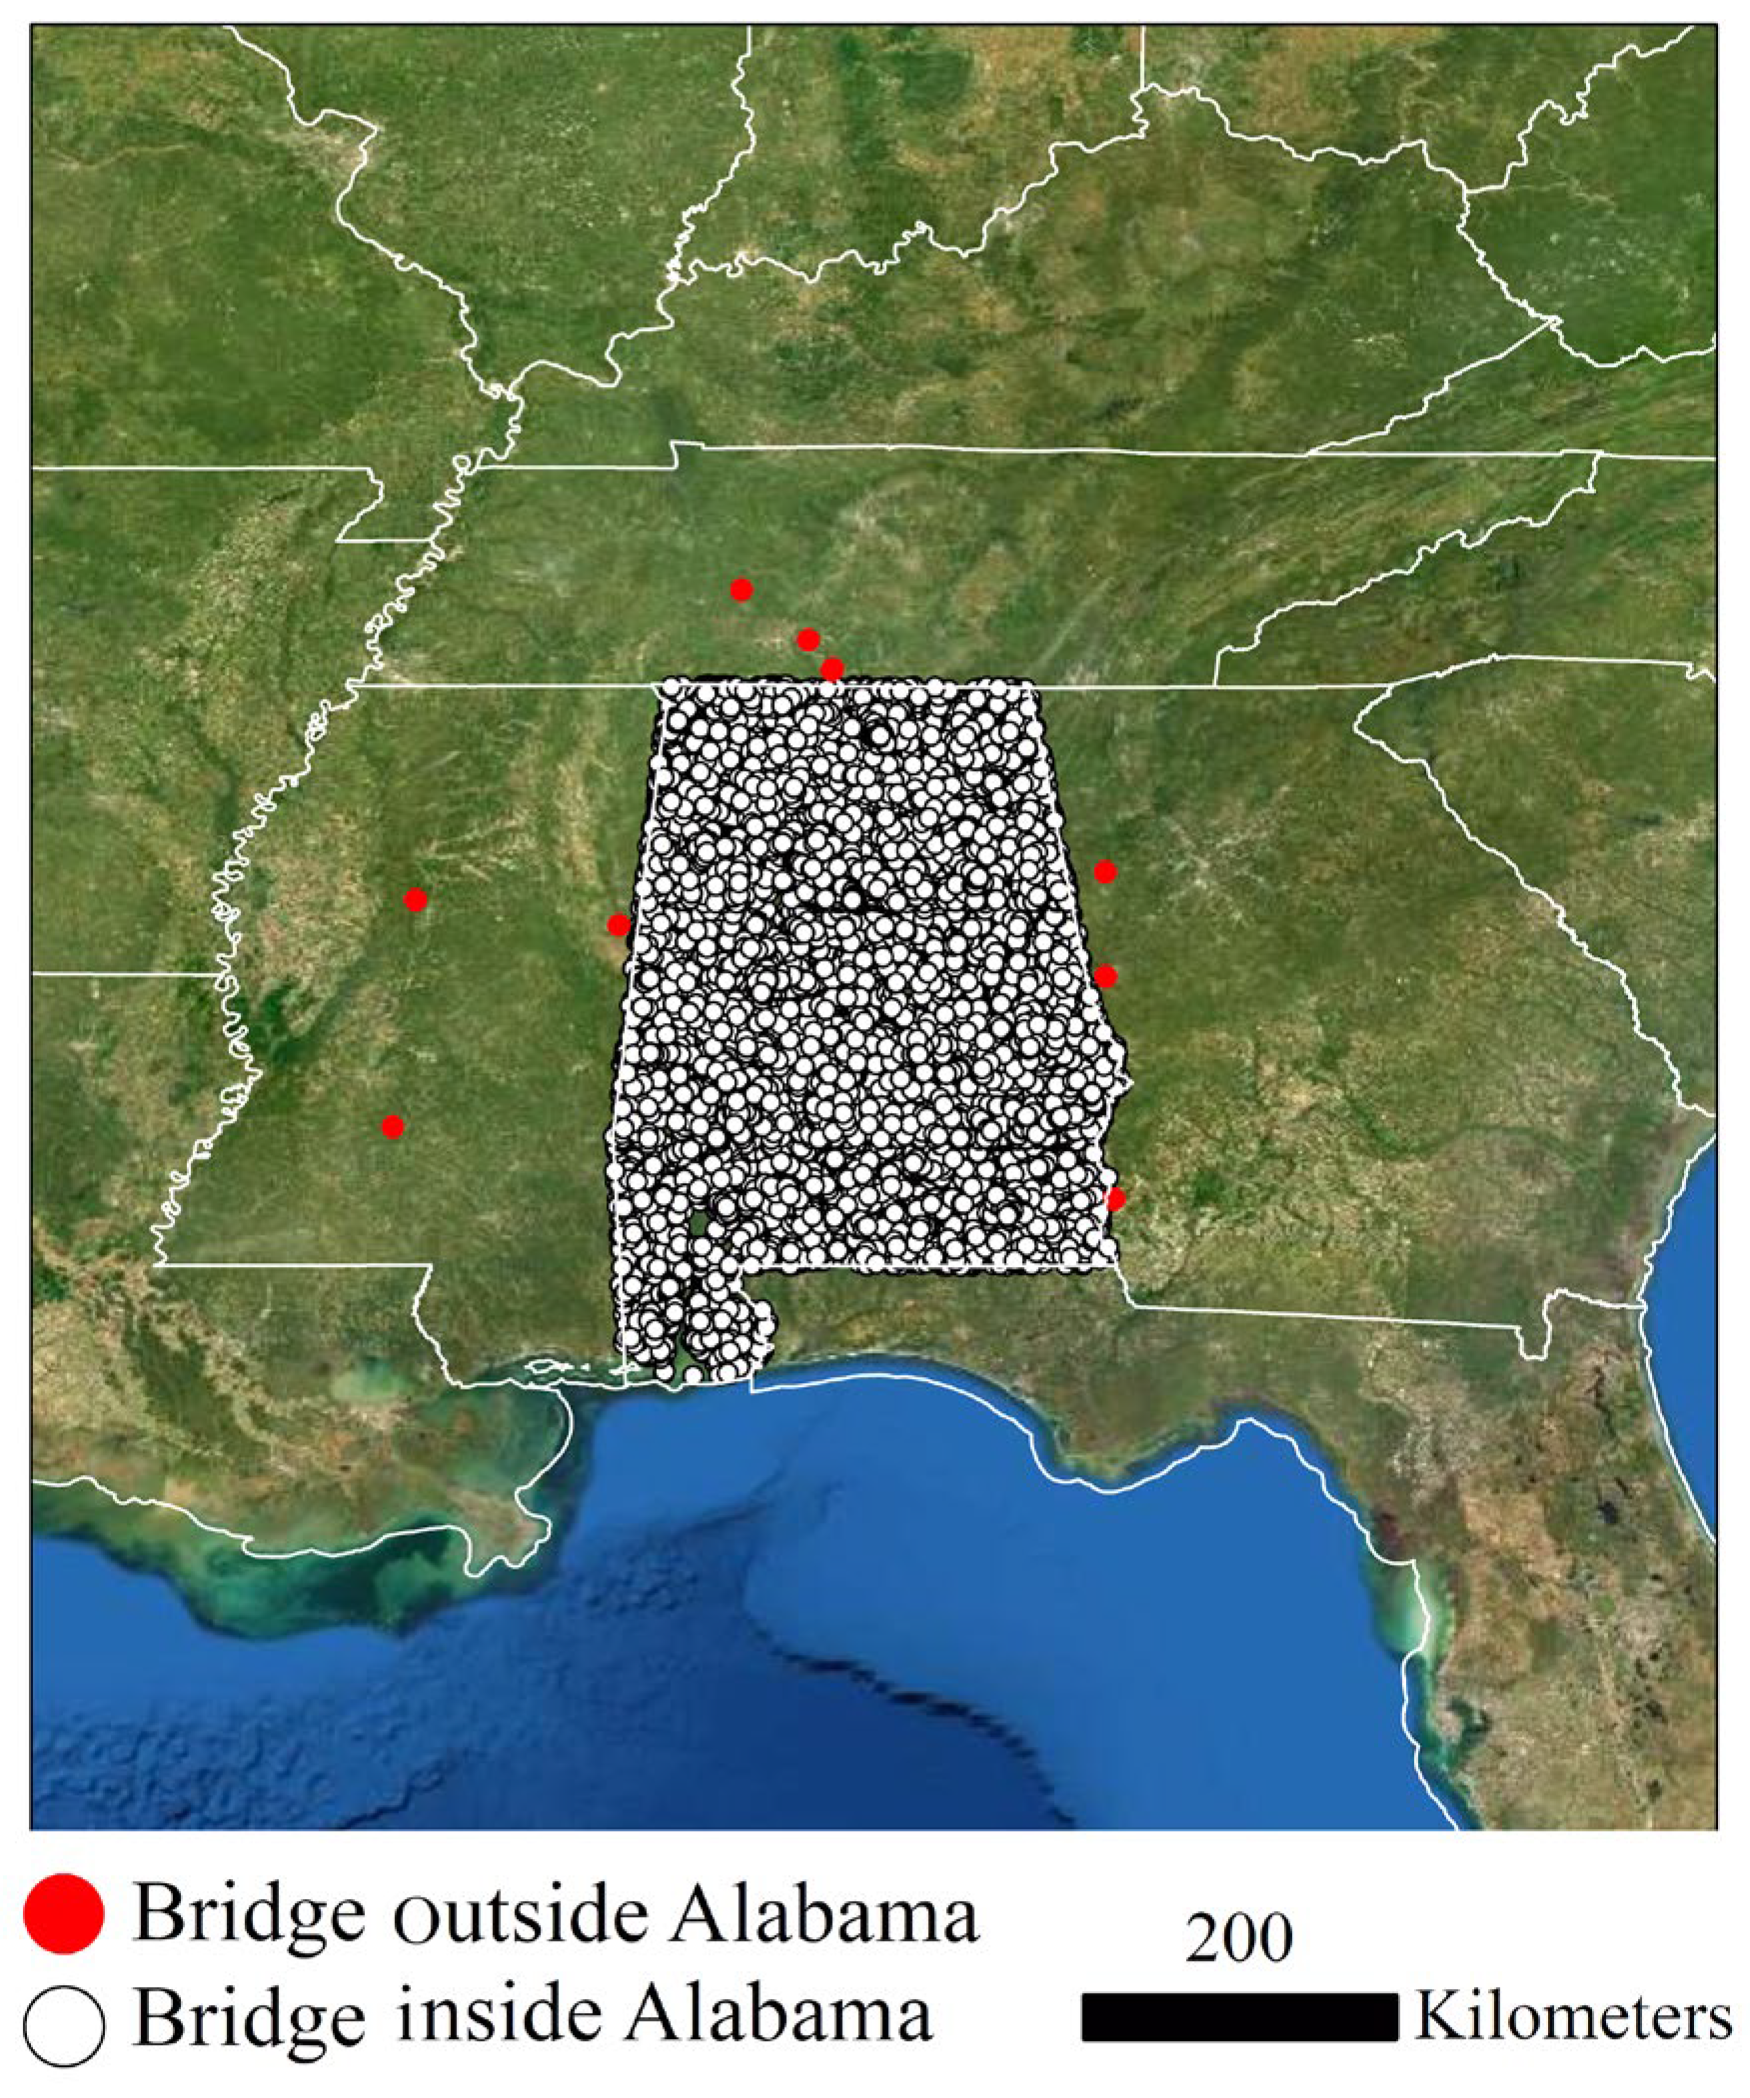
Next, bridges were spatially located using GIS technology and their locations were verified using remote sensing technology. To this end, items 16 and 17 in the NBI data, representing latitude and longitude, were used as location references for bridges. GIS technology incorporated such location references to represent 613,290 bridges as points in a vector space. Note that such points would be leveraged to associate bridges with climate regions. Difficulties in assigning accurate vector space locations were primarily attributed to incorrect latitude and longitude coordinate values of some bridges, mainly originating from typographical errors in the data entry phase. To alleviate such problems, 254 structures with null and zero latitude and longitude were removed. Next, state boundaries were considered as a criterion for validating latitude and longitude locations provided in the NBI data. By doing so, 648 bridges falling out of the boundary of the associated state were removed and the rest remained. Figure 1 shows the bridges inside and outside Alabama, represented using white and red dots, respectively.
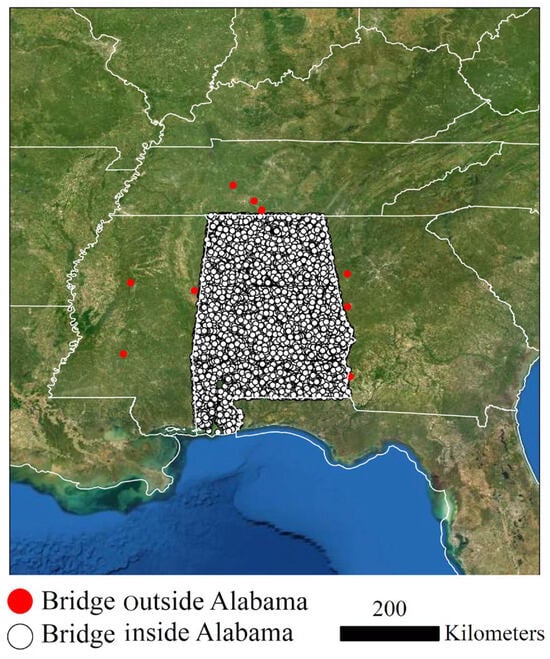
Figure 1.
The bridges inside and outside Alabama, represented using white and red dots, respectively.
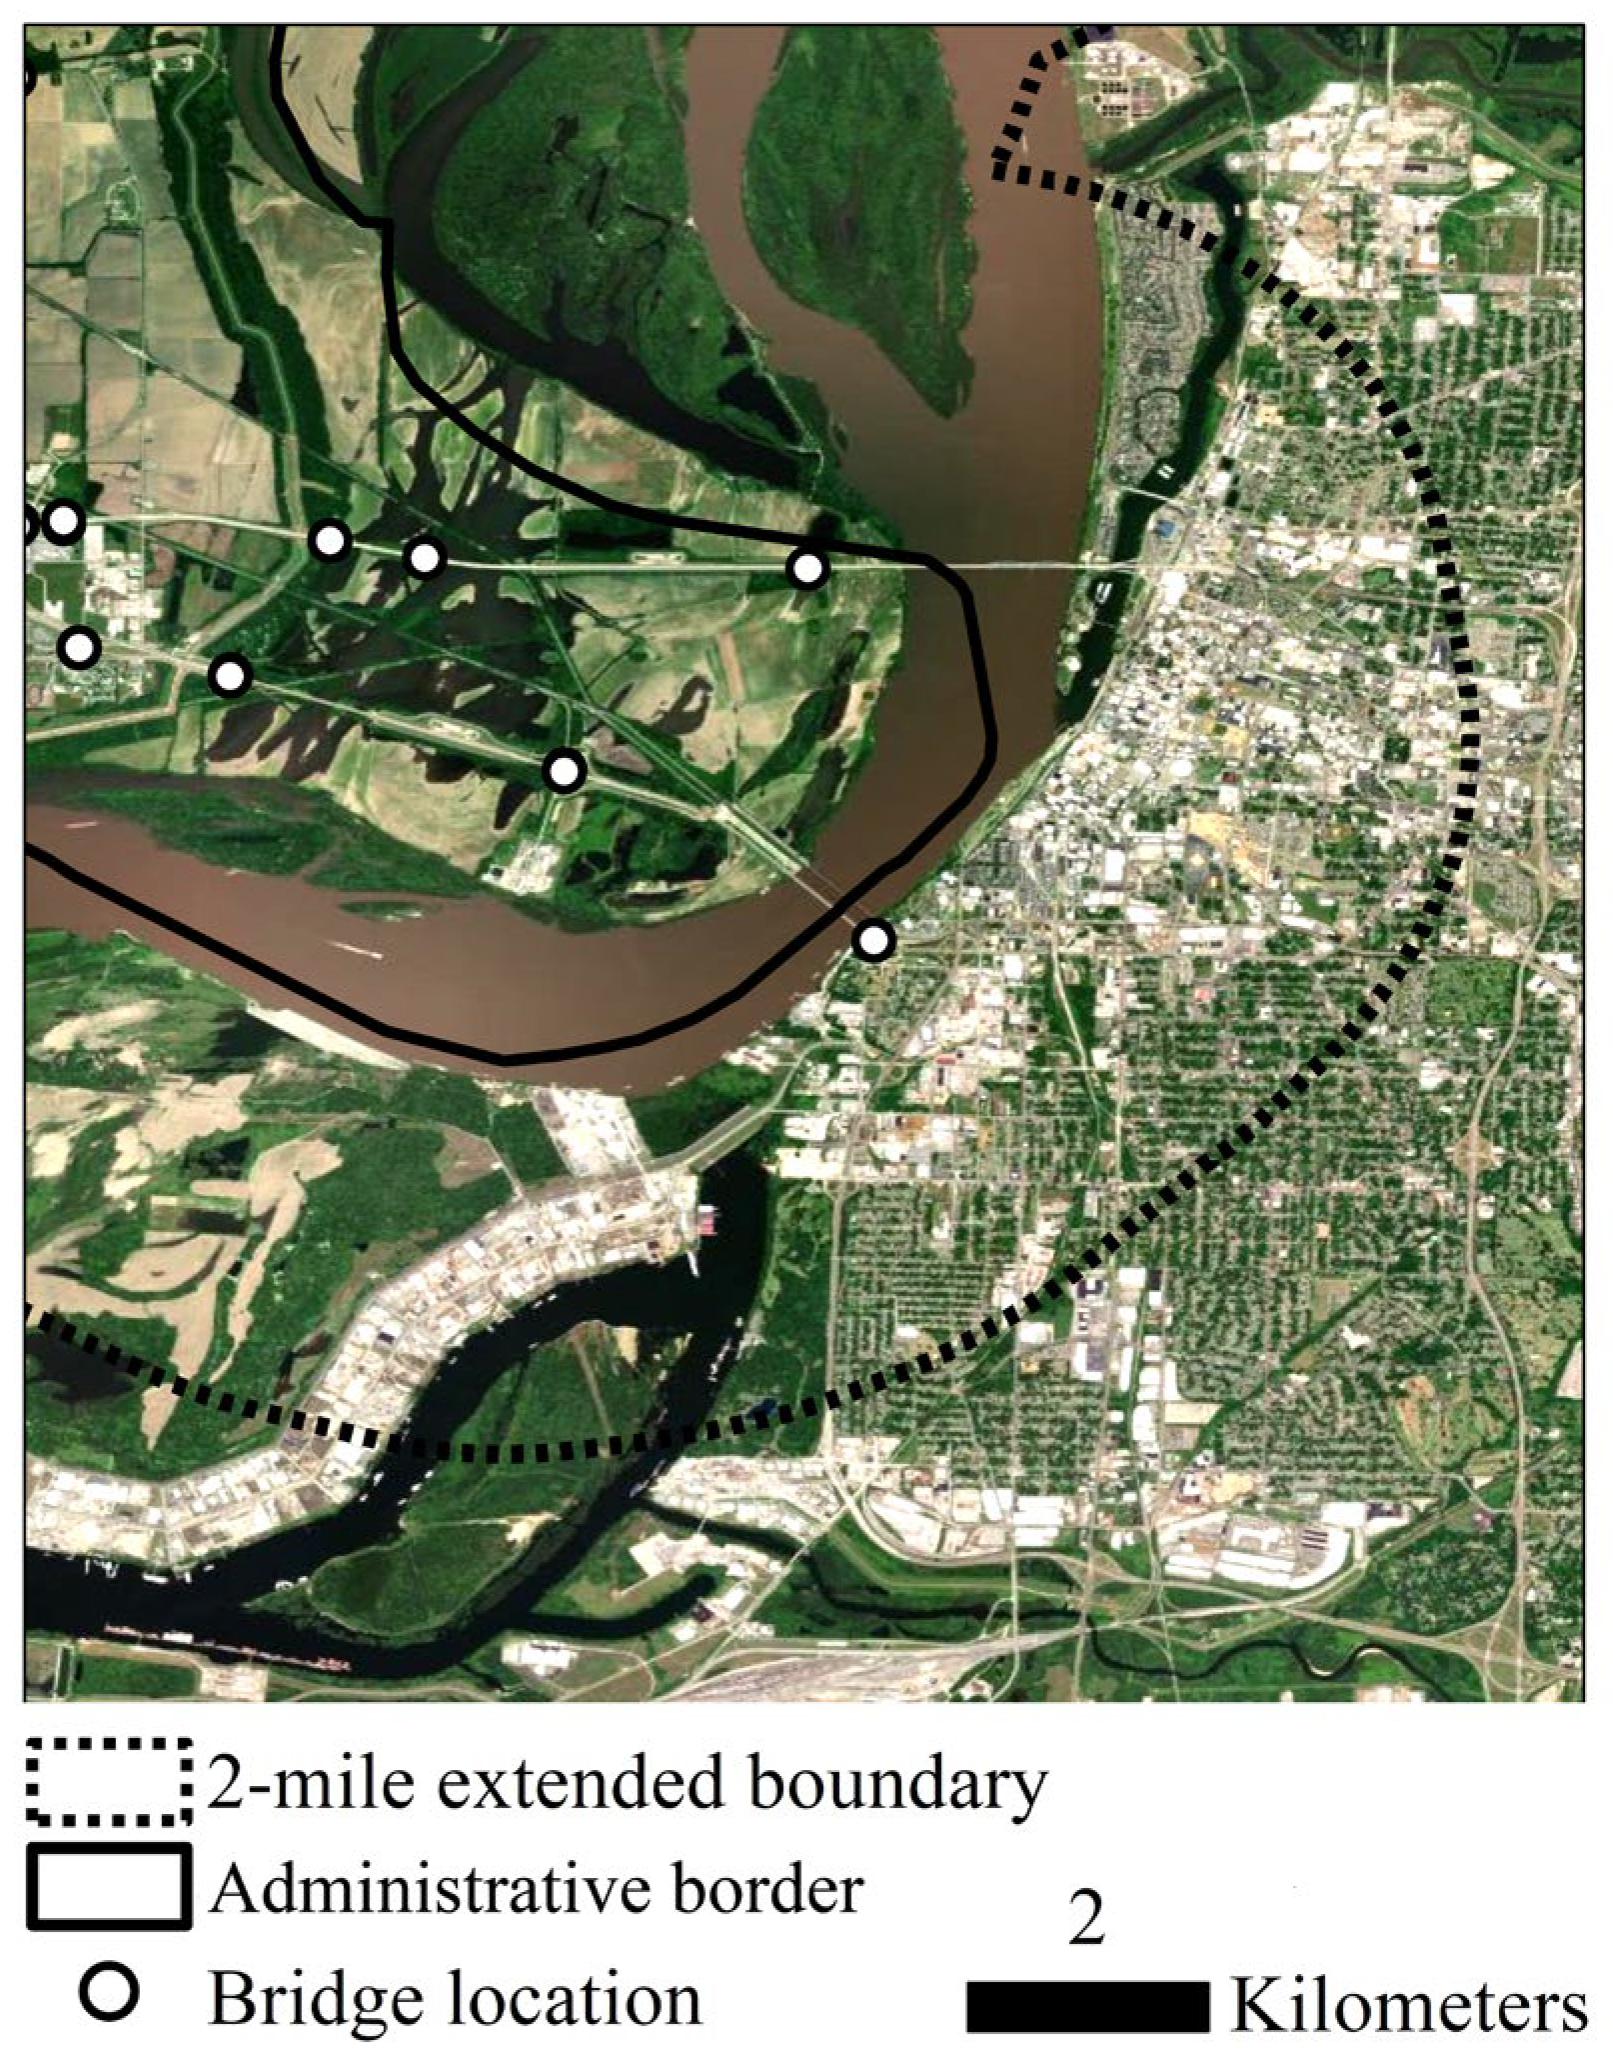
It is noteworthy that the administrative borders of states were expanded by an arbitrary buffer, in this case, 2 miles, used as state boundaries. This approach led to retaining bridges beyond and near administrative borders. Figure 2 shows a bridge over the Mississippi River in Arkansas that is located between the administrative border and the 2-mile-extended boundary and hence was retained. Although the present study used administrative borders to assess the validity of the spatial locations of bridges, the designated county in the NBI data, as a smaller division, seems more accurate. However, it is important to acknowledge that employing county-level data may introduce additional complexities and potentially prolong the evaluation process due to the finer granularity of county boundaries.
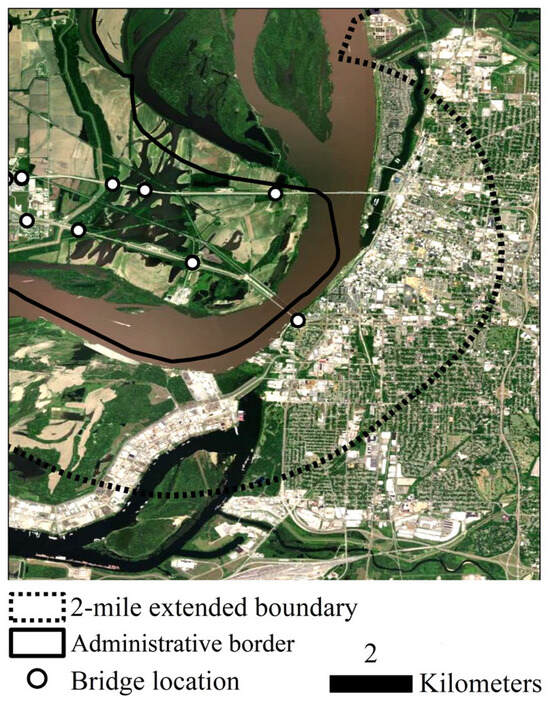
Figure 2.
A bridge over the Mississippi River in Arkansas that is located between the administrative border and the 2-mile-extended boundary and hence was retained.
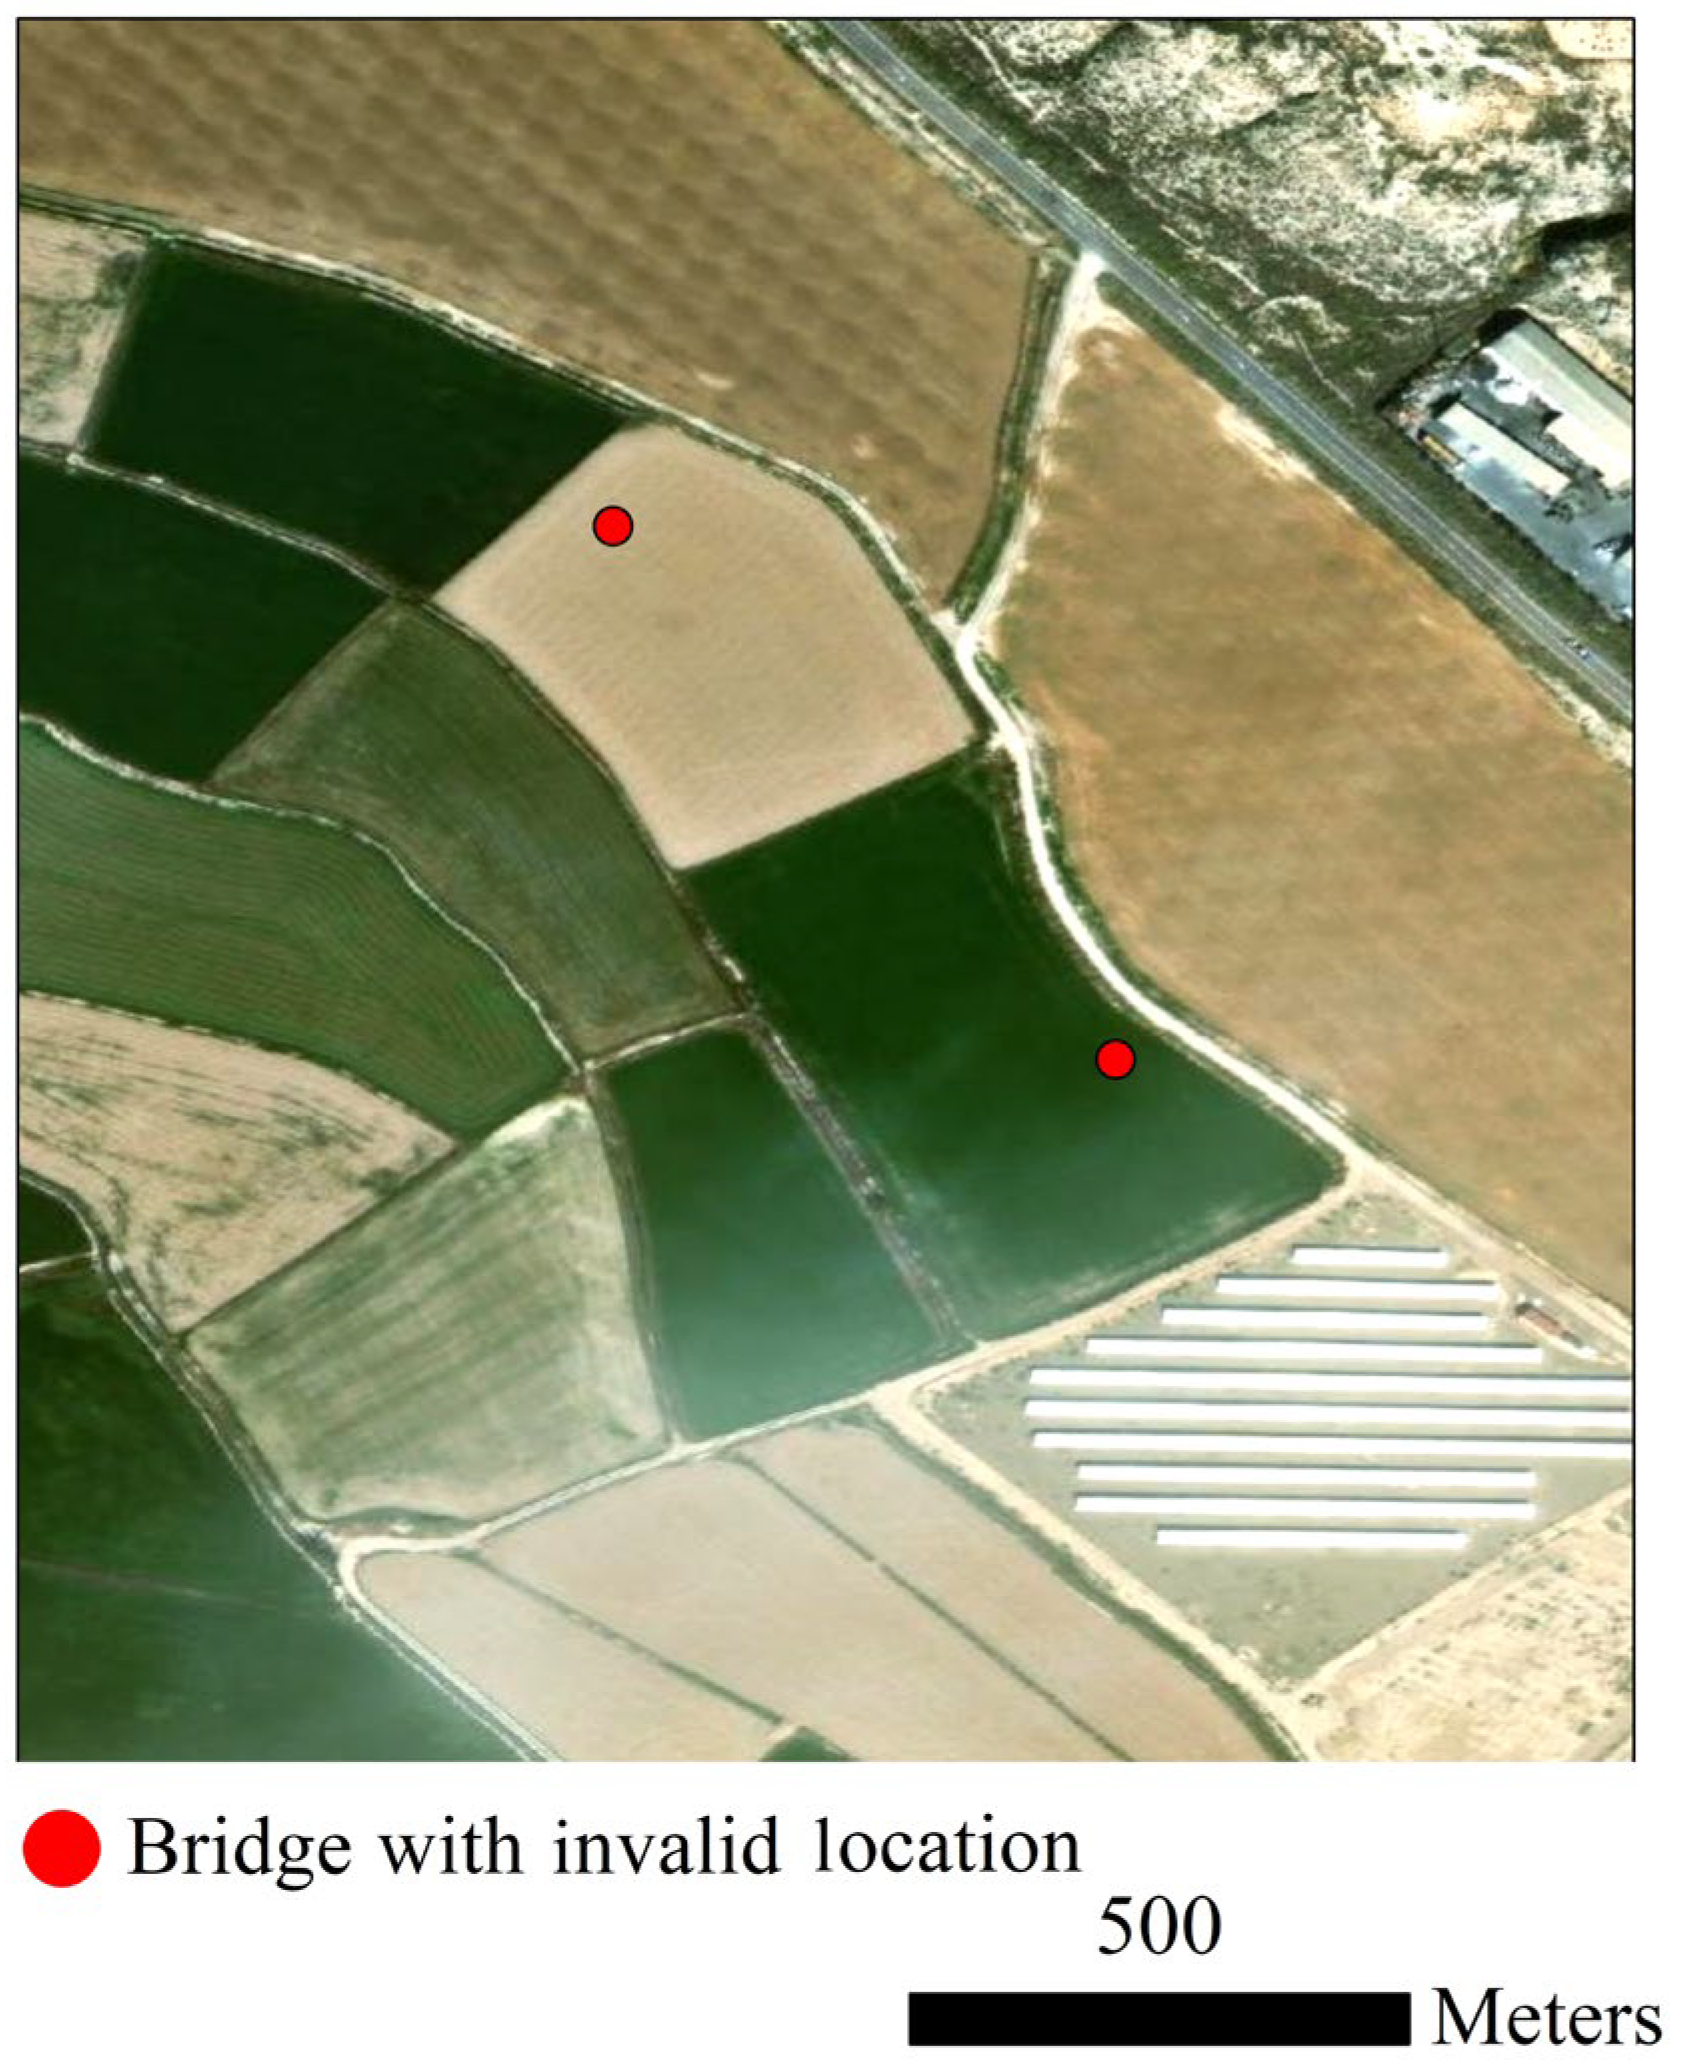
Locations of bridges were visually verified through overlaying points, representing the spatial location of bridges, on high-resolution satellite images. However, due to the large number of bridges in the United States, this approach may only be applicable to suspicious bridges. Figure 3 illustrates the spatial locations of two bridges, in Connecticut, overlaid on GeoEye satellite imagery. These bridges were removed from further analysis because they were located on farms. Note that assessing the validity of bridge locations is crucial because such locations are leveraged to allocate a climate region to each structure.
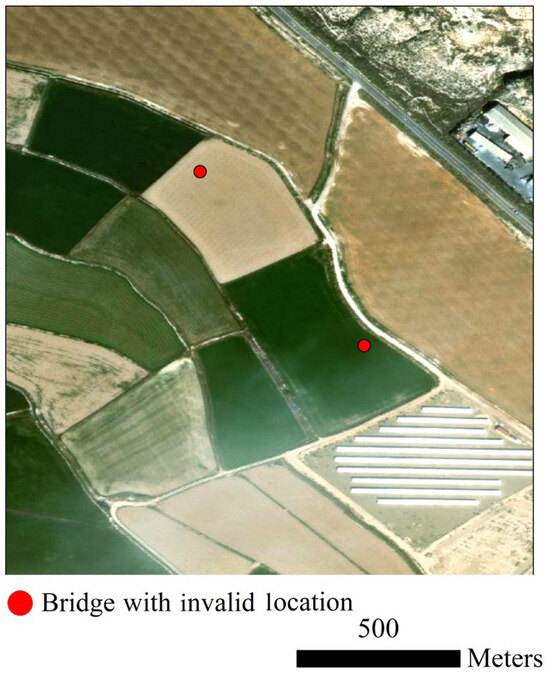
Figure 3.
The spatial locations of two bridges, in Connecticut, overlaid on GeoEye satellite imagery.
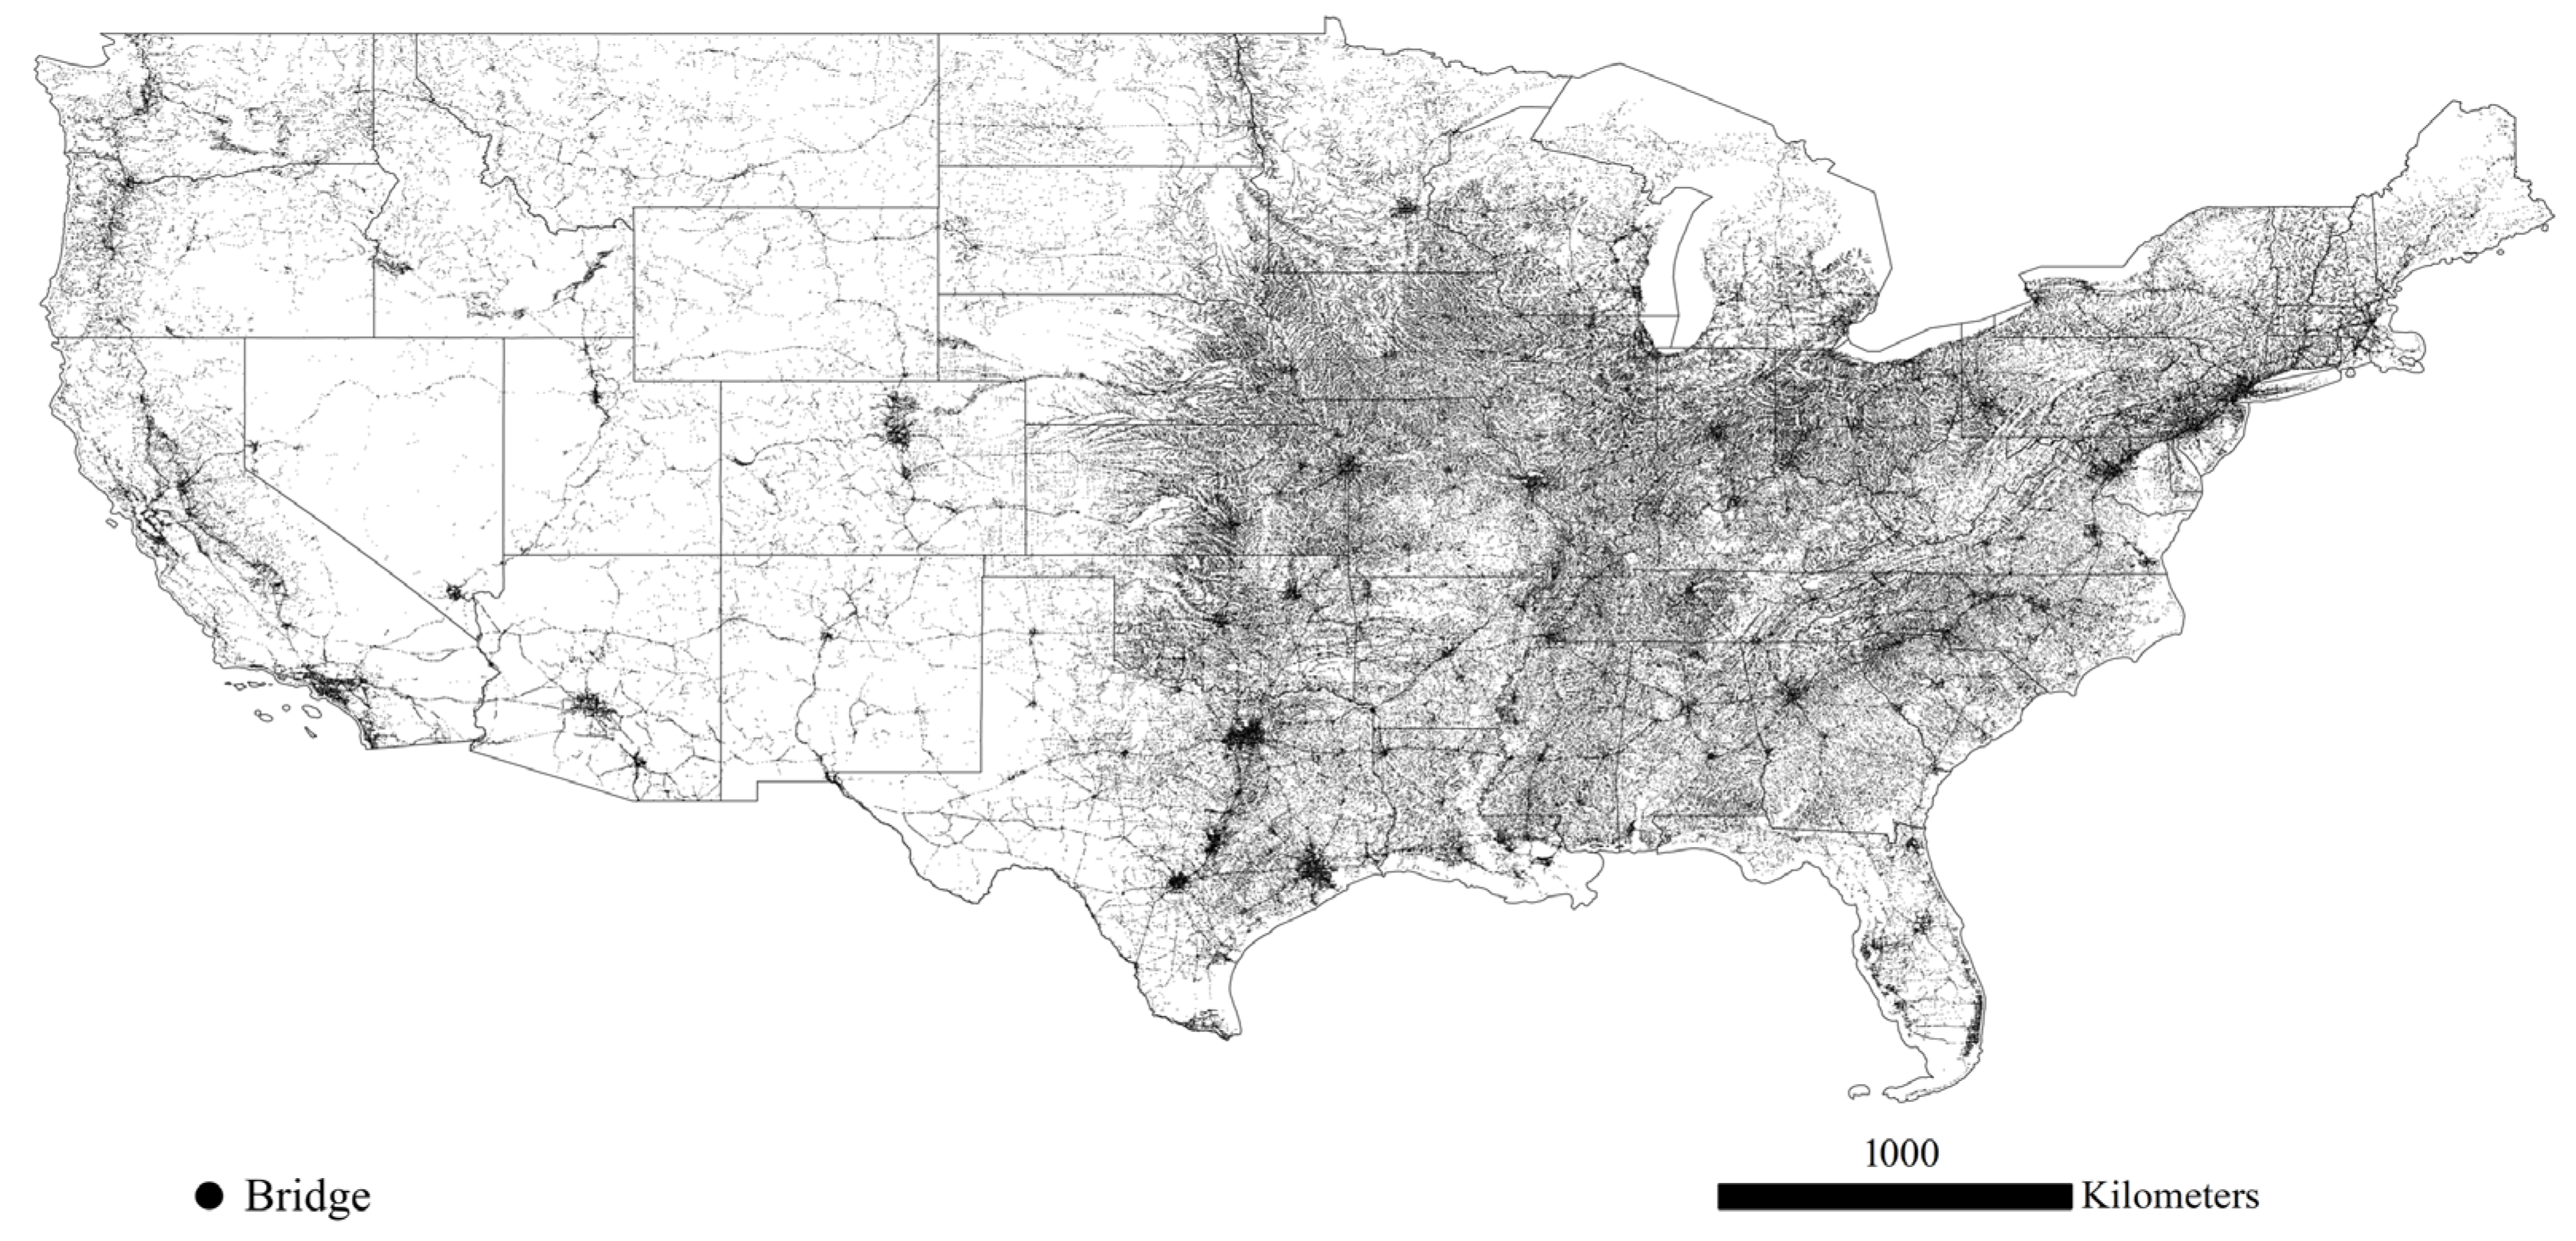
Utilizing the previously described approach, we collected data on 612,388 bridges located throughout the United States, encompassing 48 contiguous states and the District of Columbia. Figure 4 portrays the spatial distribution of bridges in the United States collected in the present study. This dataset offers valuable insights into the spatial distribution of bridges across the nation. As depicted in Figure 4, it becomes evident that bridges exhibit varying densities across the United States. Particularly, bridges are much denser in the eastern half of the country compared to the western half. This disparity in distribution is primarily attributed to the prevalence of rivers and streams in the eastern half, necessitating a denser network of bridges to facilitate transportation and connectivity.
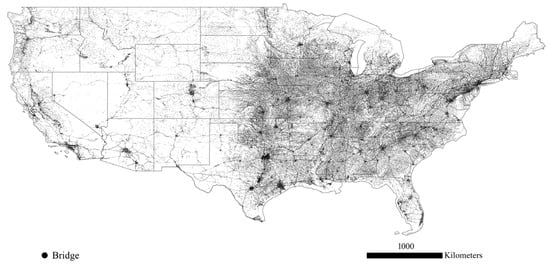
Figure 4.
The spatial distribution of bridges in the United States collected in the present study.
Table 3 lists the initial number of bridges in the NBI data in each state, number of bridges with incorrect spatial locations, percentage of bridges removed, and number of bridges retained. According to Table 3, 5.87%, 2.82%, 2.41%, 1.23%, and 1.02% of bridges in Maryland, Nevada, Connecticut, District of Columbia, and North Dakota were removed, respectively, while less than 0.5% of bridges in other states were removed. Furthermore, Texas leads the nation in the number of bridges; of the 612,388 nation bridges, 54,680 bridges belong to public highways, roads, and streets of Texas, while Rhode Island with 777 bridges comprises the minimum number of bridges.

Table 3.
The initial number of bridges in the NBI data in each state, number of bridges with incorrect spatial locations, percentage of bridges removed, and number of bridges retained.
3.3. Climate Region Collection
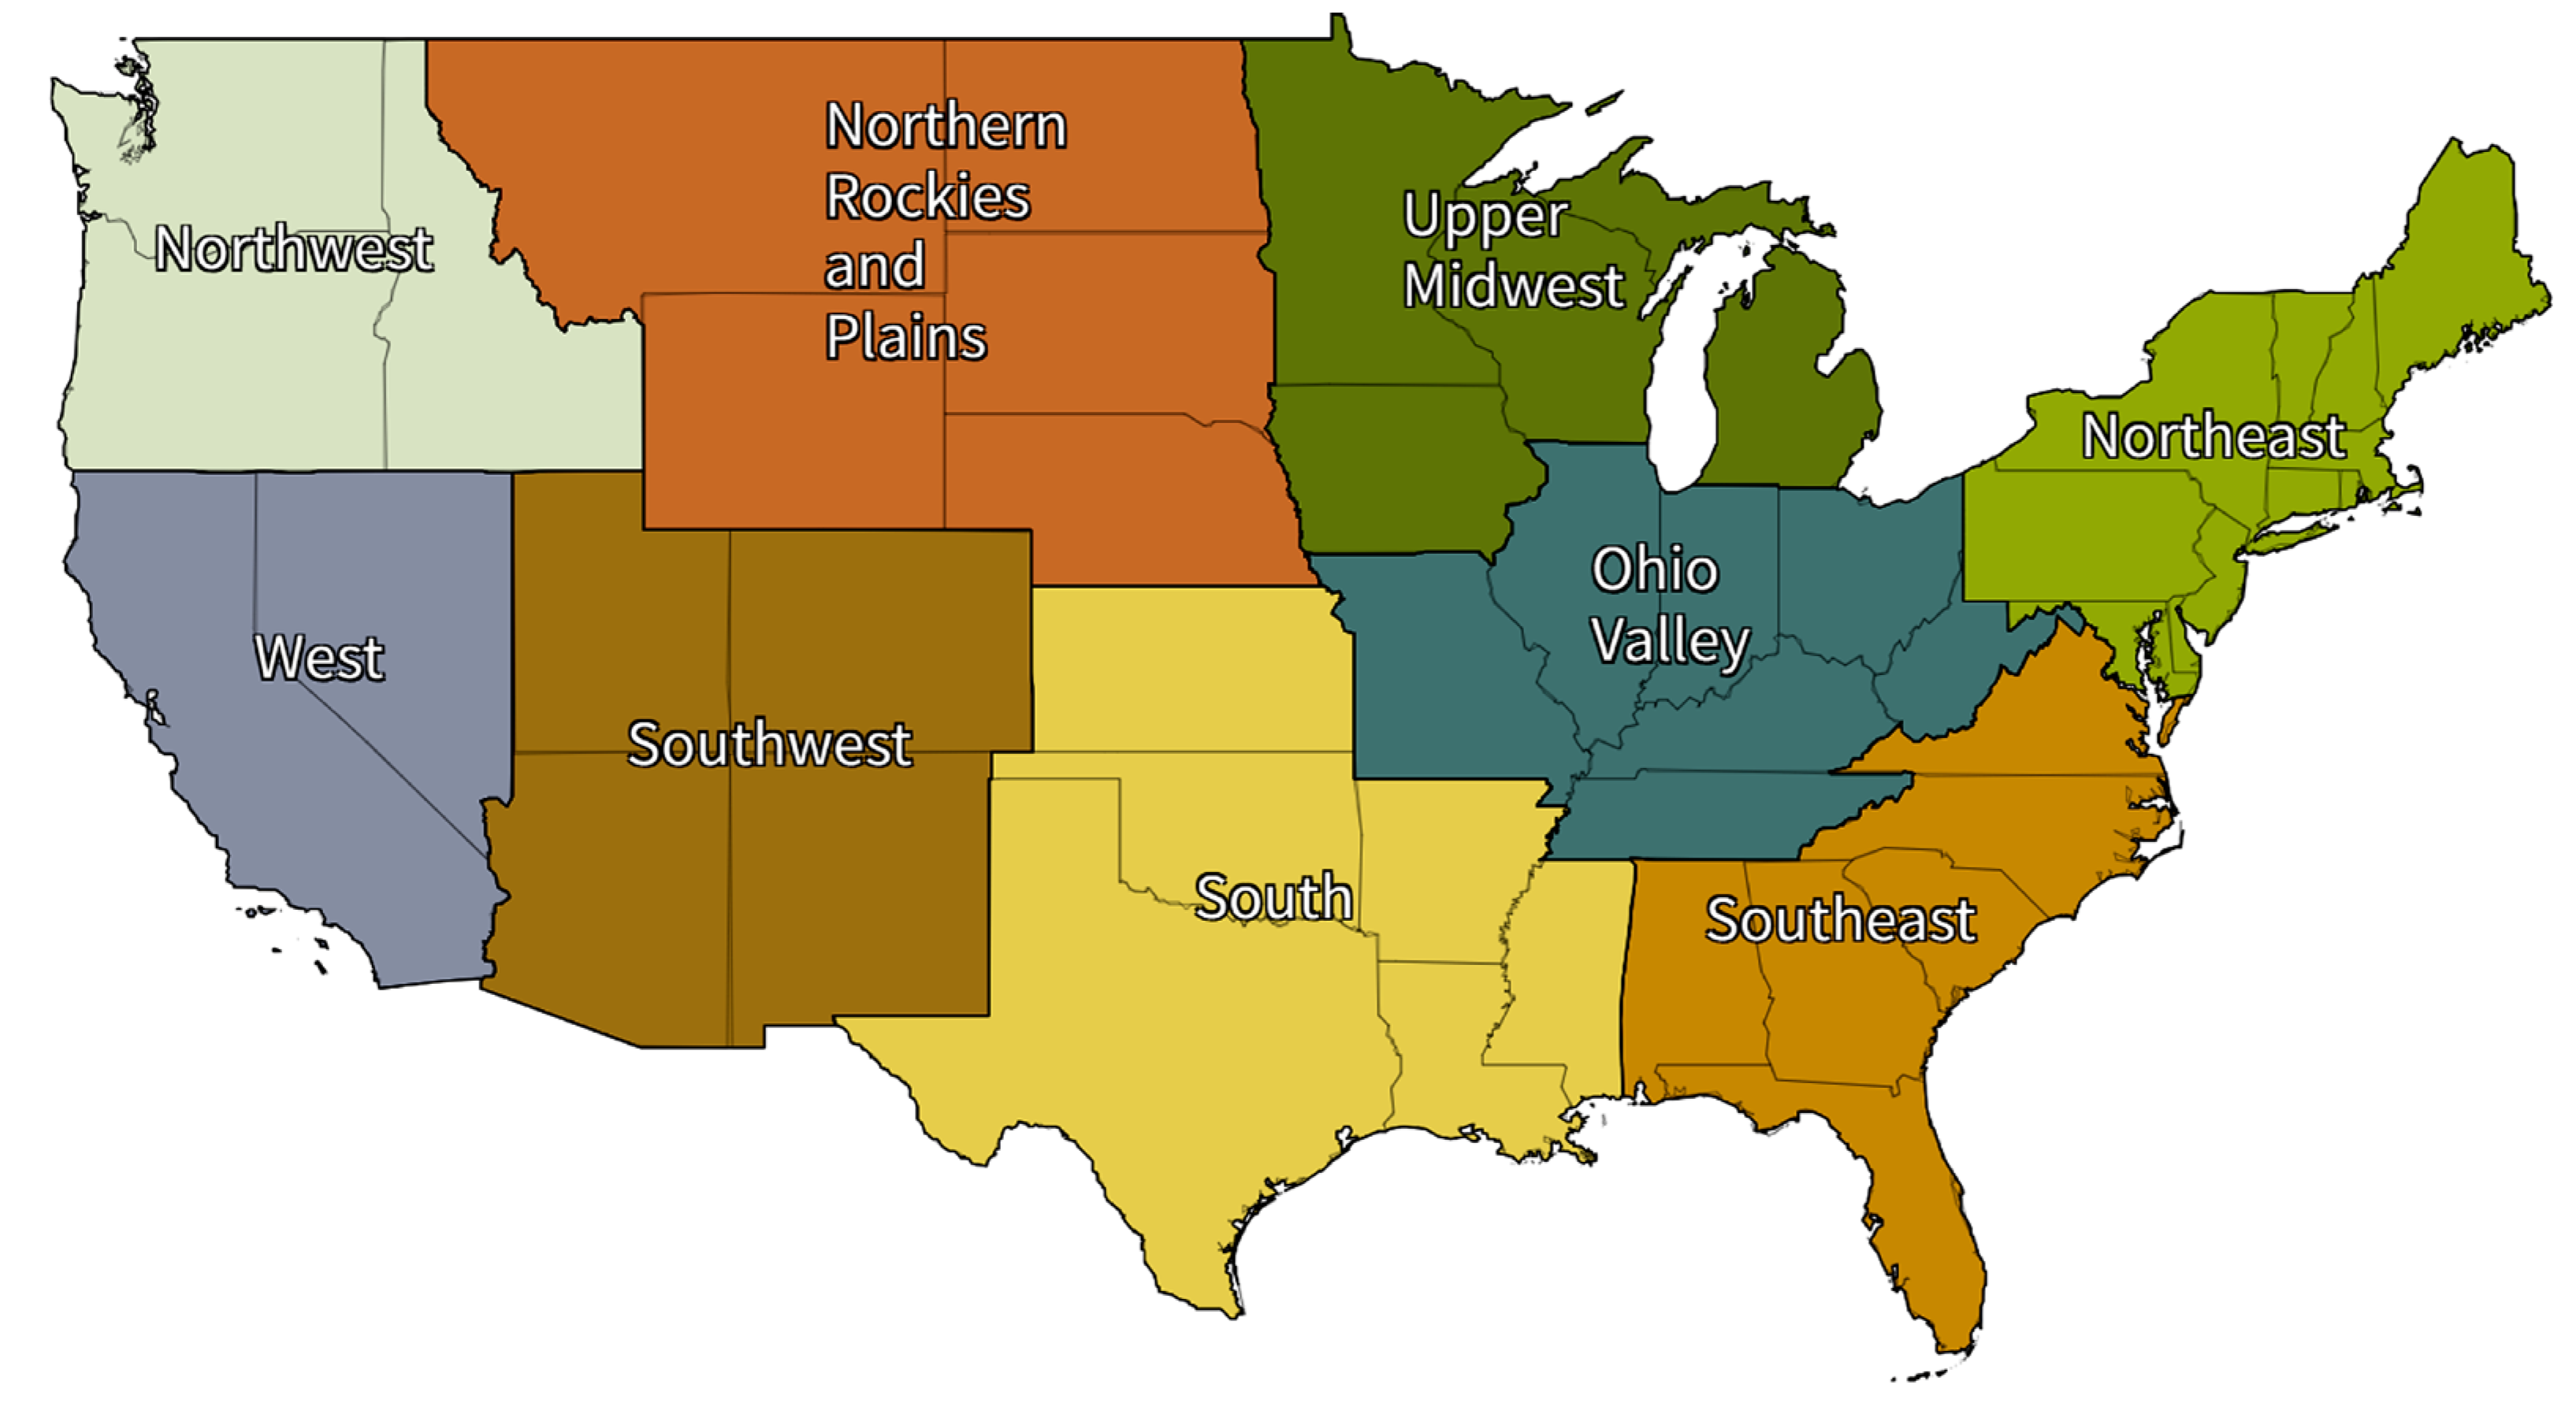
Then spatial locations of bridges were utilized to assign a climate region to each bridge structure. Figure 5 shows the nine climatically consistent regions within the United States, defined by NOAA. According to Figure 5, California and Nevada are in the West region, while Florida and Alabama are in the Southeast region.
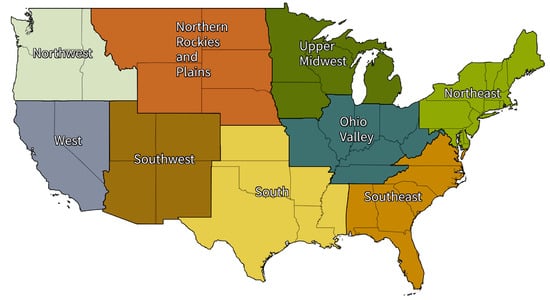
Figure 5.
Nine climatically consistent regions within the U.S., defined by NOAA “Reprinted from National Centers for Environmental Information”.
4. Model Development and Evaluation
4.1. Predictor and Response Variables
To conduct experiments, two distinct datasets were generated: the bridge data of 2020 and the five-year historical bridge data spanning the period from 2016 to 2020. A total of 20 variables, including 9 numerical and 11 categorical, were introduced as predictor variables. It is noteworthy that all 9 numerical and 10 categorical variables represented NBI and traffic data, while climate regions were introduced by only one categorical variable. Table 4 represents the list of 20 predictor variables.

Table 4.
The list of 20 predictor variables.
A multiclass variable that includes 10 deck condition ratings, from 0 to 9, was introduced as the response variable. Failed condition rating is represented by 0, while excellent condition rating is represented by 10. Table 5 represents the multiclass response variable.

Table 5.
The multiclass response variable.
4.2. Feature Selection
Feature selection is a technique that helps identify important and relevant features in the dataset while discarding redundant or irrelevant ones, to be used in ML and data mining tasks. The goal of feature selection is to create a small subset of predictor variables that still captures the vital characteristics of the dataset [44]. This approach offers several benefits, including reduced size of dataset, lower storage requirements, improved prediction accuracy, prevention of overfitting, and reduced execution and training time by focusing on easy-to-interpret predictor variables [45]. There are several methods for feature selection, such as filter, embedded, wrapper, and hybrid. In this study, permutation-based variable importance was utilized as a feature selection technique, which falls under the category of filter algorithms, which evaluate the relationship between each predictor variable and the response variable independently [46].
Random Forest uses a permutation-based approach to measure the positive effect of a variable on prediction performance. The importance of a variable is calculated as the average increase in error rate or decrease in model accuracy on out-of-bag (OOB) observations when the values of the respective predictor variable are randomly permuted. The permutation-based variable importance measures the difference between the OOB error rate before and after permuting the values of the predictor variable [47]. The variable importance of variable is defined by Equation (2):
where denotes the number of trees in the forest, and represent the mean error rate on OOB data in tree after and before permuting the predictor variable , respectively. If the predictor variable is not associated with the response variable, the permutation of its values will have no impact on the error rate. Conversely, if the response and the predictor variable are associated, permuting the values of the predictor variable will disturb this association, resulting in an increased error rate and a decrease in model accuracy. In general, the larger the decrease in model accuracy after permutation, the more informative the corresponding predictor variable is [48,49,50,51]. This insight, obtained from the OOB data, can aid in interpreting the developed model and identifying the predictor variables that offer the most predictive power. Additionally, excluding predictor variables that do not provide any useful information leads to more time-efficient analysis, improving performance, and avoidance of overfitting [52,53].
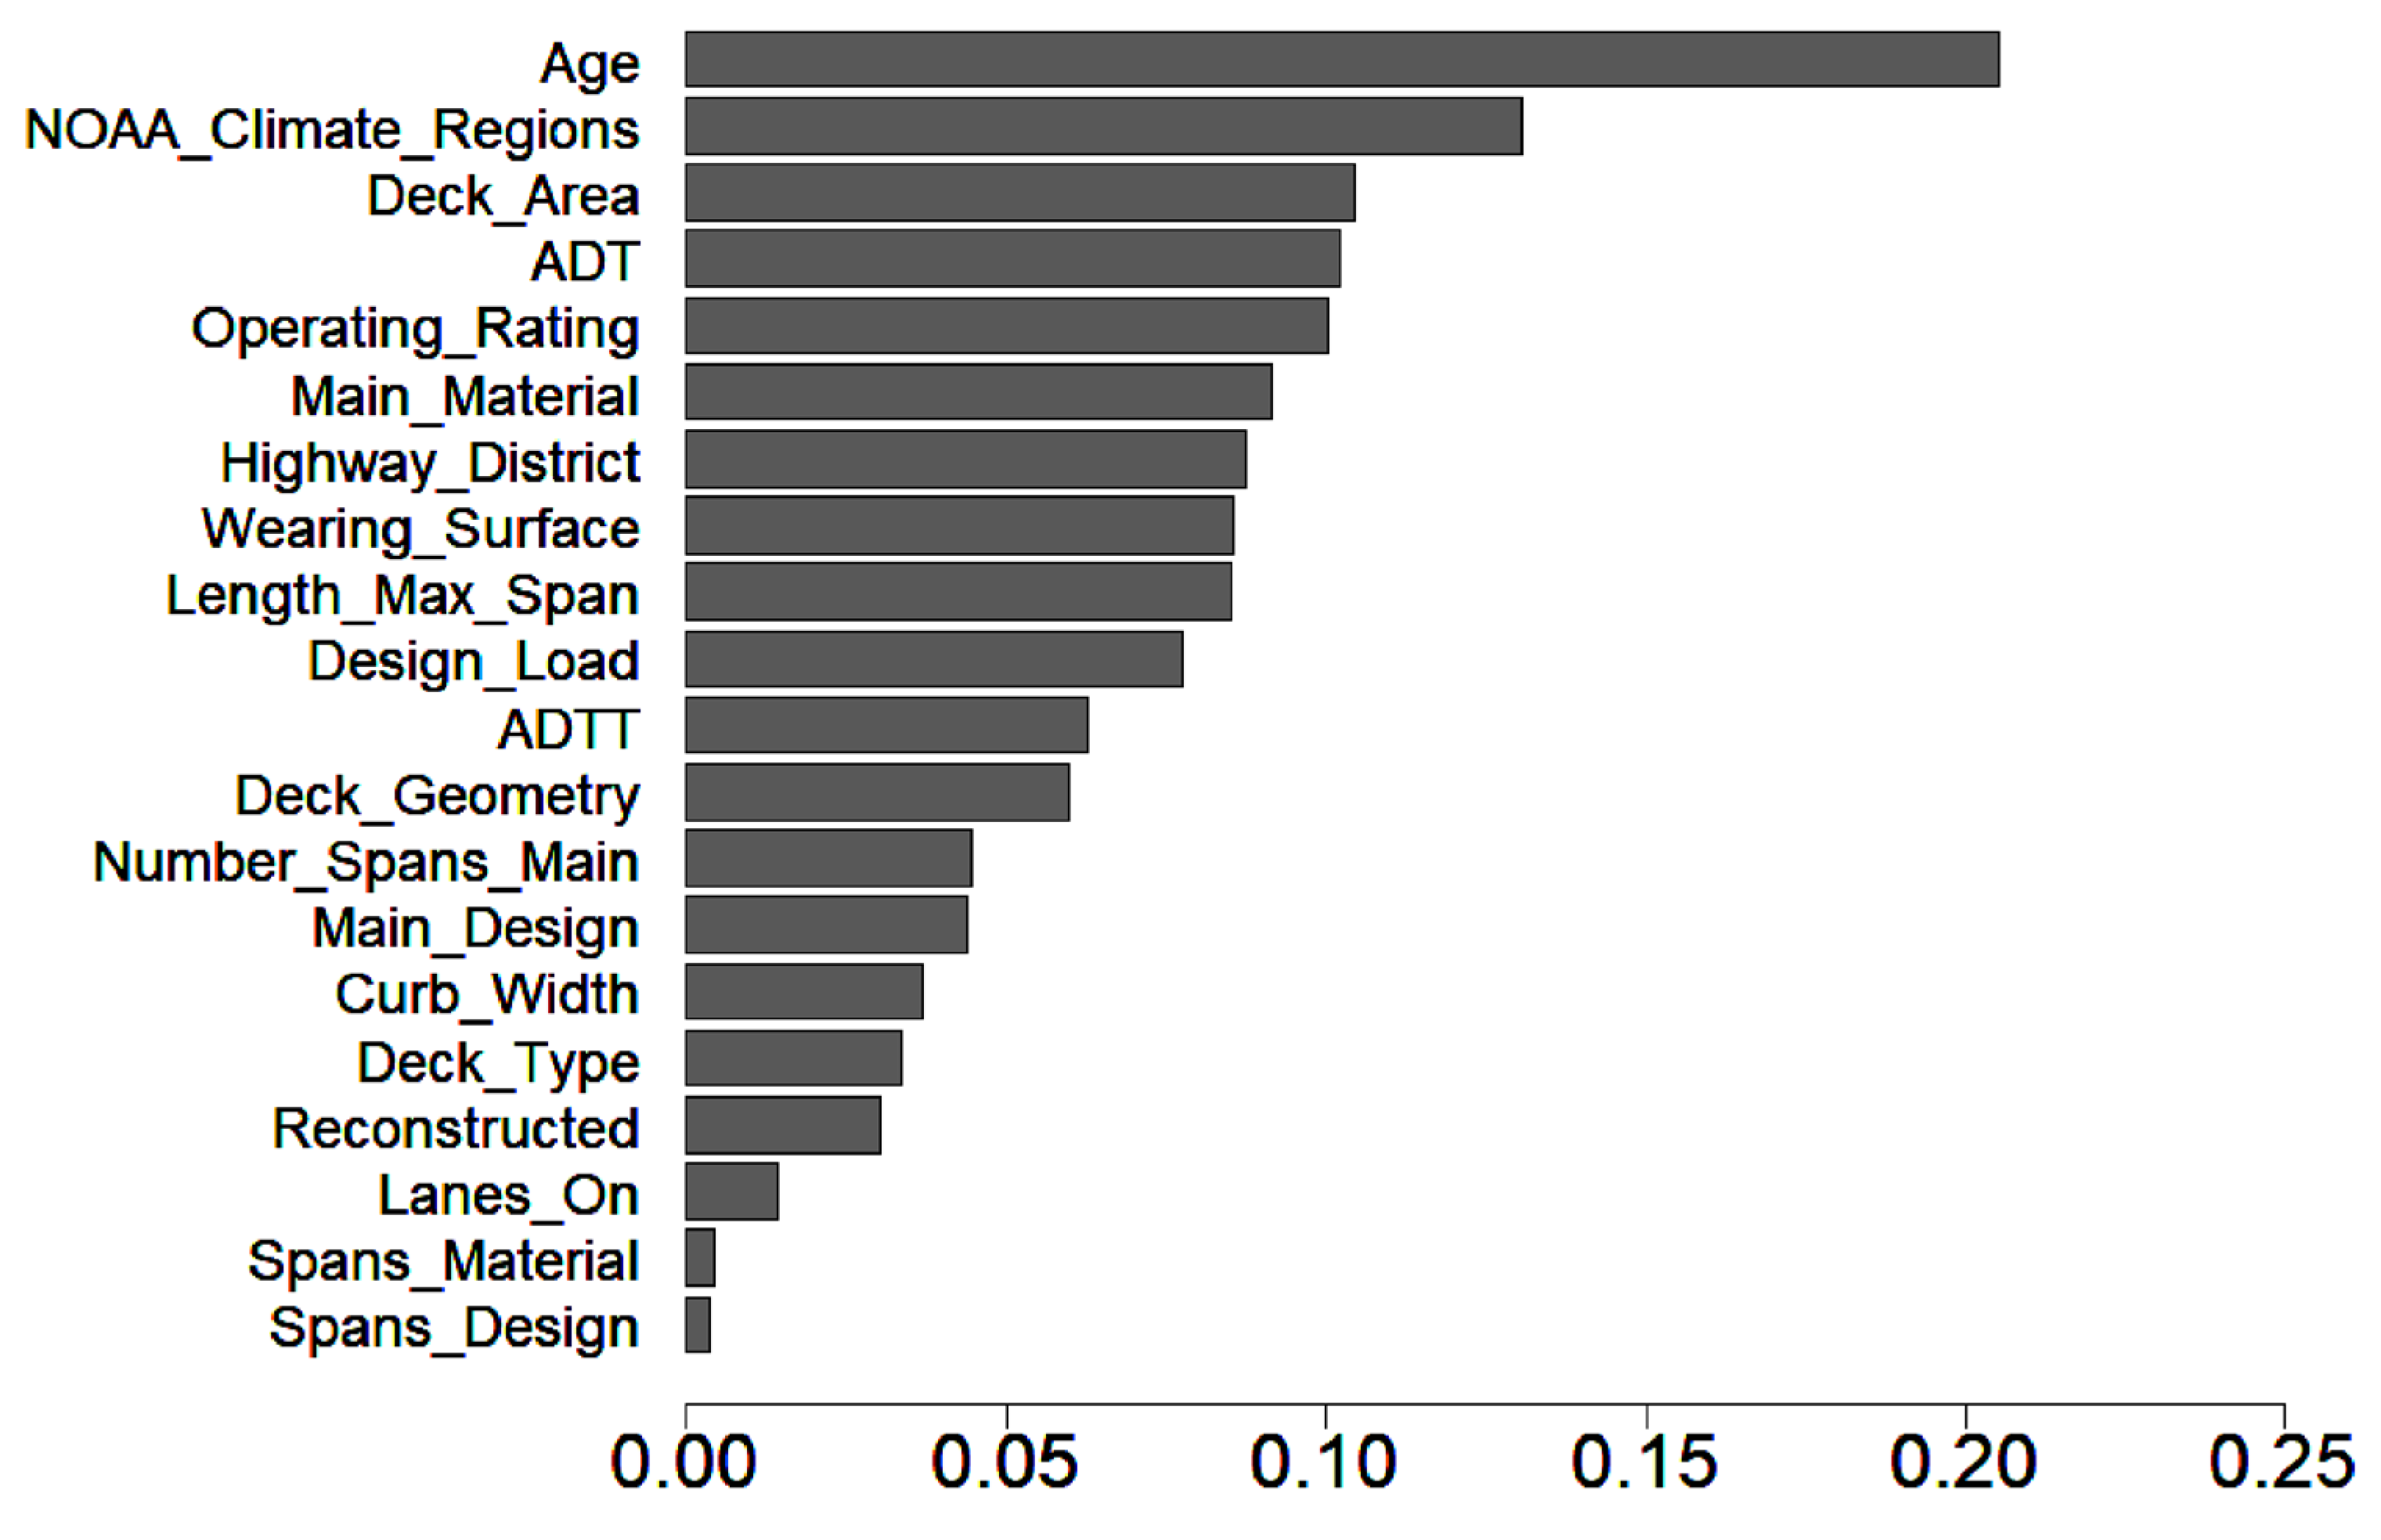
Sampling with replacement, available in the ranger package, version 0.13.1, was introduced by Wright and Ziegler [54]. This feature has led to the creation of a variable importance plot, which ranks the predictor variables based on the reduction of model accuracy if their associated values are permuted. Figure 6 shows the variable importance plot using the permutation-based variable importance approach. According to Figure 6, the most contributing predictor variable in determining deck condition rating is the age of a deck or the number of years since the last major reconstruction. It is noteworthy that climate regions (NOAA_Climate_Regions) and traffic (e.g., ADT and ADTT) are recognized as influential variables contributing to the deterioration of bridge decks. Additionally, other variables, representing various characteristics of bridge decks, are identified to influence the predictive performance of the deterioration models. These variables include Deck_Area, Operating_Rating, Main_Material, Highway_District, Wearing_Surface, Length_Max_Span, Design_Load, Deck_Geometry, Number_Spans_Main, Main_Design, Curb_Width, Deck_Type, Reconstructed, Lanes_On, Spans_Material, and Spans_design.
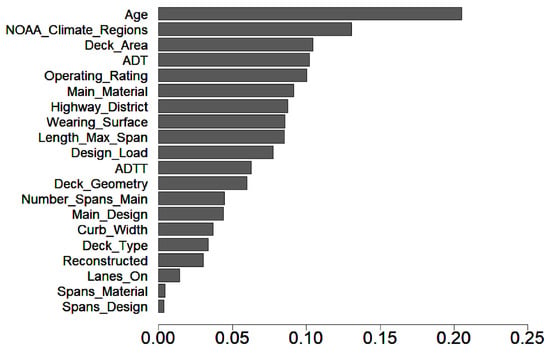
Figure 6.
The variable importance plot using the permutation-based variable importance approach.
4.3. Data Cleaning
Before developing models, the data need to undergo cleaning and transformation to ensure that they are in the appropriate format. Data cleaning involves handling records with either missing or invalid values, which can negatively impact the model performance [55,56], as well as removing duplicate instances [57]. To enable the creation of a wider range of classification models, categorical variables are encoded into numeric values [58] using label encoding or one-hot encoding [59] and numerical variables are centered and scaled [60] using Min-Max scaling, Z-score standardization, logarithmic transformation, Box-Cox transformation, and robust scaling [61].
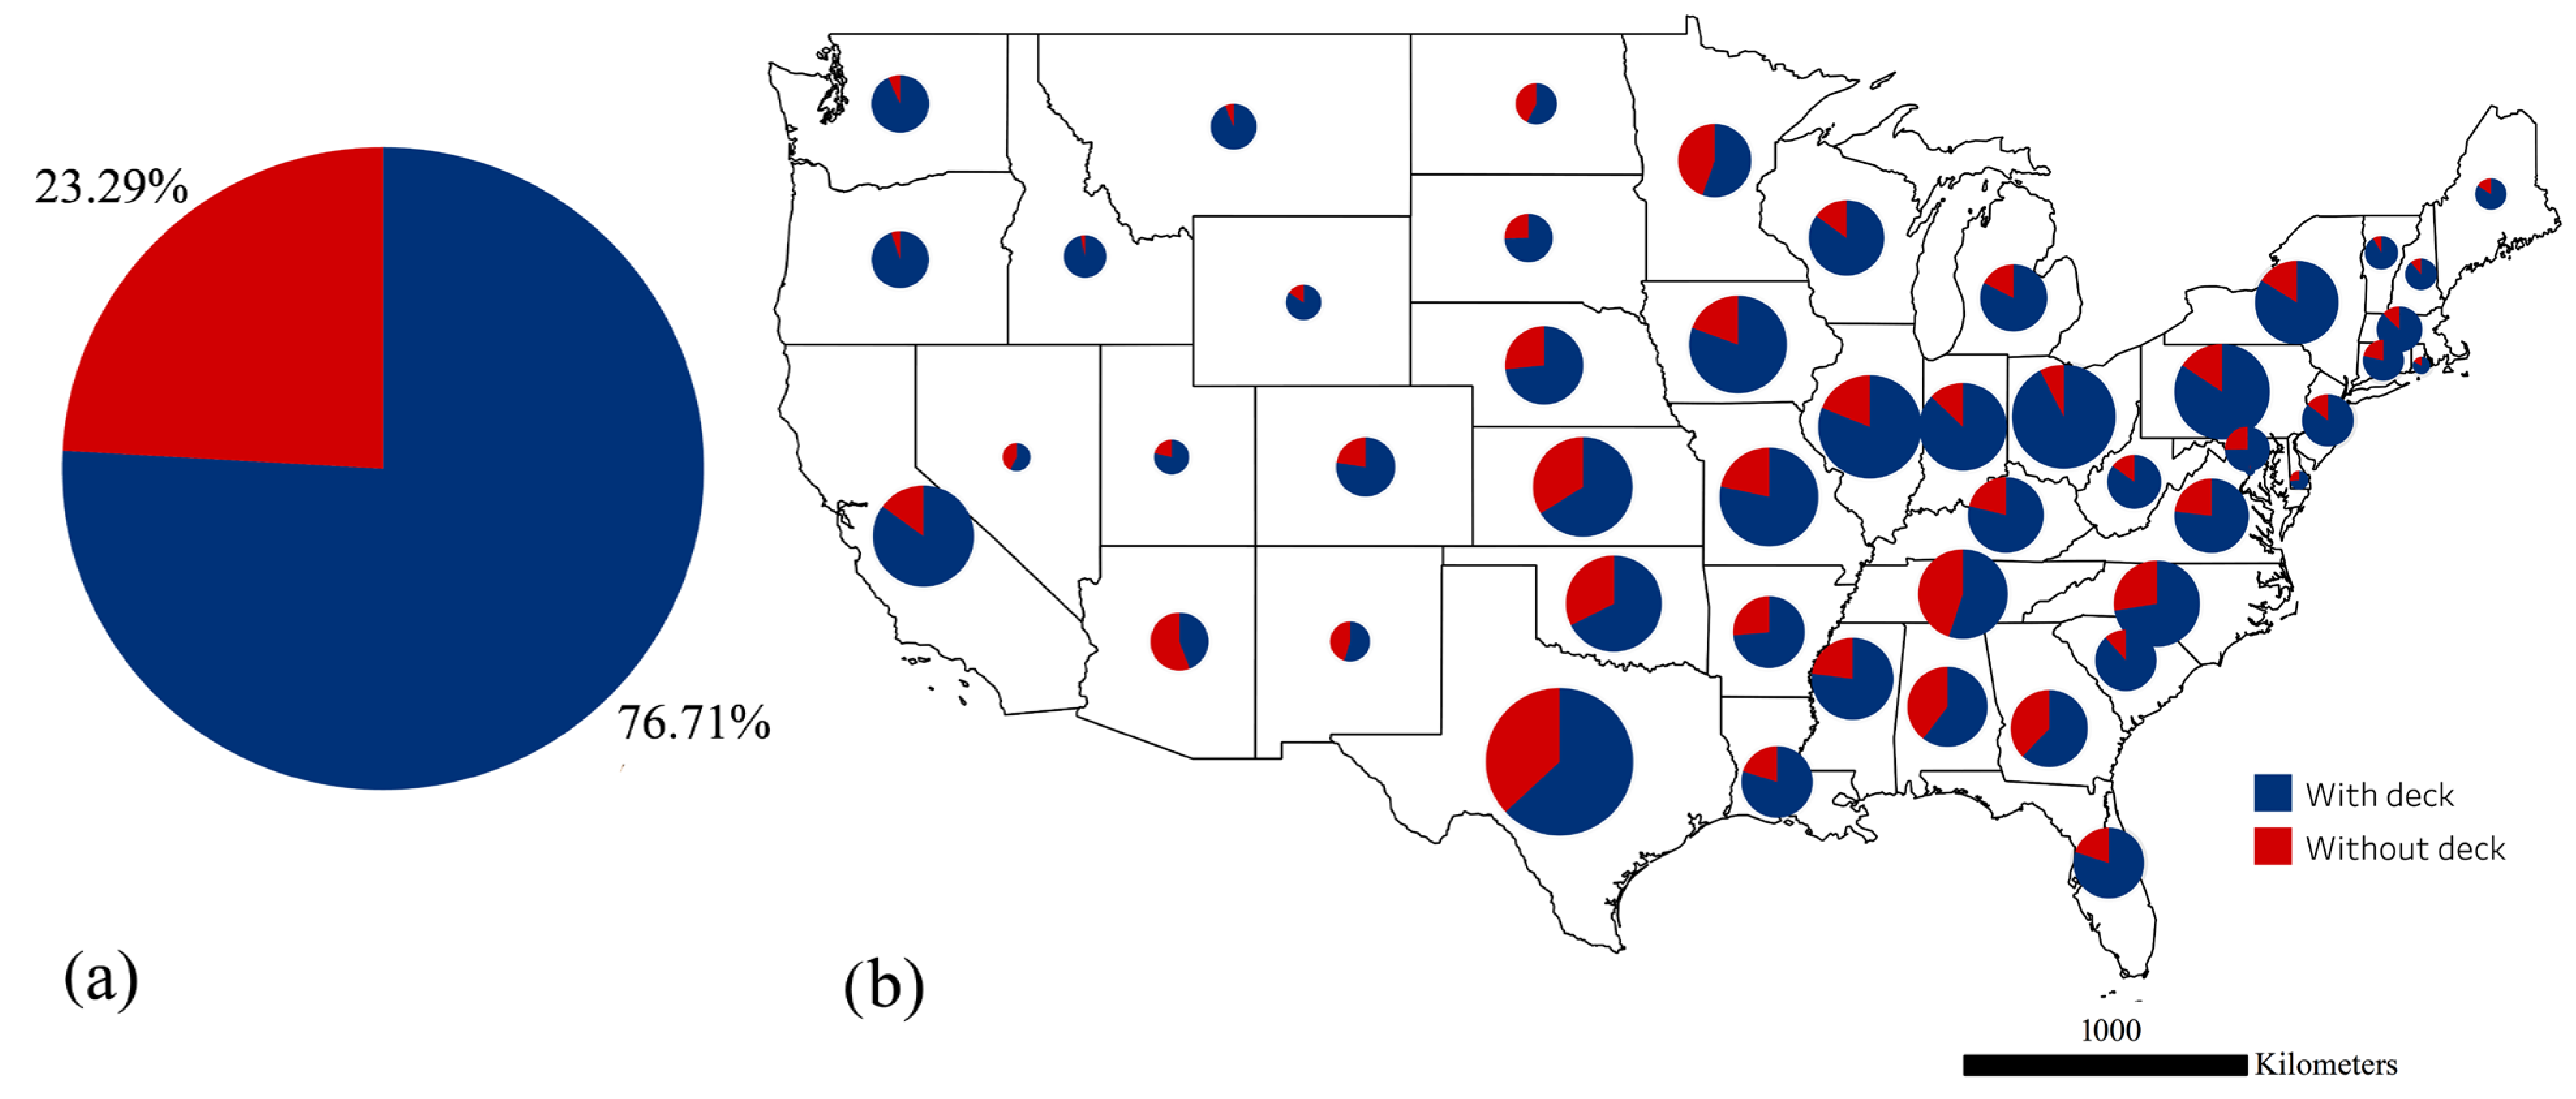
Statistical analysis of the bridge data of 2020 indicates that 76.71% of the structures in the year 2020 across the United States were bridge decks, while only 23.29% were structures without decks. Figure 7 illustrates the distribution of bridge decks in the United States and in each state. Figure 7 highlights a noteworthy contrast in the year 2020: in Arizona, less than half of the structures were bridge decks, whereas in some states like New Mexico, Texas, Oklahoma, Kansas, North Dakota, Minnesota, Tennessee, Alabama, Georgia, and North Dakota, bridge decks constituted slightly over 75% of the total. It is worth noting that in certain states such as Washington, Oregon, Idaho, and Montana, bridge decks made up more than 10% of the total.
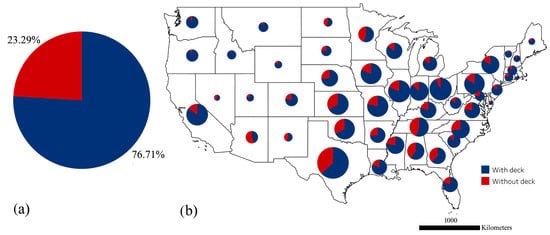
Figure 7.
The distribution of bridge decks (a) in the United States and (b) in each state.
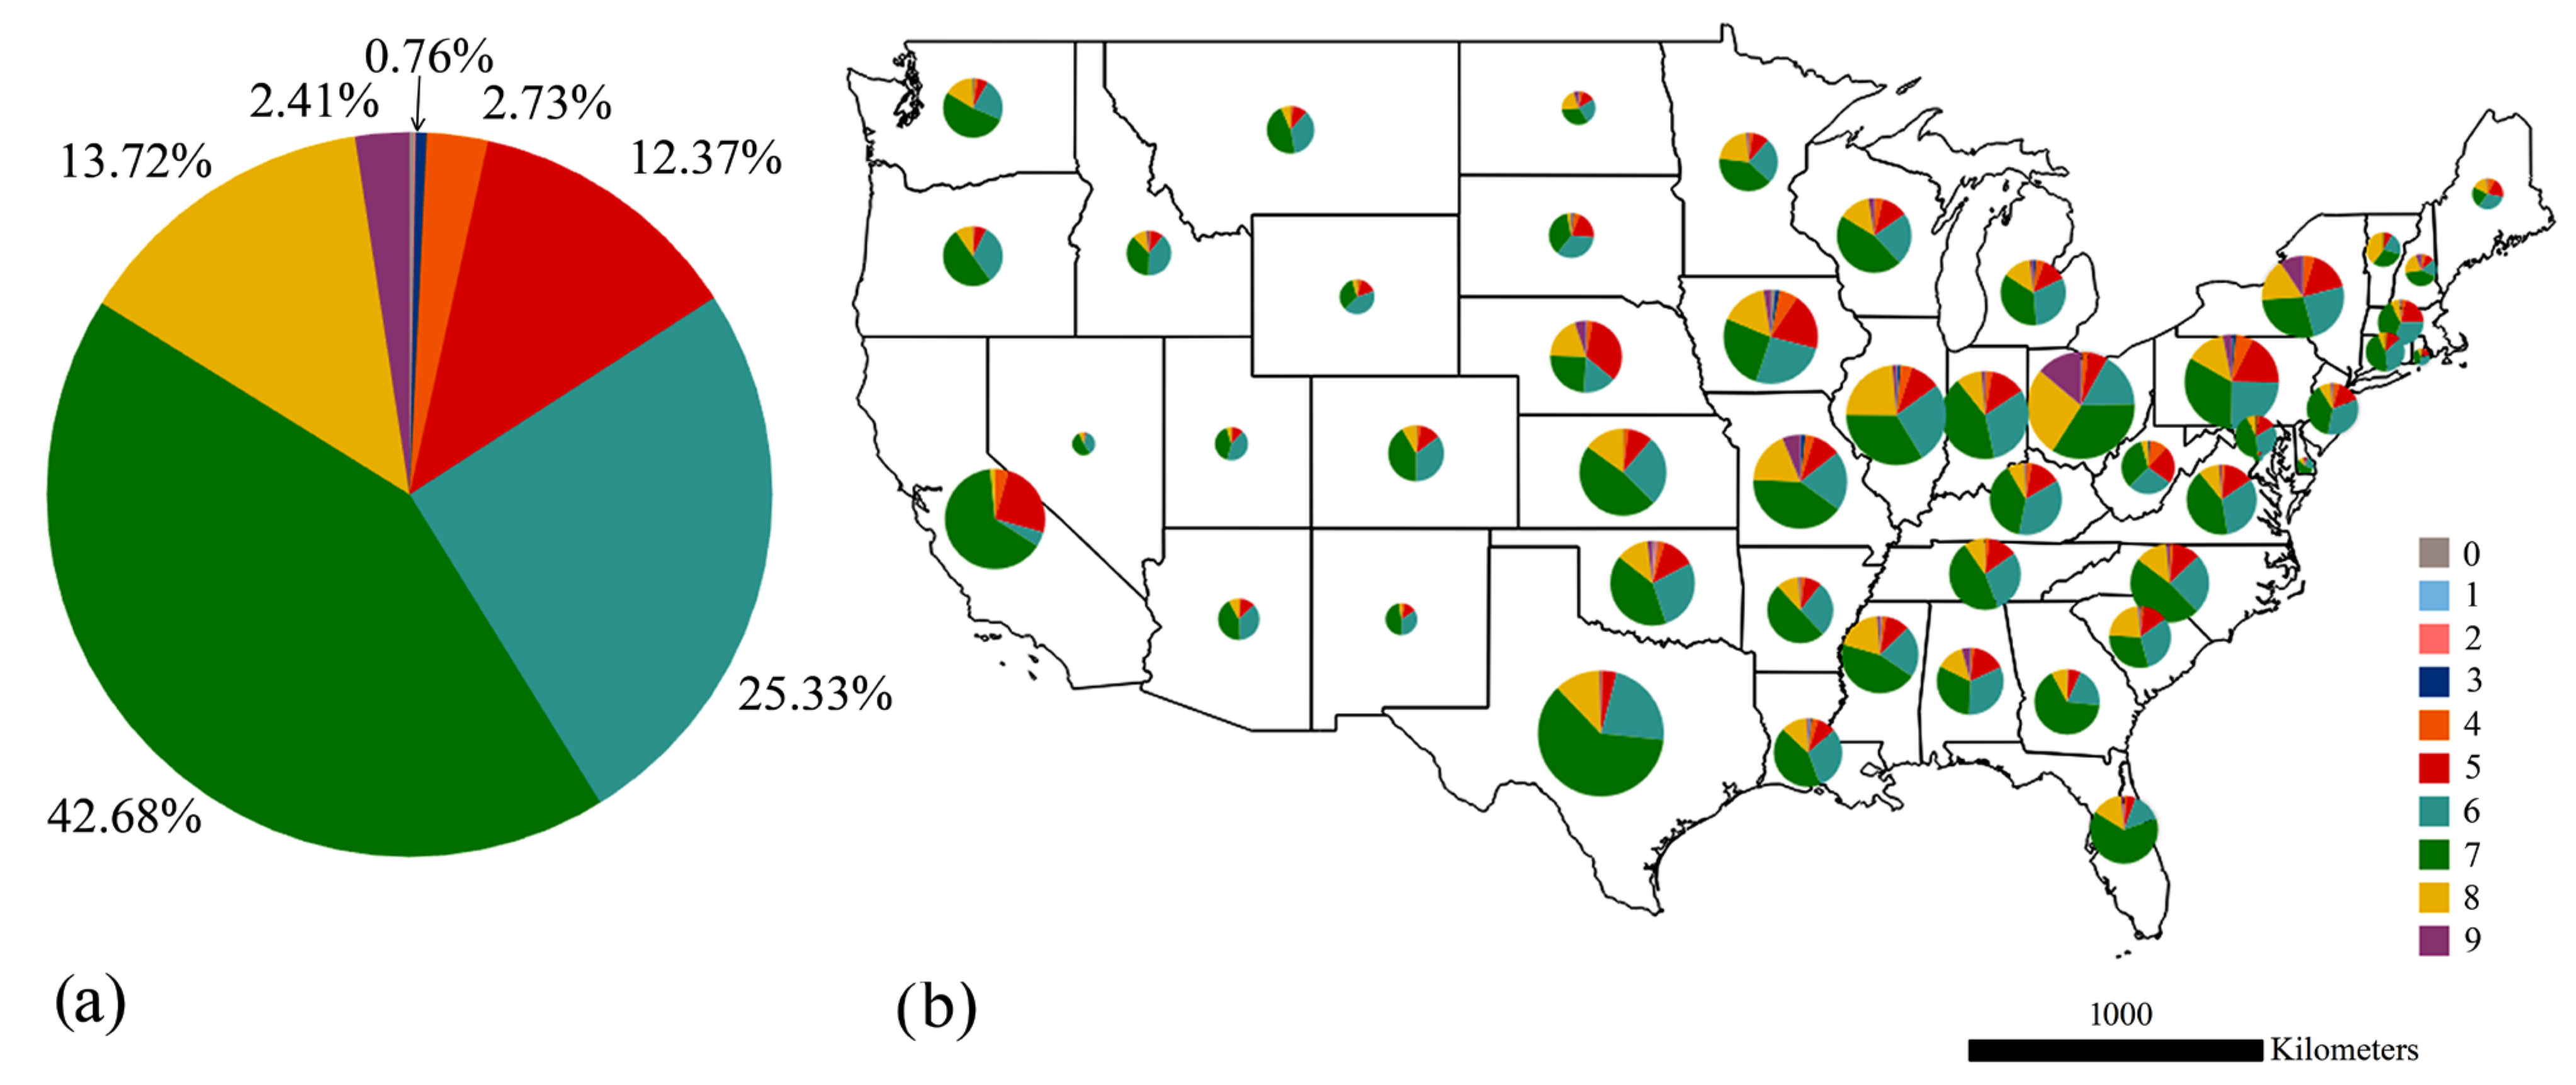
Figure 8 displays the distribution of bridge decks with 10 different condition ratings, from 0 to 9, in the United States and in each state. As depicted in Figure 8, a small fraction of bridge decks (2.41%) in the year 2020 had a condition rating of 9, while those with a condition rating of 8 accounted for 13.72% of the nation’s bridge decks. It is noteworthy that the largest proportion of bridge decks (42.68%) had a condition rating of 7, followed by 25.33% with a condition rating of 6, and 12.37% with a condition rating of 5. Meanwhile, only 2.73% of bridge decks had a condition rating of 4, and 0.76% had condition ratings of 0, 1, 2, and 3. These proportions emphasize the significant imbalance in the distribution of bridge decks across the United States and within each state when considering ten different condition ratings.
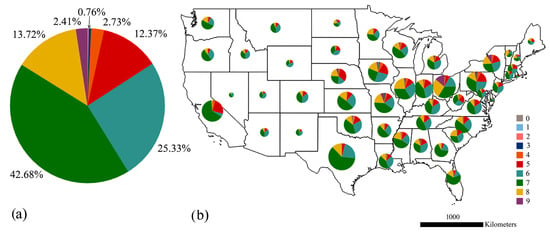
Figure 8.
The distribution of bridge decks with different condition ratings, from 0 to 9 (a) in the United States and (b) in each state.
Subsequently, both datasets were cleaned by removing structures without decks, instances with missing or invalid values, and duplicate records. In this context, invalid values refer to negative values found in the numerical predictor variables listed in Table 4. Only distinct values were retained by removing duplicate records. Table 6 lists the number of instances removed from the bridge data of 2020 and the five-year historical bridge data (2016–2020). According to Table 6, a total of 213,133 and 1,523,198 bridge decks were removed from the bridge data of 2020 and the five-year historical bridge data (2016–2020), respectively.

Table 6.
The number of instances removed from the bridge data of 2020 and the five-year historical bridge data (2016–2020).
4.4. Data Partitioning
After cleaning, 399,255 and 1,557,827 bridge decks were retained for analysis in the bridge data of 2020 and the five-year historical bridge data (2016–2020), respectively. Next, the observations of bridge decks in each bridge dataset were randomly divided into an 80% training set and a 20% test set. The training sets were used to train models, while the test sets were used to evaluate their performance. Table 7 represents the number of bridge decks in the bridge data of 2020 and the five-year historical bridge data (2016–2020) that were used to train models and evaluate their performance. According to Table 7, 319,404 and 1,246,261 bridge decks in the bridge data of 2020 and the five-year historical bridge data (2016–2020) were used to train models, while 79,851 and 311,566 bridge decks in the bridge data of 2020 and the five-year historical bridge data (2016–2020) were used to evaluate their performance.

Table 7.
The number of bridge decks in the bridge data of 2020 and the five-year historical bridge data (2016–2020) that were used to train models and evaluate their performance.
4.5. Model Performance
The models’ performance was evaluated using two metrics calculated on the test set: namely, overall accuracy and average F1 score. The overall accuracy represents the percentage of correctly classified instances out of the total number of instances. On the other hand, average F1 score is the mean of the F1 scores of all classes, where the F1 score is the harmonic mean of precision and recall [62] for a given class, which is calculated by Equation (3):
where precision is the proportion of true positive predictions among all positive predictions, and recall is the proportion of true positive predictions to the total number of actual positive cases.
5. Results of Training and Evaluating Models
From the variety of available classification models in the literature, we chose to use two tree-based ensemble models, namely Random Forest and XGBoost, as well as a more complex model, namely ANN. These models were deemed appropriate for the present study due to their common characteristics. Firstly, they have been successful in data-driven structural health-monitoring [63,64,65,66,67] and investigating infrastructure problems in previous studies [28,33,68,69]. Secondly, the existing studies have demonstrated the effectiveness of Random Forest [70,71], XGboost [22,28], and ANN [25,29,33,72,73] in capturing the complex and nonlinear relationships among the variables involved in predicting bridge condition rating. The following is a general overview of the models trained and evaluated in this study.
5.1. Random Forest
According to the original formulation by Breiman [74], Random Forest is a tree-based ensemble that uses bootstrap samples and randomness in the tree-building procedure. The decorrelation between trees achieved this way leads to significant improvement in accuracy estimated either using an OOB or a test set [75,76]. According to Hastie, Tibshirani, Friedman, and Friedman [49], the predictions on OOB data are used to compute OOB error, which is almost identical to that obtained by -fold cross-validation. Two parameters, including (number of trees) and (number of predictor variables), need to be tuned for estimating a Random Forest model [77]. The number of trees can be determined experimentally by adding the successive trees until the OOB error stabilizes [78,79,80]. While the Random Forest yields the optimal performance on most datasets with the default value of , e.g., the square root of the total number of predictor variables [81,82,83].
The Random Forest models in this study were implemented in the R programming language, version 4.2.0, using the ranger package, version 0.13.1. The default hyperparameters for the ranger package in classification tasks are = 500 and , where indicates the number of predictor variables. The best hyperparameters were selected based on the lowest and stabilized OOB error. Two Random Forest models were developed using the training sets derived from the bridge data of 2020 and the five-year historical bridge data (2016–2020). The Random Forest models were fine-tuned by optimizing the and parameters based on the OOB error on the training set. Trees were added incrementally until the OOB error on the training set reached a stabilized state. Additionally, the optimized value of was selected by finding the minimum OOB error across values ranging from 5 to 11. The OOB error curve became stable after 500 trees, and there was minimal variation (0.1%) in the OOB error for values ranging from 5 to 11. Consequently, the Random Forest models for the bridge data of 2020 and the five-year historical bridge data (2016–2020) were trained using the default values of (e.g., 500) and (e.g., 5) in approximately 4 and 73 min, respectively. Then, the test sets were utilized to evaluate the performance of the developed Random Forest classifiers.
Table 8 presents the confusion matrix of the Random Forest classifier on the test set of the bridge data of 2020. As indicated in Table 8, the Random Forest model achieved an overall accuracy of 58.1% and an average F1 score of 39.7%, indicating a noteworthy difference of 18.4% between the two metrics on the test set. According to Table 8, the Random Forest model could not efficiently learn the underlying pattern when dealing with only 16 bridge decks with a condition rating of 1, resulting in the lowest F1 score of 11.8%. Conversely, when dealing with a substantial number of bridge decks, such as 34,162 with a condition rating of 7, the Random Forest model excelled and achieved the highest F1 score of 69.7% for this condition rating.

Table 8.
The confusion matrix of the Random Forest classifier on the test set of the bridge data of 2020.
Table 9, on the other hand, exhibits the confusion matrix of the Random Forest classifier on the test set of the five-year historical bridge data (2016–2020). According to Table 9, the Random Forest achieved an overall accuracy of 83.4% and an average F1 score of 79.7%, indicating a lower difference of 3.7% between the two metrics on the test set. The notably improved performance of the Random Forest model, which was trained using the historical bridge data, can be attributed to its utilization of more extensive bridge data, enabling it to capture the underlying pattern effectively. Additionally, the reduced disparity between the overall accuracy and the average F1 score of the Random Forest model, trained using the historical bridge data, suggests that the second model exhibits less performance variation across the ten imbalanced condition ratings and hence is more consistent in its performance.

Table 9.
The confusion matrix of the Random Forest classifier on the test set of the five-year historical bridge data (2016–2020).
5.2. XGBoost
XGBoost, developed by Chen and Guestrin [84], iteratively builds an ensemble of decision trees, with each tree trained to correct the errors made by previous tree(s). The predictions from all these weak learners are then combined through a weighted majority vote to produce the final prediction [85]. XGBoost, which utilizes small decision trees with fewer splits, produces a more interpretable model.
The XGBoost models in this study were developed in the R programming language, version 4.2.0, using the xgboost package [86], version 1.6.0.1. The models were built using the default values provided by the package. The “number of boosting iterations” refers to the total number of base learners generated by the algorithm. Each base learner is built to reduce the error of the previous base learner. Overfitting can occur with too many iterations and underfitting can occur with too few, so early stopping is applied to monitor the validation loss and stop training when the model stops improving [87]. The learning rate determines the step size for updating the weights of each feature to optimize the objective function. A trade-off exists between the learning rate and the number of iterations, with a small learning rate requiring a larger number of iterations for sufficient convergence [88]. The log loss, also known as cross-entropy loss, is used to measure the performance of the classification model. A higher log loss indicates a larger discrepancy between the predicted probability and the actual label [89].
Two XGBoost models were developed using training sets of the bridge data of 2020 and the five-year historical bridge data (2016–2020). Table 10 lists the parameter values used for training the XGBoost models using the training sets of the bridge data of 2020 and the five-year historical bridge data (2016–2020). The “early_stopping_rounds” parameter was utilized to stop the training process once the model’s performance stabilized. The XGBoost model for the bridge data of 2020 completed training after approximately 4 min at 176 iterations, as the model’s performance did not improve during the final three iterations on the test set. On the other hand, the XGBoost model for the five-year historical bridge data (2016–2020) demonstrated gradual improvement over 10,000 iterations and concluded training after approximately 894 min. Subsequently, the test sets were employed to evaluate the performance of the developed XGBoost classifiers.

Table 10.
The parameter values used for training the XGBoost models using the training sets of the bridge data of 2020 and the five-year historical bridge data (2016–2020).
Table 11 presents the confusion matrix of the XGBoost classifier on the test set of the bridge data of 2020. As indicated in Table 11, the XGBoost classifier achieved an overall accuracy of 55.4% and an average F1 score of 39.2%, indicating a noteworthy difference of 16.2% between the two metrics on the test set. Additionally, Table 11 highlights that the XGBoost model exhibits lower recall when classifying bridge decks with condition ratings of 3 and 4 in comparison to classification of bridge decks with higher condition ratings. The tendency of the XGBoost model to classify bridge decks with condition ratings of 3 and 4 as higher condition ratings, such as 5 and 6, might be attributed to the limited number of bridge decks with 3 and 4 condition ratings compared to those with higher condition ratings.

Table 11.
The confusion matrix of the XGBoost classifier on the test set of the bridge data of 2020.
Table 12, on the other hand, exhibits the confusion matrix of the XGBoost classifier on the test set of the five-year historical bridge data (2016–2020). According to Table 12, the XGBoost classifier achieved an overall accuracy of 79.4% and an average F1 score of 77.5%, indicating a lower difference of 1.9% between the two metrics on the test set. The notably improved performance of the XGBoost model, which was trained using the historical bridge data, can be attributed to utilization of more extensive bridge data, enabling it to capture the underlying pattern effectively. Additionally, the reduced disparity between the overall accuracy and the average F1 score of the XGBoost model, trained using the historical bridge data, suggests that the second model exhibits less performance variation across the ten imbalanced condition ratings and hence is more consistent in its performance.

Table 12.
The confusion matrix of the XGBoost classifier on the test set of the five-year historical bridge data (2016–2020).
5.3. ANN
ANN is capable of approximating complexity based on a parallel and layered structure [24]. The information flow in an ANN model happens through communication among three types of layers: input, hidden, and output layers. While a single-hidden-layer ANN can only address linear separable patterns [90], a Deep Neural Network (DNN) with multiple hidden layers can learn more complex nonlinear relationships between inputs and outputs [91].
The key parameters of ANN include the number of hidden layers, number of nodes in each hidden layer, dropout layers, and activation functions. The number of hidden layers can significantly impact the performance of the network; more hidden layers potentially improve accuracy but also increase complexity [92]. The number of nodes in each hidden layer determines the complexity of the network. Too few nodes may result in underfitting, while too many nodes may lead to overfitting [93]. Dropout layers prevent overfitting in neural networks by randomly dropping out a portion of neurons during the training process [94]. The right activation function can improve the performance of the network [95]. The common activation functions are as follow:
- Sigmoid, described in Equation (4), looks like an s-shape and is used to predict the probability that varies between 0 and 1.
- 2.
- The Hyperbolic Tangent (TanH), described in Equation (5), is also sigmoidal (s-shaped). The range of TanH is between −1 and 1.
- 3.
- The Rectified Linear Unit (ReLU), described in Equation (6), is the most common activation function with better performance than other functions [96]. ReLU will output input directly if it is positive, otherwise, it will output zero.
- 4.
- The Scaled Exponential Linear Unit (SELU), described in Equation (7), automatically converges to a zero mean and unit variance.
where and are the following approximate values:
- 5.
- The Softmax activation function, described in Equation (8), is a combination of multiple sigmoid functions that can be used as a function in the output layer of an ANN in multiclass classification problems. The function for every data point of all individual classes returns the probability [95]. Then the class of each data point is identified based on the highest probability.
The ANN models in this study were implemented in the R programming language, version 4.2.0, using the keras package [97], version 2.9.0. Two ANN models were developed using training sets of the bridge data of 2020 and the five-year historical bridge data (2016–2020). The number of nodes in the input layer was equivalent to the number of predictor variables, and the number of nodes in the output layer was equal to the number of classes in the response variable (ten deck condition ratings from 0 to 9). The random grid search along with 10-fold cross-validation were used to determine the key parameters of the ANN model, including number of hidden layers, activation functions, number of nodes in each hidden layer, and dropout layers. The grid search explored various configurations, ranging from 1 to 5 hidden layers, different activation functions (ReLU, SELU, TanH), different number of nodes (ranging from 32 to 512), and various ratios for dropout layers (varying from 0.1 to 0.5). The optimal configuration was determined based on overall accuracy and average F1 score on the test set. Table 13 presents the parameter values employed for training the ANN models using the training sets of the bridge data of 2020 and the five-year historical bridge data (2016–2020).

Table 13.
The parameter values employed for training the ANN models using the training sets of the bridge data of 2020 and the five-year historical bridge data (2016–2020).
The ANN models, consisting of multiple hidden layers, with input layer consisting of 250 nodes, and output layer consisting of 10 nodes, were developed. The models used ReLU activation functions in the hidden layers, Softmax in the output layer, and dropout layers with predefined ratios to reduce overfitting. The models were trained using the Adam optimization algorithm with categorical_crossentropy loss and 100 epochs. It took approximately 5 and 225 min to train the ANN models using the bridge data of 2020 and the five-year historical bridge data (2016–2020), respectively. Subsequently, the test sets were employed to evaluate the performance of the developed ANN classifiers.
Table 14 presents the confusion matrix of the ANN classifier on the test set of the bridge data of 2020. As indicated in Table 14, the ANN classifier achieved an overall accuracy of 55.6% and an average F1 score of 38.7%, indicating a noteworthy difference of 16.9% between the two metrics on the test set. Additionally, Table 14 highlights that the ANN model exhibits lower recall when classifying bridge decks with condition ratings of 3 and 4 in comparison to classification of bridge decks with higher condition ratings. The tendency of the ANN model to classify bridge decks with condition ratings of 3 and 4 as higher condition ratings, such as 5 and 6, might be attributed to the limited number of bridge decks with 3 and 4 condition ratings compared to those with higher condition ratings.

Table 14.
The confusion matrix of the ANN classifier on the test set of the bridge data of 2020.
Table 15 on the other hand, exhibits the confusion matrix of the ANN classifier on the test set of the five-year historical bridge data (2016–2020). According to Table 15, the ANN classifier achieved an overall accuracy of 79.7% and an average F1 score of 78.4%, indicating a lower difference of 1.3% between the two metrics on the test set. The notably improved performance of the ANN model, which was trained using the historical bridge data, can be attributed to utilization of more extensive bridge data, enabling it to capture the underlying pattern effectively. Additionally, the reduced disparity between the overall accuracy and the average F1 score of the ANN model, trained using the historical bridge data, suggests that the second model exhibits less performance variation across the ten imbalanced condition ratings and hence is more consistent in its performance.

Table 15.
The confusion matrix of the ANN classifier on the test set of the five-year historical bridge data (2016–2020).
6. Model Selection and Discussion
Given that the three models were trained using identical training sets and were evaluated using the same test sets, it seems reasonable to assess their effectiveness for prediction purposes by examining training time and prediction performance. Table 16 lists the training time and prediction performance of the three models that were trained and evaluated using the bridge data of 2020 and the five-year historical bridge data (2016–2020). According to Table 16, when the models were trained using the 319,404 bridge decks in the bridge data of 2020, the Random Forest model achieved 58.1% overall accuracy and 39.7% average F1 score in just 4 min. The XGBoost model was also trained in 4 min and obtained 55.4% overall accuracy and 39.2% average F1 score. The ANN model was trained in 5 min and obtained 55.6% overall accuracy and 38.7% average F1 score.

Table 16.
The training time and prediction performance of the three models that were trained and evaluated using the bridge data of 2020 and the five-year historical bridge data (2016–2020).
According to Table 16, when the 1,246,261 bridge decks in the five-year historical bridge data (2016–2020) were used to train models, the Random Forest model was trained in 73 min and achieved 83.4% overall accuracy and 79.7% average F1 score. While the XGBoost model was trained in 894 min and obtained 79.4% overall accuracy and 77.5% average F1 score. The ANN model achieved 79.7% overall accuracy and 78.4% average F1 score after being developed in 225 min.
These findings indicate that the inclusion of five years of historical bridge data (2016–2020) significantly enhances the predictive capabilities of the models compared to relying solely on the bridge data of 2020. This underscores that the historical bridge data offers adequate data for the algorithms to learn from, leading to the accurate classification of bridge decks into ten distinct condition ratings. To elaborate, a single year of bridge data includes one record for each bridge deck in the United States, constituting only one feature vector (a numerical representation of a record) within the feature space (a multi-dimensional space representing feature vectors). Conversely, multi-year bridge data involves multiple records for each bridge deck in the United States, contributing to numerous feature vectors within the feature space. Given that the characteristics of a bridge deck may not undergo significant changes within a few years, and its climate region remains constant, the incorporation of data spanning multiple years generates denser feature vectors within the feature space. This denser representation allows the ML models to better discern the underlying patterns within the bridge data, thereby enabling them to draw more accurate decision boundaries to distinguish the ten classes representing ten different deck condition ratings. As a result, this substantial increase in data significantly enhances the models’ performance compared to learning from just one year of bridge data.
Therefore, using historical bridge data, all the three models demonstrate proficiency in predicting the condition rating of the nation’s bridge decks. Notably, the Random Forest model, as can be seen in Table 9, effectively classifies bridge decks with condition ratings of 3 and 4, achieving average F1 scores of 77.1% and 76.2%, respectively. Similarly, the XGBoost model, as illustrated in Table 12, accurately categorizes bridge decks with condition ratings of 3 and 4, achieving average F1 scores of 76.6% and 74.2%, respectively. Moreover, the ANN model, as can be seen in Table 15, effectively classifies bridge decks with condition ratings of 3 and 4, achieving average F1 scores of 81.1% and 79.6%, respectively. These observations underscore the three models’ ability to avoid misclassifying bridge decks with low condition ratings as having high condition ratings, thereby mitigating uncertainty in maintenance decision-making.
Therefore, the Random Forest, XGBoost, and ANN models, trained with historical bridge data, serve as valuable tools to estimate the future condition rating of a bridge deck. With knowledge of the characteristics and climate region of a particular bridge deck in a specific year, infrastructure managers can leverage these models to effectively allocate maintenance resources, particularly focusing on bridge decks anticipated to have a significant need, thereby saving both costs and time in the overall maintenance strategy. Although these models, trained using historical bridge data, appear to be efficient models for the purpose of condition rating prediction of the nation’s bridge decks, there are numerous bridge decks that were misclassified. Sources of errors that cause misclassified bridge decks can be addressed in three categories.
The first source of error can be attributed to the inherent variability in human perception during the assignment of condition rating to a bridge deck. Essentially, an inspector tends to demonstrate a margin of ±1 error when determining a condition rating. Consequently, incorporating bridge decks, whose predicted ratings fall within this ±1 margin of error as correct predicted condition ratings, significantly enhances the overall accuracy of classification models. As an example, this inclusion results in an increase in overall accuracies from 83.4% to 97.3% for the Random Forest model, from 79.4% to 96.6% for the XGBoost model, and from 79.7% to 97.1% for the ANN model, when the five-year historical bridge data (2016–2020) are employed as the dataset. This suggests that considering the errors introduced by human assessment when evaluating the performance of classification models results in models achieving overall accuracies exceeding 90%. Consequently, neglecting the human-induced errors in assessing classification model performance leads to differences between models’ performances.
The second source of error can be attributed to the data quality. In particular, the initial values of the predictor variables corresponding to the misclassified bridge decks, with a margin of ±1 the correct predictions, should be investigated. If possible, erroneous values should be corrected, otherwise the corresponding bridge deck should be removed from the dataset. Subsequently, the models should be retrained using the refined and high-quality dataset. The third source of error can be linked to the lack of incorporating other predictor variables introduced by the big bridge data analytics framework proposed by Liu and El-Gohary [23,98], such as hazard data, National Bridge Element (NBE) data, textual inspection, and maintenance reports.
To investigate whether Random Forest, XGBoost, and ANN models exhibit the same performance when a subset of the bridge data is utilized as the dataset, it is necessary to draw a sample that represents the characteristics of the entire population of over 460,000 of the nation’s bridge decks. This can be accomplished by employing stratified sampling and randomly selecting bridge decks from the population. Subsequently, the models should be trained and assessed using the collected sample. Then, a comparison should be made between the performance of the models on the sample and their performance on the entire population. This comparison serves to determine whether these models demonstrate consistent performance when a sample of bridge decks is utilized as the dataset.
7. Conclusions and Future Work
The objective of this study was to evaluate the effectiveness of the Random Forest, XGBoost, and ANN algorithms in accurately predicting the condition rating of bridge decks in the United States. For doing so, the study employed an approach to develop bridge data in the United States by utilizing remote sensing and GIS technologies to collect NBI, traffic, and climate regions. This approach allowed for the creation of bridge data in a single year, as well as historical bridge data spanning several years. To conduct experimental investigations, datasets for the year 2020 and a historical dataset covering a five-year period from 2016 to 2020 were created and used to develop three models. This study created datasets for the year 2020 and a historical dataset covering a five-year period from 2016 to 2020 by incorporating NBI, traffic, and climate regions to develop three models: Random Forest, XGBoost, and ANN.
Subsequently, 20 variables, identified through literature review and engineering judgments, were employed as predictor variables and 10 different deck condition ratings were introduced as the response variable. The preprocessed bridge datasets were then divided into an 80% training set and a 20% test set to train and evaluate models. The findings demonstrate that using historical bridge data significantly enhances the predictive performance of the models compared to using data from a single year. This implies that the historical bridge data that incorporates multi-year bridge data provides adequate information for the models to learn and hence improves their predictive performance. The experimental results indicate that, when trained using historical bridge data, the Random Forest, XGBoost, and ANN models exhibited overall accuracies of 83.4%, 79.4%, and 79.7%, respectively. Additionally, they achieved average F1 scores of 79.7%, 77.5%, and 78.4%, respectively. This implies that the Random Forest, XGBoost, and ANN models, trained using the five years of bridge data, could effectively predict the condition ratings of bridge decks across the United States.
Notably, the permutation-based variable importance suggests that the age of a deck or the number of years since the last major reconstruction was the most important predictor variable contributing to bridge deck deterioration. In addition, climate regions were identified as the second most critical variable influencing the development of the model. This suggests that the deterioration of bridge decks depends on their locations. Furthermore, traffic was recognized as another critical factor accelerating deterioration of a bridge deck. Additionally, various bridge deck characteristics, like deck type, were also recognized for their influence on the predictive performance of deterioration models. It is evident that the reconstruction of a bridge deck can delay its deterioration, aligning with the recognition of “Reconstructed” as an important factor. Therefore, to develop a bridge deck deterioration model, it seems essential to incorporate NBI, traffic, and climate regions.
In conclusion, this study underscores the efficacy of the Random Forest, XGBoost, and ANN algorithms, trained with historical bridge data that includes NBI, traffic, and climate data. The developed models serve as promising tools for accurately predicting the condition rating of bridge decks in the United States. The predicted condition ratings by these models can be utilized to efficiently monitor the deterioration of the nation’s bridge decks, particularly those located in urban areas experiencing high traffic volumes. By plugging in the age of a particular bridge deck in each year, along with its climate region, traffic details, and other relevant characteristics into the trained model, one can predict the future condition ratings of that bridge deck. These estimated condition ratings over time enable decision makers to proactively plan maintenance, rehabilitation, or reconstruction efforts, ensuring timely preservation of bridge decks that contribute to the safety of public commutes.
Although the Random Forest, XGBoost, and ANN models, trained using the five-year historical bridge data (2016–2020), were recognized as the accurate models for classifying the nation’s bridge decks, further research seems required. The research should incorporate longer historical bridge data spanning multiple years, which has been available since 1992, and evaluate its impact on the performance of the models. Additionally, the development of other ML models using historical bridge data and evaluation of their performance are recommended. Future work should continue to explore the potential of leveraging ML and AI algorithms to enhance the health monitoring of infrastructure.
Author Contributions
Conceptualization, F.F.; methodology, F.F. and F.S.N.F.; software, F.F. and F.S.N.F.; validation, F.F. and F.S.N.F.; formal analysis, F.F. and F.S.N.F.; investigation, F.F. and F.S.N.F.; resources, F.F. and F.S.N.F.; data curation, F.F. and F.S.N.F.; writing—original draft preparation, F.F. and F.S.N.F.; writing—review and editing, F.F. and F.S.N.F.; visualization, F.F. and F.S.N.F.; supervision, F.F.; project administration, F.F. All authors have read and agreed to the published version of the manuscript.
Funding
This research was performed under an appointment to the U.S. Department of Homeland Security (DHS) Science & Technology (S&T) Directorate Office of University Programs Summer Research Team Program for Minority Serving Institutions, administered by the Oak Ridge Institute for Science and Education (ORISE) through an interagency agreement between the U.S. Department of Energy (DOE) and DHS. ORISE is managed by ORAU under DOE contract number DE-SC0014664. All opinions expressed in this paper are the authors’ and do not necessarily reflect the policies and views of DHS, DOE, or ORAU/ORISE.
Data Availability Statement
The data and code presented in this study are openly available in Fard, F. (2023). UnitedStates-HistoricalBridgeData-2016to2020 at https://doi.org/10.5281/zenodo.10447902 (accessed on 31 December 2023).
Conflicts of Interest
The authors declare no conflicts of interest. The funders had no role in the writing of the manuscript or in the decision to publish the results.
References
- Creary, P.A.; Fang, F.C. Forecasting long-term bridge deterioration conditions using artificial intelligence techniques. Int. J. Intell. Syst. Technol. Appl. 2014, 13, 280–293. [Google Scholar] [CrossRef]
- Hooks, J.M.; Frangopol, D.M. LTBP Bridge Performance Primer; United States, Federal Highway Administration, Office of Infrastructure: Washington, DC, USA, 2013. [Google Scholar]
- ARTBA. Bridge Report; American Road and Transportation Builders Association: Washington, DC, USA, 2022. [Google Scholar]
- ASCE. Report card for America’s Infrastructure. 2022. Available online: https://infrastructurereportcard.org/cat-item/bridges-infrastructure/ (accessed on 1 November 2023).
- Zulifqar, A.; Cabieses, M.; Mikhail, A.; Khan, N. Design of a Bridge Inspection System (BIS) to Reduce Time and Cost; George Mason University: Farifax, VA, USA, 2014. [Google Scholar]
- Jeong, Y.; Kim, W.; Lee, I.; Lee, J. Bridge inspection practices and bridge management programs in China, Japan, Korea, and US. J. Struct. Integr. Maint. 2018, 3, 126–135. [Google Scholar]
- Ranjith, S.; Setunge, S.; Gravina, R.; Venkatesan, S. Deterioration prediction of timber bridge elements using the Markov chain. J. Perform. Constr. Facil. 2013, 27, 319–325. [Google Scholar] [CrossRef]
- Hasan, S.; Elwakil, E. National bridge inventory data-based stochastic modeling for deck condition rating of prestressed concrete bridges. Pract. Period. Struct. Des. Constr. 2020, 25, 04020022. [Google Scholar] [CrossRef]
- Huang, Y.-H. Artificial neural network model of bridge deterioration. J. Perform. Constr. Facil. 2010, 24, 597–602. [Google Scholar] [CrossRef]
- Liu, H.; Madanat, S. Adaptive optimisation methods in system-level bridge management. Struct. Infrastruct. Eng. 2015, 11, 884–896. [Google Scholar] [CrossRef]
- Morcous, G.; Rivard, H.; Hanna, A. Modeling bridge deterioration using case-based reasoning. J. Infrastruct. Syst. 2002, 8, 86–95. [Google Scholar] [CrossRef]
- Qiao, Y.; Moomen, M.; Zhang, Z.; Agbelie, B.; Labi, S.; Sinha, K.C. Modeling deterioration of bridge components with binary probit techniques with random effects. Transp. Res. Rec. 2016, 2550, 96–105. [Google Scholar] [CrossRef]
- Chang, M.; Maguire, M.; Sun, Y. Framework for mitigating human bias in selection of explanatory variables for bridge deterioration modeling. J. Infrastruct. Syst. 2017, 23, 04017002. [Google Scholar] [CrossRef]
- Inkoom, S.; Sobanjo, J. Availability function as bridge element’s importance weight in computing overall bridge health index. Struct. Infrastruct. Eng. 2018, 14, 1598–1610. [Google Scholar] [CrossRef]
- Mohammed Abdelkader, E.; Marzouk, M.; Zayed, T. Modeling of Concrete Bridge Decks Deterioration Using a Hybrid Stochastic Model. In Proceedings of the Building Tomorrow’s Society, Fredericton, NB, Canada, 13–16 June 2018. [Google Scholar]
- Cesare, M.A.; Santamarina, C.; Turkstra, C.; Vanmarcke, E.H. Modeling bridge deterioration with Markov chains. J. Transp. Eng. 1992, 118, 820–833. [Google Scholar] [CrossRef]
- Morcous, G. Performance prediction of bridge deck systems using Markov chains. J. Perform. Constr. Facil. 2006, 20, 146–155. [Google Scholar] [CrossRef]
- Ramaswamy, R. Estimation of Latent Pavement Performance from Damage Measurements; Massachusetts Institute of Technology: Cambridge, MA, USA, 1989. [Google Scholar]
- Alipour, M.; Harris, D.K.; Barnes, L.E.; Ozbulut, O.E.; Carroll, J. Load-capacity rating of bridge populations through machine learning: Application of decision trees and random forests. J. Bridge Eng. 2017, 22, 04017076. [Google Scholar] [CrossRef]
- Almarahlleh, N.H. Deterioration Prediction Models for Condition Assessment of Concrete Bridge Decks Using Machine Learning Techniques; Western Michigan University: Kalamazoo, MI, USA, 2021. [Google Scholar]
- Garg, Y.; Masih, A.; Sharma, U. Predicting bridge damage during earthquake using machine learning algorithms. In Proceedings of the 2021 11th International Conference on Cloud Computing, Data Science & Engineering (Confluence), Noida, India, 28–29 January 2021; pp. 725–728. [Google Scholar]
- Kong, X.; Li, Z.; Zhang, Y.; Das, S. Bridge deck deterioration: Reasons and patterns. Transp. Res. Rec. 2022, 2676, 570–584. [Google Scholar] [CrossRef]
- Liu, K.; El-Gohary, N. A smart bridge data analytics framework for enhanced bridge deterioration prediction. In Proceedings of the Construction Research Congress 2020, Tempe, AZ, USA, 8–10 March 2020; pp. 1194–1202. [Google Scholar]
- Ojha, V.K.; Abraham, A.; Snášel, V. Metaheuristic design of feedforward neural networks: A review of two decades of research. Eng. Appl. Artif. Intell. 2017, 60, 97–116. [Google Scholar] [CrossRef]
- Srikanth, I.; Arockiasamy, M. Deterioration models for prediction of remaining useful life of timber and concrete bridges: A review. J. Traffic Transp. Eng. (Engl. Ed.) 2020, 7, 152–173. [Google Scholar] [CrossRef]
- Taunk, K.; De, S.; Verma, S.; Swetapadma, A. A brief review of nearest neighbor algorithm for learning and classification. In Proceedings of the International Conference on Intelligent Computing and Control Systems (ICCS), Madurai, India, 15–17 May 2019; pp. 1255–1260. [Google Scholar]
- Bektas, B.A.; Carriquiry, A.; Smadi, O. Using classification trees for predicting national bridge inventory condition ratings. J. Infrastruct. Syst. 2013, 19, 425–433. [Google Scholar] [CrossRef]
- Lim, S.; Chi, S. Xgboost application on bridge management systems for proactive damage estimation. Adv. Eng. Inform. 2019, 41, 100922. [Google Scholar] [CrossRef]
- Assaad, R.; El-adaway, I.H. Bridge infrastructure asset management system: Comparative computational machine learning approach for evaluating and predicting deck deterioration conditions. J. Infrastruct. Syst. 2020, 26, 04020032. [Google Scholar] [CrossRef]
- Chyad, A.M.; Abudayyeh, O.; Alkasisbeh, M.R. A nonlinear regression-based machine learning model for predicting concrete bridge deck condition. In Proceedings of the 1st International Congress on Engineering Technologies, Irbid, Jordan, 16–18 June 2020; pp. 131–136. [Google Scholar]
- Liu, H.; Nehme, J.; Lu, P. An application of convolutional neural network for deterioration modeling of highway bridge components in the United States. Struct. Infrastruct. Eng. 2023, 19, 731–744. [Google Scholar] [CrossRef]
- Liu, K.; El-Gohary, N. Learning from class-imbalanced bridge and weather data for supporting bridge deterioration prediction. In Advances in Informatics and Computing in Civil and Construction Engineering, Proceedings of the 35th CIB W78 2018 Conference: IT in Design, Construction, and Management, Chicago, IL, USA, 1–3 October 2018; Springer: Cham, Switzerland, 2019; pp. 749–756. [Google Scholar]
- Nguyen, T.T.; Dinh, K. Prediction of bridge deck condition rating based on artificial neural networks. J. Sci. Technol. Civ. Eng. (STCE)-HUCE 2019, 13, 15–25. [Google Scholar] [CrossRef]
- Manafpour, A.; Guler, I.; Radlińska, A.; Rajabipour, F.; Warn, G. Stochastic analysis and time-based modeling of concrete bridge deck deterioration. J. Bridge Eng. 2018, 23, 04018066. [Google Scholar] [CrossRef]
- Radovic, M.; Ghonima, O.; Schumacher, T. Data mining of bridge concrete deck parameters in the national bridge inventory by two-step cluster analysis. ASCE-ASME J. Risk Uncertain. Eng. Syst. Part A Civ. Eng. 2017, 3, F4016004. [Google Scholar] [CrossRef]
- Winn, E.K.; Burgueño, R. Development and Validation of Deterioration Models for Concrete Bridge Decks-Phase 1: Artificial Intelligence Models and Bridge Management System; Michigan Department of Transportation: Lansing, MI, USA, 2013. [Google Scholar]
- Hatami, A.; Morcous, G. Developing Deterioration Models for Nebraska Bridges; Nebraska Transportation Center: Lincoln, NE, USA, 2011. [Google Scholar]
- Hong, T.-H.; Chung, S.-H.; Han, S.-W.; Lee, S.-Y. Service life estimation of concrete bridge decks. KSCE J. Civ. Eng. 2006, 10, 233–241. [Google Scholar] [CrossRef]
- Morcous, G. Modeling bridge deck deterioration by using decision tree algorithms. Transportation Research Record: Journal of the Transportation Research Board; Transportation Research Board: Washington, DC, USA, 2005. [Google Scholar]
- Melhem, H.G.; Cheng, Y.; Kossler, D.; Scherschligt, D. Wrapper methods for inductive learning: Example application to bridge decks. J. Comput. Civ. Eng. 2003, 17, 46–57. [Google Scholar] [CrossRef]
- FHWA. Recording and Coding Guide for the Structure Inventory and Appraisal of the Nation’s Bridges; Federal Highway Administration: Washington, DC, USA, 1995. [Google Scholar]
- Ghonima, O. Statistical Modeling of United States Highway Concrete Bridge Decks; University of Delaware: Newark, DE, USA, 2017. [Google Scholar]
- USDOT. Federal Highway Administration National Bridge Inventory; USDOT: Washington, DC, USA, 2013. [Google Scholar]
- Eesa, A.S.; Orman, Z.; Brifcani, A.M.A. A novel feature-selection approach based on the cuttlefish optimization algorithm for intrusion detection systems. Expert Syst. Appl. 2015, 42, 2670–2679. [Google Scholar] [CrossRef]
- Zebari, R.; Abdulazeez, A.; Zeebaree, D.; Zebari, D.; Saeed, J. A comprehensive review of dimensionality reduction techniques for feature selection and feature extraction. J. Appl. Sci. Technol. Trends 2020, 1, 56–70. [Google Scholar] [CrossRef]
- Mokhtari, S.; Abbaspour, A.; Yen, K.K.; Sargolzaei, A. A machine learning approach for anomaly detection in industrial control systems based on measurement data. Electronics 2021, 10, 407. [Google Scholar] [CrossRef]
- Janitza, S.; Strobl, C.; Boulesteix, A.-L. An AUC-based permutation variable importance measure for random forests. BMC Bioinform. 2013, 14, 119. [Google Scholar] [CrossRef]
- Cutler, A.; Cutler, D.R.; Stevens, J.R. Tree-based methods. In High-Dimensional Data Analysis in Cancer Research; Springer: Berlin/Heidelberg, Germany, 2008; pp. 1–19. [Google Scholar]
- Hastie, T.; Tibshirani, R.; Friedman, J.H.; Friedman, J.H. The Elements of Statistical Learning: Data Mining, Inference, and Prediction; Springer: Berlin/Heidelberg, Germany, 2009; Volume 2. [Google Scholar]
- Liaw, A.; Wiener, M. Classification and regression by randomForest. R News 2002, 2, 18–22. [Google Scholar]
- Wright, M.N.; Ziegler, A.; König, I.R. Do little interactions get lost in dark random forests? BMC Bioinform. 2016, 17, 145. [Google Scholar] [CrossRef] [PubMed]
- Han, J.; Pei, J.; Tong, H. Data Mining: Concepts and Techniques; Morgan kaufmann: Burlington, MA, USA, 2022. [Google Scholar]
- Song, Y.; Si, W.; Dai, F.; Yang, G. Weighted ReliefF with threshold constraints of feature selection for imbalanced data classification. Concurr. Comput. Pract. Exp. 2020, 32, e5691. [Google Scholar] [CrossRef]
- Wright, M.N.; Ziegler, A. ranger: A fast implementation of random forests for high dimensional data in C++ and R. arXiv 2015, arXiv:1508.04409. [Google Scholar] [CrossRef]
- Han, J.; Kamber, M.; Pei, J. Data Mining Concepts and Techniques Third Edition; Morgan Kaufmann: Burlington, MA, USA, 2012. [Google Scholar]
- Witten, I.H.; Frank, E.; Hall, M.A.; Pal, C.J. Practical machine learning tools and techniques. In Data Mining, 4th ed.; Elsevier Publishers: Amsterdam, The Netherlands, 2017. [Google Scholar]
- Alasadi, S.A.; Bhaya, W.S. Review of data preprocessing techniques in data mining. J. Eng. Appl. Sci. 2017, 12, 4102–4107. [Google Scholar]
- Gupta, H.; Asha, V. Impact of encoding of high cardinality categorical data to solve prediction problems. J. Comput. Theor. Nanosci. 2020, 17, 4197–4201. [Google Scholar] [CrossRef]
- Cerda, P.; Varoquaux, G.; Kégl, B. Similarity encoding for learning with dirty categorical variables. Mach. Learn. 2018, 107, 1477–1494. [Google Scholar] [CrossRef]
- Zheng, A.; Casari, A. Feature Engineering for Machine Learning: Principles and Techniques for Data Scientists; O’Reilly Media, Inc.: Sebastopol, CA, USA, 2018. [Google Scholar]
- Noel, D.D.; Justin, K.G.A.; Alphonse, A.K.; Désiré, L.H.; Dramane, D.; Nafan, D.; Malerba, G. Normality Assessment of Several Quantitative Data Transformation Procedures. Biostat. Biom. Open Access J. 2021, 10, 51–65. [Google Scholar] [CrossRef]
- Grandini, M.; Bagli, E.; Visani, G. Metrics for multi-class classification: An overview. arXiv 2020, arXiv:2008.05756. [Google Scholar]
- Azimi, M.; Eslamlou, A.D.; Pekcan, G. Data-driven structural health monitoring and damage detection through deep learning: State-of-the-art review. Sensors 2020, 20, 2778. [Google Scholar] [CrossRef]
- Dadras Eslamlou, A.; Huang, S. Artificial-Neural-Network-Based Surrogate Models for Structural Health Monitoring of Civil Structures: A Literature Review. Buildings 2022, 12, 2067. [Google Scholar] [CrossRef]
- Eslamlou, A.D.; Ghaderiaram, A.; Schlangen, E.; Fotouhi, M. A review on non-destructive evaluation of construction materials and structures using magnetic sensors. Constr. Build. Mater. 2023, 397, 132460. [Google Scholar] [CrossRef]
- Fard, F. Prediction of concrete bridge deck condition rating based on climate data in addition to bridge data: Five states as a case study. In Proceedings of the 17th International Conference on Knowledge Management, Potsdom, Germany, 23–24 June 2022. [Google Scholar]
- Gattulli, V.; Franchi, F.; Graziosi, F.; Marotta, A.; Rinaldi, C.; Potenza, F.; Sabatino, U.D. Design and evaluation of 5G-based architecture supporting data-driven digital twins updating and matching in seismic monitoring. Bull. Earthq. Eng. 2022, 20, 4345–4365. [Google Scholar] [CrossRef]
- Jia, H.; Lin, J.; Liu, J. Bridge seismic damage assessment model applying artificial neural networks and the random forest algorithm. Adv. Civ. Eng. 2020, 2020, 6548682. [Google Scholar] [CrossRef]
- Tokdemir, O.B.; Ayvalik, C.; Mohammadi, J. Prediction of highway bridge performance by artificial neural networks and genetic algorithms. In Proceedings of the 17th International Association for Automation and Robotics in Construction (ISARC), Taipei, Taiwan, 18–20 September 2000; pp. 1091–1098. [Google Scholar]
- Smarra, F.; Di Girolamo, G.D.; De Iuliis, V.; Jain, A.; Mangharam, R.; D’Innocenzo, A. Data-driven switching modeling for mpc using regression trees and random forests. Nonlinear Anal. Hybrid Syst. 2020, 36, 100882. [Google Scholar] [CrossRef]
- Taghaddos, M.; Mohamed, Y. Predicting bridge conditions in Ontario: A case study. In Proceedings of the International Symposium on Automation and Robotics in Construction (ISARC), Banff, AB, Canada, 21–24 May 2019; pp. 166–171. [Google Scholar]
- Creary, P.A.; Fang, F.C. The data mining approach for analyzing infrastructure operating conditions. Procedia-Soc. Behav. Sci. 2013, 96, 2835–2845. [Google Scholar] [CrossRef][Green Version]
- Shirazi, A.; Fard, F.S.N. Financial Hedging and Risk Compression, A journey from linear regression to neural network. arXiv 2023, arXiv:2305.04801. [Google Scholar] [CrossRef]
- Breiman, L. Random forests. Mach. Learn. 2001, 45, 5–32. [Google Scholar] [CrossRef]
- Breiman, L.C. Adele Random Forests. Available online: https://www.stat.berkeley.edu/~breiman/RandomForests/cc_home.htm (accessed on 30 January 2022).
- James, G.; Witten, D.; Hastie, T.; Tibshirani, R. An Introduction to Statistical Learning; Springer: Berlin/Heidelberg, Germany, 2013; Volume 112. [Google Scholar]
- Genuer, R.; Poggi, J.-M.; Tuleau-Malot, C. Variable selection using random forests. Pattern Recognit. Lett. 2010, 31, 2225–2236. [Google Scholar] [CrossRef]
- Dudek, G. Short-term load forecasting using random forests. In Intelligent Systems’ 2014: Proceedings of the 7th IEEE International Conference Intelligent Systems IS’2014, September 24–26, 2014, Warsaw, Poland, Volume 2: Tools, Architectures, Systems, Applications; Springer: Cham, Switzerland, 2015; pp. 821–828. [Google Scholar]
- Kavzoglu, T.; Colkesen, I.; Sahin, E.K. Machine learning techniques in landslide susceptibility mapping: A survey and a case study. In Landslides: Theory, Practice and Modelling; Springer: Cham, Switzerland, 2019; pp. 283–301. [Google Scholar]
- Naing, W.Y.N.; Htike, Z.Z. Forecasting of monthly temperature variations using random forests. ARPN J. Eng. Appl. Sci 2015, 10, 10109–10112. [Google Scholar]
- Cutler, D.R.; Edwards Jr, T.C.; Beard, K.H.; Cutler, A.; Hess, K.T.; Gibson, J.; Lawler, J.J. Random forests for classification in ecology. Ecology 2007, 88, 2783–2792. [Google Scholar] [CrossRef]
- Díaz-Uriarte, R.; Alvarez de Andrés, S. Gene selection and classification of microarray data using random forest. BMC Bioinform. 2006, 7, 3. [Google Scholar] [CrossRef]
- Freeman, E.A.; Moisen, G.G.; Coulston, J.W.; Wilson, B.T. Random forests and stochastic gradient boosting for predicting tree canopy cover: Comparing tuning processes and model performance. Can. J. For. Res. 2016, 46, 323–339. [Google Scholar] [CrossRef]
- Chen, T.; Guestrin, C. Xgboost: A scalable tree boosting system. In Proceedings of the 22nd Acm Sigkdd International Conference on Knowledge Discovery and Data Mining, San Francisco, CA, USA, 13–17 August 2016; pp. 785–794. [Google Scholar]
- Ajit, P. Prediction of employee turnover in organizations using machine learning algorithms. Algorithms 2016, 4, C5. [Google Scholar]
- Chen, T.; He, T.; Benesty, M.; Khotilovich, V.; Tang, Y.; Cho, H.; Chen, K.; Mitchell, R.; Cano, I.; Zhou, T. Xgboost: Extreme Gradient Boosting, R package version 0.4-2. 2015.
- Ghimire, S.; Deo, R.C.; Casillas-Perez, D.; Salcedo-Sanz, S. Boosting solar radiation predictions with global climate models, observational predictors and hybrid deep-machine learning algorithms. Appl. Energy 2022, 316, 119063. [Google Scholar] [CrossRef]
- Xia, Y.; Liu, C.; Li, Y.; Liu, N. A boosted decision tree approach using Bayesian hyper-parameter optimization for credit scoring. Expert Syst. Appl. 2017, 78, 225–241. [Google Scholar] [CrossRef]
- Liew, X.Y.; Hameed, N.; Clos, J. An investigation of XGBoost-based algorithm for breast cancer classification. Mach. Learn. Appl. 2021, 6, 100154. [Google Scholar] [CrossRef]
- Minsky, M.; Papert, S. Perceptrons: An Introduction to Computational; MIT press: Cambridge, MA, USA, 1988. [Google Scholar]
- Werbos, P. Beyond Regression: New Tools for Prediction and Analysis in the Behavioral Sciences. Ph.D. Thesis, Committee on Applied Mathematics, Harvard University, Cambridge, MA, USA, 1974. [Google Scholar]
- Uzair, M.; Jamil, N. Effects of hidden layers on the efficiency of neural networks. In Proceedings of the 2020 IEEE 23rd International Multitopic Conference (INMIC), Bahawalpur, Pakistan, 5–7 November 2020; pp. 1–6. [Google Scholar]
- Liu, C.; Zhao, Z.; Wen, G. Adaptive neural network control with optimal number of hidden nodes for trajectory tracking of robot manipulators. Neurocomputing 2019, 350, 136–145. [Google Scholar] [CrossRef]
- Srivastava, N.; Hinton, G.; Krizhevsky, A.; Sutskever, I.; Salakhutdinov, R. Dropout: A simple way to prevent neural networks from overfitting. J. Mach. Learn. Res. 2014, 15, 1929–1958. [Google Scholar]
- Sharma, S.; Sharma, S.; Athaiya, A. Activation functions in neural networks. Towards Data Sci 2017, 6, 310–316. [Google Scholar] [CrossRef]
- Xu, B.; Wang, N.; Chen, T.; Li, M. Empirical evaluation of rectified activations in convolutional network. arXiv 2015, arXiv:1505.00853. [Google Scholar]
- Arnold, T.B. kerasR: R Interface to the Keras Deep Learning Library. J. Open Source Softw. 2017, 2, 296. [Google Scholar] [CrossRef]
- Liu, K.; El-Gohary, N. Semantic modeling of bridge deterioration knowledge for supporting big bridge data analytics. In Proceedings of the ASCE Construction Research Congress (CRC), San Juan, Puerto Rico, 31 May–2 June 2016; pp. 930–939. [Google Scholar]
Disclaimer/Publisher’s Note: The statements, opinions and data contained in all publications are solely those of the individual author(s) and contributor(s) and not of MDPI and/or the editor(s). MDPI and/or the editor(s) disclaim responsibility for any injury to people or property resulting from any ideas, methods, instructions or products referred to in the content. |
© 2024 by the authors. Licensee MDPI, Basel, Switzerland. This article is an open access article distributed under the terms and conditions of the Creative Commons Attribution (CC BY) license (https://creativecommons.org/licenses/by/4.0/).

