1. Introduction
With the emergence of concepts such as the “nighttime economy” [
1] and the implementation of strategies like the “18-h city” [
2], the UK’s urban economy has witnessed a twofold growth [
3]. Research on the night economy began to emerge. In the 21st century, theories about the night economy have become more abundant. The connotations, characteristics, functions, and factors influencing the night economy have been elaborated [
4]. Based on governmental policies related to the nighttime economy, scholars have investigated the evolutionary mechanisms of these policies [
5], and urban management planning for nighttime [
6]. The study of the night economy is no longer confined to British cities [
7]. Currently, the term “nighttime economy” primarily refers to economic activities predominantly centered on the service sector, occurring in urban spaces during the nighttime [
3]. Its formats encompass activities such as nighttime shopping, dining, travel, and entertainment [
8].
However, geographical practice has not kept up with the development of the theory. “Night-time economy” in the early research in the UK refers to a mixture of social science studies of alcohol and social science studies of the night-time leisure industry that have come to dominate how we understand nighttime cities [
9]. Although there are is lot of geographical research on the night economy, researchers are still mainly focused on alcohol and violence, such as the concentration of potential nighttime crime zones [
10], the impact of the nighttime economy on sexual violence [
11], the relationship between the nighttime economy and alcohol-related violence [
12], the costs of alcohol-related violence [
13], and the dominant role of university students in bars [
14]. Other scholars focused on ecological issues arising from the rapid growth of the nighttime economy, such as “light pollution” [
15]. Although some scholars began to shift their attention to the temporal and spatial distribution of the night economy, the inefficient survey data they used made the study area only the central urban area and the important night commercial district [
16,
17,
18]. There is a lack of mathematical statistical models and efficient data applied to analyze the spatial distribution of the night economy and to visualize it in research on the night economy.
Lighting is a necessary condition for modern human production and life at night. With the development of image enhancement and processing technology [
19], satellite images of nighttime lights are increasingly applied to estimate economic growth [
9], evaluate the development level of townships and transport hubs [
20], visualize the spatial distribution of the GDP [
21], explore human mobility [
22], and identify regional economic centers [
23]. However, these researchers ignored that a night light image itself is a direct reflection of the illumination at night. Night radiance images are more suitable for analyzing the development situation of the night economy.
Points of interest (POI) are widely used for studying the spatial distribution of various facilities due to their accurate geographical location and abundant types [
24]. But day and night are different [
9]. Researchers often do not explicitly consider the time validity of approaching POIs [
25]. Dai W X (2021) divided the time of POIs according to experience and obtained a more accurate trip purpose, which proves that POI data need to consider the time [
26]. Therefore, POI data can be used to analyze night facilities after being categorized by the hours of operation (i.e., after assigning time attributes).
Other data with temporal and geographic attributes, such as taxi origin–destination (OD) data, can be directly used to study night travel characteristics and intensive interactions between regions after screening. Common methods for OD data visualization include OD matrices [
27] and mapping OD flows with different colored line segments [
28]. However, there are deficiencies in extracting the main information of OD flows. Researchers used OD flow as a second-order form of points to divide the origin–destination clusters into different types, and also took advantage of the directional characteristics of OD data and processed them as vectors [
29,
30,
31]. Cosine similarity has also been applied to vector extraction [
32]. However, these methods cause a significant loss or distortion of the information of the flow. In order to retain the characteristics and geographic information of the flow, some scholars tend to take “flow” itself as the research object and actively apply the relevant theory of “point space” to the OD flow. Extending conventional approaches, measures of global and local spatial associations for flows were proposed, and the associated statistical properties and significance testing were discussed [
33]. Hierarchical clustering and density clustering were combined to extract flows of different lengths and directions to reduce information loss in the clustering process [
34]. The local K-function was also applied to the clustering of OD flows within a certain range [
35]. Entropy theory and probability distribution functions were applied to search for adjacent OD flows within a certain radius of each OD flow to extract clustering flows and find the strongest spatial connection [
36]. Through the development of point space theory to flow space, Gao Y Z et al. (2018) proposed the definition of “flow space” as the Cartesian product of OD flow [
37] when comparing the motion modes of flows with the statistical method of multidimensional space. Subsequently, Pei T et al. (2020) further enriched the theory of “flow space,” including the density definition of flow, multiple distance definitions and types of flow, and multiple modes of flow [
38]. Based on the “flow space” theory, Shu H et al. (2021) employed Ripley’s K-function to derive the L-function for calculating the flow clustering scale [
39]. Yan X R et al. (2023) further distinguished the spatial attributes of flow clustering on the basis of the L-function [
40]. Based on the theory of flow space, this paper used the L-function to calculate the cluster scale, and used the local L-function to extract the cluster flow.
In summary, this study selected Xiamen City as its research subject and employed various data sources, including taxi origin–destination (OD) data, POIs, and night light radiation to fill in the research on the relationships between night activity and the economy. In this study, the main night activity area is identified as Jiangtou to Zhongshan Road. Wuyuanwan and Lujiang Wharf are potential areas for development, and a comprehensive business format is more attractive. Finally, the findings of this research hold positive implications for enhancing infrastructure utilization rates and can also provide valuable insights for urban nighttime economic development and policy formulation. This study can provide a new big data perspective for the study of the night economy and fill the gap between the field of the night economy and the field of human behavior.
3. Materials and Methods
This study introduces a multifaceted methodology for investigating the spatiotemporal distribution patterns characterizing the nocturnal economy, rooted in the richness of diverse data sources. By meticulously examining the nocturnal activities and the lighting demand dynamics, this study formulated a comprehensive understanding of the intricate relationship between them. The analytical framework encompassed a nuanced dissection of the spatiotemporal patterns of the behavior of nocturnal consumers. This investigation delved into the nuanced impacts various service facilities exert upon nocturnal activities, unraveling the complexities of their influence.
To ensure the coherence and comparability of the data, this research devised a unified data formatting protocol, specifically focusing on spatial standardization. Anchored in the minimum scale of the grid data employed herein (characterized by a spatial resolution of 500 m for nighttime light data), this standard aligns with the spatial range identified by Steiner [
43] in relation to human activities—comprising 500 m. Conforming to this spatial scale, a finely calibrated 500 m × 500 m grid structure was established, seamlessly integrating diverse experimental findings for subsequent calculations encompassing diverse parameters, including profitability evaluations. A graphical representation of the proposed methodology is eloquently captured in
Figure 4:
3.1. Identification of Night Activity Gathering Areas
This study draws upon a dataset encompassing 12,460 taxi origin–destination (OD) records within Xiamen City during a specific hour (20:00 to 21:00) on a designated day in 2019. The algorithm’s optimal clustering outcome is deduced through the amalgamation of the Silhouette Coefficient and CH (Calinski–Harabasz), depicted visually in
Figure 5a, where the DBSCAN noise ratio is 3.76% and the optimal cluster of K-Means++ and Mean-Shift is 39 and 8. However, DBSCAN and Mean-Shift diminish significantly in scenarios involving extensive high-density spatial configurations. thereby precluding the execution of refined clustering subdivisions for the central Xiamen Island region. Concurrent K-Means++ is inherently unable to discern peripheral regions characterized by noise disruptions.
The clustering results in
Figure 5 indicate that employing a singular algorithmic approach for the clustering of Xiamen City proved inadequate in achieving desirable results. This study harnessed the synergistic merits of both DBSCAN and K-Means++ through a two-stage clustering methodology: in the initial stage, DBSCAN was enlisted to effectively excise noise regions from the dataset, thereby enhancing data fidelity. In the ensuing stage, a secondary K-Means++ clustering procedure was applied to the interregional clusters that were identified by DBSCAN, promoting a more nuanced and refined partitioning of the dataset. The specific denoising and second partition are shown in
Figure 6.
Then, we calculated the density of the cluster with ConvexHull in sklearn. Lastly, employing the natural break classification method, the amalgamated clusters were classified into five distinct density levels: high, relatively high, medium, relatively low, and low. This stratification culminated in the identification of five distinct nocturnal activity agglomeration zones, characterized by their respective density attributes.
3.2. Aggregated Flow Extraction Methods
The following introduces the theoretical knowledge of flow, including flow space, distance between flows, fluid volume, and flow density.
- (1)
Flow Space
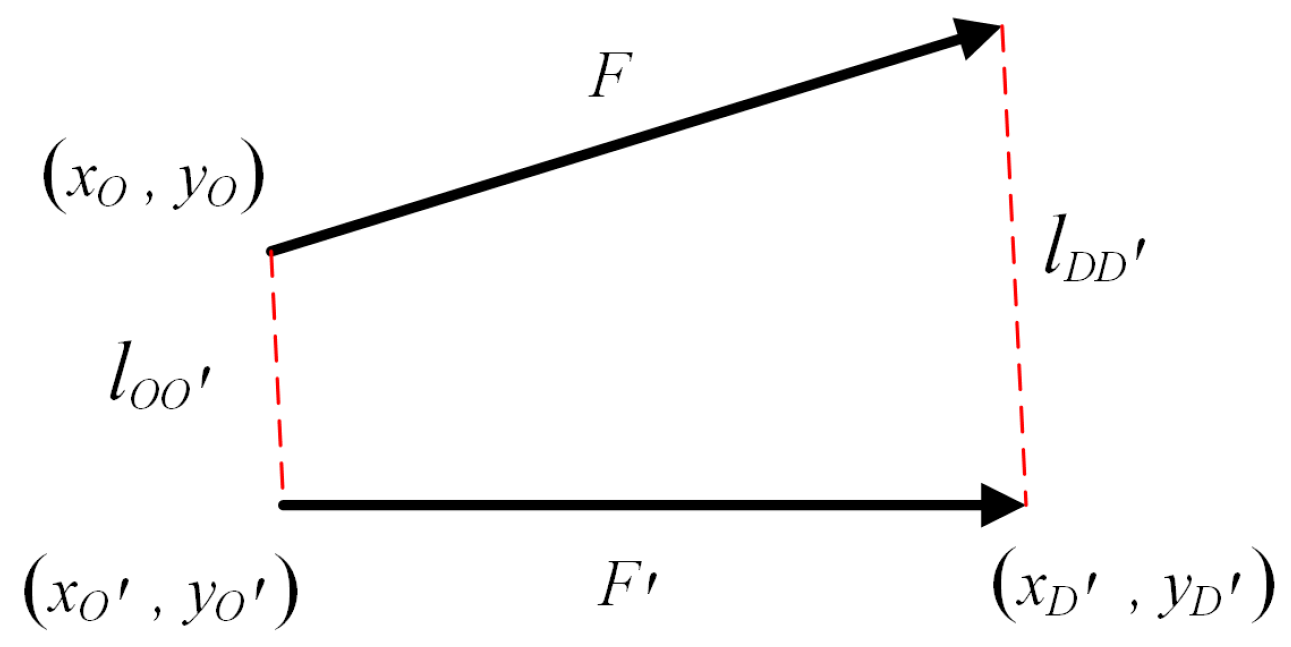
Origin–destination (OD) flows represent events with temporal and geographical attributes. In a two-dimensional space, OD flows can be simplified as ((xO, yO), (xD, yD)). Viewing the planes containing the O and D points as two separate two-dimensional planes, the O and D points along with their neighborhoods within radius r, when projected onto their respective two-dimensional planes, collectively constitute a four-dimensional space denoted as “flow space” [
39,
40], as illustrated in
Figure 7. Once two regions have a spatial interaction relationship, they can be called a “flow space.”
- (2)
Distance between Flows
There are several flows in a flow space. The concept of “distance between flows” is introduced for two-dimensional planes. A variety of lengths can be used to measure the distance between two lines. In this study, the distance length of two flow points O and D are used to calculate the distance between flows, as depicted in
Figure 8. According to the different combination rules, different distances between flows are derived, including maximum distance, summation distance, average distance, and weighted distance [
39].
- (3)
Fluid Volume
According to the definition of “fluid space,” the formula for defining the “fluid volume” is presented as follows:
In Equations (8) and (9),
F represents an arbitrary flow; ∅ denotes the set of all flows with a distance less than
r from flow
F;
dis (
F,
F′) represents the distance between flow
F and flow
F′;
SO indicates the area of the neighborhood around point
O with a radius of
r; and
SD indicates the area of the neighborhood around point
D with a radius of
r. The volume of a four-dimensional hypersphere with a radius of
r in the Euclidean distance metric can be computed by integrating two-dimensional circles of radius
r and another two-dimensional circle of radius
r, as expressed by the following formula:
Therefore, in this study, the fluid volume for various stream distances is calculated based on Equation (9), as demonstrated below:
In Equations (11) and (13), the symbol “r” represents the neighborhood, “Vmax” denotes the fluid volume based on the maximum distance, “Vadd” represents the fluid volume based on the summation distance, and “Vavg” corresponds to the fluid volume based on the average distance.
- (4)
Flow Density
Flow density refers to the number of flows within a unit volume of flow space [
39]. The estimation of flow density can be achieved using the second-order characteristics of the flow. The formula is as follows:
In Equation (14), ρF represents the flux density of flow F, V denotes the fluid volume per unit flow space, and n signifies the flow quantity within a unit flow space.
Ripley’s K-function enables the analysis of clustering tendencies at different distances within a point dataset. The spatial Ripley’s K-function for a flow can be defined as the normalized expected value of the flow within a neighborhood of radius
r in the flow space [
40]. The L-function is normalized by Ripley’s K-function. The formula is given below:
In Equations (15) and (16), where ρF represents the density of the flow, when the distance between flow components Fi and Fj is less than r, σFij(r) = 1. Conversely, when the distance between flow components Fi and Fj exceeds r, σFij(r) = 0.
For each individual flow, the local L-function is obtained, as given by the following expression:
In Equation (17), Li(r) denotes the local L-function, with the remaining parameters being consistent with the preceding context.
Under the framework of Flow Space Theory, this study calculated
L-function values at different radii, and selected the flow space radius corresponding to the largest
L-function value as the optimal radius
r’. Taking
r’ as the radius of flow space, the
Li-function value of each flow was calculated. The flow with the largest
Li-function value was selected as the central flow, and all flows in the flow space with an optimal radius around the central flow were extracted as aggregation flows. The formula is given below:
In Equations (18)–(20), L’(r’) denotes the max value of the L-function; r’ denote the optimal radius of the flow space; FL″ denotes the central flow, which means the max local L-function when the r equal to r′; and ∅cluster denotes the cluster of flow, with the remaining parameters being consistent with the preceding context.
3.3. Geographic Detectors
The core theory of geographic detectors is based on the assumption that if an independent variable has a significant effect on a dependent variable, then the spatial distribution of the independent variable and the dependent variable should be similar. This study employees differentiation factor detectors and interaction detection in geographic detectors to find the impact of night service facilities on the nighttime economy [
44]. A differentiation factor detector can detect the extent to which covariates explain the spatial differentiation of interaction Y, represented by the
q value [
45], expressed as:
In Equation (21), SSW denotes the within sum of squares of factor XS. SST denotes the total sum of squares.
You can check whether the
q value is significant by looking up tables or using geographic detector software (version 2015) ”
http://wwwgeodetector.cn (accessed on 2 September 2020)”. The value range of q is [0, 1], and the larger the q, the more significant the spatial differentiation of interaction Y. The larger the q, the stronger the explanation of covariates X
S for interaction Y, and vice versa. Interaction detection can identify the interaction between different covariates X
S, that is, to assess whether the combined action of covariate X1 and covariate X2 will increase the influence on interaction Y, or whether the influence of these covariates X on interaction Y is independent of each other, as shown in
Table 3.
4. Results
4.1. Identification and Analysis of Night Activity Agglomeration Areas
Taxis, serving as a predominant mode of urban transportation, epitomize a pivotal component of nocturnal trip demands for residents, with their origin points (O-points) signifying passenger pickup locations and destination points (D-points) accurately reflecting nocturnal activity areas. In view of this, the present study emanates from a “point-space” perspective to delineate clusters of nocturnal activities, leveraging the realm of Geomatics Science and Technology. By using secondary clustering, the night activity gathering area was obtained after denoising, secondary division, convex hull calculation, and density division. The mainland area of Xiamen is all low-density agglomeration areas, so this study focused on the situation of Xiamen Island, as shown in
Figure 9 and
Figure 10.
Areas with densities classified as high and above were considered as nocturnal activity aggregation areas. Temporally, on weekdays, the aggregation zones around midnight (referred to as “O points”) were most widespread between 19:00 and 22:00. These zones included Jiangtou, the north-central part of Lianqian, the eastern part of Yundang, the western part of Jialian, and Wucun, Lujiang, Zhonghua, and Xiagang (as shown in
Figure 9a). After 22:00, the range of aggregation zones gradually narrowed. For the holiday O-point aggregation zones, the distribution ranged from 19:00 to 3:00, similar to that of weekday O-points from 19:00 to 22:00, and the range and density levels of the other aggregation zones changed little from 19:00 to 3:00. Subsequently, after 3:00, the range of holiday O-point aggregation zones abruptly contracted. The density of weekday O-point aggregation zones exhibited a gently decreasing trend (as shown in
Figure 11a). But the density of holiday O-point aggregation zones displayed a reversed S-shaped decline, with an initial gentle drop followed by a sudden decrease (as depicted in
Figure 11b).
Regarding weekday D-point aggregation zones, the most extensive distribution occurred between 19:00 and 22:00 (as shown in
Figure 10a). Between 22:00 and 0:00, the range of aggregation zones gradually narrowed. Surprisingly, the nighttime activity density in the Jialian increased during this period, upgrading to a high-density level (as shown in
Figure 10c, marked by ②). On holidays, compared to weekday D-point aggregation zones during 19:00 to 22:00, additional aggregation areas emerged in the eastern part of Jiangtou and the north-central part of Lianqian. Between 0:00 and 3:00, the nighttime activity density in the western part of Jiangtou increased, upgrading to a high-density region (as shown in
Figure 10g, marked by ③). Therefore, the density of both weekday and holiday nighttime D-point aggregation zones displayed a fluctuating, declining trend (as presented in
Figure 11c).
Consequently, the nocturnal activity density of Xiamen city gradually decreased outward from the geometric center of Xiamen Island, exhibiting a multi-ring distribution pattern. The clustering of nocturnal activity was the most significant on Xiamen Island. The density of the O-point and D-point in Jialian’s Lianban mixed commercial and residential area were the most densely populated areas for nighttime activities. The density change pattern of the O-point indicates that the demand for nocturnal activities in Xiamen is greater during holidays, with holiday aggregation periods extending by 3 h compared to weekdays. Nocturnal activities exhibit a secondary peak between 0:00 and 3:00.
4.2. Analysis of the Pattern of Night Activity Flow
Identifying the “flow” pattern of night activity can excavate the interactive relationship and dynamic connection within urban areas, divide urban function areas, and better understand the behavior pattern and dynamic mechanism of night activity.
Patterns of flow clustering can be classified into fundamental types: aggregated, dispersed, and aggregated–dispersed hybrids (as depicted in
Figure 12a,c), and composite types exhibiting a combination of these fundamental patterns (as depicted in
Figure 12d,f). The mean flow is utilized to indicate the direction of aggregated flows, with distinct colors representing the clustering scale.
This paper takes into consideration the “flow” attribute of OD (origin–destination) data. It excludes ultra-short-distance flows with lengths less than 1 km and defines a threshold based on the 3 km starting distance from Xiamen City’s 2021 taxi fare standards. Flows with lengths between 2 km and 3 km are categorized as short-distance flows, while flows with lengths exceeding 3 km are classified as long-distance flows. The “flow distance,” defined as the maximum distance within a flow, was used in conjunction with the L-function in “flow space” to compute the clustering scale of nighttime activities in Xiamen City. The maximum aggregation scale served as a parameter to employ the Li-function in discovering aggregative flows within clustered areas.
The extracted aggregation flows are shown in
Figure 13 and
Figure 14. Each cluster of aggregation flows represents the spatial interaction between an O-points region and a D-points region, that is, a flow space. The clustering scale of short-distance flow is less than 400 m. The clustering scale of long-distance flow ranges from 1000 m to 2900 m. Subsequently, an analysis of the distribution patterns of these flows was conducted.
There were many directions and modes of short-distance aggregated flow. On working days, the Zhonghua road business district to Xiamen University showed an interactive cluster. From the Xiamen train station business district to the Lianban mixed commercial and residential district was a cluster. The Lianban mixed commercial and residential district with the surrounding business circles and residential areas, including the Jiangtou residential district, the Jiangtou business district, the culture and art center of Xiamen City, Nanhu, and all parks showed as interactive clusters. Therefore, the Lianban mixed commercial and residential district was a variety of composite patterns of clusters, dispersed and aggregated. Compared to weekdays, the Ruijing plaza embraced a north-south discrete pattern. A cluster pattern was newly formed in the Zhonghua road business district to the Xiahe residential district.
In
Figure 14, the long-distance aggregation flow reflects the interaction between the towns and is less expressive than the short-distance aggregation. The mean flow vectors inherently possess an aggregative attribute and could theoretically be considered as aggregated flows. Based on the distribution areas of mean flows and their orientations, flow patterns within the nocturnal activity were identified and explored (as presented in
Figure 15).
From
Figure 15, it can be observed that in the long-distance regional context, the aggregative flow patterns with cluster scales less than 2300 m exhibited predominant orientations toward the southwest and northeast directions. These patterns were concentrated primarily in the vicinity of Heshan to Zhonghua and Lujiang streets, characterized by predominantly cluster patterns and interactive cluster-compound patterns. During weekdays from 19:00 to 0:00, interactions of a cluster-compound nature were evident in the following flow segments: Jiangtou to Jialian and Wucun, Jialian and Wucun to Zhonghua and Lujiang, and Yundang to Lujiang and Kaiyuan. In the timeframe of weekdays from 0:00 to 3:00, an interactive cluster-compound pattern emerged in the Jiangtou to Wucun segment, while a unidirectional cluster pattern was observed in the Lujiang to Wucun segment. Between 3:00 and 5:00 on weekdays, the interactive region extended from the southern section of Dianqian to Jialian, characterized by an interactive cluster-compound pattern.
During holidays from 19:00 to 22:00, the flow directions were most dispersed, covering the central and southern regions of Xiamen Island. This dispersion was predominantly described by interactive cluster-compound patterns, including Jiangtou to Wucun and Yundang, Yundang and Wucun to Lujiang and Zhonghua, and Jialian to Lianqian in the central region. From 22:00 to 0:00 on holidays, only Jiangtou to Wucun and Wucun to Lujiang and Zhonghua exhibited an interactive cluster-compound pattern. In the holiday time frame from 0:00 to 3:00, the flow directions became more concentrated, primarily directed toward the northeast. The nocturnal activity areas showed a continuity in interaction patterns with the previous timeframe. Between 3:00 and 5:00, a continuous unidirectional flow pattern emerged from Lujiang to Jialian, extending to Jinshan.
Consequently, within the nocturnal activity hotspots of Xiamen City, long distance flow patterns primarily manifest as cluster patterns and interactive cluster–compound patterns, with the primary interactive region located between Jiangtou and Wucun, and Wucun and Lujiang.
4.3. Correlation and Analysis of Lighting Supply and Demand
4.3.1. Correlation Analysis
Human night activities are basically concentrated in the built-up area of construction land. According to the resolution of 500 m of a radiation map, this study divided Xiamen City into a 500 m grid and counted the number of service facilities and the radiation values in the grid. Employing the geographical detectors methodology, a comprehensive analysis was conducted to meticulously probe the far-reaching impacts of these nocturnal service facilities on nighttime activities (as delineated in
Table 4).
From
Table 4, it can be observed that nighttime activities, such as dining, shopping, accommodation, residential, and entertainment facilities, had a significant impact on the density of nighttime activities. Conversely, nighttime scenery, transportation, educational, and medical facilities exerted a negligible influence on nighttime activities and could be disregarded. Additionally, the impact of the same facilities on the nighttime activity density of Xiamen City was relatively consistent between weekdays and holidays. Among the nighttime service facilities that influenced the density of point O, the core factors with q values exceeding 0.5 included nighttime dining, shopping, and entertainment facilities. Similarly, for the density of point D, the key factors with q values greater than 0.5 comprised nighttime dining, shopping, entertainment, and residential facilities. Consequently, when nighttime dining and shopping facilities were clustered and distributed, they exhibited a higher potential to attract consumers, making commercial districts with large-scale integrated malls and food streets the most concentrated areas of nighttime activities. All of the factors enhanced the correlation, with the strongest enhancement effect at the O-point being restaurant and work facilities, and the strongest enhancement effect at the D-point being restaurant and shopping facilities. Hence, the influence of nighttime service facilities in Xiamen City on nighttime activities remained relatively consistent between weekdays and holidays. Among these, the primary factors affecting nighttime travel activities included nighttime dining, shopping, and entertainment facilities, while nighttime recreational activities were additionally impacted by residential facilities.
4.3.2. Light Supply and Demand Analysis
The concentration area of D-points encapsulates the predominant distribution of nocturnal activity demands. Therefore, this study placed particular emphasis on the selection of the D-point concentration area. The objective was to ascertain the supply–demand relationship between this area and both nocturnal light availability and the provisioning of nocturnal services. Subsequent to this, an analysis of the distribution of supply and demand was conducted.
Both nocturnal activities density and nocturnal radiance image were reclassified into five distinct categories based on their density, each category being assigned a numerical value ranging from one to five. The profit and loss value of light was calculated by subtracting the radiation value after reclassification from the nocturnal activity density after reclassification. The nocturnal activity–lighting relationship is expressed within a range of surplus and deficit values spanning from negative four to three. Specifically, a surplus value ranging from negative four to negative one signifies an ample supply of nocturnal lighting, thereby constituting the “light surplus area.” Conversely, a deficit value within the range of one to four signifies an inadequate supply of nocturnal lighting, delineating the “light deficit area.” A value of zero represents the “light balance area” that denotes a state of equilibrium between the supply and demand of nocturnal activity, including the lighting balance and the dark balance.
Based on the data presented in
Figure 16, it is evident that there existed a fundamental similarity in the distribution of lighting surpluses and deficits between weekdays and holidays. We took point D of the holiday as an example to show the distribution of supply and demand (see
Figure 17 for details).
Notably, areas characterized by a “lighting surplus” considerably outnumbered those exhibiting a “lighting deficit.” Extensive infrastructures such as Haicang Port, Xiamen Gaoqi International Airport, the Xiangyushan Bonded Area, as well as nascent developmental towns like Xindian and Dongfu were characterized by a notable surplus in lighting provision (as presented in
Figure 17B–E). However, a distinct inadequacy in lighting supply was observed in the vicinity of the ferry terminal within the Lujiang wharf and Haibin park. The Dongping and Wenping community demolition and resettlement residential area lacks large commercial facilities and was also a light deficit area (as presented in
Figure 17A). This phenomenon was pronounced in various locales, including the prominent commercial districts, where the equilibrium between lighting provision and demand was notably skewed toward lighting balance. Ecological areas such as Dongping mountain, botanical gardens, reservoirs and so on were in dark balance (as presented in
Figure 17F).
5. Discussion
In recent years, nighttime consumption in China has accounted for 50% of the total daily consumption, with this proportion continuously increasing [
46,
47]. However, the majority of official statistical data have not distinguished between the nighttime and daytime economies, resulting in a lack of direct and effective data for research on the nighttime economy, thereby impeding its comprehensive investigation. Based on the theory of “point space” and “flow space,” this study determined the static distribution and regional interactions of urban economic activities at night.
A single point clustering algorithm has a poor clustering effect when there is a large range of high-density regions, so it is necessary to combine the advantages of multiple clusters. The noise is removed first, and then the large area of high density is divided twice. The L-function and Li-function used in mining clustering in this study showed that the clustering effect was more obvious in short distances than in long distances, which is more suitable for mining regional interactions at the community level: for example, the interactions and relationships between the Xiamen Culture and Art Center and between Jialia, and the new gathering center, Ruijing plaza.
The distribution of night activities and lighting supply in Xiamen City clearly showed that the four major commercial districts connected in series or that the commercial districts of mixed residential buildings (from Jiangtou to Lianban to the Xiamen railway station to Zhongshan Road) are the most prosperous areas in Xiamen at night, with a sufficient lighting supply, a dense flow of people, and great regional interactions.
Based on the calculation of light profit and loss value, it is obvious that the mainland area (namely, outside Xiamen Island) was weak in night activities from the overall perspective of Xiamen City. In many areas, the lighting infrastructure was perfect, but the night activities were not much, forming surplus areas of light, like Wuyuanwan Park. Compared with the census and statistical data limited to specific squares and tourist attractions on commercial streets [
16,
17], this study has the advantage of being more efficient and reflecting the situation more comprehensively.
Compared with studies on the influencing factors and patterns of the night economy only from theory [
4,
5], this paper found that catering, shopping, and entertainment are people’s favorite night consumption activities from the quantitative calculation results of the correlations. Interaction detection proved that a combination of large shopping malls and food courts was the most attractive. Recreational activities such as bars and clubs were not the only purpose of a night out. This provides a new direction for the study of the night economy in the future.
While a substantial volume of origin–destination (OD) data to a certain extent accurately represents residents’ travel characteristics, the limitations in data acquisition have confined this research to using exclusively taxi OD data, thereby diminishing the representativeness of the population. Regarding data timeliness, this paper employed the Dragon Boat Festival holiday as a representation of nocturnal holiday activities, thereby reducing the representativeness of nighttime activities during holidays. Consequently, future research could be expanded in the following directions: by integrating long-term sequences of self-driving and public transportation OD data into the spatiotemporal domain, discerning drop-off point semantics, and enhancing population representativeness during both workdays and holidays.


