
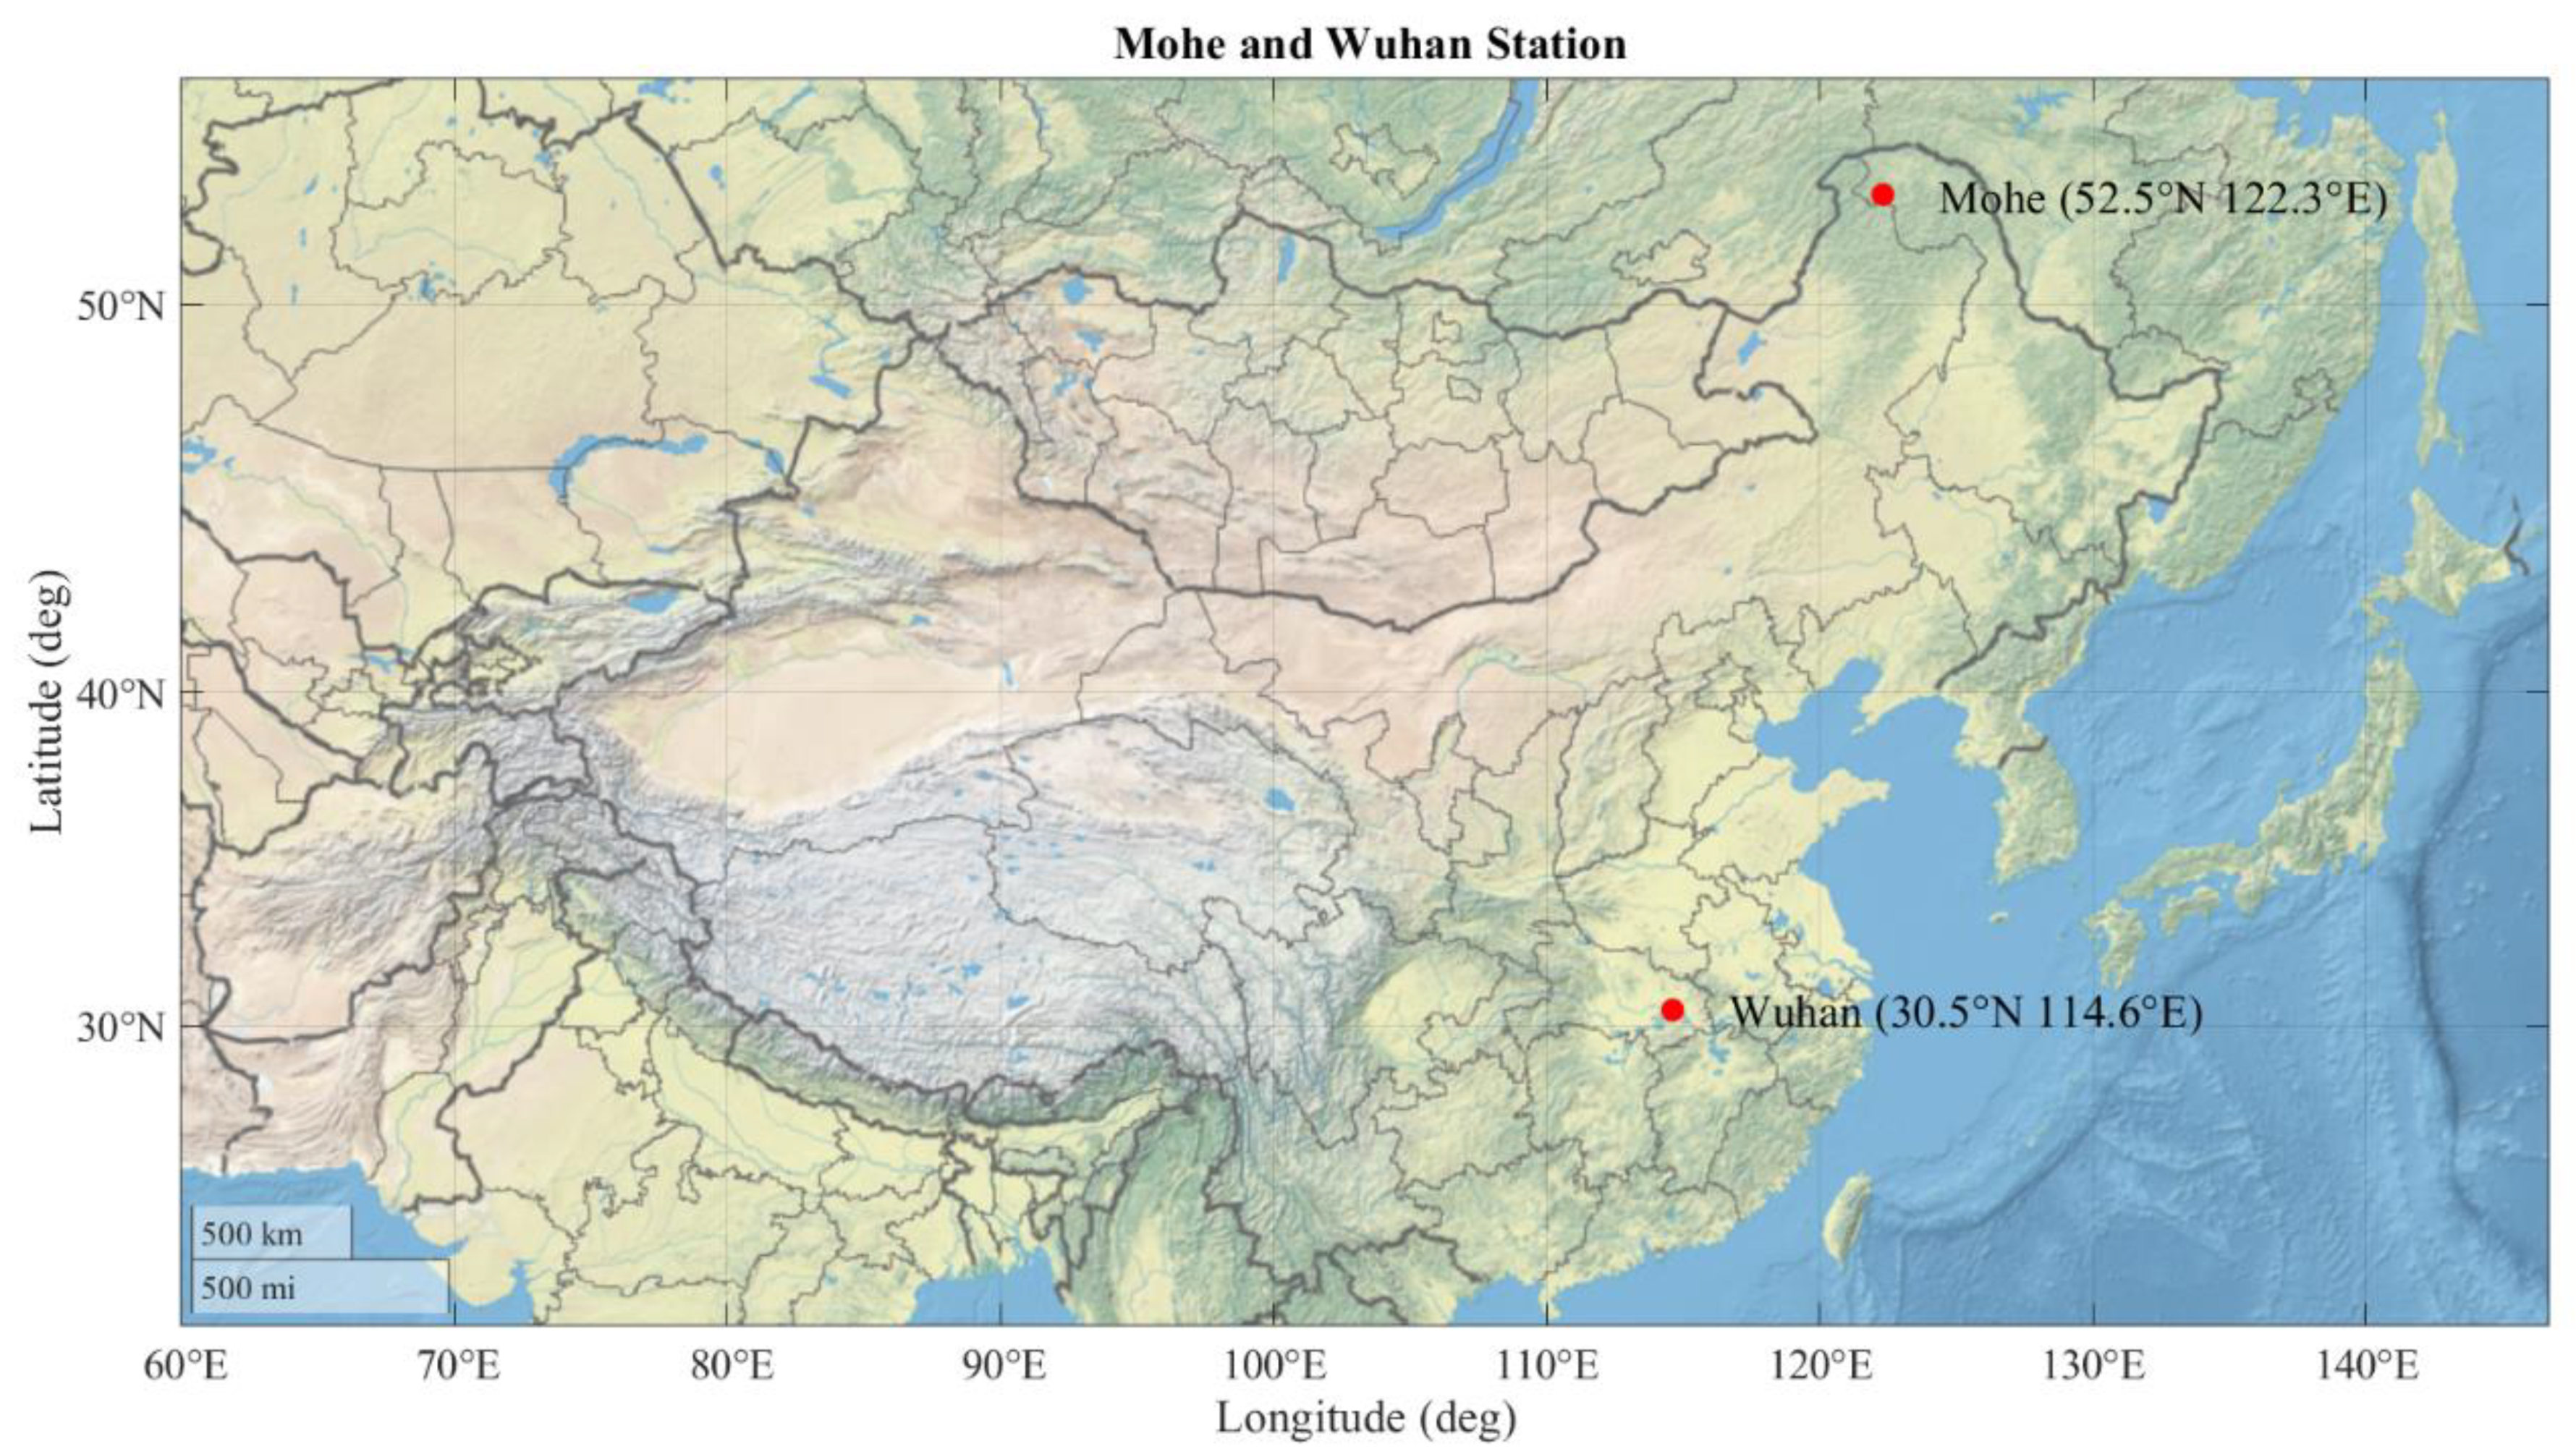
Multi-Year Behavioral Observations of Quasi-2-Day Wave Activity in High-Latitude Mohe (52.5°N, 122.3°E) and Middle-Latitude Wuhan (30.5°N, 114.6°E) Using Meteor Radars


Abstract
1. Introduction
2. Data and Analysis
3. Results
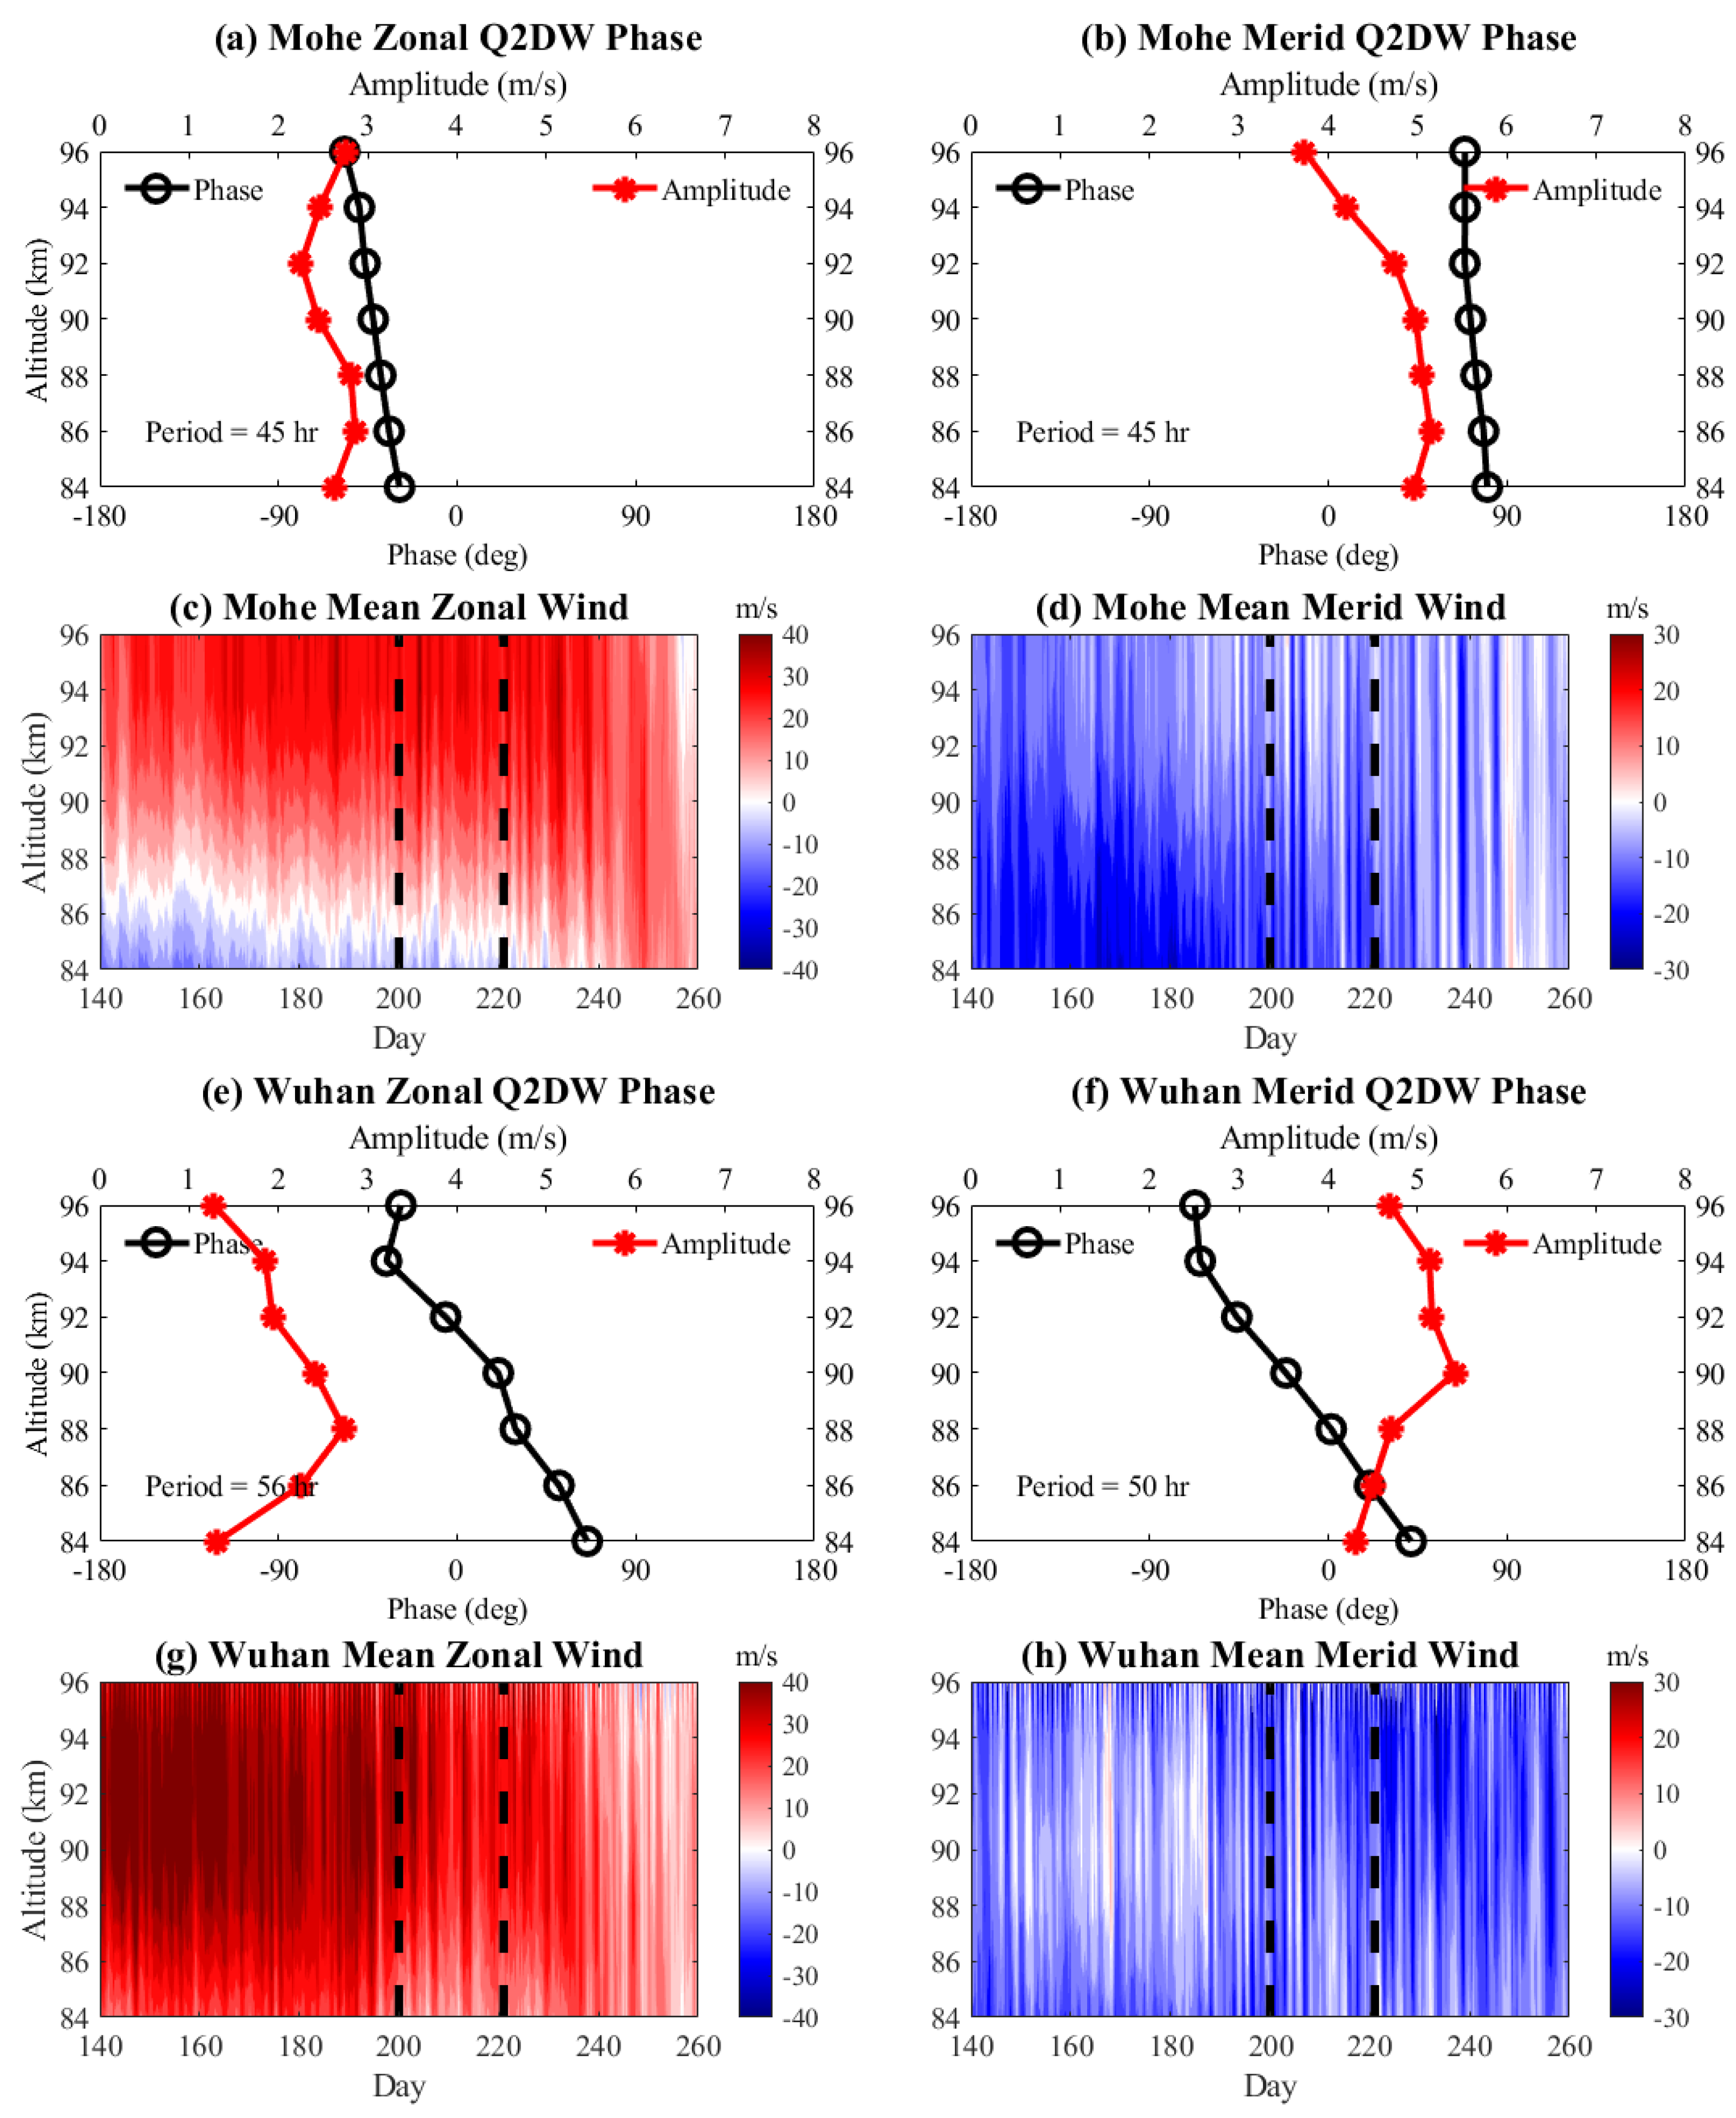
3.1. Mean Winds
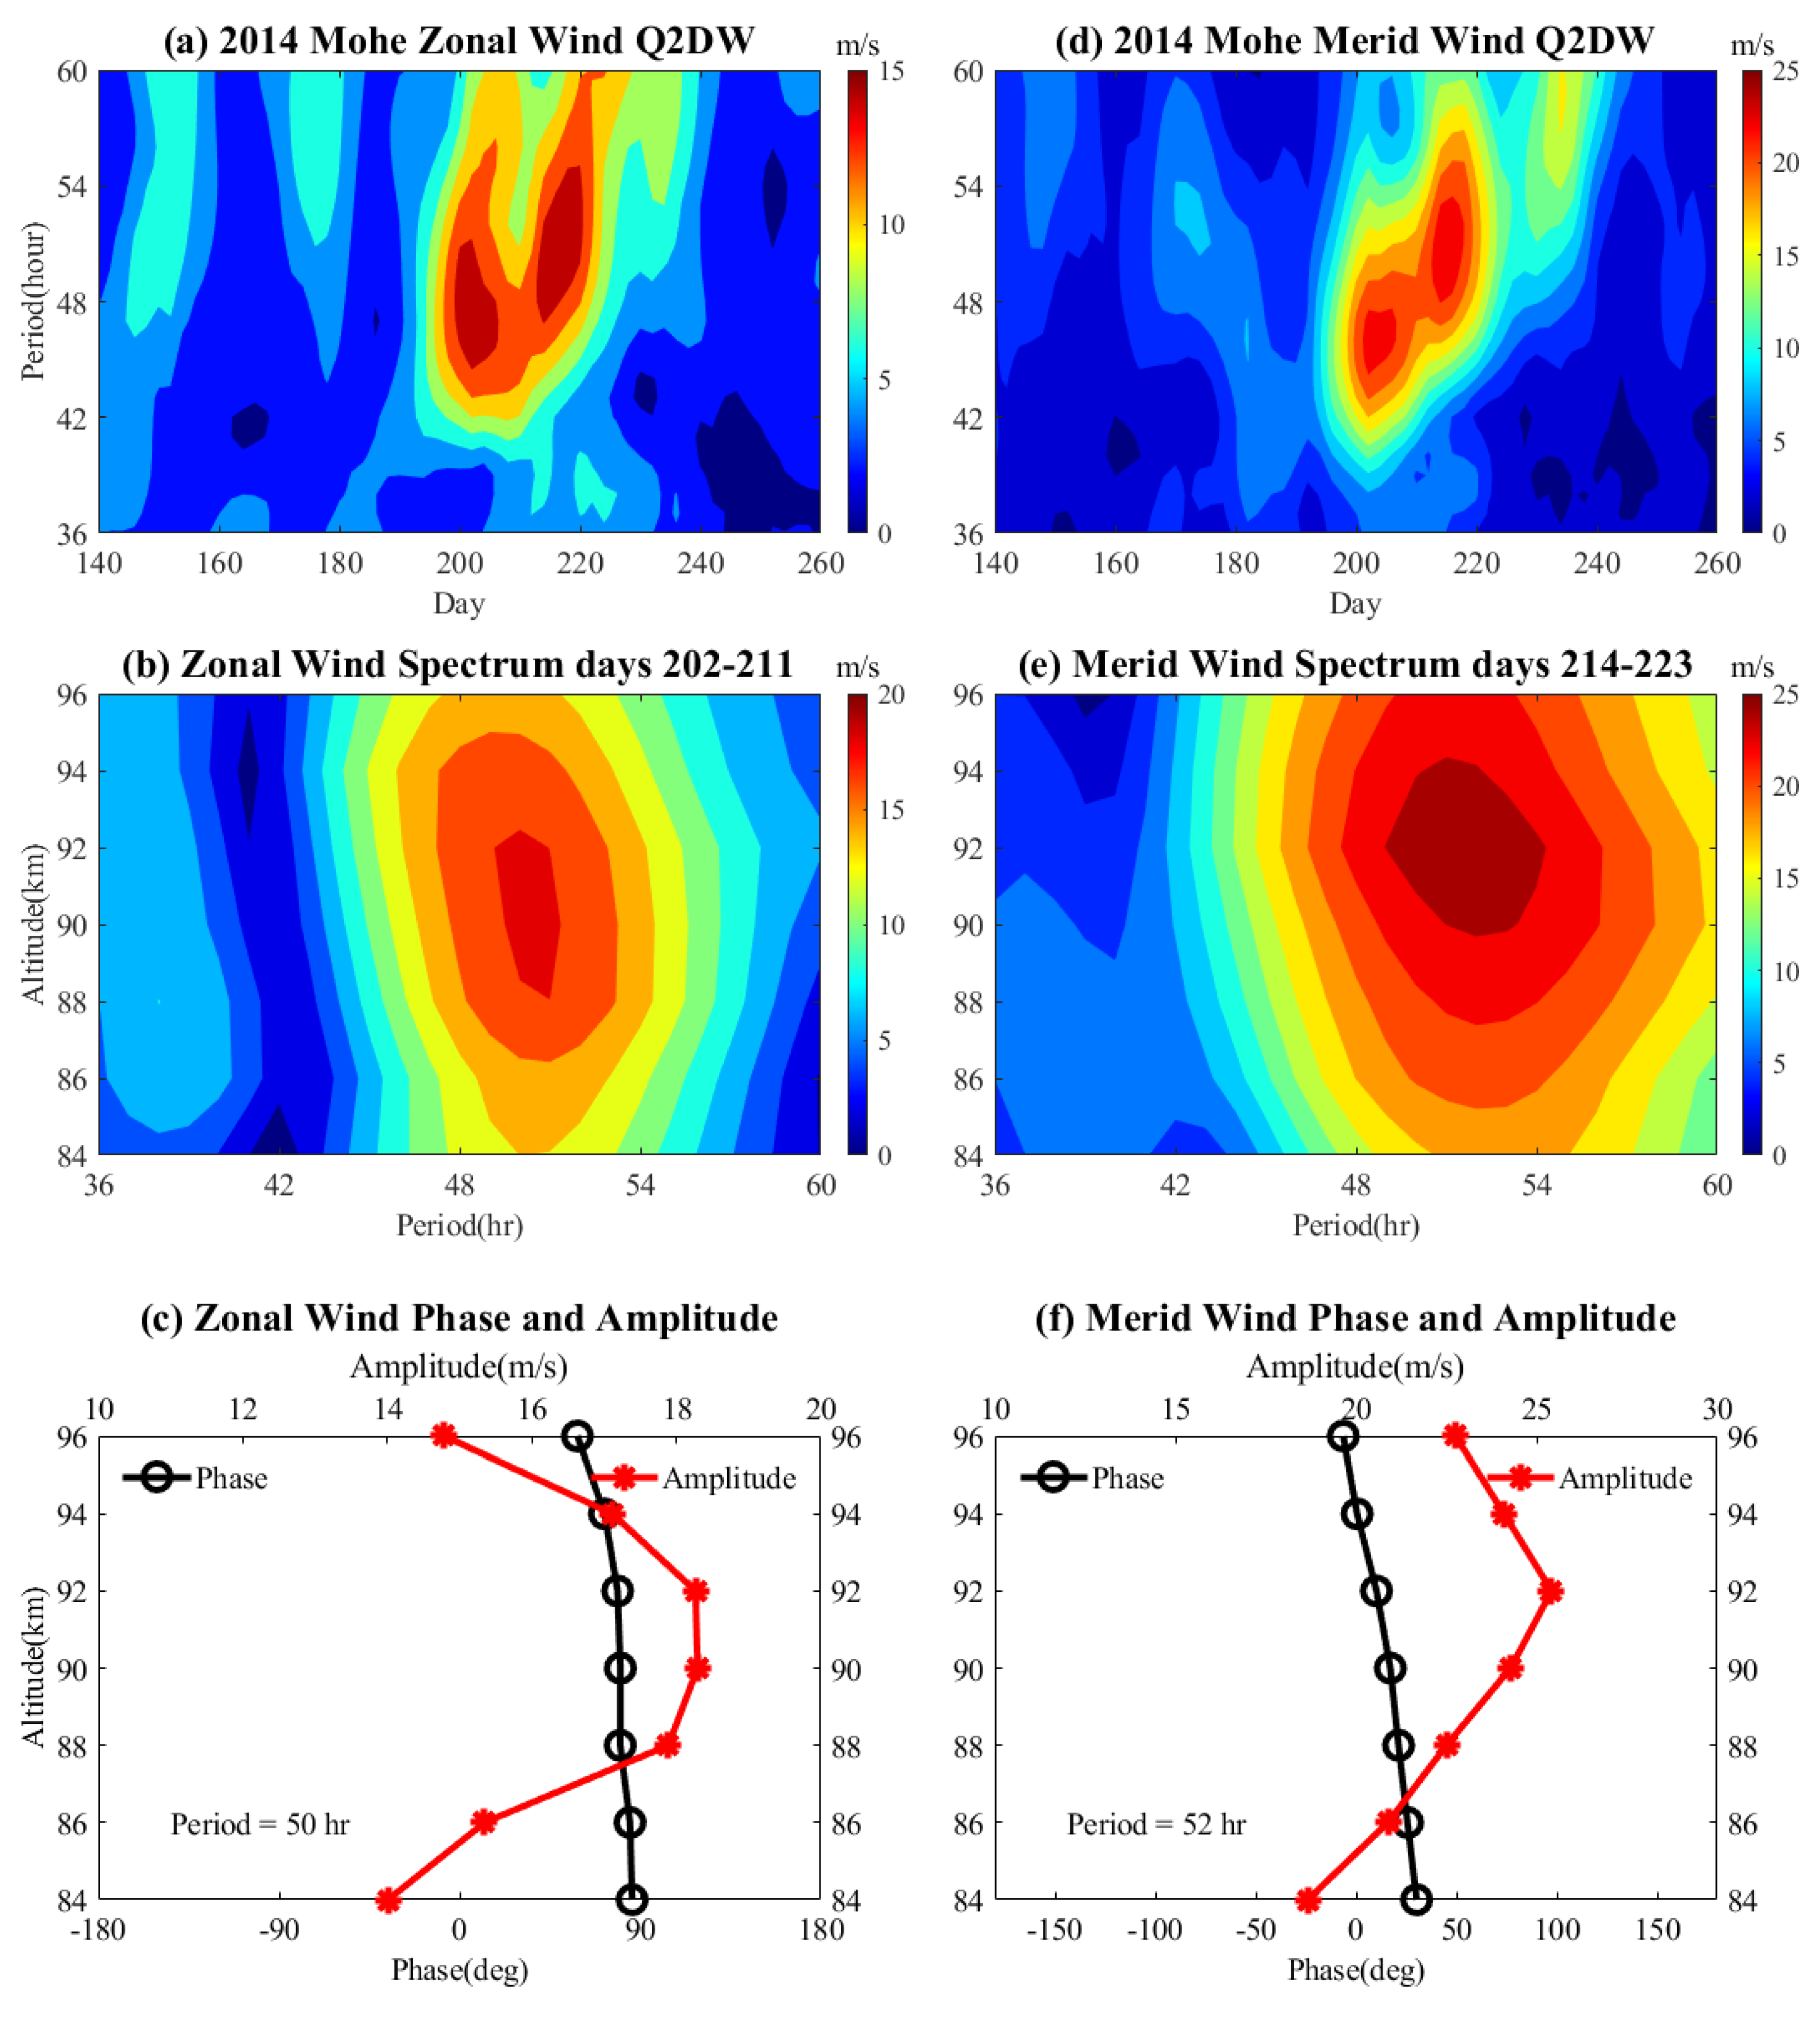
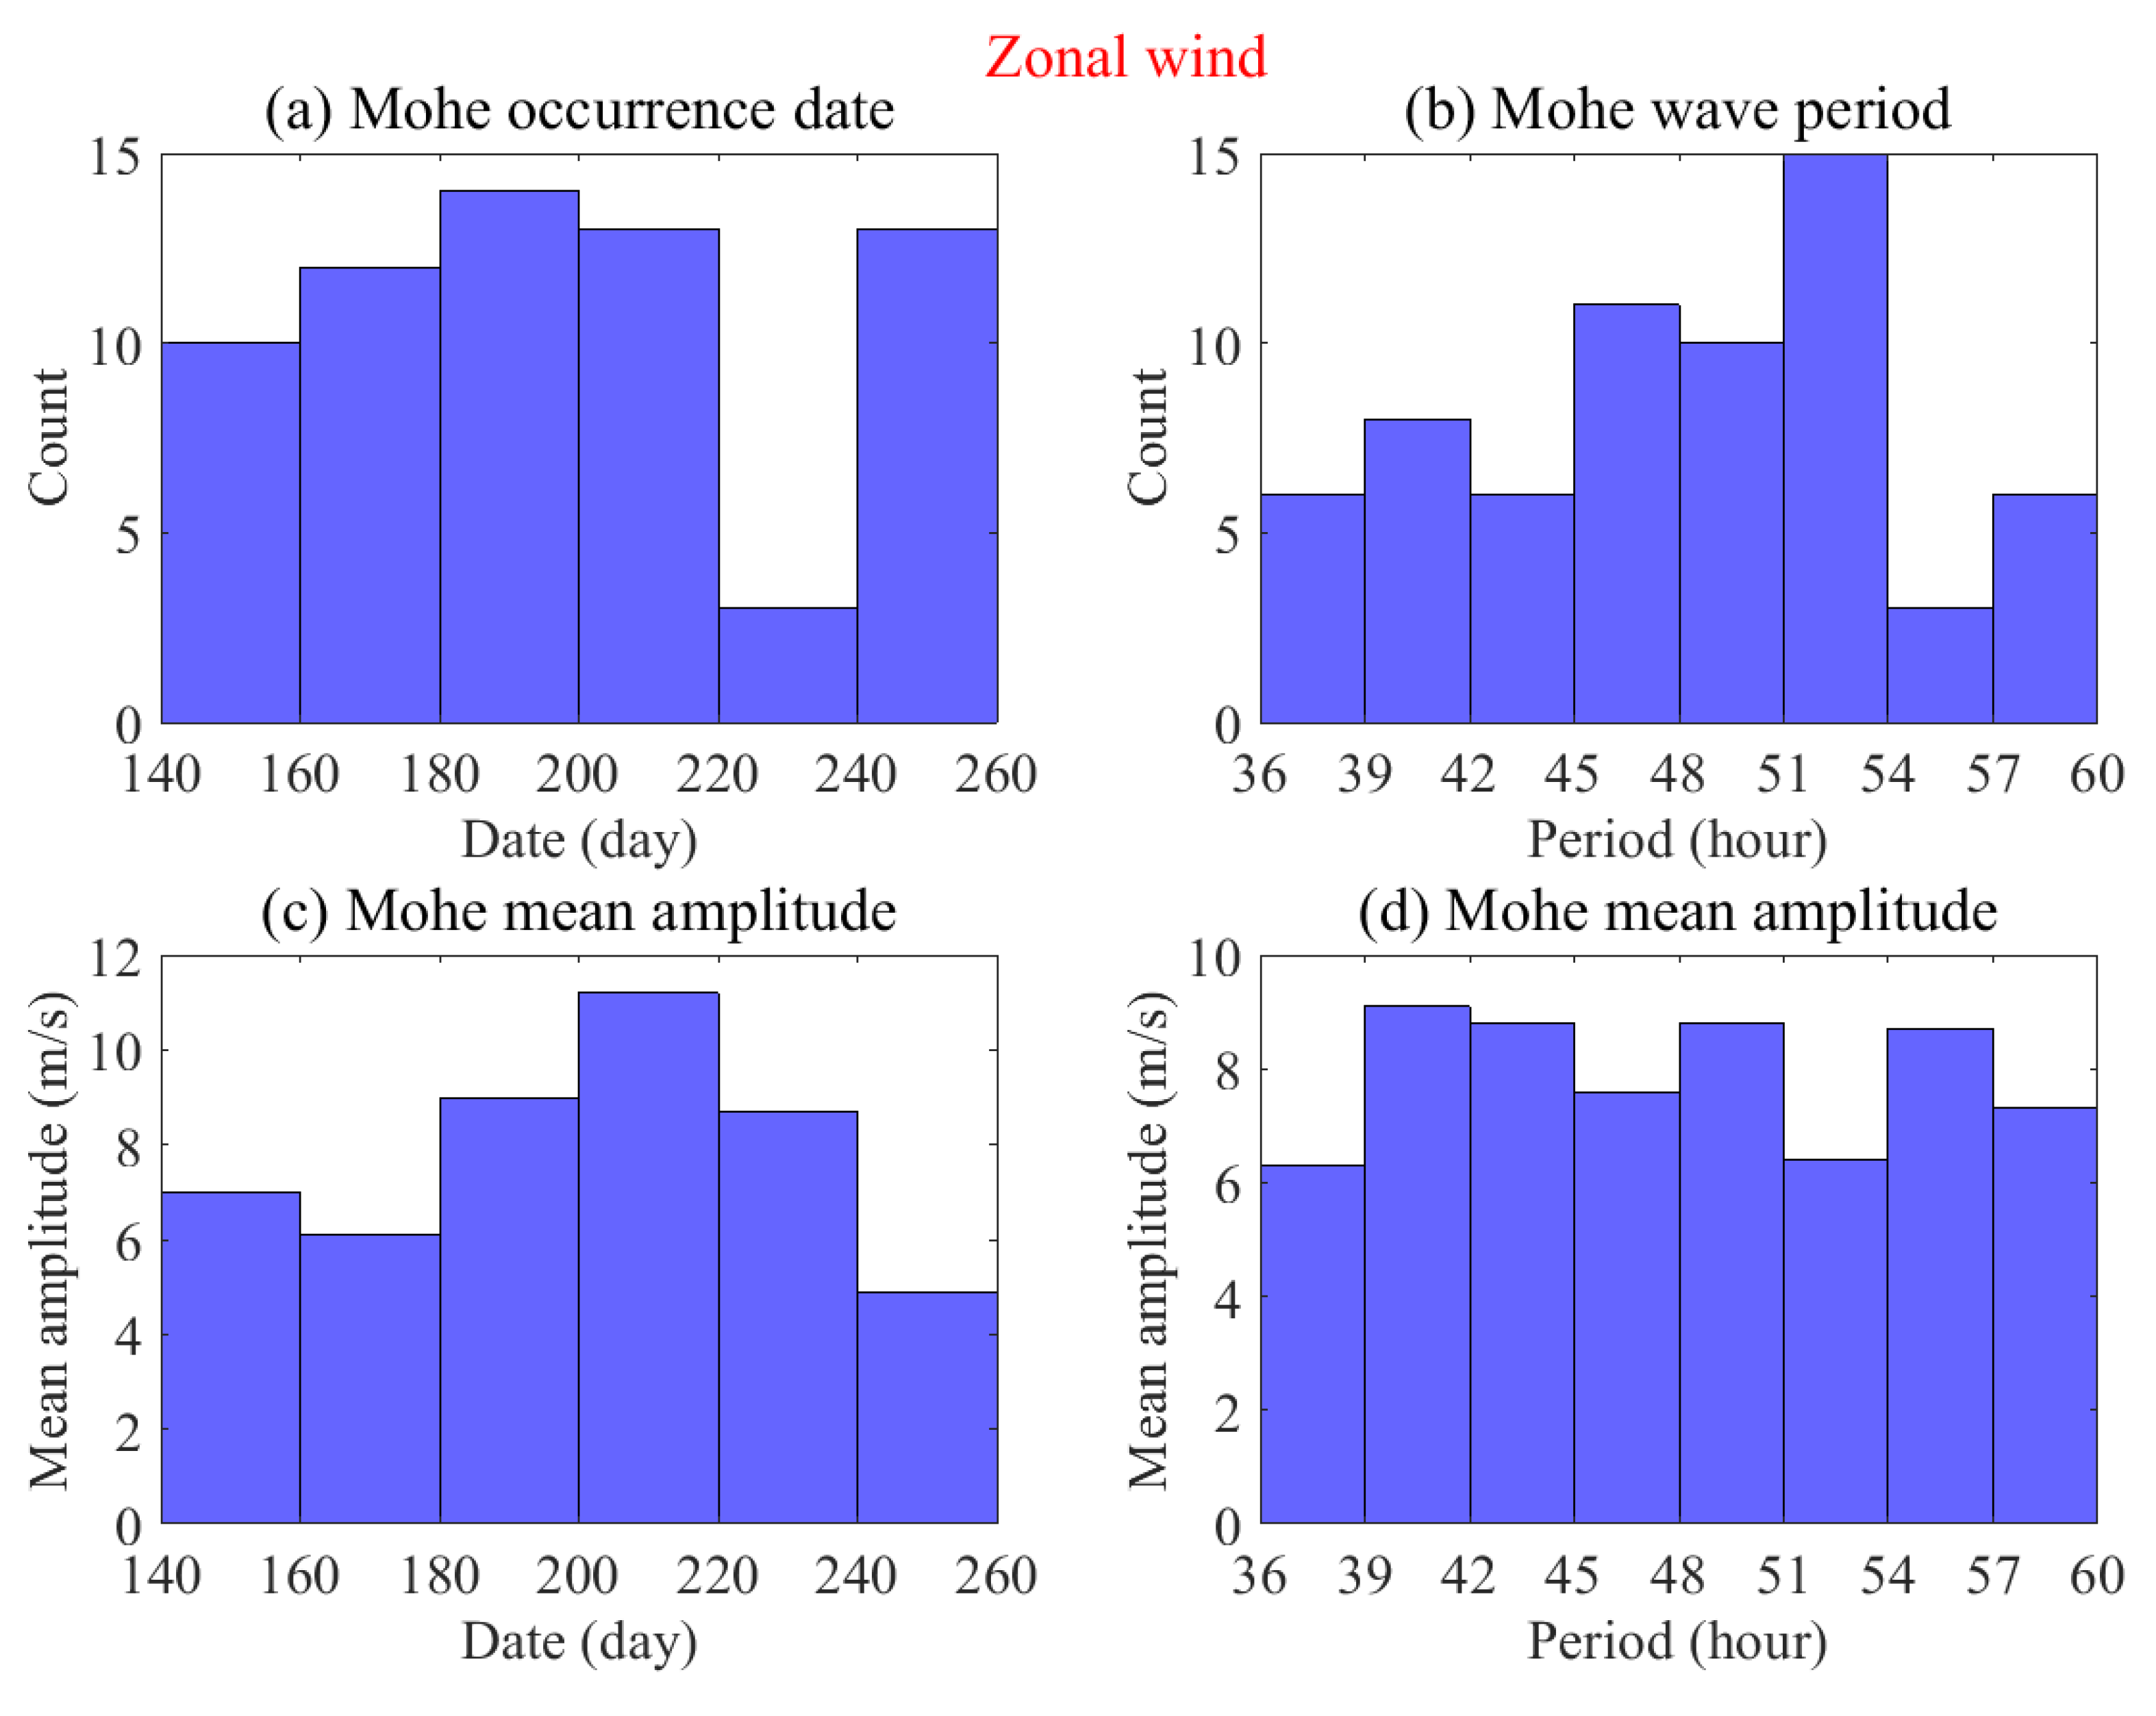
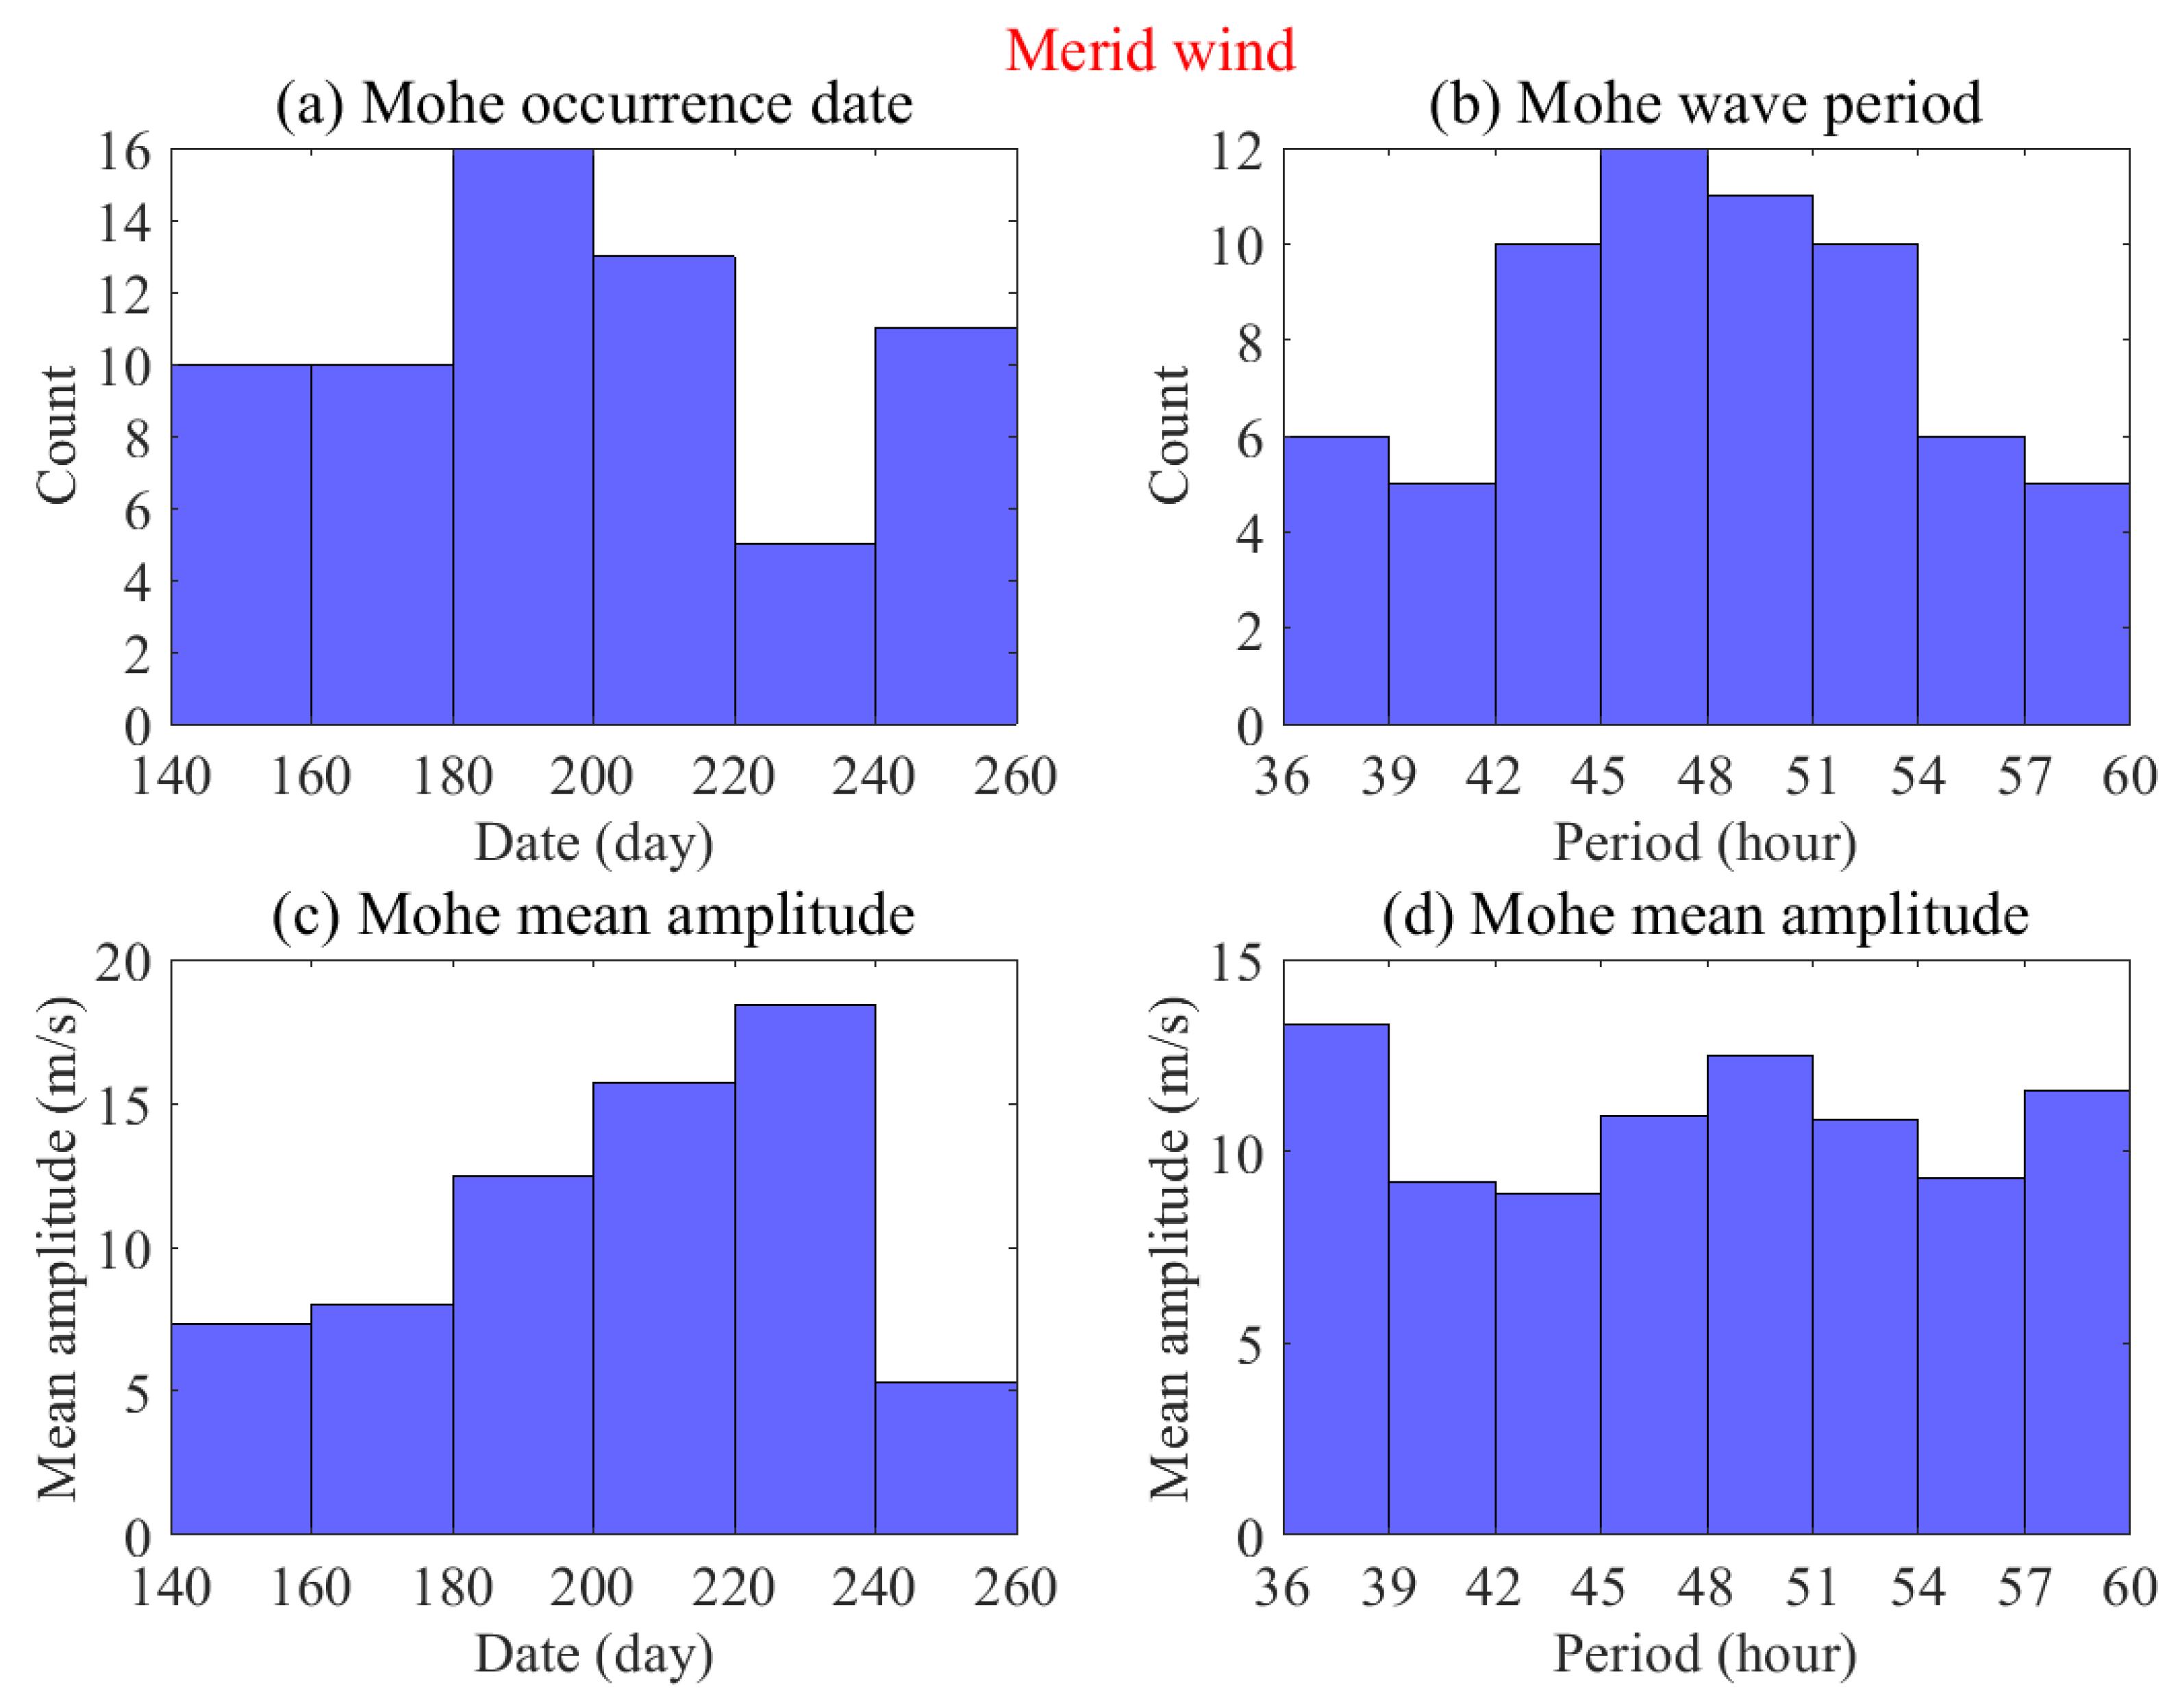
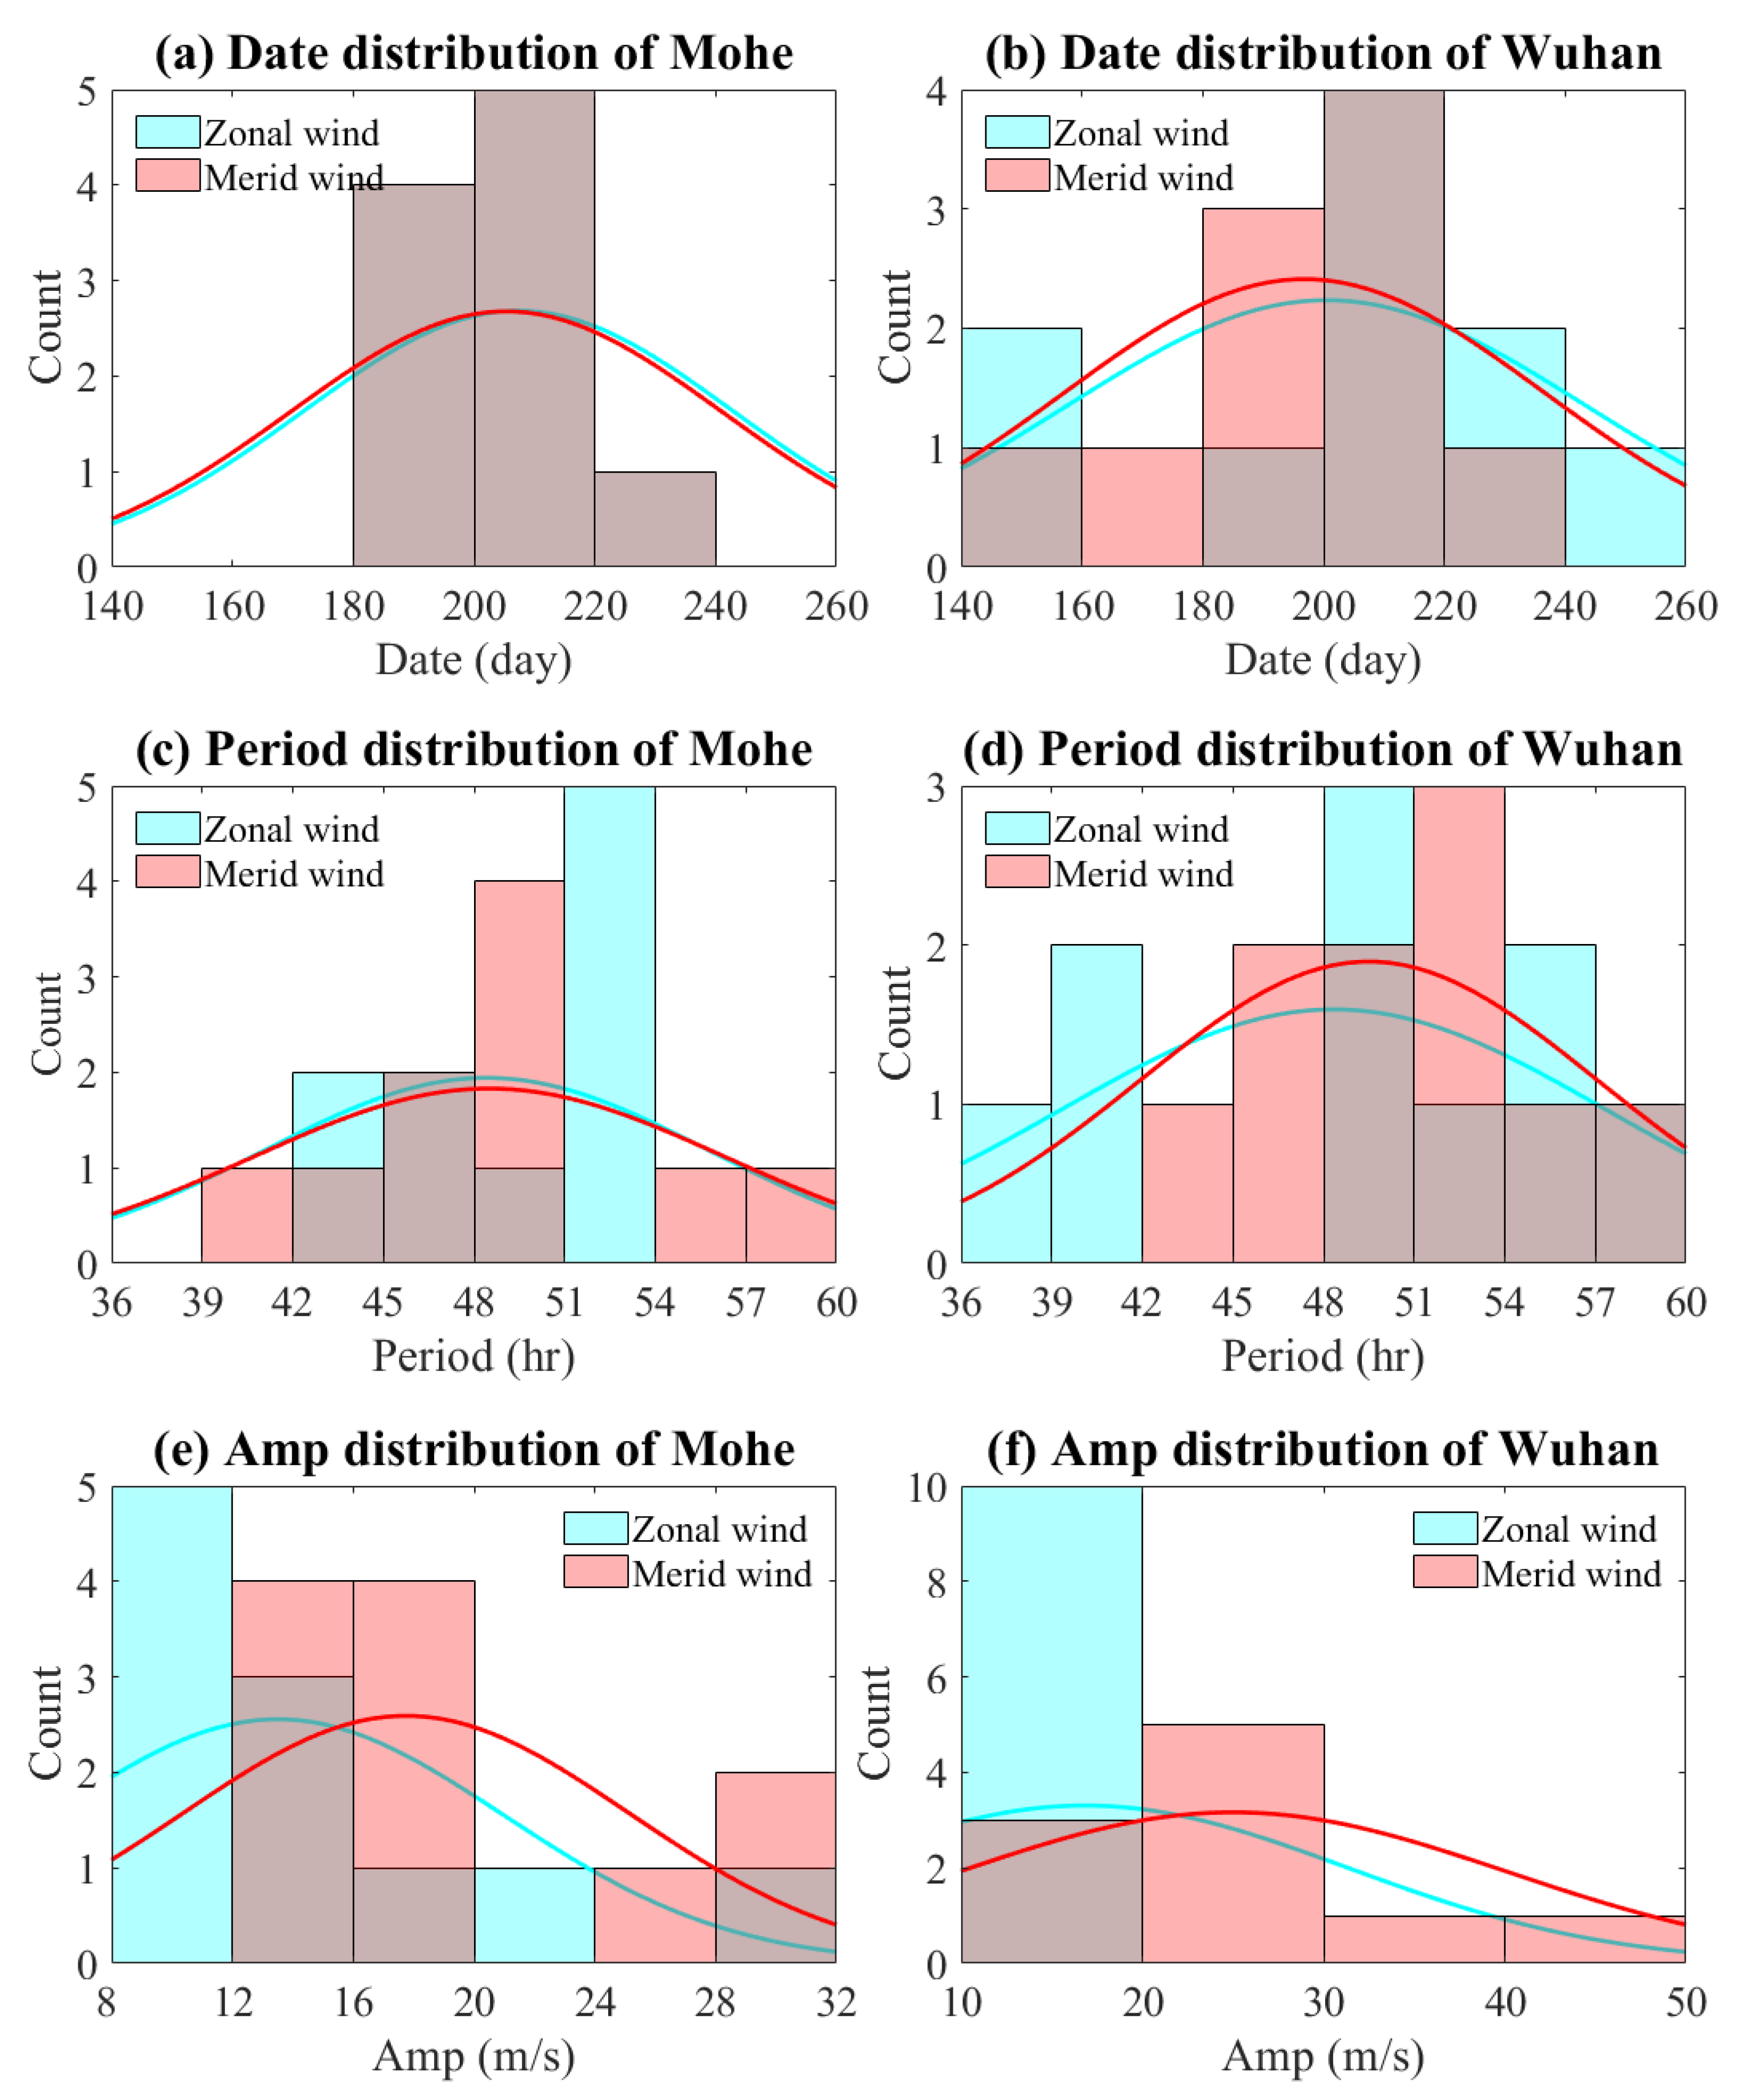
3.2. Mohe Q2DW
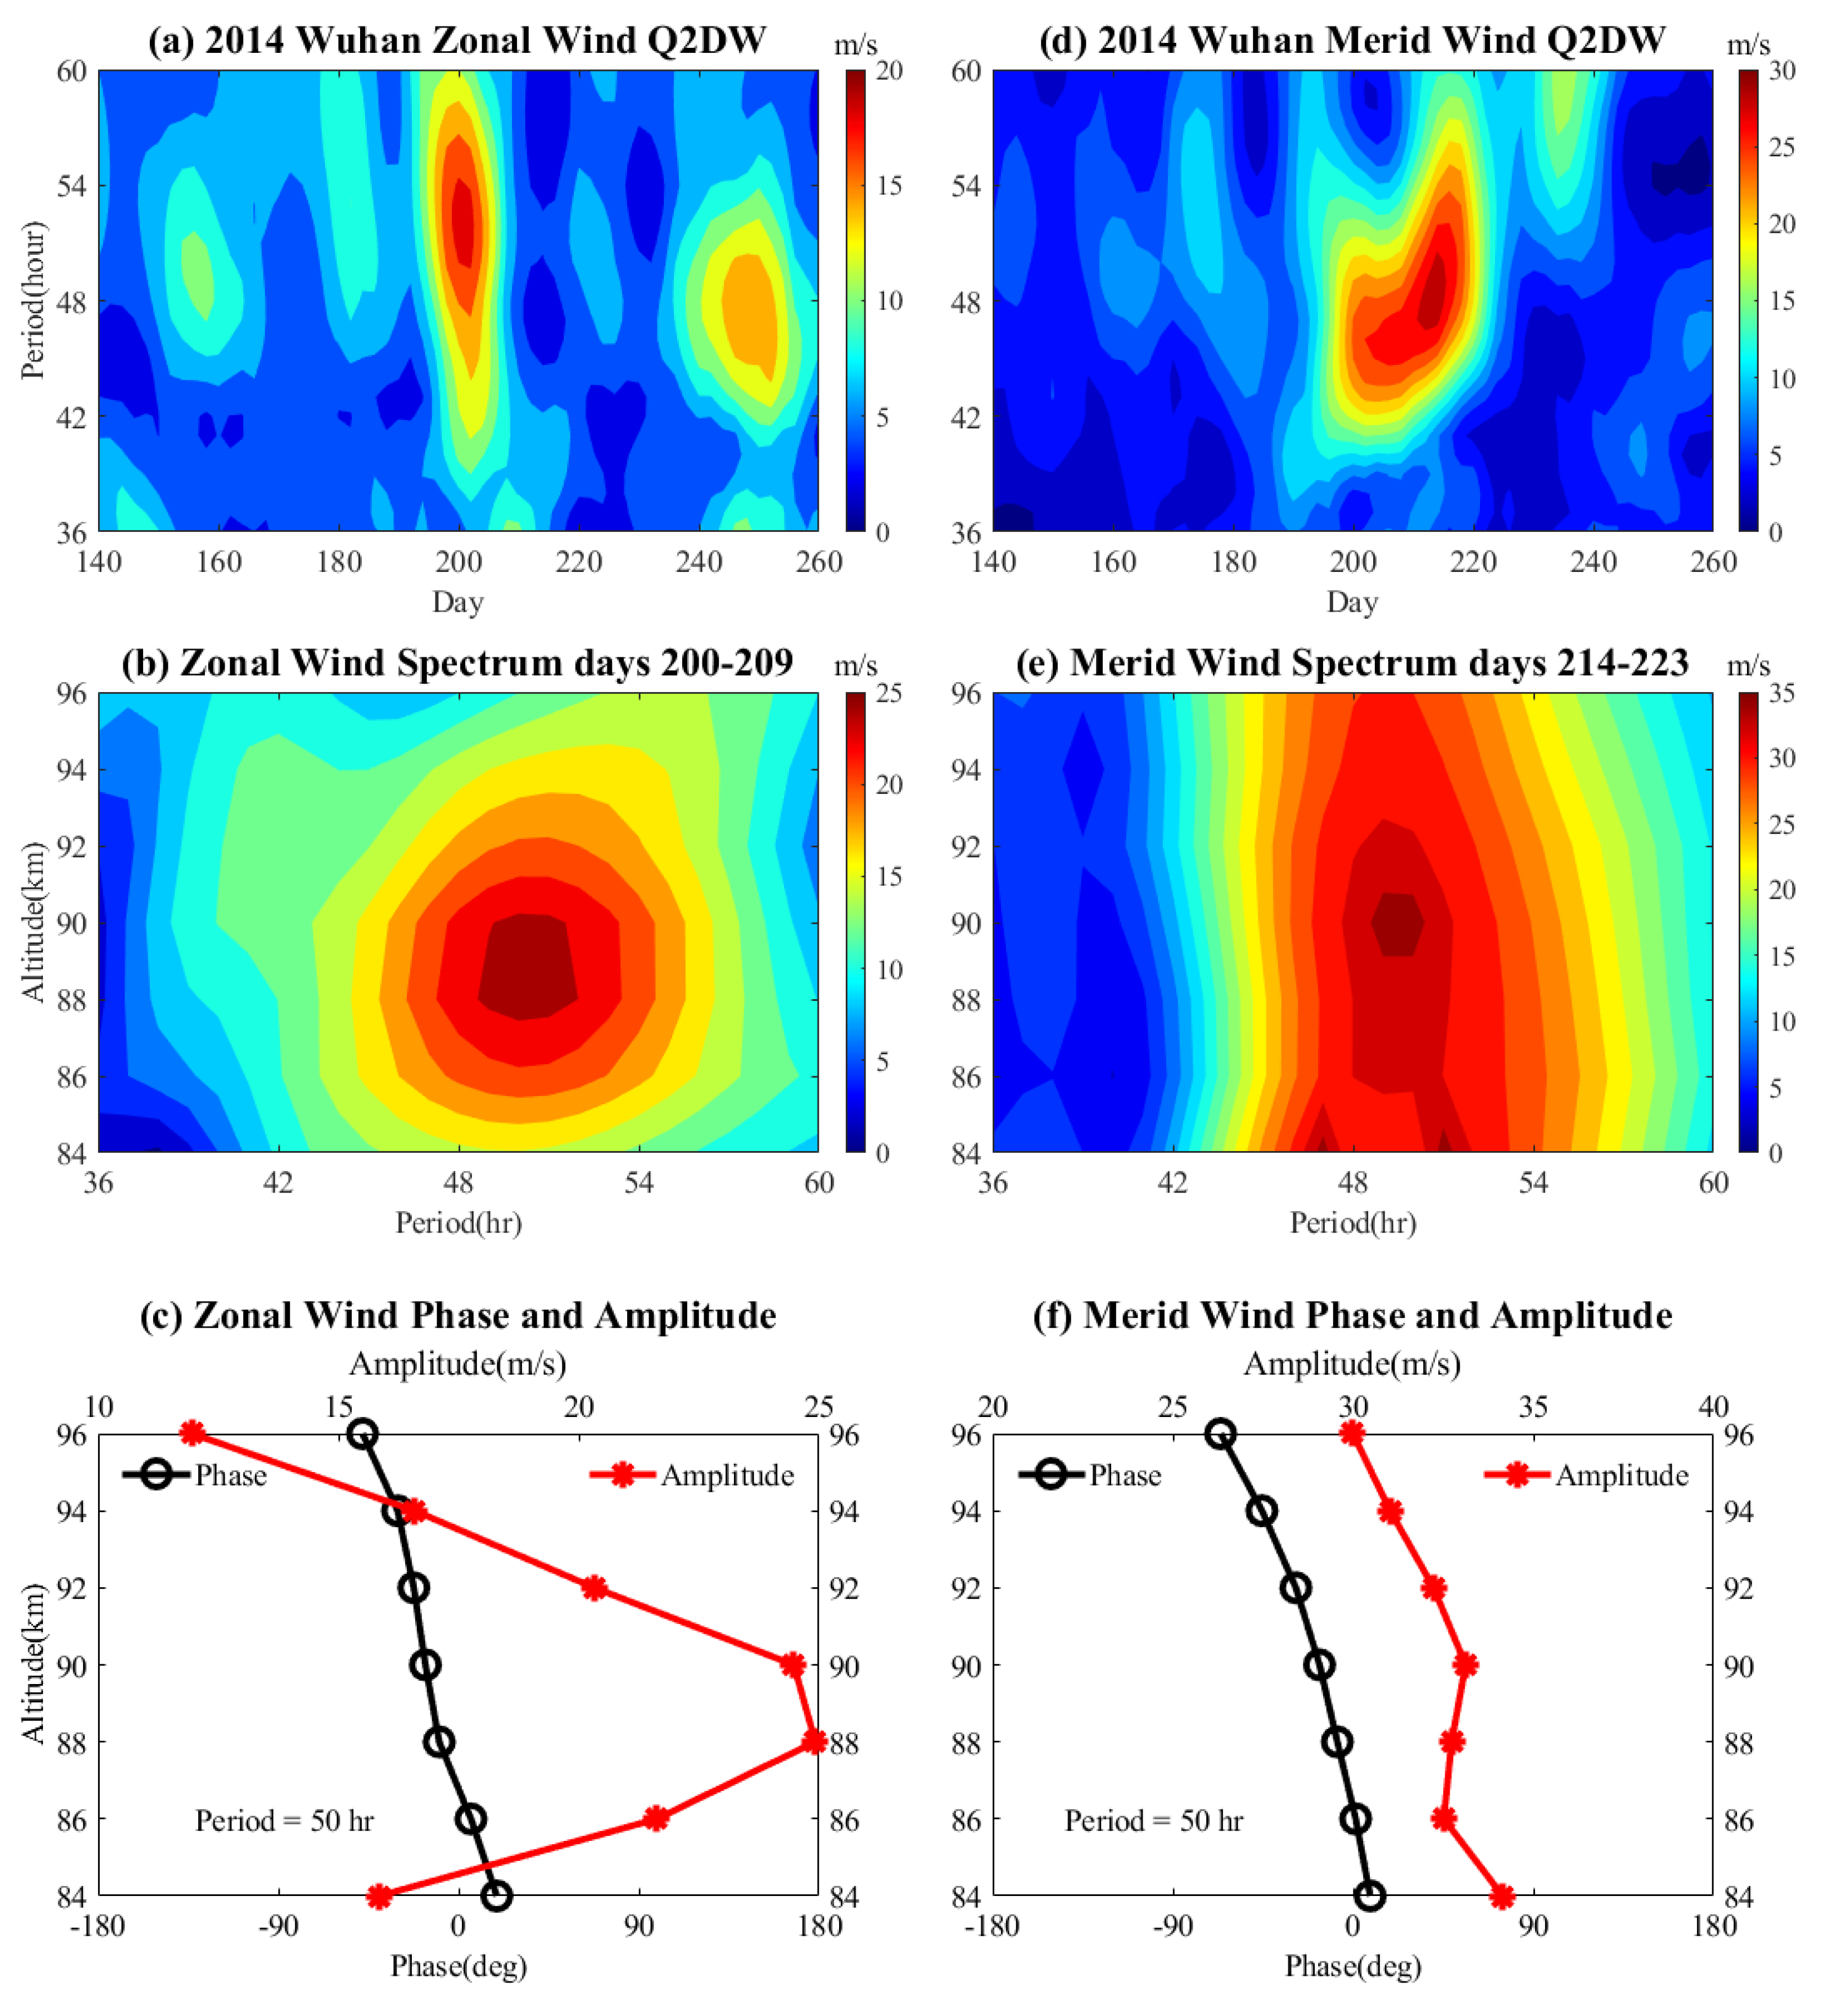
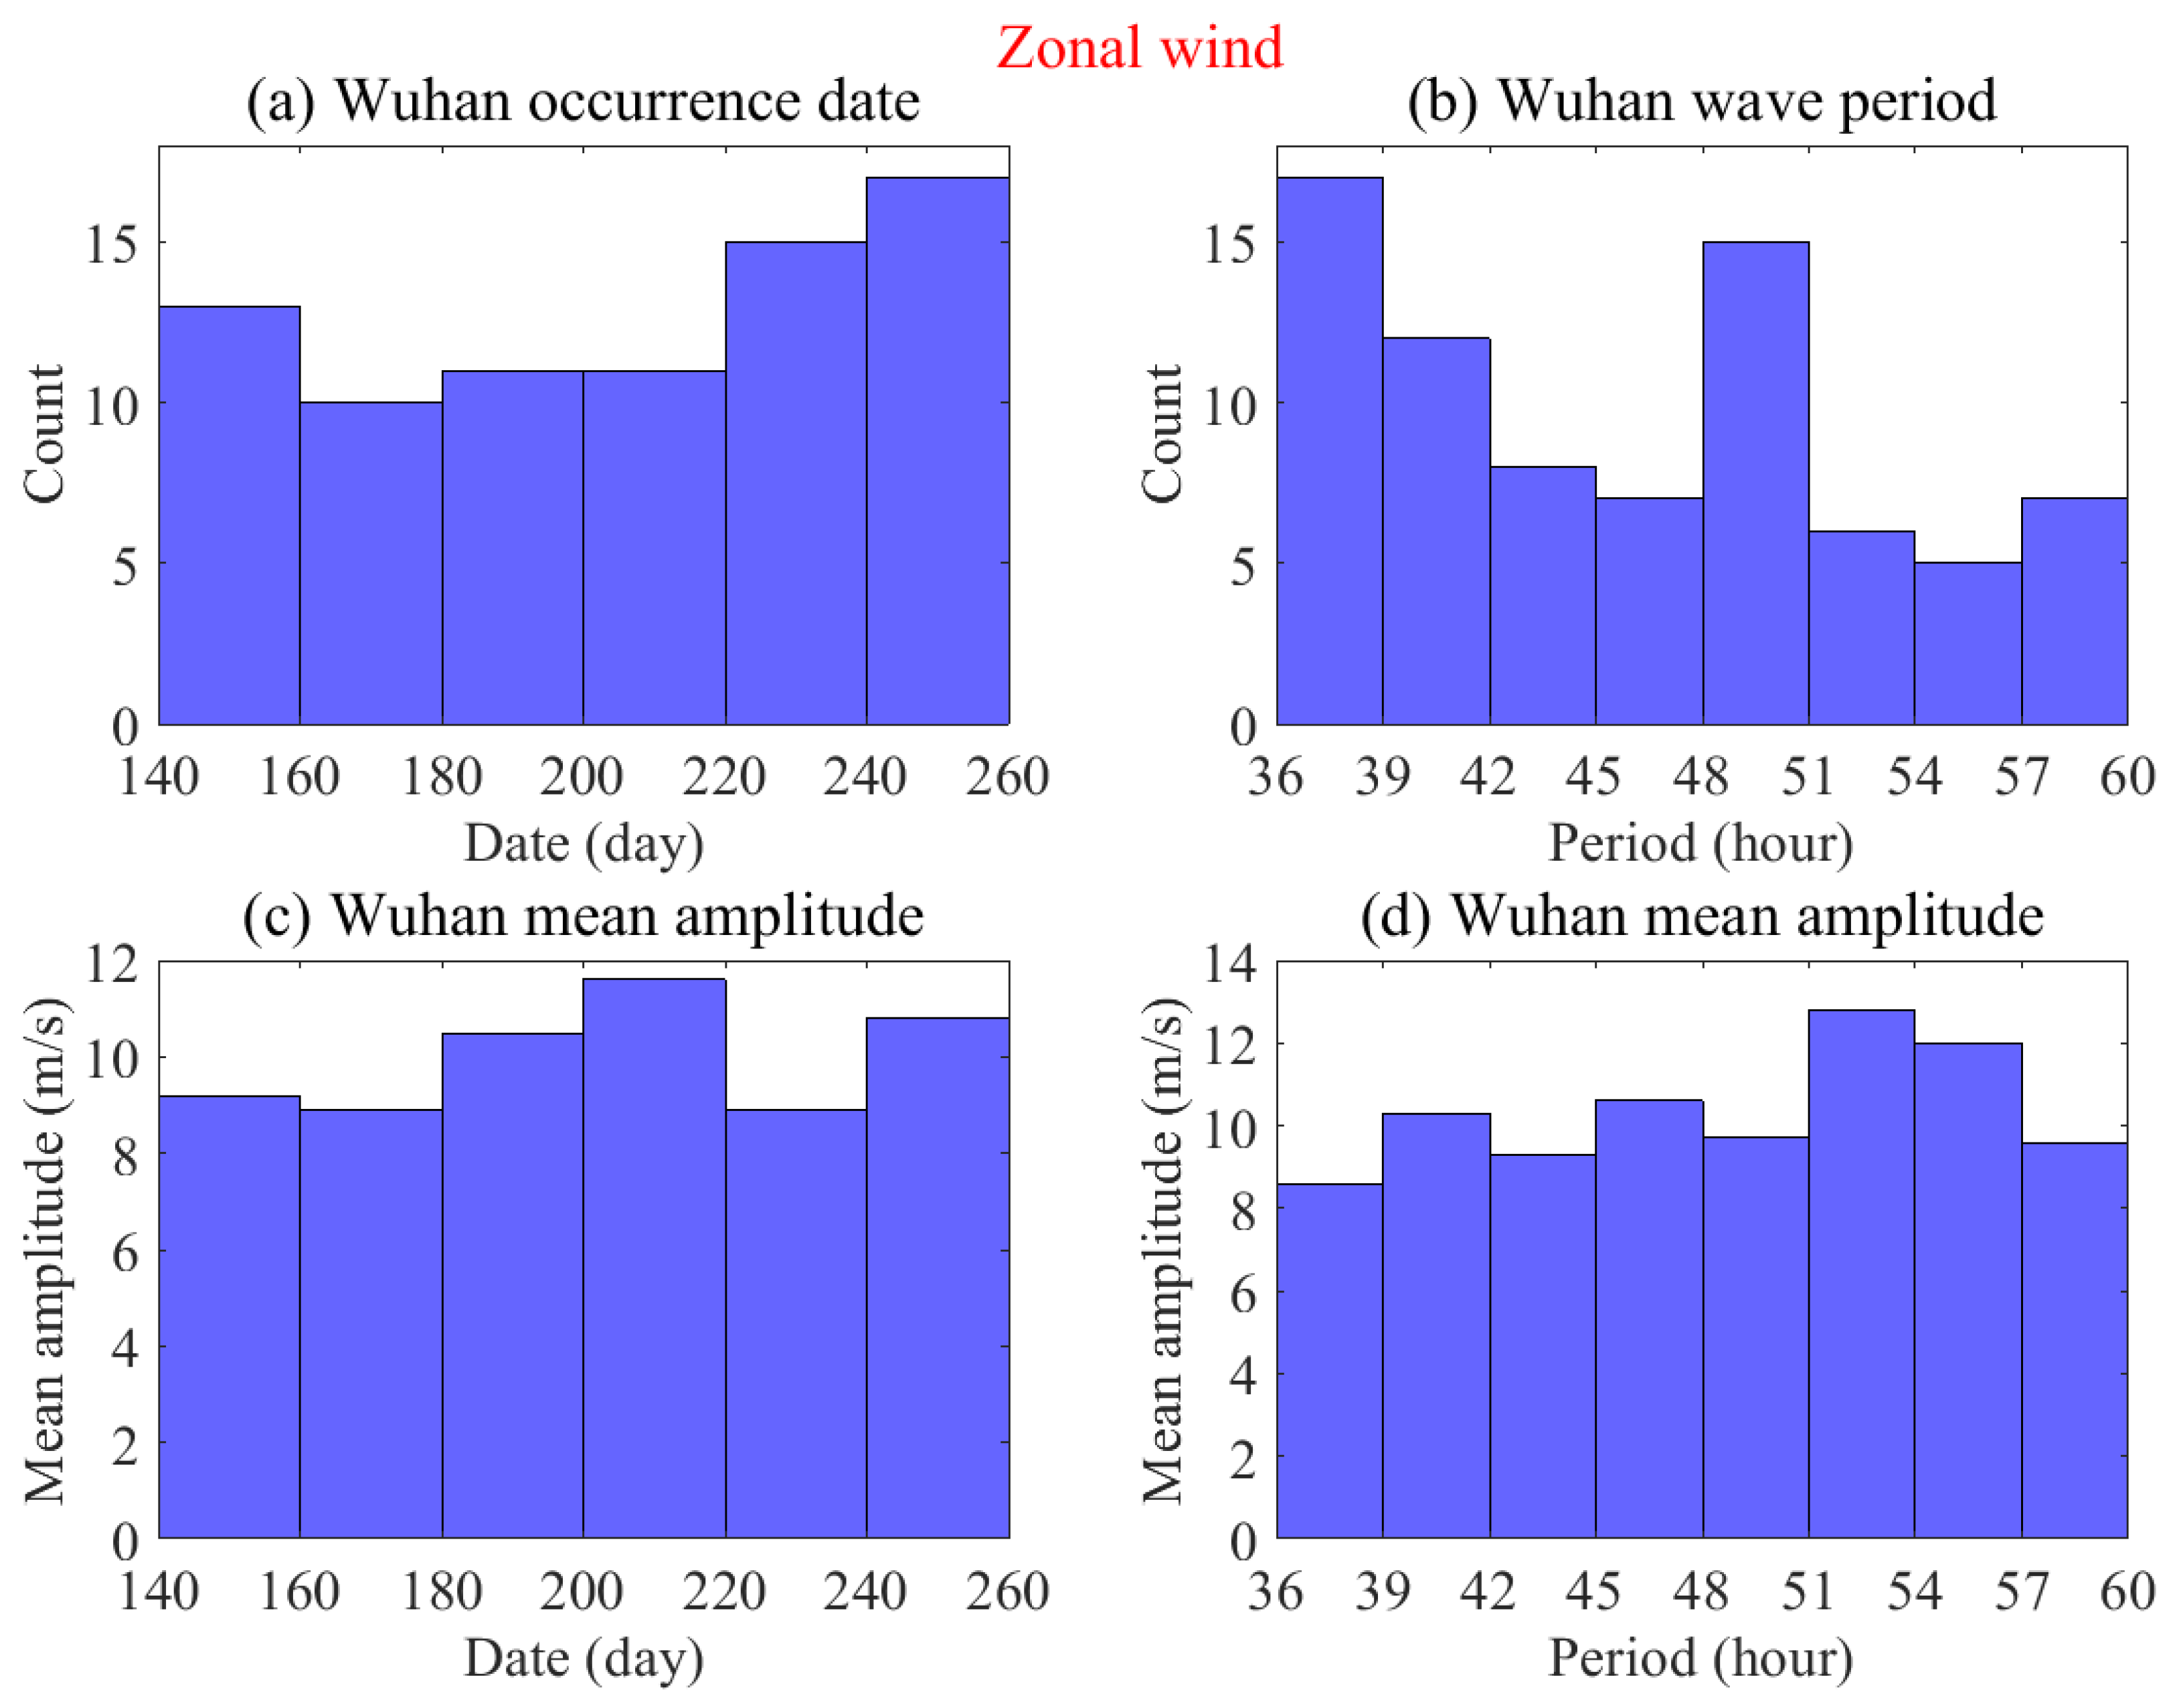
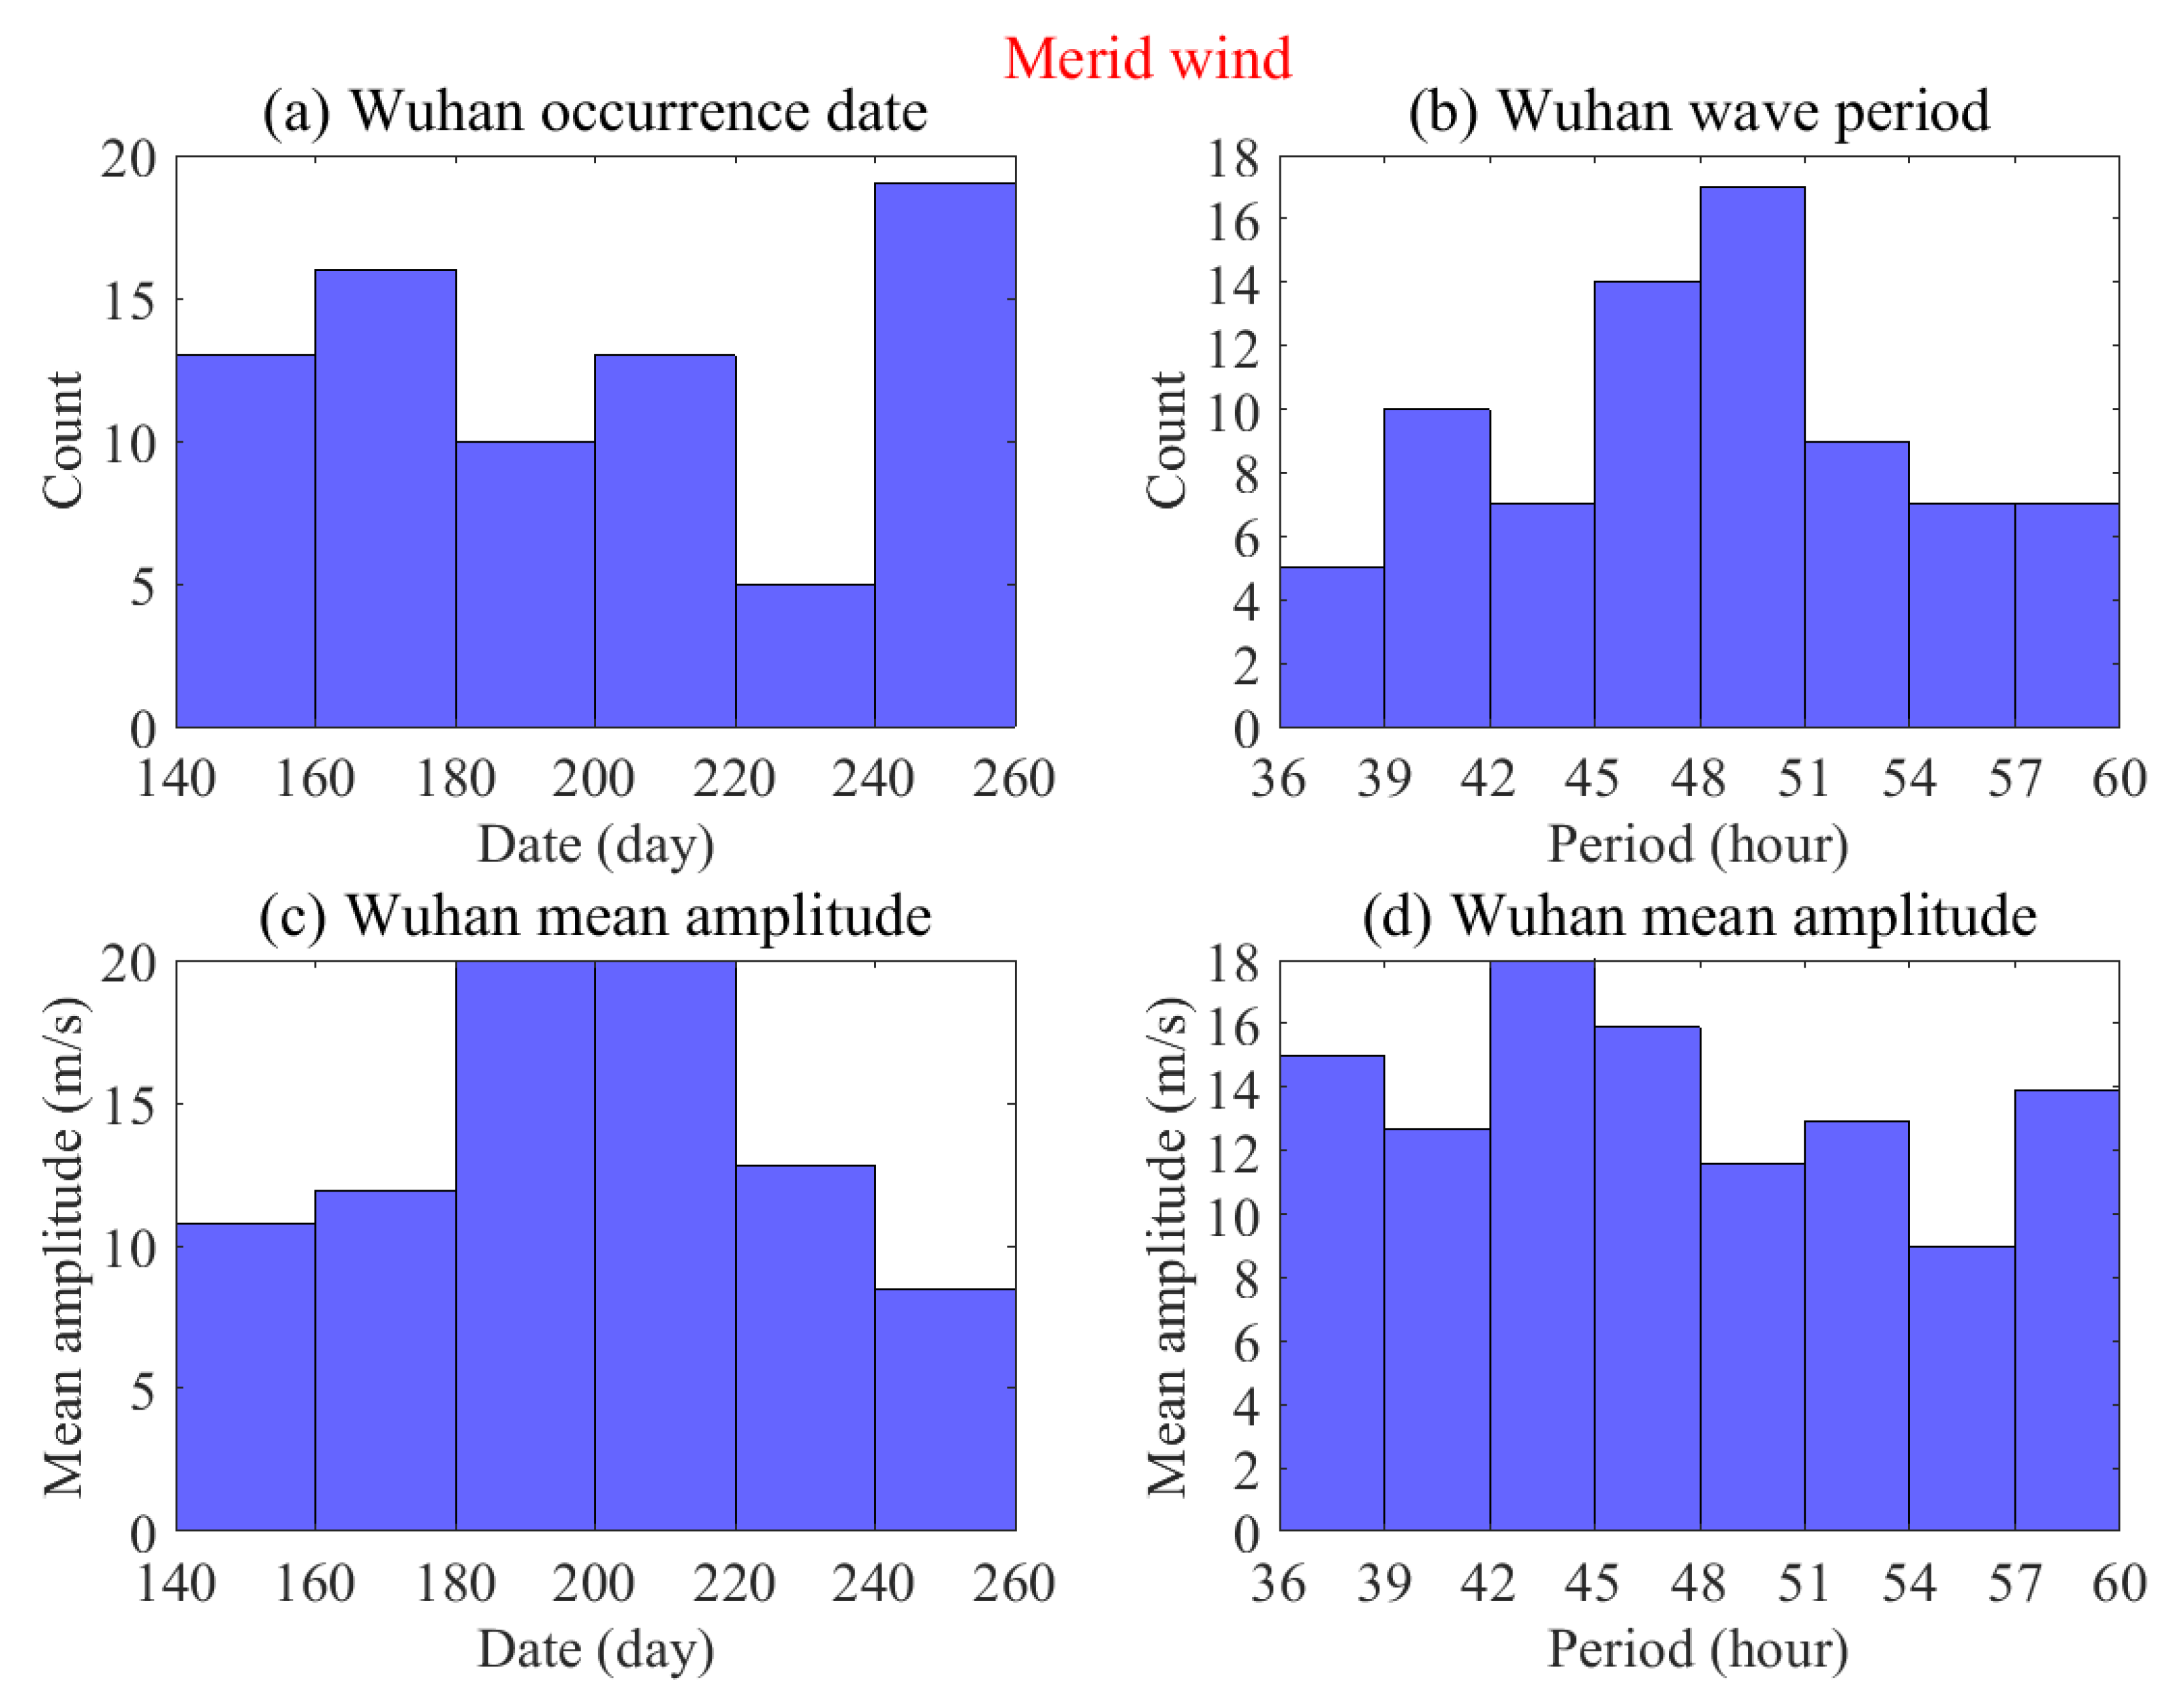
3.3. Wuhan Q2DW
4. Discussion
5. Summary
Author Contributions
Funding
Institutional Review Board Statement
Informed Consent Statement
Data Availability Statement
Acknowledgments
Conflicts of Interest
References
- Pancheva, D.; Mukhtarov, P.; Siskind, D.E. Climatology of the quasi-2-day waves observed in the MLS/Aura measurements (2005–2014). J. Atmos. Sol. Terr. Phys. 2018, 171, 210–224. [Google Scholar] [CrossRef]
- Lilienthal, F.; Jacobi, C. Meteor radar quasi 2-day wave observations over 10 years at Collm (51.3°N, 13.0°E). Atmos. Chem. Phys. 2015, 15, 9917–9927. [Google Scholar] [CrossRef]
- Gu, S.-Y.; Tang, L.; Hou, X.; Zhao, H.; Teng, C.-K.-M.; Dou, X. Quasi-Two-Day Waves in the Northern Hemisphere Observed by TIMED/SABER Measurements during 2002–2019. J. Geophys. Res. Space Phys. 2021, 126, e2020JA028877. [Google Scholar] [CrossRef]
- Liu, G.; England, S.L.; Janches, D. Quasi Two-, Three-, and Six-Day Planetary-Scale Wave Oscillations in the Upper Atmosphere Observed by TIMED/SABER over ~17 Years during 2002–2018. J. Geophys. Res. Space Phys. 2019, 124, 9462–9474. [Google Scholar] [CrossRef]
- Lainer, M.; Hocke, K.; Kämpfer, N. Long-term observation of midlatitude quasi 2-day waves by a water vapor radiometer. Atmos. Chem. Phys. 2018, 18, 12061–12074. [Google Scholar] [CrossRef]
- Gu, S.-Y.; Li, T.; Dou, X.; Wang, N.-N.; Riggin, D.; Fritts, D. Long-term observations of the quasi two-day wave by Hawaii MF radar. J. Geophys. Res. Space Phys. 2013, 118, 7886–7894. [Google Scholar] [CrossRef]
- Tunbridge, V.M.; Sandford, D.J.; Mitchell, N.J. Zonal wave numbers of the summertime 2 day planetary wave observed in the mesosphere by EOS Aura Microwave Limb Sounder. J. Geophys. Res. Atmos. 2011, 116, D11103. [Google Scholar] [CrossRef]
- Suresh Babu, V.; Kishore Kumar, K.; John, S.R.; Subrahmanyam, K.V.; Ramkumar, G. Meteor radar observations of short-term variability of quasi 2 day waves and their interaction with tides and planetary waves in the mesosphere–lower thermosphere region over Thumba (8.5°N, 77°E). J. Geophys. Res. Atmos. 2011, 116, D16121. [Google Scholar] [CrossRef]
- Wu, D.L.; Fishbein, E.F.; Read, W.G.; Waters, J.W. Excitation and Evolution of the Quasi-2-Day Wave Observed in UARS/MLS Temperature Measurements. J. Atmos. Sci. 1996, 53, 728–738. [Google Scholar] [CrossRef]
- Meek, C.E.; Manson, A.H.; Franke, S.J.; Singer, W.; Hoffmann, P.; Clark, R.R.; Tsuda, T.; Nakamura, T.; Tsutsumi, M.; Hagan, M.; et al. Global study of northern hemisphere quasi-2-day wave events in recent summers near 90 km altitude. J. Atmos. Terr. Phys. 1996, 58, 1401–1411. [Google Scholar] [CrossRef]
- Tang, L.; Gu, S.Y.; Dou, X.K. Eastward-propagating planetary waves in the polar middle atmosphere. Atmos. Chem. Phys. 2021, 21, 17495–17512. [Google Scholar] [CrossRef]
- Yamazaki, Y.; Stolle, C.; Matzka, J.; Alken, P. Quasi-6-Day Wave Modulation of the Equatorial Electrojet. J. Geophys. Res. Space Phys. 2018, 123, 4094–4109. [Google Scholar] [CrossRef]
- Forbes, J.M.; Zhang, X. The quasi-6 day wave and its interactions with solar tides. J. Geophys. Res. Space Phys. 2017, 122, 4764–4776. [Google Scholar] [CrossRef]
- Pancheva, D.; Mukhtarov, P.; Andonov, B.; Forbes, J.M. Global distribution and climatological features of the 5–6-day planetary waves seen in the SABER/TIMED temperatures (2002–2007). J. Atmos. Sol. Terr. Phys. 2010, 72, 26–37. [Google Scholar] [CrossRef]
- Riggin, D.M.; Fritts, D.C.; Tsuda, T.; Nakamura, T.; Vincent, R.A. Radar observations of a 3-day Kelvin wave in the equatorial mesosphere. J. Geophys. Res. Atmos. 1997, 102, 26141–26157. [Google Scholar] [CrossRef]
- Allen, D.R.; Stanford, J.L.; Elson, L.S.; Fishbein, E.F.; Froidevaux, L.; Waters, J.W. The 4-Day Wave as Observed from the Upper Atmosphere Research Satellite Microwave Limb Sounder. J. Atmos. Sci. 1997, 54, 420–434. [Google Scholar] [CrossRef]
- Lawrence, B.N.; Fraser, G.J.; Vincent, R.A.; Phillips, A. The 4-Day Wave in the Antarctic Mesosphere. J. Geophys. Res.-Atmos. 1995, 100, 18899–18908. [Google Scholar] [CrossRef]
- Randel, W.J.; Lait, L.R. Dynamics of the 4-Day Wave in the Southern Hemisphere Polar Stratosphere. J. Atmos. Sci. 1991, 48, 2496–2508. [Google Scholar] [CrossRef]
- Yamazaki, Y.; Matthias, V. Large-Amplitude Quasi-10-Day Waves in the Middle Atmosphere during Final Warmings. J. Geophys. Res. Atmos. 2019, 124, 9874–9892. [Google Scholar] [CrossRef]
- Forbes, J.M.; Zhang, X. Quasi-10-day wave in the atmosphere. J. Geophys. Res. Atmos. 2015, 120, 11079–11089. [Google Scholar] [CrossRef]
- Liu, J.; Zhang, D.; Hao, Y.; Xiao, Z. Multi-instrumental Observations of the Quasi-16-Day Variations from the Lower Thermosphere to the Topside Ionosphere in the Low-Latitude Eastern Asian Sector During the 2017 Sudden Stratospheric Warming Event. J. Geophys. Res. Space Phys. 2020, 125, e2019JA027505. [Google Scholar] [CrossRef]
- Gong, Y.; Ma, Z.; Li, C.; Lv, X.; Zhang, S.; Zhou, Q.; Huang, C.; Huang, K.; Yu, Y.; Li, G. Characteristics of the quasi-16-day wave in the mesosphere and lower thermosphere region as revealed by meteor radar, Aura satellite, and MERRA2 reanalysis data from 2008 to 2017. Earth Planet. Phys. 2020, 4, 274–284. [Google Scholar] [CrossRef]
- Gong, Y.; Wang, H.; Ma, Z.; Zhang, S.; Zhou, Q.; Huang, C.; Huang, K. A Statistical Analysis of the Propagating Quasi 16-Day Waves at High Latitudes and Their Response to Sudden Stratospheric Warmings from 2005 to 2018. J. Geophys. Res. Atmos. 2019, 124, 12617–12630. [Google Scholar] [CrossRef]
- Day, K.A.; Taylor, M.J.; Mitchell, N.J. Mean winds, temperatures and the 16- and 5-day planetary waves in the mesosphere and lower thermosphere over Bear Lake Observatory (42°N, 111°W). Atmos. Chem. Phys. 2012, 12, 1571–1585. [Google Scholar] [CrossRef]
- Day, K.A.; Hibbins, R.E.; Mitchell, N.J. Aura MLS observations of the westward-propagating s = 1, 16-day planetary wave in the stratosphere, mesosphere and lower thermosphere. Atmos. Chem. Phys. 2011, 11, 4149–4161. [Google Scholar] [CrossRef]
- Muller, H.G.; Massey, H.S.W.; Groves, G.V. A discussion on D and E region winds over Europe—Long-period meteor wind oscillations. Math. Phys. Sci. 1972, 271, 585–599. [Google Scholar] [CrossRef]
- Watanabe, S.; Tomikawa, Y.; Sato, K.; Kawatani, Y.; Miyazaki, K.; Takahashi, M. Simulation of the eastward 4-day wave in the Antarctic winter mesosphere using a gravity wave resolving general circulation model. J. Geophys. Res. Atmos. 2009, 114, D16111. [Google Scholar] [CrossRef]
- Manney, G.L.; Orsolini, Y.J.; Pumphrey, H.C.; Roche, A.E. The 4-Day Wave and Transport of UARS Tracers in the Austral Polar Vortex. J. Atmos. Sci. 1998, 55, 3456–3470. [Google Scholar] [CrossRef]
- Fraser, G.J.; Hernandez, G.; Smith, R.W. Eastward-moving 2–4 day waves in the winter Antarctic mesosphere. Geophys. Res. Lett. 1993, 20, 1547–1550. [Google Scholar] [CrossRef]
- Venne, D.E.; Stanford, J.L. Observation of a 4–Day Temperature Wave in the Polar Winter Stratosphere. J. Atmos. Sci. 1979, 36, 2016–2019. [Google Scholar] [CrossRef]
- Jacobi, C.; Fröhlich, K.; Pogoreltsev, A. Quasi two-day-wave modulation of gravity wave flux and consequences for the planetary wave propagation in a simple circulation model. J. Atmos. Sol. Terr. Phys. 2006, 68, 283–292. [Google Scholar] [CrossRef]
- Jacobi, C.; Portnyagin, Y.I.; Merzlyakov, E.G.; Kashcheyev, B.L.; Oleynikov, A.N.; Kürschner, D.; Mitchell, N.J.; Middleton, H.R.; Muller, H.G.; Comley, V.E. Mesosphere/lower thermosphere wind measurements over Europe in summer 1998. J. Atmos. Sol. Terr. Phys. 2001, 63, 1017–1031. [Google Scholar] [CrossRef]
- Ma, Z.; Gong, Y.; Zhang, S.; Zhou, Q.; Huang, C.; Huang, K.; Yu, Y.; Li, G.; Ning, B.; Li, C. Responses of Quasi 2 Day Waves in the MLT Region to the 2013 SSW Revealed by a Meteor Radar Chain. Geophys. Res. Lett. 2017, 44, 9142–9150. [Google Scholar] [CrossRef]
- Holdsworth, D.A.; Reid, I.M.; Cervera, M.A. Buckland Park all-sky interferometric meteor radar. Radio Sci. 2004, 39, RS5009. [Google Scholar] [CrossRef]
- Hall, C.M.; Aso, T.; Tsutsumi, M. An examination of high latitude upper mesosphere dynamic stability using the Nippon/Norway Svalbard Meteor Radar. Geophys. Res. Lett. 2002, 29, 121-1–121-3. [Google Scholar] [CrossRef]
- Stober, G.; Jacobi, C.; Fröhlich, K.; Oberheide, J. Meteor radar temperatures over Collm (51.3°N, 13°E). Adv. Space Res. 2008, 42, 1253–1258. [Google Scholar] [CrossRef]
- Hall, C.M.; Aso, T.; Tsutsumi, M.; Hffner, J.; Sigernes, F.; Holdsworth, D.A. Neutral air temperatures at 90 km and 70°N and 78°N. J. Geophys. Res.Atmos. 2006, 111, D14105. [Google Scholar] [CrossRef]
- Hocking, W.K.; Fuller, B.; Vandepeer, B. Real-time determination of meteor-related parameters utilizing modern digital technology. J. Atmos. Sol. Terr. Phys. 2001, 63, 155–169. [Google Scholar] [CrossRef]
- Yi, W.; Reid, I.M.; Xue, X.; Murphy, D.J.; Hall, C.M.; Tsutsumi, M.; Ning, B.; Li, G.; Younger, J.P.; Chen, T.; et al. High- and Middle-Latitude Neutral Mesospheric Density Response to Geomagnetic Storms. Geophys. Res. Lett. 2018, 45, 436–444. [Google Scholar] [CrossRef]
- Liu, L.; Liu, H.; Chen, Y.; Le, H.; Sun, Y.-Y.; Ning, B.; Hu, L.; Wan, W. Variations of the meteor echo heights at Beijing and Mohe, China. J. Geophys. Res. Space Phys. 2017, 122, 1117–1127. [Google Scholar] [CrossRef]
- Yu, Y.; Wan, W.; Ning, B.; Liu, L.; Wang, Z.; Hu, L.; Ren, Z. Tidal wind mapping from observations of a meteor radar chain in December 2011. J. Geophys. Res. Space Phys. 2013, 118, 2321–2332. [Google Scholar] [CrossRef]
- Xiong, J.G.; Wan, W.; Ning, B.; Liu, L. First results of the tidal structure in the MLT revealed by Wuhan Meteor Radar (30°40′N, 114°30′E). J. Atmos. Sol. Terr. Phys. 2004, 66, 675–682. [Google Scholar] [CrossRef]
- Sun, R.D.; Gu, S.Y.; Dou, X.K.; Wei, Y.F.; Qin, Y.S.; Yang, Z.L. Decadal Quasi-2-Day Wave Observations in the Equatorial Mesopause Region by a Meteor Radar over Kototabang (0.2°S, 100.3°E) and TIMED/TIDI and Comparison with Quasi-2-Day Wave Observations at Mid-Latitudes. Remote Sens. 2023, 15, 1122. [Google Scholar] [CrossRef]
- Pancheva, D.; Mukhtarov, P.; Siskind, D.E.; Smith, A.K. Global distribution and variability of quasi 2 day waves based on the NOGAPS-ALPHA reanalysis model. J. Geophys. Res. Space Phys. 2016, 121, 411–422, 449. [Google Scholar] [CrossRef]
- Huang, Y.Y.; Zhang, S.D.; Yi, F.; Huang, C.M.; Huang, K.M.; Gan, Q.; Gong, Y. Global climatological variability of quasi-two-day waves revealed by TIMED/SABER observations. Ann. Geophys. 2013, 31, 1061–1075. [Google Scholar] [CrossRef]
- Gu, S.-Y.; Li, T.; Dou, X.; Wu, Q.; Mlynczak, M.G.; Russell Iii, J.M. Observations of Quasi-Two-Day wave by TIMED/SABER and TIMED/TIDI. J. Geophys. Res. Atmos. 2013, 118, 1624–1639. [Google Scholar] [CrossRef]
Disclaimer/Publisher’s Note: The statements, opinions and data contained in all publications are solely those of the individual author(s) and contributor(s) and not of MDPI and/or the editor(s). MDPI and/or the editor(s) disclaim responsibility for any injury to people or property resulting from any ideas, methods, instructions or products referred to in the content. |
© 2024 by the authors. Licensee MDPI, Basel, Switzerland. This article is an open access article distributed under the terms and conditions of the Creative Commons Attribution (CC BY) license (https://creativecommons.org/licenses/by/4.0/).
Share and Cite
Tang, L.; Gu, S.-Y.; Sun, R.; Dou, X. Multi-Year Behavioral Observations of Quasi-2-Day Wave Activity in High-Latitude Mohe (52.5°N, 122.3°E) and Middle-Latitude Wuhan (30.5°N, 114.6°E) Using Meteor Radars. Remote Sens. 2024, 16, 311. https://doi.org/10.3390/rs16020311
Tang L, Gu S-Y, Sun R, Dou X. Multi-Year Behavioral Observations of Quasi-2-Day Wave Activity in High-Latitude Mohe (52.5°N, 122.3°E) and Middle-Latitude Wuhan (30.5°N, 114.6°E) Using Meteor Radars. Remote Sensing. 2024; 16(2):311. https://doi.org/10.3390/rs16020311
Chicago/Turabian StyleTang, Liang, Sheng-Yang Gu, Ruidi Sun, and Xiankang Dou. 2024. "Multi-Year Behavioral Observations of Quasi-2-Day Wave Activity in High-Latitude Mohe (52.5°N, 122.3°E) and Middle-Latitude Wuhan (30.5°N, 114.6°E) Using Meteor Radars" Remote Sensing 16, no. 2: 311. https://doi.org/10.3390/rs16020311
APA StyleTang, L., Gu, S.-Y., Sun, R., & Dou, X. (2024). Multi-Year Behavioral Observations of Quasi-2-Day Wave Activity in High-Latitude Mohe (52.5°N, 122.3°E) and Middle-Latitude Wuhan (30.5°N, 114.6°E) Using Meteor Radars. Remote Sensing, 16(2), 311. https://doi.org/10.3390/rs16020311