Abstract
The advancement of remote sensing has enabled the creation of high-resolution Digital Elevation Models (DEMs). Topographic features such as slope gradient (SG), local convexity (LC), and surface texture (ST), derived from DEMs, are related to subsurface geological conditions. In South Korea, bedrock depth (Dbedrock) and the average shear wave velocity of soil (VSsoil) serve as metrics for determining the site class, which represents the degree of site amplification in seismic design criteria. These metrics, typically measured through geotechnical and geophysical investigations, require predictive methods for preliminary estimation over large areas. Previous studies developed an automatic terrain classification (AC) scheme using SG, LC, and ST, and subsequent research revealed that terrain classification effectively represents subsurface conditions such as Dbedrcok and average shear wave velocity down to 30 m depth. However, AC intrinsically depends on the regional features of DEMs, dividing regions based on nested means of topographic features (SG, LC, and ST). In this study, we developed two terrain classification methods to determine the thresholds of class divisions, aiming to optimize Dbedrock and VSsoil predictions: Sequentially Optimized Classification (SOC) and Non-Sequentially Optimized Classification (NOC). Through the study of the sensitivity of terrain classification methods, smoothing levels, and threshold levels for terrain class generation, we identified the best classification method by comparing it with the geological and mountainous region distribution. Subsequently, we developed DEM-dependent regression models for each class to enhance the accuracy of predicting Dbedrock and VSsoil. The main findings of this study are: (1) the terrain class map suggested in this study represents the distribution of alluvial plane and mountainous regions well, and (2) the DEM calibration for each class provides increased accuracy of Dbedrock and VSsoil predictions in South Korea. We anticipate that the terrain class map, along with Dbedrock and VSsoil maps, will be effectively utilized in geological interpretations and land-use planning for seismic design.
Keywords:
DEM; slope; convexity; texture; bedrock depth; average shear wave velocity; terrain classification 1. Introduction
South Korea’s national seismic design standard classifies soil using bedrock depth (Dbedrock) and the average shear wave velocity of soil layers (VSsoil) [1]. Ground investigations at new construction sites typically involve drilling surveys to determine Dbedrock and geophysical methods such as downhole and suspension P-S logging tests for VSsoil. However, these ground surveys are often impractical for existing structures and numerous buildings which lack prior data. A preliminary approach that estimates Dbedrock and VSsoil using available topographic data (e.g., elevation, slope) can offer valuable insights for broader area site classifications. Representatively, Wald and Allen [2] and Allen and Wald [3] developed a relationship model for VS30 (i.e., time-averaged shear wave velocity down to 30 m depth) using the slope calculated from a Digital Elevation Model (DEM). In addition, there are studies using machine learning techniques with DEM data to develop a Dbedrock map in China [4], and using linear regression analysis based on DEM and slope to develop a VS30 model in South Korea [5]. Moreover, there are studies that predict the soil–rock interface and rockhead elevation using machine learning techniques with borehole data [6,7]. As noted, DEM has been the main resource used in the prediction of subsurface conditions.
The advancement of remote sensing has significantly progressed the development of DEM [8]. Traditionally, DEMs were derived from stereo pairs of satellite images, providing global coverage with a moderate resolution [9]. In the 2000s, the Shuttle Radar Topography Mission (SRTM) marked a significant shift by using radar interferometry to achieve a 30 m resolution mapping of the Earth [10]. Further enhancement came with aerial Light Detection and Ranging (LiDAR) systems, which brought DEM accuracy down to centimeter-level precision, proving to be particularly advantageous in forested areas due to their capability to penetrate vegetation [11]. In South Korea, the National Geographic Information Institute (NGII) provides a DEM with a 90 m resolution for the Korean Peninsula and one with a 5 m resolution for South Korea derived from aerial photogrammetry using stereo pairs of satellite images and topography maps [12]. In addition, the advent of modern LiDAR technology has further refined its accuracy, which enables it to provide a 1 m resolution DEM for city regions. As a result, South Korea’s DEMs are available in 1 m, 5 m, and 90 m resolutions, with the 90 m resolution DEM being accessible via the National Spatial Data Infrastructure (NSDI) portal [13]. However, the 1 m and 5 m resolution DEMs remain restricted from public access.
As the DEM provides the elevation of the surface, surface characteristics such as slope gradient (SG), local convexity (LC), and surface texture (ST) can be generated from the DEM [14]. These topographic features are instrumental in analyzing surface soil characteristics and the underlying geology. Iwahashi and Pike [14] (IP07) introduced a terrain classification scheme based on the SG, LC, and ST topographic features. They established an automatic terrain classification method using these features to distinguish 16 terrain classes and validated their approach by comparing the classifications with known geology and landforms. Table 1 lists dominant landforms and lithologic units per terrain class in Japan [14]. Low-number classes (1–8) are related to mountains and volcanic landforms, while high-number classes (9–16) are related to soil deposits. These terrain classes effectively represent the geomorphic and geologic features of the surface, but as noted in IP07, the classification’s effectiveness might vary depending on regional differences, resolution, and vertical intervals in the DEMs used.

Table 1.
Dominant landforms and lithologic units per terrain class in Japan (adapted from Iwahashi and Pike [14]).
Terrain classes from IP07 have been applied in various studies worldwide to deduce geotechnical properties such as the average shear wave velocity in the top 30 m (VS30) and bedrock depth (Dbedrock). For instance, Vilanova et al. [15] developed a VS30 model for Portugal that incorporated terrain classifications to predict seismic site behaviors. Similarly, other studies have utilized DEM-based terrain classifications to map seismic risks and site conditions in diverse regions like Iran [16], Indonesia [17], North Korea [18], and California [19]. Moreover, Furze et al. [20] demonstrated the use of terrain attributes in mapping Dbedrock with a random forest algorithm.
This study aims to find terrain classes which correspond to geologic units in South Korea, and infer Dbedrock and VSsoil values based on terrain classes and DEM. We implemented three methods for terrain classification: (1) Automated Classification (AC) aligned with the IP07 approach, (2) Sequentially Optimized Classification (SOC) that defines thresholds to minimize Dbedrock standard deviation at each division stage, and (3) Non-Sequentially Optimized Classification (NOC) that employs a Monte-Carlo simulation to identify thresholds, minimizing Dbedrock standard deviation across all classes. We utilize a 90 m resolution DEM from the NSDI portal. The 1 m DEM only covers city regions, and the 5 m DEM is not open to public access. The 30 m DEM from the SRTM project [10] is available, but we chose the local DEM to capture the local topographical variations. Using the 90 m DEM, we generated multiple SG, LC, and ST layers for sensitivity analysis of the smoothing window and threshold effects. We further calculated Dbedrock by fitting a linear model to the elevation of the DEM at each class. Finally, the resulting terrain classes are compared with geological layers and the prediction performance of Dbedrock and VSsoil are evaluated.
2. Data
This section discusses the ground investigation data utilized in this study and the methods employed for deriving SG, LC, and ST. Ground investigation provides Dbedrock and VSsoil, while SG, LC, and ST are prediction variables used for estimating terrain classes.
2.1. Ground Investigations
The ground investigation data encompass borehole logs with geological strata and Standard Penetration Test (SPT) results, as well as VS profiles. These elements determine the Dbedrock and VSsoil at a given site. Dbedrock is ascertained by identifying the depth to a soft rock layer or a stiffer layer, while VSsoil is an average of the shear wave velocities of soil layers calculated from VS travel times. The Geotechnical Information Database System (GeoInfo) in South Korea [21] is a crucial repository for this data, containing 349,869 borehole records as of October 2023. Among these, 115,608 borehole logs reach the bedrock for Dbedrock calculations, but only 1891 logs include VS profiles derived from geophysical investigations. To overcome the deficit in VS profiles, we have leveraged SPT N-values, which are widely available, correlating them to VS using the N-VS model [22]. In the absence of N-values, a median VS for each soil layer, as defined in Heo and Kwak [22], is utilized to fill in the missing VS data. Additionally, we filtered out sites that are poorly located due to the potential errors from the coordination system when the raw data are supplied. Ultimately, we produced Dbedrock and VSsoil data for 113,208 sites. Figure 1 presents the distribution of these sites in South Korea.
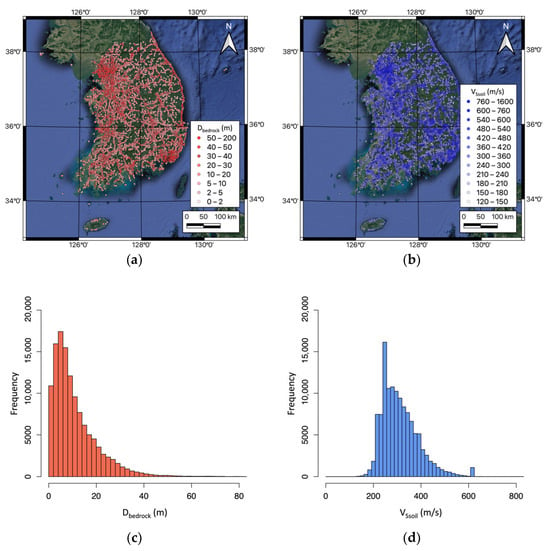
Figure 1.
Distribution maps of borehole locations where (a) Dbedrock and (b) VSsoil are available, and histograms of (c) Dbedrock and (d) VSsoil.
2.2. Topographic Features
The terrain classification in this study leverages DEM-related topographic features: SG, LC, and ST. These features’ calculations are influenced by kernel window size and the thresholds of binary classification. Figure 2 shows the study area, the DEM used in this study, and three example topographic features (SG, LC, and ST) derived from the DEM. The derivation of SG, LC, and ST is described in the following sessions.
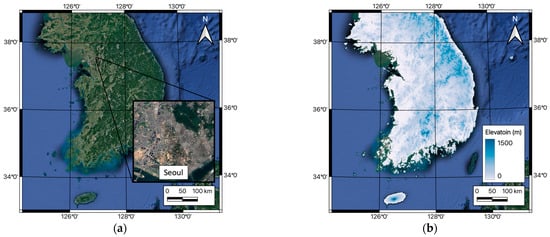

Figure 2.
(a) Map of South Korea and study area (Seoul), (b) DEM used in this study, (c) slope gradient (SG), (d) local convexity (LC), and (e) surface texture (ST) derived from DEM in South Korea.
2.2.1. Slope Gradient (SG)
SG quantifies the change in elevation over a distance. To compute SG, a 3 × 3 kernel matrix, where the sum of each value is zero, is first applied to the same dimension of the elevation matrix to derive dx and dy components as per Equations (1)–(4) [23]:
where kernelSG,x and kernelSG,y are kernel matrices for the x and y directions, respectively, and [elev] is a matrix with DEM values (i.e., elevations), and : indicates the inner product of the two matrices. The summation of the absolute values of the kernel matrix and the resolution of DEM (resDEM) are divided into Equations (3) and (4) for normalization. Therefore, slope in radian (slp) is the arctangent of the square root of the sum of the squares of dx and dy (Equation (5)).
SG is the value in degree converted from slp. If the size of kernel window increases, it smooths the SG values. Figure 3 compares SG calculations over different kernel sizes for the Seoul region in South Korea. Among various smooth levels, the SG with a 3 × 3 kernel window is adopted for use in the terrain classification carried out in this study because the SG with a 3 × 3 kernel window does not strongly emphasize the noise from the DEM, as noted in Iwahashi et al. [24].
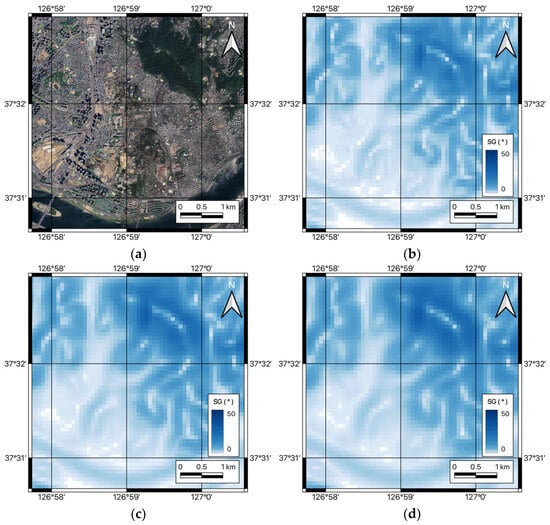
Figure 3.
(a) Satellite image for the Seoul region and slope gradient maps with (b) 3 × 3 kernel window, (c) 5 × 5 kernel window, and (d) 7 × 7 kernel window.
2.2.2. Local Convexity (LC)
LC measures surface curvature. By applying various kernel matrices to the DEM, LC quantifies the convexity or concavity of the terrain:
where kernelLC is a kernel matrix and conv is the resulting convexity. Positive values of conv indicate a convex shape, while negative values indicate a concave shape. In IP07, rather than using raw conv values, binary values, which are zero if conv is less than a certain threshold and one if conv is greater than the threshold, are averaged within a certain radius to calculate LC. Iwahashi et al. [24] calculated LC using thresholds greater than 0 for the determination of concave shape. In addition, the window size of kernelLC can be varied. For the 3 × 3 window size, the Laplacian kernel is used, and for the 5 × 5 and 7 × 7 sizes, Laplacian of Gaussian kernels are used:
Figure 4 shows LCs for the Seoul region with different kernel sizes and thresholds (1, 2, and 3 m). The radius of circular range is determined based on the kernel window sizes (10 grids for 3 × 3, 15 grids for 5 × 5, and 20 grids for 7 × 7 window size). Window sizes larger than the 3 × 3 size (Figure 4d–i) smooth LC too much so that the resolution level is significantly decreased regardless of threshold variation. The higher threshold ignores the low-level concave shape so that it distinguishes flat and concave areas more sharply (e.g., Figure 4c comparing to Figure 4a). Thus, we selected the 3 × 3 window size with 1 to 3 m threshold values for the sensitivity study in the subsequent section.
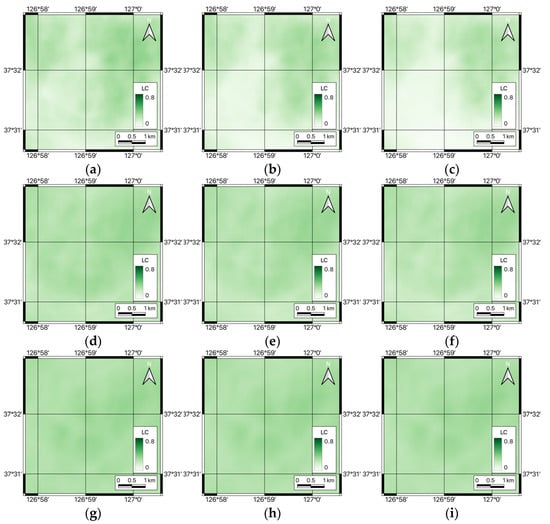
Figure 4.
Maps of local convexity for Seoul region with (a–c) 3 × 3 kernel windows, (d–f) 5 × 5 kernel windows, and (g–i) 7 × 7 kernel windows with 1 m (a,d,g), 2 m (b,e,h), and 3 m (c,f,i) thresholds.
2.2.3. Surface Texture (ST)
ST assesses terrain roughness. In IP07, ST is calculated as the average number of either pits or peaks within a certain circular range. If a DEM value is higher or lower than the median within a window, one is assigned to the cell; otherwise, zero is assigned. The average of these binary values within a circular range is determined to be the ST value. An ST close to one indicates a highly textured area, while an ST close to zero indicates flat terrain. This method is highly dependent on the vertical interval of the DEM; if the vertical interval is at the millimeter level, almost every cell would be assigned one, whereas if the vertical interval is large (e.g., 10 m), most cells would be assigned zero. To address this issue, Iwahashi et al. [24] introduced a threshold; the absolute value of the difference between a DEM value and the median must be greater than this threshold for a cell to be assigned as one.
Figure 5 displays the STs for the Seoul region using 3 × 3, 5 × 5, and 7 × 7 window sizes with three different thresholds (1, 2, and 3 m). Similar to the LC calculation, the radius of the circular range is dependent on window sizes (10 grids for 3 × 3, 15 grids for 5 × 5, and 20 grids for 7 × 7 window size). The level of smoothing in the ST correlates with the selected window size, ranging from light smoothing (3 × 3) to heavy smoothing (7 × 7), and the threshold level more clearly distinguishes between flat and textured areas (e.g., Figure 5c comparing to Figure 5a).
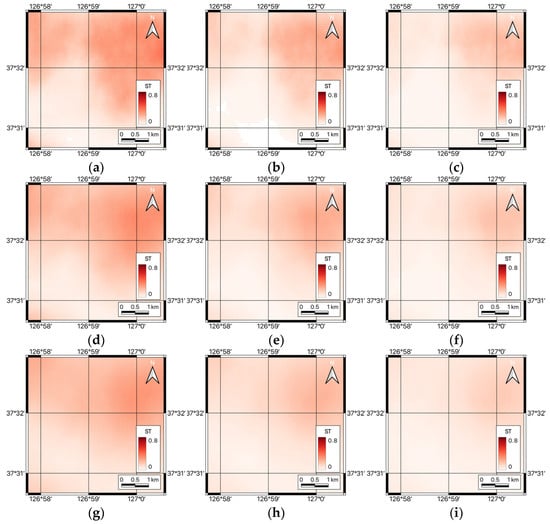
Figure 5.
Maps of surface texture for Seoul region with (a–c) 3 × 3 kernel windows, (d–f) 5 × 5 kernel windows, and (g–i) 7 × 7 kernel windows with 1 m (a,d,g), 2 m (b,e,h), and 3 m (c,f,i) thresholds.
2.3. Geological Features
The 1:50,000 geologic maps, collected from the Korean Institute of Geoscience and Mineral Resources (KIGAM) [25], provide a detailed representation of geological formations and alluvial distribution on the surface of the earth. Furthermore, in conjunction with maps of mountainous regions from the national cadastral map collection of the NSDI [13], we found that geological formations in mountainous regions are from an old geologic era, and Quaternary alluvium is distributed around the outside of the mountainous region. Comparing the terrain classification results with these geological maps helps in assessing the accuracy of the topographic features validated in IP07 [14].
Figure 6a shows the distribution of surface geology in the Seoul region. Quaternary alluvium dominates near the river, and a region older than Quaternary (Precambrian and Jurassic) can be seen in the hilly and mountainous areas. The mountainous region map delineates the extent of mountainous terrains (Figure 6b). This map highlights the areas of high elevation, ruggedness, and slope steepness, which are relevant to terrain classification.
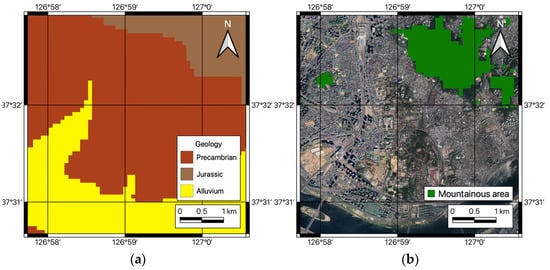
Figure 6.
Maps of (a) surface geology from 1:50,000 resolution geology map and (b) mountainous region obtained from national cadastral map for the Seoul region.
3. Methods of Terrain Classification
3.1. Analysis Cases
SG, LC, and ST are parameters which are influenced by the size of the smoothing window and threshold values, which yield diverse values and, consequently, different terrain classifications. Lighter smoothing typically results in highly variable SG, LC, and ST values over small areas. The thresholds that determine a positive value for LC and ST influence the level of consideration given to convexity and texture. Therefore, it is crucial to determine which combination of smoothing level and threshold produces terrain classes that best correlate with geologic formation and Dbedrock and VSsoil within the region of South Korea. For SG analysis, a 3 × 3 window size is consistently used. In the case of LC, the kernel window size is fixed at 3 × 3, but the thresholds for determining a positive value vary from 1 to 3 m. For ST, the window sizes range from 3 × 3 to 7 × 7, with corresponding thresholds which also range from 1 to 3 m. This approach results in a total of nine cases, as detailed in Table 2. It is noted that the DEM provided by NSDI has a base resolution of 90 m grid size with a vertical interval measured in micrometers.

Table 2.
Analysis of cases with varying filter sizes and vertical intervals for the calculation of slope gradient (SG), local convexity (LC), and surface texture (ST).
3.2. Automated Classification (AC)
Iwahashi and Pike [14] proposed an Automated Classification (AC) method which partitions a study area into 8, 12, or 16 terrain classes based on SG, LC, and ST. These classes, though derived from topographic data, correlate strongly with the landforms and geological structures in the region [14]. This study adopts the 16-class system to accommodate all combinations of SG, LC, and ST values. This system is suitable for a wide area with diverse topographical features [14]. These 16 classes are defined based on three threshold values for SG, LC, and ST, respectively, which are determined through nested means at each classification phase. Figure 7 shows the criteria defining the 16 classes. SG, LC, and ST values are divided sequentially at each phase according to their 1st (SGTH1, LCTH1, STTH1), 2nd (SGTH2, LCTH2, STTH2), and 3rd (SGTH3, LCTH3, STTH3) phase thresholds, forming 16 distinct classes. In the 1st phase, classes 1 to 4 are defined by following steps:
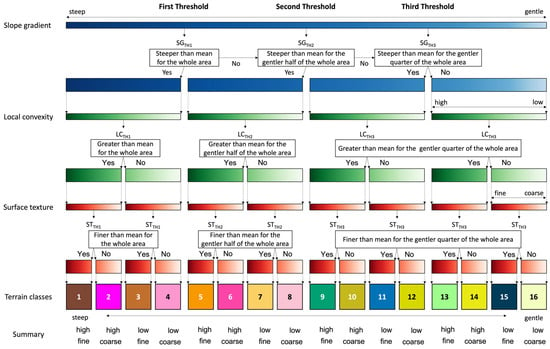
Figure 7.
Schematic drawing showing partitioning slope gradients, local convexity, and surface texture based on nested means suggested by Iwahashi and Pike [14].
- (1)
- Divide the SG into two groups based on the SGTH1, which is the mean of the whole SG;
- (2)
- Divide the nested LC, where the SG is steeper than SGTH1 (SG1), into two groups based on the LCTH1, which is the mean of the nested LC (i.e., LC1 that is greater than LCTH1 and LC2 that is lower than LCTH1);
- (3)
- Divide the nested ST, where the SG is steeper than SGTH1 (SG1), into two groups based on the STTH1, which is the mean of the nested ST (i.e., ST1 that is greater than STTH1 and ST2 that is lower than STTH1);
- (4)
- Denote regions with [SG1, LC1, and ST1] as Class 1, with [SG1, LC1, ST2] as Class 2, with [SG1, LC2, ST1] as Class 3, and with [SG1, LC2, ST2] as Class 4.
The 2nd phase defines classes 5 to 8 similarly to the 1st phase but using an SG that is gentler than SGTH1 and steeper than SGTH2 (SG2) with LCTH2 and STTH2. The 3rd phase defines classes 9 to 16, where classes 9 to 12 are defined using SG3, which is an SG gentler than SGTH2 and steeper than SGTH3 and classes 13 to 16 are defined using SG4, which is an SG gentler than SGTH3. For the 3rd phase, LCTH3 and STTH3 are applied to classes 9 to 16.
Figure 8 presents the terrain classification map of the Seoul region, generated using the AC for each case outlined in Table 2. The terrain classifications exhibit minimal variation across the cases. Within the same window size category (Cases 1–3, 4–6, and 7–9), the regions classified as plains (high number classes) extend into areas previously categorized as mountainous or hilly edges (low number classes) with an increasing number of thresholds. Modifying the LC threshold (e.g., Cases 1, 4, and 7) does not substantially alter the extent of the classes; however, there is a slight increase in class numbers in mountainous regions.
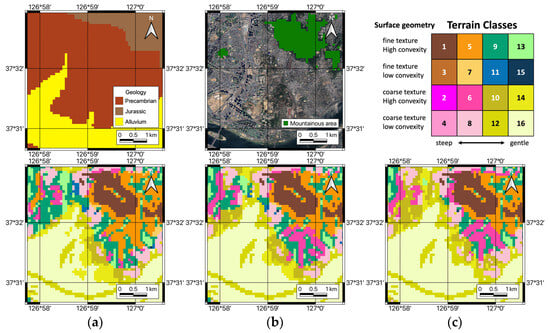
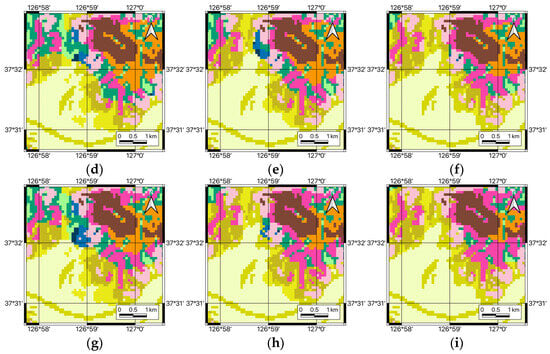
Figure 8.
Maps of terrain classes of Seoul region classified using automatic terrain classification scheme proposed by Iwahashi and Pike [14] for Case 1 to Case 9 which correspond to (a–i).
3.3. Sequentially Optimized Classification (SOC)
The AC method primarily categorizes major terrain types based on SG. Typically, mountainous regions, characterized by steep SG values, are associated with shallow bedrock depth and rapid shear-wave soil velocity. Conversely, areas with gentle SG are often composed of sedimentary layers and landfills, where deeper Dbedrock and slower VSsoil are expected. Consequently, employing SG as a primary classification criterion is justified. However, the AC’s approach of utilizing the nested mean as the threshold in South Korea, results in a high SG threshold because most of the area is mountainous, and so the average SG is high. As a result, AC’s approach cannot distinguish flatter regions into various classes.
To address this, we introduced Sequentially Optimized Classification (SOC), which determines thresholds for SG, LC, and ST by minimizing the standard deviation in the Dbedrock residuals at each classification phase. Residuals are calculated as the difference between the actual Dbedrock and the median Dbedrock of a terrain group, expressed in natural logarithm. For instance, in the first phase, the optimal SG threshold (SGTH1) is identified by finding the value that minimizes the standard deviation of Dbedrock residuals for the two groups—divided into low and high SGTH1. Dbedrock predictions for each group are determined by the median value within that group. This procedure is replicated to define optimal thresholds for SG, LC, and ST in subsequent phases.
Figure 9 presents the terrain classification maps for the Seoul region utilizing SOC for each case. Compared to AC, there is a reduction in the terrain class numbers across all regions. The regions with high class number (greater than 9) alluvial deposits are greatly shrunk, and mountainous regions are mostly composed of class numbers 1 to 3 for all cases. The influence of smoothing levels and threshold values on terrain classification is observed to be similar to that in AC-derived classes.
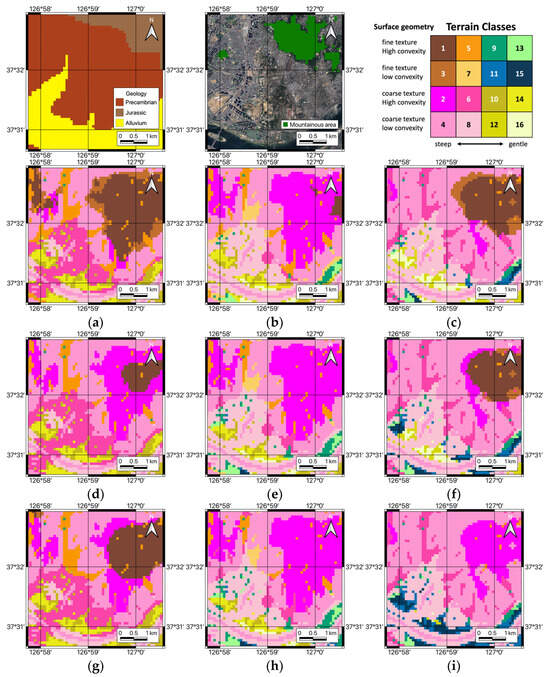
Figure 9.
Maps of terrain classes in the Seoul region classified using the Sequentially Optimized Classification scheme for Dbedrock prediction in Case 1 to Case 9 which are correspond to (a–i).
3.4. Non-Sequentially Optimized Classification (NOC)
While AC and SOC begin their classification with SG, followed by LC and ST, implying a dependency of the latter classifications on the initial SG division, the Non-Sequentially Optimized Classification (NOC) approach differs by simultaneously optimizing thresholds for SG, LC, and ST. NOC employs random number generation to minimize the overall standard deviation of Dbedrock residuals. To this end, we generated 100,000 sets of uniformly distributed random numbers within the range of 0 to 20 degrees for SG, and 0 to 0.6 for both LC and ST, subsequently identifying the optimized threshold set. This method allows for the determination of SG, LC, and ST thresholds that are not predicated on their ‘parent’ classification group, unlike the sequential dependencies in AC and SOC.
Figure 10 shows the terrain class maps generated using NOC in the Seoul region for each case. Comparing these to the terrain class maps generated by AC and SOC, the NOC maps show a better match with the actual alluvial plain distribution and mountainous region distribution. In particular, Case 2 (Figure 10b) shows the best match; the top-right area has the lowest class number, which corresponds to the mountainous region, and high class numbers (yellowish colors), indicating flat regions, correspond to Quaternary alluvium. Case 1 (Figure 10a) has a limited area of high class numbers in the flat region. Cases 3 and 7 have similar class distribution to Case 2, but their representation of mountainous regions and alluvial deposits is worse than Case 2. Cases 4 to 6 and 7 to 8 do not represent the geologic distribution well either.
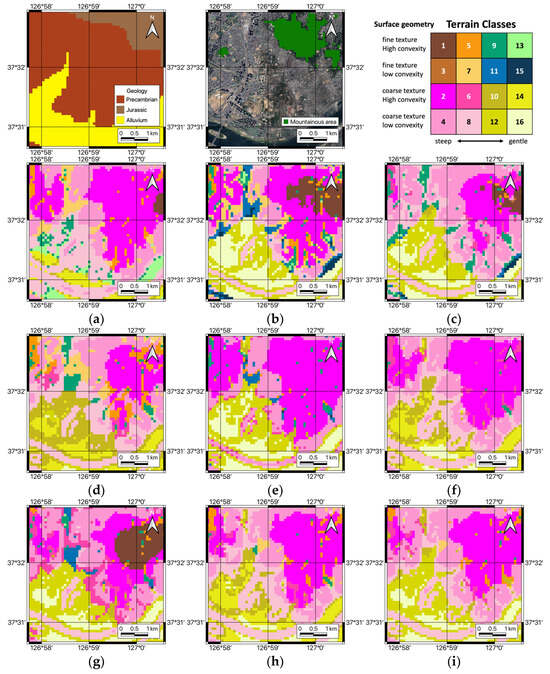
Figure 10.
Maps of terrain classes in the Seoul region classified using the Non-Sequentially Optimized Classification scheme for Dbedrock prediction in Case 1 to Case 9, which correspond to (a–i).
4. Results
4.1. Prediction of Bedrock Depth and Average VS of Soil Layers per Terrain Class
Upon classifying a region, we obtain the mean Dbedrock and VSsoil for each class, calculate the residuals, and assess prediction accuracy by estimating the standard deviation of residuals. SOC follows the classification scheme suggested by IP07 (i.e., AC): it classifies SG, LC, and ST in order. The difference between SOC and AC is that SOC does not use the class division thresholds as the mean of each topographic feature, but instead uses thresholds which minimize the standard deviations. On the other hand, NOC randomly selects class division thresholds for SG, LC, and ST, and finds the set which minimizes the standard deviations. The main difference between SOC and NOC is the independence of determining the division thresholds. In SOC, a selected division threshold is dependent on the division threshold selected in the previous phase. For example, the division threshold for LC is dependent on the division threshold for SG, and the division threshold for ST is dependent on the division threshold for LC. On the other hand, in NOC, the division thresholds for SG, LC, and ST are not dependent each other because all the thresholds are randomly selected.
To determine the most effective case and method among the nine cases and three methods, we analyzed the standard deviations in Dbedrock and VSsoil residuals, assigning equal weight to each class across all cases with AC, SOC, and NOC, as detailed in Table 3. As a result, Case 1 in the NOC scheme stands out across all methods, but this is due to the very limited number of data points within the classes (only two points for class 11 and six points for class 15) causing low standard deviations. We selected Case 2 (3 × 3 grid, 2 m threshold) from NOC method as the optimal case due to following reasons; 1) number of data points are at least greater than seven for all the classes, and 2) the distribution of terrain classes corresponds well to the alluvial plane (high number class) and mountainous regions (low number class).

Table 3.
Standard deviation () in natural log unit of Dbedrock and VSsoil for terrain classes classified using AC, SOC, and NOC schemes for all cases.
Table 4 presents the thresholds defined by AC, SOC, and NOC for Case 2. AC’s SG thresholds are significantly higher than those of the other methods. Given the predominantly mountainous terrain of the Korean Peninsula, this leads to excessively high SG thresholds in AC, failing to accurately represent the relatively flat terrains, and consequently resulting in a greater standard deviation for Dbedrock and VSsoil (refer to Table 3). On the other hand, the SG threshold in SOC’s second phase is too low, so the flatter area is occupied with low class numbers. The SG thresholds in NOC are well distributed. Thus, even though the SOC scheme provides a lower standard deviation for Dbedrock and VSsoil in general, we selected NOC to match the geological representation.

Table 4.
Thresholds classifying slope gradient (SG), local convexity (LC), and surface texture (ST) of terrain classes using the Automated (AC), Sequentially Optimized (SOC), and Non-Sequentially Optimized Classification (NOC) schemes for Case 2.
Figure 11 displays boxplots for Dbedrock and VSsoil and Table 5 lists the number of data points and the median and standard deviation of Dbedrock and VSsoil for each terrain class under NOC for Case 2. The medians for Dbedrock and VSsoil are calculated by first removing outliers, then computing the median for each group. This outlier elimination helps to exclude anomalous Dbedrock and VSsoil data that were potentially caused by coordinate errors in the raw dataset. The median Dbedrock increases with the higher number of terrain classes which correspond to the flat region. For VSsoil, the median values become slower for high number of classes, but the difference between the steep region (low number classes) and the flat region (high number classes) is not significant.
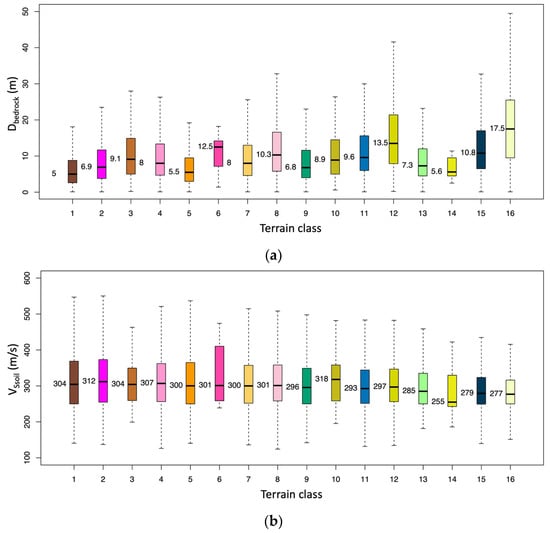
Figure 11.
Boxplots of (a) Dbedrock and (b) VSsoil for each terrain class using NOC with Case 2.

Table 5.
Median (xm) and standard deviation () of natural log unit of Dbedrock and VSsoil for terrain classes classified using NOC with Case 2.
4.2. Regression with DEM
While elevation is a key predictor for Dbedrock and VSsoil, the terrain classes do not inherently convey elevation values. The alluvial deposits become thicker (increase in Dbedrock) and the soil particle size becomes finer (decrease in VSsoil) along a decreasing elevation. To refine the prediction of Dbedrock and VSsoil considering the soil deposit environment, we employ a power model based on DEM elevation for each class. Figure 12 plots elevation against Dbedrock and VSsoil by class. In steep terrain (low number classes, 1 to 7), Dbedrock are not greatly influenced by elevation, whereas in flatter terrains (high number classes, 8–16), there is a discernible correlation between elevation and Dbedrock. For VSsoil, the elevation dependence is not as strong as Dbedrock, but there is slight increase in VSsoil with an increase in elevation. This suggests that incorporating elevation into a regression model could enhance the precision of Dbedrock and VSsoil predictions beyond terrain classification.
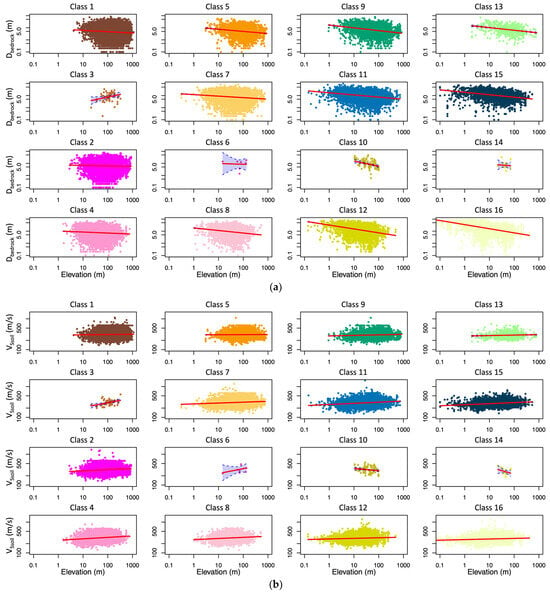
Figure 12.
(a) Dbedrock versus elevation and (b) VSsoil versus elevation for all classes. A fit model at each class is shown as red line.
To account for elevation dependency, the following power models for Dbedrock and VSsoil are applied:
where [c0, c1] and [d0, d1] are regression coefficients for each class, and elev represents the elevation in meters. Note that the resultant Dbedrock is in meters and VSsoil is in meters/second. Table 6 provides the regression coefficients and their significance level (i.e., p-value) as well as their standard deviations for each class. For Dbedrock, classes of [3,6,14] do not markedly improve prediction accuracy with model adjustments (p-value > 0.1%) due to limited number of data points and flat model prediction. In addition, class 10 has the most limited range of available elevations even though the p-value is less than 0.1%. Note that we used a p-value of 0.1% as the significance level. For VSsoil, classes [5,6,10,13,14] have highest p-values, and class 3 also has the most limited range of elevation. For these classes (i.e., 3, 6, 10, 14 for Dbedrock and 3, 5, 6, 10, 13, 14 for VSsoil), use of the median is recommended rather than using fitted models. Utilizing elevation models for each class reduces the total standard deviation from [0.865, 0.233], which solely uses median estimation, to [0.844, 0.231] for Dbedrock and VSsoil, respectively. Note that we limited the elevation range to [0.1, 1000 m] when applying it to models as not to have excessive Dbedrock and VSsoil.

Table 6.
Regression coefficients for Dbedrock and VSsoil prediction and standard deviation of residuals at each terrain class.
Figure 13 presents maps of Dbedrock and VSsoil across the Korean Peninsula using models as recommended in Table 6. The most regions have a Dbedrock of <20 m and a VSsoil of >300 m/s, but some alluvium regions (e.g., Busan, Pohang, or Goheung) have deep Dbedrock (20 to 75 m) and soft VSsoil (250 to 280 m/s).
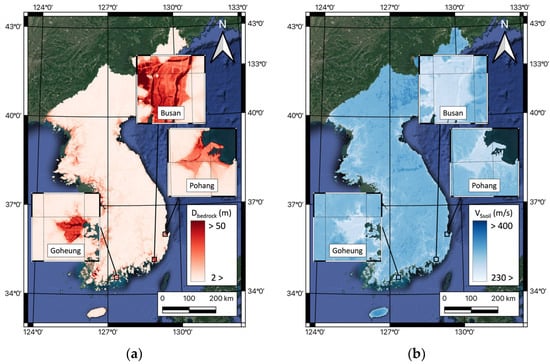
Figure 13.
Maps of (a) Dbedrock (red color gradient) and (b) VSsoil (blue color gradient) for the Korean Peninsula.
5. Discussion
5.1. Dbedrock and VSsoil Prediction Performance
This study suggests two ways of predicting Dbedrock and VSsoil: (1) using the median values of Dbedrock and VSsoil at each class, and (2) using the elevation model (Equations (10) and (11)), for which the coefficients are listed in Table 6. As noted above, for classes [3,6,10,14] for Dbedrock and [3,5,6,10,13,14] for VSsoil, median values were used instead of the elevation model. We evaluated the prediction performance of these two methods by comparing the standard deviation of the residuals using the natural log unit (σln) for Dbedrock and VSsoil. Figure 14 shows the σln at each class and the total data points. In the case of Dbedrock, the reduction in σln is high for high class numbers (9–16), where the maximum reduction was seen in class 16 (13.3% reduction). In the case of VSsoil, the reduction in σln is not significant; the maximum reduction was 2.3% for class 15. Again, we found that the elevation has more of an impact on the prediction of soil thicknesses in flatter regions, but the VS of a soil deposit is not related to elevation.
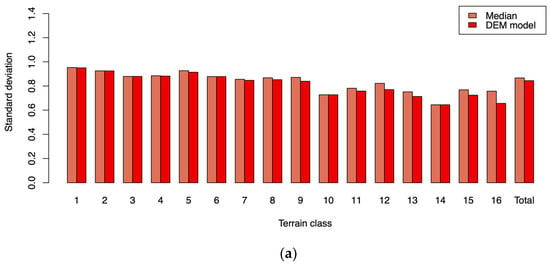
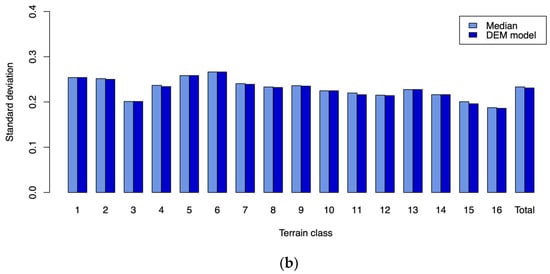
Figure 14.
Comparison between standard deviations of residuals for each class using median predictions and elevation models for (a) Dbedrock and (b) VSsoil.
5.2. Comparison with Other Thresholds
Previous studies revealed that terrain classification is related to geological formations [6,16]. Comparing terrain class maps for nine cases from three methods with geological and mountainous maps of the Seoul region (Figure 8, Figure 9 and Figure 10), we decided that Case 2 of the NOC method is the best-matched case. To further validate the applicability of the terrain class map developed in this study, we compared the terrain class maps for Case 2 with the 1:50,000 scale geological and mountainous maps of different regions (Busan, Pohang, and Goheung) in South Korea, as shown in Figure 15. The comparison revealed a good correspondence between terrain classes and geologic divisions for the NOC method. For instance, classes with low class numbers showed a significant overlap with mountainous terrains.
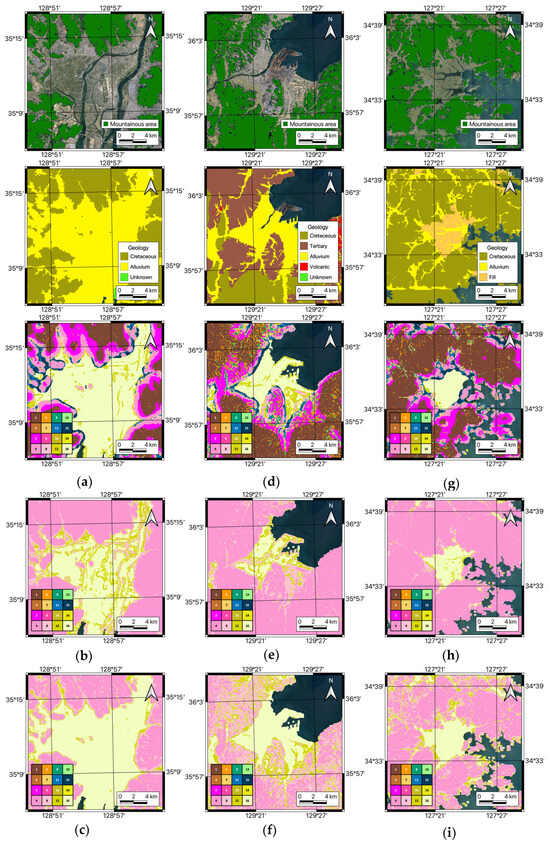
Figure 15.
Maps of mountainous and surface geology, and the classification of terrain class maps for the Busan (a–c), Pohang (d–f), and Goheung (g–i) regions based on this study (a,d,g), the world (b,e,h), and Japan (c,f,i).
In addition, the thresholds determined in this study were specifically optimized for predicting Dbedrock and VSsoil. However, it is crucial to examine how these thresholds are juxtaposed with those from other studies, which may have been developed for different regions or under varying geological conditions. To establish the robustness of our optimized thresholds, we compared the terrain classes generated using our methodology with classes defined by thresholds from other research efforts. Table 7 compares the thresholds for SG, LC, and ST chosen in this study with thresholds created for the world and Japan [14]. The world contains all terrain regions on the Earth so the median SG is low, while for Japan, the median SG is high because Japan consists of volcanic islands. The SG thresholds in this study are in between the world and Japan cases, and the LC and ST thresholds are lower than other cases. Figure 15 shows terrain class distributions defined using the world and Japanese cases for the Busan and Pohang regions. The world case predicts a narrower range of alluvium for class number 16 and cannot distinguish the mountainous regions well. The Japanese case, which has high SG thresholds, assigned class number 16 to too large an extent, and the resolution of classification is low for mountainous regions. This suggests that a region-specific calibration of the thresholds is imperative for achieving meaningful terrain classification.

Table 7.
Thresholds classifying slope gradient (SG), local convexity (LC), and surface texture (ST) to terrain classes by this study (NOC, Case 2) and other studies.
6. Conclusions
This study presented a comprehensive approach for classifying terrain in South Korea using DEMs, focusing on estimating Dbedrock and VSsoil. By applying three distinct classification methods—Automated Classification (AC), Sequentially Optimized Classification (SOC), and Non-Sequentially Optimized Classification (NOC)—to DEM-derived topographic features (slope gradient, local convexity, and surface texture), we effectively correlated terrain classes with subsurface geotechnical properties and geologic formation. Our analysis revealed that the NOC method, particularly for Case 2 (3 × 3 window size, 2 m threshold), provided the most accurate terrain classification when being correlated with geological and mountainous maps in addition to minimizing the standard deviation of errors in Dbedrock and VSsoil. The main findings of this study are listed below.
- (1)
- The results of this study indicate the capability of the NOC method to not only predict subsurface conditions but also reflect the geologic formation of the landscape. The Dbedrock and VSsoil are the result of geologic formations, so the terrain classes derived from our study can be applied to geological interpretations.
- (2)
- The incorporation of a regression model based on DEM elevation significantly enhanced the prediction accuracy for Dbedrock, and showed a moderate enhancement in predicting VSsoil.
- (3)
- This study highlights the importance of considering regional specificity when setting thresholds for terrain classification, as evidenced by the varying effectiveness of world and Japan cases applied to South Korean regions.
Our classification scheme and Dbedrock and VSsoil prediction models have the potential to serve as a preliminary guide for geologic explorations and land-use planning as well as site assessments, particularly in areas where detailed geologic maps and ground investigations are unavailable.
Although the suggested method can be applied to any region, the limitation of the suggested terrain class divisions is that they are dependent on the classification method, smoothing, and the thresholds. Thus, the use of other DEMs (e.g., high resolution DEM) or the application of our methods to other regions require further sensitivity analyses. In addition, the values of Dbedrock and VSsoil are from a limited number of sites, so the suggested results can not represent the values for entire region. Therefore, a further sensitivity study is required if a different DEM is used or the method is applied to other regions, and a validation process is essential for data points that are not used in the model development.
Future work could extend the scope of this methodology by incorporating a broader array of geospatial data to refine terrain classification and enhance the prediction of subsurface properties. While the current study utilized SG, LC, and ST for terrain classification and elevation data for Dbedrock and VSsoil refinement, integrating additional topographic attributes such as relative elevation and curvature could potentially yield more precise results. Moreover, the employment of machine learning techniques with an increased number of topographic attributes targeting geologic, geomorphic, and subsurface conditions is a promising avenue for the classification of regions.
Author Contributions
Conceptualization, I.C. and D.K.; methodology, I.C. and D.K.; software, I.C.; validation, I.C.; formal analysis, I.C.; investigation, D.K.; resources, I.C.; data curation, I.C.; writing—original draft preparation, I.C. and D.K.; writing—review and editing, I.C. and D.K.; visualization, I.C.; supervision, D.K.; funding acquisition, D.K. All authors have read and agreed to the published version of the manuscript.
Funding
This work was supported by the Ministry of Land, Infrastructure and Transport with the grant number RS-2022-00143584 and the Basic Research Program through the National Research Foundation of Korea funded by the Ministry of Science and ICT with the grant number RS-2023-00220751.
Data Availability Statement
The data presented in this study are available in following resources: boring log data at GeoInfo (https://www.geoinfo.or.kr accessed on 15 August 2023), DEM and cadastral map at NSDI portal (http://www.nsdi.go.kr accessed on 15 August 2023), and geological map at Geo Big Data Open Platform (https://data.kigam.re.kr accessed on 15 August 2023).
Acknowledgments
We are grateful to NSDI for providing the DEM and cadastral maps, MOLIT for operating and maintaining GeoInfo geotechnical database, and KIGAM for providing geological map.
Conflicts of Interest
The authors declare no conflicts of interest. The funders had no role in the design of the study; in the collection, analyses, or interpretation of data; in the writing of the manuscript; or in the decision to publish the results.
References
- MOLIT. General Seismic Design. KDS 17 10 00; Ministry of Land, Infrastructure and Transport: Sejong, Republic of Korea, 2018.
- Wald, D.J.; Allen, T.I. Topographic slope as a proxy for seismic site conditions and amplification. Bull. Seismol. Soc. Am. 2009, 97, 1379–1395. [Google Scholar] [CrossRef]
- Allen, T.I.; Wald, D.J. On the use of high-resolution topographic data as a proxy for seismic site conditions (VS30). Bull. Seismol. Soc. Am. 2009, 99, 935–943. [Google Scholar] [CrossRef]
- Yang, F.; Shangguan, W.; Zhang, J.; Hu, B. Depth-to-bedrock map of China at a spatial resolution of 100 meters. Sci. Data 2020, 7, 2. [Google Scholar]
- Choi, I.; Yoo, B.; Kwak, D. Development of Korean Peninsula VS30 map based on proxy using linear regression analysis. KSCE J. Civ. Environ. Eng. 2022, 42, 35–44. (In Korean) [Google Scholar]
- Yang, H.Q.; Chu, J.; Qi, X.; Wu, S.; Chiam, K. Bayesian evidential learning of soil-rock interface identification using boreholes. Comput. Geotech. 2023, 162, 105638. [Google Scholar] [CrossRef]
- Wang, Z.Z.; Hu, Y.; Guo, X.; He, X.; Kek, H.Y.; Ku, T.; Goh, S.H.; Leung, C.F. Predicting geological interfaces using stacking ensemble learning with multi-scale features. Can. Geotech. J. 2023, 60, 1036–1054. [Google Scholar] [CrossRef]
- Yang, L.; Meng, X.; Zhang, X. SRTM DEM and its application advances. Remote Sens. 2011, 32, 3875–3896. [Google Scholar] [CrossRef]
- Toutin, T. Three-dimensional topographic mapping with ASTER stereo data in rugged topography. IEEE Trans. Geosci. Remote Sens. 2002, 40, 2241–2247. [Google Scholar] [CrossRef]
- Farr, T.G.; Rosen, P.A.; Caro, E.; Crippen, R.; Duren, R.; Hensley, S.; Kobrick, M.; Paller, M.; Rodriguez, E.; Roth, L.; et al. The Shuttle Radar Topography Mission. Rev. Geophys. 2007, 45, 2005RG000183. [Google Scholar] [CrossRef]
- Hofton, M.A.; Minster, J.B.; Blair, J.B. Decomposition of laser altimeter waveforms. IEEE Trans. Geosci. Remote Sens. 2000, 38, 1989–1996. [Google Scholar] [CrossRef]
- National Geographic Information Institute (NGII). Available online: http://www.ngii.go.kr (accessed on 18 July 2023).
- National Spatial Data Infrastructure Portal (NSDI). Available online: http://www.nsdi.go.kr (accessed on 15 August 2023).
- Iwahashi, J.; Pike, R.J. Automated classifications of topography from DEMs by an unsupervised nested-means algorithm and a three-part geometric signature. Geomorphology 2007, 86, 409–440. [Google Scholar] [CrossRef]
- Vilanova, S.P.; Narciso, J.; Carvalho, J.P.; Lopes, I.; Quinta0Ferreira, M.; Pinto, C.C.; Borges, J.; Nemser, E.S. Developing a Geologically-Based VS30 Site-Conditions Model for Portugal: Methodology and Assessment of the Performance of Proxies. Bull. Seismol. Soc. Am. 2018, 108, 322–337. [Google Scholar] [CrossRef]
- Karimzadeh, S.; Feizizadeh, B.; Matsuoka, M. DEM-based Vs30 map and terrain surface classification in nationwide scale—A case study in Iran. ISPRS Int. J. Geo-Inf. 2019, 8, 537. [Google Scholar] [CrossRef]
- Irsyam, M.; Asrurifak, M.; Mikhail, R.; Wahdiny, I.I.; Rustiani, S. Development of Nationwide Vs30 Map and Calibrated Conversion Table for Indonesia using Automated Topographical Classification. J. Eng. Technol. Sci. 2017, 49, 457–471. [Google Scholar] [CrossRef]
- Kim, H.S.; Sun, C.G.; Lee, M.G.; Cho, H.I. Terrain Proxy-Based Site Classification for Seismic Zonation in North Korea within a Geospatial Data-Driven Workflow. Remote Sens. 2021, 13, 1844. [Google Scholar] [CrossRef]
- Yong, A.; Hough, S.E.; Iwahashi, J.; Braverman, A. A terrain-based site-conditions map of California with implications for the contiguous United States. Bull. Seismol. Soc. Am. 2012, 102, 114–128. [Google Scholar] [CrossRef]
- Furze, S.; O’Sullivan, A.M.; Allard, S.; Pronk, T.; Curry, R.A. A high-resolution, random forest approach to mapping depth-to-bedrock across shallow overburden and post-glacial terrain. Remote Sens. 2021, 13, 4210. [Google Scholar] [CrossRef]
- Ministry of Land, Infrastructure and Transport (MOLIT). Available online: https://www.geoinfo.or.kr (accessed on 15 August 2023). (In Korean)
- Heo, G.S.; Kwak, D.Y. VS prediction model using SPT-N values and soil layers in South Korea. J. Korean Geotech. Soc. 2022, 53–66. (In Korean) [Google Scholar]
- Horn, B.K. Hill shading and the reflectance map. Proc. IEEE 1981, 61, 14–47. [Google Scholar] [CrossRef]
- Iwahashi, J.; Yamazaki, D.; Nakano, T.; Endo, R. Classification of topography for ground vulnerability assessment of alluvial plains and mountains of Japan using 30 m DEM. Prog. Earth Planet. Sci. 2021, 8, 3. [Google Scholar] [CrossRef]
- Korean Institute of Geoscience and Mineral Resources (KIGAM). Available online: https://data.kigam.re.kr (accessed on 1 February 2023). (In Korean).
Disclaimer/Publisher’s Note: The statements, opinions and data contained in all publications are solely those of the individual author(s) and contributor(s) and not of MDPI and/or the editor(s). MDPI and/or the editor(s) disclaim responsibility for any injury to people or property resulting from any ideas, methods, instructions or products referred to in the content. |
© 2024 by the authors. Licensee MDPI, Basel, Switzerland. This article is an open access article distributed under the terms and conditions of the Creative Commons Attribution (CC BY) license (https://creativecommons.org/licenses/by/4.0/).
