Article

Desertification Mitigation in Northern China Was Promoted by Climate Drivers after 2000

1
Key Laboratory of Climate Resource Development and Disaster Prevention of Gansu Province, Research and Development Center of Earth System Model, School of Atmospheric Sciences, Lanzhou University, Lanzhou 730000, China
2
Ningxia Key Laboratory for Meteorological Disaster Prevention and Reduction, Yinchuan 750002, China
3
Northwest Institute of Eco-Environment and Resources, Chinese Academy of Sciences, Lanzhou 730000, China
*
Author to whom correspondence should be addressed.
These authors contributed equally to this work.
Remote Sens. 2024, 16(19), 3706; https://doi.org/10.3390/rs16193706
Submission received: 11 July 2024 / Revised: 1 October 2024 / Accepted: 2 October 2024 / Published: 5 October 2024

Abstract

:
Desertification greatly threatens the ecological environment and sustainable development over approximately 30% of global land. In this study, the contributions of climate drivers and human activity in shaping the desertification process from 1984 to 2014 were quantified in the desertification-prone region (DPR) in Northern China (NC) by employing net primary productivity (NPP) as a proxy. The results reveal that 72.74% of the DPR experienced desertification mitigation and 27.26% experienced exacerbation. Climate drivers acted as primary drivers, contributing to both the mitigation (47.2%) and exacerbation (48.5%) of desertification, while human activity also played a crucial role, with contributions of 39.6% to mitigation and 41.0% to exacerbation of desertification. Furthermore, a shift in desertification dynamics emerged around 2000, with climate drivers promoting the mitigation process (66.8%), and precipitation was a dominant climatic factor for the mitigation of desertification after 2000, which was related to internal atmospheric variability. This study highlights changes in the contributions of different factors to desertification, underscoring the need for policy adjustment to attain sustainable land management in NC.

Graphical Abstract

1. Introduction

Desertification is a land degradation phenomenon, where the biological potential of land is reduced or destroyed [1,2]. Land degradation covers approximately 30% of global land, with around 3 billion people residing in affected areas [3]. Desertification not only leads to the loss of biodiversity in ecosystems but also significantly affects the food security, health, and economic incomes of local residents, thereby impacting sustainable development in contemporary society. The impacts of desertification on human survival and social progress are increasing in light of climate change [4]. Therefore, determining how to mitigate desertification is a major challenge in sustainable development [5,6,7,8], for which understanding the causes of desertification is fundamental.
Desertification refers to land degradation caused by climate change and human activity [9,10,11]. Climate change dominates desertification through drought and changes in carbon dioxide levels, gradually causing sustained changes in ecosystems [12,13,14,15]. Human activity, such as excessive cultivation, increased grazing, deforestation, and other practices, reaches a turning point in ecosystem functionality, ultimately causing desertification (e.g., [16,17,18]). In past decades, the physical mechanism of desertification development, the related ecohydrological process, and its relationship with human activity were clarified effectively [7,9,11,13,19,20,21,22]. However, due to the different proxies used to measure desertification and different periods focused, the contributions of different factors to desertification in the past remain uncertain [23,24,25]. For example, results based on an ensemble of ecosystem models suggested that the effect of CO2 fertilization is the main cause of desertification mitigation [26]. However, an observation-based attribution study indicated that anthropogenic climate change has driven more than five million square kilometers of drylands towards desertification around the world [16]. In semi-arid alpine mountains, low elevation areas have a high risk of desertification expansion due to grazing [27]. Furthermore, based on observations of high-resolution satellite data and a global probability-based sample, it was determined that 60% of the change in global land cover could be attributed to anthropogenic land-use practices, while the residual 40% stemmed from a confluence of other factors, including climate drivers [28]. Thus, quantifying the contribution of human activity and climate drivers still needs further investigation.
China is severely impacted by desertification [29,30]. The total area of land undergoing desertification in China has escalated to 2.62 million km2, accounting for 27.33% of the country’s aggregate landmass. The majority of the desertification is concentrated in Northern China (NC) [31]. Desertification in NC has changed over the past several decades, with mitigation and exacerbation not occurring uniformly [32]. As an important factor contributing to desertification, the climate in NC has experienced interdecadal variability. The desertification region is sensitive and vulnerable to climate change. Over the arid region of NC, except for human agricultural activities and ecological water conveyance, precipitation is the main factor driving the spatial distribution of desertification [33]. Rapid global warming has led to increases in the frequency and intensity of extreme precipitation and droughts, further increasing the risk of desertification [34,35]. Climate driver (such as precipitation, temperature) variations are linked to the changes in atmospheric circulation. Studies have demonstrated that Northeast China experienced a noticeable increase in temperature starting in the mid-1990s, accompanied by interdecadal changes in large-scale circulation marked by a high-pressure anomaly [36,37,38]. Along with the temperature rising, observations revealed a significant interdecadal transition in Northwest China’s summer precipitation after the late 1980s, with increases in the amount and intensity of precipitation [39,40]. Studies also indicated that desertification increased in NC prior to the 1990s and subsequently underwent a reversal [41,42]. However, how atmospheric circulation is linked to the impacts of climate drivers on desertification remains unclear. Additionally, various ecological restoration projects were implemented, including the Three-North Shelter Forest Program and Grain-for-Green. These major ecological projects were also implemented in different regions and at different times [43,44]. Therefore, the impacts of climate drivers and human activity on desertification may have varied during different periods. However, under the background of climate change, the contributions of climate drivers and human activity to desertification in NC in different periods should be further explored.
This study focused on two aspects: What were the contributions of climate drivers and human activity to the desertification process in NC over the past decades? What were the dominant factors that drove desertification during different periods and the mechanism behind desertification? To answer these questions, this study utilized remote sensing data and meteorological datasets to analyze desertification. The methodology involved a quantitative analysis using statistical models and remote sensing techniques to assess contributions to desertification changes. Then, this study identified the primary drivers of desertification evolution, separating natural and anthropogenic factors, which was aimed at deepening our understanding of the mechanism of desertification evolution. This paper concludes with a discussion of the mechanisms underlying these drivers based on the attribution results.

2. Dataset and Methodology

2.1. Study Area

This study focused on the desertification-prone region (DPR) in NC (Figure 1), which was zoned according to a study by Wang et al. [35]. The DPR extends from central Asia in the west to northeastern China in the east and primarily comprises sandy areas, with annual rainfall amounts below 400 mm. Based on vegetation coverage, these areas can be further classified as mobile, semi-mobile, semi-anchored, and anchored sandy lands. These areas are highly susceptible to climate change and human activities if the productivity of sandy land decreases, resulting in aeolian desertification and a fragile ecology [45]. However, almost all sandy areas have been used to meet subsistence needs [29], which further increases the risk of desertification in these areas. More information about DPR can be found in the Supplementary Materials (Note S1).

2.2. Data Sources

Net primary productivity (NPP) is the net amount of organic carbon sequestered via photosynthesis and serves as a sensitive indicator reflecting the impacts of climate change and human activities [46]. Considering a decrease in plant biomass as a partial indication of land degradation, changes in NPP were considered a proxy for desertification in this study, as NPP has been widely used to assess desertification (e.g., [47,48,49,50]). In this study, NPP was calculated using the Carnegie–Ames–Stanford Approach (CASA) model, which relies on remote sensing (the normalized difference vegetation index (NDVI) and land cover data) and meteorological datasets. Specific information related to the data can be found in Table 1.
The NDVI data were derived from NOAA AVHRR satellite data, with outputs generated twice a month. The AVHRR NDVI has undergone intercalibration and corrections for atmospheric effects, cloud cover, and biases from the drift of satellite orbital [55]. It is regarded as the most reliable dataset for long-term NDVI trend analysis [56] and effectively represents vegetation conditions in China [57]. Monthly NDVI data were generated by applying a maximum-value compositing procedure to merge the 15-day data. The land-use data were obtained from a 1:10-scale multi-period thematic land-use database with manual visual interpretation, using Landsat remote sensing imagery data from the United States Landsat satellite as the main source of information. The solar radiation data were the result of fusing meteorological station datasets and the ISCCP-HXG cloud product through geo-weighted regression, and they had higher accuracy in long-term trend modeling than the ISCCP-HXG, GEWEX-SRB, and CMSAF-CLARA-A2 satellite radiation products [52]. The GPCC precipitation was based on quality-controlled data from 67,200 stations around the world with records lasting 10 years or more. The evapotranspiration data from the GLEAM maximized the recovery of evaporation information contained in current satellite observations of climate and environmental variables. ERA5 is currently commonly used for meteorological reanalysis. The GLASS NPP is based on the GLASS GPP algorithm, which is uniquely suited to reproducing inter-annual variability [58], and it is also mostly applied to the validation of NPP calculated by other models (i.e., CASA model) [59,60]. To ensure temporal consistency and spatial comparability, the study period was set from 1984 to 2014, and all above data were interpolated onto a 0.25° × 0.25° grid by bilinear interpolation. The Pacific Decadal Oscillation (PDO) was defined by the empirical orthogonal function leading pattern of sea surface temperature anomalies in the North Pacific basin (typically, polewards from 20°N), and the Atlantic Multi-Decadal Oscillation (AMO) was identified based on the average anomalies of sea surface temperatures in the North Atlantic basin, typically over 0–80°N. As important factors affecting global climate change, the PDO and AMO have greatly impacted climate change in NC [61]. Population data were derived from raw global census data, then harmonized and disaggregated into grid cells based on the distribution, classification, and build-up of each corresponding decade as mapped in the GHSLs [53]. Cropland data were derived from a high-resolution dataset based on satellite data, machine learning, and other frameworks that was more accurate and stable than other datasets [54].

2.3. Methods

In this study, we studied desertification using trends in three NPP factors that were representative of the roles of different factors. A flowchart of the methodological approach is shown in Figure S1. The CASA model was employed to calculate the actual NPP (ANPP). The CASA model is an ecological model that utilizes satellite, meteorological, and surface data to estimate light-use efficiency [62,63]. This model has been extensively employed in China [64,65,66]. ANPP represents NPP from climatic factors and human activities and is essentially equivalent to the NPP from the GLASS based on Taylor scores [67], Pearson’s correlation coefficient, linear fitting, etc. (Figure S3).
In the CASA model, ANPP is calculated by converting the absorbed photosynthetically active radiation (APAR, g C MJ−1) into plant biomass:
A N P P x , t = A P A R x , t × ε x , t
where ε x , t denotes light-use efficiency, the spatial location is denoted by x, and t denotes time. More detailed calculations of APAR and ε and the parameter settings can be found in the Supplementary Materials (Method S1).
This study calculated a potential NPP (PNPP) that was generated only from climate drivers using the modified Thornthwaite memorial model [68,69]. The calculation of PNPP was expressed as follows:
P N P P x , t = 3000 × 1 e 0.0009695 V x , t 20
where V x , t stands for the average annual actual evapotranspiration (mm). A detailed calculation of PNPP is presented in the Supplementary Materials (Method S2).
The human-induced loss of NPP (HNPP), which reflects the impacts of human activities on vegetation productivity, is defined as the difference between PNPP and ANPP:
H N P P = P N P P A N P P
A flowchart of the implementation details of the CASA and modified Thornthwaite models used to calculate ANPP, PNPP, and HNPP can be seen in the Supplementary Materials (Figure S2).
The impacts of climate drivers and human activity on NPP can be attributed according to the linear trends (S) of NPP, i.e., ANPP (SANPP), PNPP (SPNPP), and HNPP (SHNPP), which are calculated as follows:
S = ( i = 1 n i × N P P i ) i = 1 n i × 1 n i = 1 n N P P i i = 1 n i 2 n 1 n i = 1 n N P P i 2
where i represents the sequential numbering of years, commencing with 1 for the year 1984, 2 for the year 1985, and so on (i = 1, 2, … 31), aligning with the study period. N P P i symbolizes the NPP value for the ith year.
Generally, a positive trend in ANPP (SANPP > 0) means that desertification mitigation occurred, while a negative SANPP (SANPP < 0) indicates that vegetation degradation and desertification exacerbation occurred. A positive SPNPP (SPNPP > 0) indicates that climate drivers benefited vegetation growth and contributed to desertification mitigation, whereas a negative SHNPP (SHNPP < 0) means a decrease in human-induced vegetation deterioration; in other words, human activity contributed to desertification mitigation and vice versa. Detailed criteria for assessing desertification mitigation or exacerbation and the contributions of climate drivers and human activity are outlined in Table 2.

2.4. Empirical Orthogonal Function (EOF) Decomposition

To explore the dominant modes of NPP change, empirical orthogonal function (EOF) decomposition was also performed for the NPP data. EOF analysis is a statistical technique used to understand spatiotemporal patterns in data [70]. Through EOF analysis, most of the changes in the variable field could be represented by a small number of modes, the dependence of each mode was tested according to the criterion suggested by North et al. [71], and the first mode was selected for analysis in this study.

3. Results

3.1. Attributions of Historical Desertification in NC during the Period from 1984 to 2014

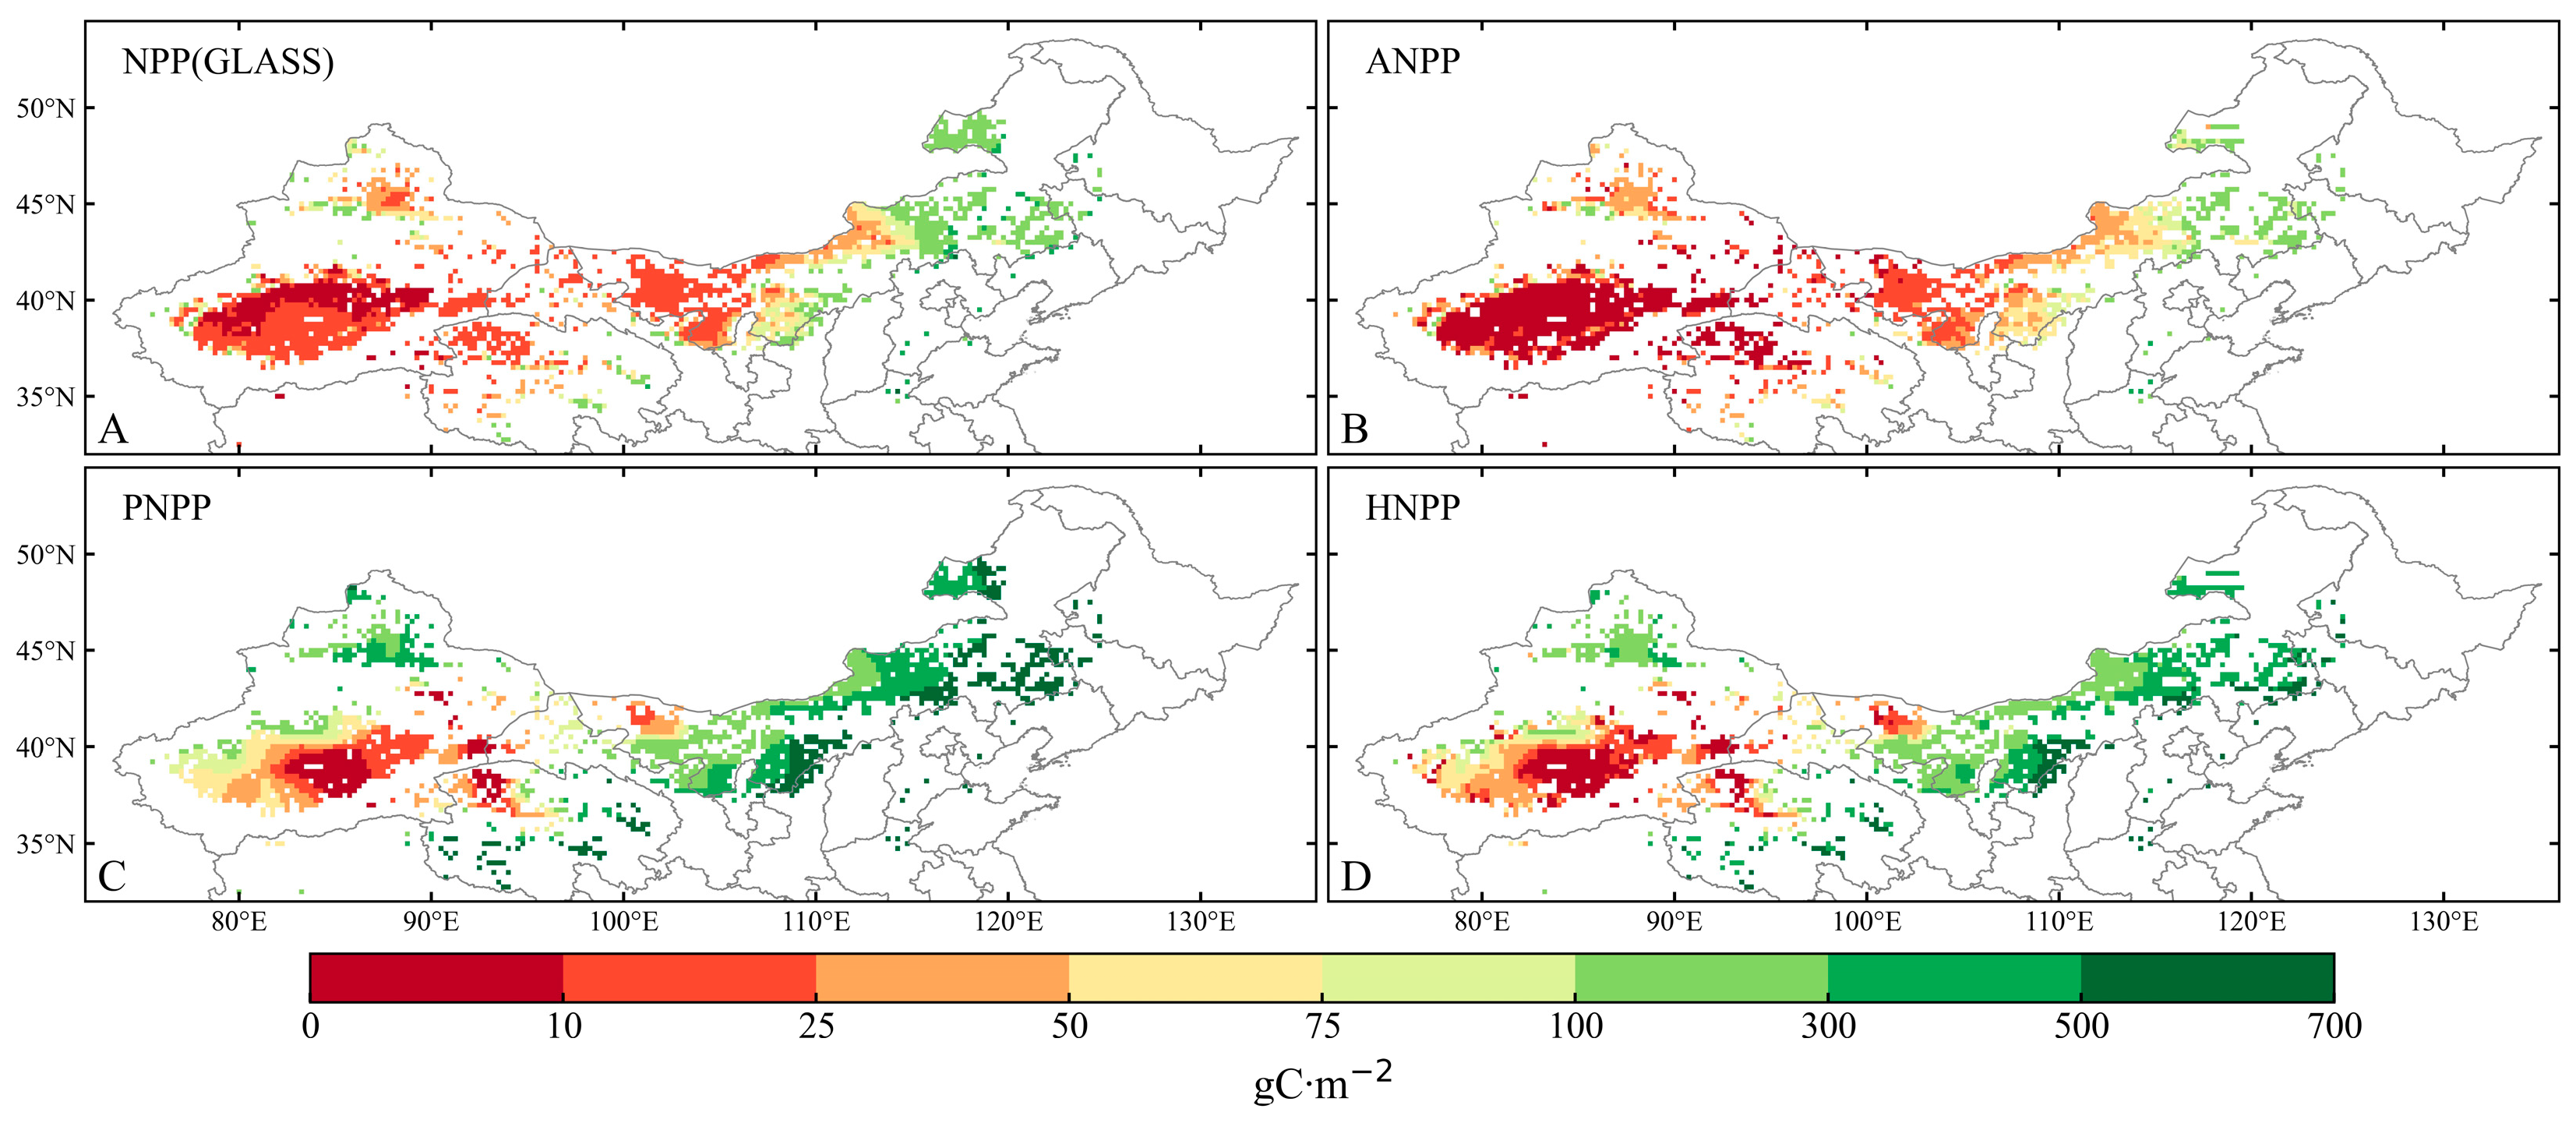
Validation of the CASA model’s feasibility in calculating NPP was first carried out by comparing it with GLASS data, which showed that the CASA model can effectively re-produce the variations in NPP across space and time in the DPR of NC (Figure S3). The spatial distribution of NPP in the DPR of NC is displayed in Figure 2. The annual mean NPP from the GLASS could reach 39.41 g C m−2, and it increased from the southwest to the northeast (Figure 2A). The ANPP calculated using the CASA model exhibited a similar spatial pattern (Figure 2B). The average PNPP could reach 242.89 g C m−2 yr−1, with its distribution also decreasing from the northeast to the southwest (Figure 2C). In the regions of Juggar and Ala Shan, the annual mean PNPP surpassed the ANPP by wide margins, reaching 264.38 g C m−2 and 258.9 g C m−2, indicating that vegetation recovery in these areas had not yet reached the ecosystem’s carrying capacity. Conversely, the PNPP was relatively low in Tarim and Qinghai, measuring less than 75 g C m−2 yr−1. In addition, the annual mean HNPP was larger than 100 g C m−2 in central and eastern Inner Mongolia and Juggar, which implies that human activities greatly influenced desertification in these regions.
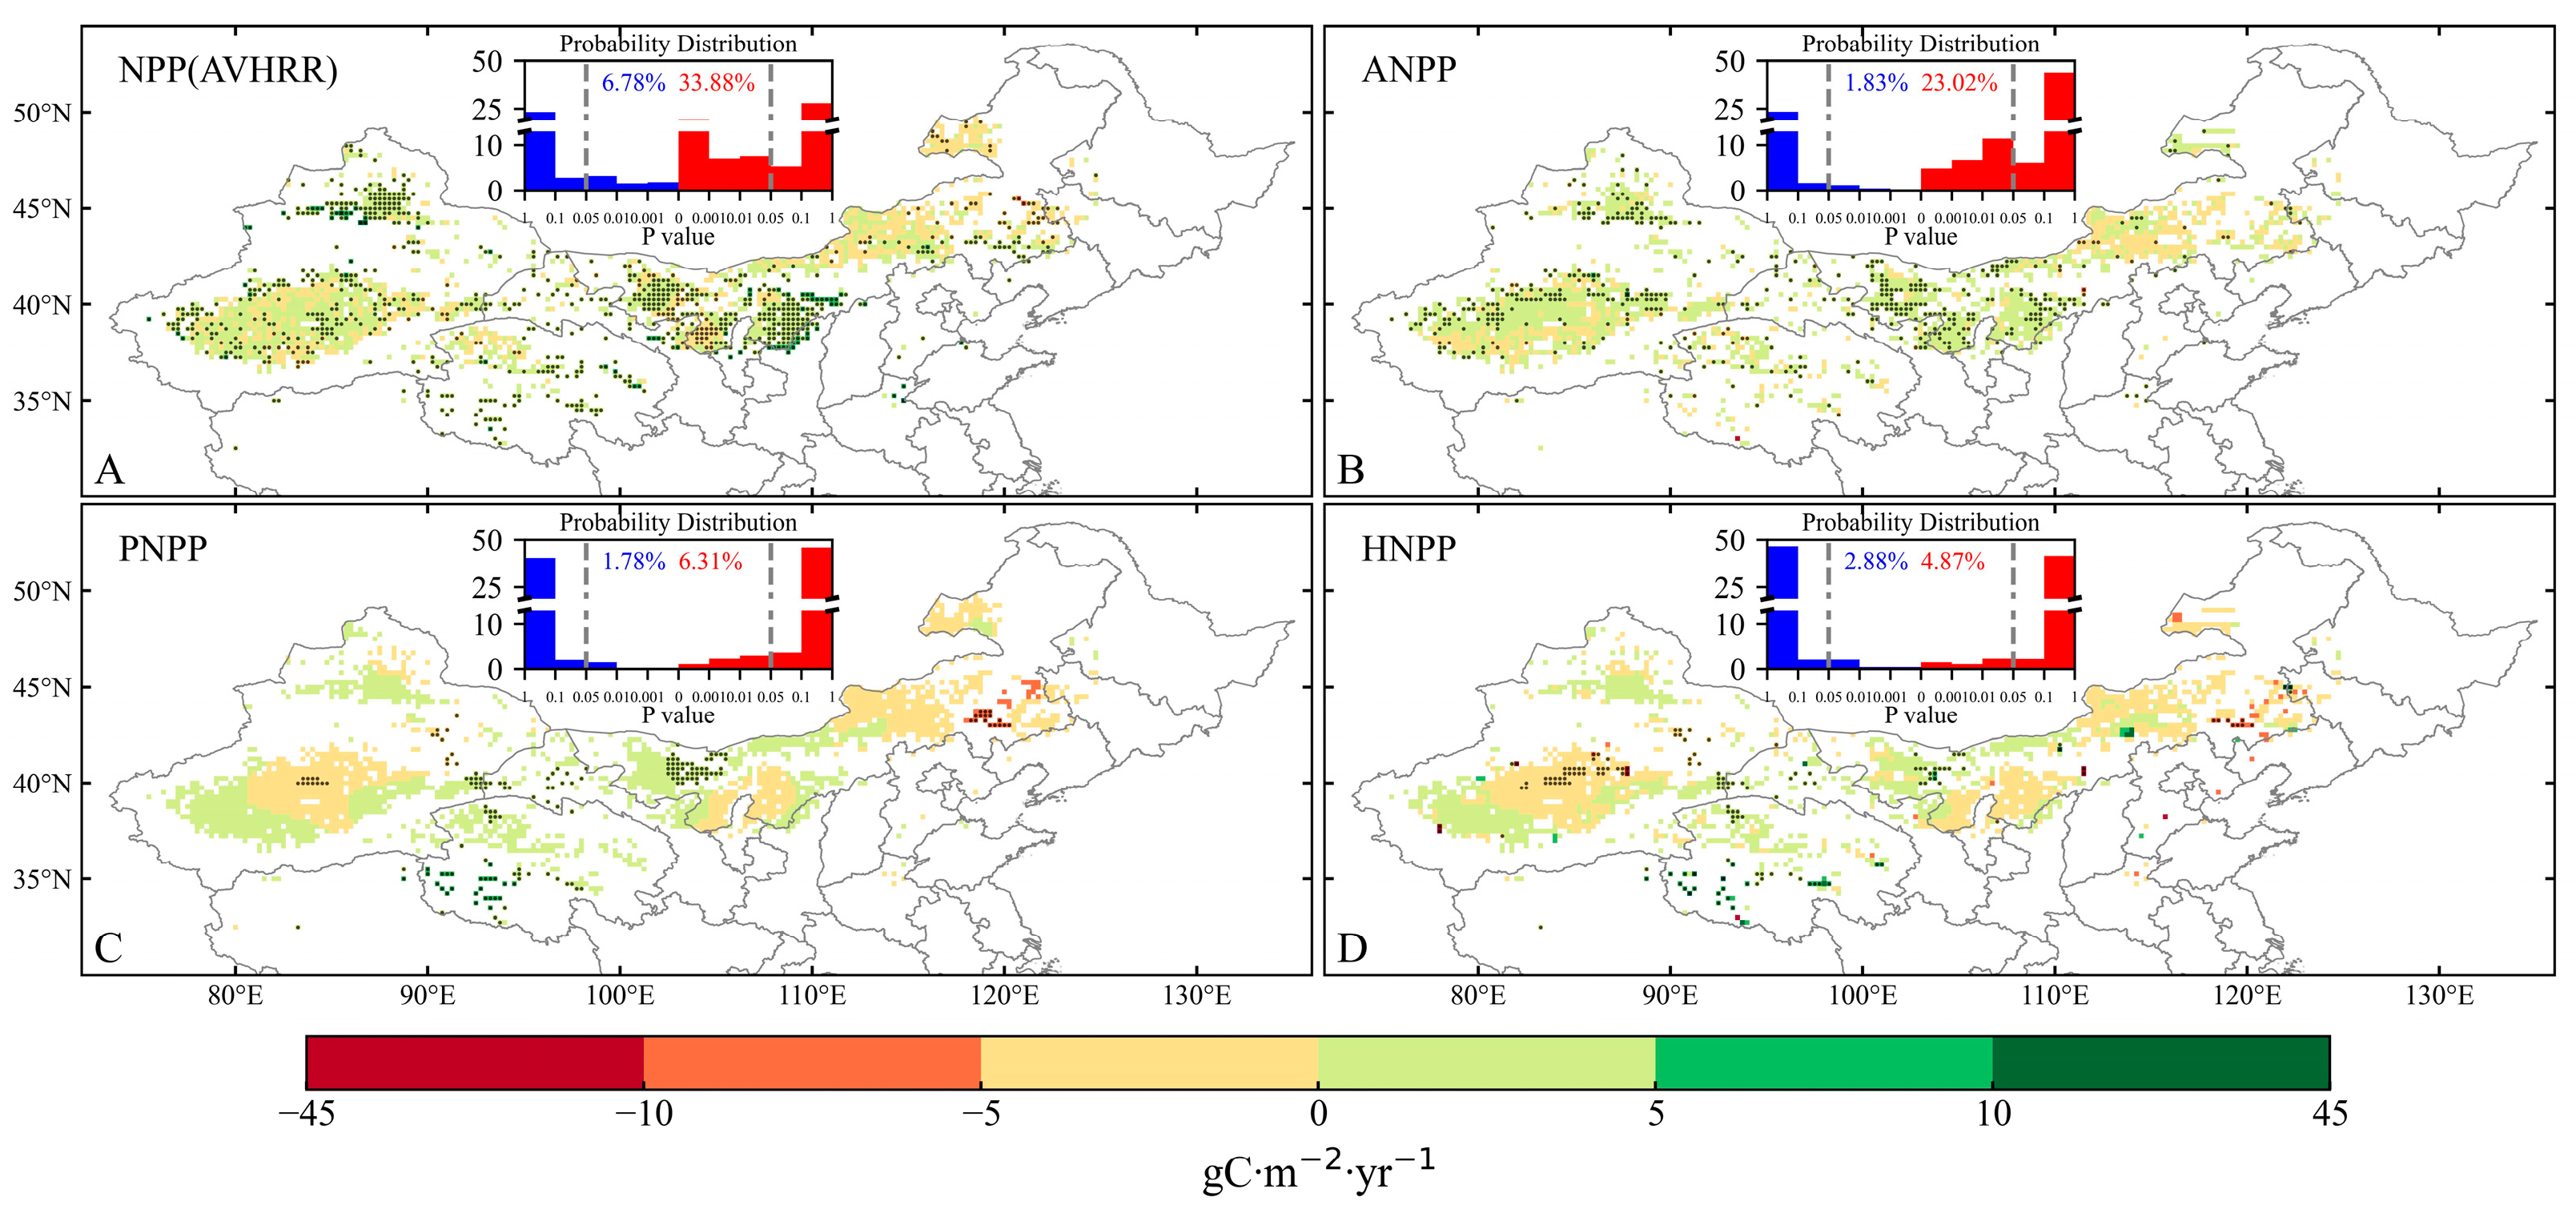
To evaluate the changes in desertification in NC, Figure 3 shows the linear trends for NPP from 1984 to 2014. Both the NPP from the GLASS and the ANPP calculated using the CASA model exhibited increasing trends in most regions of the DPR in NC over the past three decades, demonstrating the mitigation of desertification (Figure 3A,B). Conversely, in Hulunbuir, Otindag, and Horqin, the ANPP showed significant decreases, signifying the exacerbation of desertification in these areas. For the trends in PNPP (Figure 3C), a similar pattern of linear trends was observed in the desertification mitigation regions, indicating that climate drivers were the dominant factor in mitigating desertification from 1984 to 2014. The trends in PNPP also revealed a distinct difference in vegetation responses to climate drivers between the eastern and western regions of the DPR of NC. Additionally, HNPP changes generally exhibited a similar trend pattern to those caused by climate drivers (Figure 3D); in other words, human activity played the opposite role in desertification in NC. Specifically, the negative trend for HNPP in central and eastern Inner Mongolia (Ordos, Otindag, Horqin, and Hulunbuir) and south Xinjiang (Tarim) means that human activity supported ecological restoration and desertification mitigation. In Hexi Corridor, Qinghai, and north Xinjiang (Juggar), a positive trend for HNPP indicates that human activity decreased ecological restoration and led to the exacerbation of desertification.
As indicated by the linear trend of NPP, overall, 72.74% of the DPR in NC exhibited mitigation of desertification (SANPP > 0). These areas were primarily situated in Juggar, Tarim, Qinghai, Ala Shan, Hexi Corridor, and Ordos (see inset in Figure 4A). Meanwhile, 27.26% of the area experienced an exacerbation of desertification, specifically Otindag and Horqin (see inset in Figure 4B). To further quantify the effects of climate drivers and hu-man activity on desertification in NC, according to the judgement criteria (Table 2), the contributions of climate drivers accounted for 47.2% of the mitigation of desertification in NC, while 39.6% of the mitigation was attributed to human activity, and the remaining 13.2% was influenced by both human activities and climate drivers (Figure 4A). There were large spatial differences in the predominant factors that mitigated desertification, with climate drivers emerging as the principal factor in the northwestern DPR (Juggar, Qinghai, Ala Shan, and Hexi Corridor), while human activity dominated in the eastern DPR (Ordos, Hulunbuir, Otindag, and Horqin). For the exacerbation of desertification, climate drivers accounted for 48.5% of the area, while human activity accounted for 41.03%. Specifically, desertification exacerbation dominated by climate drivers was primarily concentrated in Tarim, Otindag, and Horqin, whereas desertification exacerbation due to human activity was scattered across the western DPR in NC.

3.2. Shift in Desertification after 2000 in NC

Studies suggested that a reversal of desertification occurred around 2000 [72,73,74]. Additionally, climatic factors, such as the near-surface air temperature, precipitation, and wind speed, have exhibited dramatic interdecadal variability [75,76,77]. Therefore, it was necessary to further analyze whether the impacts of climate drivers and human activity on desertification in NC have changed over the past three decades.
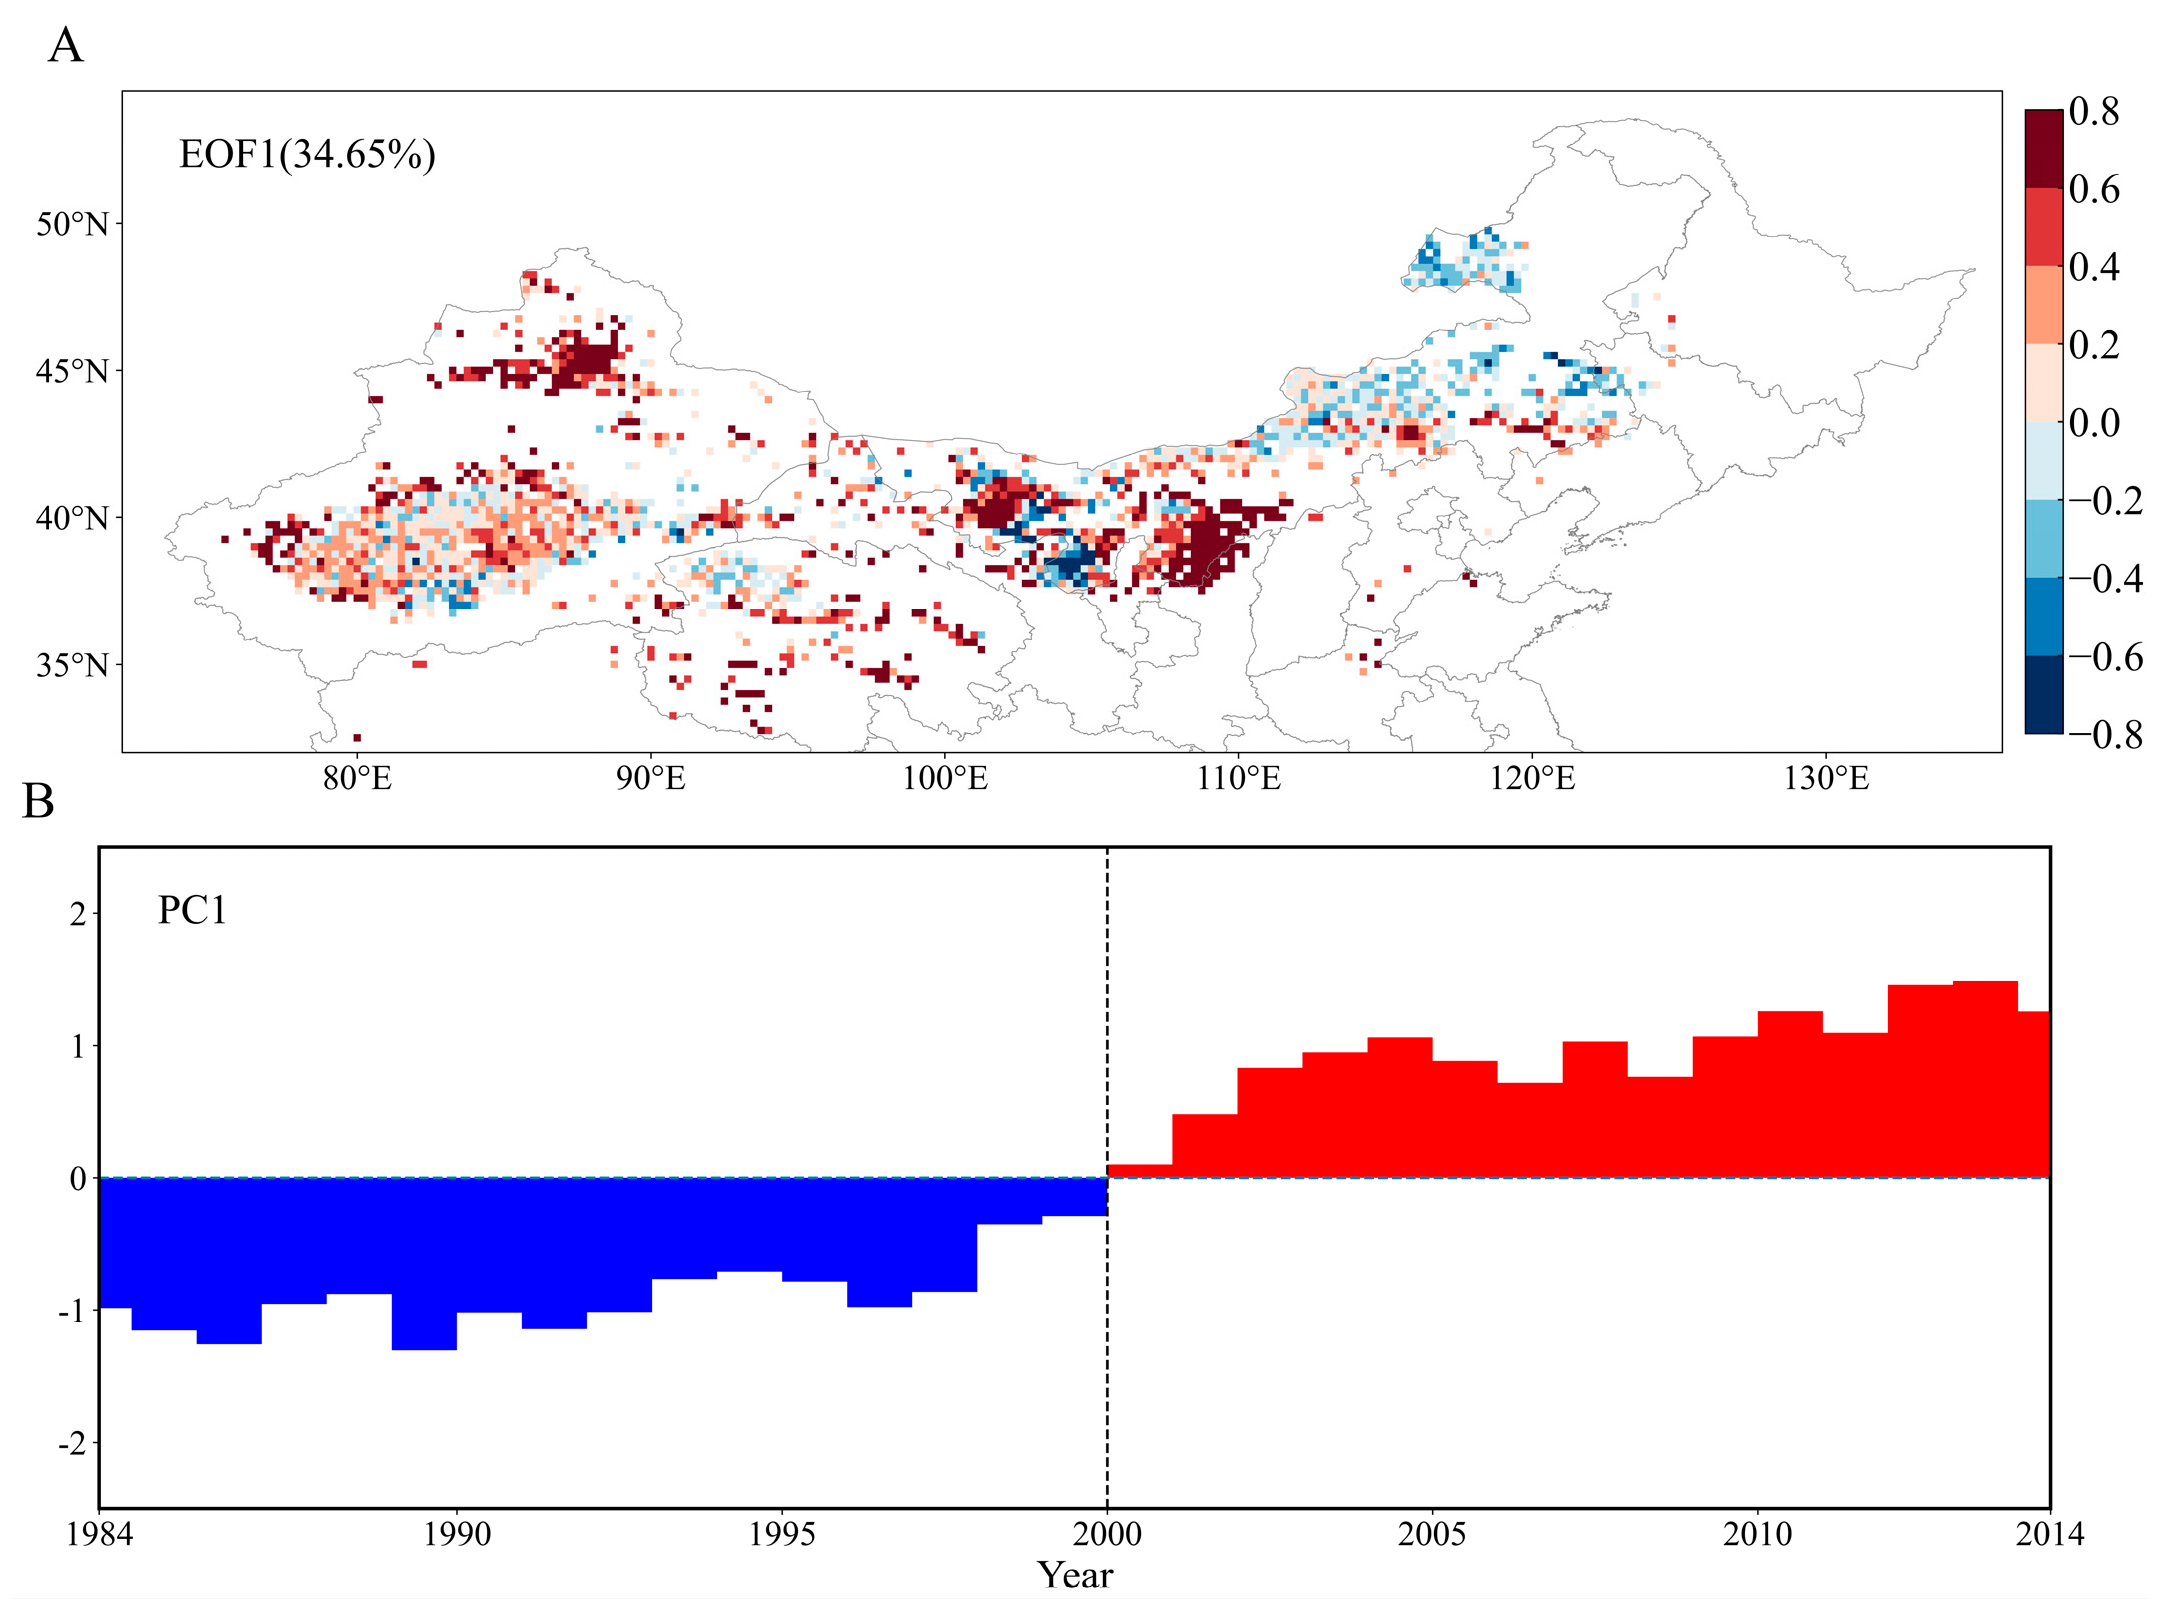
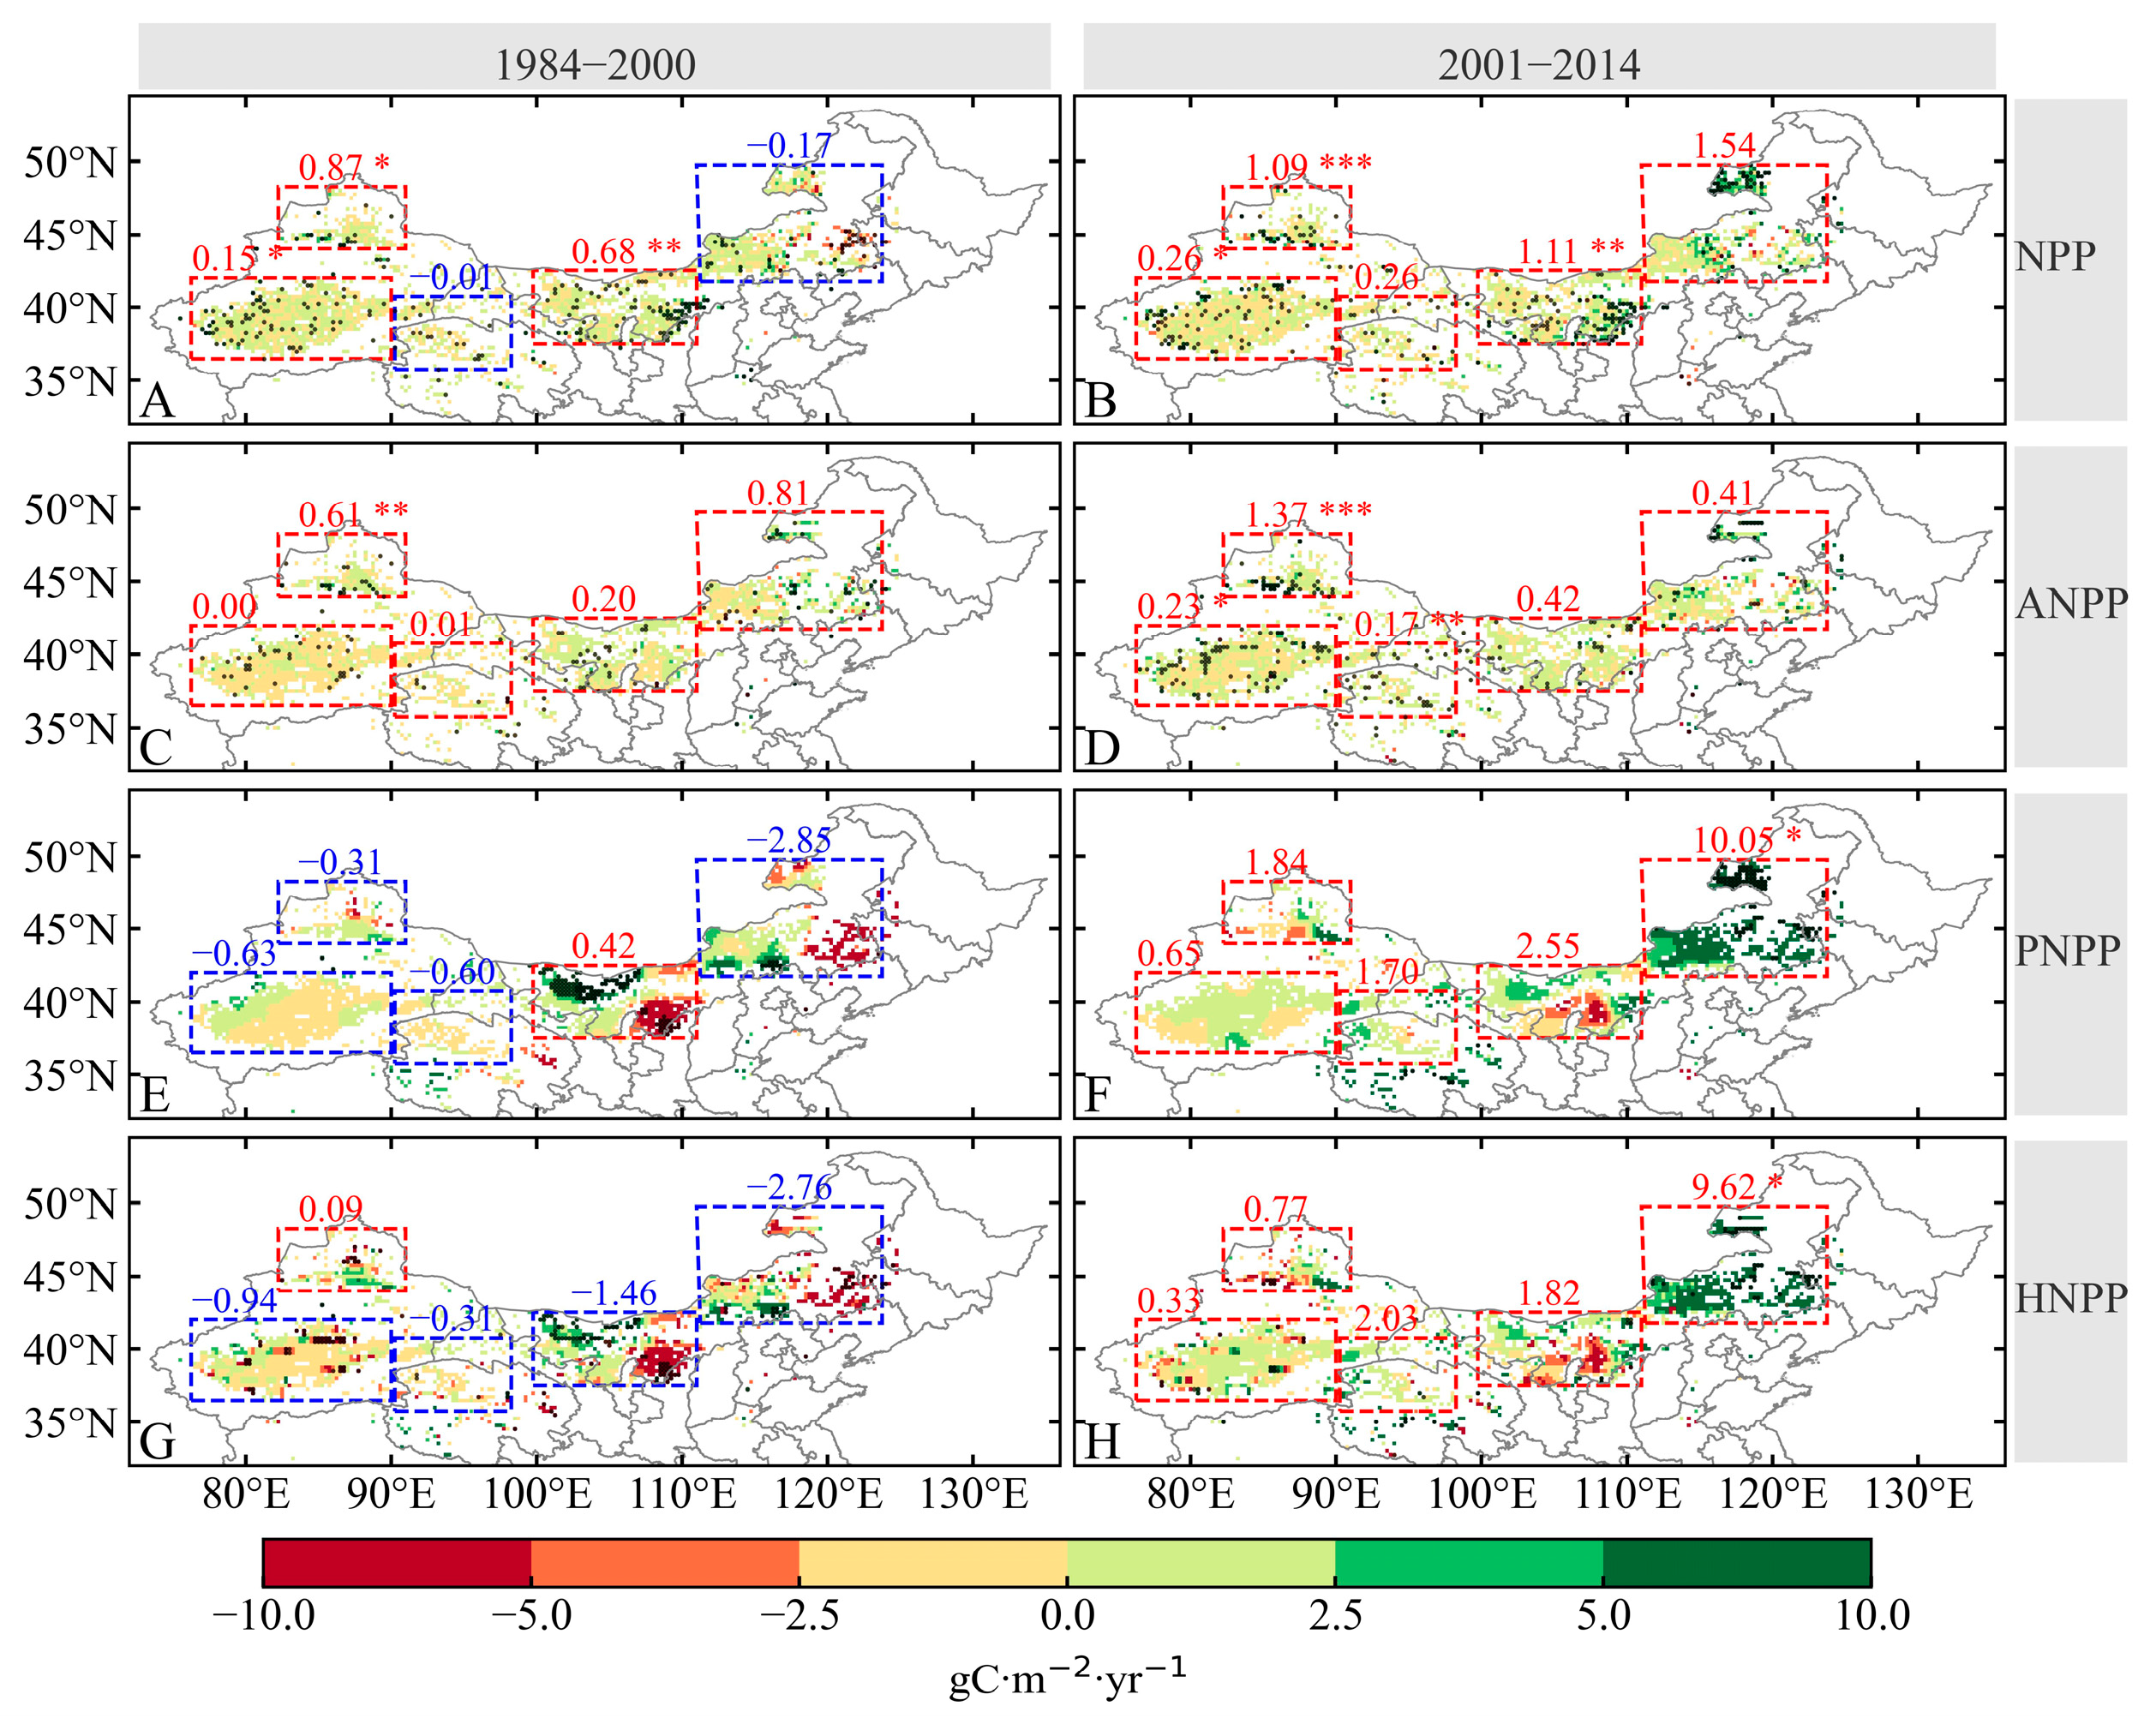
As illustrated by the empirical orthogonal function (EOF) decomposition of NPP (Figure 5A), the spatial mode of NPP variability showed an east–west reversal pattern, with the explained variance of the first leading mode of the EOF (EOF1) accounting for 34.65% of the total. The principal component (PC1) of EOF1 showed temporal turning around the year 2000 (Figure 5B). Such a decadal shift was consistent with previous studies [42,78,79]. To further analyze the desertification shift around the 2000s in NC, a comparison of the spatial patterns of the linear trends in NPP between the periods of 1984–2000 and 2001–2014 is shown in Figure 6. The NPP growth rate greatly increased after 2000 (Figure 6A,B). Similar changes appeared for ANPP except in the northeastern DPR, i.e., the Ordos, Horqin, and Hulunbuir regions (Figure 6C,D). This may have been due to missing data in the Hulunbuir region, uncertainties introduced by the methodology of directly extrapolating ANPP from the long-term NDVI, or the degradation of the AVHRR sensors assimilated by the GLASS [80,81]. The changes in NPP and ANPP corresponded to an opposite change in PNPP, which exhibited noteworthy decreases in most regions before 2000 and remarkable increases thereafter (Figure 6E,F). Meanwhile, the consistent patterns of change in HNPP (Figure 6G,H) and PNPP suggest opposite contributions of climate drivers and human activity to desertification in the Ordos, Horqin, and Hulunbuir regions. Before 2000, ANPP increased while PNPP decreased, indicating that human activity supported the mitigation of desertification in these regions while climate drivers had a negative effect. After 2000, PNPP showed an increasing trend, reflecting a positive effect of climate drivers on the mitigation of desertification, as reported by Duan et al. [82], Gou et al. [83], and Zhang et al. [84].
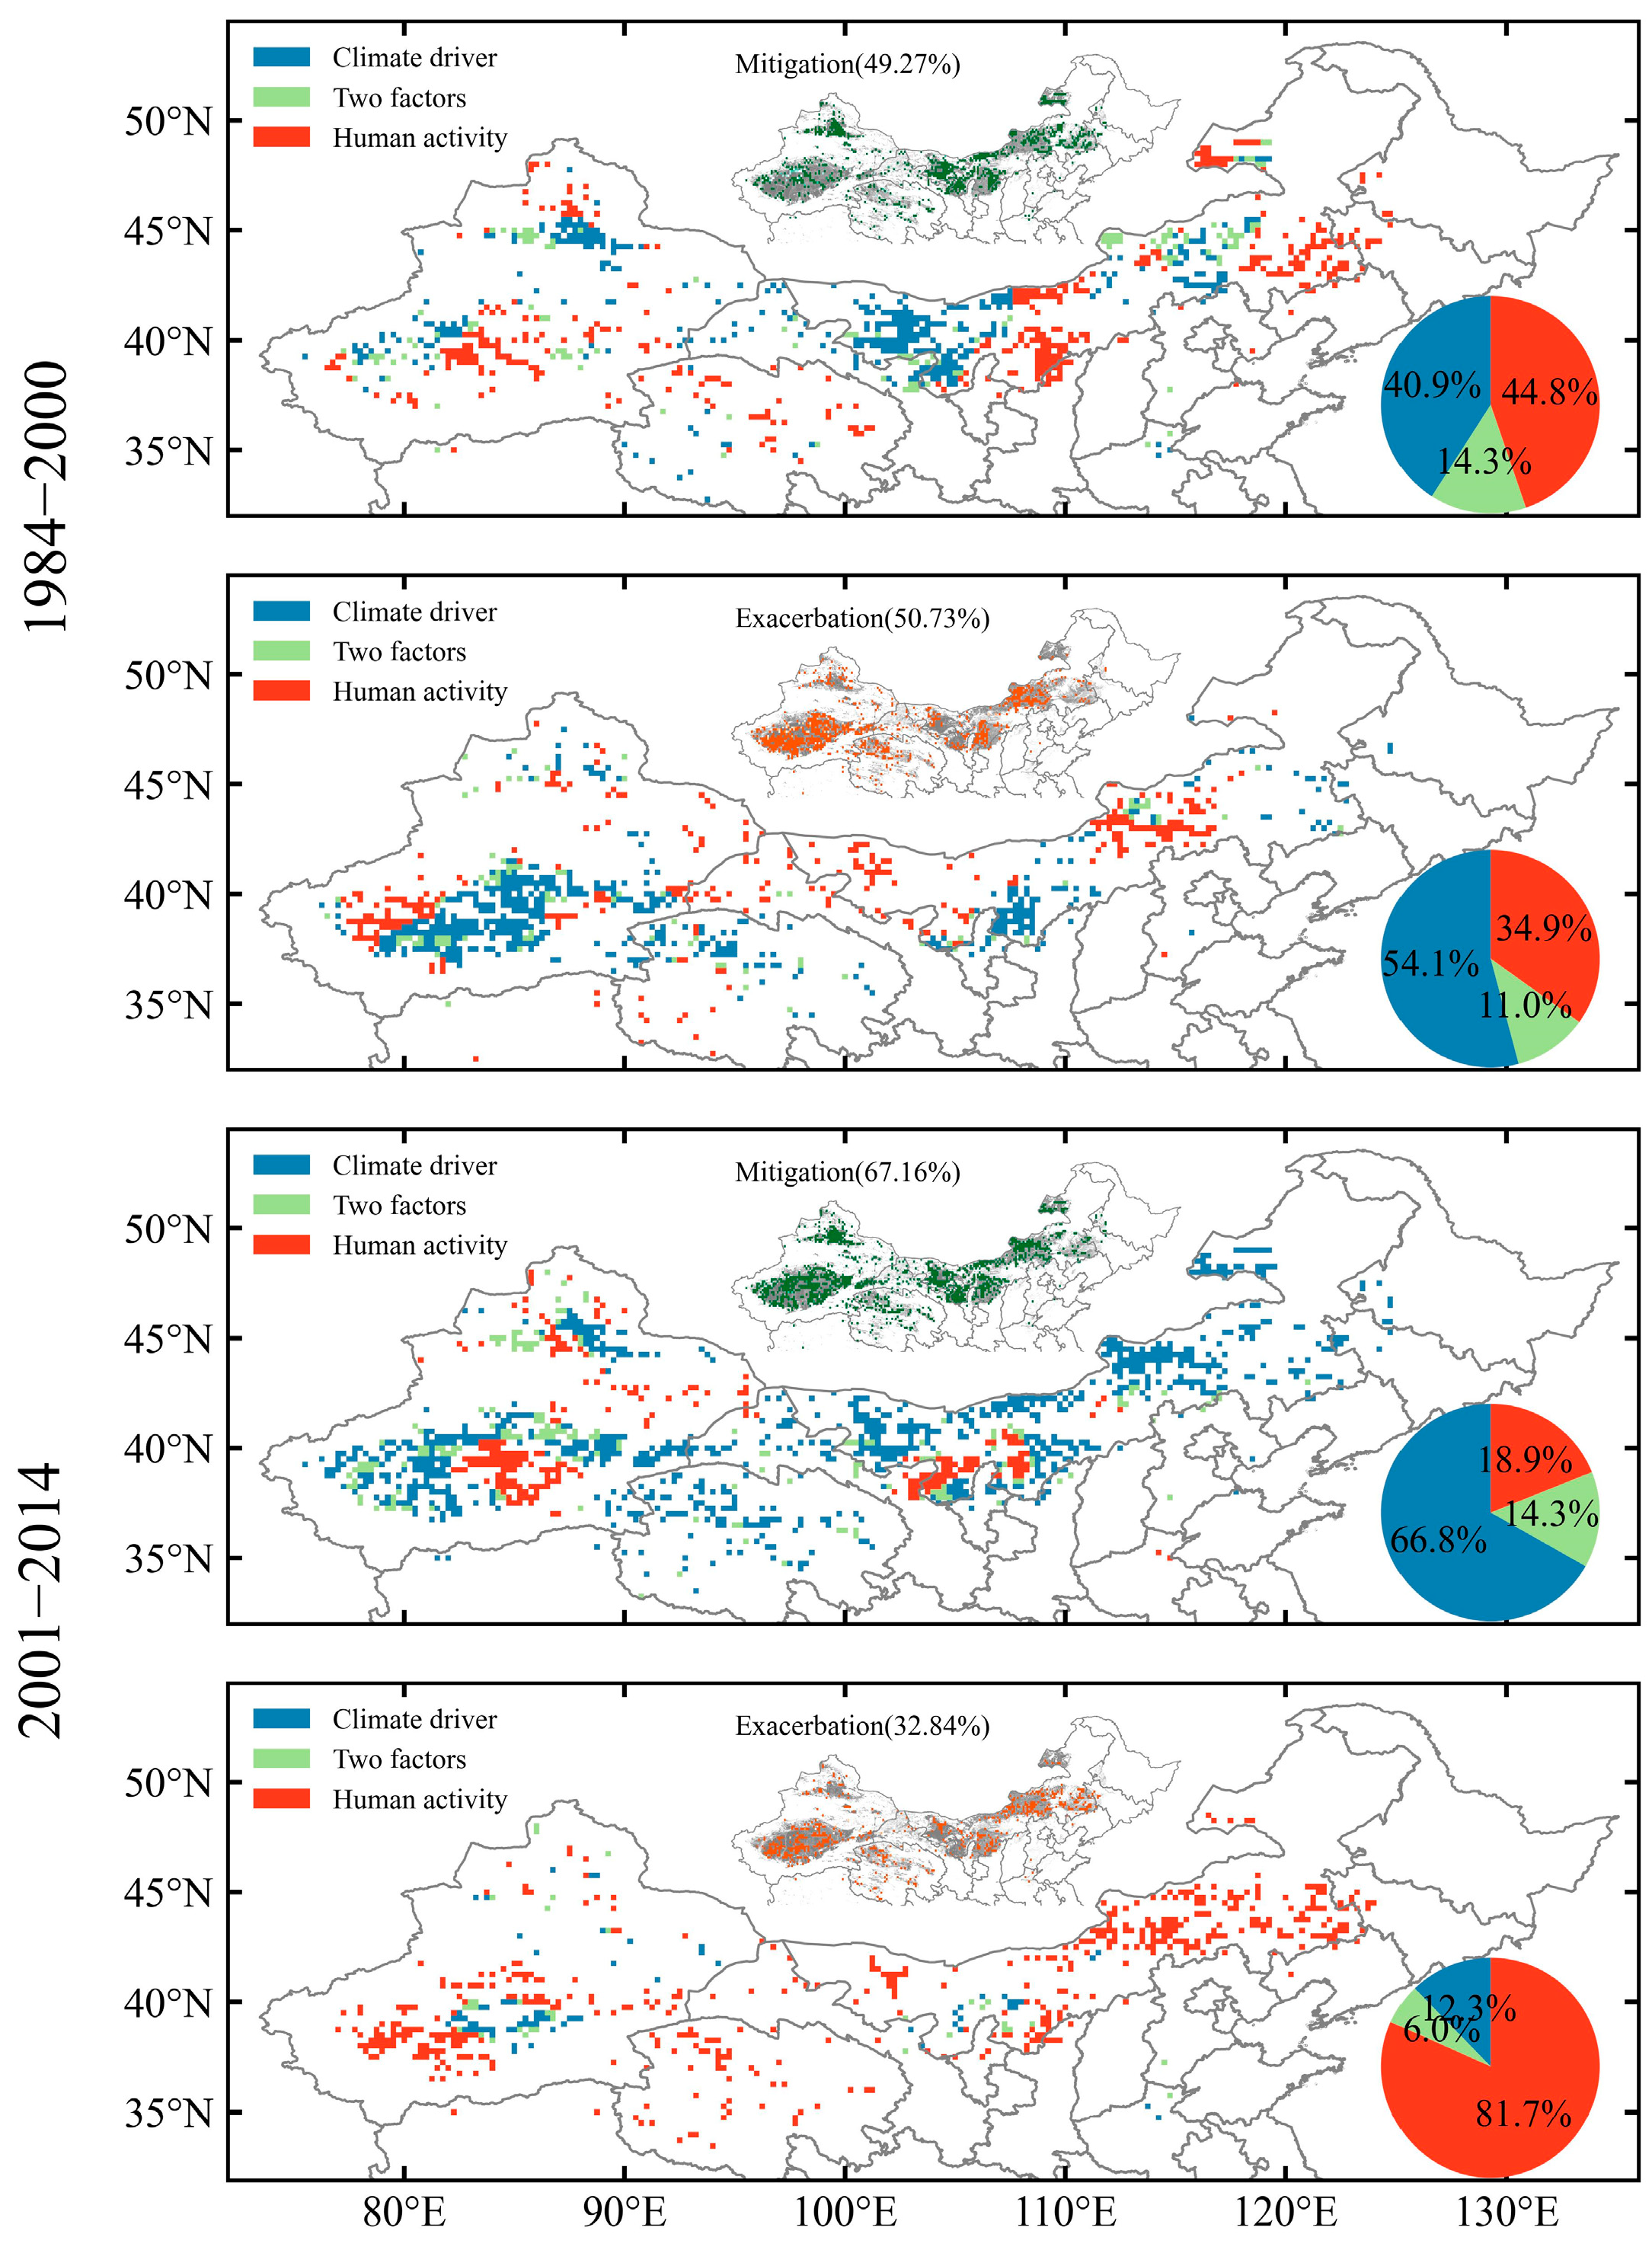
As shown in Figure 7, desertification-mitigated areas in the DPR of NC increased by 17.89% after 2000 (67.16%) compared to before 2000 (49.27%). The main driving factors were also different. From 1984 to 2000, human activity exhibited a 44.8% contribution to the mitigation of desertification, which decreased to 18.9% from 2001 to 2014 (Figure 7(top,middle bottom)). Conversely, after 2000, the contribution of human activity to the exacerbation of desertification increased to 81.7%, while climate drivers exhibited only a 12.3% contribution (Figure 7(middle top,bottom)). It should be noted that we used ANPP because its algorithms have a physical meaning and it could be compared with PNPP. We also compared the results with those calculated directly based on the GLASS NPP (Figures S4 and S5). The results of the GLASS-based NPP data analyses were generally consistent with those of the CASA model-based ANPP analyses except for differences in desertification changes up to the year 2000, which may have been due to the inferior mitigation of desertification estimated using ANPP in the Tarim region. The relative influence of climate drivers and human activity on desertification varies across different regions (Figure S6). In the Juggar region, desertification mitigation is primarily driven by climate factors, while human activities dominate desertification exacerbation in this region. In the Tarim region, the dynamics shifted after 2000 from a pattern in which human activity contributed to mitigation while climate drivers led to exacerbation to one in which climate drivers promoted mitigation while human activity contributed to worsening desertification, probably due to human agricultural activities [33]. Desertification dynamics in the Qianghai region are more pronounced than those in Tarim, with climate factors completely dominating mitigation after 2000, while the exacerbation of desertification is entirely due to human activity. For the Ala Shan, Hexi Corridor, and Ordos region, desertification mitigation has mainly been dominated by climate factors, although these factors also dominated deterioration after 2000. Unlike other regions, the Otindag, Horqin, and Hulunbuir region experienced desertification mitigation driven by human activity from 1984 to 2014, even as climate change completely dominated after 2000. Overall, climate drivers played a dominant role in desertification mitigation, while desertification exacerbation was caused by human activity in the DPR of NC after 2000.

4. Discussion

4.1. Effects of Different Climatic Factors

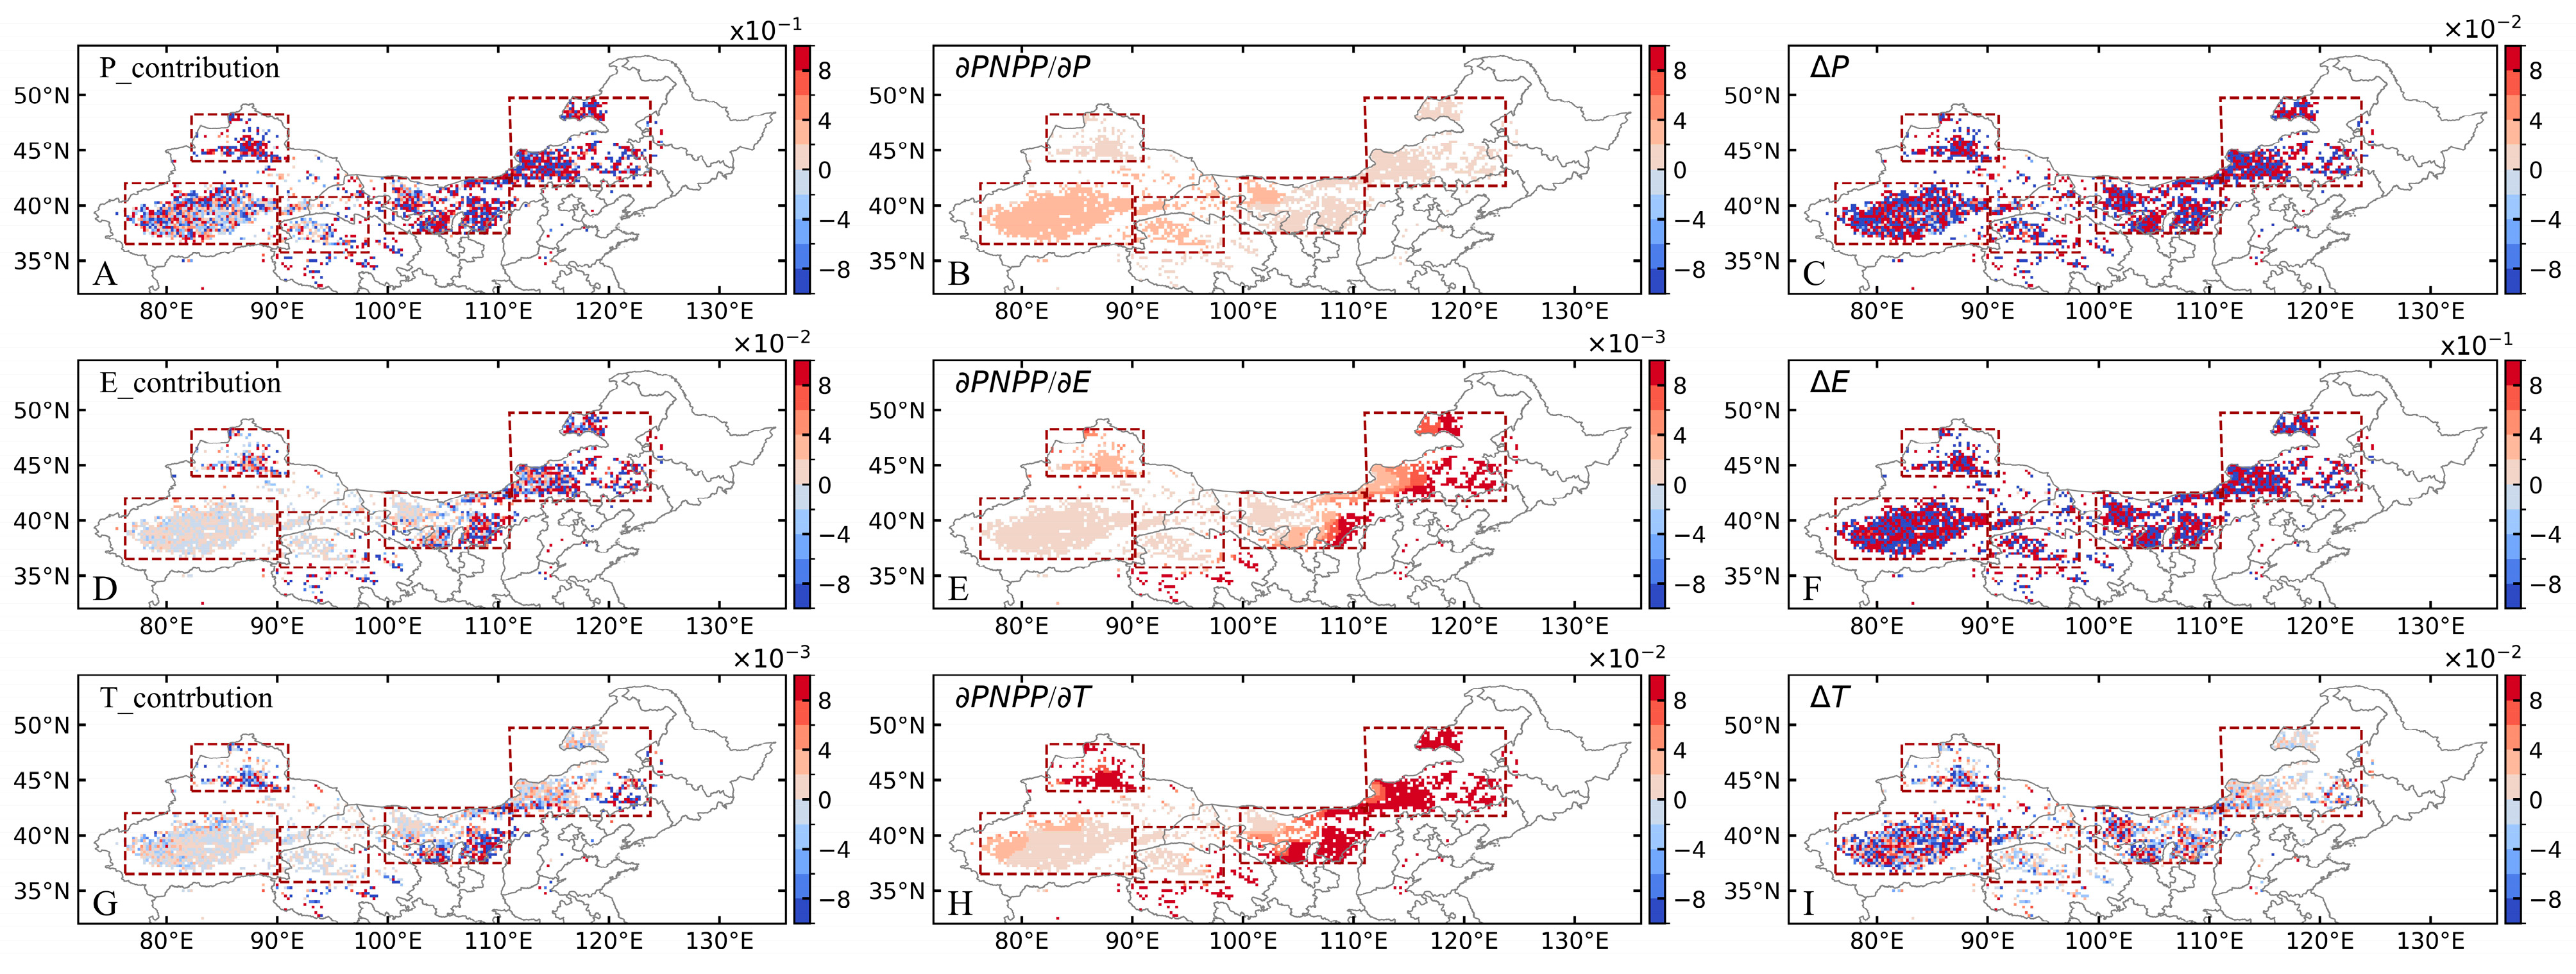
The above analysis indicates that climate drivers promoted the mitigation of desertification in NC after 2000. PNPP can reflect the influence of climate drivers on desertification. Therefore, according to the PNPP algorithm, an examination was conducted to determine the key factors (among the near-surface air temperature, surface evapotranspiration, and precipitation) that dominated the mitigation of desertification in NC after 2000. A rising temperature can increase soil organic carbon turnover and diminish soil productivity [85]. In addition, an increase in the near-surface air temperature can reduce soil moisture in semi-arid regions [86] and trigger soil salinization [87], which exacerbates desertification risk [88]. From 1984 to 2014, the entire DPR in NC experienced a temperature rise (Figure S7A). Meanwhile, surface evapotranspiration increased in most areas of the DPR (Figure S7D), amplifying vegetation water requirements, particularly in irrigated regions, and exacerbating soil erosion risk [89]. Compared to the period from 1984 to 2000 (Figure S7B), the temperature increase was mitigated after 2000 in the DPR of NC (Figure S7C), which may have contributed to the mitigation of desertification. However, after 2000, an increase in surface evapotranspiration occurred in these regions (Figure S7F), likely due to human activities such as farming, over-grazing, and mining [90]. This phenomenon also provides a partial explanation for the contrasting impacts of climate drivers and human activity in these regions. In arid and semi-arid regions, water availability is essential for governing ecosystems [91]. Precipitation has emerged as a dominant factor that influences NPP in these regions [92,93]. During the period from 1984 to 2014, precipitation significantly increased over the middle–western DPR, while it decreased over the western DPR (Figure S7G), consistent with the trends of PNPP (Figure S8). Nevertheless, compared with the precipitation trend from 1984 to 2000 (Figure S7H), precipitation increased in Otindag, Horqin, and Hulunbuir after 2000 (Figure S7I), which favored the mitigation of desertification in these regions. To further quantify the contributions of precipitation (P), evapotranspiration (E), and the near-surface air temperature (T), a method used by Yang et al. [94] was adopted. The terms ∂PNPP/∂P, ∂PNPP/∂E, and ∂PNPP/∂T are the sensitivities of individual factors (i.e., P, E, and T) to changes in PNPP, and the terms (∂PNPP/∂P)dP, (∂PNPP/∂E)dE, and (∂PNPP/∂T)dT represent the contributions of P, E, and T, respectively, to changes in PNPP. The details of the method can be seen in the Supplementary Materials (Method S4). As shown in Figure 8, the spatial pattern of the PNPP changes (i.e., the potential tendency for desertification) induced by the changes in precipitation (dP) (i.e., (∂PNPP/∂P) dP) indicated a positive contribution of dP to desertification mitigation in most regions (Figure 8A) because the sensitivity of PNPP to change in P (i.e., (PNPP/∂P)) was positive in the DPR (Figure 8B), followed by the change in PP). Moreover, it is clear that precipitation contributed more than evaporation and temperature (Figure 8D,G). Several studies have suggested that soil moisture is an important factor for vegetation in arid regions, but its impacts show large spatial variability and temporal lag [95,96,97]. In addition, soil moisture is regulated by precipitation and surface evapotranspiration. Thus, impacts of different climatic factors should reflect the effects of soil moisture.

4.2. Atmospheric Circulation and Internal Variability

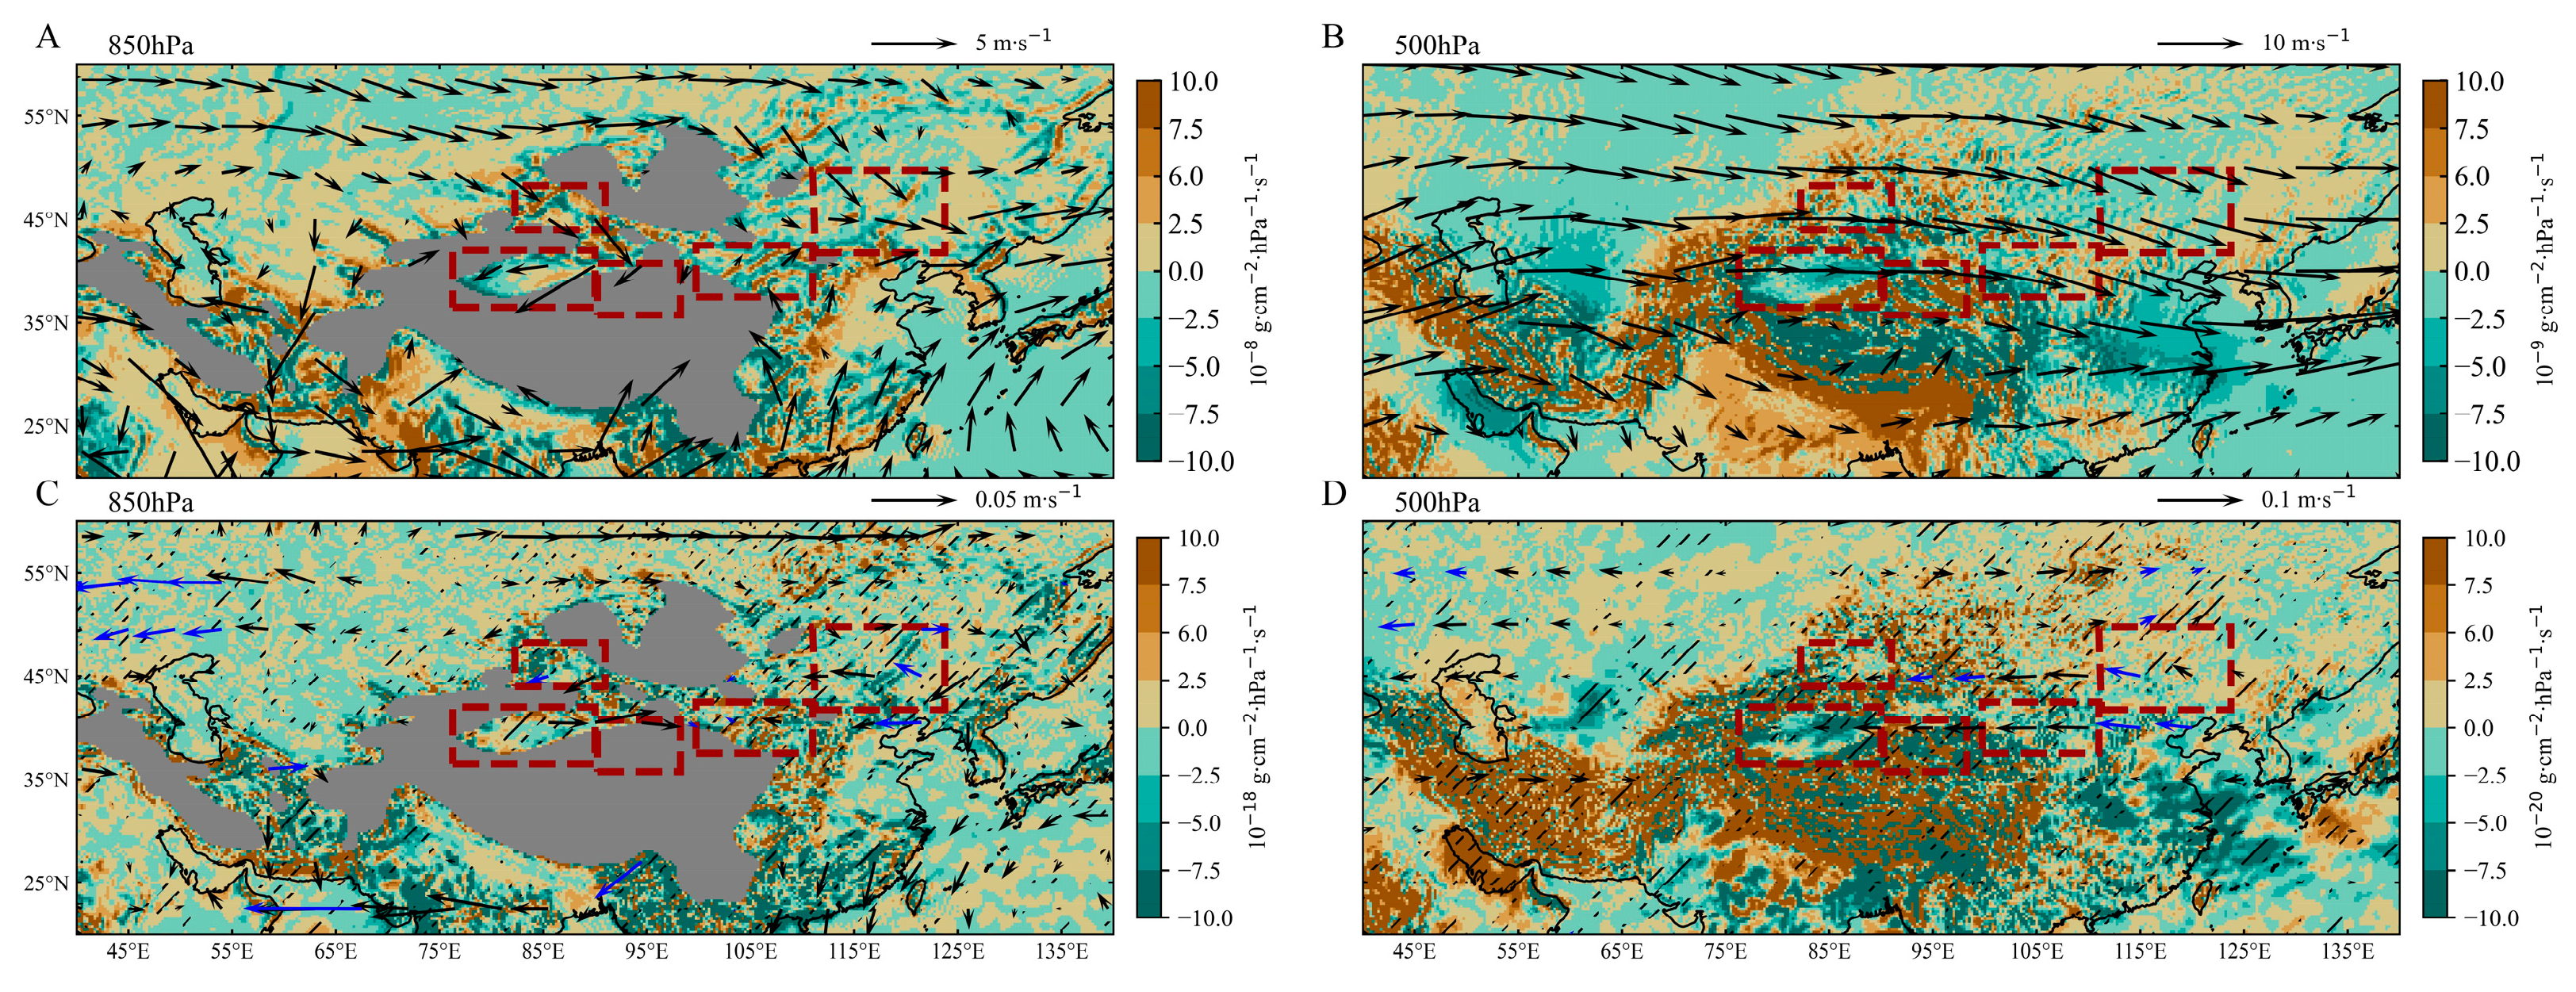
Precipitation was demonstrated to be a dominant factor for desertification by the above analysis, as its variations were tightly linked to changes in atmospheric circulation. To discuss the mechanism behind precipitation variations, we focus on the rainy season from April to September, which constitutes 87% of the total annual precipitation (Figure S9). The sources and transportation of water vapor were examined at 500 hPa and 850 hPa (Figure 9). Precipitation in the Juggar region is influenced by northwestward airflow during the rainy season (Figure 9A,B). Generally, little water vapor reaches the inland arid region through advection, so Juggar primarily relies on the obstruction posed by the tall mountain range for precipitation, which primarily occurs on the northern slopes of the Tianshan Mountain [98]. The Tarim region, encircled by mountain ranges to the west, south, and north, experiences restricted access to water vapor from the westerlies, which consequently leads to limited precipitation. It mainly relies on water vapor transported by low-level (850 hPa) easterly flows from the east side of the Tarim region (Figure 9A). As it is situated in the northeastern part of the Tibetan Plateau, Qinghai primarily receives water vapor for precipitation from the Eurasian landmass via the westerlies and from the northern Indian subcontinent via the Indian summer monsoons [99,100]. The precipitation in Ala Shan, Hexi Corridor, and Ordos is influenced by the westerly trough, which is characterized by a prevailing northwest airflow and low-level (850 hPa) water vapor from the southwest monsoon winds. The Hulunbuir, Otindag, and Horqin regions are located be-hind an aloft westerly trough, which brings water vapor. Regressions of water vapor flux divergence and horizontal wind at 500 hPa and 850 hPa (Figure 9C,D) show that the anomalous east winds over the region from Northeast China to Mongolia support water vapor convergence over Ala Shan, Hexi Corridor, and Ordos but reduce water vapor transport from the upstream regions to Hulunbuir, Otindag, and Horqin. Accompanied by the anomalous northeast winds over the north side of Tianshan Mountain, water vapor convergence increases over Juggar. Meanwhile, the anomalous west winds over eastern Tarim restrain water vapor transport from the east side. Thus, water vapor convergence there decreases. These anomalies of water vapor divergence related to atmospheric circulation anomalies are generally consistent with precipitation trends (Figure 8G), which partly illustrate the causes of precipitation changes.
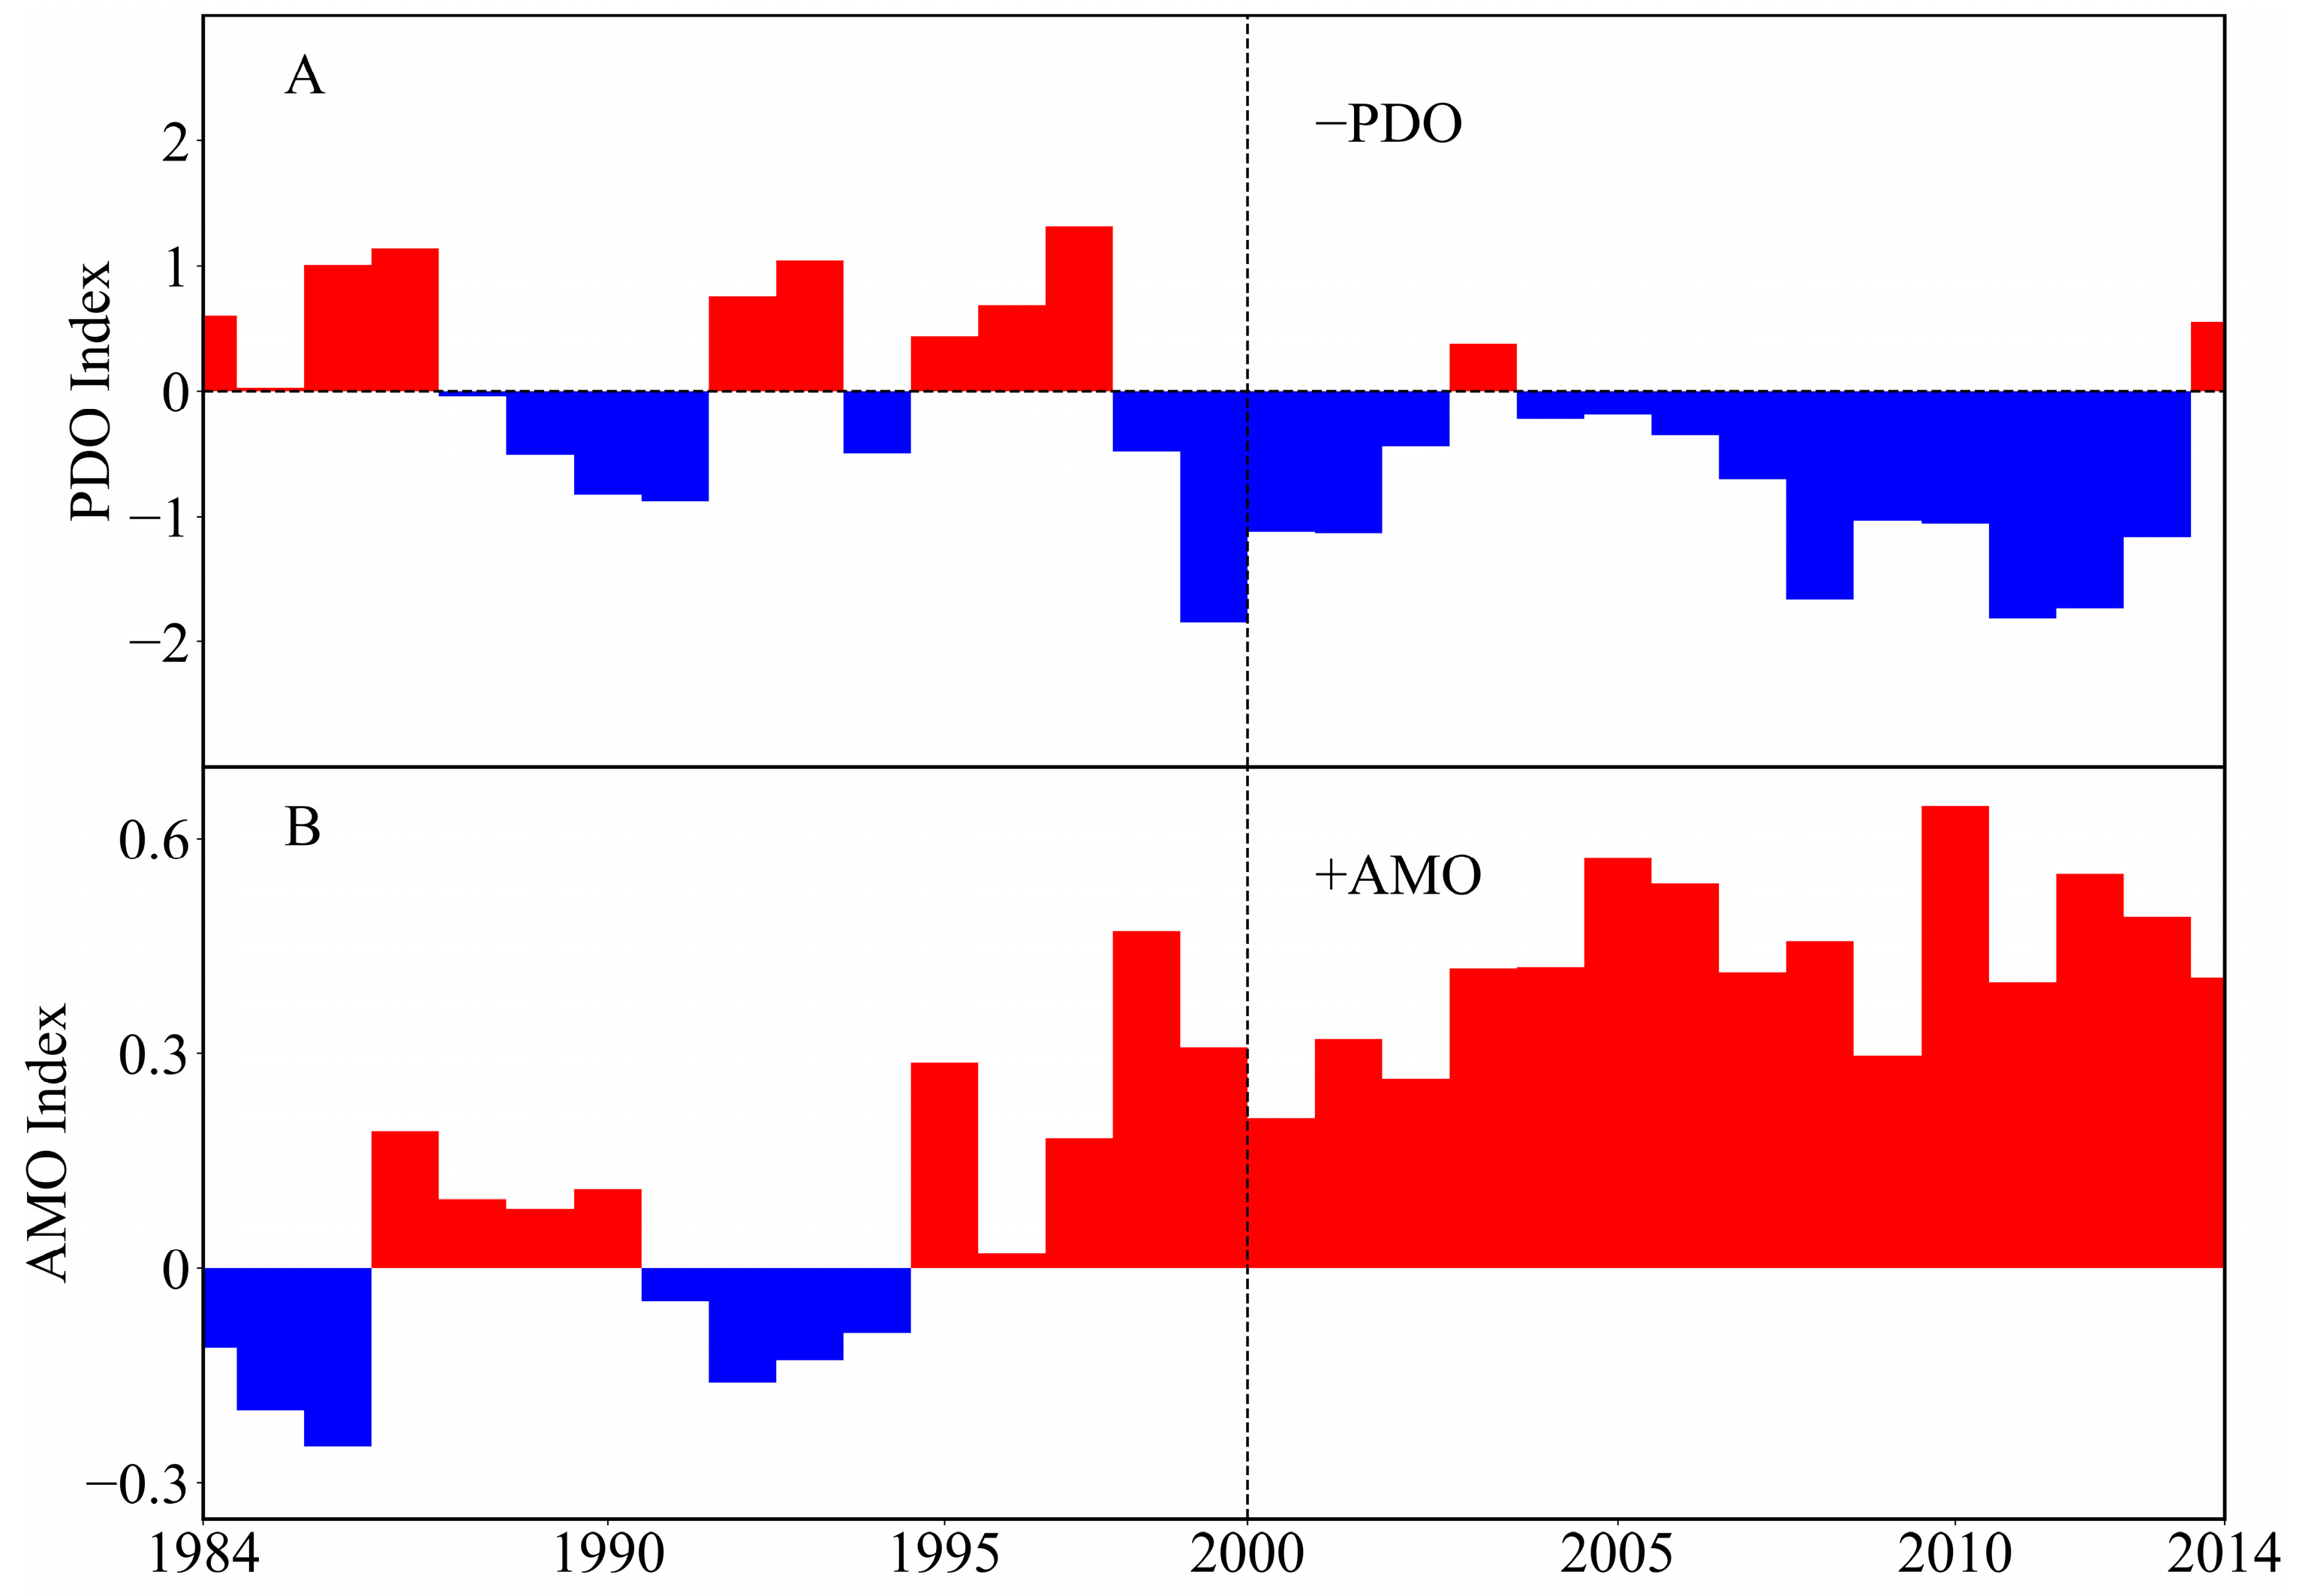
Decadal-scale internal climate variability, such as the phases of the PDO and AMO, affects atmospheric circulation patterns. After the 1990s, the AMO shifted from a cold phase to a warm phase, while the PDO transitioned from a warm phase to a cold phase (Figure 10). These changes in oceanic temperature anomaly patterns triggered adjustments in atmospheric circulation and thereby influenced precipitation in NC [101,102]. The AMO transitioned from a negative phase to a positive phase, which triggered a remotely correlated wave train over Eurasia, an atmospheric fluctuation that can produce opposing climate effects in different regions [103,104]. Over the Mongolian Plateau, this wave train manifests as an anti-cyclonic anomaly [105], which enhances the water vapor transported to the arid region of Northwest China, resulting in increased precipitation [106]. In addition, there is a strong correlation between the annual precipitation in Northwest China and the AMO [107]. During the warm AMO phase, the vertical coupling between the upper-level anti-cyclone and the lower-level low-pressure system facilitates ascending motion in NC, which contributes to increased precipitation. During the cold AMO phase, contrary results were observed [108]. During the cold phases of the PDO, a lower-troposphere anti-cyclonic anomaly is induced over the North Pacific, which leads to wet and warm southeasterly winds and above-normal precipitation over NC [109]. The cold phase of the PDO extends the western Pacific subtropical high westward, weakening the East Asian summer monsoon, which leads to a shift in the position of the East Asian westerly jet, culminating in the emergence of easterly anomalies over East Asia [110]. Additionally, along the edge of the subtropical high, a southwesterly flow supports water vapor transport to NC, resulting in increased precipitation [61]. It should also be recognized that the effect of climate drivers on NPP is lagged. Thus, the shift in desertification occurred around 2000.

4.3. Human Activity in NC

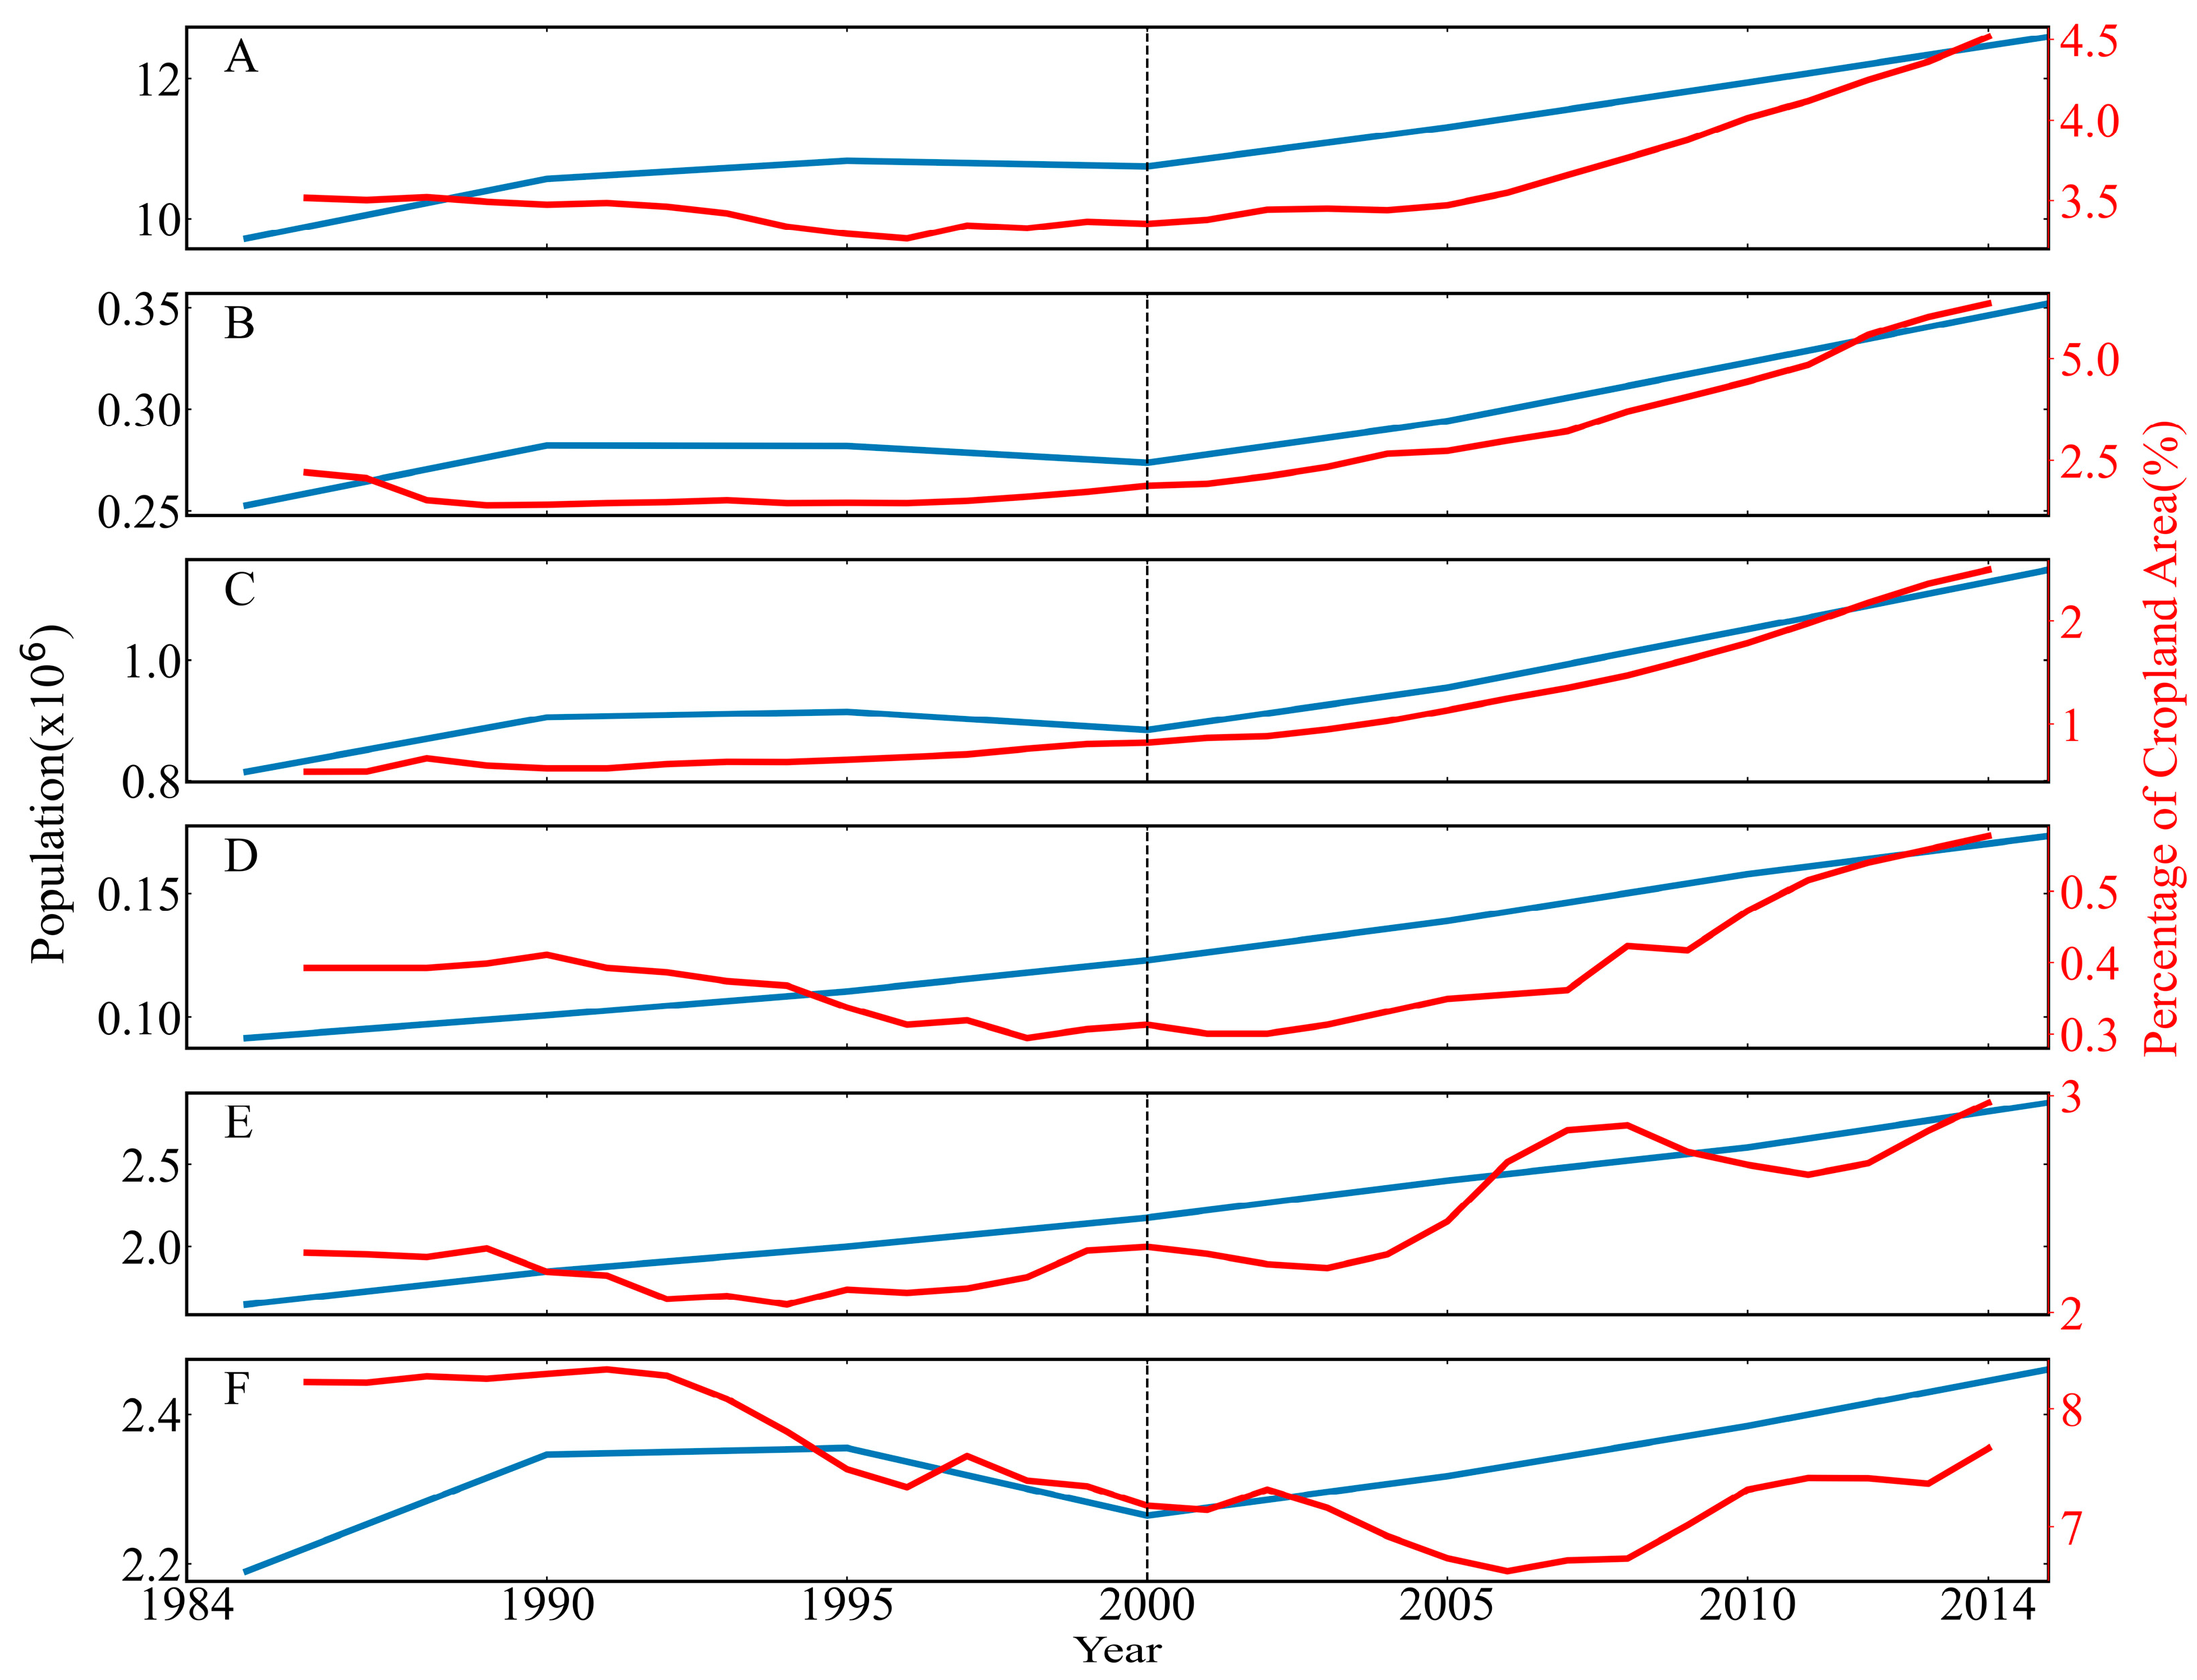
Confronting the serious problem of desertification, the Chinese government has established and implemented a sequence of large-scale environmental and ecological recovery programs since 1978, such as the Three North’s Forest Shelterbelt Program and Soil and Water Conservation Program—National [111]. These ecological programs have reduced the area of desertification and greatly increased regional vegetation cover via afforestation [18,112]. Particularly in the southern part of Ordos, desertification was mitigated before 2000 under very unfavorable climatic conditions (Figure 6). This success was attributed to investments by the local government and its management [113]. This also occurred in Horqin [114]. Although the need to combat desertification was already known before 2000, efforts to stop the deteriorating trend had failed (Figure 7). In response to this sustainability emergency, several projects were carried out around 2000, including the Natural Forest Conservation Program and the Grain-for-Green Program, and these programs generally contributed positively to mitigating desertification and controlling dust storms [79,111,115]. Unfortunately, the desertification situations in some regions, such as Otindag and Horqin, were not sustainably improved due to increases in grazing and cropland brought about by the increase in population as well as irrational afforestation [116,117]. The population, which can partly reflect human activity, has been growing in all regions, especially after 2000, and this has been accompanied by a rising share of cropland area (Figure 11). These findings generally support that human activity dominates the desertification exacerbation from 2001 to 2014 (as shown by Figure 7(bottom)). Specifically, in Hulunbuir, Otindag, and Horqin before 2000, the reduction in the area of cropland corresponded to a policy of returning farmland to forests [65,116] and to desertification degradation, which was dominated by human activity (as shown by Figure 7(top)). Therefore, in a situation where desertification is likely to be unceasingly exacerbated in the near future [94], policies suited to local conditions that take into account the driving causes of desertification are needed to achieve sustainable development.

4.4. Limitations

In this study, the evolution of desertification and its cause in the DPR of NC were detected by regarding NPP as a proxy; this approach still has some limitations. Although a decrease in plant biomass as a partial indication of land degradation, desertification is a complex process, and we still need a comprehensive indicator for representing desertification [9]. In addition, this study analyzed the evolution of desertification on a coarse resolution, which might be awkward in areas with complex terrain and underlying surface. Future research should incorporate specific satellite observations to provide more accurate assessments.
Moreover, this study adopts a narrow definition of human activities, focusing only on direct impacts, such as changes in subsurface types, while considering indirect influences, like greenhouse gas emissions, as climatic factors. This limited perspective may lead to an underestimation of the broader impacts of human activities on desertification.

5. Conclusions

This study employed NPP as a quantitative indicator to monitor the desertification trend from 1984 to 2014 and to assess the relative contributions of climate drivers and human activity. The results show that 72.74% of the total area of the DPR in NC experienced desertification mitigation from 1984 to 2014. These areas were predominantly in the northern and northwestern regions. Meanwhile, the regions with desertification exacerbation accounted for 27.26% of the DPR. This was mainly observed in Otindag. The SPNPP and SHNPP indicated that climate drivers served as the primary factors influencing the desertification process: they contributed to 47.2% of mitigation and 48.5% of exacerbation, whereas human activity accounted for 39.6% of mitigation and 41.0% of exacerbation. The remaining 13.2% and 10.5% of the area were influenced by both human activity and climate drivers.
A shift in desertification occurred around 2000, with mitigation appearing in most regions. Before 2000, nearly half of the DPR areas (49.27%) experienced mitigation, with human activity having a slightly stronger positive effect (44.8%) compared to climate drivers (40.9%). Since 2000, there has been substantial desertification mitigation (67.16%), with climate drivers becoming the dominant positive factor (66.8%). However, 32.84% of the DPR still experienced desertification exacerbation, of which human activity contributed 81.7%.
In addition to the near-surface air temperature and surface evapotranspiration, precipitation is the primary climatic factor that has promoted the mitigation of desertification in the DPR of NC since 2000. The abnormal easterly winds caused by the phase changes of the AMO and PDO transport additional water vapor over Ala Shan, Hexi Corridor, and Ordos, thereby increasing precipitation, enhancing the climate’s ability to affect vegetation, and helping to alleviate desertification, which is also influenced by human activity. While many ecological projects have helped to control its expansion, irrational land use persists. Although the impact of changes in climatic factors is stronger than that of human activity, human activity seems more controllable than climate drivers when changing desertification, even under unfavorable climatic conditions (i.e., increases in both the near-surface air temperature and evapotranspiration and decreases in precipitation), such as the situation in Ordos. Meanwhile, even when climatic conditions are favorable for desertification mitigation, irrational human activities can still cause desertification exacerbation, such as in Horqin.
This study quantified desertification changes in the DPR of NC during the period of 1984–2014 and detected the main causes across different time periods and regions. The research results are beneficial for a deep understanding of desertification and the formation mechanism under the background of climate change, and these also offer a scientific foundation for the targeted management of desertification, with strategies tailored to specific temporal and regional contexts.

Supplementary Materials

The following supporting information can be downloaded at https://www.mdpi.com/article/10.3390/rs16193706/s1, Method S1: Detailed algorithms of the CASA model; Method S2: Detailed algorithms of the modified Thornthwaite memorial model; Method S3: Taylor skill score; Method S4: Detailed algorithms of the contributions of different climatic factors to PNPP; Note S1: Desertification-prone region (DPR) in Northern China. Figure S1: Flowchart of this study; Figure S2: Detailed flowchart for calculating ANPP, PNPP, and HNPP; Figure S3: The validation of the CASA model by GLASS data; Figure S4: Contribution of factors to desertification change but using Glass NPP; Figure S5: The same as Figure S4 but for different time periods; Figure S6: Contributions of climate change and human activities to different areas. Figure S7: Spatial distribution of temperature evaporation precipitation trends; Figure S8: Scatters of the near-surface air-temperature, evaporation, and precipitation trend with the NPP, ANPP, and PNPP trend; Figure S9: The monthly precipitation in the DPR. References [1,29,31,35,58,62,118,119] are cited in the Supplementary Materials.

Author Contributions

Conceptualization, K.Y. and C.W.; methodology, H.L. and K.Y.; software, H.L.; validation, H.L., K.Y. and Y.C.; formal analysis, H.L. and K.Y.; investigation, K.Y. and Y.C.; resources, Z.W. and C.Z.; data curation, H.L. and L.A.; writing—original draft preparation, H.L.; writing—review and editing, K.Y.; visualization, H.L. All authors have read and agreed to the published version of the manuscript.

Funding

This study was supported by the National Key R&D Program of China (2020YFA0608404), China Meteorological Administration Innovation Development Special Project (CXFZ2024J043), and Ningxia Natural Science Foundation project (2022AAC05065).

Data Availability Statement

The datasets generated and analyzed in the current study are available from the corresponding author on reasonable request.

Acknowledgments

We sincerely thank the High-Performance Computing Center at Lanzhou University for their invaluable support and the provision of essential computational resources.

Conflicts of Interest

The authors declare no conflicts of interest.

References

  1. United Nations. Elaboration of an International Convention to Combat Desertification in Countries Experiencing Serious Drought and/or Desertification, Particularly in Africa. United Nations, 1994. Available online: https://wedocs.unep.org/20.500.11822/27569 (accessed on 3 October 2024).
  2. Sterk, G.; Stoorvogel, J.J. Desertification–Scientific versus Political Realities. Land 2020, 9, 156. [Google Scholar] [CrossRef]
  3. Nkonya, E.; Mirzabaev, A.; von Braun, J. (Eds.) Economics of land degradation and improvement: An introduction and overview. In Economics of Land Degradation and Improvement—A Global Assessment for Sustainable Development; Springer International Publishing: Cham, Switzerland, 2016; pp. 1–14. [Google Scholar] [CrossRef]
  4. United Nations. Transforming Our World: The 2030 Agenda for Sustainable Development. United Nations, 2015. Available online: https://wedocs.unep.org/20.500.11822/9814 (accessed on 3 October 2024).
  5. Barbier, E.B.; Hochard, J.P. Does land degradation increase poverty in developing countries? PLoS ONE 2016, 11, e0152973. [Google Scholar] [CrossRef]
  6. Hochman, Z.; Gobbett, D.L.; Horan, H. Climate trends account for stalled wheat yields in Australia since 1990. Glob. Chang. Biol. 2017, 23, 2071–2081. [Google Scholar] [CrossRef]
  7. Shao, W.Y.; Wang, Q.Z.; Guan, Q.Y.; Zhang, J.; Yang, X.Y.; Liu, Z. Environmental sensitivity assessment of land desertification in the Hexi Corridor, China. CATENA 2023, 220, 106728. [Google Scholar] [CrossRef]
  8. Wilting, H.C.; Schipper, A.M.; Bakkenes, M.; Meijer, J.R.; Huijbregts, M.A.J. Quantifying Biodiversity Losses Due to Human Consumption: A Global-Scale Footprint Analysis. Environ. Sci. Technol. 2017, 51, 3298–3306. [Google Scholar] [CrossRef]
  9. Bai, Z.G.; Dent, D.L.; Olsson, L.; Schaepman, M.E. Proxy global assessment of land degradation. Soil Use Manag. 2008, 24, 223–234. [Google Scholar] [CrossRef]
  10. Prince, S.D.; De Colstoun, E.B.; Kravitz, L.L. Evidence from rain-use efficiencies does not indicate extensive Sahelian desertification. Glob. Chang. Biol. 2004, 4, 359–374. [Google Scholar] [CrossRef]
  11. D’Odorico, P.; Bhattachan, A.; Davis, K.F.; Ravi, S.; Runyan, C.W. Global desertification: Drivers and feedbacks. Adv. Water. Resour. 2013, 51, 326–344. [Google Scholar] [CrossRef]
  12. Andela, N.; Liu, Y.Y.; Van Dijk, A.; De Jeu, R.A.M.; McVicar, T.R. Global changes in dryland vegetation dynamics (1988–2008) assessed by satellite remote sensing: Comparing a new passive microwave vegetation density record with reflective greenness data. Biogeosciences 2013, 10, 6657–6676. [Google Scholar] [CrossRef]
  13. Kassas, M. Desertification: A general review. J. Arid Environ. 1995, 30, 115–128. [Google Scholar] [CrossRef]
  14. Marland, G.; Pielke, R.A.; Apps, M.; Avissar, R.; Betts, R.A.; Davis, K.J.; Frumhoff, P.C.; Jackson, S.T.; Joyce, L.A.; Kauppi, P.; et al. The climatic impacts of land surface change and carbon management, and the implications for climate-change mitigation policy. Clim. Policy 2003, 3, 149–157. [Google Scholar] [CrossRef]
  15. Prince, S.; Von Maltitz, G.; Zhang, F.; Byrne, K.; Driscoll, C.; Eshel, G.; Kust, G.; Martínez-Garza, C.; Metzger, J.; Midgley, G. Status and trends of land degradation and restoration and associated changes in biodiversity and ecosystem functions. In Intergovernmental Science-Policy Platform on Biodiversity and Ecosystem Services (IPBES); Montanarella, L., Scholes, R.B.A., Eds.; IPBES: Bonn, Germany, 2018; pp. 221–338. [Google Scholar]
  16. Burrell, A.L.; Evans, J.P.; De Kauwe, M.G. Anthropogenic climate change has driven over 5 million km2 of drylands towards desertification. Nat. Commun. 2020, 11, 3853. [Google Scholar] [CrossRef]
  17. Horion, S.; Prishchepov, A.V.; Verbesselt, J.; de Beurs, K.; Tagesson, T.; Fensholt, R. Revealing turning points in ecosystem functioning over the Northern Eurasian agricultural frontier. Glob. Chang. Biol. 2016, 22, 2801–2817. [Google Scholar] [CrossRef]
  18. Wu, B.; Ci, L.J. Landscape change and desertification development in the Mu Us Sandland, Northern China. J. Arid Environ. 2002, 50, 429–444. [Google Scholar] [CrossRef]
  19. Zhang, X.Y.; Wang, X.; Yan, P. Re-evaluating the impacts of human activity and environmental change on desertification in the Minqin Oasis, China. Environ. Geol. 2008, 55, 705–771. [Google Scholar] [CrossRef]
  20. Ren, H.; Liu, Y.; Wen, Z.; Shi, H.; Zhou, R.; Wang, Z.; Kareem, H.A.; Zhang, W. Untangling the effects of climate variation and human interference on grassland dynamics in North China. Land Degrad. Dev. 2024, 35, 467–483. [Google Scholar] [CrossRef]
  21. Wang, J.; Cui, K.; Yang, F.; Li, J.; Zhang, C.; Du, T.; Zhang, H. Evaluation of spatiotemporal variation and impact factors for vegetation net primary productivity in a typical open-pit mining ecosystem in northwestern China. Land Degrad. Dev. 2024, 35, 3756–3770. [Google Scholar] [CrossRef]
  22. Chen, Y.; Xu, Y.; Chen, T.; Zhang, F.; Zhu, S. Exploring the Spatiotemporal Dynamics and Driving Factors of Net Ecosys-tem Productivity in China from 1982 to 2020. Remote Sens. 2024, 16, 60. [Google Scholar] [CrossRef]
  23. Herrmann, S.M.; Hutchinson, C.F. The changing contexts of the desertification debate. J. Arid Environ. 2005, 63, 538–555. [Google Scholar] [CrossRef]
  24. Rivera-Marin, D.; Dash, J.; Ogutu, B. The use of remote sensing for desertification studies: A review. J. Arid Environ. 2022, 206, 104829. [Google Scholar] [CrossRef]
  25. Xu, D.Y.; Li, C.L.; Song, X.; Ren, H.Y. The dynamics of desertification in the farming-pastoral region of North China over the past 10 years and their relationship to climate change and human activity. CATENA 2014, 123, 11–22. [Google Scholar] [CrossRef]
  26. Zhu, Z.C.; Piao, S.L.; Myneni, R.B.; Huang, M.T.; Zeng, Z.Z.; Canadell, J.G.; Ciais, P.; Sitch, S.; Friedlingstein, P.; Arneth, A.; et al. Greening of the Earth and its drivers. Nat. Clim. Chang. 2016, 6, 791–795. [Google Scholar] [CrossRef]
  27. Liu, Z.; Si, J.; Deng, Y.; Jia, B.; Li, X.; He, X.; Zhou, D.; Wang, C.; Zhu, X.; Qin, J.; et al. Assessment of Land Desertification and Its Drivers in Semi-Arid Alpine Mountains: A Case Study of the Qilian Mountains Region, Northwest China. Remote Sens. 2023, 15, 3836. [Google Scholar] [CrossRef]
  28. Song, X.P.; Hansen, M.C.; Stehman, S.V.; Potapov, P.V.; Tyukavina, A.; Vermote, E.F.; Townshend, J.R. Global land change from 1982 to 2016. Nature 2018, 560, 639–643. [Google Scholar] [CrossRef]
  29. Wang, C.H. Climate Change and Desertification; Chinese Meteorological Press: Beijing, China, 2003. [Google Scholar]
  30. Yang, X.; Zhang, K.; Jia, B.; Ci, L. Desertification assessment in China: An overview. J. Arid Environ. 2005, 63, 517–531. [Google Scholar] [CrossRef]
  31. State Forestry Administration of China. The Bulletin of Status Quo of Desertification and Sandification in China. State Forestry Administration of China (2000, 2005, 2010, 2015), Beijing, China. Available online: http://www.forestry.gov.cn/ (accessed on 3 October 2024).
  32. Zhang, C.X.; Wang, X.M.; Li, J.C.; Hua, T. Identifying the effect of climate change on desertification in northern China via trend analysis of potential evapotranspiration and precipitation. Ecol. Indic. 2020, 112, 106141. [Google Scholar] [CrossRef]
  33. Hua, D.; Hao, X.M. Spatiotemporal change and drivers analysis of desertification in the arid region of northwest China based on geographic detector. Environ. Chall. 2021, 4, 100082. [Google Scholar] [CrossRef]
  34. Wang, F.; Pan, X.B.; Wang, D.F.; Shen, C.Y.; Lu, Q. Combating desertification in China: Past, present and future. Land Use Policy 2013, 31, 311–313. [Google Scholar] [CrossRef]
  35. Wang, X.M.; Ge, Q.S.; Geng, X.; Wang, Z.S.; Gao, L.; Bryan, B.A.; Chen, S.Q.; Su, Y.N.; Cai, D.W.; Ye, J.S.; et al. Unintended consequences of combating desertification in China. Nat. Commun. 2023, 14, 1139. [Google Scholar] [CrossRef] [PubMed]
  36. Chen, W.; Lu, R.Y. A decadal shift of summer surface air temperature over Northeast Asia around the mid-1990s. Adv. Atmos. Sci. 2014, 31, 735–742. [Google Scholar] [CrossRef]
  37. Urabe, Y.; Maeda, S. The relationship between Japan’s recent temperature and decadal variability. Sci. Online Lett. Atmos. 2014, 10, 176–179. [Google Scholar] [CrossRef]
  38. Wei, K.; Chen, W. An abrupt increase in the summer high temperature extreme days across China in the mid-1990s. Adv. Atmos. Sci. 2011, 28, 1023–1029. [Google Scholar] [CrossRef]
  39. Li, B.F.; Chen, Y.N.; Chen, Z.S.; Xiong, H.G.; Lian, L.S. Why does precipitation in northwest China show a significant increasing trend from 1960 to 2010? Atmos. Res. 2016, 167, 275–284. [Google Scholar] [CrossRef]
  40. Xue, T.; Ding, Y.H.; Lu, C.H. Interdecadal Variability of Summer Precipitation in Northwest China and Associated Atmospheric Circulation Changes. J. Meteorol. Res. 2022, 36, 824–840. [Google Scholar] [CrossRef]
  41. Lyu, Y.L.; Shi, P.J.; Han, G.Y.; Liu, L.Y.; Guo, L.L.; Hu, X.; Zhang, G.M. Desertification Control Practices in China. Sustainability 2020, 12, 3258. [Google Scholar] [CrossRef]
  42. Wang, T.; Yan, C.Z.; Song, X.; Li, S. Landsat images reveal trends in the aeolian desertification in a source area for sand and dust storms in China’s Alashan plateau (1975–2007). Land Degrad. Dev. 2013, 24, 422–429. [Google Scholar] [CrossRef]
  43. Li, C.J.; Fu, B.J.; Wang, S.; Stringer, L.C.; Wang, Y.P.; Li, Z.D.; Liu, Y.X.; Zhou, W.X. Drivers and impacts of changes in China’s drylands. Nat. Rev. Earth Environ. 2021, 2, 858–873. [Google Scholar] [CrossRef]
  44. Xie, S.D.; Mo, X.G.; Hu, S.; Liu, S.X. Contributions of climate change, elevated atmospheric CO2 and human activities to ET and GPP trends in the Three-North Region of China. Agric. For. Meteorol. 2020, 295, 108183. [Google Scholar] [CrossRef]
  45. Duan, H.C.; Yan, C.Z.; Tsunekawa, A.; Song, X.; Li, S.; Xie, J.L. Assessing vegetation dynamics in the Three-North Shelter Forest region of China using AVHRR NDVI data. Environ. Earth Sci. 2011, 64, 1011–1020. [Google Scholar] [CrossRef]
  46. Schimel, D.S. Terrestrial biogeochemical cycles: Global estimates with remote sensing. Remote Sens. Environ. 1995, 51, 49–56. [Google Scholar] [CrossRef]
  47. Cai, D.W.; Wang, X.M.; Hua, T.; Jiao, L.L.; Geng, X. Baseline and status of desertification in Central Asia. Land Degrad. Dev. 2022, 33, 771–784. [Google Scholar] [CrossRef]
  48. Jackson, H.; Prince, S.D. Degradation of net primary production in a semiarid rangeland. Biogeosciences 2016, 13, 4721–4734. [Google Scholar] [CrossRef]
  49. Noojipady, P.; Prince, S.D.; Rishmawi, K. Reductions in productivity due to land degradation in the drylands of the southwestern united states. Ecosyst. Health Sustain. 2015, 1, 1–15. [Google Scholar] [CrossRef]
  50. Zika, M.; Erb, K.H. The global loss of net primary production resulting from human-induced soil degradation in drylands. Ecol. Econ. 2009, 69, 310–318. [Google Scholar] [CrossRef]
  51. Xu, X.L.; Liu, J.Y.; Zhang, S.W.; Li, R.D.; Yan, C.Z.; Wu, S.X. The multi-period land use land cover remote sensing monitoring dataset for China. Resour. Environ. Sci. Data Platform 2018. [Google Scholar] [CrossRef]
  52. Feng, F.; Wang, K.C. Merging High-Resolution Satellite Surface Radiation Data with Meteorological Sunshine Duration Observations over China from 1983 to 2017. Remote Sens. 2021, 13, 602. [Google Scholar] [CrossRef]
  53. Schiavina, M.; Freire, S.; Carioli, A.; MacManus, K. GHS-POP R2023A–GHS Population Grid Multitemporal (1975–2030); European Commission, Joint Research Centre, Publications Office of the European Union: Luxembourg, 2023. [Google Scholar] [CrossRef]
  54. Tu, Y.; Wu, S.; Chen, B.; Weng, Q.; Bai, Y.; Yang, J.; Yu, L.; and Xu, B. A 30 m annual cropland dataset of China from 1986 to 2021. Earth Syst. Sci. Data 2024, 16, 2297–2316. [Google Scholar] [CrossRef]
  55. Pinzon, J.E.; Tucker, C.J. A non-stationary 1981–2012 AVHRR NDVI3g time series. Remote Sens. 2014, 6, 6929–6960. [Google Scholar] [CrossRef]
  56. Beck, H.E.; McVicar, T.R.; van Dijk, A.I.; Schellekens, J.; de Jeu, R.A.; Bruijnzeel, L.A. Global evaluation of four AVHRR–NDVI data sets: Intercomparison and assessment against Landsat imagery. Remote Sens. Environ. 2011, 115, 2547–2563. [Google Scholar] [CrossRef]
  57. Zhang, Y.H.; Ye, A.Z. Spatial and temporal variations in vegetation coverage observed using AVHRR GIMMS and Terra MODIS data in the mainland of China. Int. J. Remote Sens. 2020, 41, 4238–4268. [Google Scholar] [CrossRef]
  58. Zheng, Y.; Shen, R.Q.; Wang, Y.W.; Li, X.Q.; Liu, S.G.; Chen, J.M.; Ju, W.M.; Zhang, L.; Yuan, W.P. Improved estimate of global gross primary production for reproducing its long-term variation, 1982–2017. Earth Syst. Sci. Data 2020, 12, 2725–2746. [Google Scholar] [CrossRef]
  59. Lv, G.; Li, X.; Fang, L.; Peng, Y.; Zhang, C.; Yao, J.; Ren, S.; Chen, J.; Men, J.; Zhang, Q.; et al. Disentangling the Influential Factors Driving NPP Decrease in Shandong Province: An Analysis from Time Series Evaluation Using MODIS and CASA Model. Remote Sens. 2024, 16, 1966. [Google Scholar] [CrossRef]
  60. Chen, B.; Jiapaer, G.; Yu, T.; Zhang, L.; Tu, H.; Liang, H.; Lin, K.; Ju, T.; Ling, Q. The role of climatic factor timing on grassland net primary productivity in Altay, Xinjiang. Ecol. Indic. 2023, 157, 111243. [Google Scholar] [CrossRef]
  61. Chen, F.H.; Chen, J.; Huang, W. Weakened East Asian summer monsoon triggers increased precipitation in Northwest China. Sci. China Earth Sci. 2021, 64, 835–837. [Google Scholar] [CrossRef]
  62. Field, C.B.; Randerson, J.T.; Malmström, C.M. Global net primary production: Combining ecology and remote sensing. Remote Sens. Environ. 1995, 51, 74–88. [Google Scholar] [CrossRef]
  63. Potter, C.S.; Randerson, J.T.; Field, C.B.; Matson, P.A.; Vitousek, P.M.; Mooney, H.; Klooster, S.A. Terrestrial ecosystem production: A process model based on global satellite and surface data. Glob. Biogeochem. Cycles 1993, 7, 811–841. [Google Scholar] [CrossRef]
  64. Li, Q.; Zhang, C.L.; Shen, Y.P.; Jia, W.R.; Li, J. Quantitative assessment of the relative roles of climate change and human activities in desertification processes on the Qinghai-Tibet Plateau based on net primary productivity. CATENA 2016, 147, 789–796. [Google Scholar] [CrossRef]
  65. Xu, D.Y.; Kang, X.W.; Liu, Z.L.; Zhuang, D.F.; Pan, J.J. Assessing the relative role of climate change and human activity in sandy desertification of Ordos region, China. Sci. China Ser. D Earth Sci. 2009, 56, 855–868. [Google Scholar] [CrossRef]
  66. Zhou, W.; Gang, C.C.; Zhou, F.C.; Li, J.L.; Dong, X.G.; Zhao, C.Z. Quantitative assessment of the individual contribution of climate and human factors to desertification in northwest China using net primary productivity as an indicator. Ecol. Indic. 2015, 48, 560–569. [Google Scholar] [CrossRef]
  67. Taylor, K.E. Summarizing multiple aspects of model performance in a single diagram. J. Geophys. Res. Atmos. 2001, 106, 7183–7192. [Google Scholar] [CrossRef]
  68. Lieth, H. Modeling the Primary Productivity of the World. In Primary Productivity of the Biosphere; Leith, H., Whittaker, R.H., Eds.; Springer: Berlin/Heidelberg, Germany, 1975; pp. 237–263. [Google Scholar] [CrossRef]
  69. Lieth, H.; Box, E. Evapotranspiration and primary productivity: C.W. Thornthwaite Memorial Model. Publ. Climatol. 1972, 25, 37–46. [Google Scholar]
  70. Jolliffe, I.T. Principal component analysis: A beginner’s guide—I. Introduction and application. Weather 1990, 45, 375–382. [Google Scholar] [CrossRef]
  71. North, G.R.; Bell, T.L.; Cahalan, R.F.; Moeng, F.J. Sampling errors in the estimation of empirical orthogonal function. Mon. Weather Rev. 1982, 110, 699–706. [Google Scholar] [CrossRef]
  72. Na, R.; Du, H.; Na, L.; Shan, Y.; He, H.S.; Wu, Z.; Zong, S.; Yang, Y.; Huang, L. Spatiotemporal changes in the Aeolian desertification of Hulunbuir Grassland and its driving factors in China during 1980–2015. CATENA 2019, 182, 104123. [Google Scholar] [CrossRef]
  73. Wang, T.; Song, X.; Yan, C.Z.; Li, S.; Xie, J.L. Remote sensing analysis on aeolian desertification trends in Northern China during 1975—2010. J. Desert Res. 2011, 31, 1351–1356. [Google Scholar]
  74. Xie, J.L.; Lu, Z.X.; Feng, K. Effects of climate change and human activities on aeolian desertification reversal in mu us Sandy land, China. Sustainability 2022, 14, 1669. [Google Scholar] [CrossRef]
  75. Guo, H.; Xu, M.; Hu, Q. Changes in near-surface wind speed in China: 1969–2005. Int. J. Climatol. 2011, 31, 349–358. [Google Scholar] [CrossRef]
  76. Hansen, J.; Ruedy, R.; Sato, M.; Lo, K. Global surface temperature change. Rev. Geophys. 2010, 48, RG4004. [Google Scholar] [CrossRef]
  77. Ma, S.M.; Zhou, T.J.; Dai, A.G.; Han, Z.Y. Observed Changes in the Distributions of Daily Precipitation Frequency and Amount over China from 1960 to 2013. J. Clim. 2015, 28, 6960–6978. [Google Scholar] [CrossRef]
  78. Wang, T. The progress of research on aeolian desertification. Bull. Chin. Acad. Sci. 2009, 24, 290–296. [Google Scholar] [CrossRef]
  79. Wang, T. Aeolian desertification and its control in Northern China. Int. Soil Water Conserv. Res. 2014, 2, 34–41. [Google Scholar] [CrossRef]
  80. Liu, Y.; Liu, R.G.; Chen, J.M. Retrospective retrieval of long-term consistent global leaf area index (1981–2011) from combined AVHRR and MODIS data. J. Geophys. Res. Biogeosci. 2012, 117, G04003. [Google Scholar] [CrossRef]
  81. Piao, S.L.; Wang, X.H.; Park, T.; Chen, C.; Lian, X.; He, Y.; Bjerke, J.W.; Chen, A.P.; Ciais, P.; Tømmervik, H.; et al. Characteristics, drivers and feedbacks of global greening. Nat. Rev. Earth Environ. 2020, 1, 14–27. [Google Scholar] [CrossRef]
  82. Duan, H.C.; Wang, T.; Xue, X.; Yan, C.Z. Dynamic monitoring of aeolian desertification based on multiple indicators in Horqin Sandy Land, China. Sci. Total Environ. 2019, 650, 2374–2388. [Google Scholar] [CrossRef]
  83. Gou, F.; Liang, W.; Sun, S.B.; Jin, Z.; Zhang, W.B.; Yan, J.W. Analysis of the desertification dynamics of sandy lands in Northern China over the period 2000–2017. Geocarto. Int. 2021, 36, 1938–1959. [Google Scholar] [CrossRef]
  84. Zhang, C.X.; Wang, X.M.; Li, J.C.; Zhang, Z.C.; Zheng, Y. The impact of climate change on aeolian desertification in northern China: Assessment using aridity index. CATENA 2021, 207, 105681. [Google Scholar] [CrossRef]
  85. Austin, A.T.; Yahdjian, L.; Stark, J.M.; Belnap, J.; Porporato, A.; Norton, U.; Ravetta, D.A.; Schaeffer, S.M. Water pulses and biogeochemical cycles in arid and semiarid ecosystems. Oecologia 2004, 141, 221–235. [Google Scholar] [CrossRef]
  86. Seneviratne, S.I.; Corti, T.; Davin, E.L.; Hirschi, M.; Jaeger, E.B.; Lehner, I.; Orlowsky, B.; Teuling, A.J. Investigating soil moisture–climate interactions in a changing climate: A review. Earth Sci. Rev. 2010, 99, 125–161. [Google Scholar] [CrossRef]
  87. Hassani, A.; Azapagic, A.; Shokri, N. Global predictions of primary soil salinization under changing climate in the 21st century. Nat. Commun. 2021, 12, 6663. [Google Scholar] [CrossRef]
  88. Ma, X.F.; Zhao, C.Y.; Tao, H.; Zhu, J.T.; Kundzewicz, Z.W. Projections of actual evapotranspiration under the 1.5 °C and 2.0 °C global warming scenarios in sandy areas in northern China. Sci. Total Environ. 2018, 645, 1496–1508. [Google Scholar] [CrossRef]
  89. Bekchanov, M.; Lamers, J.P.A.; Martius, C. Pros and Cons of Adopting Water-Wise Approaches in the Lower Reaches of the Amu Darya: A Socio-Economic View. Water 2010, 2, 200–216. [Google Scholar] [CrossRef]
  90. Gu, Y.Y.; Pang, B.; Qiao, X.N.; Xu, D.L.; Li, W.J.; Yan, Y.; Dou, H.S.; Ao, W.; Wang, W.L.; Zou, C.X.; et al. Vegetation dynamics in response to climate change and human activities in the Hulun Lake basin from 1981 to 2019. Ecol. Indic. 2022, 136, 108700. [Google Scholar] [CrossRef]
  91. Ye, J.S.; Delgado-Baquerizo, M.; Soliveres, S.; Maestre, F.T. Multifunctionality debt in global drylands linked to past biome and climate. Glob. Chang. Biol. 2019, 25, 2152–2161. [Google Scholar] [CrossRef]
  92. Piao, S.L.; Tan, K.; Nan, H.J.; Ciais, P.; Fang, J.Y.; Wang, T.; Vuichard, N.; Zhu, B. Impacts of climate and CO2 changes on the vegetation growth and carbon balance of Qinghai-Tibetan grasslands over the past five decades. Glob. Planet. Chang. 2012, 98, 73–80. [Google Scholar] [CrossRef]
  93. Chen, B.X.; Zhang, X.Z.; Tao, J.; Wu, J.S.; Wang, J.S.; Shi, P.L.; Zhang, Y.J.; Yu, C.Q. The impact of climate change and anthropogenic activities on alpine grassland over the Qinghai-Tibet Plateau. Agric. For. Meteorol. 2014, 189, 11–18. [Google Scholar] [CrossRef]
  94. Yang, J.T.; Yang, K.; Wang, C.H. How desertification in northern China will change under a rapidly warming climate in the near future (2021–2050). Theor. Appl. Climatol. 2023, 151, 935–948. [Google Scholar] [CrossRef]
  95. Jin, Y.Q.; Li, J.; Liu, C.G.; Liu, Y.T.; Zhang, Y.P.; Song, Q.H.; Sha, L.Q.; Chen, A.G.; Yang, D.X.; Li, P.G. Response of net primary productivity to precipitation exclusion in a savanna ecosystem. For. Ecol. Manag. 2018, 429, 69–76. [Google Scholar] [CrossRef]
  96. Yue, D.X.; Zhou, Y.Y.; Guo, J.J.; Chao, Z.Z.; Guo, X.J. Relationship between net primary productivity and soil water content in the Shule River Basin. Catena 2022, 208, 105770. [Google Scholar] [CrossRef]
  97. Briggs, J.M.; Knapp, A.K. Interannual variability in primary production in tallgrass prairie: Climate, soil moisture, topographic position, and fire as determinants of aboveground biomass. Am. J. Bot. 1995, 82, 1024–1030. [Google Scholar] [CrossRef]
  98. Shi, Z.G.; Zhou, P.; Li, X.Z.; Cheng, H.; Sha, Y.Y.; Xie, X.N.; Liu, H.; Wu, J.; Liu, X.D. Distinct Holocene precipitation trends over arid Central Asia and linkages to westerlies and Asian monsoon. Quat. Sci. Rev. 2021, 266, 107055. [Google Scholar] [CrossRef]
  99. Feng, L.; Zhou, T.J. Water vapor transport for summer precipitation over the Tibetan Plateau: Multidata set analysis. J. Geophys. Res. Atmos. 2012, 117, D20114. [Google Scholar] [CrossRef]
  100. Zhang, C.; Tang, Q.H.; Chen, D.L. Recent Changes in the Moisture Source of Precipitation over the Tibetan Plateau. J. Clim. 2017, 30, 1807–1819. [Google Scholar] [CrossRef]
  101. Zhang, G.W.; Zeng, G.; Li, C.; Yang, X.Y. Impact of PDO and AMO on interdecadal variability in extreme high temperatures in North China over the most recent 40-year period. Clim. Dyn. 2020, 54, 3003–3020. [Google Scholar] [CrossRef]
  102. Chen, F.H.; Xie, T.T.; Yang, Y.J.; Chen, S.Q.; Chen, F.; Huang, W.; Chen, J. Discussion of the “warming and wetting” trend and its future variation in the drylands of Northwest China under global warming. Sci. China Earth Sci. 2023, 66, 1241–1257. [Google Scholar] [CrossRef]
  103. Ding, Q.H.; Wang, B. Circumglobal teleconnection in the Northern Hemisphere summer. J. Clim. 2005, 18, 3483–3505. [Google Scholar] [CrossRef]
  104. Huang, W.; Chen, J.H.; Zhang, X.J.; Feng, S.; Chen, F.H. Definition of the core zone of the “westerlies-dominated climatic regime”, and its controlling factors during the instrumental period. Sci. China Earth Sci. 2015, 58, 676–684. [Google Scholar] [CrossRef]
  105. Chen, J.; Huang, W.; Zhang, Q.; Feng, S. Origin of the spatial consistency of summer precipitation variability between the Mongolian Plateau and the mid-latitude East Asian summer monsoon region. Sci. China Earth Sci. 2020, 63, 1199–1208. [Google Scholar] [CrossRef]
  106. Ma, Q.R.; Zhang, J.; Game, A.T.; Chang, Y.; Li, S.S. Spatiotemporal variability of summer precipitation and precipitation extremes and associated large-scale mechanisms in Central Asia during 1979–2018. J. Hydro. X. 2020, 8, 100061. [Google Scholar] [CrossRef]
  107. Sang, Y.F.; Fu, Q.; Singh, V.P.; Sivakumar, B.; Zhu, Y.X.; Li, X.X. Does summer precipitation in China exhibit significant periodicities? J. Hydrol. 2020, 581, 124289. [Google Scholar] [CrossRef]
  108. Wu, P.; Liu, Y.J.; Ding, Y.H.; Li, X.C.; Wang, J. Modulation of sea surface temperature over the North Atlantic and Indian-Pacific warm pool on interdecadal change of summer precipitation over northwest China. Int. J. Climatol. 2022, 42, 8526–8538. [Google Scholar] [CrossRef]
  109. Yang, Q.; Ma, Z.G.; Fan, X.G.; Yang, Z.L.; Xu, Z.F.; Wu, P.L. Decadal Modulation of Precipitation Patterns over Eastern China by Sea Surface Temperature Anomalies. J. Clim. 2017, 30, 7017–7033. [Google Scholar] [CrossRef]
  110. Ding, Y.H.; Wu, P.; Liu, Y.J. Modulation of sea surface temperature in three oceans on precipitation increase over Northwest China during the past 60 years: A review. Front. Clim. 2022, 4, 1015225. [Google Scholar] [CrossRef]
  111. Bryan, B.A.; Gao, L.; Ye, Y.Q.; Sun, X.F.; Connor, J.D.; Crossman, N.D.; StaffordSmith, M.; Wu, J.G.; He, C.Y.; Yu, D.Y.; et al. China’s response to a national land-system sustainability emergency. Nature 2018, 559, 193–204. [Google Scholar] [CrossRef] [PubMed]
  112. Wang, Q.; Zhang, B.; Zhang, Z.Q.; Zhang, X.F.; Dai, S.P. The Three-North Shelterbelt Program and dynamic changes in vegetation cover. J. Resour. Ecol. 2014, 5, 53–59. [Google Scholar] [CrossRef]
  113. Gao, X.H.; Wang, Y.M.; Wang, J.H.; Yan, C.Z.; Li, Z.F. Analysis on desertification dynamics based on remote sensing and GIS in zone along the Great Wall in northern Shaanxi province. J. Desert Res. 2005, 25, 63–67. [Google Scholar]
  114. Yan, Q.L.; Zhu, J.J.; Hu, Z.B.; Sun, O.J. Environmental impacts of the shelter forests in Horqin Sandy Land, Northeast China. J. Environ. Qual. 2011, 40, 815–824. [Google Scholar] [CrossRef]
  115. Cao, J.J.; Zhang, X.F.; Deo, R.; Gong, Y.F.; Feng, Q. Influence of stand type and stand age on soil carbon storage in China’s arid and semi-arid regions. Land Use Policy. 2018, 78, 258–265. [Google Scholar] [CrossRef]
  116. Li, J.Y.; Xu, B.; Yang, X.C.; Qin, Z.H.; Zhao, L.N.; Jin, Y.X.; Zhao, F.; Guo, J. Historical grassland desertification changes in the Horqin Sandy Land, Northern China (1985–2013). Sci. Rep. 2017, 7, 3009. [Google Scholar] [CrossRef]
  117. Yi, Y.; Shi, M.C.; Wu, J.; Yang, N.; Zhang, C.; Yi, X.D. Spatio-Temporal Patterns and Driving Forces of Desertification in Otindag Sandy Land, Inner Mongolia, China, in Recent 30 Years. Remote Sens. 2022, 15, 279. [Google Scholar] [CrossRef]
  118. Li, R.; Wu, Q.; Li, X.; Sheng, Y.; Hu, G.; Cheng, G.; Wu, X. Characteristic, changes and impacts of permafrost on Qinghai-Tibet Plateau. Chin. Sci. Bull. 2019, 64, 2783–2795418. [Google Scholar] [CrossRef]
  119. Chang, Q.; Xie, B. Vegetation of Dynamics and Climate Change of the Loess Plateau; Science Press: Beijing, China, 2019. [Google Scholar]
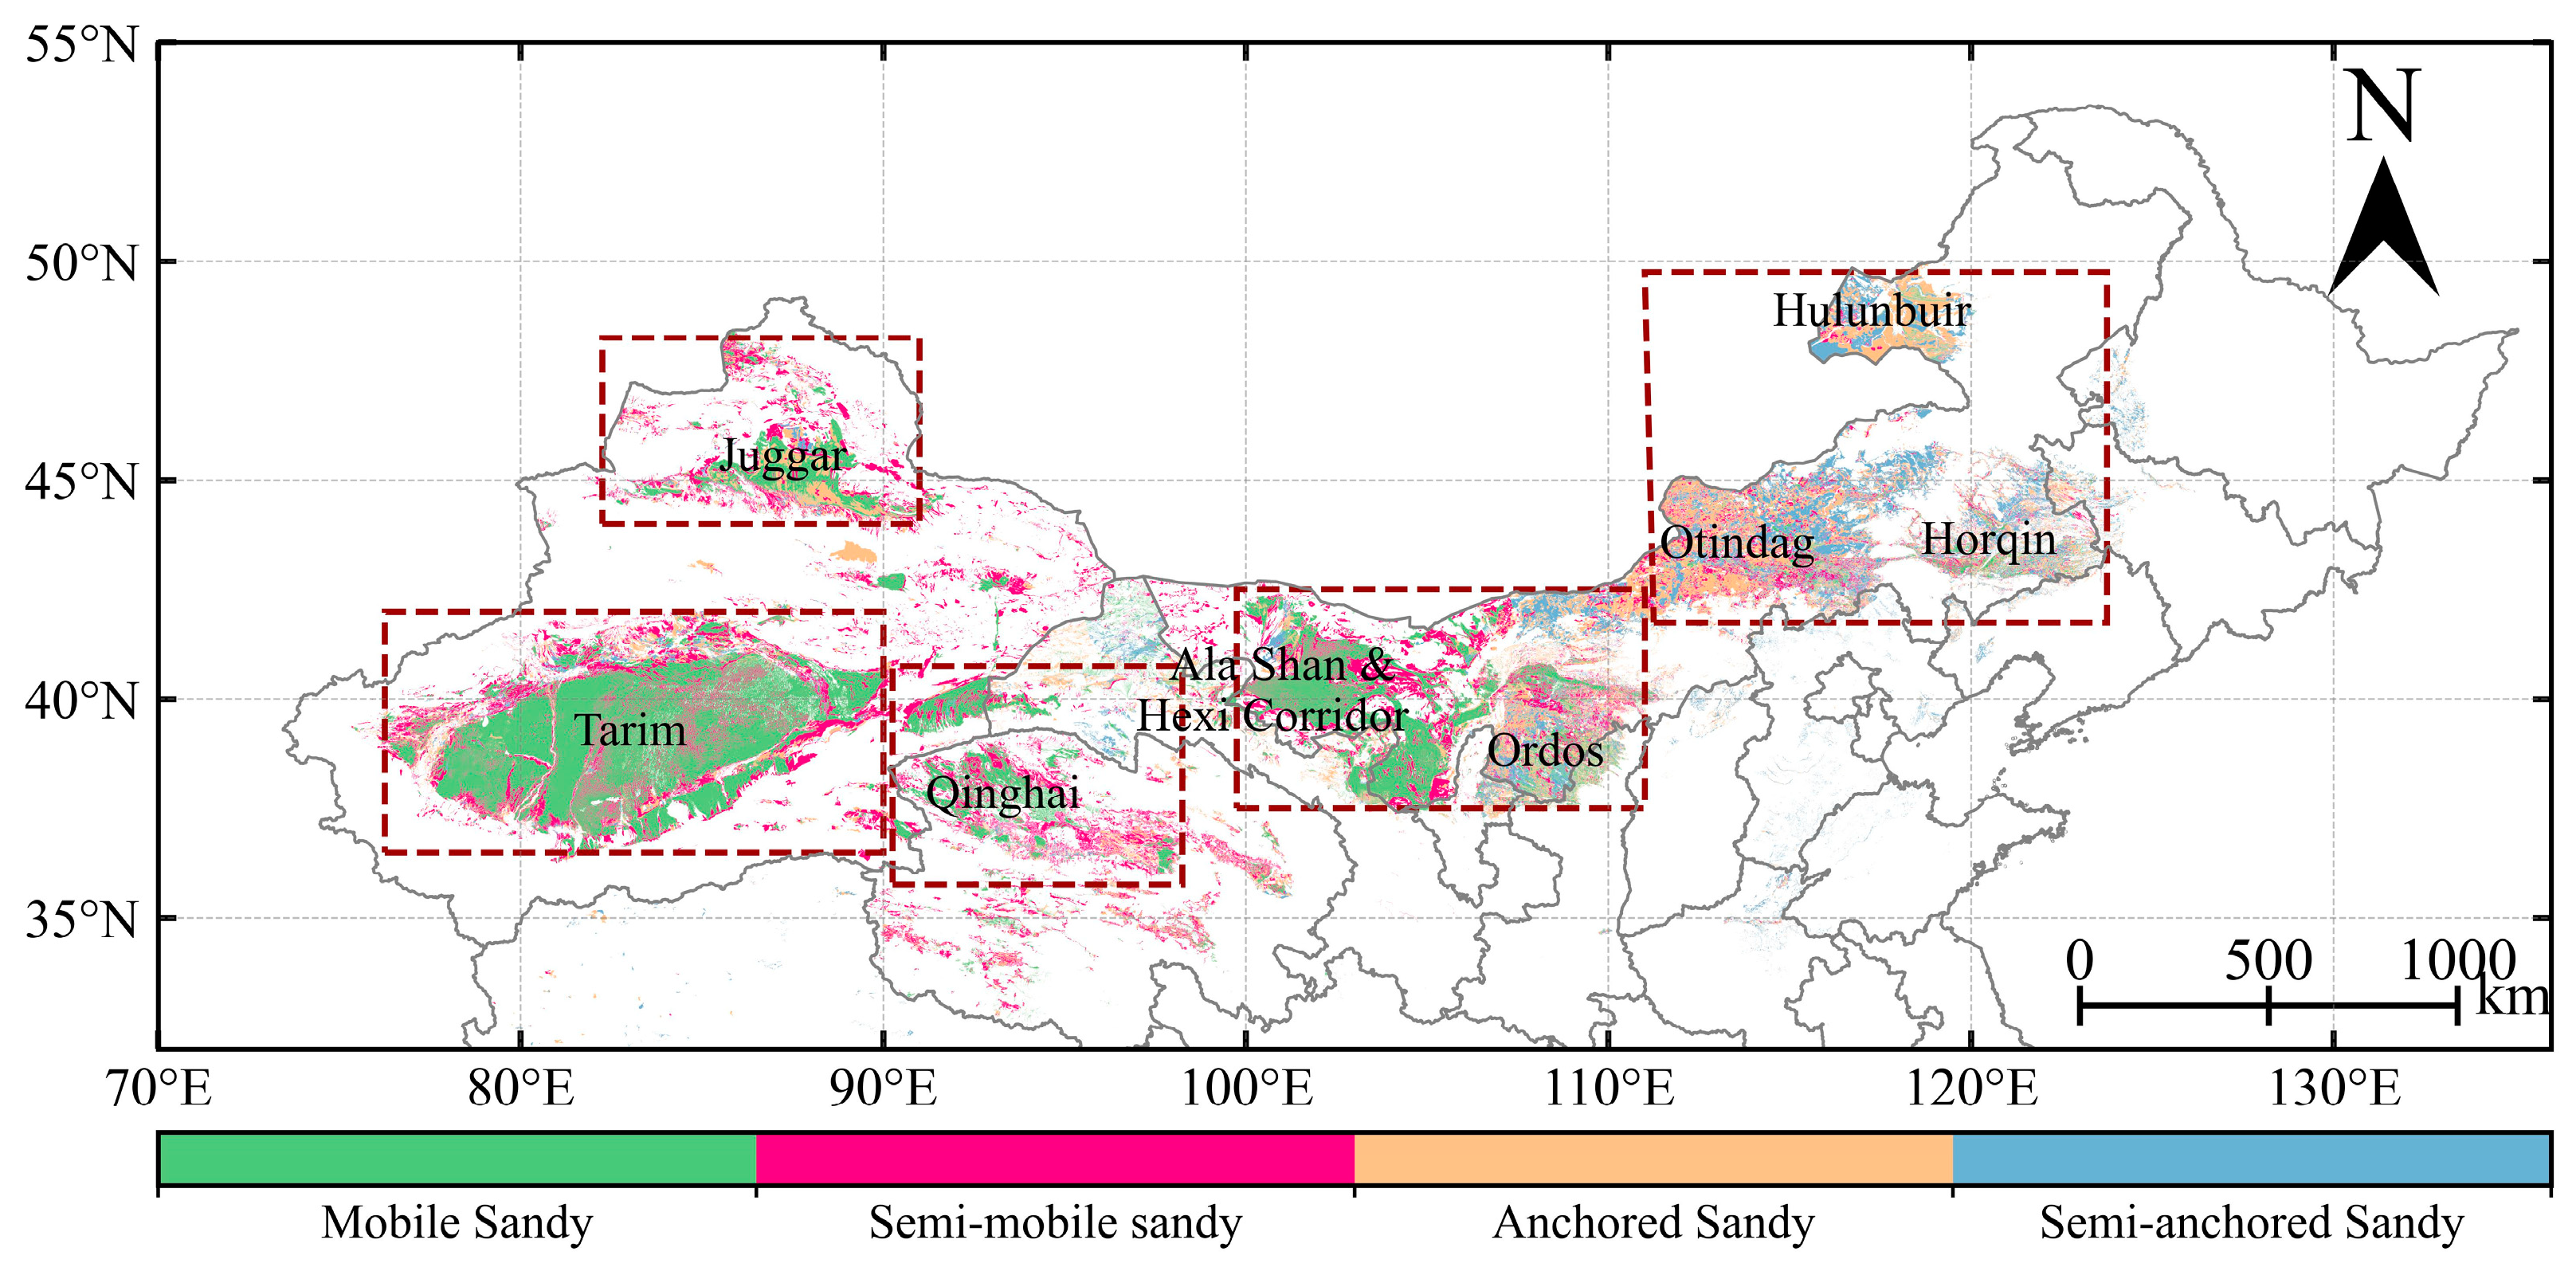
Figure 1. Location and subregions of the desertification-prone region (DPR) in NC.
Remotesensing 16 03706 g001
Figure 2. Spatial distributions of the annual mean (A) NPP from the GLASS, (B) ANPP, (C) PNPP, and (D) HNPP. All values are averages during the period from 1984 to 2014.
Remotesensing 16 03706 g002
Figure 3. Spatial distributions of the linear trends for (A) NPP from the GLASS, (B) ANPP, (C) PNPP, and (D) HNPP during the period from 1984 to 2014. The black dots represent grid values that are significant at the 95% confidence level.
Remotesensing 16 03706 g003
Figure 4. Different factors (human activity, climate drivers, and both) affected the (A) mitigation and (B) exacerbation of desertification during the period from 1984 to 2014. The inset figures in (A,B) represent the total areas of desertification mitigation and exacerbation, respectively, and the pie charts represent the contributions of each factor.
Remotesensing 16 03706 g004
Figure 5. First leading mode of EOF (EOF1) for NPP in NC. (A) Spatial pattern of loading vectors. (B) Principal component (PC1) of EOF1.
Remotesensing 16 03706 g005
Figure 6. The spatial pattern of the linear trends (slopes) for (A) NPP, (B) ANPP, (C) PNPP, and (D) HNPP during the periods of (A,C,E,G) 1984-2000 and (B,D,F,H) 2001–2014. The numbers indicate the trends of the corresponding regional averages, with red representing a positive trend and blue representing a negative trend. ***, **, and * indicate 99%, 95%, and 90% confidence levels, respectively. The black dots represent grid values that are significant at the 95% confidence level.
Remotesensing 16 03706 g006
Figure 7. Different factors (human activity, climate drivers, and both) affected the mitigation and exacerbation of desertification (top,middle top) from 1984 to 2000 and (middle bottom,bottom) from 2001 to 2014. The inset figures represent the total areas of desertification mitigation and exacerbation, and the pie charts represent the contributions of each factor.
Remotesensing 16 03706 g007
Figure 8. Attributions of desertification in the DPR to climate factors from 1984 to 2014. (A) The contribution of precipitation (P) to PNPP change, (B) the sensitivity of PNPP to P, and (C) mean changes (Δ) in P (1984–2014). (DF) and (GI) are the same as (AC) but for evapotranspiration (E) and temperature (T).
Remotesensing 16 03706 g008
Figure 9. Spatial distributions of specific humidity (A,B), water vapor flux divergence (shading) and horizontal wind (vectors) (C,D), and their regressions against the precipitation series at 850 hPa (left line) and 500 hPa (right line). The black slashes and blue vectors represent grid values that are significant at the 90% confidence level. The dashed boxes are the different areas in the DPR.
Remotesensing 16 03706 g009
Figure 10. Serial histograms of (A) annual mean PDO and (B) AMO.
Remotesensing 16 03706 g010
Figure 11. The population and cropland changes in the DPR. (A) The entire DPR; (B) Juggar; (C) Tarim; (D) Qinghai; (E) Ala Shan, Hexi Corridor, and Ordos; and (F) Hulunbuir, Otindag, and Horqin. The blue line represents the population and the red line represents the percentage of the cropland area.
Remotesensing 16 03706 g011
Table 1. Data information.
DataSourceSpatial
Resolution
Temporal
Resolution
NDVIAdvanced Very High-Resolution Radiometer (AVHRR)1/12°15 days
Land cover The multi-period land-use land cover remote sensing monitoring dataset for China [51]30 m-
Solar radiationHigh spatial resolution (10 km) surface solar radiation dataset with by merging sunshine hours over China [52]10 kmMonthly
PrecipitationThe Global Precipitation Climatology Centre0.25°Monthly
EvapotranspirationThe Global Land Evaporation Amsterdam Model (GLEAM)0.25°Monthly
Wind speedThe European Centre for Medium-Range Weather Forecasts Reanalysis v5 (ERA5)0.25°Monthly
Near-surface air temperature
Potential
evapotranspiration
NPP (for validate)The Global Land Surface Satellite (GLASS)500 m8 days
Pacific Decadal Oscillation (PDO) indexThe National Centers for Environmental Information-Monthly
Atlantic Multidecadal Oscillation (AMO) index
PopulationThe Global Human Settlement Layer (GHSL) [53]30″5 years
CroplandThe 30 m annual cropland dataset of China [54]30 mYearly
Table 2. Criteria determining the impacts of climate drivers and human activity, both individually and in combination, on the mitigation and exacerbation of desertification.
Desertification TrendSANPPSPNPPSHNPPDominant Factors
Mitigation>0<0<0Human activity
>0>0Climate drivers
>0<0Two factors
Exacerbation<0<0<0Climate drivers
>0>0Human activity
<0>0Two factors
Disclaimer/Publisher’s Note: The statements, opinions and data contained in all publications are solely those of the individual author(s) and contributor(s) and not of MDPI and/or the editor(s). MDPI and/or the editor(s) disclaim responsibility for any injury to people or property resulting from any ideas, methods, instructions or products referred to in the content.