Article

Coastal Vulnerability Index (CVI) Assessment: Evaluating Risks Associated with Human-Made Activities along the Limassol Coastline, Cyprus

by
Christos Theocharidis
1,2,*,
Marina Doukanari
1,2,
Eleftheria Kalogirou
1,2,
Demetris Christofi
1,2,
Christodoulos Mettas
1,2,
Charalampos Kontoes
3,
Diofantos Hadjimitsis
1,2,
Athanasios V. Argyriou
4 and
Marinos Eliades
1
1
ERATOSTHENES Centre of Excellence, 3012 Limassol, Cyprus
2
Department of Civil Engineering and Geomatics, Faculty of Engineering and Technology, Cyprus University of Technology, 3036 Limassol, Cyprus
3
National Observatory of Athens, Operational Unit BEYOND Centre for Earth Observation Research and Satellite Remote Sensing IAASARS/NOA, 15236 Athens, Greece
4
Laboratory of Geophysics-Satellite Remote Sensing & Archaeoenvironment (GeoSat ReSeArch Lab), Institute for Mediterranean Studies, Foundation for Research and Technology (FORTH)-Hellas, 74100 Rethymno, Greece
*
Author to whom correspondence should be addressed.
Remote Sens. 2024, 16(19), 3688; https://doi.org/10.3390/rs16193688
Submission received: 23 August 2024 / Revised: 25 September 2024 / Accepted: 1 October 2024 / Published: 3 October 2024
(This article belongs to the Section Environmental Remote Sensing)

Abstract

:
Coastal risk assessment is crucial for coastal management and decision making, especially in areas already experiencing the negative impacts of climate change. This study aims to investigate the coastal vulnerability due to climate change and human activities in an area west of the Limassol district’s coastline, in Cyprus, on which there have been limited studies. Furthermore, an analysis is conducted utilising the Coastal Vulnerability Index (CVI) by exploiting eight key parameters: land cover, coastal slope, shoreline erosion rates, tidal range, significant wave height, coastal elevation, sea-level rise, and coastal geomorphology. These parameters were assessed utilising remote sensing (RS) data and Geographical Information Systems (GISs) along a 36.1 km stretch of coastline. The results exhibited varying risk levels of coastal vulnerability, mainly highlighting a coastal area where the Kouris River estuary is highly vulnerable. The study underscores the need for targeted coastal management strategies to address the risks associated with coastal erosion. Additionally, the CVI developed in this study can be exploited as a tool for decision makers, empowering them to prioritise areas for intervention and bolster the resilience of coastal areas in the face of environmental changes.

1. Introduction

Over the past century, coastal areas have become increasingly attractive [1], prompting more individuals to select coastal regions as prime locations for establishing businesses or residences. It is calculated that 45–60% of the global population resides within coastal zones, highlighting the significant human presence in these areas [2,3]. Consequently, populations and infrastructure are now more vulnerable to coastal hazards, such as coastal erosion and submerged features [1], leading to increased costs for protective measures.
Coastal erosion represents a multifaceted and continuously evolving phenomenon influenced by numerous factors such as climate change, anthropogenic activities, and natural processes [4]. The scale and magnitude of coastal vulnerability can threaten socio-economic communities near shorelines [5]. Globally, due to their dynamic nature, shorelines are susceptible to various indicators that vary in quality and quantity. Practical tools such as coastal monitoring and vulnerability assessments are crucial for decision makers to understand the diverse effects of natural factors and determine the susceptibility status of specific areas [3].
The development of remote sensing (RS) methods and the increased availability of Earth Observation (EO) data have delivered unique prospects for enhancing coastal monitoring capabilities. Ground observations for monitoring coastal vulnerability can be arduous, expensive, and ineffective in terms of both the area covered and the time taken. In contrast, satellite remote sensing offers observations of coastal regions on a large scale, both in terms of spatial and temporal dimensions [6]. This enables the extraction of substantial data regarding various processes, including sediment transport, erosion rates, and shoreline evolution. Additionally, building on these state-of-the-art technological developments and tools, the ongoing development of machine learning and Artificial Intelligence (AI) and other automatic classification algorithms has significantly improved the identification of coastal features and patterns, allowing for real-time information regarding coastal conditions. However, AI algorithms can sometimes produce inaccurate results due to biases in training data or other limitations in the algorithms themselves, making the traditional coastal monitoring algorithms more reliable in many cases [7].
Incorporating RS data into Geographic Information System (GIS) software can provide crucial analyses for coastal monitoring. These systems have been extensively utilised for coastal monitoring due to their enhanced geospatial processing capabilities [8,9]. GIS algorithms and tools can create weighted and combined indexes, resulting in the Coastal Vulnerability Index (CVI) [10,11,12,13]. This index is evaluated using Multi-Criteria Decision Analysis (MCDA) methods by implementing weighted criteria to establish a comprehensive framework and highlight areas more prone to hazards. This multi-criteria approach evaluates indicators based on physical factors such as coastal slope, geomorphology, and historical shoreline changes. Incorporating these parameters of each indicator into an MCDA framework allows coastal managers to evaluate the importance of the CVI and the impact of each parameter on the vulnerability index, considering both spatial and temporal resolutions [3]. One of the most effective methods within the MCDA framework [14] is the Analytic Hierarchy Process (AHP) [15]. The AHP is a methodical approach [1] used to organise and evaluate intricate decision-making processes. It enables the division of a complicated problem into its components and the creation of a hierarchy of simpler sub-problems that may be analysed separately. The AHP offers a thorough assessment of coastal vulnerability by assigning weights to each element—criterion—based on its relative significance and then combining these weights. Various factors influence the selection of these criteria, and their weights can differ for each location. Cruz-Ramírez et al. [16] conducted a comprehensive review of 60 vulnerability studies spanning 29 years, focusing on the most frequently used parameters in coastal vulnerability assessments. Their analysis highlighted that these parameters include coastal slope, geomorphology, historical shoreline changes, and other critical factors. Thus, the choice and ranking of each criterion can be determined by a literature review and marine scientific experts with expertise in the case study’s location.
This method enhances the precision and reliability of vulnerability assessments, making it a valuable tool for coastal managers [17]. Vulnerability assessment is critical for developing coastal strategies to address risks, especially in islands with pronounced effects [18], such as Cyprus. This study aimed to investigate the coastal vulnerability of the Limassol district in Cyprus, specifically focusing on the risks associated with coastal erosion. By applying a CVI through Multi-Criteria Decision Analysis (MCDA), the study seeks to provide a comprehensive understanding of how various factors, such as land cover, coastal slope, erosion rates, tidal range, wave height, elevation, sea-level rise, and coastal geomorphology, contribute to the overall vulnerability of the region’s coastline. This study identifies the most vulnerable areas along the 36.1 km coastline and offers critical insights to improve future coastal management strategies. The present and future necessity of developing new policies for environmental management within the area is a key focus of this research, as current policies may not adequately address the evolving risks posed by climate change and human activities. Additionally, the study seeks to enhance the resilience of the Limassol coastline by providing data-driven recommendations for mitigating the impacts of both natural and human factors, ultimately contributing to the development of more effective and sustainable coastal protection measures.

2. Study Area

The coastal area is located within a grid system that was created to define the study area from the west side of the Akrotiri Peninsula (F1 grid cell) to the Pissouri area (B1 grid cell) inside the border of the Limassol district on the southern coast of Cyprus (Figure 1). The studied coastline, washed by the Mediterranean Sea, spans approximately 36.1 km. According to ESRI demographic data [19], the population within the grid cells covering this area is about 762 people, with 319 households. Various formations characterise the geomorphological and textural diversity of the study area. According to the Geological Survey Department [20], the coastal texture in the study area is characterised mainly by rocky shorelines interspersed with beaches composed of cobbles and fine sands. These rocky shorelines are more resistant to erosion due to the durability of the rock material.
In contrast, sandy beaches are more dynamic, shaped by wave and current action, and are more prone to erosion [21]. Loam and clay deposits are present inland from the coastline and do not constitute beach material but influence the surrounding geomorphology. While less dynamic, these inland features can indirectly affect sediment transport processes and coastal erosion. Moreover, the coastline geology extending from the B1-F1 grid cell is characterised by cliffs and rocky pavements in most cases, predominantly composed of Nicosia and Pachna formations (e.g., chalks, marls, limestone, shale, and gypsum), alluvium–colluvium, and marine and fluvial deposits. For more detailed information about these geological types, please refer to [22]. Overall, this coastline presents a complex and dynamic coastal system whose vulnerability to coastal processes is influenced by various factors, which are analysed below in Section 3.

3. Materials and Methods

The CVI was utilised to assess the coastal vulnerability factors and integrate all the information representing coastal erosion. The CVI was developed by Thieler and Hammar-Klose [23] as an essential tool to explore and identify various environmental factors contributing to coastal erosion. The CVI considers various factors divided into typological groups, such as geological factors, physical processes, and vegetation [24]. Generally, the most commonly used factors [25] are based on the typological groups, including geological factors (e.g., geomorphology, shoreline erosion/accretion rates, coastal slope, beach, and dune width); hydro-physical factors (e.g., relative sea-level rise, mean significant wave height, mean tidal range, storm surge, and number of extreme events); and vegetation factors (e.g., width of vegetation behind the beach and seagrass presence). Of course, except for the three typological groups, socio-economic parameters (e.g., population density, age of inhabitants, and land use/land cover) have also been utilised in different studies [26,27]. The number of parameters differs significantly from one study to another, making it challenging to create a universal CVI, mainly due to the complexity of global coastal characteristics and different research approaches; hence, some parameters and ranks cannot be directly applied to all circumstances. Therefore, modifications to the CVI may be required to calculate the vulnerability in specific coasts, as in this study, where, although the coastal characteristics were ranked according to the USGS methodology [28], some changes and additions were made to capture the Limassol coastal characteristics.
Figure 2 briefly presents the flow chart of the methodology by which the CVI was created. The parameters utilised for the CVI calculations were dynamic and varied in resolution, since they were derived from different sources. For parameters involving marine information, interpolation was necessary to cover the entire coastline of the study, as there were gaps in some areas due to the low resolution of the data. The rasters were then converted into points and spatially joined with the transects created by the Digital Shoreline Analysis System (DSAS), a crucial step that eventually led to the creation of the CVI map and 27 shoreline grids with a size of 1.5 × 1.5 km2 for better data visualisation and analysis. Further information about the data is discussed in the following sub-sections. This study selected eight parameters to calculate the CVI: land cover, coastal slope, rate of coastline erosion, mean tidal range, mean significant wave height, coastal elevation, relative sea-level rise, and coastal geomorphology. More information and justifications for selecting each parameter are given in the following sections. Table 1 gives information about the data and sources for each factor used to calculate the CVI and the processing steps conducted in the ArcGIS Pro (version 3.3) and DSAS software (version 6.0).

3.1. Land Use/Land Cover

“Land use” encompasses various human land utilisations, including urban development and vegetation. This parameter is crucial, as different land-cover types, such as vegetation and urban areas, vary in terms of protectability against erosion and flooding. Moreover, zoning laws are informed by land-use data, which help to identify high-risk regions and mitigate dangers [30]. For instance, limiting construction in flood-prone areas and protecting natural buffers can decrease vulnerability. Studies have shown that vegetative land covers, such as mangroves and coastal forests, are crucial for sediment stabilisation and erosion control. These natural barriers mitigate the forces of waves and storm surges, protecting inland regions from erosion and flooding [31,32]. Accurate land-use data and continuous monitoring are essential for creating sustainable coastal management plans. To evaluate the distribution and impact of different land uses on coastal vulnerability, the (ESA) WorldCover v200 product was used, providing a global land-cover map for 2021 at a 10 m resolution based on Sentinel-1 and Sentinel-2 imagery [33].

3.2. Coastal Slope

Coastal slope, or the gradient of the beach profile, is a critical factor in wave energy dissipation and sediment transport dynamics that significantly affects erosion rates. Research studies employ topographic surveys and remote sensing techniques aided by numerical modelling to quantify and analyse coastal slopes. For instance, Komar [34] used wave tank experiments and field measurements to examine the dependency of longshore currents on beach slopes, demonstrating that the gradient of the beach influenced wave angle and sediment transport. Lazarus and Murray [35] employed numerical modelling to correlate shoreline change with wave-driven alongshore sediment transport, highlighting the impact of coastal slope variations on these processes. A coastal slope was created through the DEM derived by the Department of Lands and Surveys (DLS). The slope calculation was performed using ArcGIS Pro software’s slope analysis tool, which automatically calculates a slope as a percentage based on the DEM. This tool measures the rate of change in elevation at each point across the study area, providing a spatially accurate slope calculation for each coastal segment.

3.3. Rate of Coastline Erosion

Measuring coastline erosion, expressed in meters per year, is crucial in comprehending and controlling coastal transformations and fluctuations in erosion or accretion while providing insights into a coastline’s long-term stability. Advanced techniques like aerial photography, satellite images, and the Digital Shoreline Analysis System (DSAS) are utilised to quantify and examine erosion rates. For instance, Baig et al. [36] employed DSAS to quantify erosion and accretion rates along India’s Vishakhapatnam coast. They utilised multi-temporal satellite pictures to provide valuable information for making decisions regarding coastal management. Jonah et al. [37] analysed historical aerial photographs and satellite imagery to ascertain the typical rates of coastal erosion in Ghana.
This study evaluated, by historical aerial photographs derived from DLS, the motions of the shoreline based on six historical positions recorded in 1963, 1993, 2003, 2008, 2009, and 2019. These historical data offer an accurate and thorough analysis of the changes over time, enabling a meticulous examination of erosion trends and patterns. DSAS was used to process these data, employing two statistical methods to evaluate shoreline changes: the Linear Regression Rate (LRR) and Net Shoreline Movement (NSM). These methods involve analysing past shoreline positions over time, with the slope of the regression line representing the rate of change, helping to identify regions that are significantly eroding or accumulating [38]. This approach provides valuable insights for developing targeted coastal management strategies and mitigating the impacts of coastal erosion.

3.4. Mean Tidal Range

The mean tidal range (MTR) was derived from the global ecological classification of Coastal Segment Units (CSUs), which provided a comprehensive understanding of coastal dynamics [39]. MTR is the vertical distance separating the average high- and low-tide levels. The tidal range significantly influences coastal features such as beaches and estuaries, with large tidal ranges contributing to dynamic coastal processes, including tidal flooding, faster rates of erosion, and more saltwater intrusion into freshwater systems [30]. However, it should be noted that different academics have varied opinions about ranking coasts regarding tidal range [40]. Based on this viewpoint, we assume that sensitivity decreases with increasing tidal range. The validity of this assumption is due to the fact that storms or other extreme water levels will impact above the highest tidal levels and their possible influence. There is a possibility of a storm occurring at high tide on a macro-tidal shoreline.
Consequently, a storm with a two-meter surge height might occur in an area with a five-meter tidal range without rising over the elevation [40]. Regarding its impact on the CVI, areas with low tidal ranges are generally considered more vulnerable because they have reduced natural defences against coastal flooding and storm surges. As a result, these areas are assigned higher vulnerability scores in the CVI, reflecting the greater risk of erosion and flooding in low-tidal range environments.

3.5. Mean Significant Wave Height

Wave height affects the energy impacting the coast, influencing erosion and sediment transport. Mean wave height derived from the Copernicus Marine Service (CMS) dataset represents the average height of the highest one-third of waves observed over a certain period, typically measured as significant wave height (SWH). This metric is essential for understanding coastal dynamics, erosion patterns, and the impact of storm surges. Higher waves lead to more significant erosion and sediment displacement, reshaping coastlines and affecting coastal infrastructure [30,40].

3.6. Coastal Elevation

Coastal elevation acquired from DLS, with the shoreline serving as the reference point, which refers to the vertical distance between the land and the sea level, is critical in determining the susceptibility to sea-level rise and coastal flooding. Methods such as Light Detection and Ranging (LiDAR), GPS surveys, and satellite altimetry are commonly employed to acquire detailed elevation data. Kulp and Strauss [41] utilised LiDAR-derived elevation data to estimate population exposure to future sea-level rise, demonstrating that over 190 million people live below projected high-tide lines for 2100 under low-carbon emission scenarios. Gesch [42] highlighted the importance of high-quality elevation data, comparing different Digital Elevation Models (DEMs) to improve sea-level-rise impact assessments. Higher elevations are generally associated with reduced vulnerability to coastal hazards, as these areas tend to experience less erosion during storm events since they can effectively absorb the incoming waves’ energy [43]. Moreover, highly elevated areas are less prone to saltwater intrusion into freshwater systems, a critical issue in low-lying coastal areas [44].

3.7. Relative Sea-Level Rise

The relative sea-level rise (RSLR) derived from CMS refers to a complex phenomenon that changes at coastal sites and is affected by local and global influences. The rise in sea level is mainly caused by the thermal expansion of water and the melting of polar ice caps, which replenishes the oceans with more water [45]. Additionally, RSL can be highly affected locally by coastal erosion and land subsidence. The loss of land mass due to erosion raises the relative sea level, thereby increasing the vulnerability of coastal areas to flooding and other related phenomena, reducing the height difference between sea and land [45].

3.8. Coastal Geomorphology

Coastal erosion can drastically alter a region’s geomorphology by redistributing or removing sediment. Modifications may remove existing coastal structures or generate new coastal basins. Furthermore, losing natural barriers like marshes and dunes increases a coastline’s vulnerability to storm- and wave-related events, elevating the risk of catastrophic events like flooding and additional erosion [46]. Significant conclusions can be drawn when comparing DEMs at various times, monitoring the amount and rate of erosion, the movement of sediments, and other geomorphological changes. DEMs are critical for documenting and analysing geomorphological changes because they enable precise measurement and monitoring of changes in coastal topography. The DEM was used to automatically derive coastal geomorphology by generating landform classes using ArcGIS Pro software. Then, the landform classes were matched with the classes from the ranking table (Table 2).

3.9. Coastal Vulnerability Index (CVI)

The CVI represents the final, integrated outcome of all the parameters discussed in the previous sections. Combining the abovementioned factors, the CVI offers a hierarchical, top-level evaluation of a coastline’s susceptibility to various hazards. In this study, a total of 692 perpendicular transects were created along the coastline; the transects were 100 m long and 50 m from each other. Each parameter of the CVI was assigned a vulnerability ranking based on the chosen ranges for the specific characteristics of the region of interest. This process identified five level risks, as shown in Table 2, highlighting the potential of each parameter to cause very low, low, moderate, high, and very high damage to the different parts of the shoreline [47]. After that, all the ranked parameters were integrated into one single index, discriminating the shoreline vulnerability into five-level risks.
The original formulation of the CVI generally includes six variables, but, as mentioned above, different research approaches have made their presence known over the years. In this study case, an alternative CVI formula based on the study area’s characteristics and containing eight variables is proposed, four of which are geological factors (coastal slope, rate of coastline erosion, coastal elevation, and coastal geomorphology), three of which are hydro-physical factors (mean tidal range, mean significant wave height, and relative sea-level rise), and one of which is a socio-economic factor (land cover/land use). The parameters are ranked from 1 (very low vulnerability) to 5 (very high vulnerability), based on Table 2, since they include quantitative and qualitative information. Their numerical values were calculated through a mathematical formula by the CVI, and the values were further classified into five equal parts (quintiles) using the quantile method in the ArcGIS Pro software to classify the CVI range into five risk levels as follows: very low (1.581–3.872), low (3.872–5.477), moderate (5.477–10.606), high (10.606–19.364), and very high (19.364–27.386). In general, the CVI is computed as the square root of the product of the ranked parameter divided by the total number of parameters, as indicated below in Equation (1):
C o a s t a l   V u l n e r a b i l i t y   I n d e x   =   a × b × c × d × e × f × g × h / 8 2
where a = coastal land cover, b = coastal slope, c = rate of coastline erosion, d = mean tidal range, e = mean significant wave height, f = coastal elevation, g = relative sea-level rise, and h = coastal geomorphology.
This formula was selected to ensure that each parameter contributes proportionally to the overall index without any one parameter overshadowing the others. This approach provides a balanced assessment of coastal vulnerability, and while alternative formulas exist in the literature, the chosen method best suits the specific characteristics of the Limassol coastline.
In general, the eight parameters were selected based on their relevance to coastal vulnerability assessments in the Mediterranean and are justified in their respective sub-sections. These parameters are widely accepted based on the scientific literature, each parameter capturing key environmental or anthropogenic factors affecting the Limassol coastline, providing a comprehensive and regionally tailored approach to the CVI. The grading of the CVI score in Table 2 for each parameter was chosen carefully based on the literature. These thresholds reflect globally recognised values while also considering local characteristics such as lower tidal ranges and moderate wave heights typical of the Mediterranean. Although different grading criteria could potentially alter the results, the selected ranges provide a balanced and contextually appropriate evaluation for this study area, ensuring that the CVI effectively captures the vulnerability dynamics of the Limassol coast. Remote sensing techniques, including satellite imagery and aerial photographs, were crucial for analysing the shoreline changes, land use, and geomorphology. These methods allowed efficient and accurate data collection across the study area, providing up-to-date information that strengthened the CVI assessment.
Table 2. Parameters and their rankings used to calculate the Coastal Vulnerability Index.
LabelFactorCVI ScoreReferences
Very Low (1)Low (2)Moderate (3)High (4)Very High (5)
(a)Coastal land coverTree coverShrubland,
bare soil
Cropland,
grassland
Herbaceous wetlandBuilt-up[48,49,50]
(b)Coastal slope (%)>128–124–82–4<2[51,52,53]
(c)Rate of coastline erosion (m/year)>2+1.0:+2.0−1.1:+1.0−1.1:−2<−2.0[28,30]
(d)Mean tidal range (m)>6.04.0–6.02.0–4.01.0–2.0<1.0[23,54]
(e)Mean significant wave height (m)0:<0.550.55–0.850.85–1.051.05–1.25>1.25[17,28]
(f)Coastal elevation (m)≥2010–205–102–50–2[53,55]
(g)Relative sea-level rise (mm/year)<1.81.8–2.52.5–33.0–3.4>3.4[28,56]
(h)Coastal geomorphologyRocky cliffed coasts, fiords, fiards
(Peak, ridge)
Medium cliffs, indented coasts
(Shoulder, spur)
Low cliffs, glacial drift, alluvial plains
(Flat, slope, footslope)
Cobble beaches, estuary, lagoon
(Valley)
Barrier beaches, sand beaches, salt marsh, mudflats, deltas, mangroves, coral reefs
(Hollow, pit)
[28,55]
The bold landform types inside the parentheses are the different classes created from the landform raster.

4. Results

As has been mentioned, in our study, eight parameters of coastal vulnerability were identified, and they are analysed in this section. Figure 3 indicates the vulnerability ranking for each parameter utilised to calculate the CVI.

4.1. Land Use/Land Cover

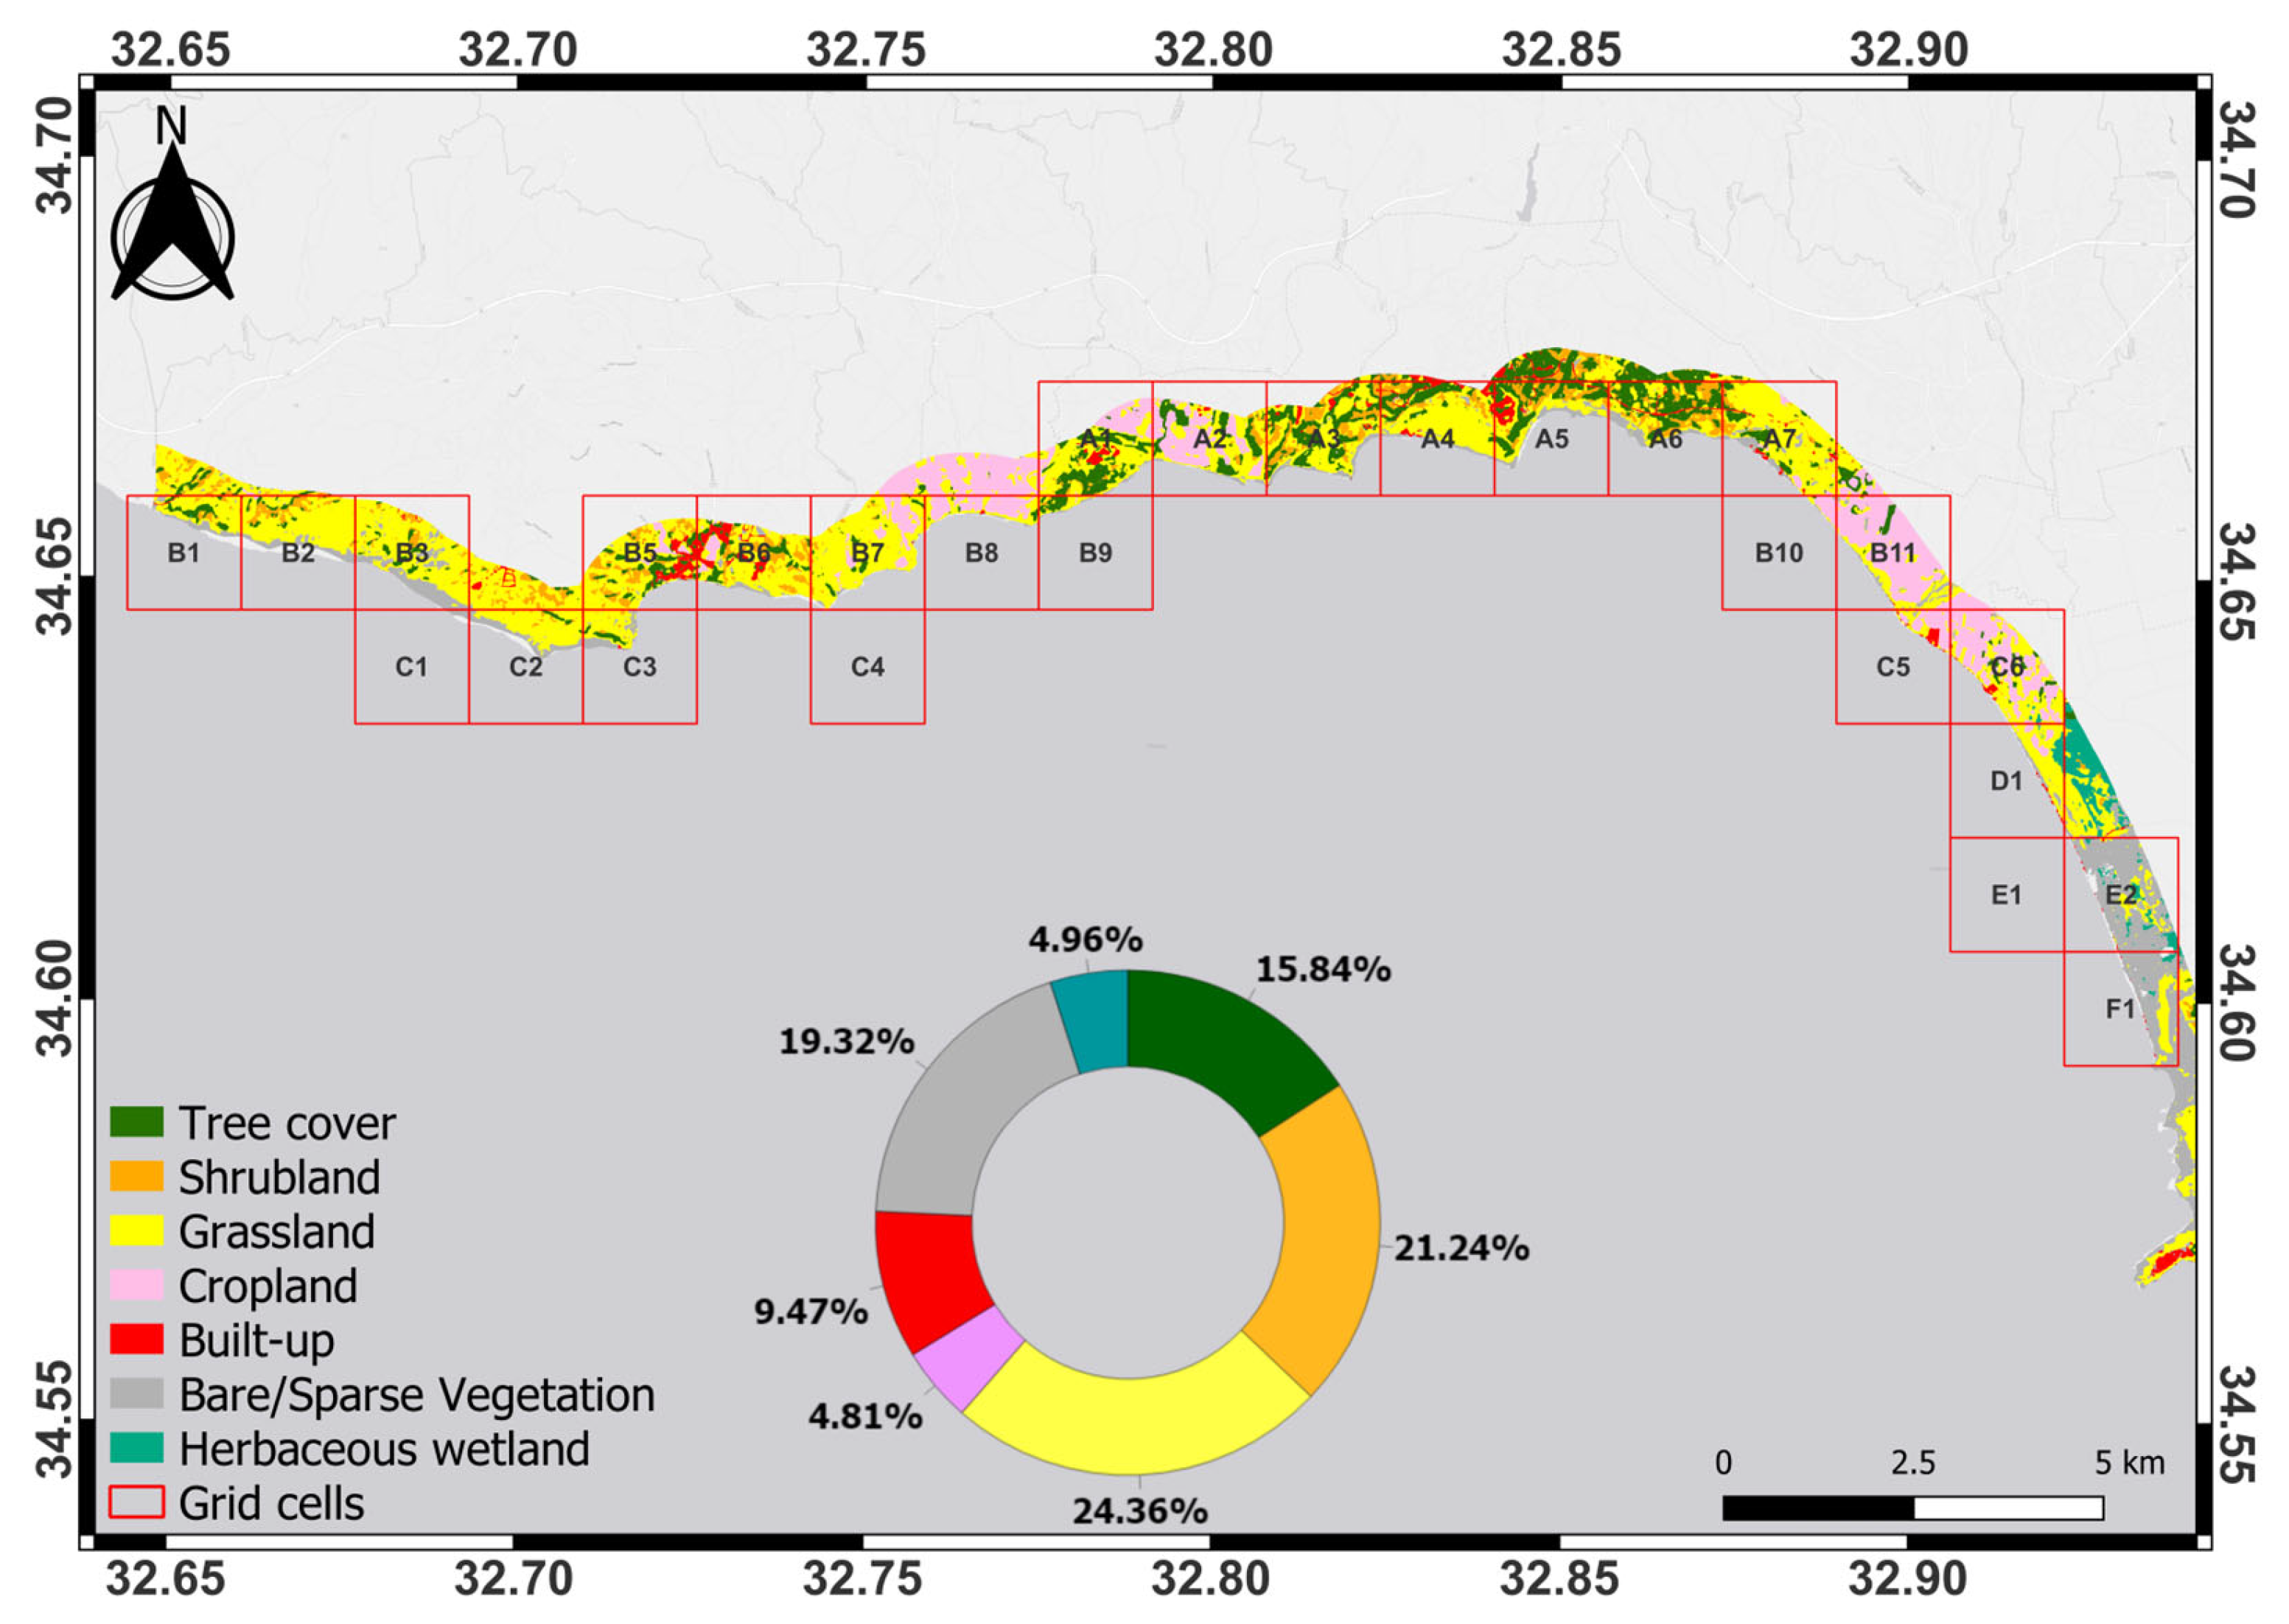
The land cover of the study area is characterised by a variety of land-cover classes, grassland being the dominant class according to ESA Worldcover, covering 24.36% of the grid cells, as shown in Figure 4, followed by shrubland (21.24%), bare/sparse vegetation (19.32%), tree cover (15.84%), built-up areas (9.47%), herbaceous wetland (4.96%), and cropland (4.81%).
From the ranking that was made for the coastal land cover, it was found that 0.83 km (2.3%) of the coastline is very highly vulnerable, another 60% (21.68 km) is moderately vulnerable, 8.23 km (22.8%) has a low rank of vulnerability, and 5.38 km (14.9%) has very low vulnerability. In total, 16 transects were ranked as very highly vulnerable, 415 as moderate, 158 as low, and 103 as very low (Figure 3a).

4.2. Coastal Slope

Analysing the coastal slope, its spatial distribution revealed that 9.24 km (25.58%) of the coastline ranked as very highly vulnerable, followed by 8.67% (3.13 km) as highly vulnerable, 13.29% (4.8 km) as moderately vulnerable, and 9.25% (3.34 km) as lowly vulnerable, with, as shown in Figure 3b, a length of 15.61 km (43.21%) of the 35.8 km of the coast having very low vulnerability. The most critical areas are located mainly in the east, the less vulnerable areas being on the west side of the coastline, and the study area’s centre has a mixture of different vulnerability ranks.

4.3. Rate of Coastline Erosion

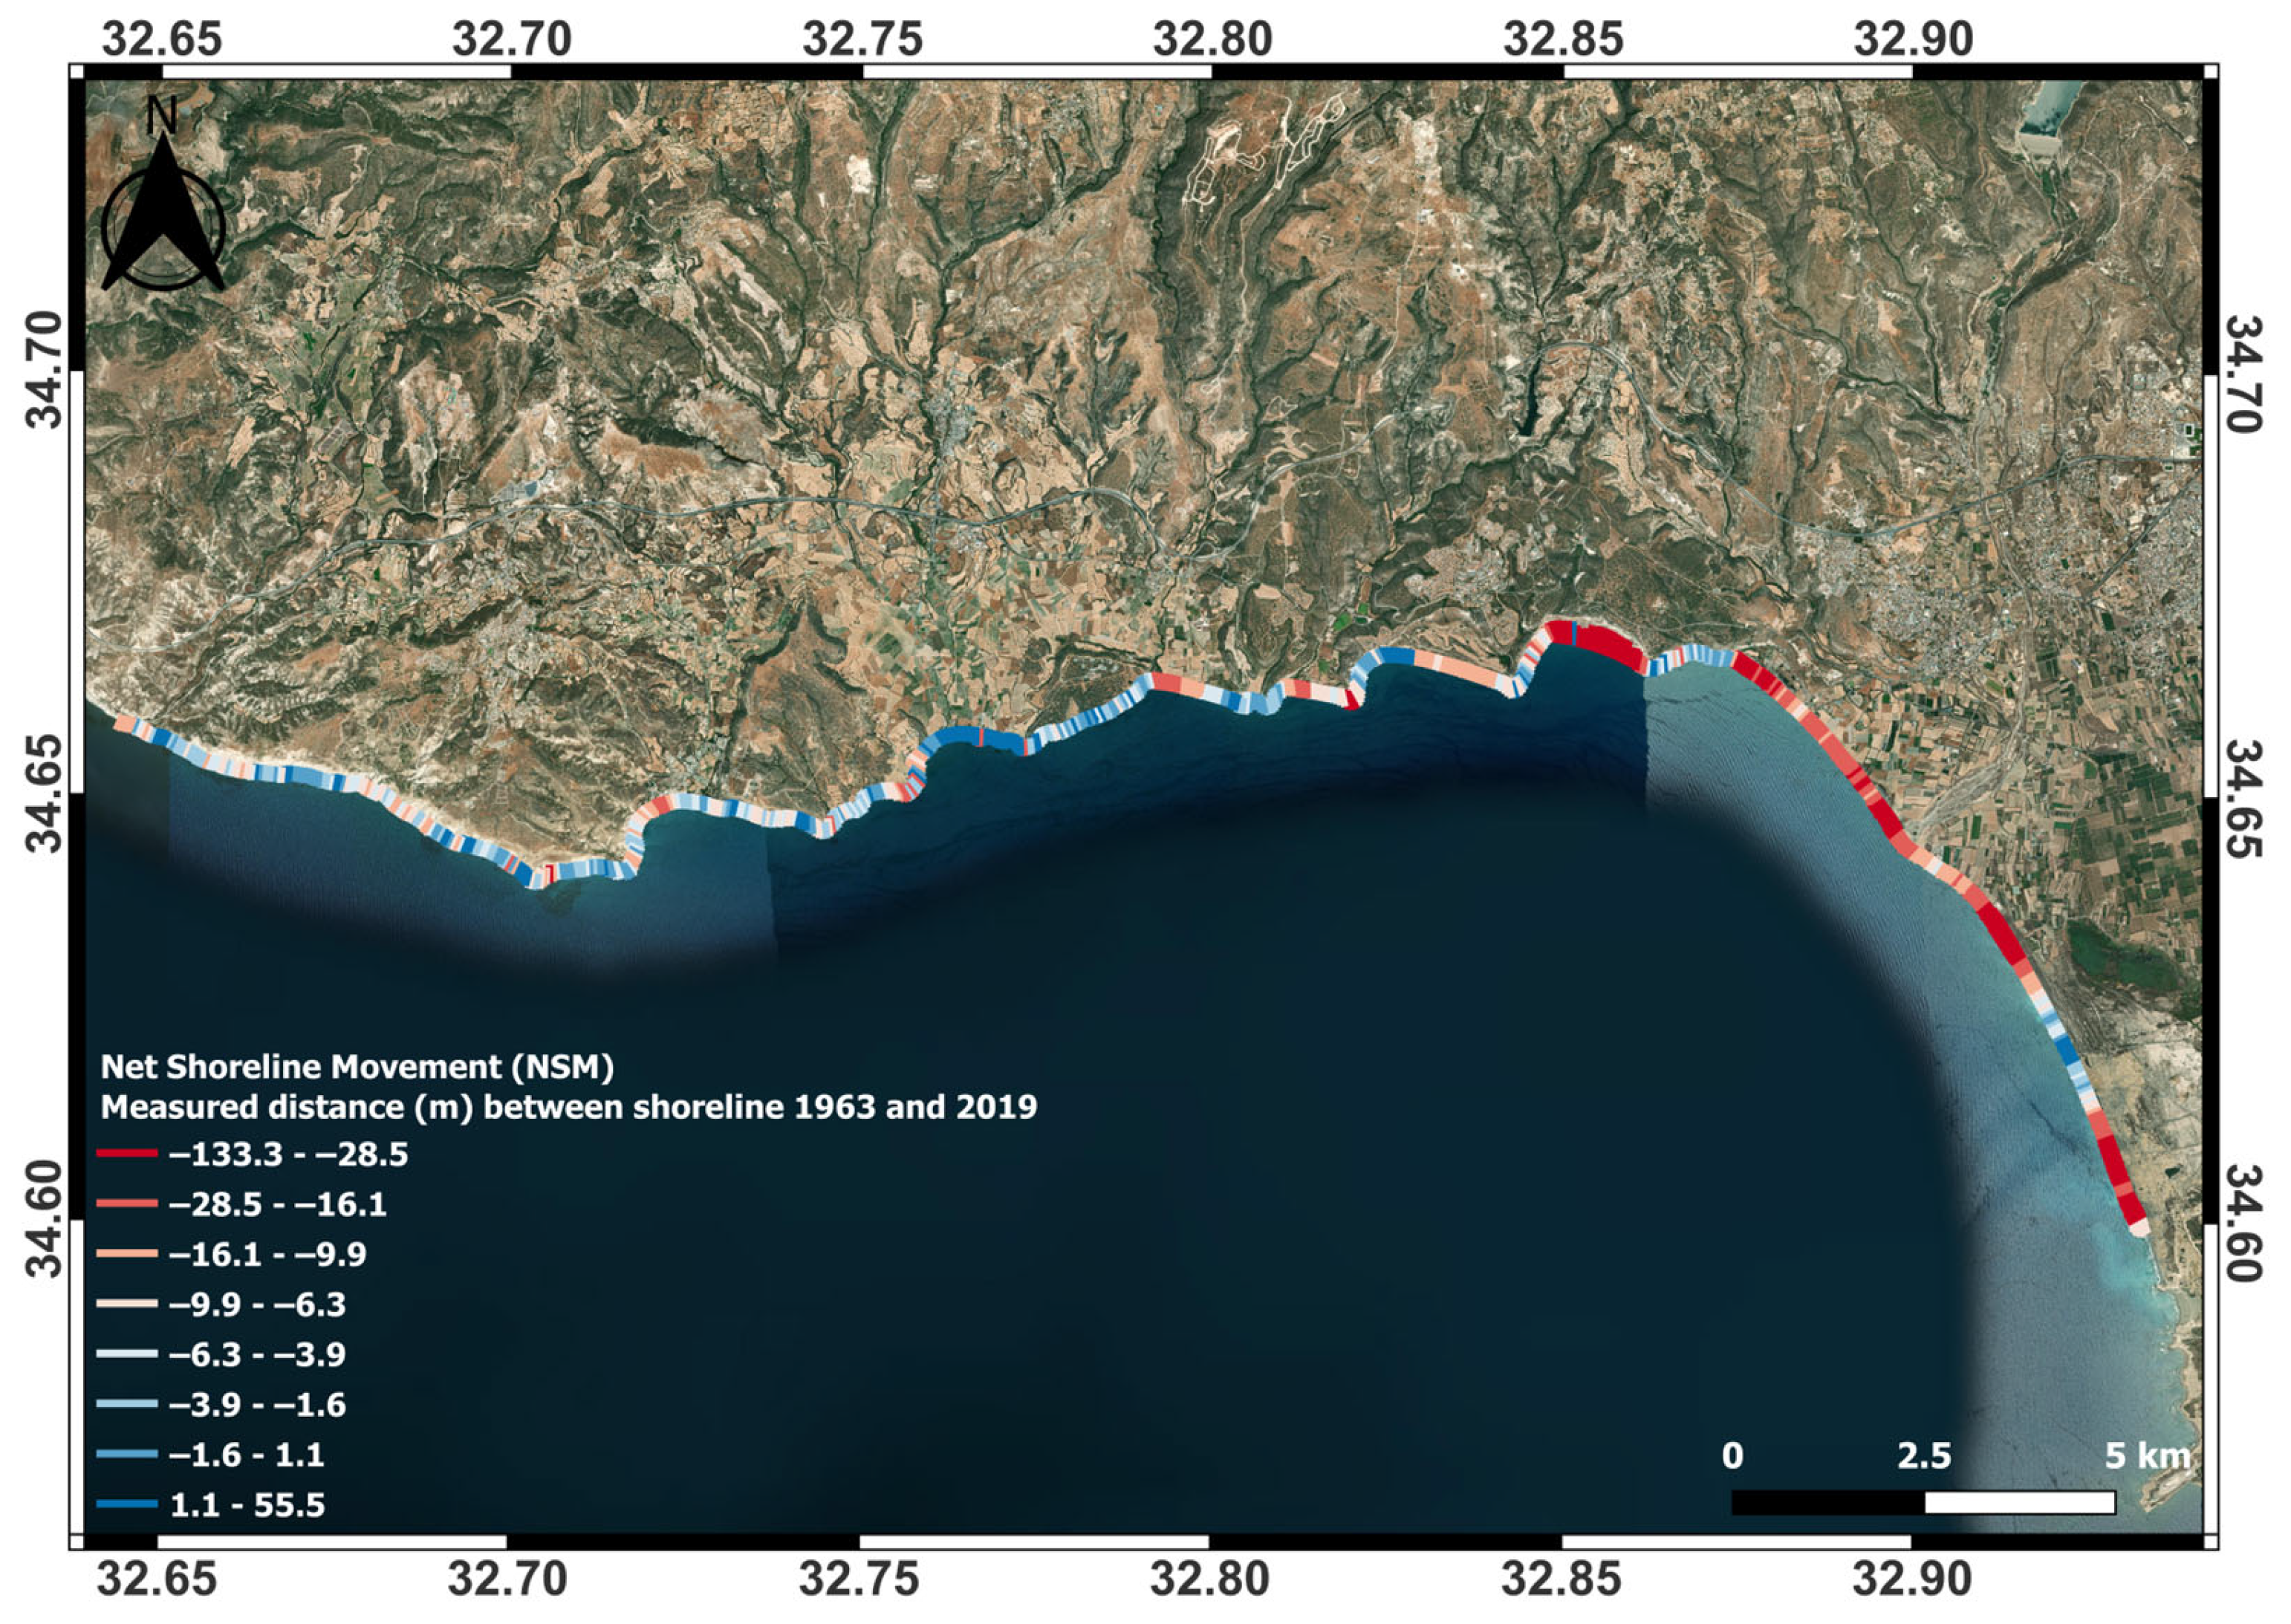
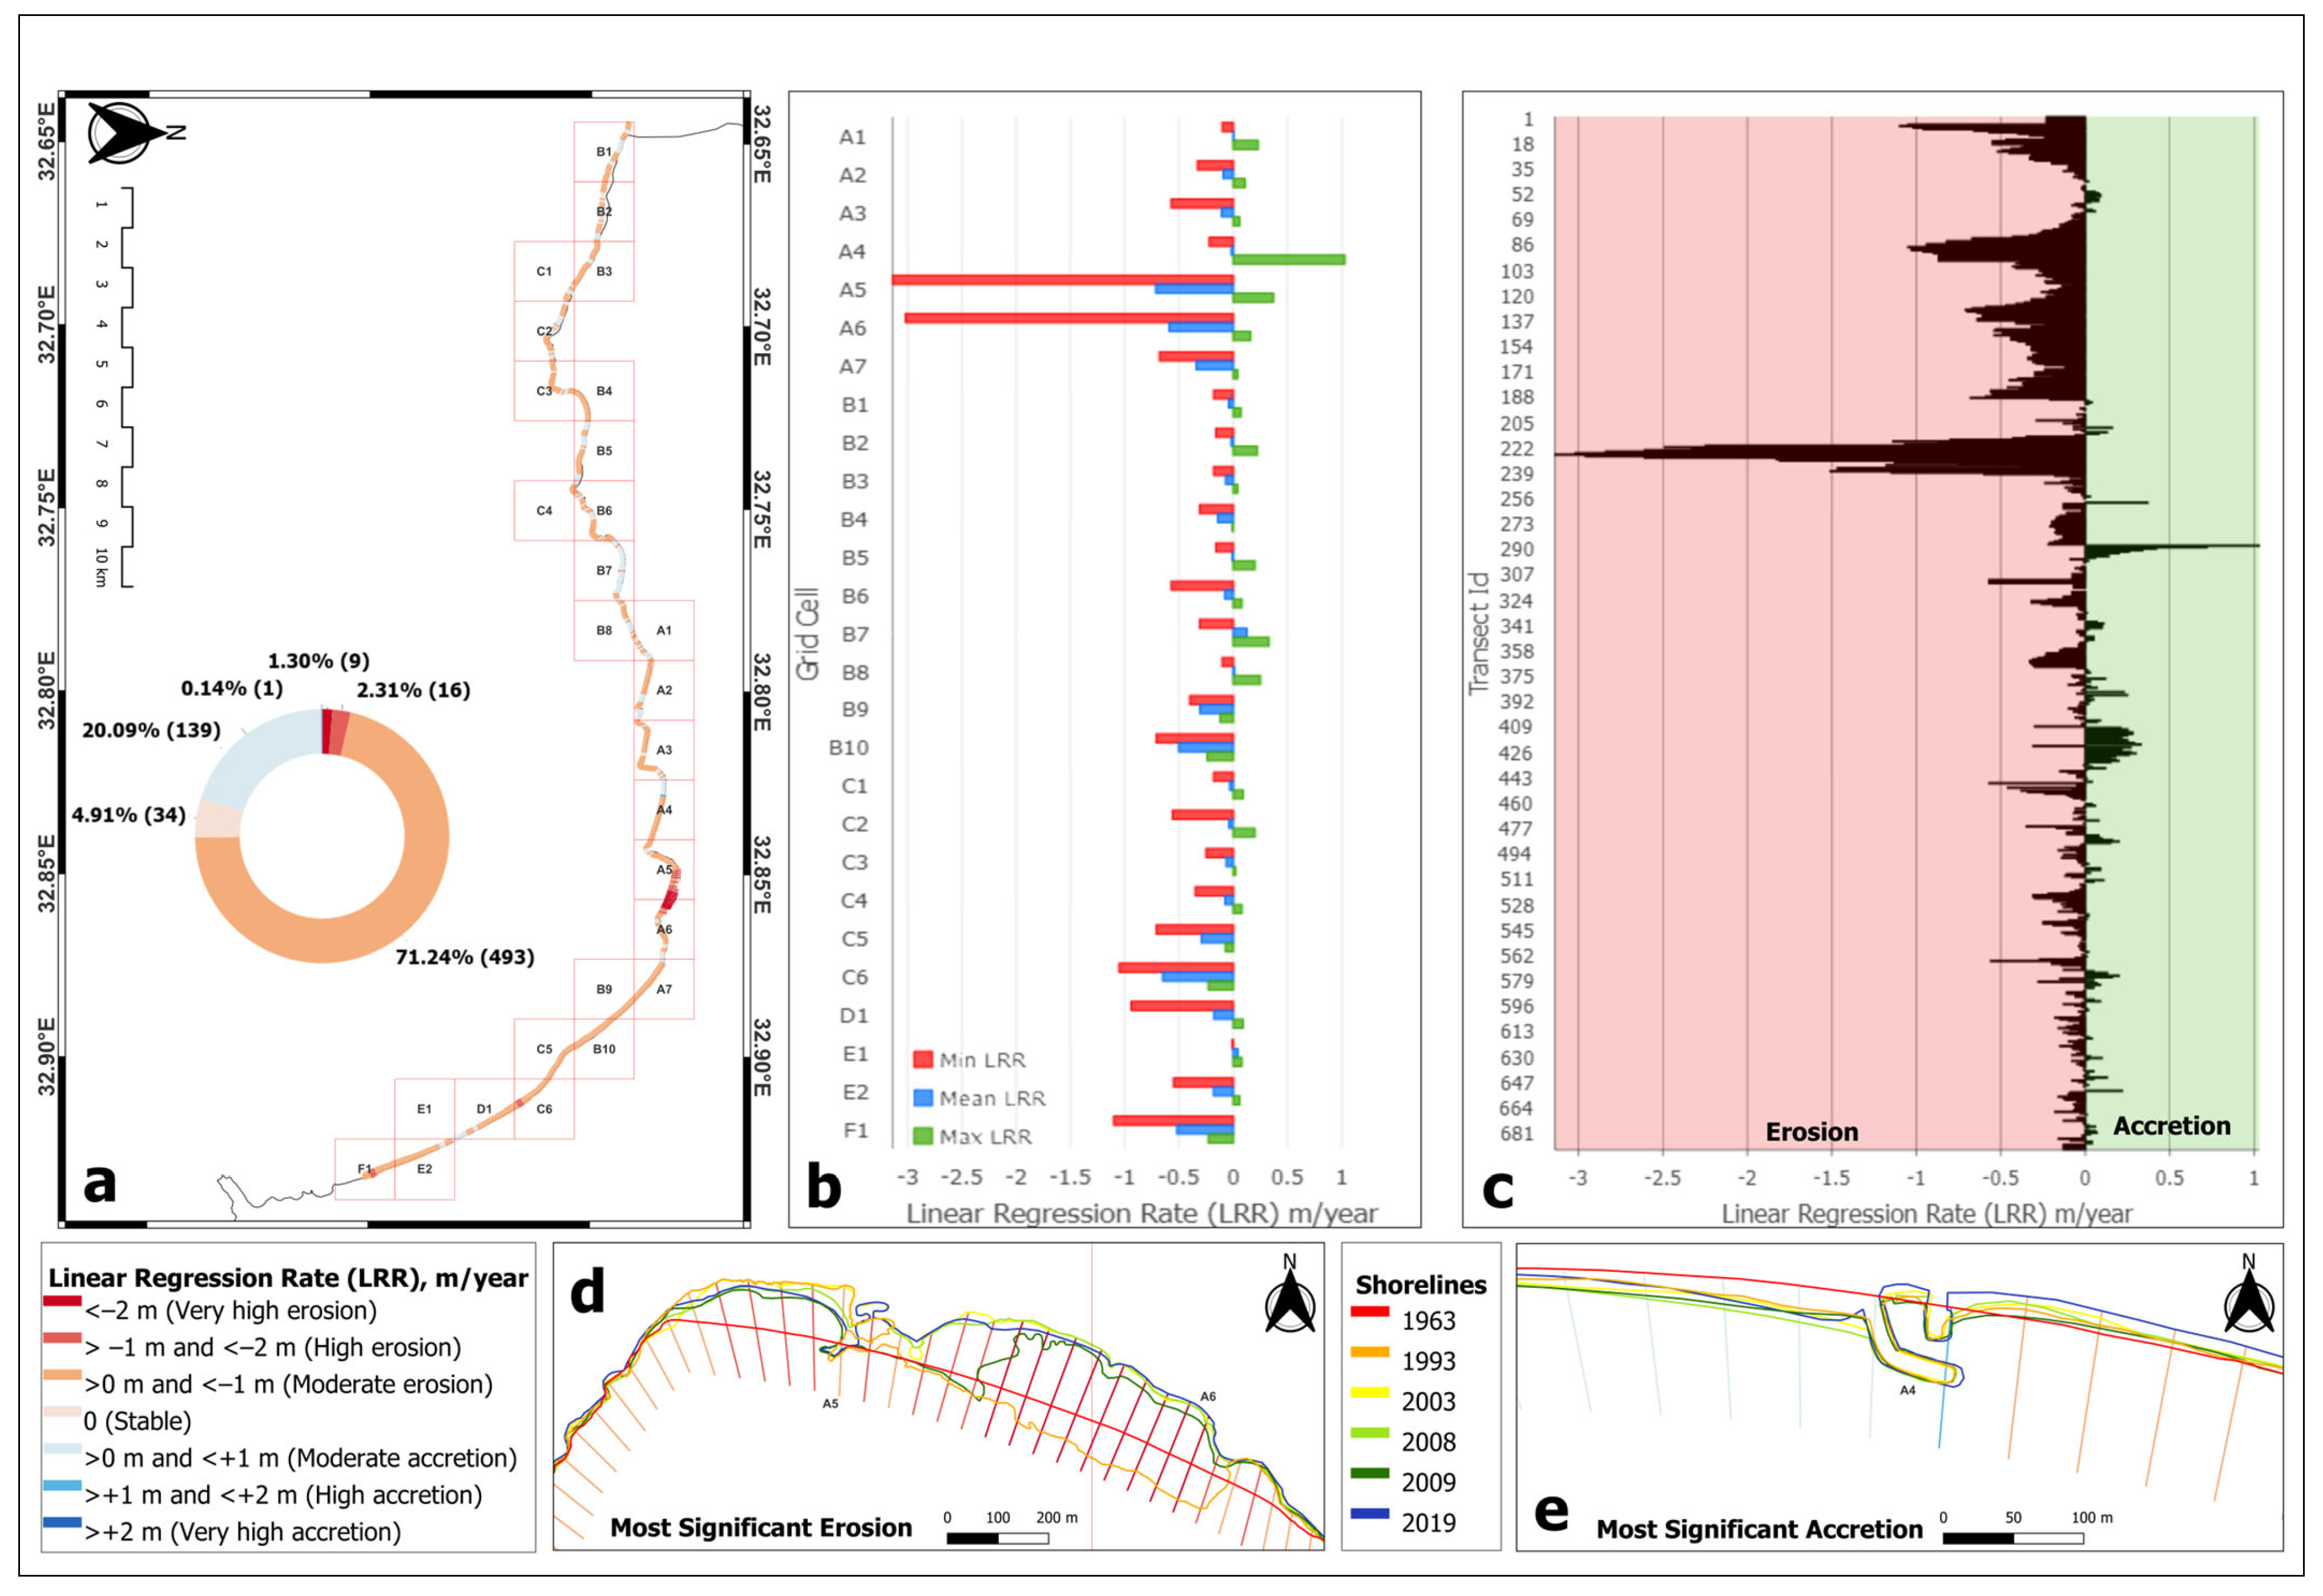
According to the results for the rate of coastline erosion, 96.82% (34.99 km) of the coastline ranked with moderate vulnerability. Moreover, 0.52 km (1.45%) ranked as highly vulnerable and the remaining 1.73% (0.63 km) as very highly vulnerable. The study revealed 22 transects indicating high to very high vulnerability, as indicated in Figure 3c with orange and red colours. Classifying the erosion/accretion rates for the study area into seven categories [57], the results revealed that 71.24% (25.74 km) is undergoing moderate erosion, 20.09% (7.26 km) is undergoing moderate accretion, 4.31% (1.55 km) is stable, 2.31% (0.83 km) is highly eroded, 1.3% (0.46 km) is very highly eroded, and only 0.14% (0.05 km) is highly accreted. Based on the classification, no transect had very high accretion (Figure 5a). Plotting the max, min, and mean LRRs for each grid cell (Figure 5b) and transect ID (Figure 5c), the bar charts revealed that the A5 cell had the highest erosion rate (−3.14 m/year—transect ID 227) and that, conversely, the A4 cell had the most considerable accretion rate (+1.03 m/year—transect ID 288). More specifically, Zapalo Bay in the Episkopi area experienced the most significant erosion rates (Figure 5d); in the area covered by transects 227 and 228, the distance between the oldest and the youngest shorelines (NSM) reached −133.35 m and −131.93 m, respectively. On the other hand, the highest accretion rates (Figure 5e) were identified on a beach southwest of the Episkopi Cantonment area, where transects 288 and 289 had NSMs of 55.47 and 37.47 m, respectively. However, these extensive depositions are due to human interventions, specifically a marina construction, rather than natural causes. Consequently, the largest subsequent deposits identified in transects 290 and 291, with NSMs of 20.86 m and 15.09 m, are situated adjacent to the marina, explaining the significant sediment deposition due to the marina’s presence. An NSM map of the study area can be found in Figure A1, and detailed information about the LRR and NSM statistics for each grid cell is presented in Table A1.

4.4. Mean Tidal Range

Based on the vulnerability ranking, the mean tidal range (MTR) for the entire coastline was classified as having very high vulnerability (Figure 3d), since the tidal range is less than 1 m. A tidal range below this threshold indicates a higher susceptibility to coastal hazards, such as erosion and flooding, as the natural buffering capacity of the coastline is significantly reduced. Consequently, areas with low tidal ranges are more vulnerable to natural phenomena like sea-level rise and extreme weather events.

4.5. Mean Significant Wave Height

The study demonstrated that the mean significant wave height (MSWH) ranged between 0.55 and 0.85 m from 1993 to 2023, classifying the entire studied coastline as lowly vulnerable, reducing the risk of wave-induced coastal erosion (Figure 3e).

4.6. Coastal Elevation

Regarding the coastal elevation, 52.46% (18.95 km) ranked as having very low vulnerability, 26.01% (9.4 km) as having a high vulnerability, 10.26% (3.7 km) as having a very high vulnerability, 7.37% (2.66 km) as having a low vulnerability, and 3.9% as having moderate vulnerability (1.4 km). As shown in Figure 3f, the east side of the coastline has mainly high to very high vulnerability, meaning that this area’s elevation ranges between 0 and 5 m above sea level, in contrast to the rest of the coastline, where the vulnerability varies.

4.7. Relative Sea-Level Rise

According to the range value of the relative sea-level rise (RSLR) in the Limassol district coastline and the ranking table, the study area can be considered very lowly vulnerable, since the range value of the RLSR for the period 1992–2012 was less than 1.8 mm/year, which is notable, since it is significantly below from the global average (~3.3 mm/year) (Figure 3g).

4.8. Coastal Geomorphology

Coastal geomorphology ranked in the majority of the study area as moderately vulnerable, with 66.62% (24.07 km) being distributed mainly with low cliffs, while 15.9% (5.7 km) ranked as lowly vulnerable, 8.67% (3.13 km) ranked as very highly vulnerable, 4.48% (1.61 km) ranked as very lowly vulnerable, and 4.34% (1.56 km) ranked as highly vulnerable.

4.9. Coastal Vulnerability Index (CVI)

Calculating the CVI for the 36.1 km of coastline, the values ranged between 2.73 and 37.5 and were divided into five vulnerability levels based on quartile ranges, as presented in Table 3. For the 36.1 km of the studied coastline, 29.34% (10.6 km) of the mapped shoreline ranked as very lowly vulnerable, 24.42% (8.82 km) as highly vulnerable, 22.11% (7.99 km) as lowly vulnerable, 16.62% (6 km) as moderately vulnerable, and the remaining 7.51% (2.71 km) as being in the very highly vulnerable category (Figure 6a). As indicated in Figure 6b and in more detail in Table A1, three different grid cells, A4, B10, and C5, contained transects with the maximum CVI value; specifically, transect 266 and 267 (grid cell A4), which had CVI values of 37.5, and transect 129, located precisely above the border between cells B10 and C5. Although the highest CVI values were in the grid cells mentioned above, the highest mean CVI values were calculated in E1, D1, and C6, located on the east side of the coastline, with CVIs of 27.75, 25.48, and 25.38, making them very highly vulnerable. In contrast, based on the CVI rankings, the B2, C3, and C1 grid cells are considered very lowly vulnerable, having mean CVIs of 5.34, 4.95, and 4.84, respectively, and being located on the west side of the study coastline.
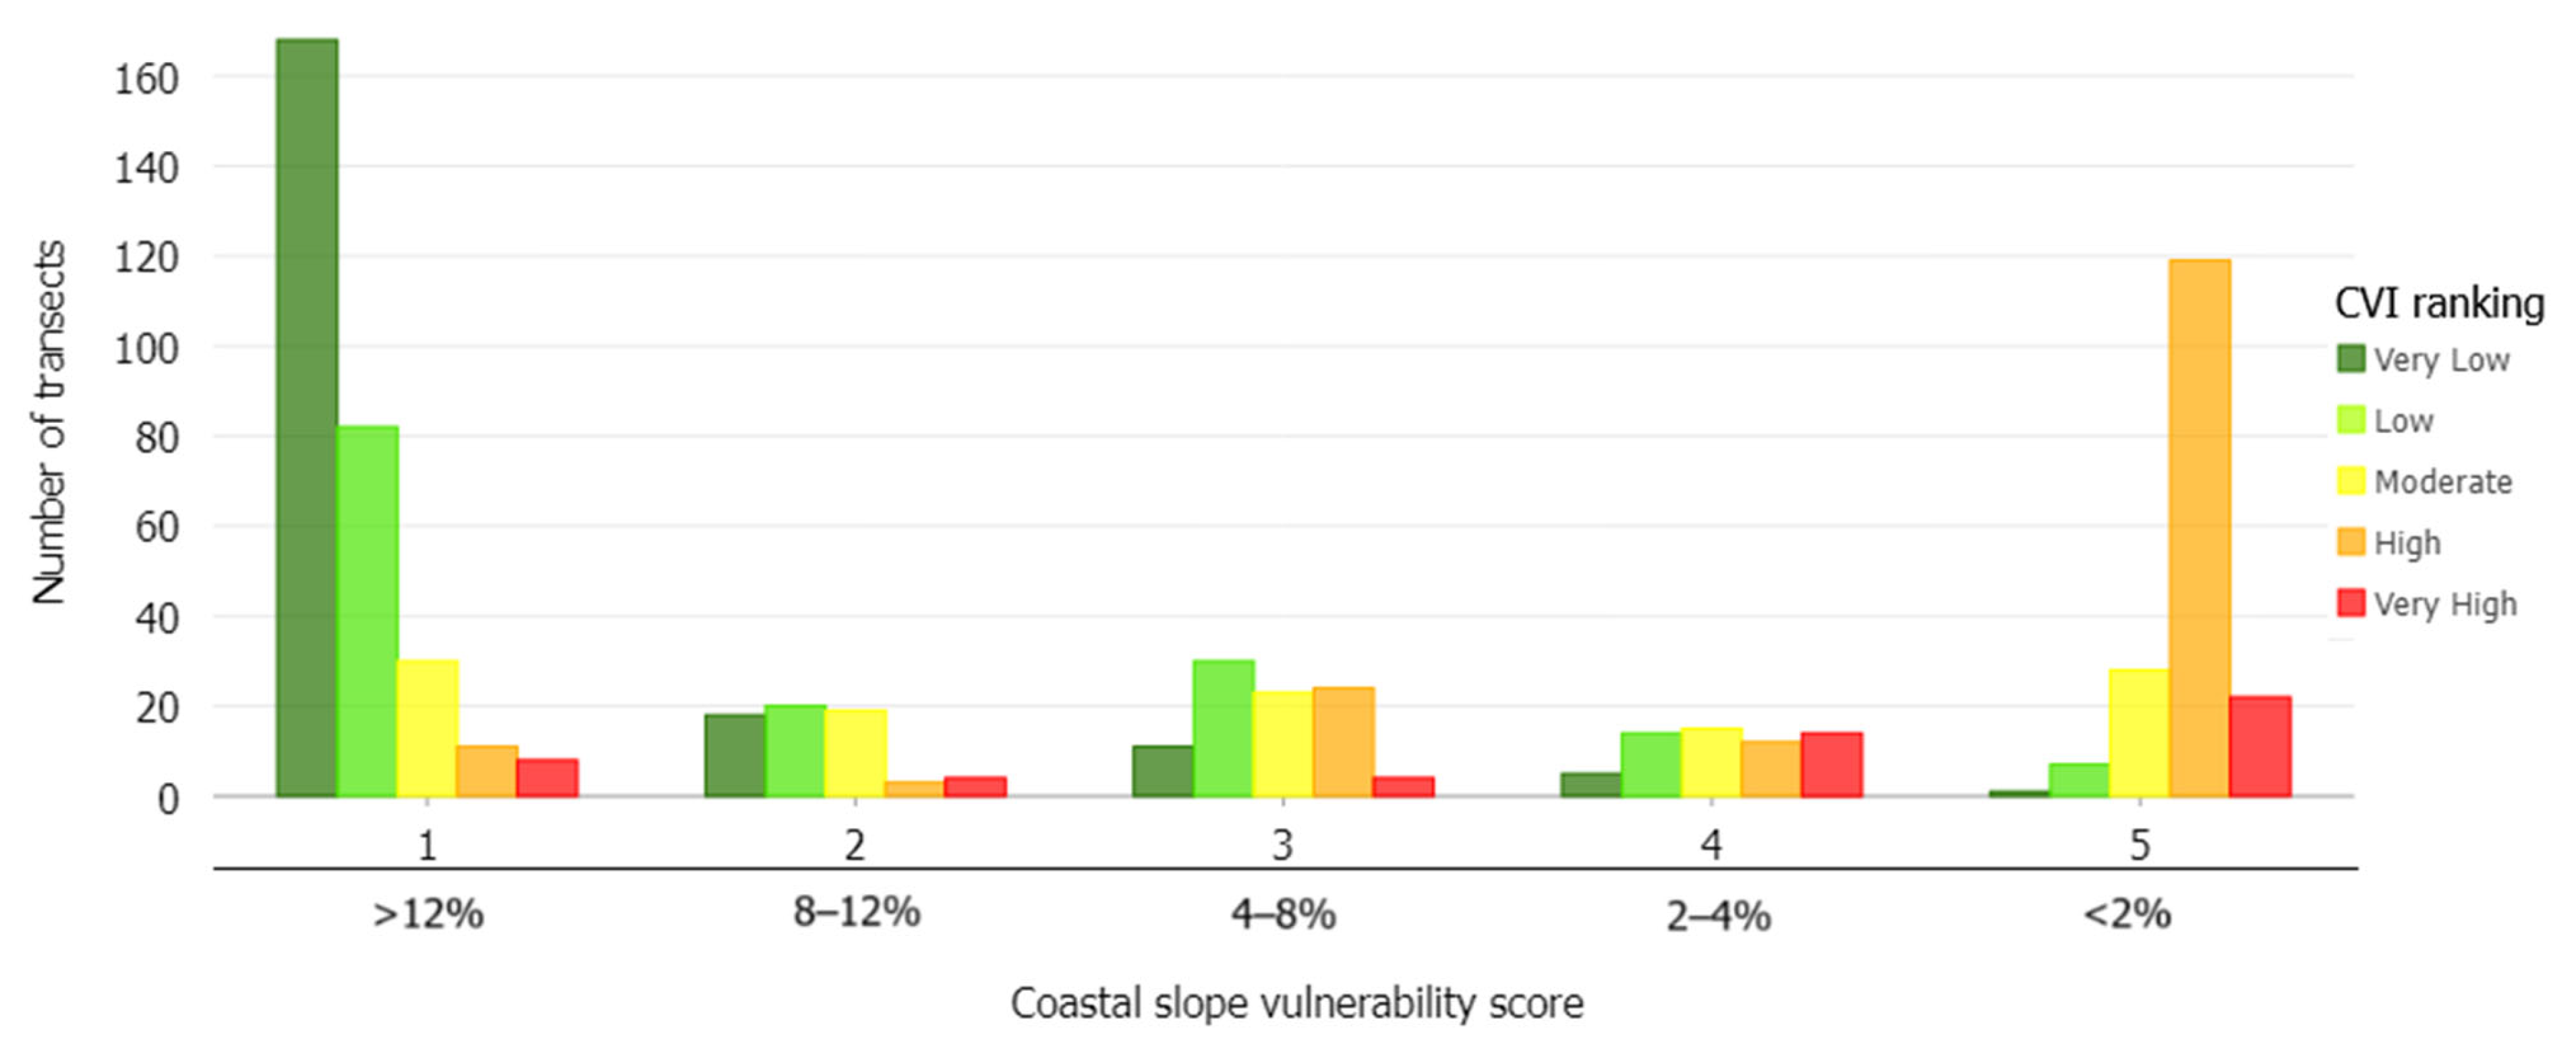
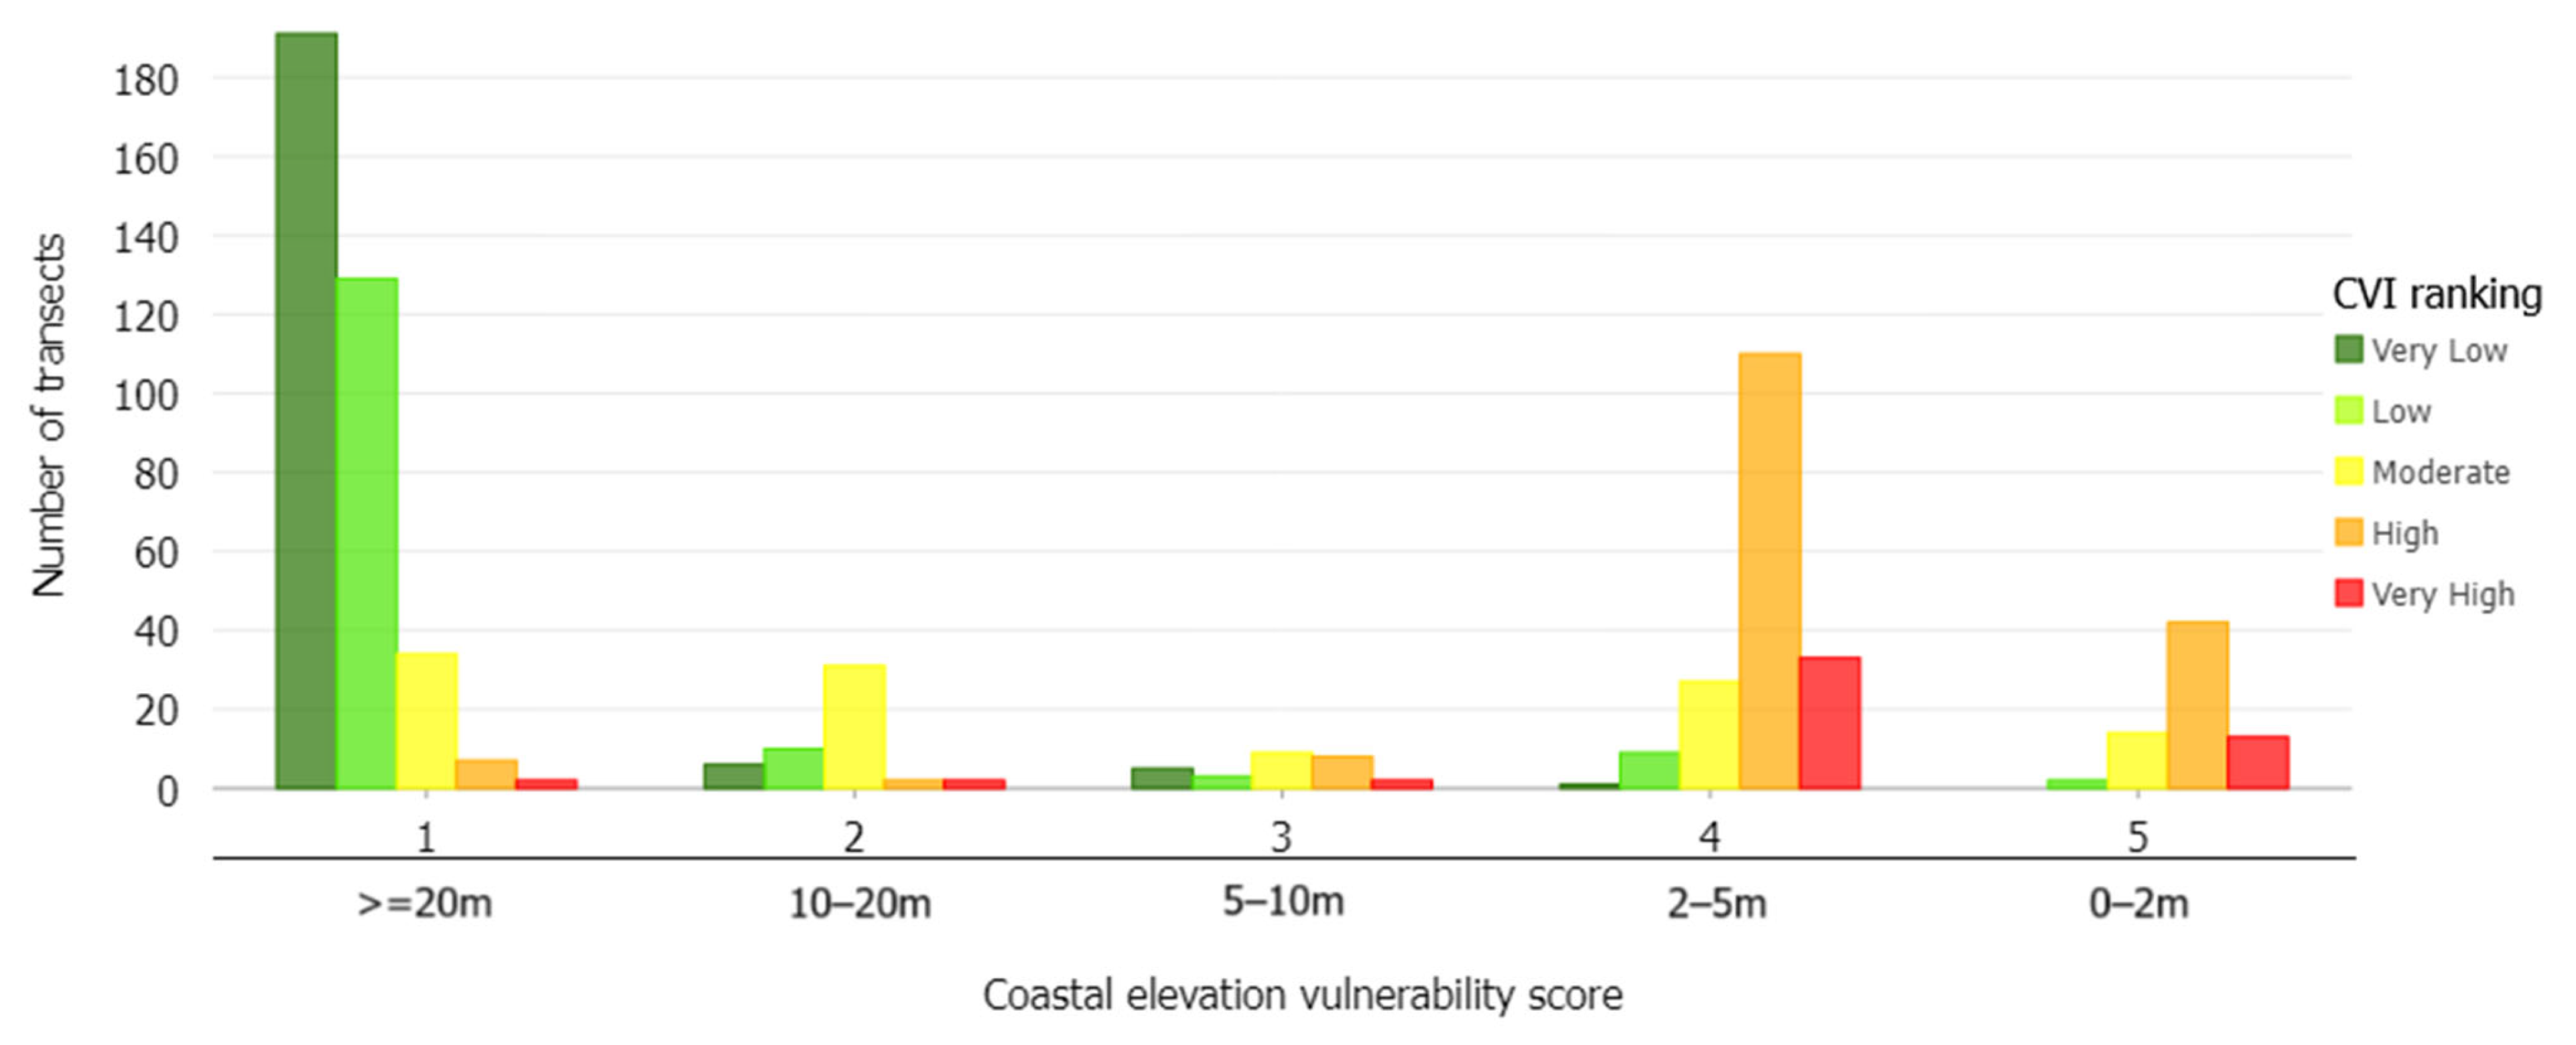
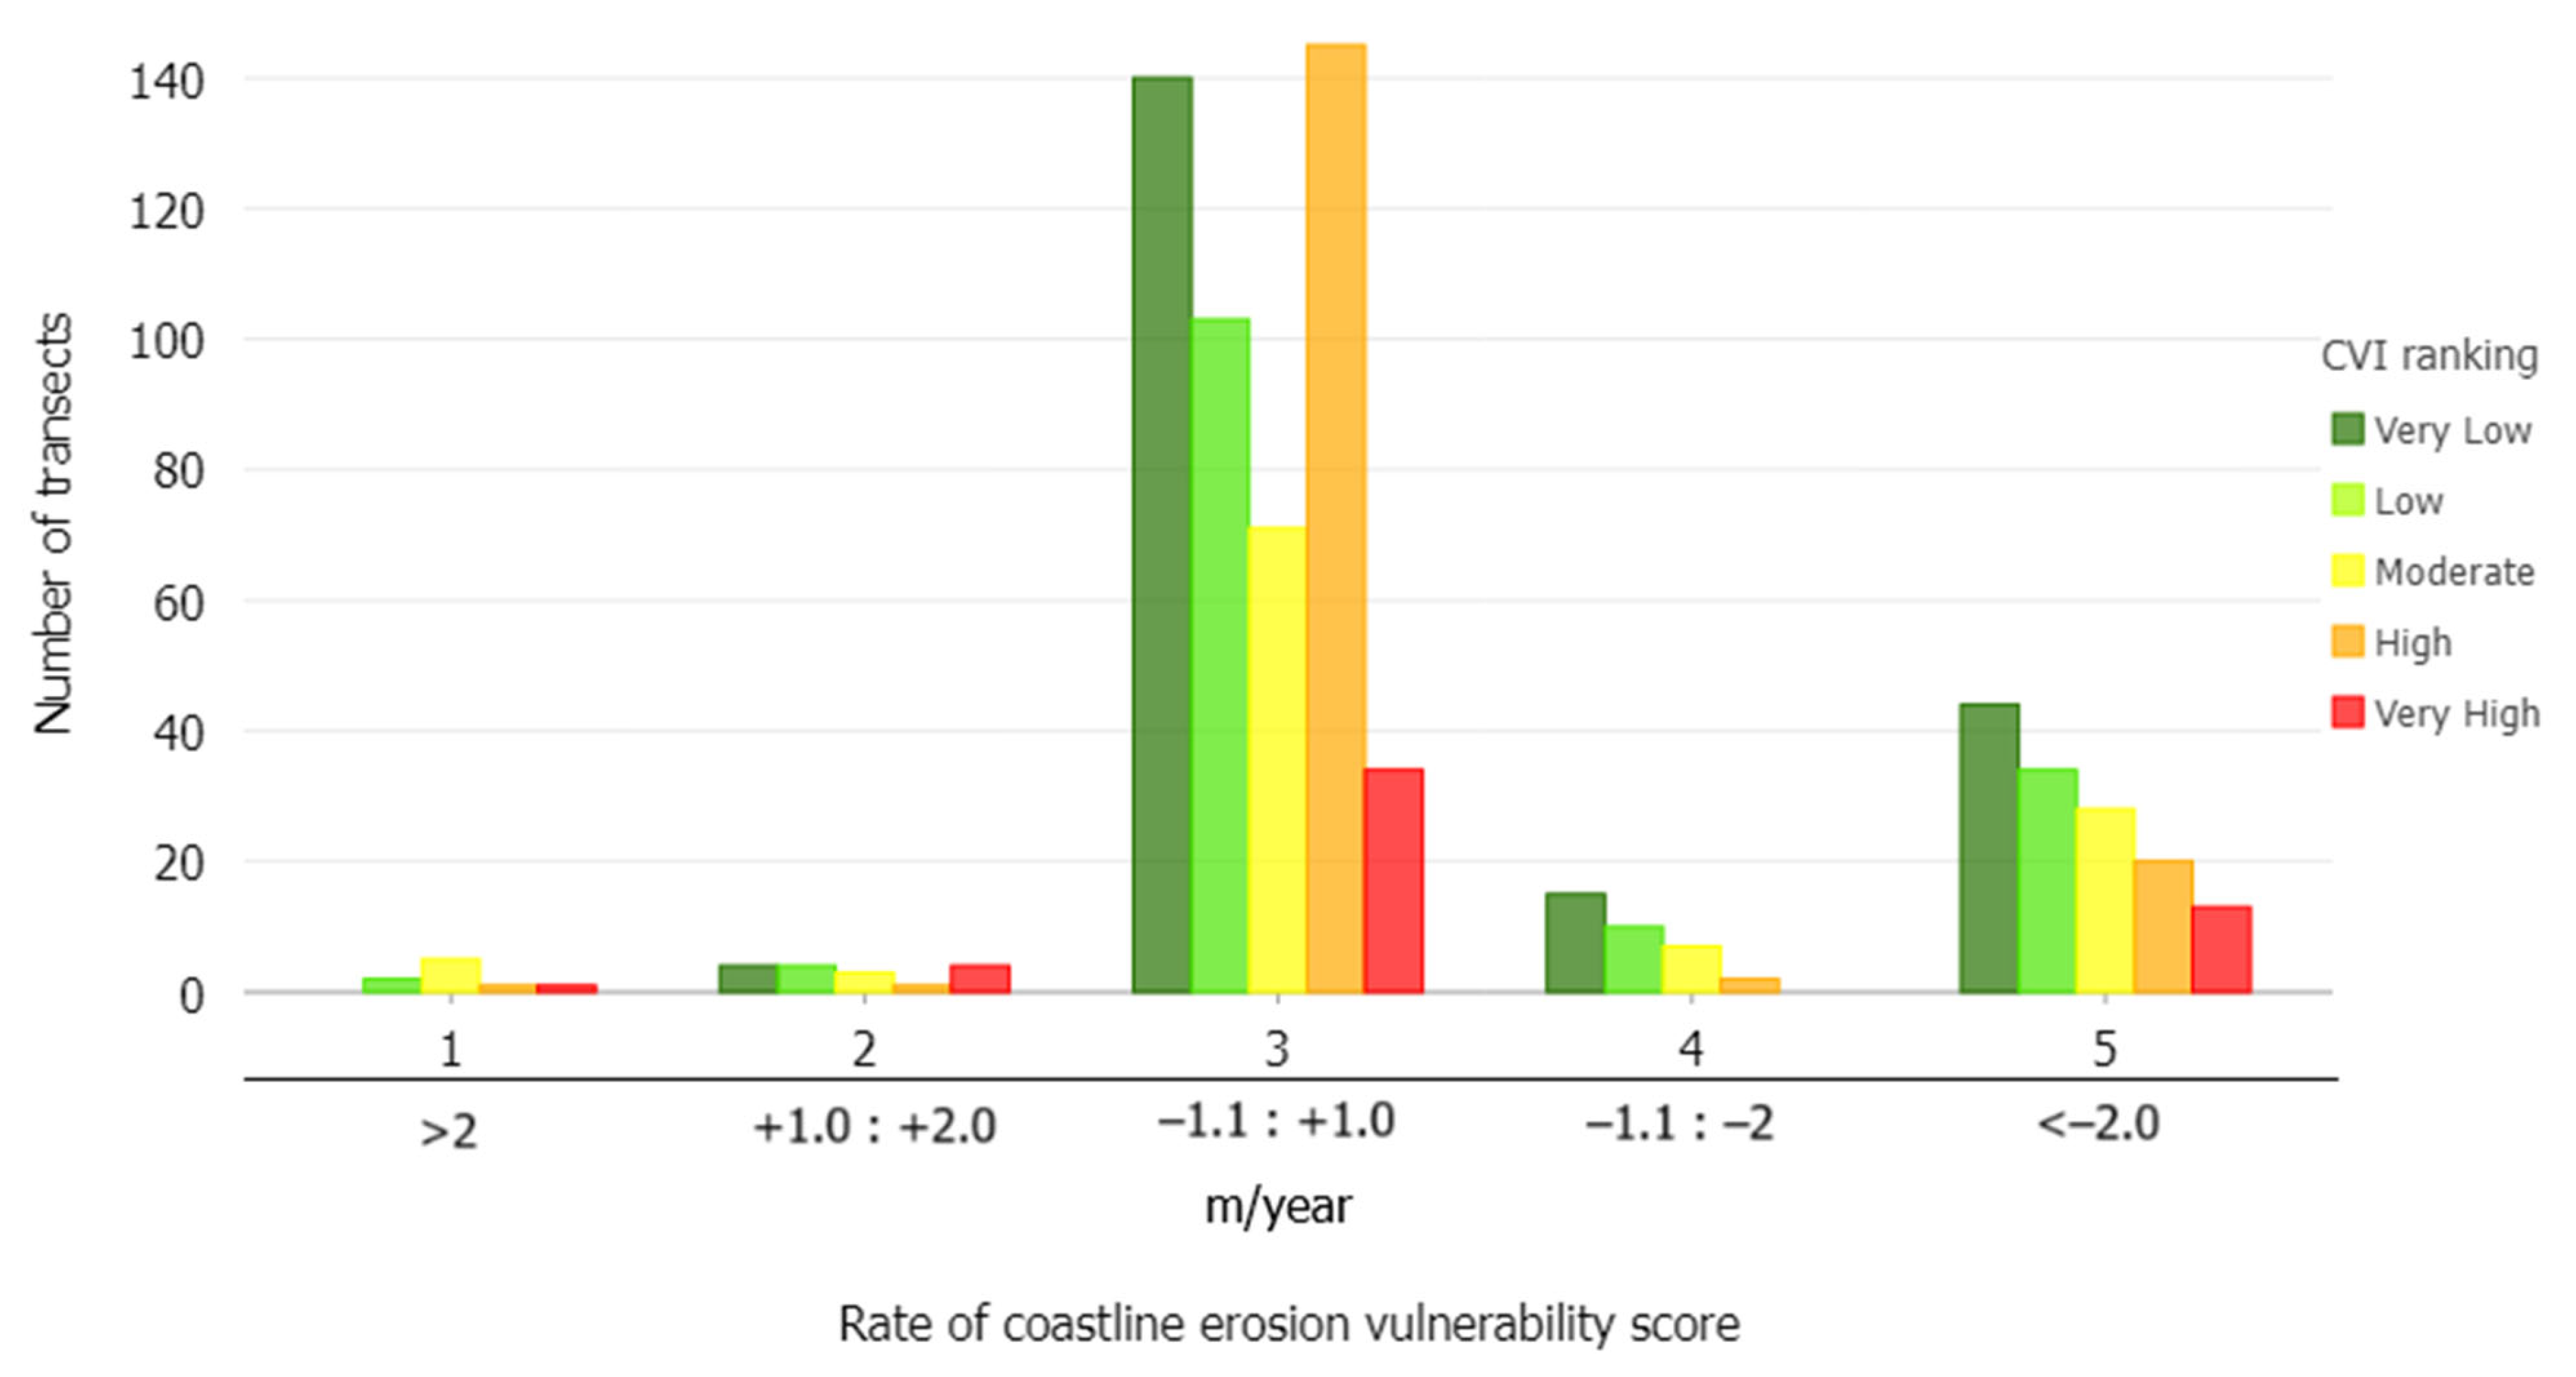
According to Figure A2, Figure A3, Figure A4, Figure A5 and Figure A6 in the Appendix A section, areas with very low vulnerability are primarily characterised by low cliffs and alluvial plains with elevations and slopes exceeding 20 m and 12%, respectively. In addition, areas with low vulnerability comprise low cliffs and alluvial plains, followed by medium cliffs and indented coasts, with altitudes ranging from 10 to 20 m and slopes being over 12%. Regions with moderate vulnerability mainly consist of low cliffs and alluvial plains, where the elevation and slope exhibit fluctuating patterns. Likewise, low cliffs and alluvial plains constitute the areas with high and very high vulnerability. However, the altitudinal range is from 2 to 5 m, and the slope is below 2% for highly vulnerable areas; for the very highly vulnerable areas, the elevation is slightly wider, at 2 to 5 m, and the slope percentage increases between 0 and 4%. Most land-cover areas for all five CVI categories refer to croplands and grasslands, followed by bare soil and shrubland, tree cover, and built-up areas. It is noted that, in this study, there was no herbaceous wetland intersecting the shoreline transects; hence, no vulnerability score for this land-cover class was assigned. Overall, the areas with the highest coastal vulnerability are located on the east side of the coastline, where the estuary of the Kouris River is located, southeast of the Kouris Dam. The CVI revealed areas with very low coastal vulnerability risk on the other side of the coastline. In contrast, the central areas of the study coastline present a mixture of different vulnerability risks, with some beaches exhibiting high to very high vulnerability, which will be further discussed in the next section.

5. Discussion

The study identified eight key parameters influencing coastal vulnerability along the southern coastline of Cyprus from the Akrotiri Peninsula to the Pissouri area, revealing a complex interplay of geological, hydro-physical, and socio-economic factors. Various studies have utilised the CVI to examine coastal vulnerability in Mediterranean regions with roughly similar climatic conditions and key parameters [24,30,57,58,59,60,61,62]. To the best of our knowledge, only one coastal vulnerability assessment has been conducted for the Cyprus coastline [63]. More specifically, this study applied the InVEST Coastal Vulnerability Model to assess coastal risks in the Mediterranean, including Cyprus, covering a coastal stretch from Akamas to Limassol in the western part of Cyprus, which also covered the region of interest of our study. Similar high-vulnerability areas were identified, particularly in regions with low elevations and high exposure to winds and waves. However, the authors used fewer parameters than we did and did not mention the resolution of their data, which is critical for understanding the precision and applicability of their findings. Generally, both studies highlight the east side of the coastline as being particularly vulnerable, with factors such as elevation, slope, and land cover influencing vulnerability levels. While the methodologies differ, our study provides additional insights into localised coastal dynamics by incorporating a broader range of parameters, including coastal slope, land use, and geomorphology, which the InVEST model does not fully capture. This allows for a more detailed understanding of geomorphological features and localised risks along the Limassol coastline, contributing to more nuanced policy recommendations.
In terms of the key parameters used, it is positive that the majority of the studied coastline is covered by croplands and grasslands, which are the dominant land-cover classes, followed by shrubland/bare soil and tree cover (Figure A2), since they provide some natural protection against erosion due to their root systems helping to stabilise the soil [31]. Also, the lower wave heights are beneficial for the stability of the coastline, especially in areas with rocky and loam beaches, which are less dynamic than sandy beaches [64]. Moreover, the low-ranged MSWH may be due to its sheltered geographic position, which protects the study area from the dominant northwest winds and larger wave systems [65] and the dissipating effect of the local bathymetry on wave energy [66]. On the other hand, the entire coastline tidal range being less than 1 m reduces the coastline’s buffering capacity. This makes it more susceptible to erosion and flooding, particularly in areas with low elevations and slopes, such as the east part of the coastline (Figure 3f) [67]. The consistent vulnerability levels of the hydro-physical factors mentioned above reveal the specific conditions along the Limassol coastline, where these parameters show relatively low variability. Despite their uniformity, these factors significantly contribute to the overall vulnerability assessment, especially when combined with other variables such as coastal slope and geomorphology, so the analysis is comprehensive and regionally appropriate.
The coastal erosion rate analysis showed that the biggest NSM was in Zapalo Bay, where, specifically in two transects, the shoreline moved over 130 m. The NSM analysis suggested that such tremendous erosion was due to natural processes. However, further investigation into the historical and anthropogenic activities in the area suggests that human interventions have played a critical role in this erosion. Zapalo Bay derived its name from a gravel mining company active in the area about 50 years ago, which carried out activities such as drilling holes for an underwater quarry, which has left visible traces to this day and significantly affected the bay’s coastal dynamics [68]. Therefore, the presence of the inactive quarry has disrupted the natural sediment transport processes, while, at the same time, the drilling and extraction activities likely altered the seabed and coastal morphology, leading to increased erosion. The literature indicated that human activities created traces at sea level, but nature also played a role by transporting large quantities of fine sand to the coast, making this dual influence of human and natural interventions complex.
The analysis of the CVI, as mentioned above, revealed that the areas with the highest vulnerability are located on the east side of the coastline, particularly near the estuary of the Kouris River (cells B10 and C5), which is situated southwest of the Kouris Dam. The construction of the Kouris Dam has significantly impacted the sediment transport dynamics in this region [69,70,71]. The river became inactive after the dam’s construction, ceasing to transport sediments to the shore, resulting in a lack of sediment replenishment, increasing coastal erosion and reducing the vulnerability of these areas. Therefore, the combination of the low elevation, the moderate vulnerability of the land-cover classes, the geomorphology, and the implication of the Kouris Dam classified the area as highly to very highly vulnerable.

6. Conclusions

This study investigated the coastal vulnerability in the Limassol district, revealing that the studied coastal regions face significant challenges from human activities, often compounded by natural processes. The CVI was created by combining several datasets and techniques, including RS and GISs. Overall, two areas were highlighted for their vulnerability, which had already been significantly affected. First, Zapallo Bay experienced intensive sand mining in previous years, and second, the construction of the Kouris Dam showed that the coasts are not only affected by natural processes but also by human interventions. In conclusion, integrating spatial analysis and quantitative data, this study highlights the importance of targeted coastal management strategies to enhance resilience and sustainability in the face of ongoing environmental change and human effects. The findings underscore the need for proactive measures to mitigate the adverse effects of both natural and anthropogenic factors on coastal regions.

Author Contributions

Conceptualisation, C.T. and M.D.; methodology, C.T.; software, C.T.; validation, C.T., M.D. and M.E.; formal analysis, C.T.; investigation, C.T.; resources, C.T.; data curation, C.T.; writing—original draft preparation, C.T. and M.D.; writing—review and editing, C.T., M.D., E.K., D.C. and M.E.; visualisation, C.T.; supervision, M.E., A.V.A., C.M., D.H. and C.K.; project administration, M.E.; funding acquisition, D.H. All authors have read and agreed to the published version of the manuscript.

Funding

This work was funded through the EXCELSIOR Teaming project (Grant Agreement No. 857510, www.excelsior2020.eu, accessed on 12 August 2024), which has received funding from the European Union’s Horizon 2020 research and innovation programme and from the Government of the Republic of Cyprus through the Directorate General for the European Programmes, Coordination and Development.

Data Availability Statement

The data presented in this study are available on request from the corresponding author.

Acknowledgments

The authors acknowledge the ‘EXCELSIOR’: ERATOSTHENES: Excellence Research Centre for Earth Surveillance and Space-Based Monitoring of the Environment H2020 Widespread Teaming project (www.excelsior2020.eu, accessed on 12 August 2024). The ‘EXCELSIOR’ project has received funding from the European Union’s Horizon 2020 research and innovation programme, under Grant Agreement No. 857510, from the Government of the Republic of Cyprus through the Directorate General for European Programmes, Coordination and Development and the Cyprus University of Technology. Also, the authors acknowledge the “coaSTal Erosion in cyPrus from Space” (STEPS) project, which is funded under the 8th European Space Agency (ESA) Plan for European Cooperating States (PECS) with Contract No. 4000142840/23/NL/MH/nh.

Conflicts of Interest

The authors declare no conflicts of interest.

Appendix A

Figure A1. NSM in the study area. The more red the coastline, the more erosion it has undergone, while the bluer it is, the more deposition it has seen.
Remotesensing 16 03688 g0a1
Table A1. Total transects and LRR, NSM, and CVI statistics for each grid cell in the study area.
Grid CellNo. of TransectsLRR (m/Year)NSM (m)CVI
MinMeanMaxMinMeanMaxMinMeanMax
A118−0.100.000.23−7.61−1.879.975.818.4612.99
A233−0.33−0.090.11−19.95−7.164.273.3516.1725.98
A342−0.57−0.110.06−44.92−9.280.753.357.0212.25
A431−0.22−0.021.03−16.07−4.3355.475.8119.0537.50
A541−3.14−0.710.37−133.35−37.5315.482.749.2525.98
A635−3.02−0.590.16−130.40−28.557.723.3510.0529.05
A726−0.68−0.340.04−40.38−22.73−0.304.7414.3829.05
B134−0.18−0.040.07−15.83−4.613.402.746.2011.62
B225−0.16−0.020.22−10.10−1.7312.363.355.348.66
B331−0.18−0.070.04−13.39−6.94−0.722.745.808.22
B427−0.31−0.14−0.01−20.49−10.34−2.333.358.0815.00
B516−0.16−0.010.20−9.57−3.733.802.7412.7330.62
B632−0.57−0.080.08−28.00−6.442.215.8113.5330.00
B746−0.310.130.33−20.914.1314.775.8121.8733.54
B839−0.100.010.25−7.49−0.6812.655.816.8510.06
B923−0.40−0.31−0.12−22.48−17.36−7.7615.0022.3430.00
B1018−0.71−0.50−0.24−37.08−27.61−12.778.6623.2537.50
C112−0.18−0.030.09−13.39−2.626.022.744.846.12
C235−0.56−0.040.20−29.22−3.159.584.746.1311.62
C328−0.25−0.060.02−12.21−3.781.752.744.9510.61
C49−0.35−0.080.08−20.15−6.181.055.8110.3114.23
C524−0.71−0.29−0.07−37.08−17.55−5.5715.0024.7537.50
C624−1.05−0.65−0.23−59.84−37.05−12.9215.0025.3833.54
D135−0.94−0.180.09−54.65−12.613.629.4925.4833.54
E13−0.010.040.08−1.780.441.9723.7227.7533.54
E233−0.55−0.180.06−41.99−18.341.1413.6923.3430.00
F119−1.10−0.52−0.23−65.69−33.95−6.7510.6122.8830.62
Figure A2. Bar chart showing the number of transects ranked in CVI categories according to land-cover vulnerability score.
Remotesensing 16 03688 g0a2
Figure A3. Bar chart showing the number of transects ranked in CVI categories according to coastal slope vulnerability score.
Remotesensing 16 03688 g0a3
Figure A4. Bar chart showing the number of transects ranked in CVI categories according to coastal elevation vulnerability score.
Remotesensing 16 03688 g0a4
Figure A5. Bar chart showing the number of transects ranked in CVI categories according to coastal geomorphology vulnerability score.
Remotesensing 16 03688 g0a5
Figure A6. Bar chart showing the number of transects ranked in CVI categories according to coastal erosion vulnerability score.
Remotesensing 16 03688 g0a6

References

  1. Le Cozannet, G.; Garcin, M.; Bulteau, T.; Mirgon, C.; Yates, M.L.; Méndez, M.; Baills, A.; Idier, D.; Oliveros, C. An AHP-Derived Method for Mapping the Physical Vulnerability of Coastal Areas at Regional Scales. Nat. Hazards Earth Syst. Sci. 2013, 13, 1209–1227. [Google Scholar] [CrossRef]
  2. Boye, C.B.; Appeaning Addo, K.; Wiafe, G.; Dzigbodi-Adjimah, K. Spatio-Temporal Analyses of Shoreline Change in the Western Region of Ghana. J. Coast Conserv. 2018, 22, 769–776. [Google Scholar] [CrossRef]
  3. Thirumurthy, S.; Jayanthi, M.; Samynathan, M.; Duraisamy, M.; Kabiraj, S.; Anbazhahan, N. Multi-Criteria Coastal Environmental Vulnerability Assessment Using Analytic Hierarchy Process Based Uncertainty Analysis Integrated into GIS. J. Environ. Manag. 2022, 313, 114941. [Google Scholar] [CrossRef]
  4. Watkiss, P.; Troeltzsch, J.; McGlade, K.; Watkiss, M. The Economic Cost of Climate Change in Europe: Synthesis Report on COACCH Interim Results; COACCH: Lecce, Italy, 2019; 29p. [Google Scholar]
  5. Parthasarathy, K.S.S.; Deka, P.C. Remote Sensing and GIS Application in Assessment of Coastal Vulnerability and Shoreline Changes: A Review. ISH J. Hydraul. Eng. 2021, 27, 588–600. [Google Scholar] [CrossRef]
  6. McAllister, E.; Payo, A.; Novellino, A.; Dolphin, T.; Medina-Lopez, E. Multispectral Satellite Imagery and Machine Learning for the Extraction of Shoreline Indicators. Coast. Eng. 2022, 174, 104102. [Google Scholar] [CrossRef]
  7. Janga, B.; Asamani, G.; Sun, Z.; Cristea, N. A Review of Practical AI for Remote Sensing in Earth Sciences. Remote Sens. 2023, 15, 4112. [Google Scholar] [CrossRef]
  8. Apostolopoulos, D.; Nikolakopoulos, K. A Review and Meta-Analysis of Remote Sensing Data, GIS Methods, Materials and Indices Used for Monitoring the Coastline Evolution over the Last Twenty Years. Eur. J. Remote Sens. 2021, 54, 240–265. [Google Scholar] [CrossRef]
  9. Apostolopoulos, D.N.; Nikolakopoulos, K.G. Statistical Methods to Estimate the Accuracy of Diachronic Low-Resolution Satellite Instruments for Shoreline Monitoring. J.Appl. Remote Sens. 2021, 16, 012007. [Google Scholar] [CrossRef]
  10. Hamid, A.I.A.; Din, A.H.M.; Abdullah, N.M.; Yusof, N.; Hamid, M.R.A.; Shah, A.M. Exploring Space Geodetic Technology for Physical Coastal Vulnerability Index and Management Strategies: A Review. Ocean Coast Manag. 2021, 214, 105916. [Google Scholar] [CrossRef]
  11. Bera, R.; Maiti, R. An Assessment of Coastal Vulnerability Using Geospatial Techniques. Environ. Earth Sci. 2021, 80, 1–18. [Google Scholar] [CrossRef]
  12. Szlafsztein, C.; Sterr, H. Coastal Zone Management Tool: A GIS-Based Vulnerability Assessment to Natural Hazards. Mangrove Dyn. Manag. N. Braz. 2010, 211, 365–385. [Google Scholar]
  13. Yahia Meddah, R.; Ghodbani, T.; Senouci, R.; Rabehi, W.; Duarte, L.; Teodoro, A.C. Estimation of the Coastal Vulnerability Index Using Multi-Criteria Decision Making: The Coastal Social–Ecological System of Rachgoun, Western Algeria. Sustainability 2023, 15, 12838. [Google Scholar] [CrossRef]
  14. Talukder, B.; Hipel, K.W. Review and Selection of Multi-Criteria Decision Analysis (MCDA) Technique for Sustainability Assessment. In Energy Systems Evaluation (Volume 1) Sustainability Assessment; Springer: Cham, Switzerland, 2021; pp. 145–160. [Google Scholar]
  15. Tavana, M.; Soltanifar, M.; Santos-Arteaga, F.J. Analytical Hierarchy Process: Revolution and Evolution. Ann. Oper. Res. 2023, 326, 879–907. [Google Scholar] [CrossRef]
  16. Cruz-Ramírez, C.J.; Chávez, V.; Silva, R.; Muñoz-Perez, J.J.; Rivera-Arriaga, E. Coastal Management: A Review of Key Elements for Vulnerability Assessment. J. Mar. Sci. Eng. 2024, 12, 386. [Google Scholar] [CrossRef]
  17. Priya Rajan, S.M.; Nellayaputhenpeedika, M.; Tiwari, S.P.; Vengadasalam, R. Mapping and Analysis of the Physical Vulnerability of Coastal Tamil Nadu. Hum. Ecol. Risk Assess. Int. J. 2020, 26, 1879–1895. [Google Scholar] [CrossRef]
  18. Zhang, Y.; Hou, X. Characteristics of Coastline Changes on Southeast Asia Islands from 2000 to 2015. Remote Sens. 2020, 12, 519. [Google Scholar] [CrossRef]
  19. ESRI Demographics Data. Available online: https://doc.arcgis.com/en/esri-demographics/latest/get-started/what-is-esri-demographics.htm (accessed on 19 August 2024).
  20. Geological Survey Department. Available online: https://www.moa.gov.cy/moa/gsd/gsd.nsf/dmlIndex_en/dmlIndex_en?opendocument (accessed on 19 August 2024).
  21. Polidorou, M.; Evelpidou, N. Geomorphology of the Coastal Sand Dune Fields and Their Association with the Palaeolandscape Evolution of Akrotiri Peninsula, Lemesos, Cyprus. Geosciences 2021, 11, 448. [Google Scholar] [CrossRef]
  22. Salomon, F.; Blue, L. Geoarchaeology of the Akrotiri Peninsula; University of Leicester: Leicester, UK, 2018. [Google Scholar]
  23. Thieler, E.R.; Hammar-Klose, E.S. National Assessment of Coastal Vulnerability to Sea-Level Rise: Preliminary Results for the U.S. Atlantic Coast; US Geological Survey: Reston, VA, USA, 1999.
  24. Pantusa, D.; D’Alessandro, F.; Riefolo, L.; Principato, F.; Tomasicchio, G.R. Application of a Coastal Vulnerability Index. A Case Study along the Apulian Coastline, Italy. Water 2018, 10, 1218. [Google Scholar] [CrossRef]
  25. Roukounis, C.N.; Tsihrintzis, V.A. Indices of Coastal Vulnerability to Climate Change: A Review. Environ. Process. 2022, 9, 29. [Google Scholar] [CrossRef]
  26. Hamid, A.I.A.; Din, A.H.M.; Yusof, N.; Abdullah, N.M.; Omar, A.H.; Abdul Khanan, M.F. Coastal vulnerability index development: A review. Int. Arch. Photogramm. Remote Sens. Spat. Inf. Sci. 2019, XLII-4/W16, 229–235. [Google Scholar] [CrossRef]
  27. Nourdi, N.F.; Raphael, O.; Achab, M.; Loudi, Y.; Rudant, J.-P.; Minette, T.E.; Kambia, P.; Claude, N.J.; Romaric, N. Integrated Assessment of Coastal Vulnerability in the Bonny Bay: A Combination of Traditional Methods (Simple and AHP) and Machine Learning Approach. Estuaries Coasts 2024. [Google Scholar] [CrossRef]
  28. Hammar-Klose, E.S.; Thieler, E.R. Coastal Vulnerability to Sea-Level Rise: A Preliminary Database for the US Atlantic, Pacific, and Gulf of Mexico Coasts; US Geological Survey: Reston, VA, USA, 2001; ISBN 0607965193.
  29. Korres, G.; Ravdas, M.; Zacharioudaki, A.; Denaxa, D.; Sotiropoulou, M. Mediterranean Sea Waves Analysis and Forecast (CMEMS MED-Waves, MedWAM3 System) (Version 1) [Data Set]; Copernicus Monitoring Environment Marine Service (CMEMS): Ramonville-Saint-Agne, France, 2021. [Google Scholar]
  30. Mohamed, S.A. Coastal Vulnerability Assessment Using GIS-Based Multicriteria Analysis of Alexandria-Northwestern Nile Delta, Egypt. J. Afr. Earth Sci. 2020, 163, 103751. [Google Scholar] [CrossRef]
  31. Pang, T.; Wang, X.; Nawaz, R.A.; Keefe, G.; Adekanmbi, T. Coastal Erosion and Climate Change: A Review on Coastal-Change Process and Modeling. Ambio 2023, 52, 2034–2052. [Google Scholar] [CrossRef] [PubMed]
  32. Wright, L.D.; Wu, W.; Morris, J. Coastal Erosion and Land Loss: Causes and Impacts BT. In Tomorrow’s Coasts: Complex and Impermanent; Wright, L.D., Nichols, C.R., Eds.; Springer International Publishing: Cham, Switzerland, 2019; pp. 137–150. ISBN 978-3-319-75453-6. [Google Scholar]
  33. Zanaga, D.; Van De Kerchove, R.; Daems, D.; De Keersmaecker, W.; Brockmann, C.; Kirches, G.; Wevers, J.; Cartus, O.; Santoro, M.; Fritz, S. ESA WorldCover 10 m 2021 V200. 2022. Available online: https://zenodo.org/records/7254221 (accessed on 19 August 2024).
  34. Komar, P.D. Beach-Slope Dependence of Longshore Currents. J. Waterw. Port Coast. Ocean. Div. 1979, 105, 460–464. [Google Scholar] [CrossRef]
  35. Lazarus, E.D.; Murray, A.B. Process Signatures in Regional Patterns of Shoreline Change on Annual to Decadal Time Scales. Geophys. Res. Lett. 2007, 34, 5. [Google Scholar] [CrossRef]
  36. Baig, M.R.I.; Ahmad, I.A.; Shahfahad; Tayyab, M.; Rahman, A. Analysis of Shoreline Changes in Vishakhapatnam Coastal Tract of Andhra Pradesh, India: An Application of Digital Shoreline Analysis System (DSAS). Ann. GIS 2020, 26, 361–376. [Google Scholar] [CrossRef]
  37. Jonah, F.E.; Mensah, E.A.; Edziyie, R.E.; Agbo, N.W.; Adjei-Boateng, D. Coastal Erosion in Ghana: Causes, Policies, and Management. Coast. Manag. 2016, 44, 116–130. [Google Scholar] [CrossRef]
  38. Kundu, K.; Mandal, J.K. Shoreline Change Detection and Future Prediction of Sundarban Delta Using Remote Sensing Data and Digital Shoreline Analysis System. J. Indian Soc. Remote Sens. 2024, 52, 485–503. [Google Scholar] [CrossRef]
  39. Sayre, R.; Butler, K.; Van Graafeiland, K.; Breyer, S.; Wright, D.; Frye, C.; Karagulle, D.; Martin, M.; Cress, J.; Allen, T. A Global Ecological Classification of Coastal Segment Units. Oceanography 2021, 34, 120–129. [Google Scholar] [CrossRef]
  40. Abuodha, P.A.O.; Woodroffe, C.D. Assessing Vulnerability to Sea-Level Rise Using a Coastal Sensitivity Index: A Case Study from Southeast Australia. J. Coast Conserv. 2010, 14, 189–205. [Google Scholar] [CrossRef]
  41. Kulp, S.A.; Strauss, B.H. New Elevation Data Triple Estimates of Global Vulnerability to Sea-Level Rise and Coastal Flooding. Nat. Commun. 2019, 10, 4844. [Google Scholar] [CrossRef] [PubMed]
  42. Gesch, D.B. Best Practices for Elevation-Based Assessments of Sea-Level Rise and Coastal Flooding Exposure. Front. Earth Sci. 2018, 6, 230. [Google Scholar] [CrossRef]
  43. Zhang, K.; Douglas, B.C.; Leatherman, S.P. Global Warming and Coastal Erosion. Clim. Change 2004, 64, 41–58. [Google Scholar] [CrossRef]
  44. Cooper, J.A.G.; Pilkey, O.H. Sea-Level Rise and Shoreline Retreat: Time to Abandon the Bruun Rule. Glob. Planet Change 2004, 43, 157–171. [Google Scholar] [CrossRef]
  45. Rovere, A.; Stocchi, P.; Vacchi, M. Eustatic and Relative Sea Level Changes. Curr. Clim. Change Rep. 2016, 2, 221–231. [Google Scholar] [CrossRef]
  46. Ellison, J.; Strickland, P. Establishing Relative Sea Level Trends Where a Coast Lacks a Long Term Tide Gauge. Mitig. Adapt. Strateg. Glob. Change 2015, 20, 1211–1227. [Google Scholar] [CrossRef]
  47. Hastuti, A.W.; Nagai, M.; Suniada, K.I. Coastal Vulnerability Assessment of Bali Province, Indonesia Using Remote Sensing and GIS Approaches. Remote Sens. 2022, 14, 4409. [Google Scholar] [CrossRef]
  48. Balica, S.F.; Wright, N.G.; van der Meulen, F. A Flood Vulnerability Index for Coastal Cities and Its Use in Assessing Climate Change Impacts. Nat. Hazards 2012, 64, 73–105. [Google Scholar] [CrossRef]
  49. Calil, J.; Reguero, B.G.; Zamora, A.R.; Losada, I.J.; Méndez, F.J. Comparative Coastal Risk Index (CCRI): A Multidisciplinary Risk Index for Latin America and the Caribbean. PLoS ONE 2017, 12, e0187011. [Google Scholar] [CrossRef]
  50. Mani Murali, R.; Ankita, M.; Amrita, S.; Vethamony, P. Coastal Vulnerability Assessment of Puducherry Coast, India, Using the Analytical Hierarchical Process. Nat. Hazards Earth Syst. Sci. 2013, 13, 3291–3311. [Google Scholar] [CrossRef]
  51. Gaki-Papanastassiou, K.; Karymbalis, E.; Poulos, S.; Seni, A.; Zouva, C. Coastal Vulnerability Assessment to Sea-Level Rise Bαsed on Geomorphological and Oceanographical Parameters: The Case of Argolikos Gulf, Peloponnese, Greece*. Hell. J. Geosci. 2010, 45, 109–122. [Google Scholar]
  52. Karymbalis, E.; Chalkias, C.; Chalkias, G.; Grigoropoulou, E.; Manthos, G.; Ferentinou, M. Assessment of the Sensitivity of the Southern Coast of the Gulf of Corinth (Peloponnese, Greece) to Sea-Level Rise. Open Geosci. 2012, 4, 561–577. [Google Scholar] [CrossRef]
  53. Manno, G.; Azzara, G.; Lo Re, C.; Martinello, C.; Basile, M.; Rotigliano, E.; Ciraolo, G. An Approach for the Validation of a Coastal Erosion Vulnerability Index: An Application in Sicily. J. Mar. Sci. Eng. 2022, 11, 23. [Google Scholar] [CrossRef]
  54. Pantusa, D.; D’Alessandro, F.; Frega, F.; Francone, A.; Tomasicchio, G.R. Improvement of a Coastal Vulnerability Index and Its Application along the Calabria Coastline, Italy. Sci. Rep. 2022, 12, 21959. [Google Scholar]
  55. Tragaki, A.; Gallousi, C.; Karymbalis, E. Coastal Hazard Vulnerability Assessment Based on Geomorphic, Oceanographic and Demographic Parameters: The Case of the Peloponnese (Southern Greece). Land 2018, 7, 56. [Google Scholar] [CrossRef]
  56. Zampazas, G.; Karymbalis, E.; Chalkias, C. Assessment of the Sensitivity of Zakynthos Island (Ionian Sea, Western Greece) to Climate Change-Induced Coastal Hazards. Z. Geomorphol. 2022, 63, 183–200. [Google Scholar] [CrossRef]
  57. Natesan, U.; Parthasarathy, A.; Vishnunath, R.; Kumar, G.E.J.; Ferrer, V.A. Monitoring Longterm Shoreline Changes along Tamil Nadu, India Using Geospatial Techniques. Aquat. Procedia 2015, 4, 325–332. [Google Scholar] [CrossRef]
  58. Boumboulis, V.; Apostolopoulos, D.; Depountis, N.; Nikolakopoulos, K. The Importance of Geotechnical Evaluation and Shoreline Evolution in Coastal Vulnerability Index Calculations. J. Mar. Sci. Eng. 2021, 9, 423. [Google Scholar] [CrossRef]
  59. Hzami, A.; Heggy, E.; Amrouni, O.; Mahé, G.; Maanan, M.; Abdeljaouad, S. Alarming Coastal Vulnerability of the Deltaic and Sandy Beaches of North Africa. Sci. Rep. 2021, 11, 2320. [Google Scholar] [CrossRef]
  60. Rizzo, A.; Vandelli, V.; Buhagiar, G.; Micallef, A.S.; Soldati, M. Coastal Vulnerability Assessment along the North-Eastern Sector of Gozo Island (Malta, Mediterranean Sea). Water 2020, 12, 1405. [Google Scholar] [CrossRef]
  61. Ghoussein, Y.; Mhawej, M.; Jaffal, A.; Fadel, A.; El Hourany, R.; Faour, G. Vulnerability Assessment of the South-Lebanese Coast: A GIS-Based Approach. Ocean Coast Manag. 2018, 158, 56–63. [Google Scholar] [CrossRef]
  62. Chaib, W.; Guerfi, M.; Hemdane, Y. Evaluation of Coastal Vulnerability and Exposure to Erosion and Submersion Risks in Bou Ismail Bay (Algeria) Using the Coastal Risk Index (CRI). Arab. J. Geosci. 2020, 13, 420. [Google Scholar] [CrossRef]
  63. Gkaifyllia, A.; Sahtouris, S.; Ðorđević, N.; Papasarafianou, S.; Monioudi, I.; Tzoraki, O.; Hasiotis, T. Coastal Zone Vulnerability Analysis in East Mediterranean Basin: Greece, Cyprus and Montenegro. In Proceedings of the 18th International Conference on Environmental Science and Technology (CEST2023), Athens, Greece, 30 August–2 September 2023; Volume 18, p. 4. [Google Scholar]
  64. Déguénon, S.D.D.M.; Adade, R.; Teka, O.; Aheto, D.W.; Sinsin, B. Sea-Level Rise and Flood Mapping: A Review of Models for Coastal Management. Nat. Hazards 2024, 120, 2155–2178. [Google Scholar] [CrossRef]
  65. Soukissian, T.; Sotiriou, M.-A. Long-Term Variability of Wind Speed and Direction in the Mediterranean Basin. Wind 2022, 2, 513–534. [Google Scholar] [CrossRef]
  66. Evagorou, E.; Mettas, C.; Hadjimitsis, D. Satellite-Derived Bathymetry for Shallow Coastal Waters in Cyprus. In Remote Sensing of the Ocean, Sea Ice, Coastal Waters, and Large Water Regions 2021, Proceedings of the SPIE Remote Sensing, Online Only, Spain, 13–18 September 2021; Bostater, C.R., Neyt, X., Eds.; SPIE: Bellingham, WA, USA, 2021; p. 2. [Google Scholar]
  67. Saengsupavanich, C. Flaws in Coastal Erosion Vulnerability Assessment: Physical and Geomorphological Parameters. Arab. J. Geosci. 2022, 15, 57. [Google Scholar] [CrossRef]
  68. Konstantinou, A. Charalambous Mikaela Sketches in the Landscape—Zapalo 2017; Aristotle University of Thessaloniki: Thessaloniki, Greece, 2017. (In Greek) [Google Scholar]
  69. Toumazis, A.; Kyrou, K.; Iacovou, N.; Sophos, J.; Zervos, S.; Anastasakis, G. Pre-Reservoirs: A Sustainable Solution for Eroding Beaches/Deltas of Dammed Rivers. WIT Trans. Built Environ. 2008, 99, 179–188. [Google Scholar]
  70. Cleridou, N.; Benas, N.; Matsoukas, C.; Croke, B.; Vardavas, I. Water Resources of Cyprus under Changing Climatic Conditions: Modelling Approach, Validation and Limitations. Environ. Model. Softw. 2014, 60, 202–218. [Google Scholar] [CrossRef]
  71. Crawford, A. The Changing Maritime Landscape of the Akrotiri Peninsula (1650 BC–AD 650). Master’s Thesis, University of Southampton, Southampton, UK, 2016. [Google Scholar]
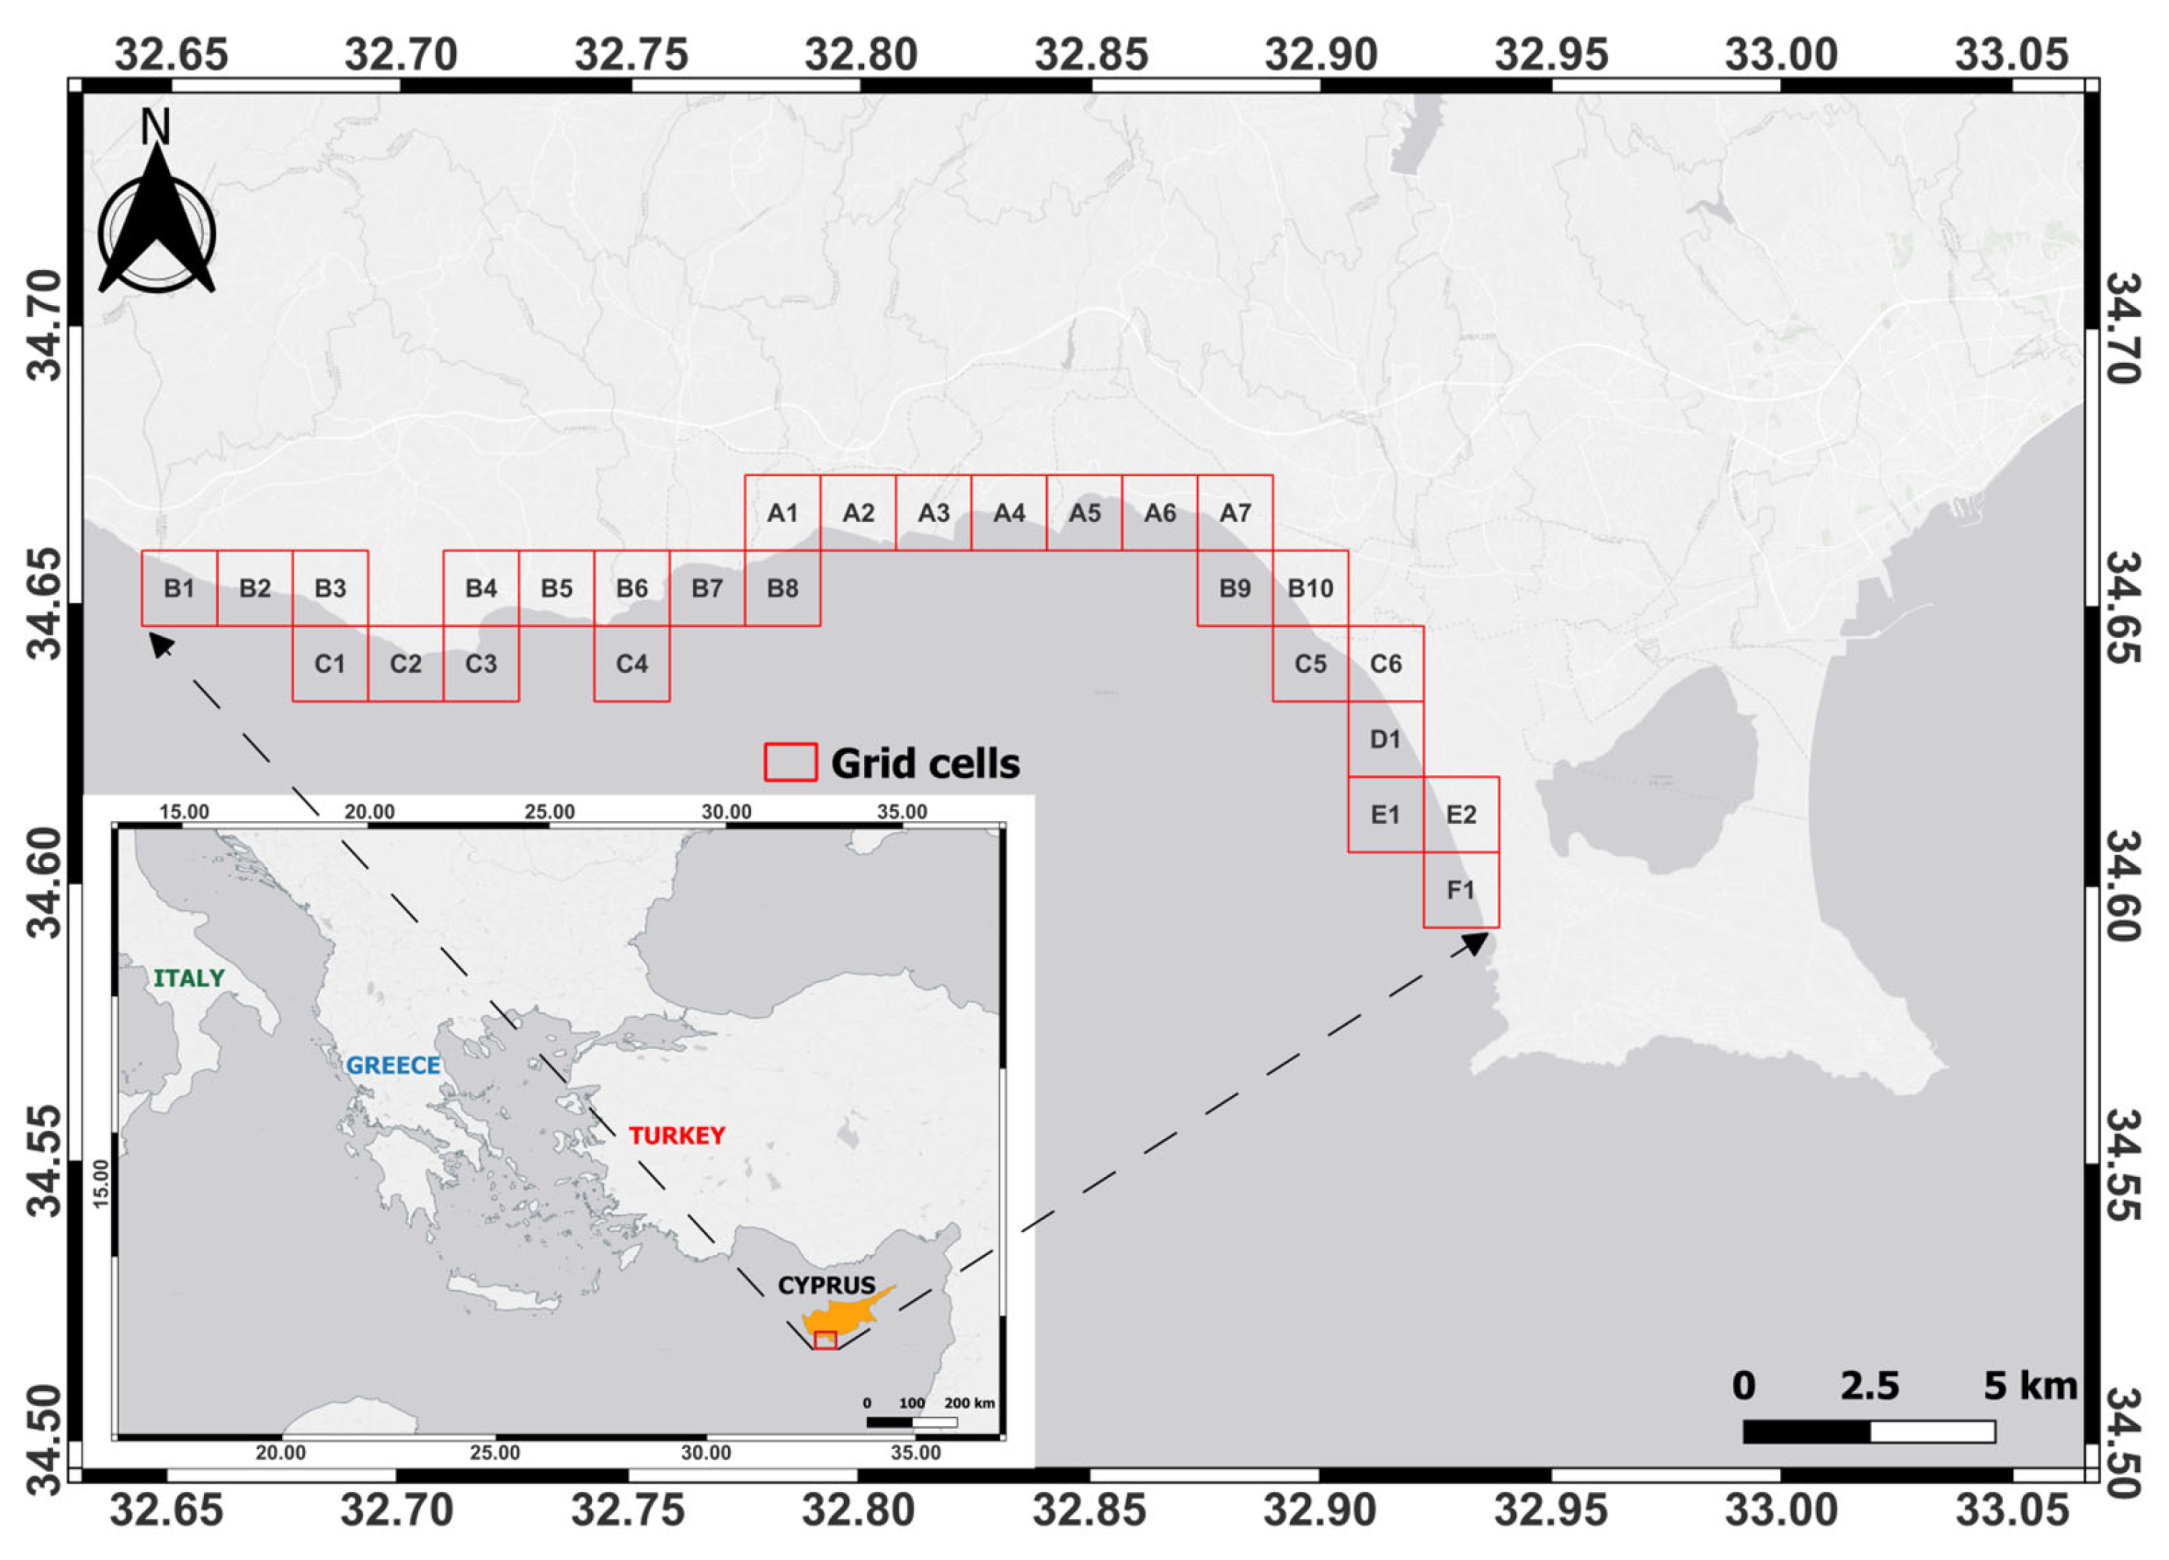
Figure 1. The study area with grid cells along the shoreline.
Remotesensing 16 03688 g001
Figure 2. A flow chart presenting the process of calculating the CVI.
Remotesensing 16 03688 g002
Figure 3. Vulnerability level of (a) land cover, (b) coastal slope, (c) coastal erosion rate, (d) mean tidal range, (e) mean significant wave height, (f) coastal elevation, (g) relative sea-level rise, and (h) coastal geomorphology. Pie charts indicate the percentage occupied by each rank, while the number of transects for each rank are in parentheses.
Remotesensing 16 03688 g003
Figure 4. ESA Worldcover and pie chart with the percentages of spatial distribution per land-cover class inside the grid cells.
Remotesensing 16 03688 g004
Figure 5. (a) Shoreline evolution of the study area by LRR (m/year) between 1963 and 2019. The pie chart indicates the percentage distribution of the LRR, while in parentheses are the numbers of transects for each rank. (b) Bar chart of LRR per grid cell. (c) Bar chart of LRR per transect ID. (d) Map of LRR, with the most significant erosion occurring in grid cells A5–A6. (e) Map of LRR showing the most significant accretion, which occurred in grid cell A4.
Remotesensing 16 03688 g005
Figure 6. (a) The CVI map of the study area. The pie chart shows the percentage distribution of the CVI, while the numbers of transects for the CVI scores are in parentheses. (b) Bar chart of CVI per grid cell.
Remotesensing 16 03688 g006
Table 1. Data and processing steps used per factor.
LabelFactorProcessing StepsSpatial ResolutionTime PeriodData and Sources
(a)Land cover
  • Extract by mask the Limassol district’s latest shoreline (2019) according to a polygon created by a buffer (1 km)
  • Extract the required classes
  • Assign weights
  • Convert rasters to points
  • Add spatial joining of points’ attributes and shoreline
10 m2021
(b)Coastal slope (%)
  • Calculate the slope percentage from the Digital Elevation Model (DEM) (f)
  • Extract by mask according to the buffered polygon (see above)
  • Assign weights
5 m-
  • DEM derived from DLS in raster format (5 m spatial resolution)
(c)Rate of coastline erosion (m/year)<0.15 mShorelines from 1963, 1993, 2003, 2008, 2009, and 2019
  • Shorelines extracted from DLS aerial photographs and processed through DSAS software (Version 6.0)
(d)Mean tidal range (m)
  • Extract TIDAL_RANG from the Ecological Coastal Unit (ECU) database (see Data and Sources) for the area of Cyprus
  • Features to point
  • Interpolation within the extent of the buffered shoreline (see above)
  • Assign weights
30 m2014
(e)Mean significant wave height (m)
  • Raster to point
  • Interpolation within the extent of the buffered polygon (see above)
  • Assign weights
0.2 deg~22.2 km1993–2023
(f)Coastal elevation (m)
  • Extract by mask according to the buffered polygon (see above)
  • Assign weights
5 m-
  • Refer to the Data and Sources for coastal slope factor
(g)Relative sea-level rise (mm/year)
  • Raster to point
  • Interpolation within the extent of the buffered polygon (see above)
  • Assign weights
~4 km1993–2012
(h)Coastal geomorphology
  • Calculate the geomorphological pattern of each raster cell from DEM and match the landform classes
  • Assign weights
5 m-
  • Refer to the Data and Sources for coastal slope factor
Table 3. CVI value ranges calculated for this study.
Quartile RangeCVI
0–20%2.73–5.8
20–40%5.8–10.06
40–60%10.06–19.36
60–80%19.36–25.98
80–100%25.98–37.5
Disclaimer/Publisher’s Note: The statements, opinions and data contained in all publications are solely those of the individual author(s) and contributor(s) and not of MDPI and/or the editor(s). MDPI and/or the editor(s) disclaim responsibility for any injury to people or property resulting from any ideas, methods, instructions or products referred to in the content.