Article

Rotational Motion Compensation for ISAR Imaging Based on Minimizing the Residual Norm

by
Xiaoyu Yang
,
Weixing Sheng
*,
Annan Xie
and
Renli Zhang
School of Electronic and Optical Engineering, Nanjing University of Science and Technology, Nanjing 210094, China
*
Author to whom correspondence should be addressed.
Remote Sens. 2024, 16(19), 3629; https://doi.org/10.3390/rs16193629
Submission received: 31 July 2024 / Revised: 4 September 2024 / Accepted: 26 September 2024 / Published: 28 September 2024

Abstract

:
In inverse synthetic aperture radar (ISAR) systems, image quality often suffers from the non-uniform rotation of non-cooperative targets. Rotational motion compensation (RMC) is necessary to perform refocused ISAR imaging via estimated rotational motion parameters. However, estimation errors tend to accumulate with the estimated processes, deteriorating the image quality. A novel RMC algorithm is proposed in this study to mitigate the impact of cumulative errors. The proposed method uses an iterative approach based on a novel criterion, i.e., the minimum residual norm of the signal phases, to estimate different rotational parameters independently to avoid the issue caused by cumulative errors. First, a refined inverse function combined with interpolation is proposed to perform the RMC procedure. Then, the rotation parameters are estimated using an iterative procedure designed to minimize the residual norm of the compensated signal phases. Finally, with the estimated parameters, RMC is performed on signals in all range bins, and focused images are obtained using the Fourier transform. Furthermore, this study utilizes simulated and real data to validate and evaluate the performance of the proposed algorithm. The experimental results demonstrate that the proposed algorithm shows dominance in the aspects of estimation accuracy, entropy values, and focusing characteristics.

1. Introduction

Inverse synthetic aperture radar (ISAR) can obtain high-resolution 2D images of non-cooperative targets to capture significant information, such as the size, shape, and 2D distribution, which is of great help in civilian and military applications. On one hand,  high-range resolution is achieved by transmitting wideband pulse signals. On the other hand, when the target rotates uniformly relative to the radar, the cross-range distribution of scatterers on the target is linearly related to the Doppler frequency. Thus, high cross-range resolution can be achieved via a coherent integration of target echoes.
The range-Doppler algorithm (RDA) is a classical ISAR imaging algorithm [1,2,3,4,5]. Before performing imaging procedures in the cross-range dimension using the Fourier transform, the RDA requires translational motion compensation (TMC) techniques to eliminate envelope shifts and phase errors caused by translational motion. Generally, TMC techniques are divided into two steps: envelope alignment [6] and phase error correction [7]. The first step involves aligning the real envelopes of the echoes in the range dimension. The second step aims to eliminate the phase distortion caused by translational motion. However, if the target moves with non-uniform rotation, the time-varying Doppler characteristics of the received signals may lead to a defocused image, showing the ineffectiveness of the RDA.
To solve the above issue, RMC was introduced into ISAR imaging [8,9,10,11]. Currently, RMC can be categorized into two groups: non-parametric and parametric methods. Non-parametric methods, which are based on time–frequency analysis techniques, are effective in obtaining time–frequency diagrams for each range bin [12,13,14,15]. Subsequently, all time–frequency diagrams are sorted according to slow time. ISAR images are then obtained by selecting different imaging moments (slicing the three-dimensional data). Conventional time–frequency analysis methods include the short-time Fourier transform (STFT), Wigner–Ville distribution, and range instantaneous Doppler (RID). Despite their effectiveness, non-parametric methods are difficult to implement in engineering due to their heavy computational load. In addition, due to the shorter length of the window function than that of a full aperture, the resolution when using time–frequency analysis techniques is worse.
Since targets usually exhibit complex second-, third-, or even higher-order motion due to their non-cooperative characteristics, parametric methods use different rotational parameter estimation functions to reconstruct signals with linearly varying Doppler frequencies to achieve RMC. For instance, an integrated cubic phase function (ICPF)–prominent point processing (PPP) algorithm [16] was proposed to estimate first-order and second-order coefficients of echoes using ICPF. To refocus blurred ISAR images for maneuvering targets in a low-SNR environment, coherently integrated generalized CPF (CIGCPF) and coherently integrated CPF (CICPF) were developed to accomplish RMC [17]. For a target with 3D rotation and third-order motions, an ISAR imaging method under low-SNR conditions was proposed by utilizing a symmetrical instantaneous autocorrelation function  [18]. In addition, the coherently integrated modified cubic phase function (CIMCPF) and the coherently integrated modified high-order ambiguous function (CIMHAF) were proposed for estimating the second-order and third-order rotational parameters, respectively; meanwhile, NUFFT was also added to reduce the computational load [19]. Furthermore, for targets with third-order non-uniform rotation, many methods were proposed to accomplish RMC, such as a method that combined the integrated parametric cubic phase function (IPCPF) with the reverse Wigner–Ville distribution [20], a method using a third-order autocorrelation function (TOAF) [21], a method using a coherently integrated non-uniform trilinear autocorrelation function (CINTAF) [22], and a method using an optimized non-uniform rotation transform [23]. Additionally, the exhaustive search method and particle swarm optimization (PSO) algorithm can also be applied when estimating rotational parameters [24,25]. Nevertheless, the parametric methods mentioned above have several disadvantages. (1) Estimation errors accumulate with estimated processes, leading to defocused images. (2) Algorithms cause excessive computational load and tend to converge to local optima, with reduced robustness. (3) With the increase in the accumulation angle and azimuth resolution, estimation errors gradually deteriorate the ISAR image quality. Hence, proposing an ISAR imaging method that is not only not affected by estimation errors but is also easy to implement in engineering is an interesting investigation.
To overcome these challenges, a novel RMC method based on minimizing the residual norm is proposed in this study. The contributions of this study can be summarized as follows:
  • An iterative optimization method is designed to estimate rotational parameters independently to address the issue in RMC algorithms where high-order parameter errors lead to the incorrect estimation of low-order parameters, as well as to improve the RMC performance more robustly.
  • The residual norm of compensated signal phases after phase linear fitting is used instead of the Shannon entropy to evaluate image quality, reducing the computational complexity.
  • An inverse function expression is derived with better accuracy in order to accomplish RMC.
The remainder of this study is structured as follows. Section 2 models the ISAR echoes. Section 3 introduces and summarizes the proposed RMC algorithm. Section 4 presents simulation experiments and evaluates the algorithm’s performance. Finally, conclusions are drawn in Section 5.

2. Signal Model

In an ISAR system, the repetition interval of the transmitted pulse, which is defined as the pulse repetition interval (PRI) or slow time, represents a fundamental processing period for the radar receiver and signal processor. Following the application of pulse compression processing to the received echo signals along fast time, it is possible to obtain high-resolution range profiles (HRRPs) of strong scatterers on the target. Subsequently, the entire radial distance corresponding to the PRI duration can be divided into a series of range bins. The radar transmits a series of pulses, samples the returns from each, and processes these samples coherently. This set of pulses constitutes a coherent processing interval (CPI) or slow time. Following the processing of each PRI within a CPI, a number of HRRPs for the targets can be obtained. By processing the echo signals in a given range bin from all PRIs in a CPI, the distribution of the strong scatterers on the target in the cross-range dimension can be achieved. The combination of the distribution along range bins with that along cross-range bins allows the creation of a two-dimensional ISAR image of the target’s strong scatterers.
Figure 1 illustrates a geometric model of the ISAR imaging of a non-uniformly rotating target in a Cartesian coordinate system as OXY , where origin O denotes the geometric center (rotation center). Then, the image projection plane is denoted by IPP . R t represents the distance between the radar and the geometric center of the target, and  θ t represents the counterclockwise rotation angle of the target, where t denotes the slow-time variable. Considering an arbitrary strong scatterer with the position of x k , y k on the target, its echo amplitude is denoted as A k . After down-sampling and pulse compression, the echoes received from different strong scatterers in the cross-range of the nth range bin can be given approximately by
s n t k = 1 K n A k e j 4 π f c c R t + x k + y k θ t ,
where K n denotes the total number of strong scatterers in the nth range bin, with  k = 1 , 2 , 3 , , K n . f c is the center frequency of the transmitted signal, and c is the speed of light. This study primarily focuses on RMC, so it is assumed that TMC has been effectively completed, that is, the variation in R t over time is fully compensated. Next, θ t can be expanded with the Taylor series as follows:
θ t = θ 0 + ω t + 1 2 ! α t 2 + ,
where θ 0 , ω , and  α denote the initial angle, angular velocity of rotation, and angular acceleration of the target, respectively. The orders of the Taylor series are related to the complexity of the target’s rotation. The higher the order is, the more complex the target’s rotation is, and vice versa. Considering a second-order Taylor series expansion of the target’s rotation and substituting (2) into (1) yields
s n t k = 1 K n A k e j 4 π f c c x k + y k θ 0 + y k ω t + 1 2 y k α t 2 ,
where A k denotes the new echo amplitude after compensating R t . Since the constant phase terms in (3) do not contribute to cross-range imaging, they can be omitted. After simplification, we have
s n t k = 1 K n A k e j 4 π f c c y k ω t + 1 2 y k α t 2 .
The first phase term in (4) is related to the target’s angular rotation velocity, which is a first-order parameter. With this first-order parameter, the cross-range distribution of strong scatterers on the target can be obtained by using the Fourier transform. On the other hand, the second phase term in (4) is determined by the target’s angular rotation acceleration, resulting in quadratical variation in the Doppler frequency with slow time and leading to blurred imaging.
Given that the target is typically a rigid body, the motion forms of all strong scatterers on the target are basically consistent. Consequently, when analyzing the echo data and estimating the rotation parameters, the scatterers in the dominant range bin can be used to represent the motion of the target, which can decrease the computational load. In this study, ANV [26] is adopted to select the dominant range bin as follows:
δ n = 1 E s n t 2 E s n t 2 ,
where δ n represents the ANV of echoes in the nth range bin, and  E ( · ) denotes the expectation operation; then, the ANV of echoes in all range bins is sorted from small to large as follows:
δ n 1 < δ n 2 < δ n 3 < < δ n N ,
where n j represents an index of the range bin with the jth ANV, and N denotes the total number of range bins. We select the n 1 th range bin with the smallest ANV as the dominant range bin, which is most likely to contain the dominant scatterers among all range bins. Although some weak scatterers may exist in the same range bin, the strength of the dominant scatterer is much higher than that of the weak scatterers; s n 1 t can be approximated as
s n 1 t A p e j 4 π f c c y p ω t + 1 2 y p α t 2 = A p e j φ 1 t + φ 2 t 2 = A p e j h p ( t ) ,
where p indicates the index of a dominant scatterer in the cross-range direction. φ 1 = 4 π f c c y p ω , φ 2 = 1 2 4 π f c c y p α , and  h p ( t ) = φ 1 t + φ 2 t 2 . To achieve a well-focused ISAR image, RMC processing is necessary to convert the phase item h p ( t ) from a nonlinear variation into a linear one.
It is assumed that a CPI contains M PRIs. The echo signal in each range bin is sampled per PRI, and the slow-time variable of the mth PRI is denoted by t m as t m = m T P R I , m = 0 , 1 , , M 1 , where T P R I denotes the pulse repetition interval. Hence, the discrete expression of (7) is written as
s n 1 t m A p e j φ 1 t m + φ 2 t m 2 = A p e j h p ( t m ) ,
where h p ( t ) can be rewritten in the following discrete form:
h p ( t m ) = φ 1 t m + φ 2 t m 2 .

3. Proposed RMC Algorithm for ISAR Imaging

In this section, the proposed algorithm will be introduced, and it mainly includes three parts: rotational motion compensation based on the inverse function method, an estimation of rotational parameters based on the minimum residual norm, and a summary of the proposed method. As shown in Figure 2, TMC and a selection of dominant range bins are applied first in the target echoes; then, the rotational parameters φ 1 and φ 2 in (9) are estimated with an iterative searching method based on the minimum residual norm as a criterion, which is based on the inverse function and interpolation to accomplish RMC. With the estimated parameters substituted, RMC is accomplished for echoes in all range bins. Finally, FT is performed in azimuthal bins to generate ISAR images.

3.1. Rotational Motion Compensation Based on the Inverse Function Method

As mentioned in Section 2, RMC processing is used to convert the phase item h p ( t m ) of echoes from a nonlinear variation in slow time t m into a linear one so that focused ISAR images can be obtained.
The inverse function method is an effective way to linearize nonlinear functions. Regardless of the nonlinear function y = f ( x ) , if the expression for its inverse function x = f 1 y can be found, there will always be z = f 1 y = f 1 f ( x ) = x . In our proposed method, the inverse function of the second-order nonlinear rotation phase function corresponding to (9) is derived, and a more accurate inverse function expression that differs from that in [27] is obtained.
The second-order nonlinear rotation phase function of (9) can be rewritten as follows:
h p φ 2 = φ 1 φ 2 t m + t m 2 .
Then,
h p φ 2 + φ 1 2 φ 2 2 = φ 1 2 φ 2 2 + φ 1 φ 2 t m + t m 2 ,
and then,
h p φ 2 + φ 1 2 φ 2 2 = t m + φ 1 2 φ 2 2 ,
so the inverse function expression of (9) is
t m = ± h p φ 2 + φ 1 2 φ 2 2 φ 1 2 φ 2 .
With this inverse function expression of (9), negative time cases are ignored, and a new slow-time variable t ^ m can be obtained as follows:
t ^ m = h p 1 ( t m ) = 1 φ 2 t m + φ 1 2 φ 2 2 φ 1 2 φ 2 ,
where h p t ^ m = h p h p 1 t m = t m .
Let m ^ = r o u n d t ^ m T P R I ; the echo signals at t ^ m can be estimated through linear interpolation [28].
s n 1 ( t ^ m ) = s n 1 ( t m ^ ) + s n 1 ( t m ^ + 1 ) s n 1 ( t m ^ ) T P R I ( t ^ m t m ^ ) .
With compensated echo signals s n 1 t ^ m , the Fourier transform is then adopted, and the cross-range distribution of strong scatterers on the radar target can be estimated.

3.2. Rotational Parameter Estimation Based on the Minimum Residual Norm

In our proposed method, the rotational parameters ( φ 1 , φ 2 ) in (9) and (14) are estimated using an iterative approach by minimizing the residual norm between a compensated phase vector and a linearly fitted phase vector.
Due to the cyclic feature in the spectral transformation of the sampled signals, rotational parameters exhibit periodic ambiguity [29,30,31]. Therefore, we can confine the parameter search space within φ 1 [ π , π ] and φ 2 [ π / N , π / N ] . Initially, we set φ 1 ( 0 ) = π and φ 2 ( 0 ) = π / N , respectively. Then, we calculate the new slow-time variable using (14) in the first round:
t ^ m ( 0 ) = 1 φ 2 ( 0 ) t m + φ 1 ( 0 ) 2 φ 2 ( 0 ) 2 φ 1 ( 0 ) 2 φ 2 ( 0 ) .
The compensated echo signals at s n 1 t ^ m ( 0 ) can be estimated through linear interpolation with (15), and the phase of the compensated echo signals can be obtained as h p t ^ m ( 0 ) .
To verify the phase linearity of the compensated echo signal, we try to find a straight line of the phase versus the new slow time h ˜ p ( t ^ m ( 0 ) ) = g t ^ m ( 0 ) + c to fit the phase of the compensated echo signal. The ordinary least squares (OLS) method from [32,33] can be adopted to estimate the coefficients of the linearly fitted phase line as follows:
g = M m = 0 M 1 t ^ m ( 0 ) h p ( t ^ m ( 0 ) ) m = 0 M 1 t ^ m ( 0 ) m = 0 M 1 h p ( t ^ m ( 0 ) ) M m = 0 M 1 t ^ m ( 0 ) 2 m = 0 M 1 t ^ m ( 0 ) 2 , c = m = 0 M 1 h p ( t ^ m ( 0 ) ) g m = 0 M 1 t ^ m ( 0 ) M ,
and the linearly fitted phase line can be written as
h ˜ p ( t ^ m ( 0 ) ) = g t ^ m ( 0 ) + c .
We define a residual norm between the compensated phase vector and a linearly fitted phase vector as
ε ( 0 ) = m = 0 M 1 h ˜ p ( t ^ m ( 0 ) ) h p ( t ^ m ( 0 ) ) .
We can see that the residual norm represents the estimation accuracy of the rotational parameters. The smaller the residual norm is, the more accurate the estimated rotational parameters are.
To find the optimal rotational parameters with the minimum residual norm, a simple global search method is used. Rotational parameters are updated within their spans, and the corresponding residual norm is calculated. Thus, the optimal rotational parameters can be obtained with the recorded minimum residual norm.
The rotational parameters are updated as follows:
φ 1 ( i + 1 ) = φ 1 ( i ) + Δ φ 1 , φ 2 ( i + 1 ) = φ 2 ( i ) + Δ φ 2 ,
and the iteration will terminate when the rotational parameters traverse the search space [ π , π ] and [ π / N , π / N ] completely, where Δ φ 1 and Δ φ 2 denote the update steps of φ 1 and φ 2 , and  φ 1 ( i ) and φ 2 ( i ) denote φ 1 and φ 2 in the ith round, respectively. After iteration, the optimal estimated rotational parameters corresponding to the smallest residual norm are denoted as φ ^ 1 and φ ^ 2 . Then, RMC is performed in all range bins by using φ ^ 1 and φ ^ 2 .

3.3. Algorithm Summary

The implementation steps are summarized in Algorithm 1.
Algorithm 1 Minimum residual norm search procedure
  • Initialize  φ 1 ( 0 ) , φ 2 ( 0 ) , Δ φ 1 , Δ φ 2 , i = 0
  • Repeat
  •        Update φ 1 ( i ) with (20).
  •        Repeat
  •            Update φ 2 ( i ) with (20).
  •            Step 1: Solve the new slow time with (14).
  •                          t ^ m ( i ) = 1 φ 2 ( i ) t m + φ 1 ( i ) 2 φ 2 ( i ) 2 φ 1 ( i ) 2 φ 2 ( i ) .
  •            Step 2: Obtain the phase after interpolation via (15).
  •                        h p ( t ^ m ( i ) ) = B p ( i ) t ^ m ( i ) , where B p ( i ) is a proportional factor of h p ( t ^ m ( i ) ) .
  •            Step 3: Linear fitting to signal phases with (17) and (18).
  •                          h ˜ p ( t ^ m ( i ) ) = g t ^ m ( i ) + c .
  •                          g = M m = 0 M 1 t ^ m ( 0 ) h p ( t ^ m ( 0 ) ) m = 0 M 1 t ^ m ( 0 ) m = 0 M 1 h p ( t ^ m ( 0 ) ) M m = 0 M 1 t ^ m ( 0 ) 2 m = 0 M 1 t ^ m ( 0 ) 2 , c = m = 0 M 1 h p ( t ^ m ( 0 ) ) g m = 0 M 1 t ^ m ( 0 ) M .
  •            Step 4: Calculate the residual norm with (19).
  •                          ε ( i ) = m = 0 M 1 h ˜ p ( t ^ m ( i ) ) h p ( t ^ m ( i ) ) .
  •            Step 5: Compare ε ( i ) with ε ( i 1 ) . If  ε ( i ) is smaller, save φ 1 ( i ) , φ 2 ( i ) ; otherwise, retain them.
  •            Step 6: i = i + 1 .
  •        Until  φ 1 ( i ) traverses the range [ π , π ] completely.
  • Until  φ 2 ( i ) traverses the range [ π / N , π / N ] completely.
  • Output  φ ^ 1 , φ ^ 2 corresponding to the smallest ε .
  • Finally, RMC for signals in all range bins using (13) and φ ^ 1 , φ ^ 2 .
The algorithm mainly involves three operations: the calculation of t ^ m , linear interpolations, and linear fittings. Their computational complexities are O M , O log 2 M , and O M , respectively, where M represents the number of PRIs within a CPI. Combined with the iterative searching procedure, the overall computational complexity of the proposed algorithm is O [ max M , N log 2 M ] .

4. Simulation and Performance Evaluation and Verification

In this section, simulated data from an ideal point scatter target model, full-wave electromagnetic simulation data of an airplane 3D conducting body model, and actual radar measurement data from an aircraft target are used to validate the effectiveness of the proposed algorithm. Additionally, some ISAR imaging and RMC methods, including RD [5], RID [15], AJTF [24], PSO [25], LVD [34], and ICPF [16], are performed for comparisons. The simulations were performed using AMD Ryzen 7 5800H with Radeon Graphics.

4.1. Simulation Data from an Ideal Point Scatter Target Model

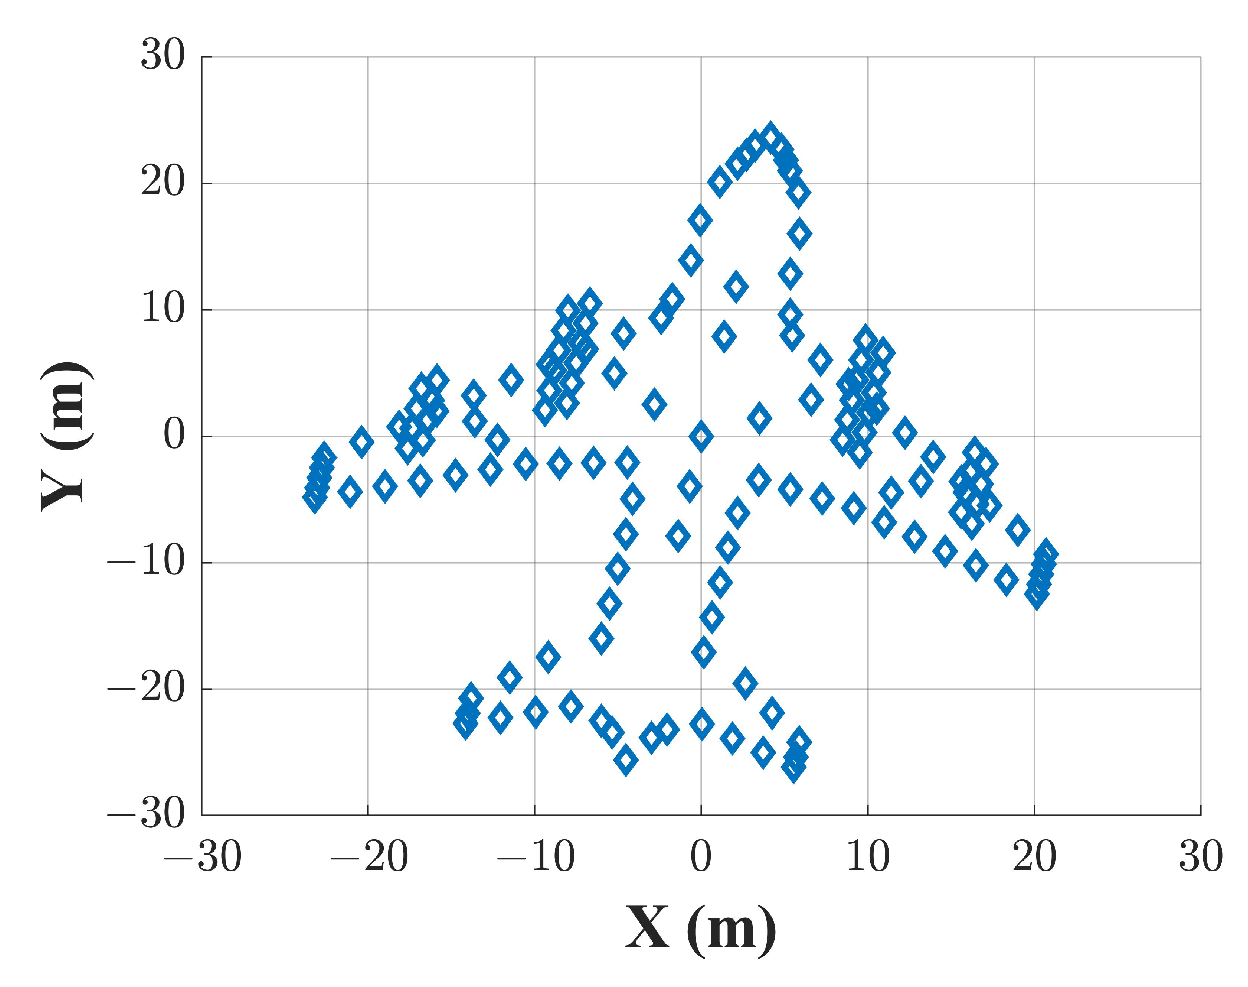
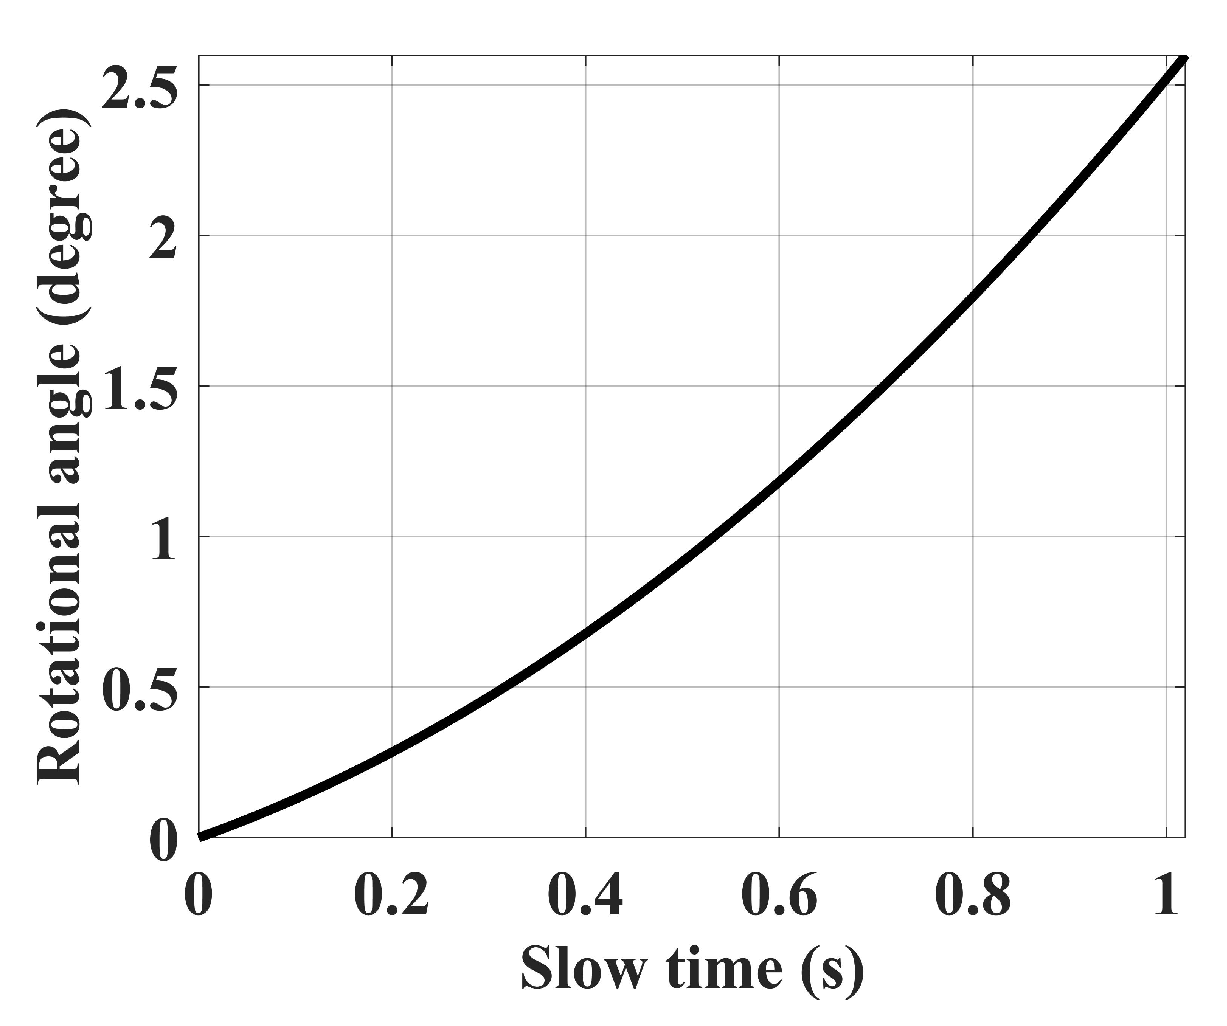
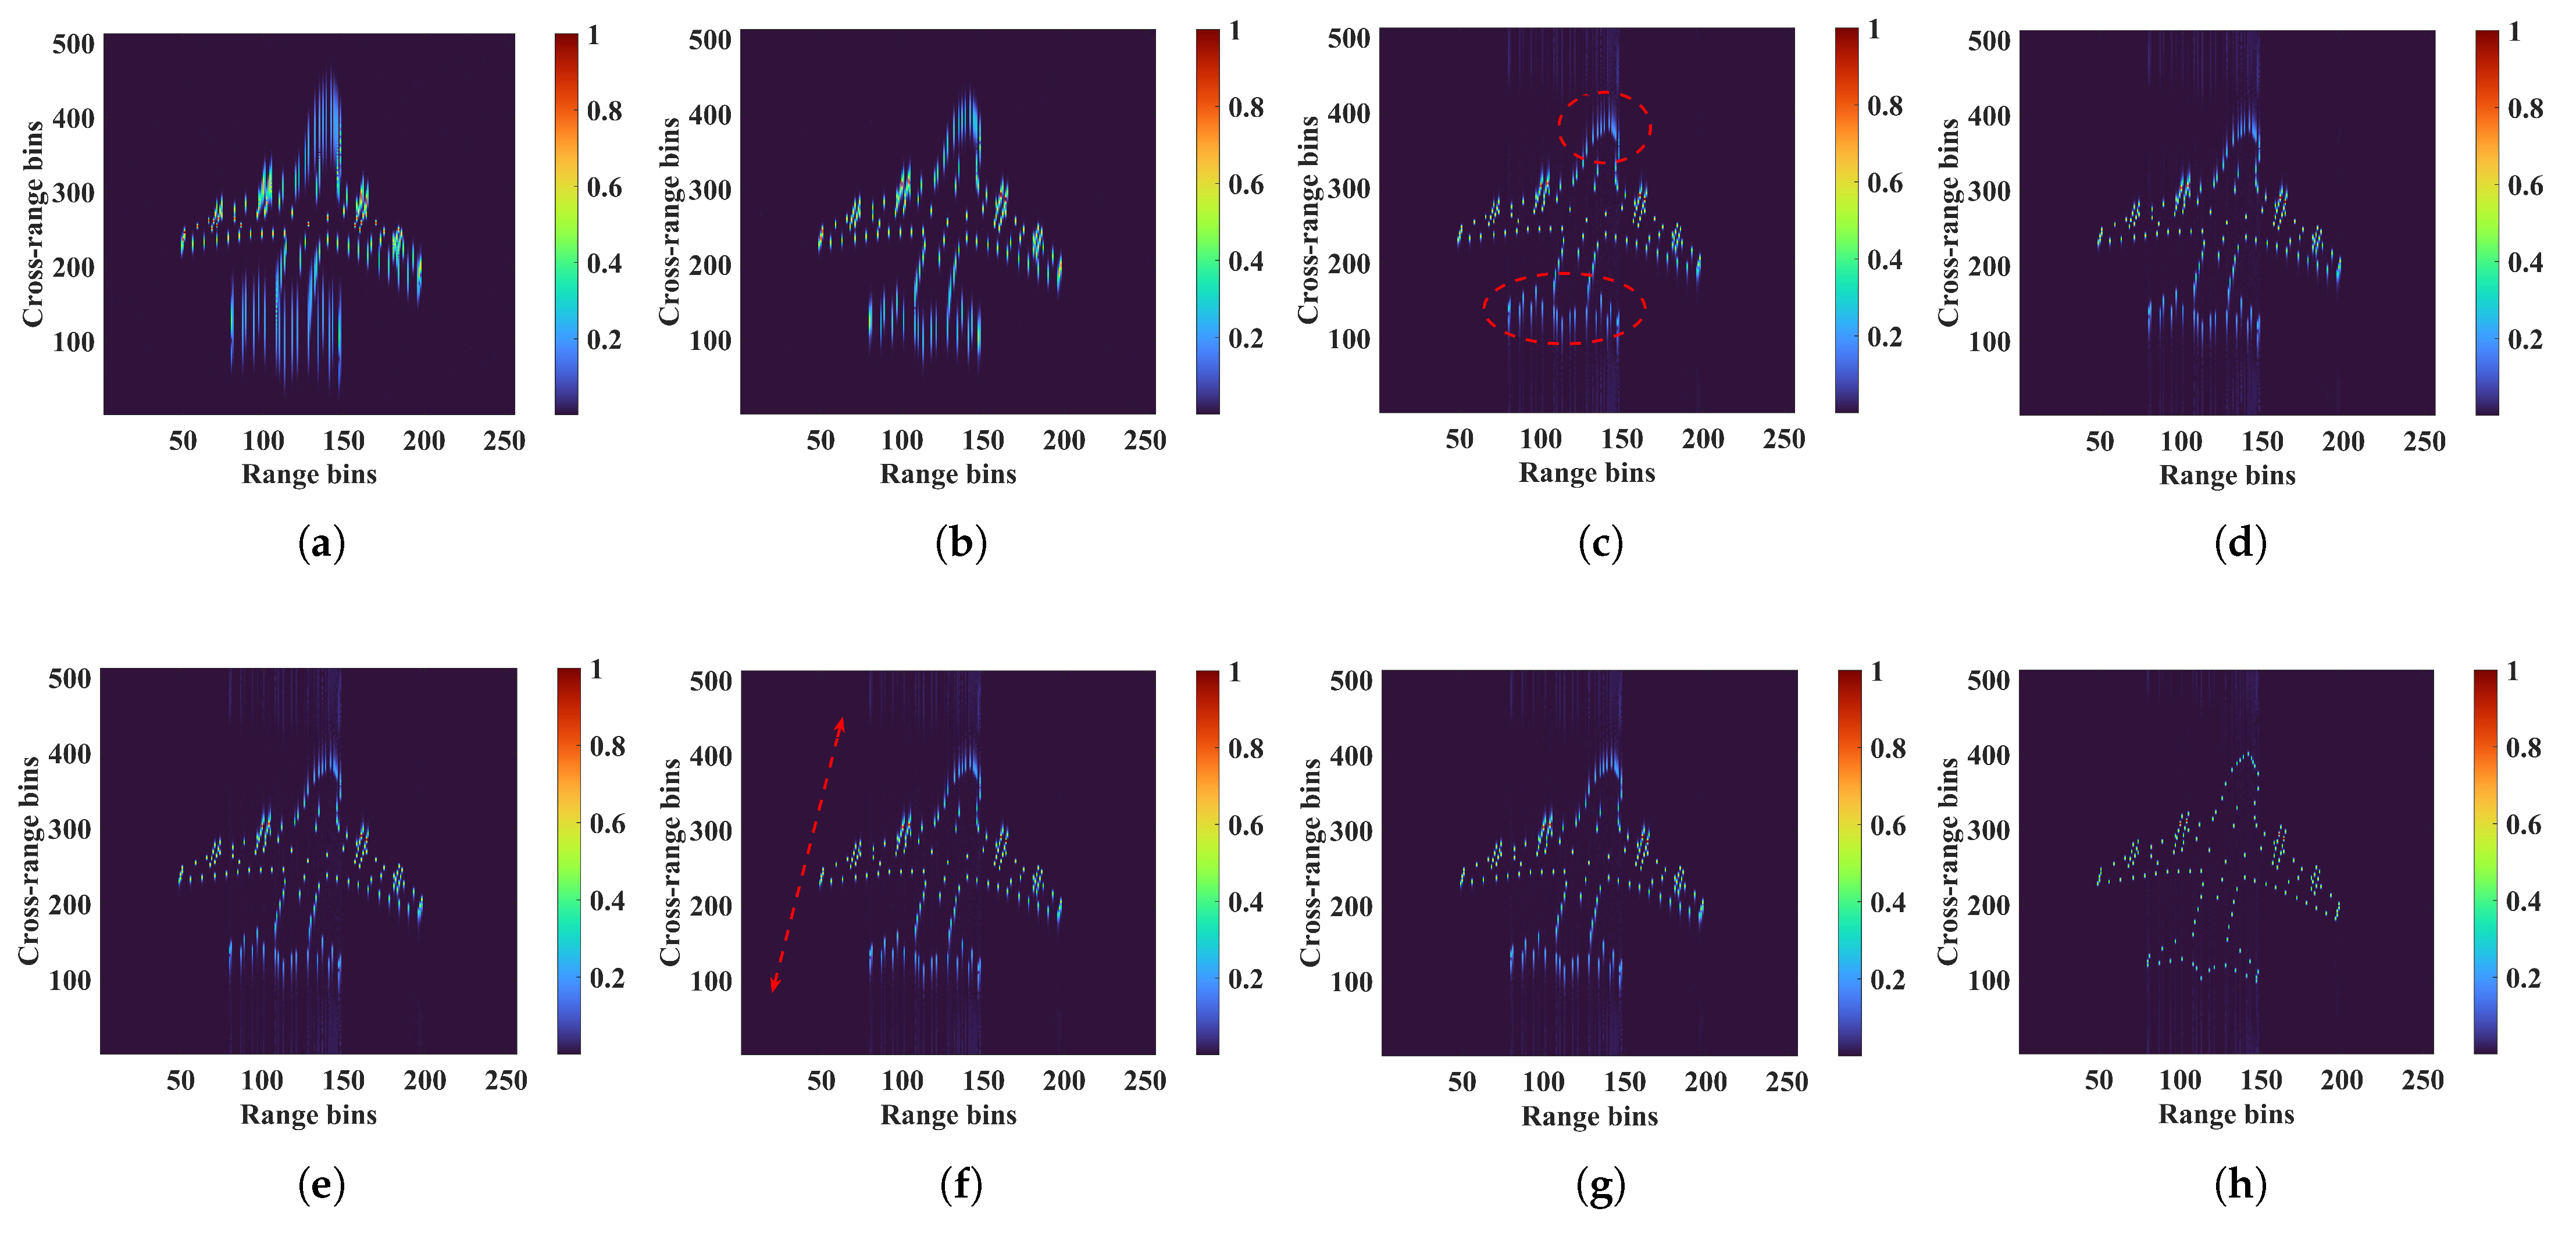
Based on the above analysis, simulation experiments were carried out using the simulation parameters listed in Table 1. The ideal scatterers, which outline an airplane, are given in Figure 3. The assumed aspect angles are shown in Figure 4. The ISAR image (see Figure 5a) based on the RDA illustrated the defocus in the head and tail of the aircraft and stretch due to non-uniform rotation. Conversely, the scatterers in the central region of cross-range bins remained clear. According to (4), the central region had small y k values and was less affected by non-uniform rotation.
Figure 5b presents the imaging results obtained by using the RID algorithm, which differed from those of the other methods (see Figure 5c–h) that used time–frequency analysis for imaging. It can be observed in Figure 5b that the image was manifested as short lines elongated along the azimuthal direction rather than focused points. This was related to the decreased azimuthal resolution, which was caused by the reduced accumulation time with the shorter window length of the STFT.
Figure 5c–f present the imaging results from four different parametric RMC algorithms: the AJTF [24], the PSO [25], the LVD [34], and the ICPF algorithms [16], respectively. It can be observed that image defocusing still occurred (see the red circles in Figure 5c) and was caused by ineffective RMC. Moreover, the defocus deteriorated when observed from the central region of the cross-range bins toward the periphery (see the red arrows in Figure 5f). Figure 5g shows the imaging results obtained by replacing (8) with the inverse function from [27], where it can be seen that the image still exhibited defocusing. In contrast, the proposed method (see Figure 5h) effectively accomplished RMC for all scatterers to eliminate defocus. Considering that a better-focused image will result in a smaller entropy [4], we adopted a minimum-entropy criterion to quantitatively assess the imaging quality. The entropy for an image g m , n is defined as
E n t r o p y = m = 1 M n = 1 N g m , n 2 S l n S / g m , n 2 ,
where S = m = 1 M n = 1 N g m , n 2 . The entropies and computation times for the target when using different algorithms are listed in Table 2. In addition, considering that a better image will result in a less stretched value, we adopted a novel minimum stretched value criterion to quantitatively assess the imaging quality of 2D ISAR images. The stretched value is defined as
S t r e t c h e d v a l u e = n = 1 N u ( n ) u t r u e ( n ) ,
where u n represents the image values in the nth range bin after compensation, while u t r u e n denotes the ideal image values in the nth range bin. · signifies the operation for calculating the norm, and N denotes the total number of range bins. The stretched values from different algorithms are also listed in Table 2. The proposed algorithm accomplished the smallest values among all, which equaled 6.49 and 11.35. This indicated that the proposed algorithm had the best performance.
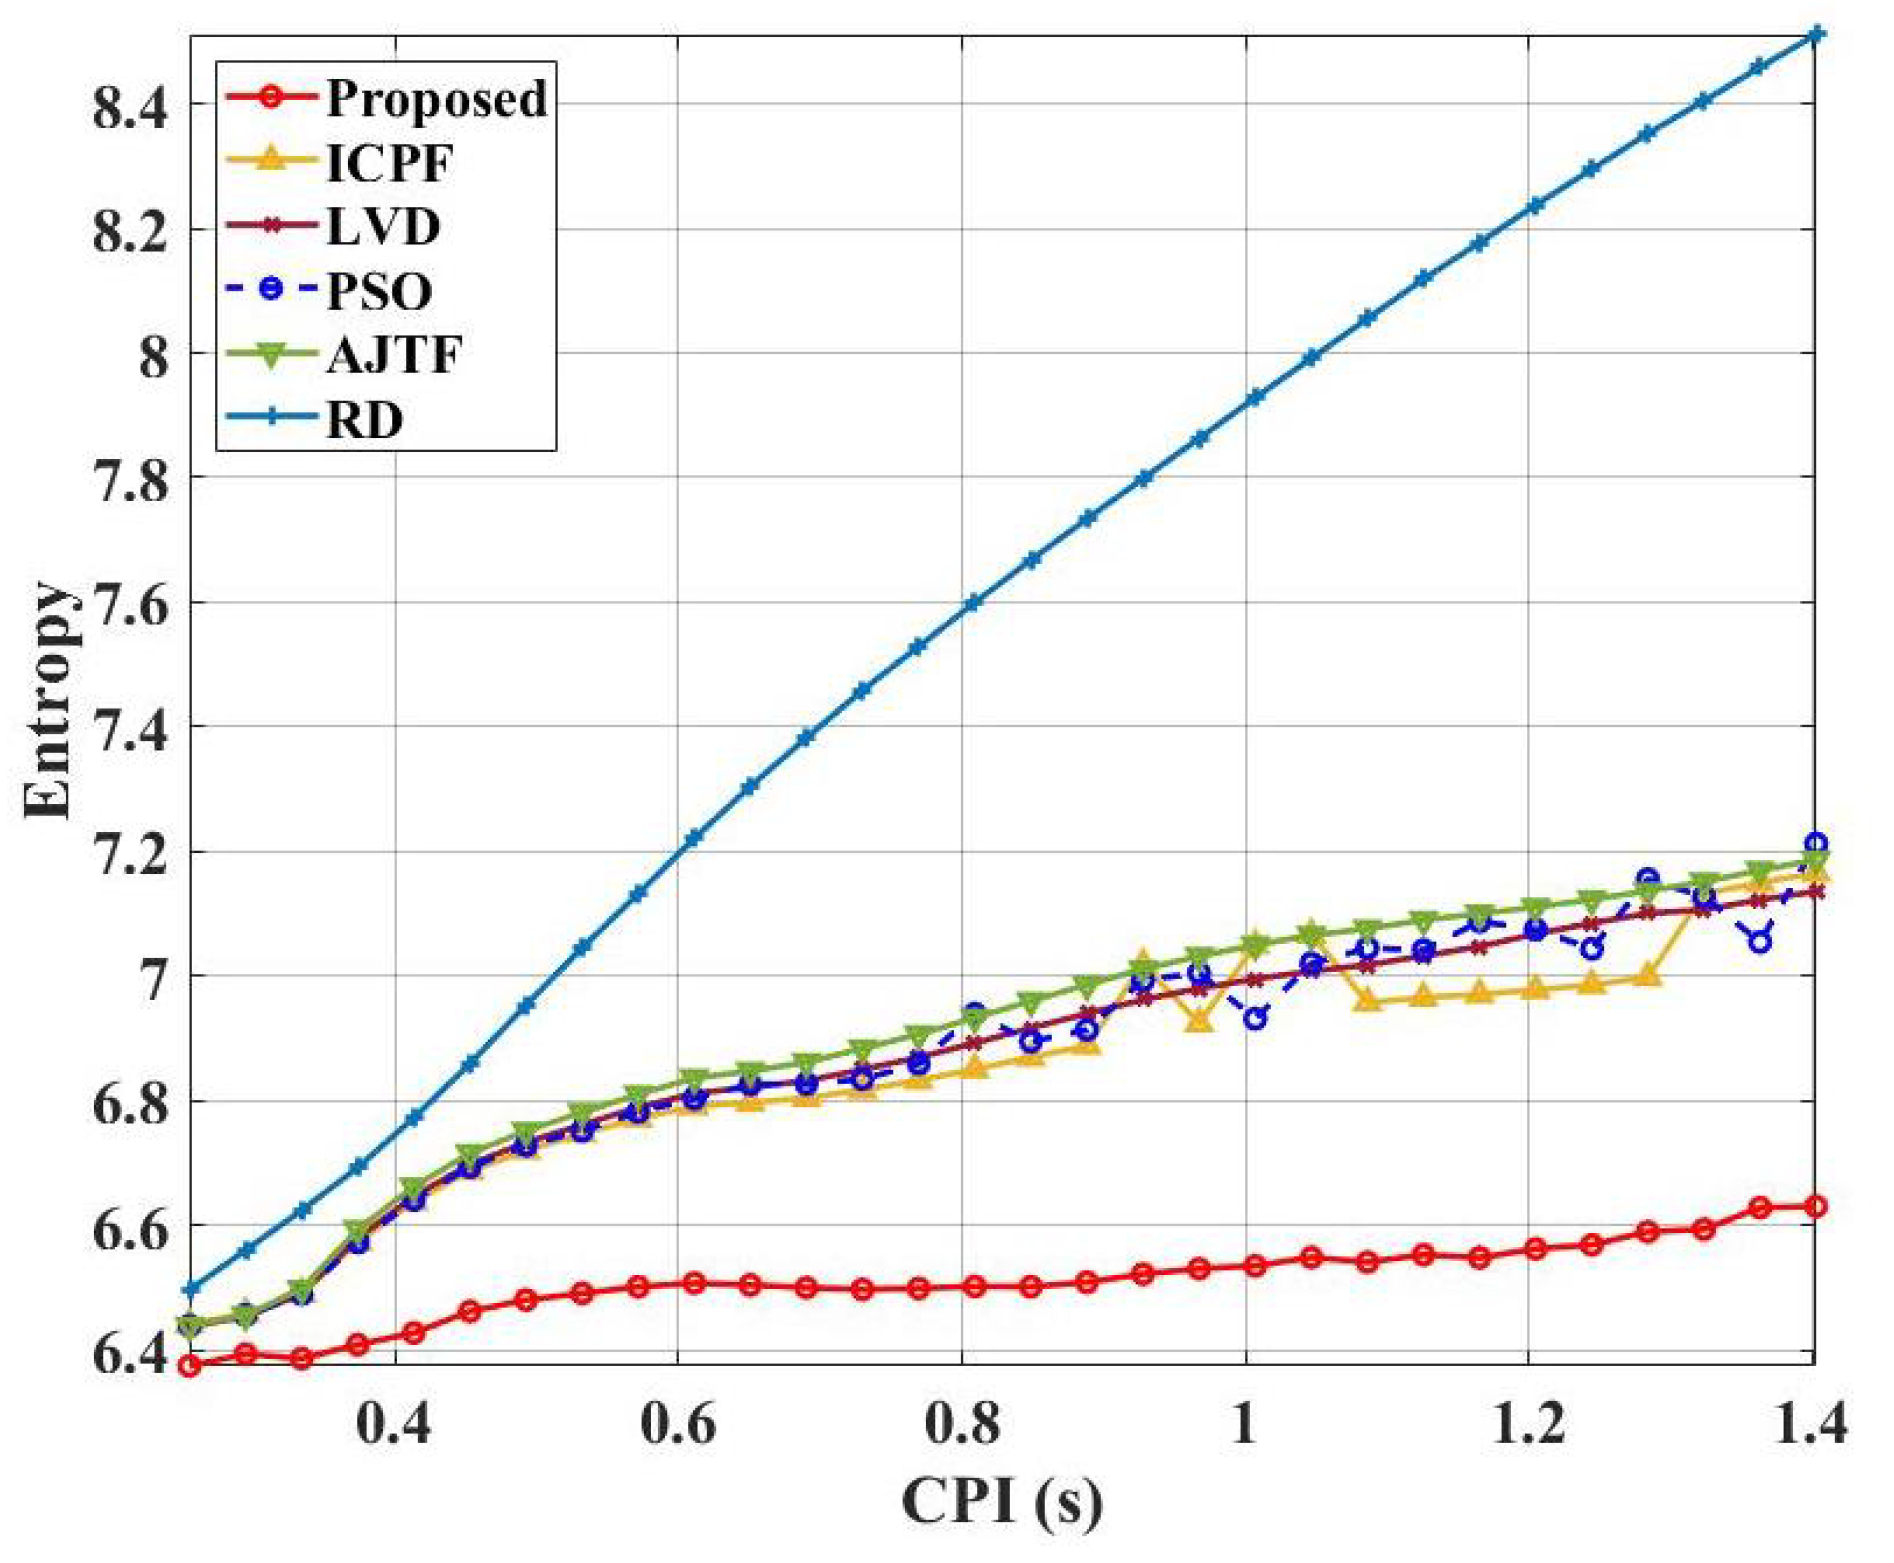
ISAR requires a long accumulation time to achieve high resolution in the cross-range dimension, which means that a larger rotation angle results in a better resolution. It was considered that images with different resolutions were affected differently by non-uniform rotation and estimation errors. The entropies versus CPI frames for six typical methods are shown in Figure 6. Unlike in Table 1, the angular velocity and angular acceleration were reset to 0.015 rad/s and 0.040 rad/s2 to prevent spectral aliasing. We first note that as the CPI frames increased, the entropy also increased according to the RD curve, which resulted in more defocused images. Furthermore, the ICPF, LVD, PSO, and AJTF algorithms perform well with small CPI durations. However, as the CPI increased, errors in parameter estimation increasingly impacted the imaging results. In contrast, the algorithm proposed in this study demonstrated strong performance.
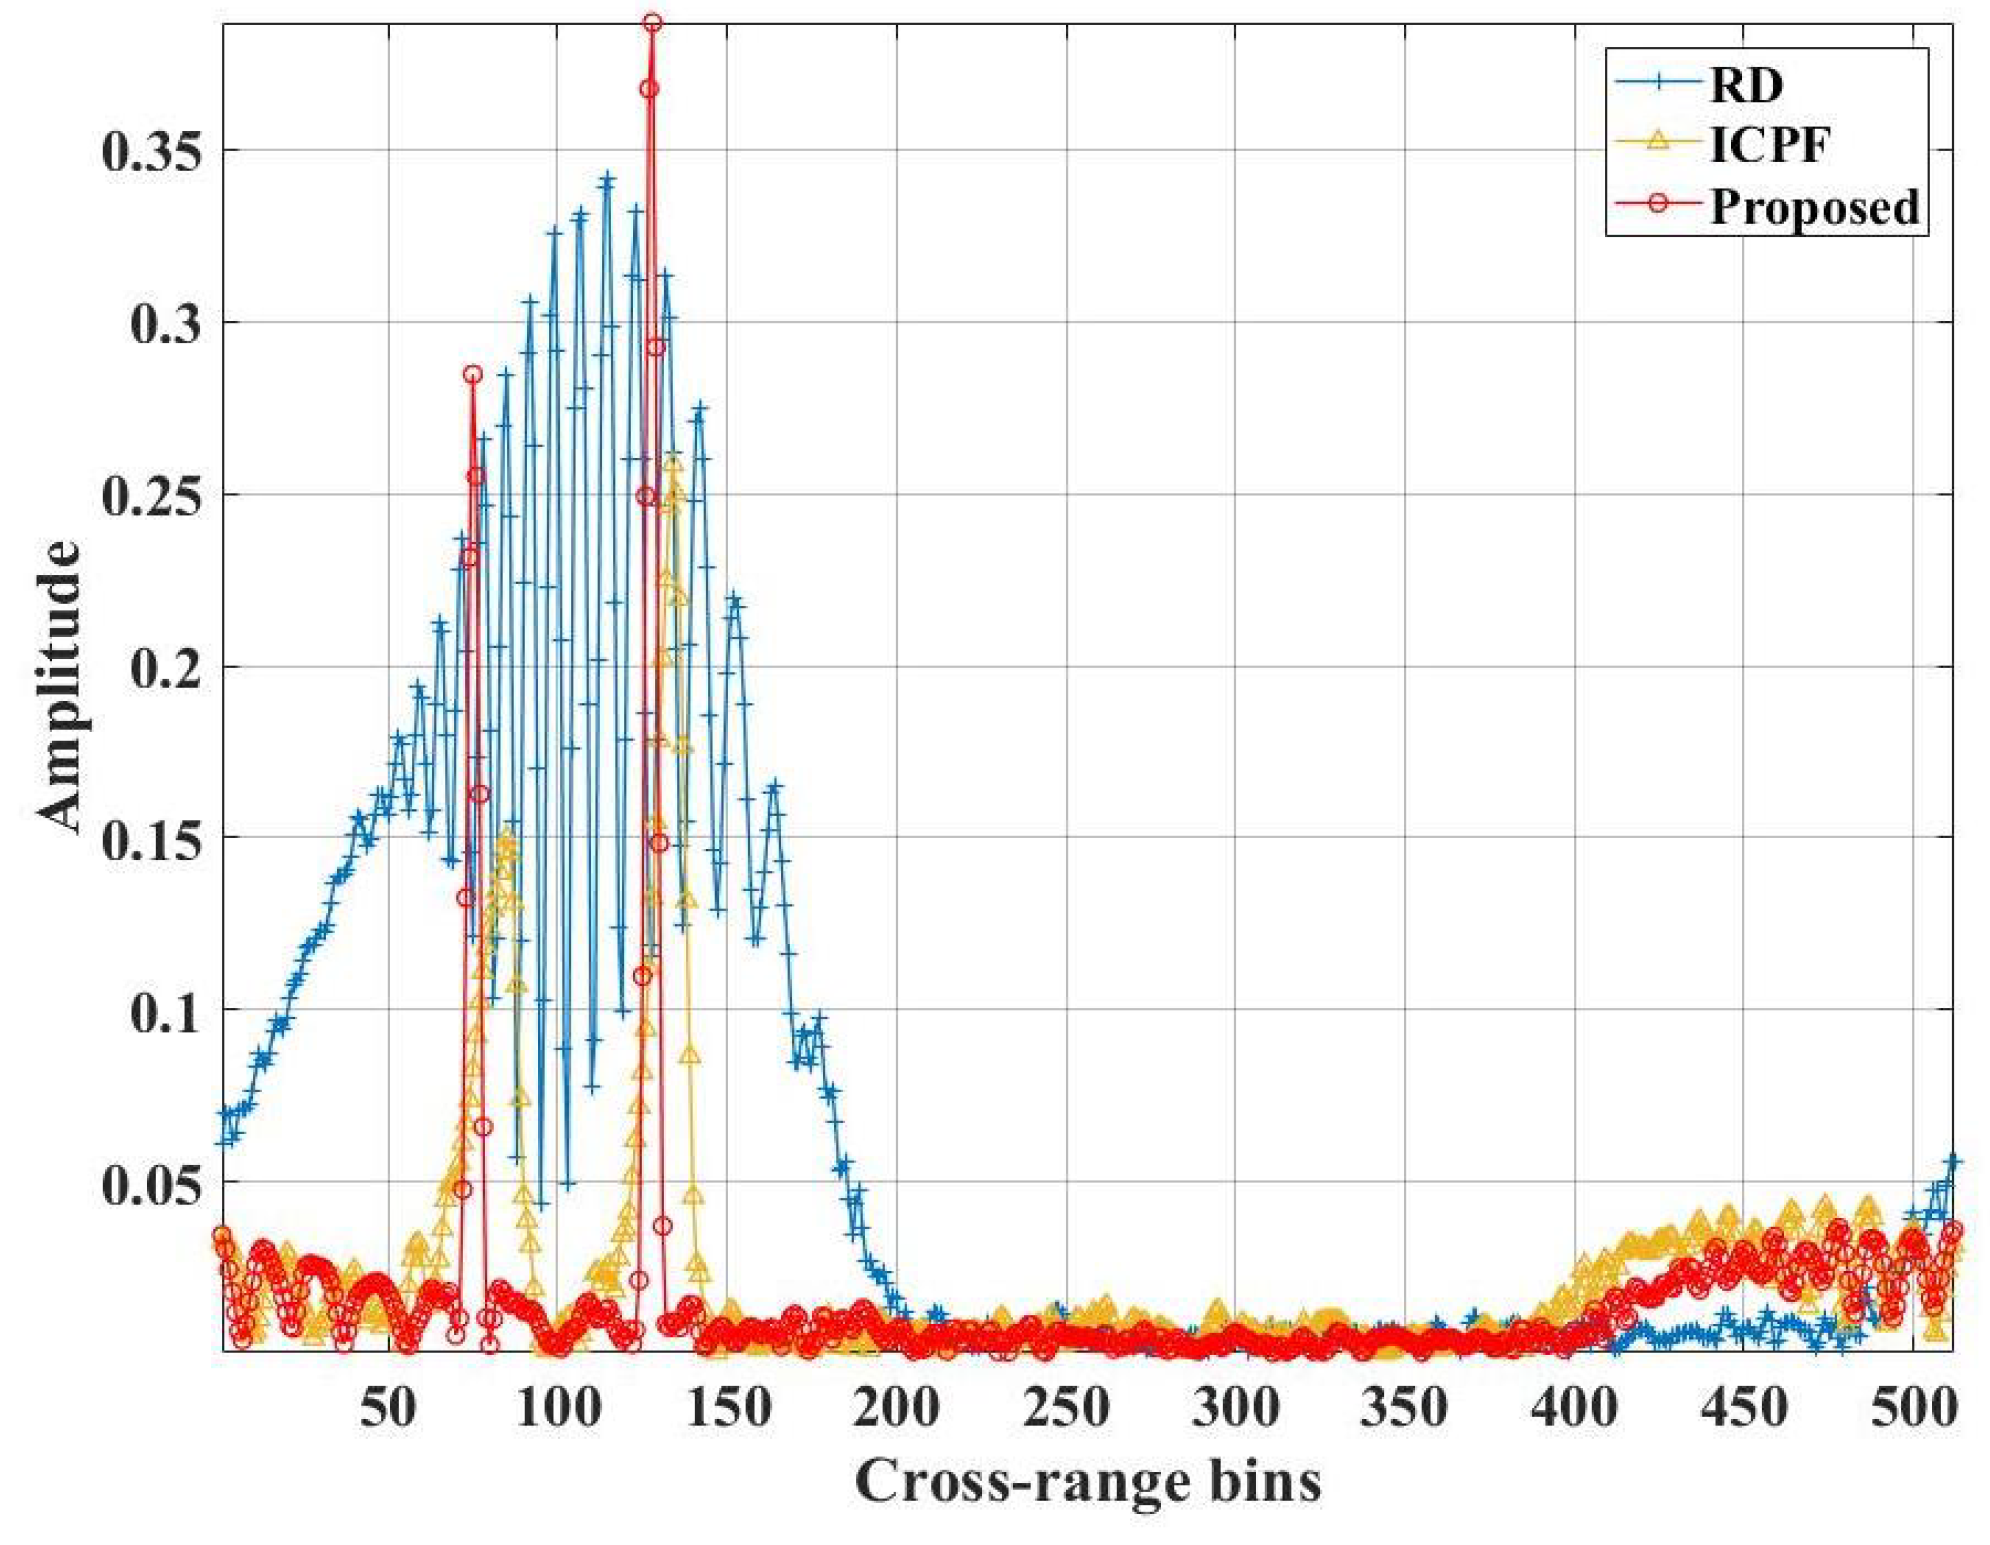
Since more accumulated time will result in more estimation errors, the data in the 108th range bin were extracted as an example to demonstrate that the proposed method could effectively deal with non-uniform rotation with large CPI durations and to lay the foundation for the acquisition of an ISAR image of high quality. Figure 7 shows a comparison of the results when using a CPI duration of 1.4 s for the RDA, the ICPF algorithm, and the proposed method. Specifically, on the one hand, the two scatterers could not be distinguished via the RDA. On the other hand, although the ICPF algorithm could roughly recover the positions of the two scatterers, the spectral lines were broad and did not form distinct peaks. In cases where the scatterers were close to each other, the spectral lines of the ICPF algorithm could exhibit aliasing. Furthermore, the proposed method was able to clearly distinguish the two spectral lines, which is the premise of improving 2D image quality.
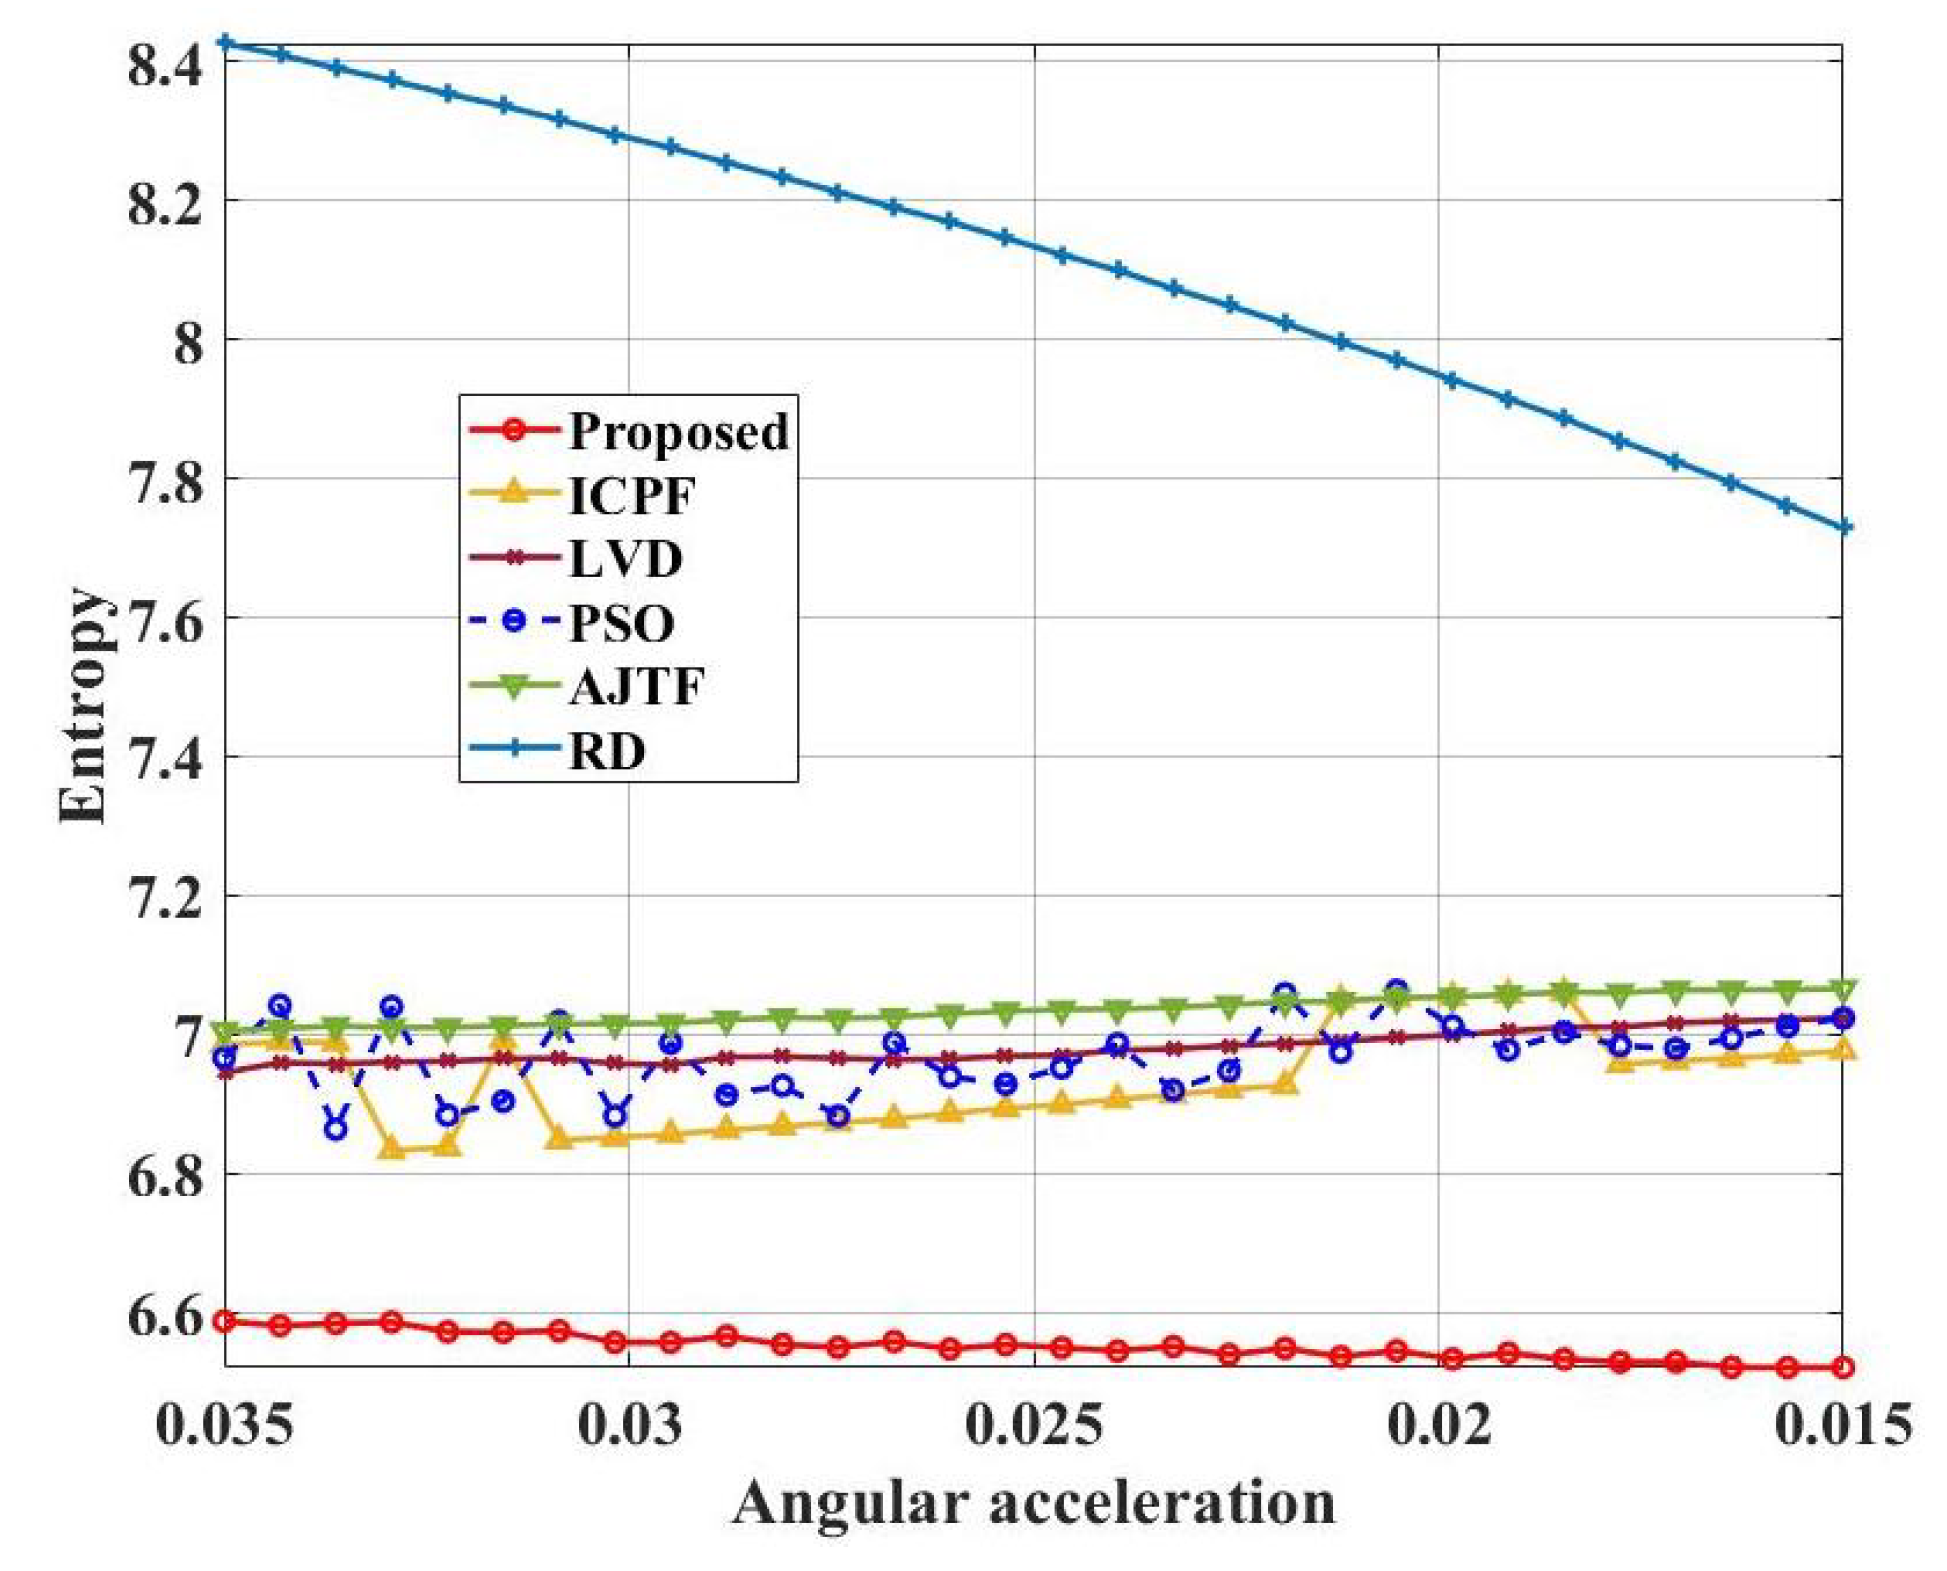
Based on the parameters in Table 1, we reset the angular velocity to 0.015 rad/s, and the angular acceleration was set from 0.035 to 0.015 rad/s2. Figure 8 shows the entropies versus angular acceleration for different methods. The RD curve showed that the entropy gradually decreased with the angular acceleration due to the decrease in the azimuthal resolution. In contrast, it can be seen that the entropies resulting from the ICPF, LVD, PSO, and AJTF algorithms slightly increased with the angular acceleration due to their similar principles for estimating parameters. They estimated the rotation parameters in descending order from complex to simple according to the complexity of the target’s non-uniform rotation. For example, if the target presented a form of motion with high angular acceleration and low angular velocity, the estimation error of the higher-order parameters affected the estimation results of the lower-order parameters to a lesser extent. However, if the target presented a motion form with comparable angular acceleration and angular velocity, the estimation error of the higher-order parameters seriously affected the estimation results of the lower-order parameters, resulting in a defocused image. However, the proposed algorithm adopted the method of an independent estimation procedure for rotational parameters, allowing the influence of estimation errors to be avoided.
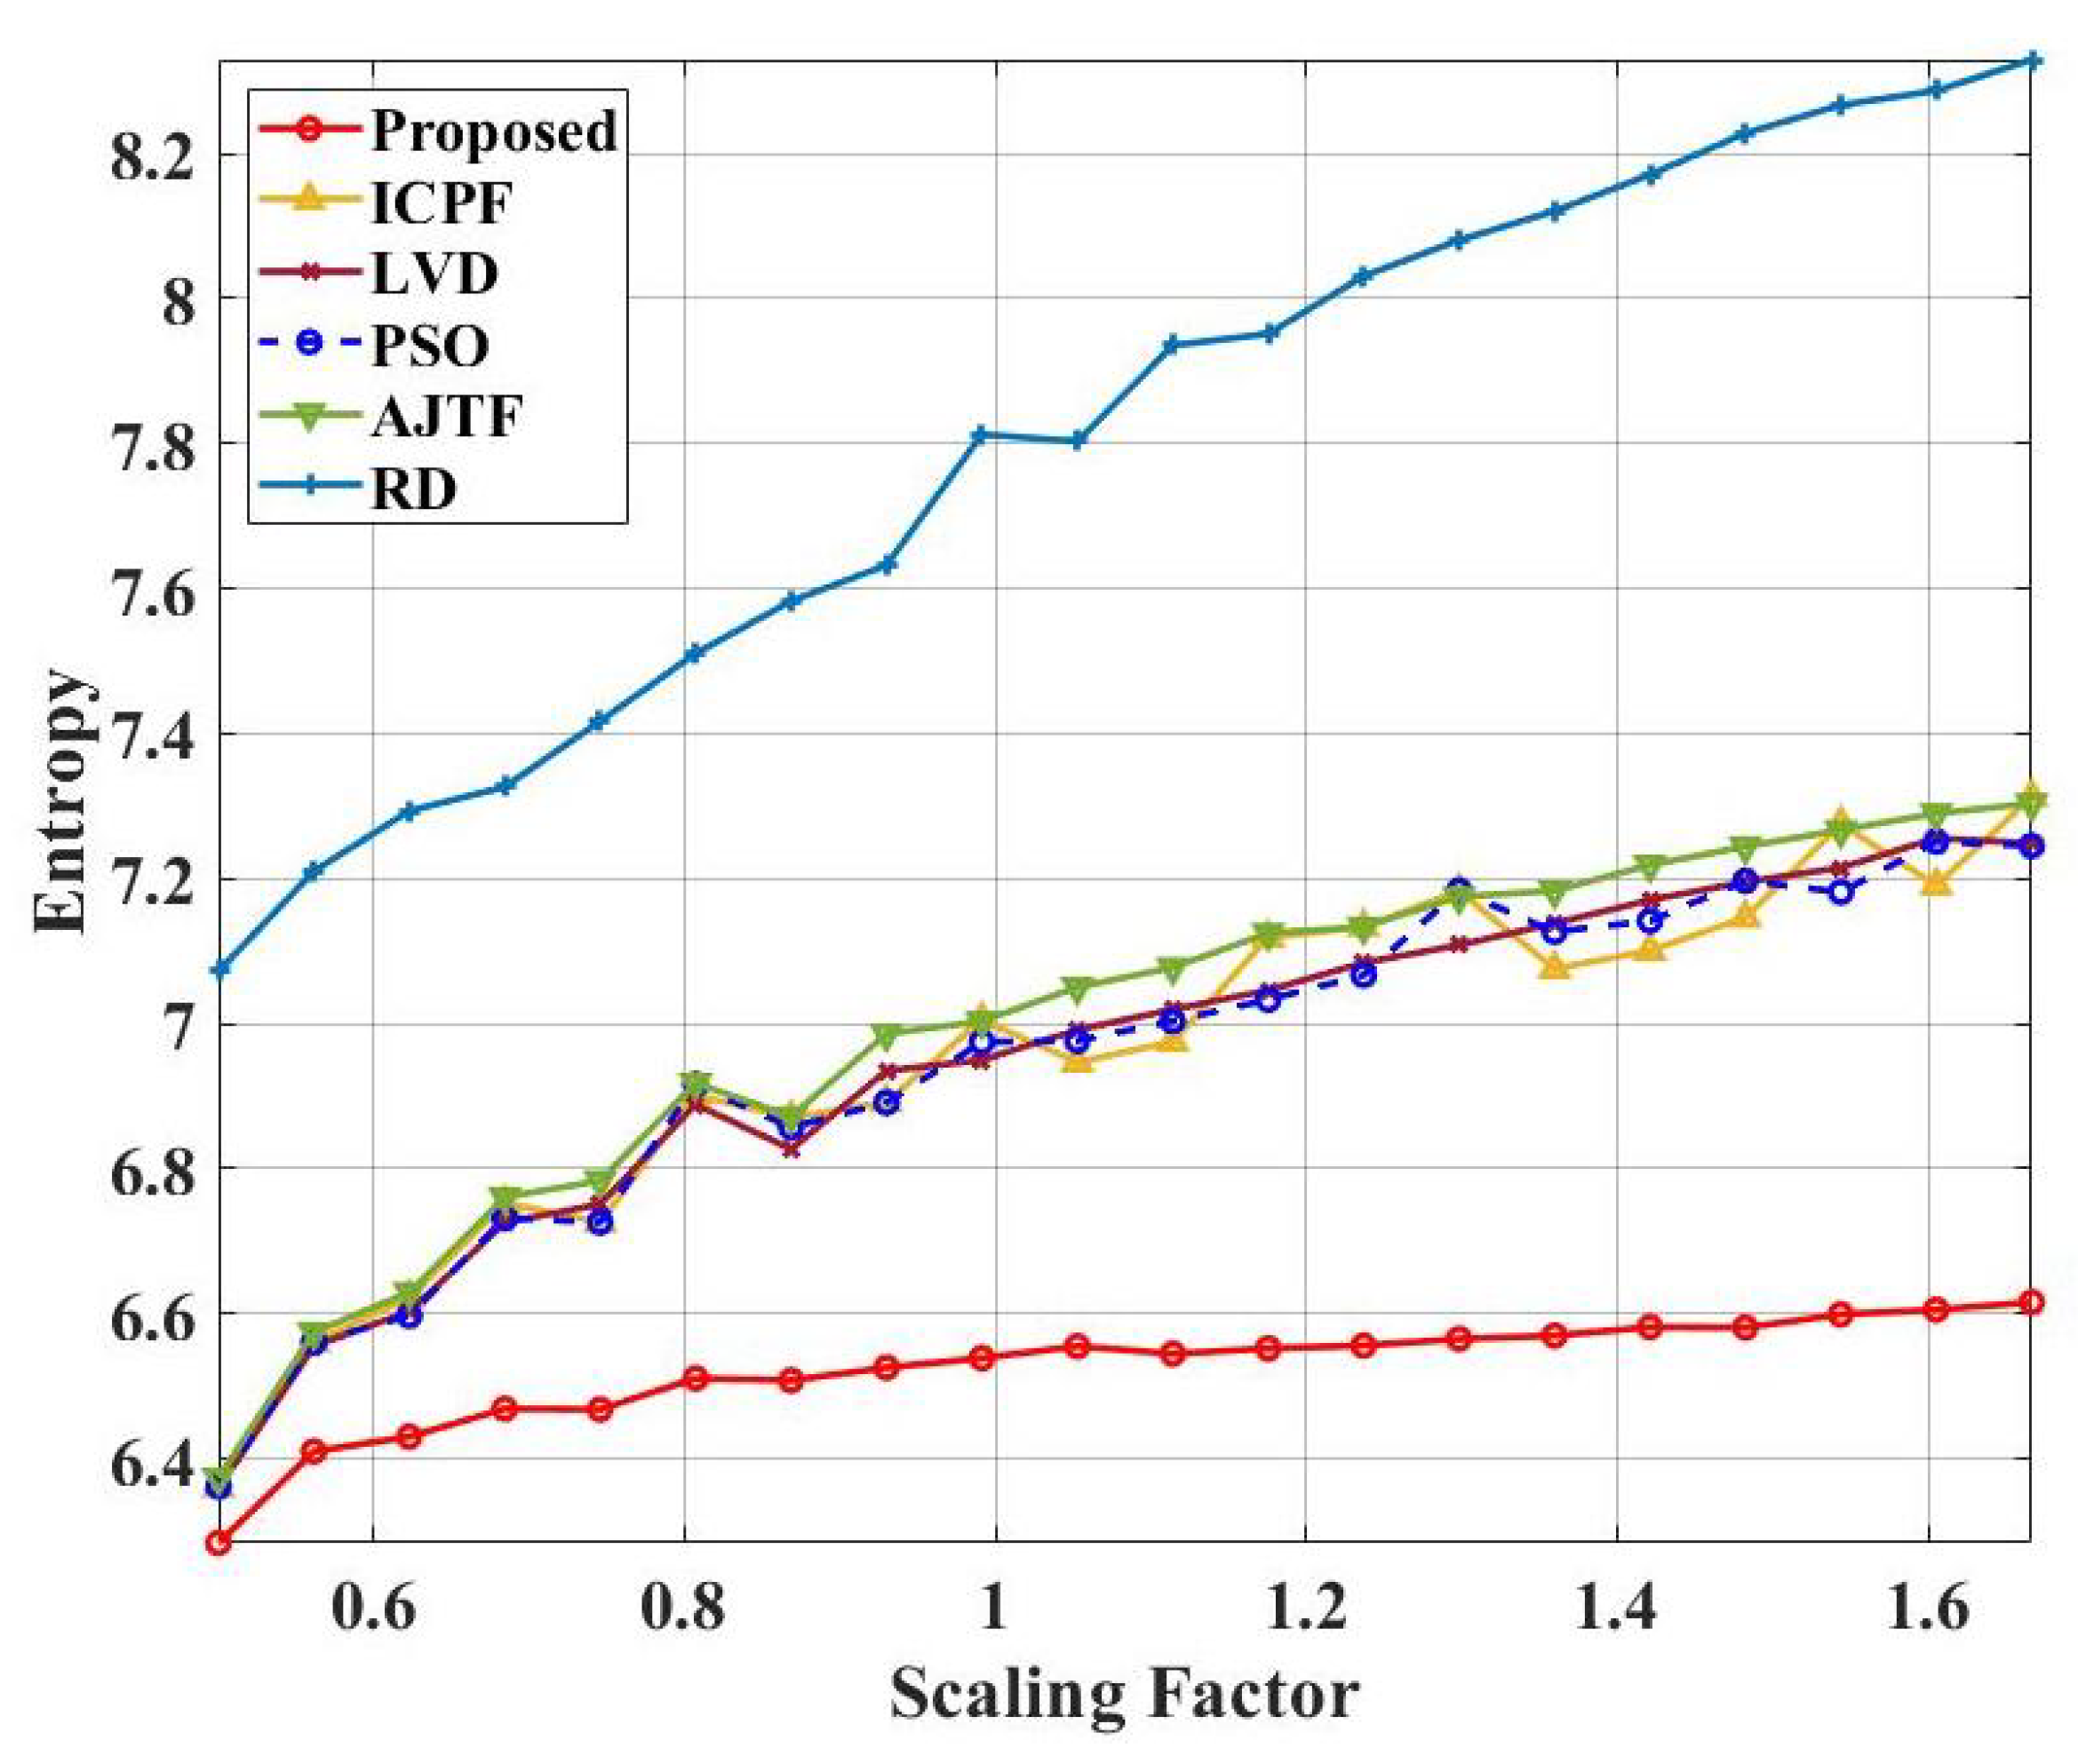
According to (4), a larger target represents a larger y k , which results in more estimation errors. To verify the algorithm’s performance in this situation, we applied scaling factors to the target (see Figure 3). Figure 9a shows the geometric model of the smallest target size after applying the scaling factor. In contrast, Figure 9b shows the geometric model of the largest target size. We uniformly set 20 target sizes ranging from the smallest size to the largest one.
Figure 10 shows the entropy of the images when using six algorithms with different target sizes. The RD curve showed that the entropy gradually increased with the target size. This is because a larger target occupies a larger proportion of images at a constant azimuth resolution. With the increase in target size, the ICPF, LVD, PSO, and AJTF algorithms performed worse and worse since larger targets resulted in more estimation errors. In contrast, the proposed algorithm performed better when using the independent estimation procedure for rotational parameters.
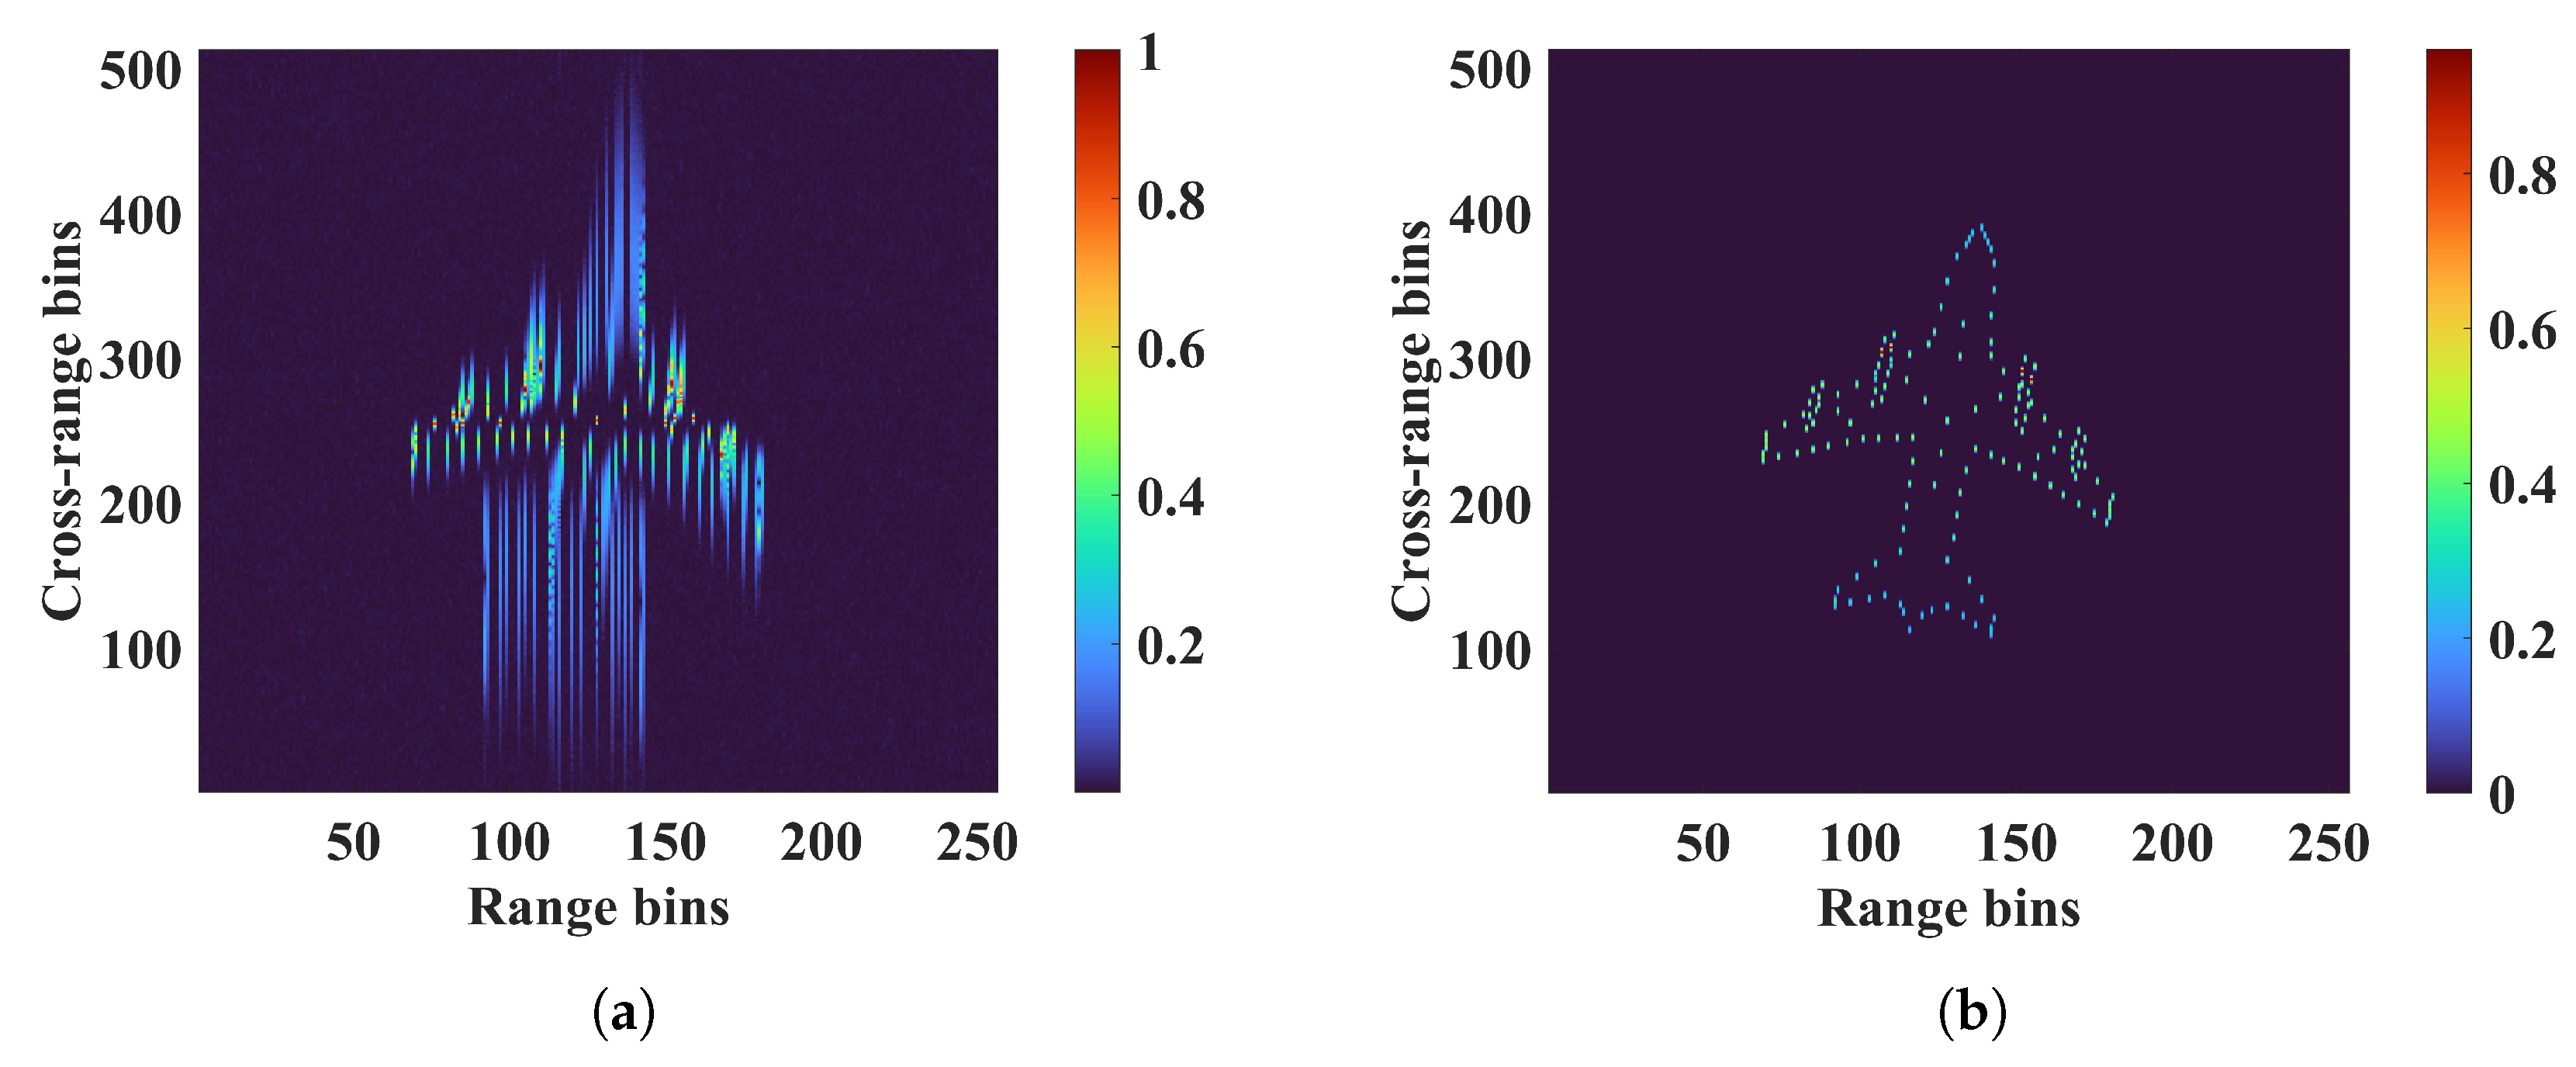
Furthermore, we expanded (2) up to the third order to validate the performance of the proposed algorithm in the presence of motion with third-order rotation. The target rotation consisted of three parts, rotation angular velocity, angular acceleration, and angular acceleration rate, and they were set to 0.015 rad/s, 0.017 rad/s2, and 0.022 rad/s3, respectively. Figure 11a shows the image obtained by using the RD algorithm. Comparing it with Figure 5a, it was found that due to the more complex motion, the defocusing (stretching) of the image was more obvious. Since the highest order of target motion equaled 3, the number of parameters for the search was reset to three, and the inverse function was accordingly refined. Then, the proposed algorithm was used to generate an ISAR image, as shown in Figure 11b. Furthermore, in order to demonstrate the performance of the proposed algorithm in this case, the entropy, time, and stretched value of ISAR images were calculated before and after compensating using (21) and (22). The results were as follows: The entropy of the image before compensating was 8.3247, and after, it was 6.5958. The stretched value of the image before compensating was 158.7457, and after, it was 12.1112. The consumed time in this case was 0.8322s. Obviously, it can be seen that the proposed algorithm still worked well in this case. Therefore, the proposed algorithm can be characterized as a more attractive candidate for obtaining high-quality ISAR images.

4.2. Full-Wave Electromagnetic Simulation Data of an Airplane 3D Conducting Body Model

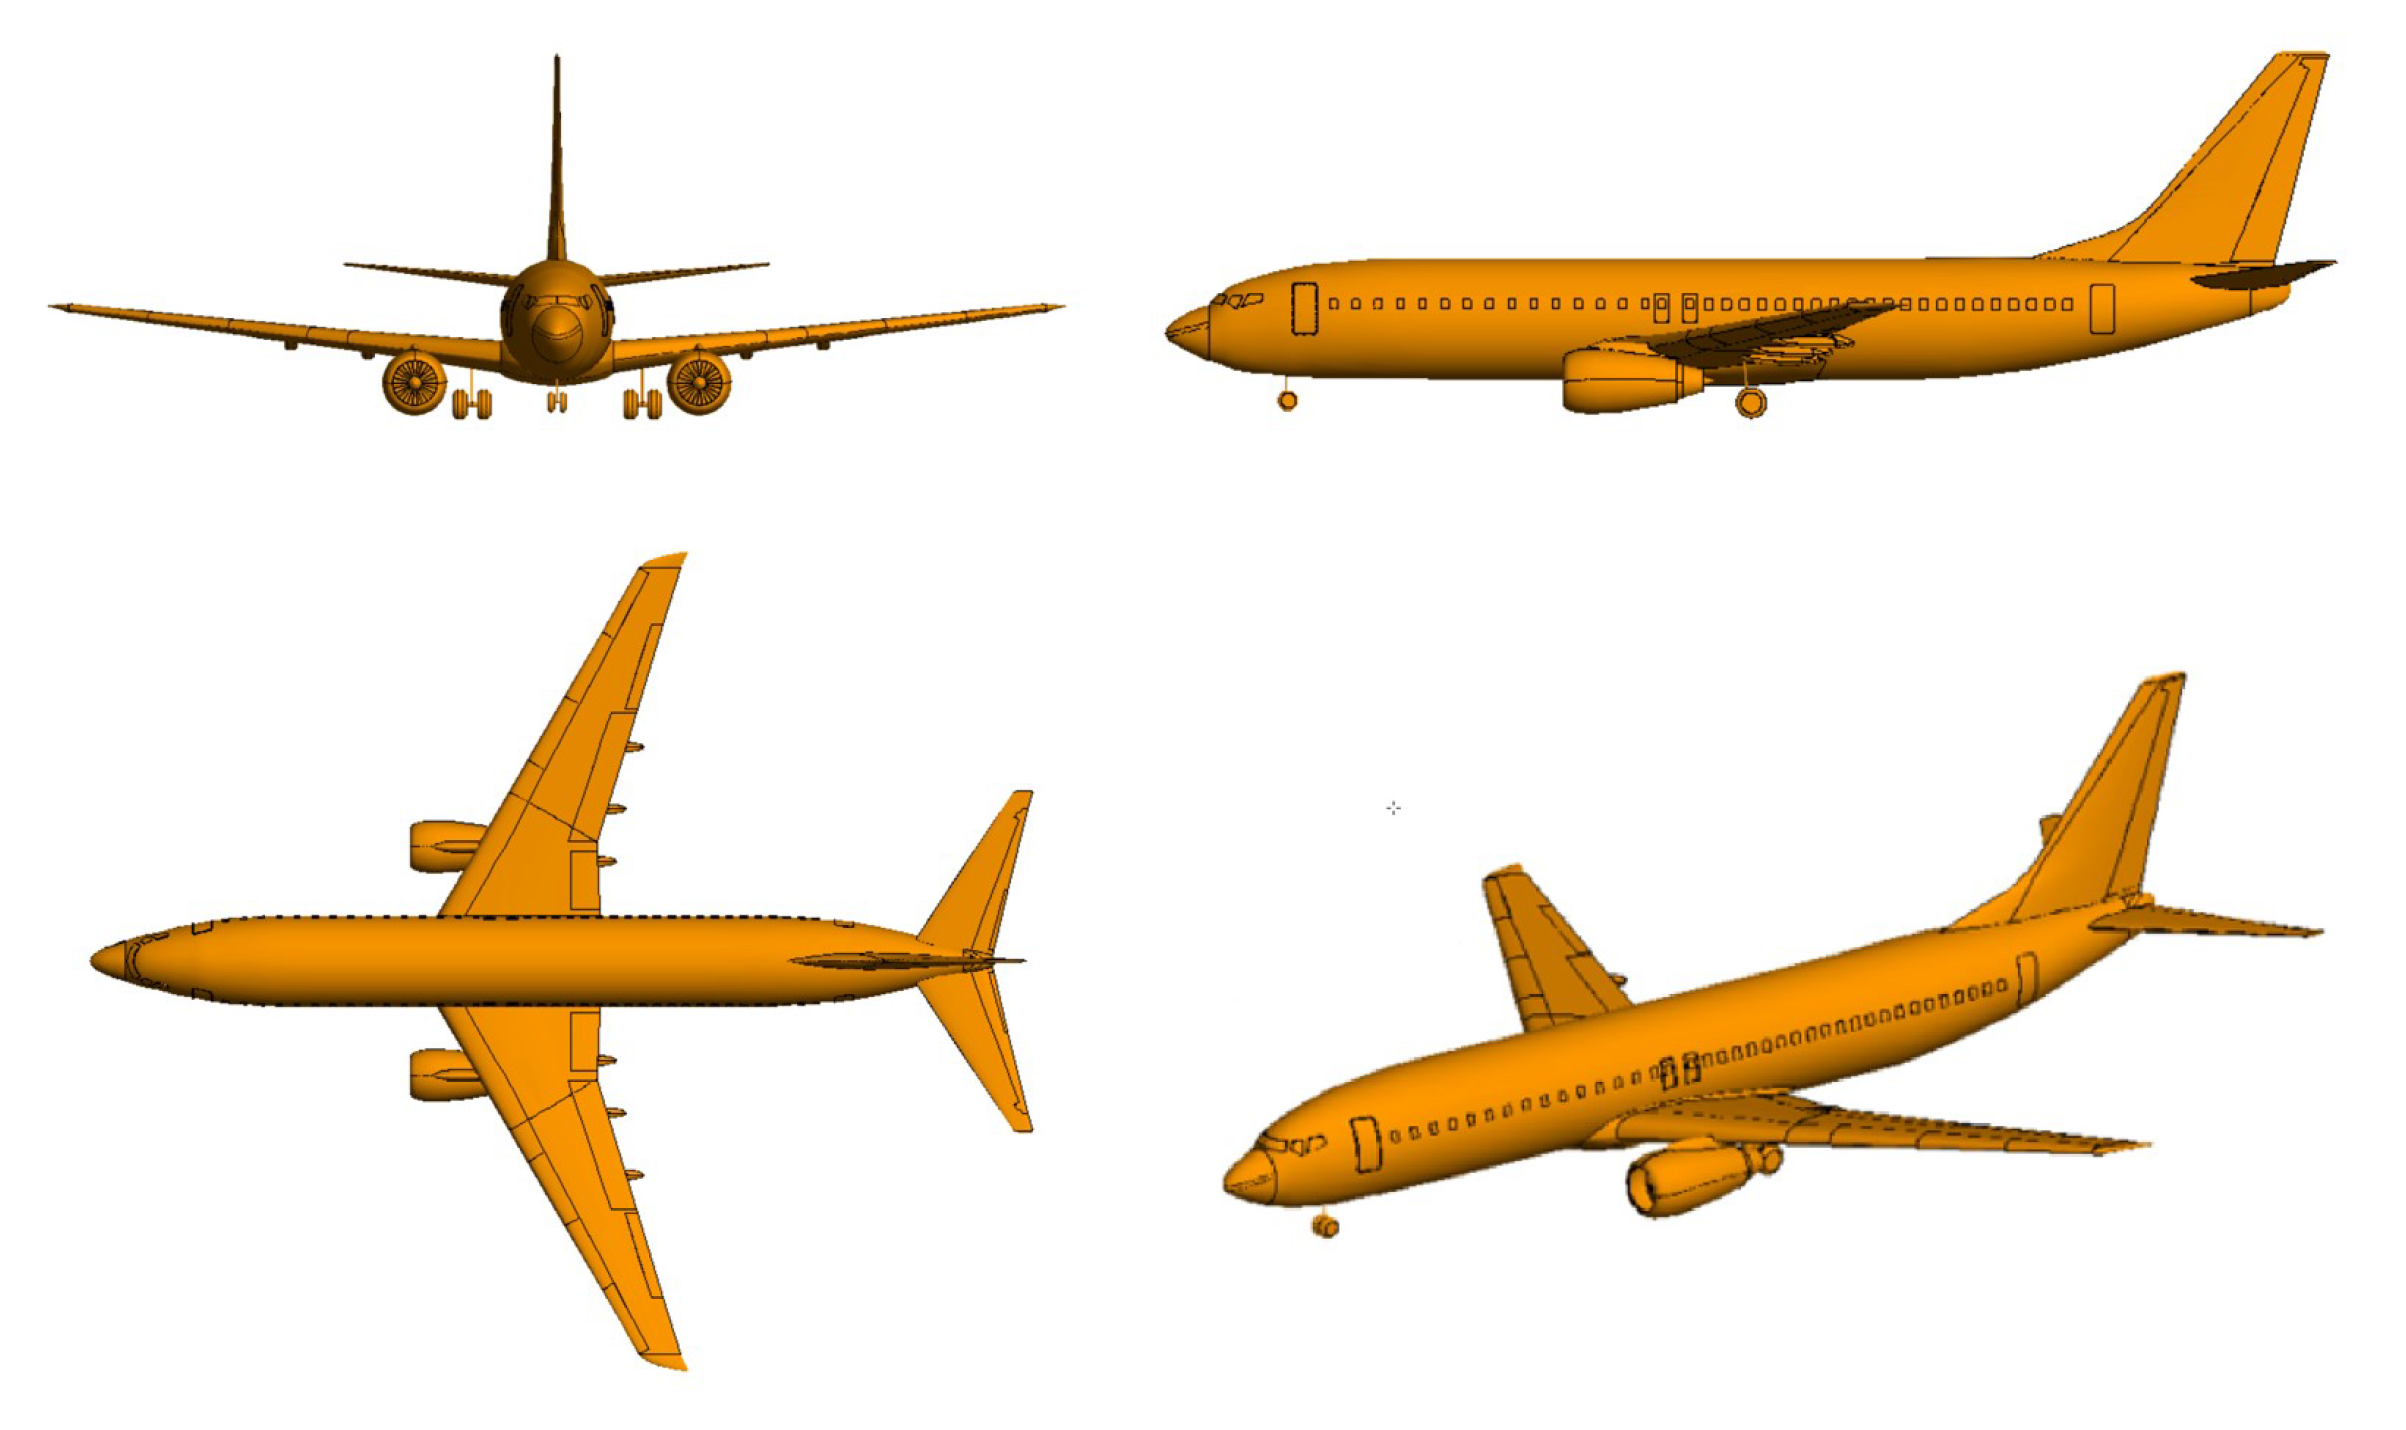
In this subsection, for a more realistic evaluation of the proposed RMC method, an electromagnetic (EM) scattering prediction technique is used to calculate the full-wave electromagnetic simulation data of an airplane 3D conducting body model. Figure 12 shows the target model, a Boeing 737 aircraft. The simulation parameters are listed in Table 3. The polarization mode used is linear polarization. The center frequency of the transmitted signal is 10 GHz, corresponding to a wavelength of 0.03 m. Given its size, the Boeing 737 is classified as an electrically large target, and the large-element PO technique is adopted to calculate complex RCS.
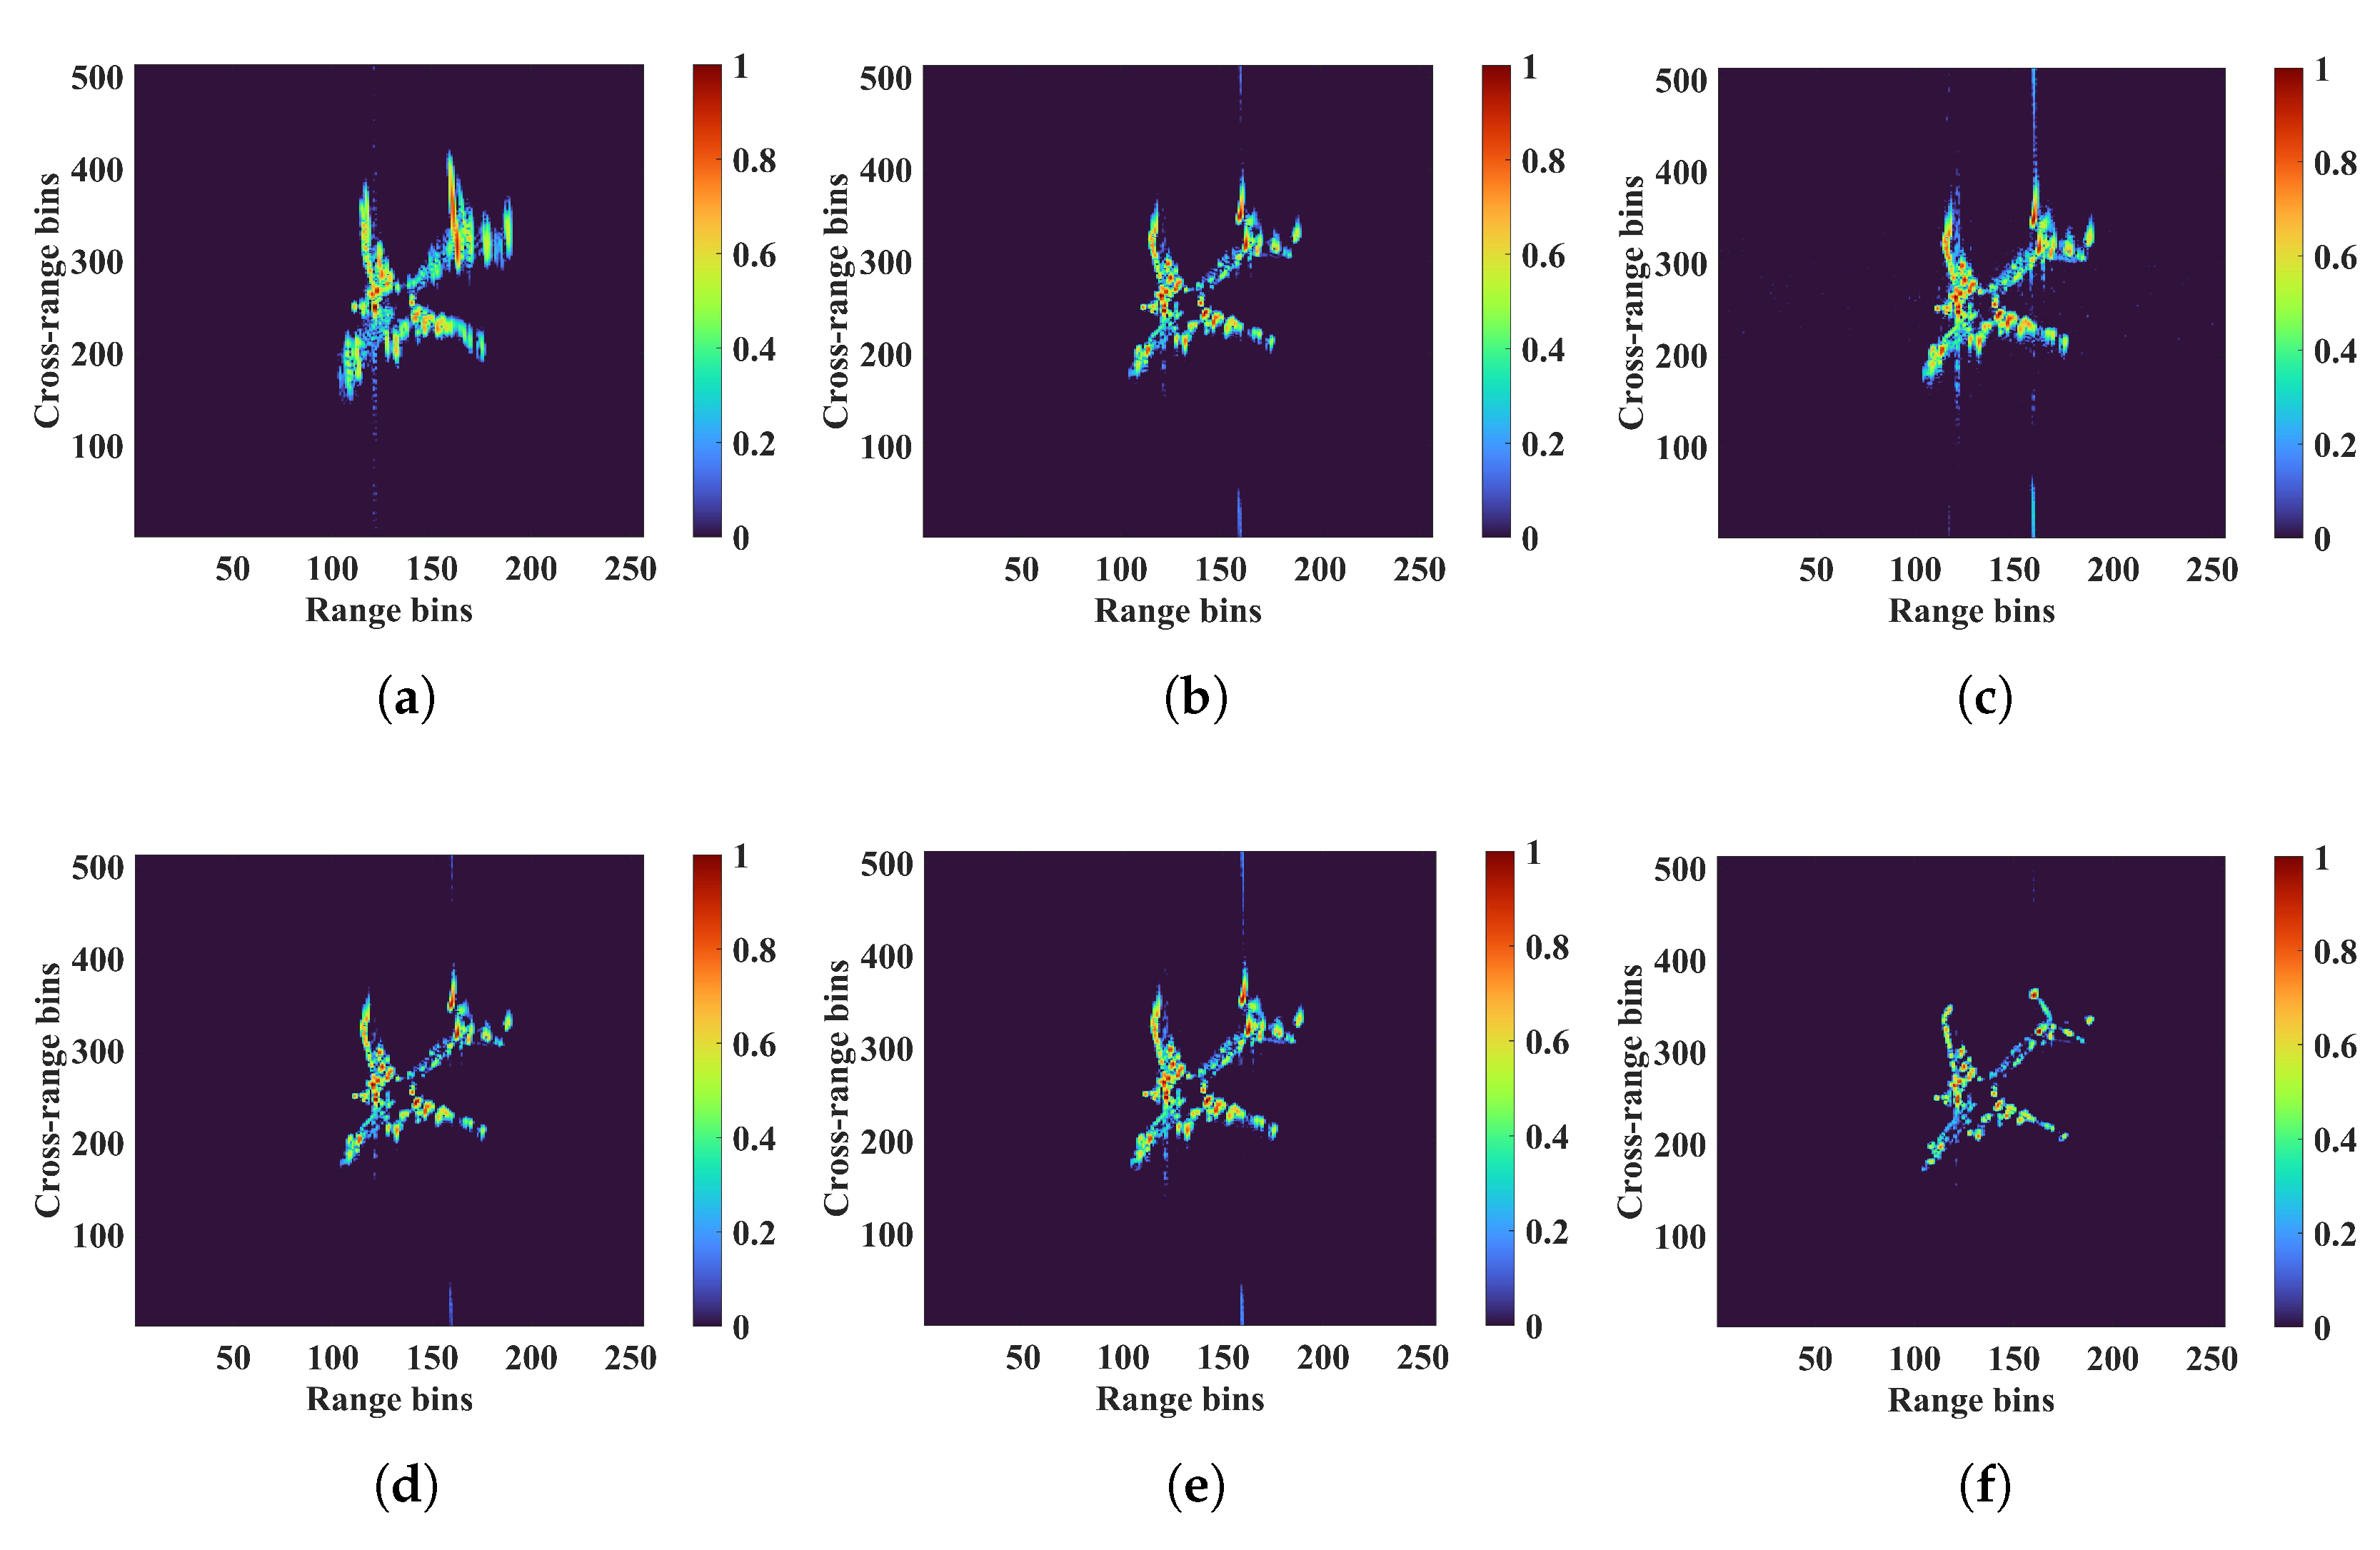
Figure 13 shows the ISAR imaging results from the Boeing 737 aircraft target, and the corresponding entropies and computation time are listed in Table 4. Because the stretched values in (22) cannot be calculated in this subsection, they are not listed in Table 4. Consistently with Figure 5a, Figure 13a shows the RDA imaging result, from which it can be seen that due to the non-uniform rotation, the plane was stretched along the azimuth direction. For instance, the tip of the left wing appeared as a line, and the tail was indistinguishable. Although the image quality of other typical methods (see Figure 13b–e) improved compared with that in Figure 13a, detailed parts of the images were still not adequately compensated, as the left wing and tail of the target remained somewhat stretched. However, the airplane image was good when using the proposed algorithm, as illustrated in Figure 13f.
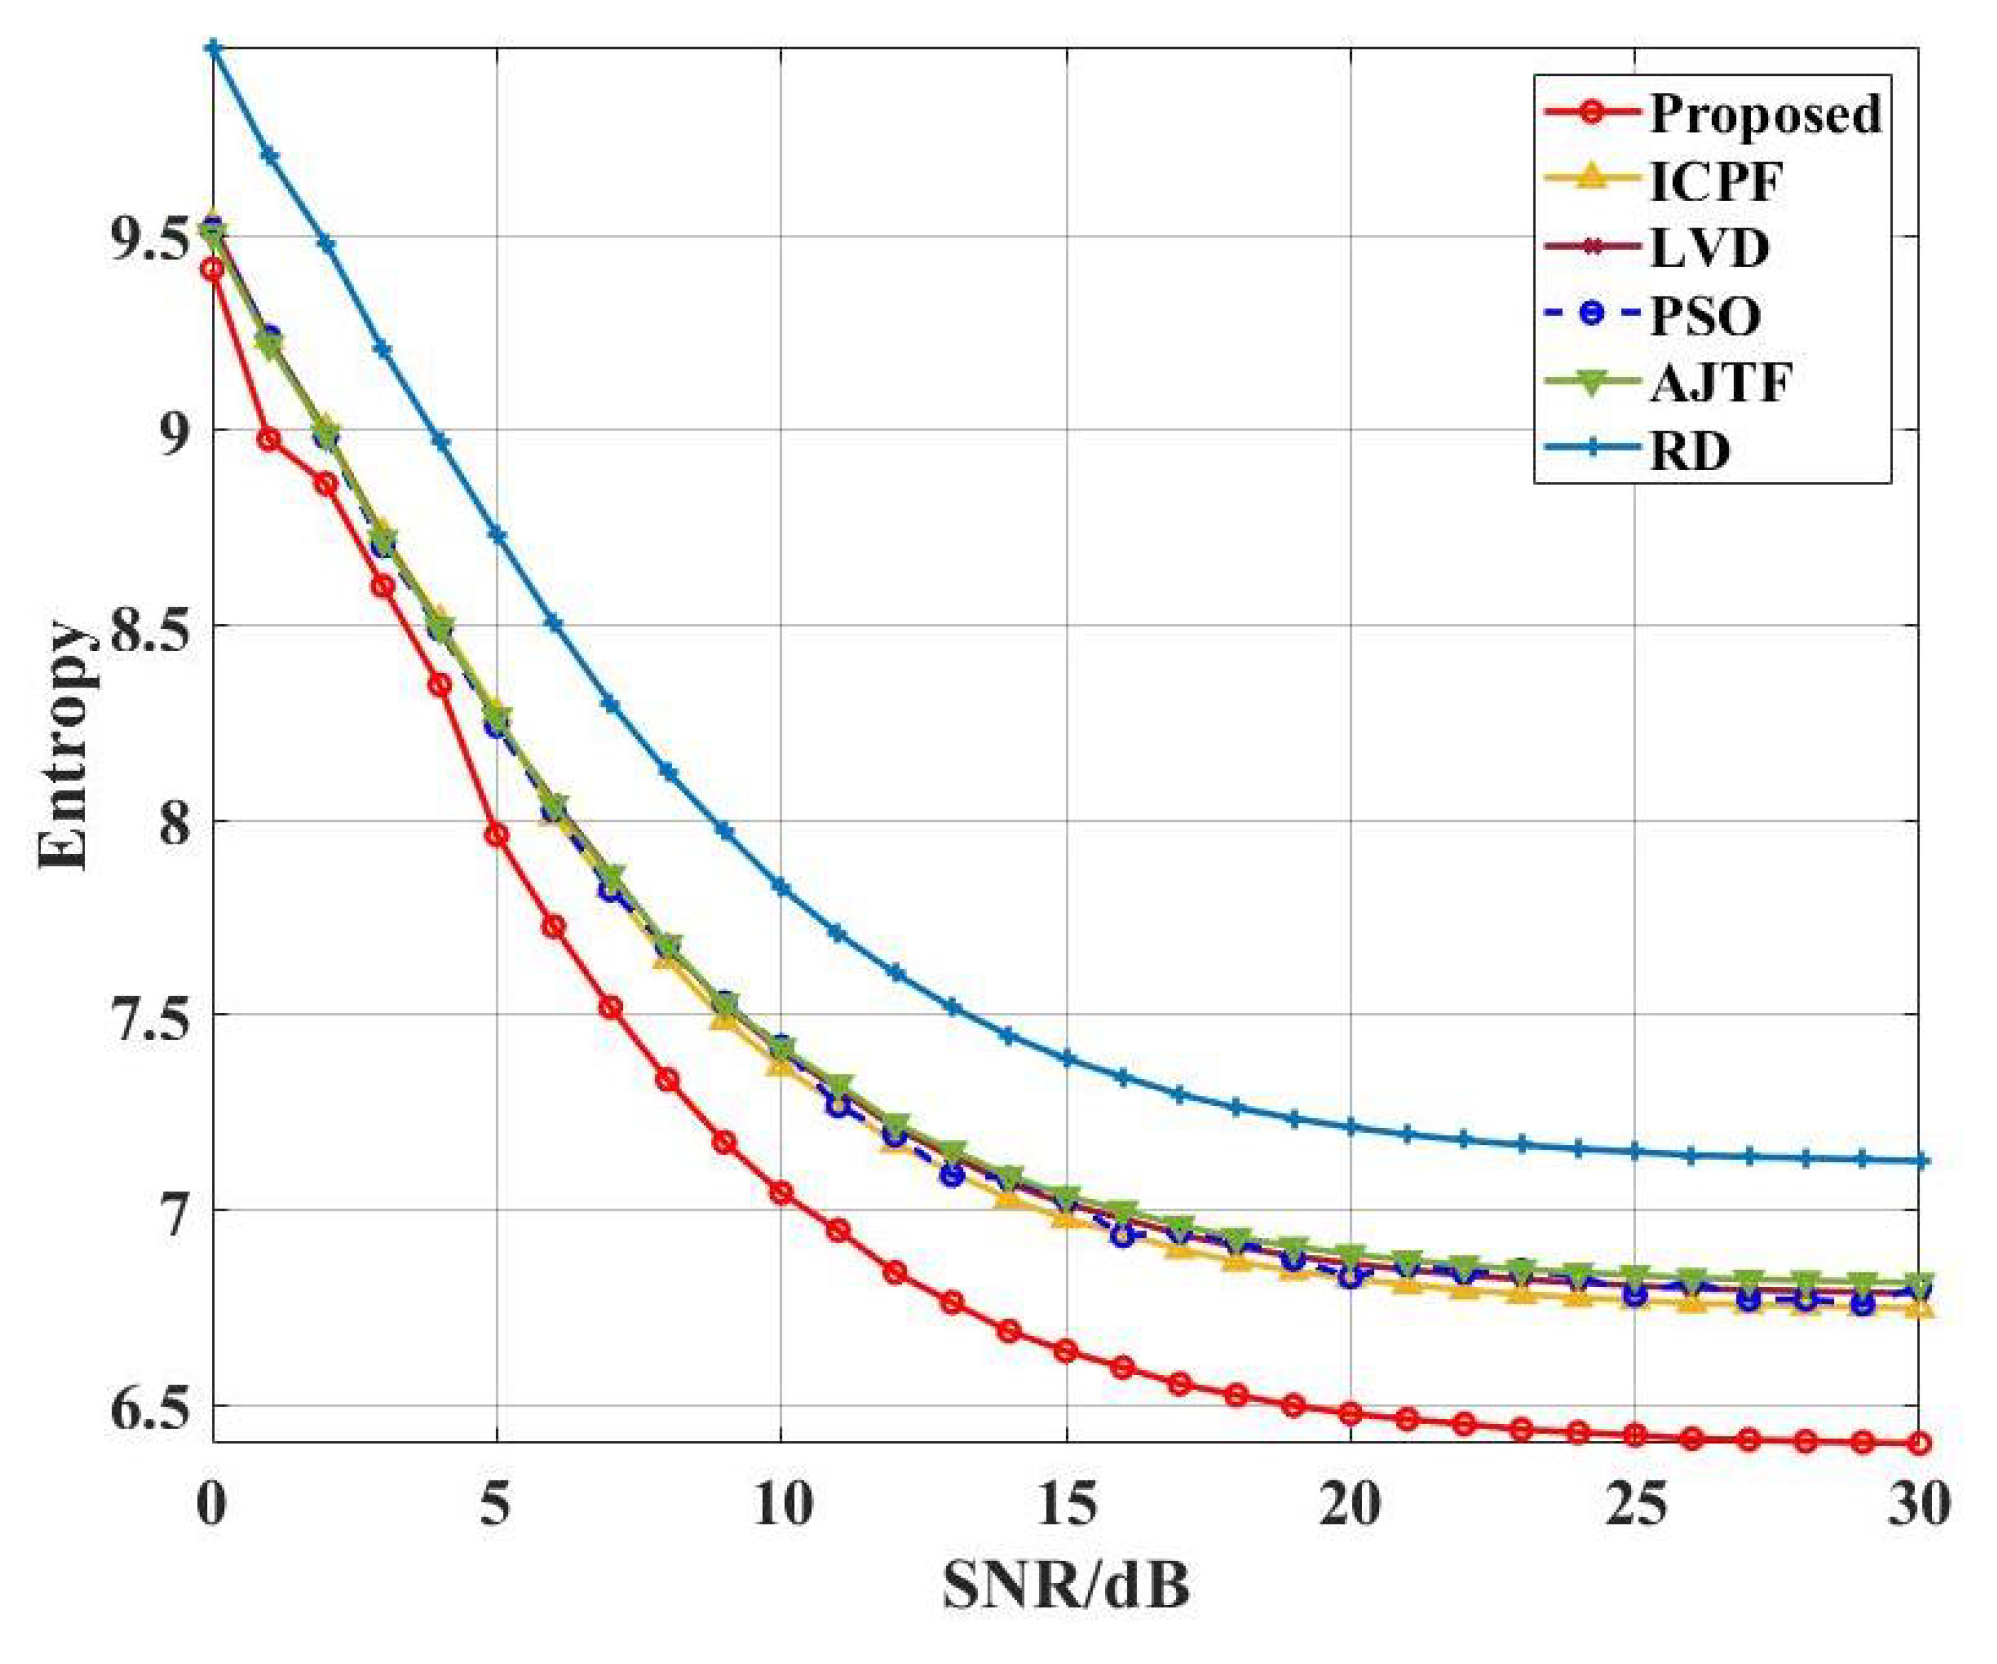
Complex zero-mean white Gaussian noise with a variance of σ 2 was added to demonstrate the algorithm’s robustness. The tested SNRs varied from 0 to 30 dB with a step size of 1 dB. For each given SNR, a total of 100 Monte Carlo experiments were processed. In Figure 14, the entropy values of the ISAR images increased for all methods as the SNR decreased. However, the entropy of the ISAR images using the proposed method was lower than that of the others across all SNRs. Consequently, the proposed RMC method was superior to the other existing methods for the removal of the non-uniform rotational motion in a noisy environment.

4.3. Actual Radar Measurement Data from an Aircraft Target

In this subsection, a set of measured data from the Yak-42 aircraft were utilized to further validate the effectiveness of the proposed algorithm. The Yak-42 is a medium-sized jet aircraft with a length of 36.68 m, a wingspan of 34.88 m, and a height of 9.83 m. The ground-based ISAR operated at a center frequency of 5.5 GHz with a bandwidth of 400 MHz. The dataset comprised approximately 100,000 PRIs, from which we extracted 4000 PRIs, each containing 256 sampling points [35]. Figure 15a first presents the pulse compression results along the range bins, from which it can be seen that severe range migration occurred. After performing the TMC procedure, the motion trajectories of all scatterers were precisely concentrated in their own range bins, as depicted in Figure 15b. After the effective motion compensation, the basic aircraft was outlined using the RD algorithm, as shown in Figure 15c. Furthermore, Figure 15d depicts the phase in the 199th range bin of the echo data. It should be noted that the phase of the signal varied linearly, which meant that the FT could accomplish the imaging procedure in the azimuthal bin.
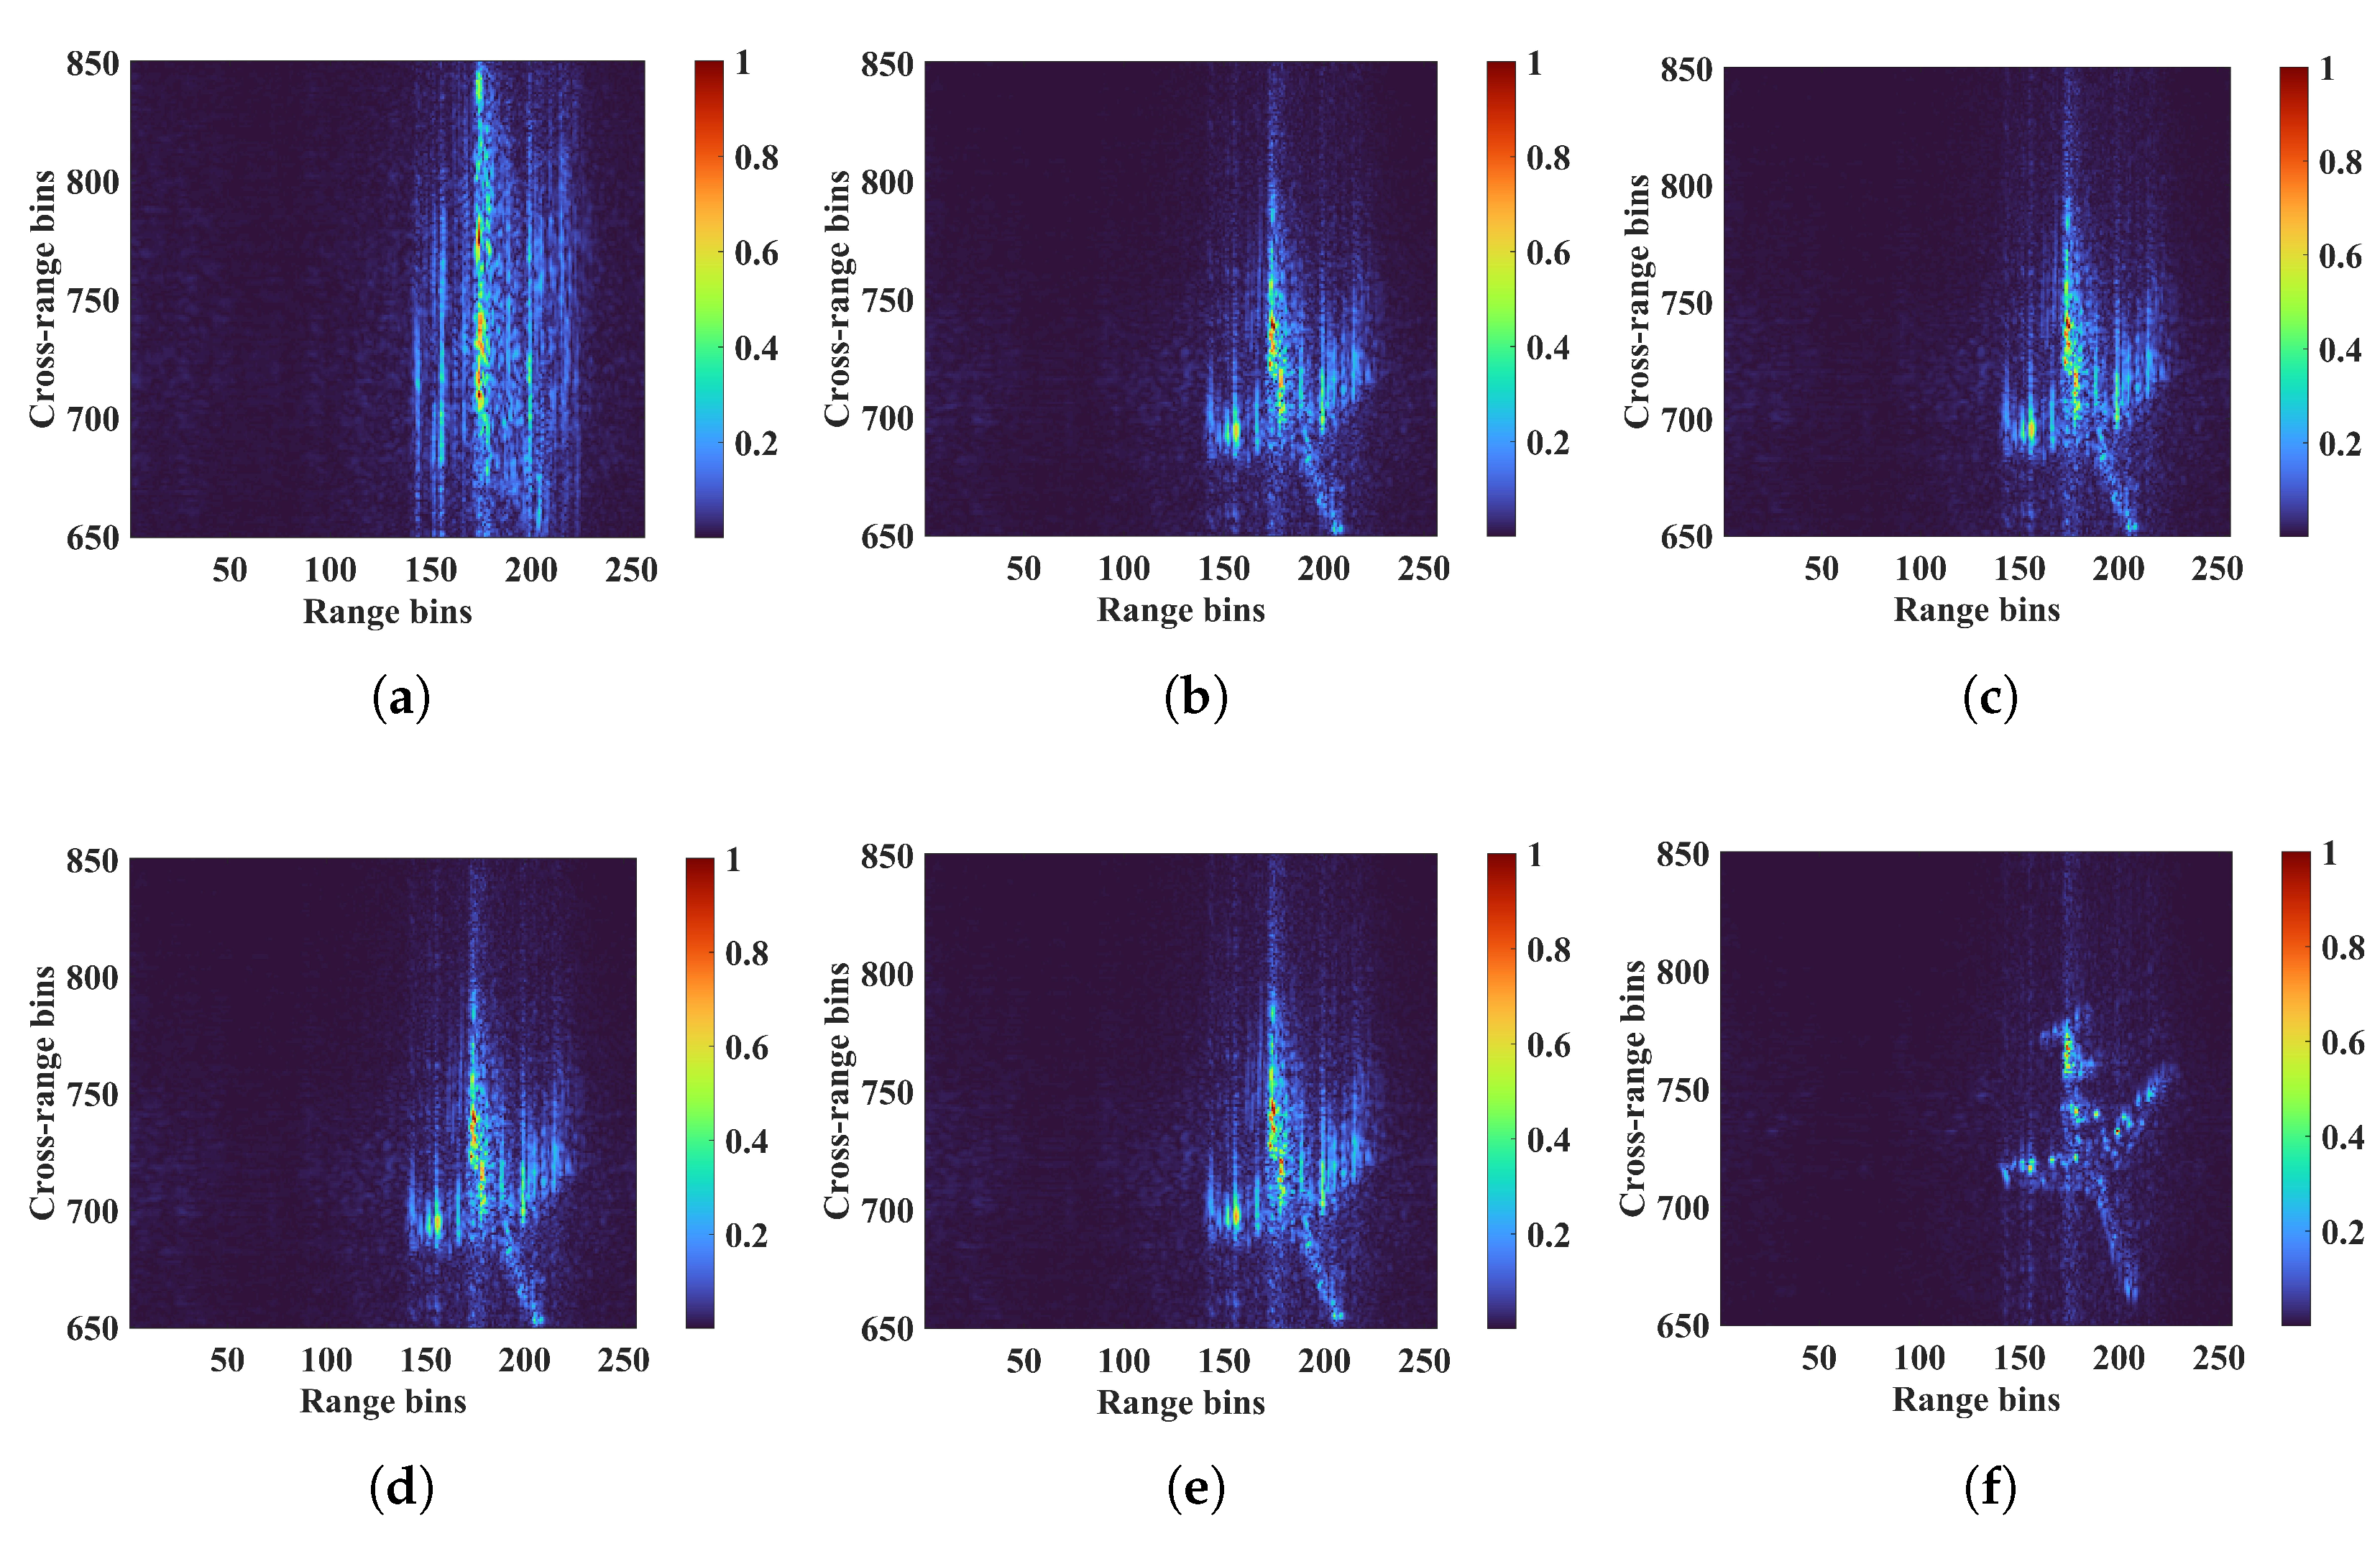
To evaluate the effectiveness of the proposed method in real situations, we extracted 1024 PRIs from 4000 PRIs using a non-uniform sampling procedure, where the sampling ratio between the angular velocity and angular acceleration was 3:4, and we used the RD algorithm to generate an ISAR image, as shown in Figure 16a. The results revealed a stretching phenomenon in the cross-range dimension due to non-uniform rotation (non-uniform sampling). Similarly, employing different algorithms for RMC, we obtained different results, as shown in Figure 16b–e. Although there was a noticeable improvement compared with Figure 16a, enabling a rough distinction of the airplane’s contour, the stretching phenomenon in the azimuth direction still existed. Furthermore, Figure 16f shows the ISAR image obtained via the proposed method, which outlined the airplane vividly, especially the crucial parts, such as the wings and tail. To quantify the ISAR image quality, Table 5 also lists the entropies and computation time of the images in Figure 16, showing that the proposed method was able to generate clear and focused images with the lowest entropy, which was 8.0015. To sum up, by combining both the ISAR images and quantitative indices, the proposed method outperformed the other existing methods in terms of computation time and entropy. The latter index was more worthy of attention because, for parameter estimation, the iteration method was based on simple numerical calculations, while the existing methods relied on solving complex equations and lacked feasibility in terms of their implementation in engineering.
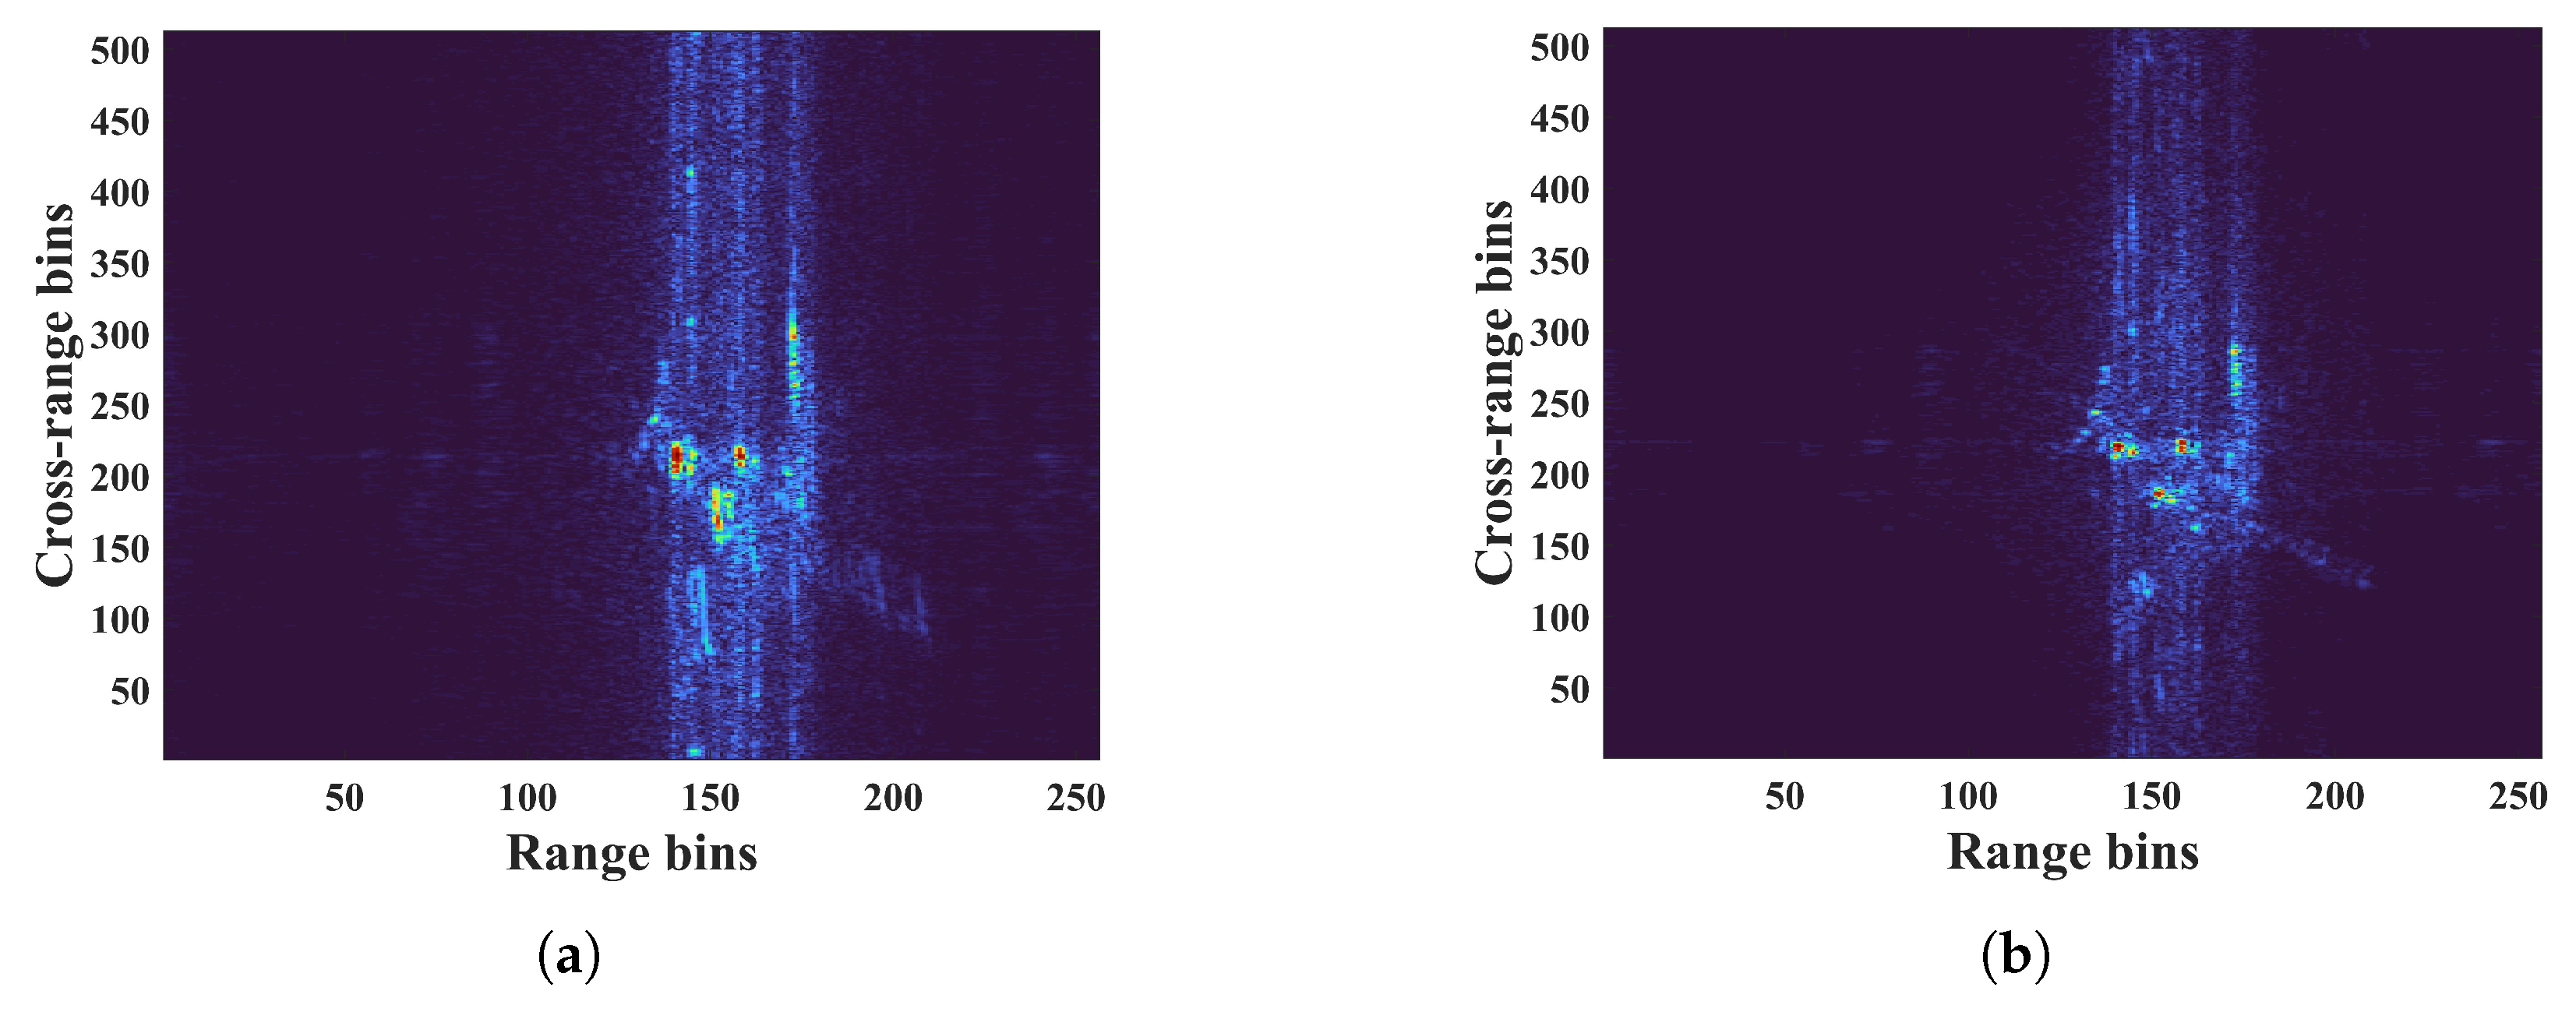
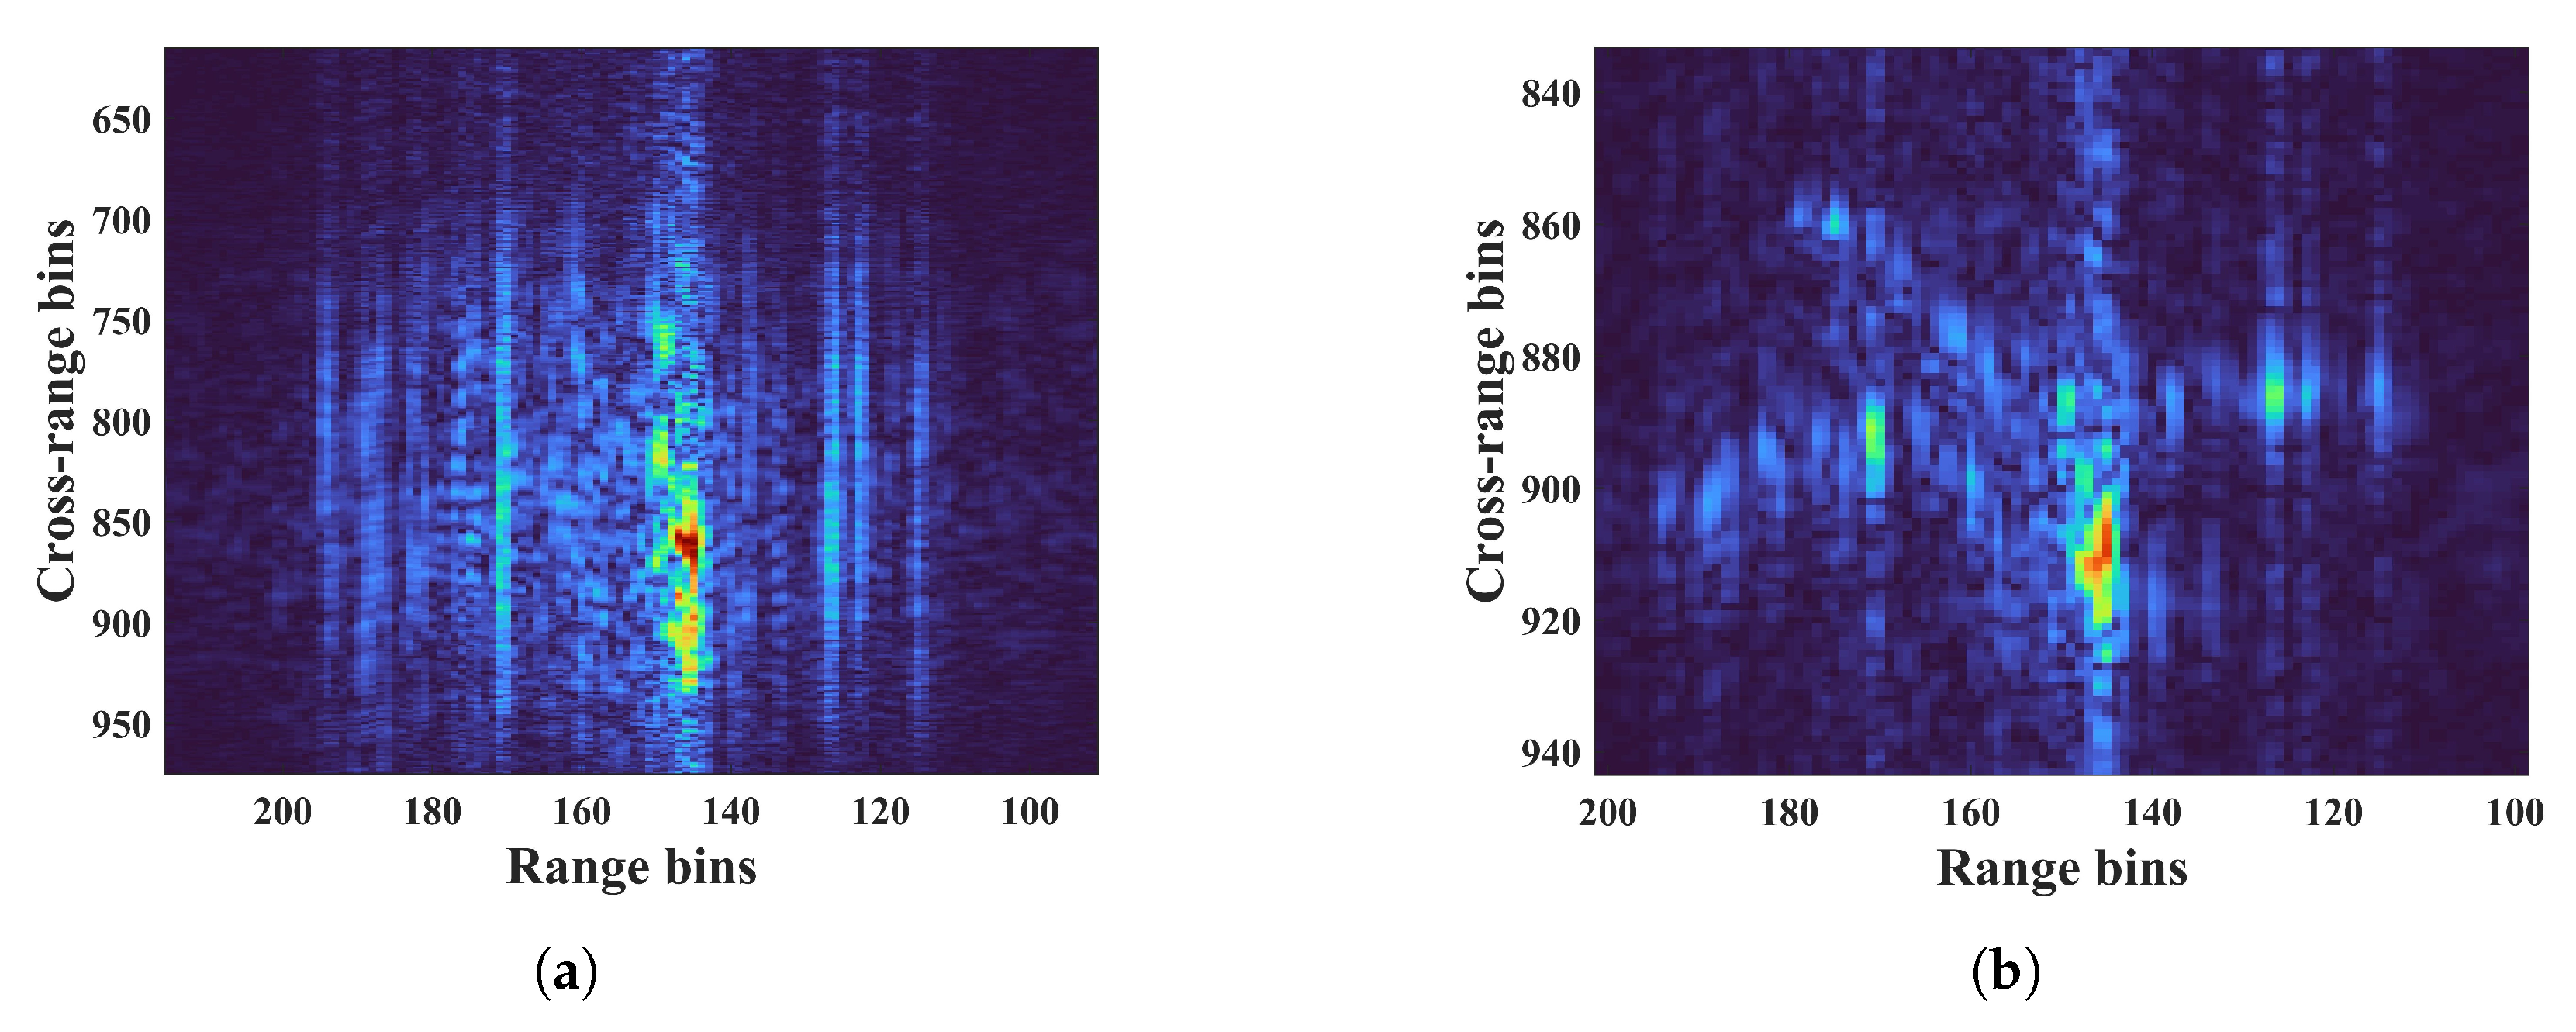
Additionally, we use the same method, i.e., non-uniform sampling, to extract echo data of two other motion trajectories from the 100,000 PRIs [35]. Subsequently, we applied the proposed algorithm, resulting in the outcomes depicted in Figure 17 and Figure 18. Figure 17a and Figure 18a represent the results of the RD algorithm, while Figure 17b and Figure 18b illustrate the imaging results using the proposed algorithm. These results show that the proposed algorithm effectively compensated for the impact from non-uniform rotation and generated clear images.

5. Conclusions

To address the issue of image defocusing caused by rotational parameter estimation errors in the ISAR imaging of targets undergoing non-uniform rotation, this study proposes a new RMC method. Specifically, by using the iterative search method combined with the residual norm criterion after linearly fitting the signal phase, the non-uniform rotation signal is compensated using the search results, and an inverse function interpolation method is derived to complete the rotation compensation procedure. Thus, the proposed algorithm can estimate rotation parameters more accurately without impacts from estimation errors so as to enhance the image quality with low entropy and reduce the computational load. Compared with the RD [5], RID [15], AJTF [24], PSO [25], LVD [34], and ICPF [16] algorithms, the effectiveness and superiority of the proposed method were comprehensively validated using simulation data from an ideal point scatter target model, full-wave electromagnetic simulation data of an airplane 3D conducting body model, and actual radar measurement data from an aircraft target.

Author Contributions

Conceptualization, X.Y. and W.S.; methodology, X.Y.; software, X.Y.; validation, X.Y. and W.S.; formal analysis, X.Y.; investigation, X.Y.; resources, X.Y.; data curation, X.Y.; writing—original draft preparation, X.Y.; writing—review and editing, W.S., A.X. and R.Z.; visualization, X.Y.; supervision, W.S.; project administration, W.S.; funding acquisition, R.Z. All authors have read and agreed to the published version of the manuscript.

Funding

This research was funded by the National Natural Science Foundation of China under Grant 61971224.

Data Availability Statement

Data is contained within the article.

Acknowledgments

The authors would like to thank all of the reviewers and editors for their constructive comments and suggestions that had an important role in further improving this work.

Conflicts of Interest

The authors declare no conflicts of interest.

References

  1. Walker, J.L. Range-Doppler Imaging of Rotating Objects. IEEE Trans. Aerosp. Electron. Syst. 1980, AES–16, 23–52. [Google Scholar] [CrossRef]
  2. Berizzi, F.; Mese, E.D.; Diani, M.; Martorella, M. High-Resolution ISAR Imaging of Maneuvering Targets by Means of the Range Instantaneous Doppler Technique: Modeling and Performance Analysis. IEEE Trans. Image Process. 2001, 10, 1880–1890. [Google Scholar] [CrossRef]
  3. Li, J.; Wu, R.; Chen, V.C. Robust autofocus algorithm for ISAR imaging of moving targets. IEEE Trans. Aerosp. Electron. Syst. 2001, 37, 1056–1069. [Google Scholar] [CrossRef]
  4. Bai, X.; Tao, R.; Wang, Z.; Wang, Y. ISAR imaging of a ship target based on parameter estimation of multicomponent quadratic frequency-modulated signals. IEEE Trans. Geosci. Remote Sens. 2014, 52, 1418–1429. [Google Scholar] [CrossRef]
  5. Guttavelli, A.; Rao, K. Comparison of various Algorithms for RD, RID and RIC methods using ISAR imaging. Int. J. Appl. Eng. Res. 2016, 11, 3364–3368. [Google Scholar]
  6. Zhu, D.; Wang, L.; Yu, Y.; Tao, Q.; Zhu, Z. Robust ISAR range alignment via minimizing the entropy of the average range profile. IEEE Geosci. Remote Sens. Lett. 2009, 6, 204–208. [Google Scholar]
  7. Kang, M.-S.; Bae, J.-H.; Lee, S.-H.; Kim, K.-T. Efficient ISAR autofocus via minimization of Tsallis Entropy. IEEE Trans. Aerosp. Electron. Syst. 2016, 52, 2950–2960. [Google Scholar] [CrossRef]
  8. Xia, S.; Wang, Y.; Zhang, J.; Dai, F. High-Speed Maneuvering Target Inverse Synthetic Aperture Radar Imaging and Motion Parameter Estimation Based on Fast Spare Bayesian Learning and Minimum Entropy. Remote Sens. 2023, 15, 3376. [Google Scholar] [CrossRef]
  9. Liu, C.; Luo, Y.; Yu, Z.; Feng, J. ISAR Imaging of Non-Stationary Moving Target Based on Parameter Estimation and Sparse Decomposition. Remote Sens. 2023, 15, 2368. [Google Scholar] [CrossRef]
  10. Wang, Z.; Yang, W.; Chen, Z.; Zhao, Z.; Hu, H.; Qi, C. A Novel Adaptive Joint Time Frequency Algorithm by the Neural Network for the ISAR Rotational Compensation. Remote Sens. 2018, 10, 334. [Google Scholar] [CrossRef]
  11. Li, W.; Yuan, Y.; Zhang, Y.; Luo, Y. Unblurring ISAR Imaging for Maneuvering Target Based on UFGAN. Remote Sens. 2022, 14, 5270. [Google Scholar] [CrossRef]
  12. Shi, H.; Yang, T.; Qiao, Z. ISAR Autofocus Imaging Algorithm for Maneuvering Targets Based on Phase Retrieval and Gabor Wavelet Transform. Remote Sens. 2018, 10, 1810. [Google Scholar] [CrossRef]
  13. Bao, Z.; Sun, C.; Xing, M. Time-frequency approaches to ISAR imaging of maneuvering targets and their limitations. IEEE Trans. Aerosp. Electron. Syst. 2001, 37, 1091–1099. [Google Scholar]
  14. Wang, Y. Inverse synthetic aperture radar imaging of manoeuvring target based on range-instantaneous-Doppler and range-instantaneous-chirp-rate algorithms. IET Radar Sonar Navig. 2012, 6, 921–928. [Google Scholar] [CrossRef]
  15. Wang, Y.; Huang, X.; Zhang, Q. Rotation parameters estimation and cross-range scaling research for range instantaneous doppler ISAR images. IEEE Sens. J. 2020, 20, 7010–7020. [Google Scholar] [CrossRef]
  16. Kang, K.-B.; Kang, B.-S.; Park, S.-H.; Kim, K.-T. Efficient ISAR imaging approach for nonuniformly rotating targets based on ICPF-PPP. IEEE Trans. Image Process. 2022, 58, 5944–5953. [Google Scholar] [CrossRef]
  17. Li, D.; Gui, X.; Liu, H.; Su, J.; Xiong, H. An ISAR imaging algorithm for maneuvering targets with low SNR based on parameter estimation of multicomponent quadratic FM signals and nonuniform FFT. IEEE J. Sel. Top. Appl. Earth Obs. Remote Sens. 2016, 9, 5688–5702. [Google Scholar] [CrossRef]
  18. Huang, P.; Xia, X.-G.; Zhan, M.; Liu, X.; Liao, G.; Jiang, X. ISAR imaging of a maneuvering target based on parameter estimation of multicomponent cubic phase signals. IEEE Trans. Geosci. Remote Sens. 2022, 660, 1–18. [Google Scholar] [CrossRef]
  19. Li, D.; Zhan, M.; Zhang, X.; Fang, Z.; Liu, H. ISAR imaging of nonuniformly rotating target based on the multicomponent CPS model under low SNR environment. IEEE Trans. Aerosp. Electron. Syst. 2017, 53, 1119–1135. [Google Scholar] [CrossRef]
  20. Lv, Q.; Su, T.; He, X. An ISAR imaging algorithm for nonuniformly rotating targets with low SNR based on modified bilinear parameter estimation of cubic phase signal. IEEE Trans. Aerosp. Electron. Syst. 2018, 54, 3108–3124. [Google Scholar] [CrossRef]
  21. Li, Y.; Zhang, J.; Zheng, J.; Niu, J.; Zhou, Y.; Meng, N. ISAR imaging of nonuniformly rotating targets with low SNR based on third order autocorrelation function. IEEE Access 2020, 8, 74707–74719. [Google Scholar] [CrossRef]
  22. Li, Y.; Zhang, J.; Zhou, Y.; Niu, J.; Wang, L.; Meng, N.; Zheng, J. ISAR imaging of nonuniformly rotating targets with low SNR based on coherently integrated nonuniform trilinear autocorrelation function. IEEE Geosci. Remote Sens. Lett. 2021, 18, 1074–1078. [Google Scholar] [CrossRef]
  23. Wu, W.; Xu, S.; Hu, P.; Zou, J.; Chen, Z. Inverse Synthetic Aperture Radar Imaging of Targets with Complex Motion based on Optimized Non-Uniform Rotation Transform. Remote Sens. 2018, 10, 593. [Google Scholar] [CrossRef]
  24. Thayaparan, T.; Brinkman, W.; Lampropoulos, G. Inverse synthetic aperture radar image focusing using fast adaptive joint time-frequency and three-dimensional motion detection on experimental radar data. IET Radar Sonar Navig. 2010, 4, 382–394. [Google Scholar] [CrossRef]
  25. Brinkman, W.; Thayaparan, T. Focusing inverse synthetic aperture radar images with higher-order motion error using the adaptive joint-time frequency algorithm optimized with the genetic algorithm and the particle swarm optimization algorithm comparison and results. IET Signal Process. 2009, 3, 329–342. [Google Scholar]
  26. Liu, L.; Zhou, F.; Tao, M.L.; Zhao, B.; Zhang, Z.J. Cross-range scaling method of inverse synthetic aperture radar image based on discrete polynomial-phase transform. IET Radar Sonar Navig. 2015, 9, 333–341. [Google Scholar] [CrossRef]
  27. Kang, B.-S.; Bae, J.-H.; Lee, S.-J.; Kim, C.-H.; Kim, K.-T. Isar rotational motion compensation algorithm using polynomial phase transform. Microw. Opt. Technol. Lett. 2016, 58, 1551–1557. [Google Scholar] [CrossRef]
  28. Ozdemir, C. Inverse Synthetic Aperture Radar with MATLAB Algorithms, 2nd ed.; John Wiley and Sons: Hoboken, NJ, USA, 2021. [Google Scholar]
  29. De Luigi, C.; Jauffret, C. Estimation and classification of FM signals using time frequency transforms. IEEE Trans. Aerosp. Electron. Syst. 2005, 41, 421–437. [Google Scholar] [CrossRef]
  30. Peleg, S.; Friedlander, B. The discrete polynomial-phase transform. IEEE Trans. Signal Process. 1995, 43, 1901–1914. [Google Scholar] [CrossRef]
  31. Wang, P.; Li, H.; Djurović, I.; Himed, B. Integrated Cubic Phase Function for Linear FM Signal Analysis. IEEE Trans. Aerosp. Electron. Syst. 2010, 46, 963–977. [Google Scholar] [CrossRef]
  32. Ramos, C.J.; Martins, A.P.; Carvalho, A.S. Frequency and Phase-Angle Estimation Using Ordinary Least Squares. IEEE Trans. Ind. Electron. 2015, 62, 5677–5688. [Google Scholar] [CrossRef]
  33. Long, T.; Jiao, W.; He, G. RPC Estimation via 1-Norm-Regularized Least Squares (L1LS). IEEE Trans. Geosci. Remote Sens. 2015, 53, 4554–4567. [Google Scholar] [CrossRef]
  34. Zuo, L.; Wang, B. ISAR imaging of non-uniform rotating targets based on optimized matching Fourier transform. IEEE Access 2020, 8, 64324–64330. [Google Scholar] [CrossRef]
  35. Yun, T.; Pan, Q.; Hao, Y.; Xu, R. Target recognition algorithm based on HRRP time-spectrogram feature and multi-scale asymmetric convolutional neural network. J. Northwest. Polytech. Univ. 2023, 43, 537–545. [Google Scholar] [CrossRef]
Figure 1. Geometric model of ISAR imaging.
Remotesensing 16 03629 g001
Figure 2. Flowchart of the proposed algorithm.
Remotesensing 16 03629 g002
Figure 3. Ideal scattering points outlining an airplane.
Remotesensing 16 03629 g003
Figure 4. Aspect angle of the non-uniformly rotating target.
Remotesensing 16 03629 g004
Figure 5. ISAR imaging results obtained using different algorithms. (a) RD; (b) RID; (c) AJTF; (d) PSO; (e) LVD; (f) ICPF; (g) replaced method [27]; (h) proposed method.
Remotesensing 16 03629 g005
Figure 6. Entropy of images versus CPI durations for the six methods.
Remotesensing 16 03629 g006
Figure 7. Comparison of the results of data in the 108th range bin for the RD algorithm, the ICPF algorithm, and the proposed method, with a CPI duration of 1.4 s.
Remotesensing 16 03629 g007
Figure 8. Entropy versus angular acceleration for the six methods.
Remotesensing 16 03629 g008
Figure 9. Scaled target geometric models with maximum and minimum sizes. (a) Minimum size; (b) maximum size.
Remotesensing 16 03629 g009
Figure 10. Entropy of images when using six algorithms at different target sizes.
Remotesensing 16 03629 g010
Figure 11. ISAR images of a target with third-order rotation. (a) RD; (b) proposed method.
Remotesensing 16 03629 g011
Figure 12. Boeing 737 model.
Remotesensing 16 03629 g012
Figure 13. ISAR imaging results obtained using different algorithms. (a) RD; (b) AJTF.; (c) PSO; (d) LVD; (e) ICPF; (f) proposed method.
Remotesensing 16 03629 g013
Figure 14. Entropy of images versus different SNRs.
Remotesensing 16 03629 g014
Figure 15. Motion compensation analysis. (a) Range compression result; (b) motion compensation result; (c) RD result after motion compensation; (d) phase of the signal in the 199th range bin.
Remotesensing 16 03629 g015
Figure 16. ISAR imaging results obtained by using different algorithms. (a) RD; (b) AJTF; (c) PSO; (d) LVD; (e) ICPF; (f) proposed method.
Remotesensing 16 03629 g016
Figure 17. Imaging results for trajectory 1: (a) RD; (b) proposed method.
Remotesensing 16 03629 g017
Figure 18. Imaging results for trajectory 2: (a) RD; (b) proposed method.
Remotesensing 16 03629 g018
Table 1. Simulation parameters.
ParametersValues
Carrier frequency10 GHz
Range bandwidth400 MHz
CPI1.02 s
SNR20 dB
Pulse duration time4 ms
Number of bursts256
Angular velocity0.020 rad/s
Angular acceleration0.048 rad/s2
Table 2. Entropies, computation time, and stretched values of ISAR images in Figure 5.
AlgorithmsStretched ValuesEntropiesComputation Time
RD147.258.11/
RID121.967.74/
AJTF99.547.1919.40 s
PSO87.917.186.83 s
LVD94.307.140.88 s
ICPF85.857.091.15 s
Replaced method 91.65 7.07 0.42 s
Proposed11.356.490.52 s
Table 3. Simulation parameters.
ParametersValues
Carrier frequency10 GHz
Range bandwidth400 MHz
CPI1.1475 s
SNR20 dB
Pulse duration time4.5 ms
Number of bursts256
Angular velocity0.025 rad/s
Angular acceleration0.050 rad/s2
Target wingspan28.45 m
Target length37.81 m
Target height11.1 m
Table 4. Entropies and computation time of ISAR images in Figure 13.
AlgorithmsEntropiesComputation Time
RD7.2140/
AJTF6.887320.3997 s
PSO6.84588.1070 s
LVD6.86250.8875 s
ICPF6.82500.9443 s
Proposed6.47820.9154 s
Table 5. Entropies and computation time of ISAR images in Figure 16.
AlgorithmsEntropiesComputation Time
RD9.1249/
AJTF8.664884.7111 s
PSO8.66248.6455 s
LVD8.657961.9058 s
ICPF8.64986.3751 s
Proposed8.00157.7714 s
Disclaimer/Publisher’s Note: The statements, opinions and data contained in all publications are solely those of the individual author(s) and contributor(s) and not of MDPI and/or the editor(s). MDPI and/or the editor(s) disclaim responsibility for any injury to people or property resulting from any ideas, methods, instructions or products referred to in the content.