Application of Remote Sensing and Explainable Artificial Intelligence (XAI) for Wildfire Occurrence Mapping in the Mountainous Region of Southwest China
Abstract
1. Introduction
2. Data and Methodology
2.1. Study Area
2.2. Dataset
2.2.1. FIRMS-MODIS and VIIRS Active Fire Products and Pre-Treatment
2.2.2. Data Sources and Extraction of Factors Affecting Wildfires
- (1)
- Meteorological factors. Meteorological data consists of daily weather data from 21 national-level meteorological stations and 35 regional-level meteorological stations in the study region. Python programming was employed to compute the closest meteorological station to each point (fire and random points) in batch processing. The corresponding meteorological variables extracted included the average number of rainless days during the fire-prevention period, precipitation, average relative humidity, average minimum temperature, average maximum temperature, daily mean temperature, daily maximum temperature, daily minimum temperature, daily accumulated precipitation, daily maximum wind speed, daily average relative humidity, daily minimum relative humidity, daily accumulated evaporation, daily average land surface temperature, daily maximum land surface temperature, and daily minimum land surface temperature. Daily meteorological data primarily originate from the China Meteorological Administration’s Comprehensive Meteorological Information Service System (CIMISS) through the China Meteorological Data Service Platform (CMDSP).
- (2)
- Human factors. Human factors encompass distances to highways, distances to railways, distances to residential areas, population density, and per capita GDP. Among these, highway, railway, and residential area data are derived from the 1:250,000 infrastructure vector map provided by the China National Administration of Surveying, Mapping, and Geoinformation. The minimal distance linking points to respective features was ascertained through the employment of the nearest neighbor analysis functionality within ArcGIS 10.6. Data on population density and GDP per capita were derived from the 1 km resolution grid data for population and GDP for the years 2000, 2005, 2010, and 2015, obtained from the Resource and Environmental Science Data Center of the Chinese Academy of Sciences (http://www.resdc.cn (accessed on 1 January 2024)). Population and GDP growth rates for each year were calculated based on the National Statistical Yearbook from 2004 to 2020. Using the raster calculator tool in ArcGIS 10.6, raster data for population and GDP were computed for each year. The multivalve extraction tool was subsequently used to obtain population density and per capita GDP corresponding to each point’s respective raster data.
- (3)
- Topographical and vegetation factors. The terrain-related factors include three key variables: altitude, slope, and aspect. Data on altitude, featuring a 90-m resolution, were sourced from the NASA Shuttle Radar Topography Mission (SRTM), accessible online through SRTM’s website (https://SRTM.csi.cgiar.org). Slope and aspect were generated using the Surface toolbox within ArcGIS 10.6, which utilized the Digital Elevation Model (DEM) dataset. Vegetation-type information originates from the digital map published by the Chinese Academy of Science. This dataset serves as a substitute for ground fuel maps. The Fractional Vegetation Cover (FVC) data were extracted from the Normalized Difference Vegetation Index (NDVI) data, which have a spatial resolution of 1 km. These data were made available through the International Scientific & Technological Cooperation Program in conjunction with the Chinese Academy of Sciences. These were calculated using the pixel binary model [68]. The formula is as follows:assigned to areas of bare soil or zones devoid of vegetation coverage. values for pixels that are fully enveloped by vegetation. This study selected a threshold of 95% of pixels as pure vegetation pixels and a threshold of 5% of pixels as pure soil pixels.
2.3. Methodology
2.3.1. Machine Learning Modeling
- (1)
- Logistic Regression model (LR)
- (2)
- Random Forest model (RF)
- (3)
- eXtreme Gradient Boosting Model (XGBoost)
2.3.2. Selection of Wildfire Driver Factors
- (1)
- Multicollinearity Test
- (2)
- Determination of Wildfire Driving Factors
- (3)
- Variable Importance Measures of Factors
- (4)
- Assessment of Relative Importance of Driver Factors
- (5)
- Validation of Wildfire Prediction Models
3. Results and Discussion
3.1. Selection of Wildfire Driving Factors
3.1.1. Selection of Meteorological Drivers
3.1.2. Selection of Local Influence Factors
3.2. Wildfire Prediction Model and Risk Zoning
3.2.1. Estimation and Identification of Model Parameters
3.2.2. Likelihood of Fire Occurrence
3.2.3. Evaluation of Predictive Performance and Activation Ability
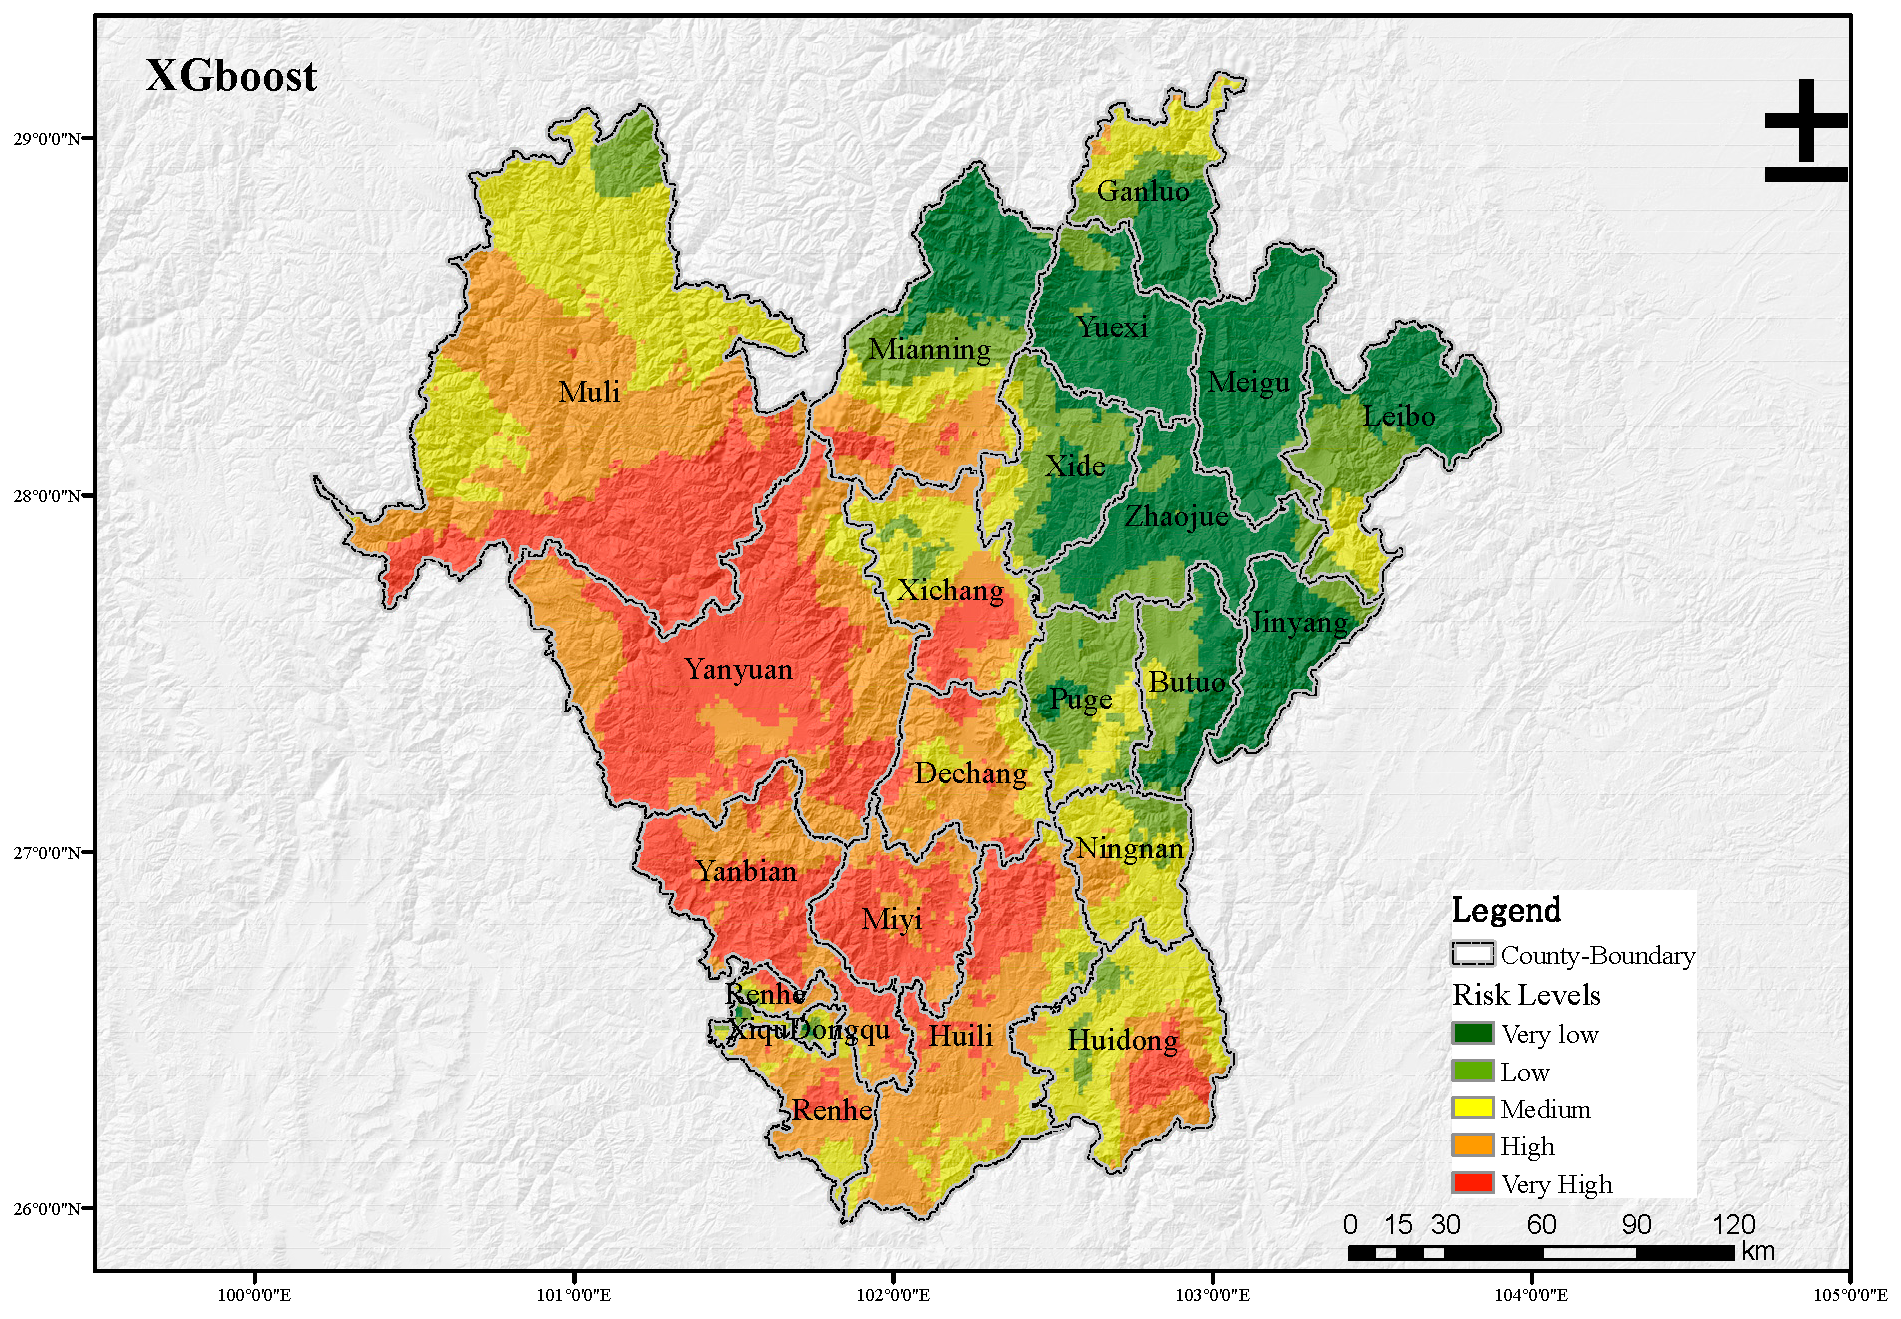
3.2.4. Using the Optimal Model for Risk Zoning Prediction
4. Discussion
4.1. Factors Influencing the Occurrence of Fires
4.2. Model Comparison and Impact
4.3. Limitations
5. Conclusions
Author Contributions
Funding
Data Availability Statement
Acknowledgments
Conflicts of Interest
References
- Yang, Y.; Tian, K.; Hao, J.; Pei, S.; Yang, Y.B. Biodiversity and biodiversity conservation in Yunnan, China. Biodivers. Conserv. 2004, 13, 813–826. [Google Scholar] [CrossRef]
- Zhao, P.; Zhang, F.; Lin, H.; Xu, S. GIS-Based Forest Fire Risk Model: A Case Study in Laoshan National Forest Park, Nanjing. Remote Sens. 2021, 13, 3704. [Google Scholar] [CrossRef]
- Bowman, D.M.J.S.; Balch, J.K.; Artaxo, P.; Bond, W.J.; Carlson, J.M.; Cochrane, M.A.; D’Antonio, C.M.; DeFries, R.S.; Doyle, J.C.; Harrison, S.P.; et al. Fire in the earth system. Science 2009, 324, 481–484. [Google Scholar] [CrossRef] [PubMed]
- Cui, L.; Luo, C.; Yao, C.; Zou, Z.; Wu, G.; Li, Q.; Wang, X. The influence of climate change on forest fires in Yunnan Province, Southwest China detected by GRACE satellites. Remote Sens. 2022, 14, 712. [Google Scholar] [CrossRef]
- Zhang, Z.; Yin, J. Research on forest fire risk assessment in high mountain forest areas in southwest China. China Emerg. Rescue 2021, 5, 179–186. [Google Scholar] [CrossRef]
- Wang, W.; Zhao, F.; Wang, Y.; Huang, X.; Ye, J. Seasonal differences in the spatial patterns of wildfire drivers and susceptibility in the southwest mountains of China. Sci. Total Environ. 2023, 869, 161782. [Google Scholar] [CrossRef]
- Flannigan, M.D.; Krawchuk, M.A.; de Groot, W.J.; Wotton, B.M.; Gowman, L.M. Implications of changing climate for global wildland fire. Int. J. Wildland Fire 2009, 18, 483–507. [Google Scholar] [CrossRef]
- Xie, L.; Zhang, R.; Zhan, J.; Li, S.; Shama, A.; Zhan, R.; Wang, T.; Lv, J.; Bao, X.; Wu, R. Wildfire Risk Assessment in Liangshan Prefecture, China Based on an Integration Machine Learning Algorithm. Remote Sens. 2022, 14, 4592. [Google Scholar] [CrossRef]
- Hu, H.; Luo, B.; Luo, S.; Wei, S.; Wang, Z.; Li, X.; Liu, F. Research progress on effects of forest fire disturbance on carbon pool of the forest ecosystem. Sci. Silvae Sin. 2020, 56, 160–169. [Google Scholar] [CrossRef]
- Zhuang, Y.; Li, R.; Yang, H.; Chen, D.; Chen, Z.; Gao, B.; He, B. Understanding temporal and spatial distribution of crop residue burning in China from 2003 to 2017 Using MODIS Data. Remote Sens. 2018, 10, 390. [Google Scholar] [CrossRef]
- Luo, X.; He, H.; Liang, Y.; Wu, Z.; Huang, C.; Zhang, Q. Simulating the effects of fire disturbance for predicting aboveground biomass of major forest types in the great Xing’an mountains. Acta Ecol. Sin. 2016, 36, 1104–1114. [Google Scholar] [CrossRef]
- Shi, K.; Touge, Y. Identifying the shift in global wildfire weather conditions over the past four decades: An analysis based on change-points and long-term trends. Geosci. Lett. 2023, 10, 3. [Google Scholar] [CrossRef]
- Westerling, A.L.; Hidalgo, H.G.; Cayan, D.R.; Swetnam, T.W. Warming and earlier spring increase western us forest wildfire activity. Science 2006, 313, 940–943. [Google Scholar] [CrossRef] [PubMed]
- Kane, V.R.; Cansler, C.A.; Povak, N.A.; Kane, J.T.; McGaughey, R.J.; Lutz, J.A.; Churchill, D.J.; North, M.P. Mixed severity fire effects within the Rim fire: Relative importance of local climate, fire weather, topography, and forest structure. For. Ecol. Manag. 2015, 358, 62–79. [Google Scholar] [CrossRef]
- Liu, J.; Guo, H.Y.; Gan, W.W.; Xu, Y.X.; Sun, R.; Li, Z.Y.; Wang, C.X.; Luo, Y. Study on spatio-temporal distribution and heterogeneity of climate forces of wildfires in Panxi Region. J. Southwest For. Univ. 2023, 43, 106–117. [Google Scholar] [CrossRef]
- Collins, B.M.; Stephens, S.L. Managing natural wildfires in Sierra Nevada wilderness areas. Front. Ecol. Environ. 2007, 5, 523–527. [Google Scholar] [CrossRef]
- Ying, L.; Cheng, H.; Shen, Z.; Guan, P.; Luo, C.; Peng, X. Relative humidity, and agricultural activities dominate wildfire ignitions in Yunnan, Southwest China: Patterns, thresholds, and implications. Agric. For. Meteorol. 2021, 307, 108540. [Google Scholar] [CrossRef]
- Syphard, A.D.; Radeloff, V.C.; Keeley, J.E.; Hawbaker, T.J.; Clayton, M.K.; Stewart, S.I.; Hammer, R.B. Human influence on California fire regimes. Ecol. Appl. 2007, 17, 1388–1402. [Google Scholar] [CrossRef]
- Ying, L.; Shen, Z.; Guan, P.; Cao, J.; Luo, C.; Peng, X.; Cheng, H. Impacts of the Western Pacific and Indian Ocean warm pools on wildfires in Yunnan, Southwest China: Spatial patterns with interannual and intra-annual variations. Geophys. Res. Lett. 2022, 49, e2022GL098797. [Google Scholar] [CrossRef]
- Wang, Z.H.; Dong, H.; Zhao, Y.Y.; He, S.C.; Yuan, Y.B.; Zhang, L.W. Predicting Forest Fire Risk in the Yunnan-Guizhou-Sichuan Region of China Using Machine Learning Models. J. Northeast. For. Univ. 2023, 51, 113–119. [Google Scholar]
- Flatley, W.T.; Lafon, C.W.; Grissino-Mayer, H.D. Climatic and topographic controls on patterns of fire in the southern and central Appalachian Mountains, USA. Landsc. Ecol. 2011, 26, 195–209. [Google Scholar] [CrossRef]
- Xu, C.; You, C. Climate-linked increasing vegetation fires in global high mountains. Ecography 2022, 12, e06527. [Google Scholar] [CrossRef]
- Sharma, N.; Behera, M.D.; Das, A.P.; Panda, R.M. Plant richness pattern in an elevation gradient in the Eastern Himalaya. Biodivers. Conserv. 2019, 28, 2085–2104. [Google Scholar] [CrossRef]
- Xiong, Q.L.; Luo, X.J.; Xiao, Y.; Liang, P.H.; Sun, H.; Pan, K.W.; Wang, L.X.; Li, L.J.; Pang, X.Y. Fire from policy, human interventions, or biophysical factors? temporal–spatial patterns of forest fire in southwestern China. For. Ecol. Manag. 2020, 474, 118381. [Google Scholar] [CrossRef]
- Maingi, J.K.; Henry, M.C. Factors influencing wildfire occurrence and distribution in eastern Kentucky, USA. Int. J. Wildland Fire 2007, 16, 23–33. [Google Scholar] [CrossRef]
- Mansuy, N.; Miller, C.; Parisien, M.A.; Parks, S.A.; Batllori, E.; Moritz, M.A. Contrasting human influences and macro-environmental factors on fire activity inside and outside protected areas of North America. Environ. Res. Lett. 2019, 14, 064007. [Google Scholar] [CrossRef]
- Thompson, M.P.; Calkin, D.E.; Finney, M.A.; Ager, A.A.; Gilbertson-Day, J.W. Integrated National-Scale Assessment of Wildfire Risk to Human and Ecological Values. Stoch. Environ. Res. Risk Assess. 2011, 25, 761–780. [Google Scholar] [CrossRef]
- Miranda, B.R.; Sturtevant, B.R.; Stewart, S.I.; Hammer, R.B. Spatial and Temporal Drivers of Wildfire Occurrence in the Context of Rural Development in Northern Wisconsin, USA. Int. J. Wildland Fire 2012, 21, 141–154. [Google Scholar] [CrossRef]
- Ganteaume, A.; Long-Fournel, M. Driving Factors of Fire Density Can Spatially Vary at the Local Scale in South-Eastern France. Int. J. Wildland Fire 2015, 24, 650–664. [Google Scholar] [CrossRef]
- Lozano, F.J.; Suárez-Seoane, S.; Kelly, M.; Luis, E. A Multiscale Approach for Modeling Fire Occurrence Probability Using Satellite Data and Classification Trees: A Case Study in a Mountainous Mediterranean Region. Remote Sens. Environ. 2008, 112, 708–719. [Google Scholar] [CrossRef]
- Yue, X.; Mickley, L.J.; Logan, J.A.; Kaplan, J.O. Ensemble projections of wildfire activity and carbonaceous aerosol concentrations over the western United States in the mid-21st century. Atmos. Environ. 2013, 77, 767–780. [Google Scholar] [CrossRef] [PubMed]
- Abatzoglou, J.T.; Kolden, C.A. Relationships between climate and macroscale area burned in the western United States. Int. J. Wildland Fire 2013, 22, 1003–1020. [Google Scholar] [CrossRef]
- Liu, Z.; Wimberly, M.C. Climatic and landscape influences on fire regimes from 1984 to 2010 in the western United States. PLoS ONE 2015, 10, e0140839. [Google Scholar] [CrossRef]
- Abatzoglou, J.T.; Williams, A.P. Impact of anthropogenic climate change on wildfire across western us forests. Proc. Natl. Acad. Sci. USA 2016, 113, 11770–11775. [Google Scholar] [CrossRef]
- Nagy, R.C.; Fusco, E.; Bradley, B.; Abatzoglou, J.T.; Balch, J. Human-related ignitions increase the number of large wildfires across U.S. ecoregions. Fire 2018, 1, 4. [Google Scholar] [CrossRef]
- Sofia, B.; Ferrara, C.; Guglietta, D.; Ricotta, C. Fifteen years of changes in fire ignition frequency in Sardinia (Italy): A rich-get-richer process. Ecol. Indic. 2019, 104, 543–548. [Google Scholar] [CrossRef]
- Zubkova, M.N.; Boschetti, L.; Abatzoglou, J.T.; Giglio, L. Changes in fire activity in Africa from 2002 to 2016 and their potential drivers. Geophys. Res. Lett. 2019, 46, 7643–7653. [Google Scholar] [CrossRef] [PubMed]
- Littell, J.S.; Peterson, D.L.; Riley, K.L.; Liu, Y.; Luce, C.H. A review of the relationships between drought and forest fire in the United States. Glob. Chang. Biol. 2016, 22, 2353–2369. [Google Scholar] [CrossRef] [PubMed]
- Shawki, D.; Field, R.D.; Tippett, M.K.; Saharjo, B.H.; Albar, I.; Atmoko, D.; Voulgarakis, A. Long-lead prediction of the 2015 fire and haze episode in Indonesia. Geophys. Res. Lett. 2017, 44, 9996–10005. [Google Scholar] [CrossRef]
- Liu, J.; Wang, Y.K.; Guo, H.Y.; Lu, Y.F.; Xu, Y.X.; Sun, Y.; Gan, W.W.; Sun, R.; Li, Z.Y. Spatial and temporal patterns and driving factors of forest fires based on an optimal parameter-based geographic detector in the Panxi region, Southwest China. Fire Ecol. 2024, 20, 27. [Google Scholar] [CrossRef]
- Parisien, M.-A.; Moritz, M.A. Environmental Controls on the Distribution of Wildfire at Multiple Spatial Scales. Ecol. Monogr. 2009, 79, 127–154. [Google Scholar] [CrossRef]
- Parisien, M.-A.; Miller, C.; Parks, S.A.; DeLancey, E.R.; Robinne, F.N.; Flannigan, M.D. The Spatially Varying Influence of Humans on Fire Probability in North America. Environ. Res. Lett. 2016, 11, 075005. [Google Scholar] [CrossRef]
- McWethy, D.B.; Pauchard, A.; García, R.A.; Holz, A.; González, M.E.; Veblen, T.T.; Stahl, J.; Currey, B. Correction: Landscape Drivers of Recent Fire Activity (2001–2017) in South-Central Chile. PLoS ONE 2018, 13, e0205287. [Google Scholar] [CrossRef] [PubMed]
- Su, J.; Liu, Z.; Wang, W.; Jiao, K.; Yu, Y.; Li, K.; Lü, Q.; Fletcher, T.L. Evaluation of the Spatial Distribution of Predictors of Fire Regimes in China from 2003 to 2016. Remote Sens. 2023, 15, 4946. [Google Scholar] [CrossRef]
- Zacharakis, I.; Tsihrintzis, V.A. Integrated wildfire danger models and factors: A review. Sci. Total Environ. 2023, 899, 165704. [Google Scholar] [CrossRef]
- Iban, M.C.; Sekertekin, A. Machine learning based wildfire susceptibility mapping using remotely sensed fire data and GIS: A case study of Adana and Mersin provinces, Turkey. Ecol. Inform. 2022, 69, 101647. [Google Scholar] [CrossRef]
- Sachdeva, S.; Bhatia, T.; Verma, A.K. GIS-based evolutionary optimized gradient boosted decision trees for forest fire susceptibility mapping. Nat. Hazards 2018, 92, 1399–1418. [Google Scholar] [CrossRef]
- Sánchez, M.B.; Tonini, M.; Mapelli, A.; Fiorucci, P. Spatial assessment of wildfires susceptibility in Santa Cruz (Bolivia) using random Forest. Geosciences 2021, 11, 224. [Google Scholar] [CrossRef]
- Hong, H.; Jaafarid, A.; Zenner, E.K. Predicting spatial patterns of wildfire susceptibility in the Huichang County, China: An integrated model to analysis of landscape indicators. Ecol. Indic. 2019, 101, 878–891. [Google Scholar] [CrossRef]
- Liu, Z.H.; Yang, J.; He, H.S.; Chang, Y. Spatial point analysis of fire occurrence and its influence factor in Huzhong forest area of the Great Xing’an Mountains in Heilongjiang Province, China. Acta Ecol. Sin. 2011, 31, 1669–1677. [Google Scholar]
- Hernandez, C.; Keribin, C.; Drobinski, P.; Turquety, S. Statistical modelling of wildfire size and intensity: A step toward meteorological forecasting of summer extreme fire risk. Ann. Geophys. 2015, 33, 1495–1506. [Google Scholar] [CrossRef]
- Jaafari, A.; Zenner, E.K.; Panahi, M.; Shahabi, H. Hybrid artificial intelligence models based on a neuro-fuzzy system and metaheuristic optimization algorithms for spatial prediction of wildfire probability. Agric. For. Meteorol. 2019, 266–267, 198–207. [Google Scholar] [CrossRef]
- Dillon, G.K.; Holden, Z.A.; Morgan, P.; Crimmins, M.A.; Heyerdahl, E.K.; Luce, C.H. Both topography and climate affected forest and woodland burn severity in two regions of the western US, 1984 to 2006. Ecosphere 2011, 2, art130. [Google Scholar] [CrossRef]
- Fu, J.J.; Wu, Z.W.; Yan, S.J.; Zhang, Y.J.; Gu, X.L.; Du, L.H. Effects of climate, vegetation, and topography on spatial patterns of burn severity in the Great Xing’an Mountains. Acta Ecol. Sin. 2020, 40, 1672–1682. [Google Scholar] [CrossRef]
- Kumar, N.; Kumar, A. Australian Bushfire Detection Using Machine Learning and Neural Networks. In Proceedings of the 2020 7th International Conference on Smart Structures and Systems (ICSSS), Chennai, India, 23–24 July 2020; pp. 1–7. [Google Scholar] [CrossRef]
- Ghorbanzadeh, O.; Kamran, K.V.; Blaschke, T.; Aryal, J.; Naboureh, A.; Einali, J.; Bian, J. Spatial Prediction of Wildfire Susceptibility Using Field Survey GPS Data and Machine Learning Approaches. Fire 2019, 2, 43. [Google Scholar] [CrossRef]
- Wang, S.S.; Qian, Y.; Leung, L.R.; Zhang, Y. Identifying key drivers of wildfires in the contiguous US using machine learning and game theory interpretation. Earth’s Future 2021, 9, e2020EF001910. [Google Scholar] [CrossRef]
- Gholamnia, K.; Nachappa, T.G.; Ghorbanzadeh, O.; Blaschke, T. Comparisons of diverse machine learning approaches for wildfire susceptibility mapping. Symmetry 2020, 12, 604. [Google Scholar] [CrossRef]
- Zhang, G.; Wang, M.; Liu, K. Deep neural networks for global wildfire susceptibility modelling. Ecol. Indic. 2021, 127, 107735. [Google Scholar] [CrossRef]
- Gunning, D.; Aha, D. DARPA’s explainable artificial intelligence (XAI) program. AI Mag. 2019, 40, 44–58. [Google Scholar] [CrossRef]
- Arrieta, A.B.; Díaz-Rodríguez, N.; Del Ser, J.; Bennetot, A.; Tabik, S.; Barbado, A.; Garcia, S.; Gil-Lopez, S.; Molina, D.; Benjamins, R.; et al. Explainable artificial intelligence (XAI): Concepts, taxonomies, opportunities and challenges toward responsible AI. Inf. Fusion 2020, 58, 82–115. [Google Scholar] [CrossRef]
- Guyette, R.P.; Muzika, R.M.; Dey, D.C. Dynamics of an anthropogenic fire regime. Ecosystems 2002, 5, 472–486. [Google Scholar] [CrossRef]
- Cilli, R.; Elia, M.; D’Este, M.; Giannico, V.; Amoroso, N.; Lombardi, A.; Pantaleo, E.; Monaco, A.; Sanesi, G.; Tangaro, S.; et al. Explainable artificial intelligence (XAI) detects wildfire occurrence in the Mediterranean countries of southern Europe. Sci. Rep. 2022, 12, 16349. [Google Scholar] [CrossRef]
- Tuia, D.; Roscher, R.; Wegner, J.D.; Jacobs, N.; Zhu, X.; Camps-Valls, G. Toward a collective agenda on AI for earth science data analysis. IEEE Geosci. Remote Sens. Mag. 2021, 9, 88–104. [Google Scholar] [CrossRef]
- Grünig, M.; Seidl, R.; Senf, C. Increasing aridity causes larger and more severe forest fires across Europe. Glob. Chang. Biol. 2023, 29, 1648–1659. [Google Scholar] [CrossRef] [PubMed]
- Chang, Y.; Zhu, Z.L.; Bu, R.C.; Chen, H.G.; Feng, Y.T.; Li, Y.H.; Hu, Y.M.; Wang, Z.C. Predicting fire occurrence patterns with logistic regression in Heilongjiang Province, China. Landsc. Ecol. 2013, 28, 1989–2004. [Google Scholar] [CrossRef]
- Guo, F.; Selvalakshmi, S.; Lin, F.; Wang, G.; Wang, W.; Su, Z.; Liu, A. Geospatial information on geographical and human factors improved anthropogenic fire occurrence modeling in the Chinese boreal forest. Can. J. For. Res. 2016, 46, 582–594. [Google Scholar] [CrossRef]
- Purevdorj, T.; Tateishi, R.; Ishiyama, T.; Honda, Y. Relationships between Percent Vegetation Cover and Vegetation Indices. Int. J. Remote Sens. 1998, 19, 3519–3535. [Google Scholar] [CrossRef]
- Genuer, R.; Poggi, J.M.; Tuleau-Malot, C. Variable selection using random forests. Pattern Recognit. Lett. 2010, 31, 2225–2236. [Google Scholar] [CrossRef]
- Breiman, L. Random forests. Mach. Learn. 2001, 45, 5–32. [Google Scholar] [CrossRef]
- Kuhn, M.; Johnson, K. Applied Predictive Modeling; Springer: New York, NY, USA, 2013. [Google Scholar]
- Chen, T.; Guestrin, C. XGBoost. In Proceedings of the 22nd ACM SIGKDD International Conference on Knowledge Discovery and Data Mining, San Francisco, CA, USA, 13–17 August 2016; Association for Computing Machinery: New York, NY, USA, 2016; pp. 785–794. [Google Scholar] [CrossRef]
- Sivrikaya, F.; Küçük, O. Modeling Forest fire risk based on GIS-based analytical hierarchy process and statistical analysis in Mediterranean region. Ecol. Inform. 2022, 68, 101537. [Google Scholar] [CrossRef]
- Lundberg, S.; Lee, S.I. A unified approach to interpreting model predictions. In Proceedings of the Advances in Neural Information Processing Systems, Long Beach, CA, USA, 4–9 December 2017; pp. 4765–4774. Available online: https://arxiv.org/abs/1705.07874 (accessed on 1 January 2024).
- Jiménez-Valverde, A. Insights into the area under the receiver operating characteristic curve (AUC) as a discrimination measure in species distribution modeling. Glob. Ecol. Biogeogr. 2012, 21, 498–507. [Google Scholar] [CrossRef]
- Stoyanova, J.; Georgiev, C.; Neytchev, P.; Kulishev, A. Spatial-Temporal Variability of Land Surface Dry Anomalies in Climatic Aspect: Biogeophysical Insight by Meteosat Observations and SVAT Modeling. Atmosphere 2019, 10, 636. [Google Scholar] [CrossRef]
- Ali, A.A.; Carcaillet, C.; Bergeron, Y. Long-term fire frequency variability in the eastern Canadian boreal forest: The influences of climate vs. local factors. Glob. Chang. Biol. 2009, 15, 1230–1241. [Google Scholar] [CrossRef]
- Chen, B.; Wu, S.; Jin, Y.; Song, Y.; Wu, C.; Venevsky, S.; Xu, B.; Webster, C.; Gong, P. Wildfire risk for global wildland–urban interface areas. Nat. Sustain. 2024, 7, 474–484. [Google Scholar] [CrossRef]
- Zumbrunnen, T.; Pezzatti, G.B.; Menéndez, P.; Bugmann, H.; Bürgi, M.; Conedera, M. Weather and human impacts on forest fires: 100 years of fire history in two climatic regions of Switzerland. For. Ecol. Manag. 2011, 261, 2188–2199. [Google Scholar] [CrossRef]
- Countryman, C.M. The Fire Environment Concept; USDA Forest Service, Pacific Southwest Range and Experiment Station: Berkeley, CA, USA, 1972.
- DellaSalla, D.A.; Williams, J.E.; Williams, C.D.; Franklin, J.F. Beyond smoke and mirrors: A synthesis of fire policy and science. Biol. Conserv. 2004, 18, 976–986. Available online: http://www.jstor.org/stable/3589171 (accessed on 1 January 2024). [CrossRef]
- Ganteaume, A.; Jappiot, M. What causes large fires in Southern France. For. Ecol. Manag. 2013, 294, 76–85. [Google Scholar] [CrossRef]
- Birch, D.S.; Morgan, P.; Kolden, C.A.; Abatzoglou, J.T.; Dillon, G.K.; Hudak, A.T.; Smith, A.M.S. Vegetation, topography, and daily weather influenced burn severity in central Idaho and western Montana forests. Ecosphere 2015, 6, 17. [Google Scholar] [CrossRef]
- Parks, S.A.; Parisien, M.A.; Miller, C.; Dobrowski, S.Z. Fire activity and severity in the western US vary along proxy gradients representing fuel amount and fuel moisture. PLoS ONE 2014, 9, e99699. [Google Scholar] [CrossRef]
- Andela, N.; Morton, D.C.; Giglio, L.; Chen, Y.; van der Werf, G.R.; Kasibhatla, P.S.; DeFries, R.S.; Collatz, G.J.; Hantson, S.; Kloster, S.; et al. A human-driven decline in global burned area. Science 2017, 356, 1356–1362. [Google Scholar] [CrossRef]
- Yebra, M.; Dennison, P.E.; Chuvieco, E.; Riaño, D.; Zylstra, P.M.; Hunt, E.R.; Danson, F.M.; Qi, Y.; Jurdao, S. A global review of remote sensing of live fuel moisture content for fire danger assessment: Moving towards operational products. Remote Sens. Environ. 2013, 136, 455–468. [Google Scholar] [CrossRef]
- Rao, K.; Williams, A.P.; Diffenbaugh, N.S.; Yebra, M.; Konings, A.G. Plant-water sensitivity regulates wildfire vulnerability. Nat. Ecol. Evol. 2022, 6, 332–339. [Google Scholar] [CrossRef]
- Cardille, J.A.; Ventura, S.J.; Turner, M.G. Environmental and social factors influencing wildfires in the upper Midwest, United States. Ecol. Appl. 2001, 11, 111–127. [Google Scholar] [CrossRef]
- Syphard, A.D.; Keeley, J.E.; Abatzoglou, J.T. Trends and drivers of fire activity vary across California aridland ecosystems. J. Arid. Environ. 2017, 144, 110–122. [Google Scholar] [CrossRef]
- Keeley, J.E.; Fotheringham, C.J.; Morais, M. Reexamining fire suppression impacts on shrubland fire regimes. Science 1999, 284, 1829–1832. [Google Scholar] [CrossRef]
- Robinne, F.N.; Parisien, M.A.; Flannigan, M. Anthropogenic influence on wildfire activity in Alberta, Canada. Int. J. Wildland Fire 2016, 25, 1131–1143. [Google Scholar] [CrossRef]
- Krawchuk, M.A.; Moritz, M.A. Constraints on global fire activity vary across a resource gradient. Ecology 2011, 92, 121–132. [Google Scholar] [CrossRef]
- Giglio, L.; Descloitres, J.; Justice, C.O.; Kaufman, Y.J. An enhanced contextual fire detection algorithm for MODIS. Remote Sens. Environ. 2003, 87, 273–282. [Google Scholar] [CrossRef]
- Schroeder, W.; Oliva, P.; Giglio, L.; Csiszar, I.A. The new VIIRS 375m active fire detection data product: Algorithm description and initial assessment. Remote Sens. Environ. 2014, 143, 85–96. [Google Scholar] [CrossRef]
- Li, P.; Li, W.; Feng, Z.; Xiao, C.; Liu, Y. Spatiotemporal dynamics of active fire frequency in Southeast Asia with the FIRMS Moderate Resolution Imaging Spectroradiometer (MODIS) and Visible Infrared Imaging Radiometer (VIIRS) data. Resour. Sci. 2019, 41, 1526–1540. [Google Scholar] [CrossRef]
- Santos, F.L.M.; Couto, F.T.; Dias, S.S.; Ribeiro, N.A.; Salgado, R. Vegetation fuel characterization using a machine learning approach over southern Portugal. Remote Sens. Appl. Soc. Environ. 2023, 32, 101017. [Google Scholar] [CrossRef]
- del Hoyo, L.V.; Isabel, M.P.M.; Vega, F.J.M. Logistic Regression Models for Human-Caused Wildfire Risk Estimation: Analysing the Effect of the Spatial Accuracy in Fire Occurrence Data. Eur. J. For. Res. 2011, 130, 983–996. [Google Scholar] [CrossRef]

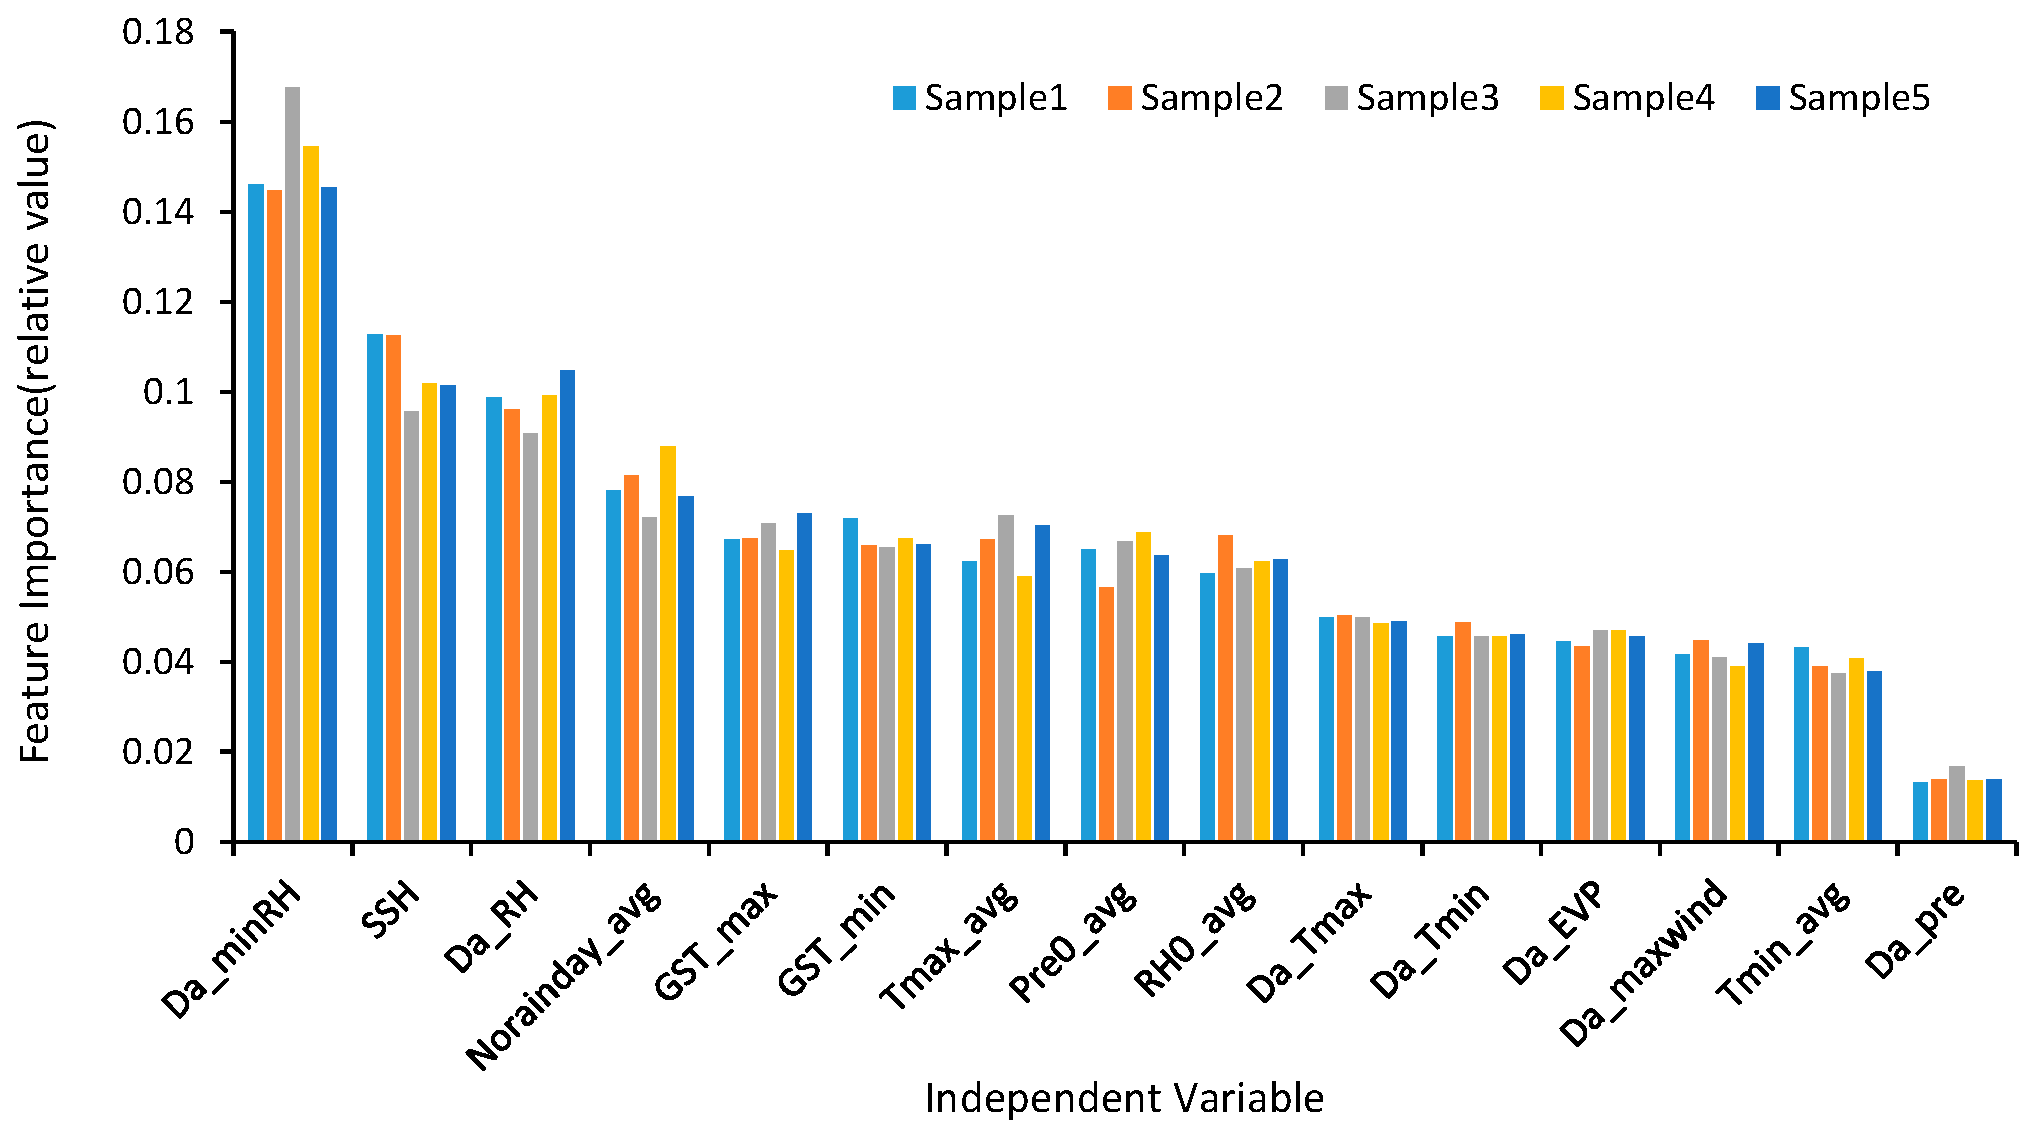
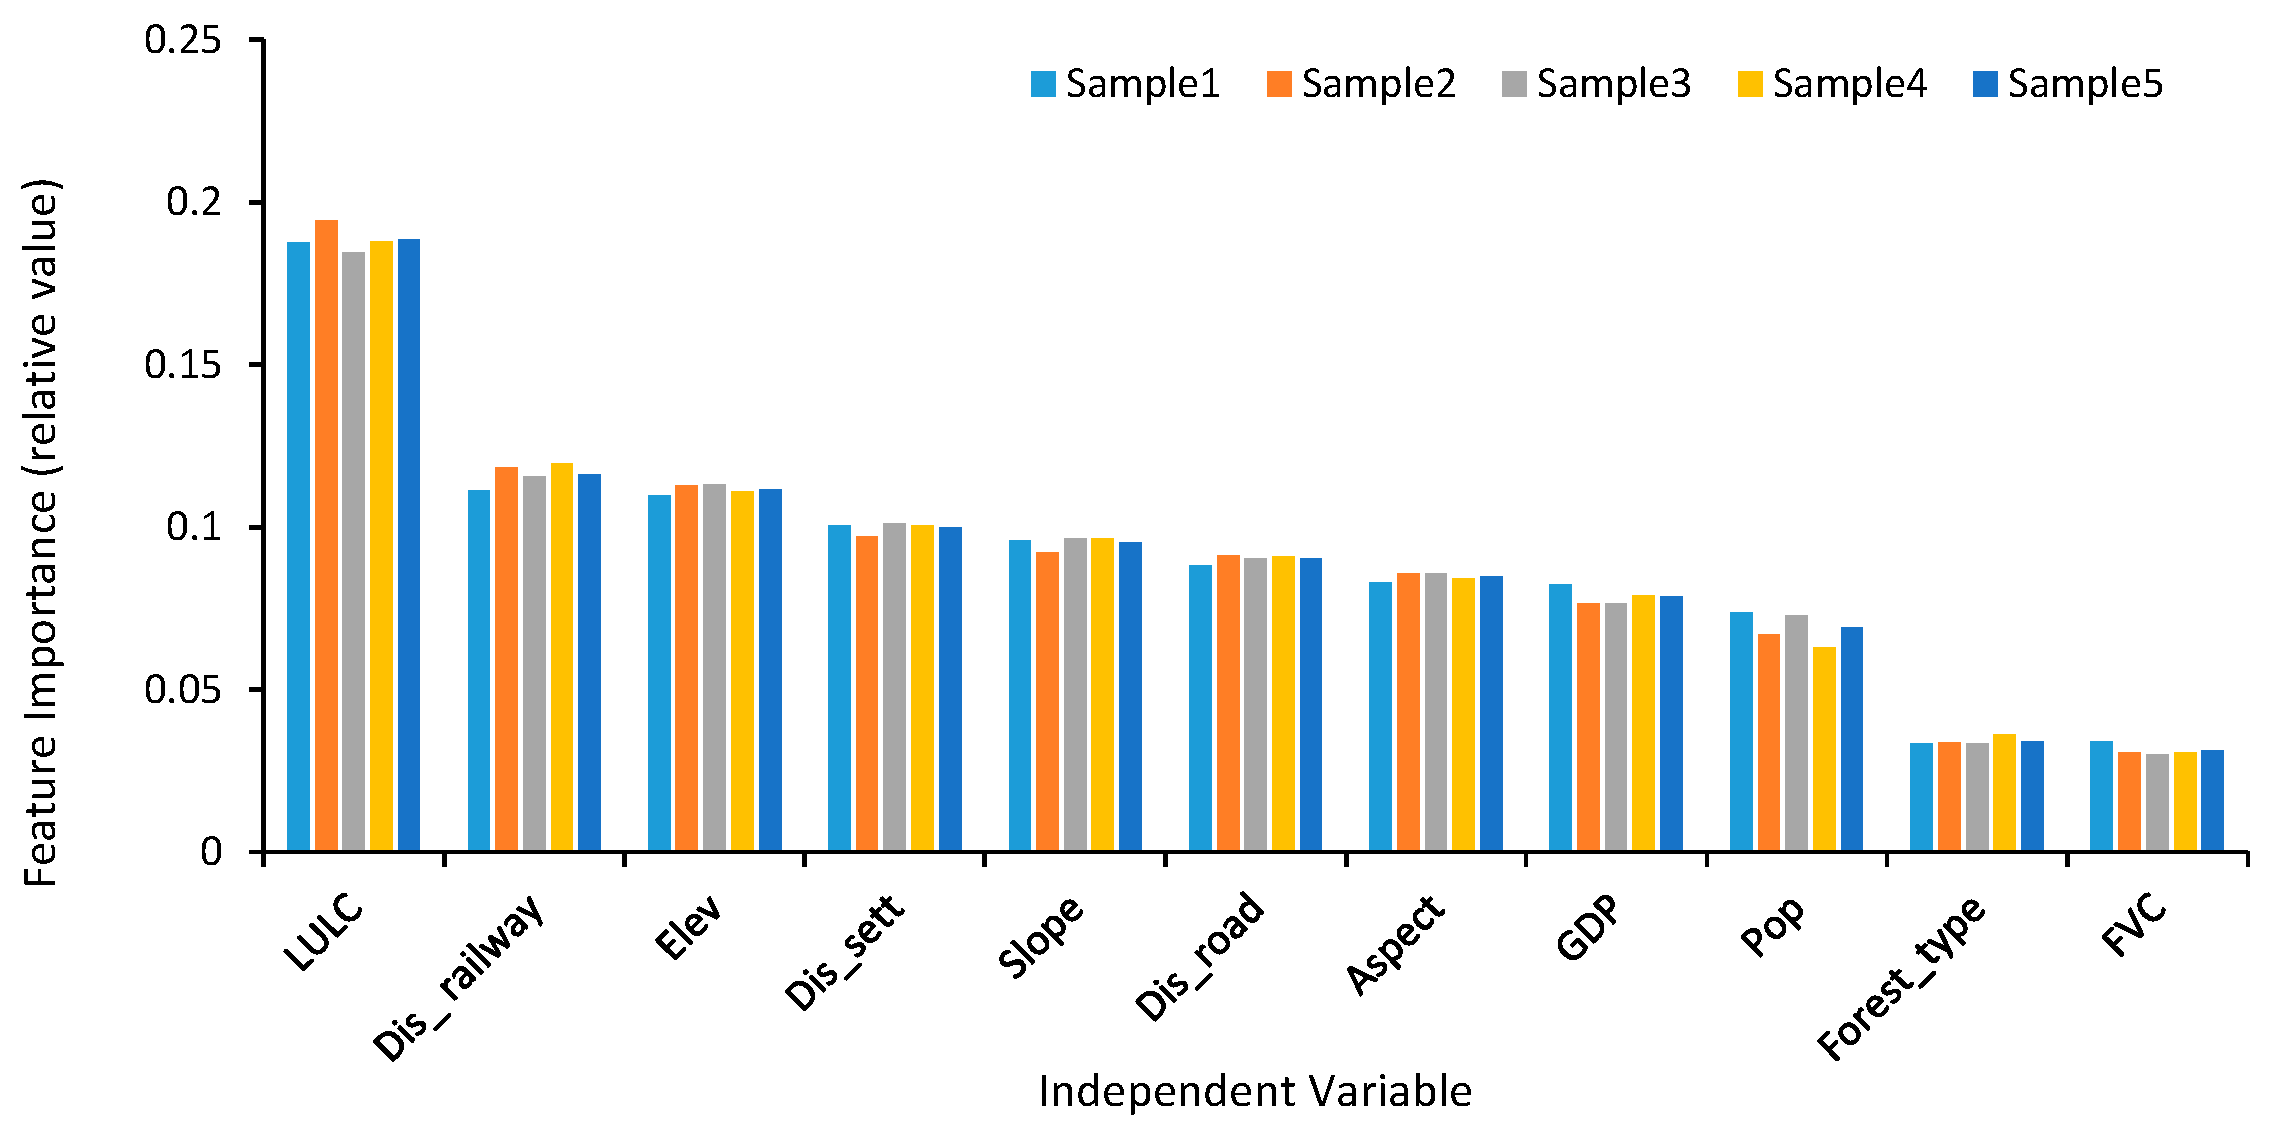
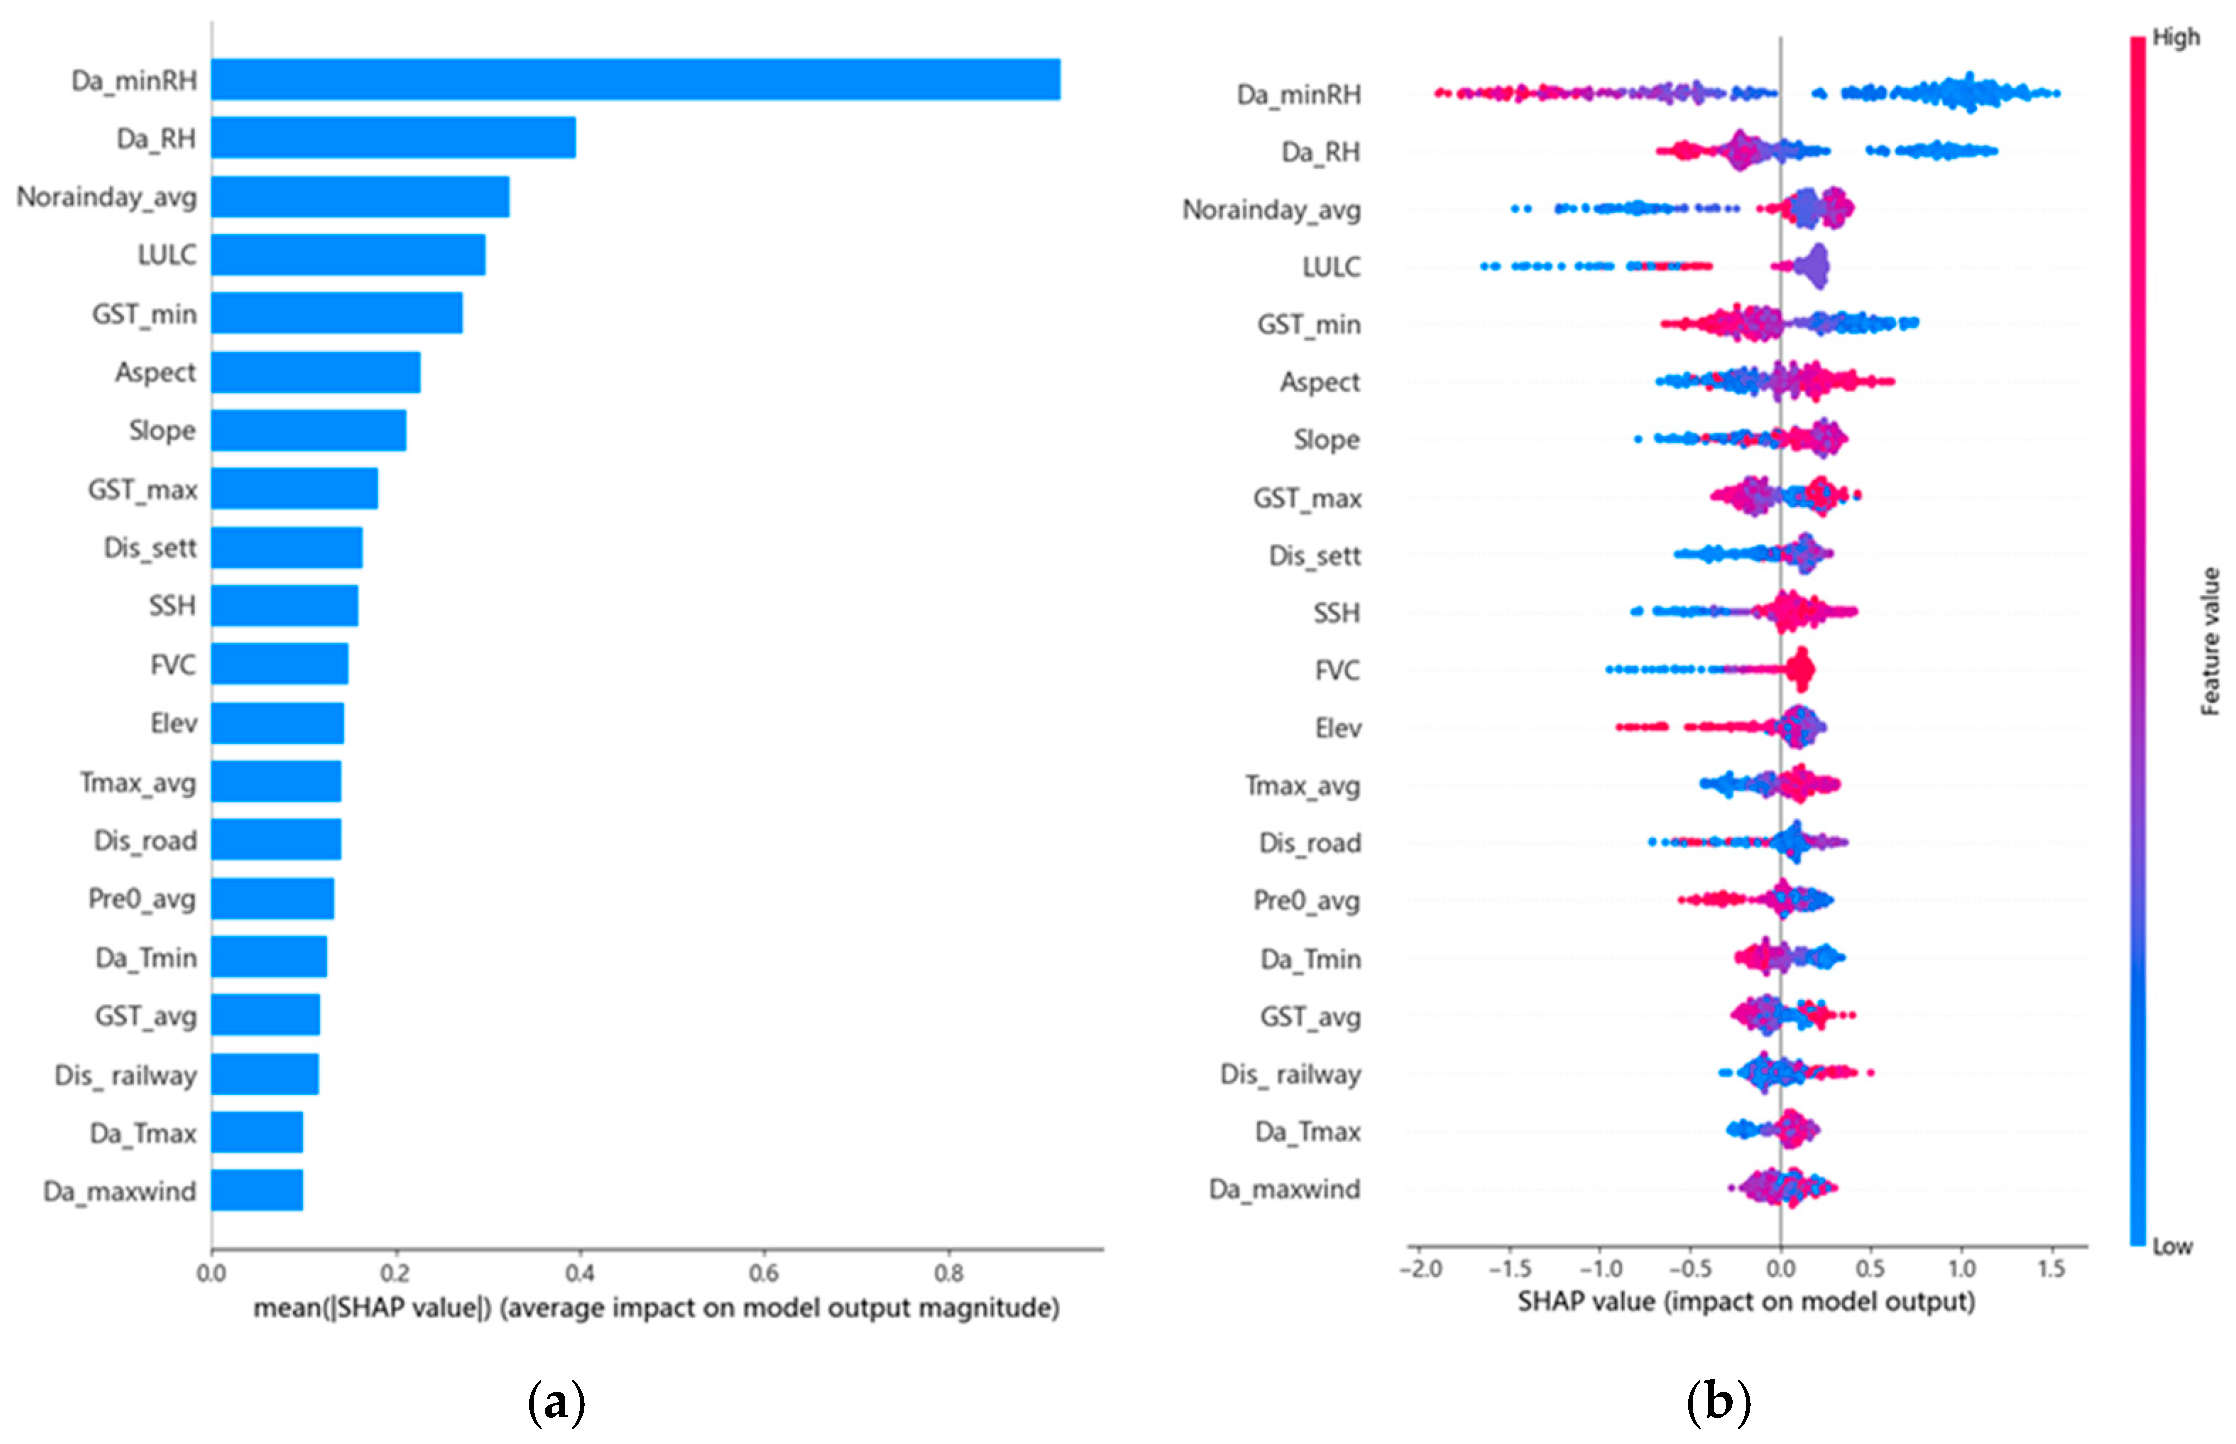
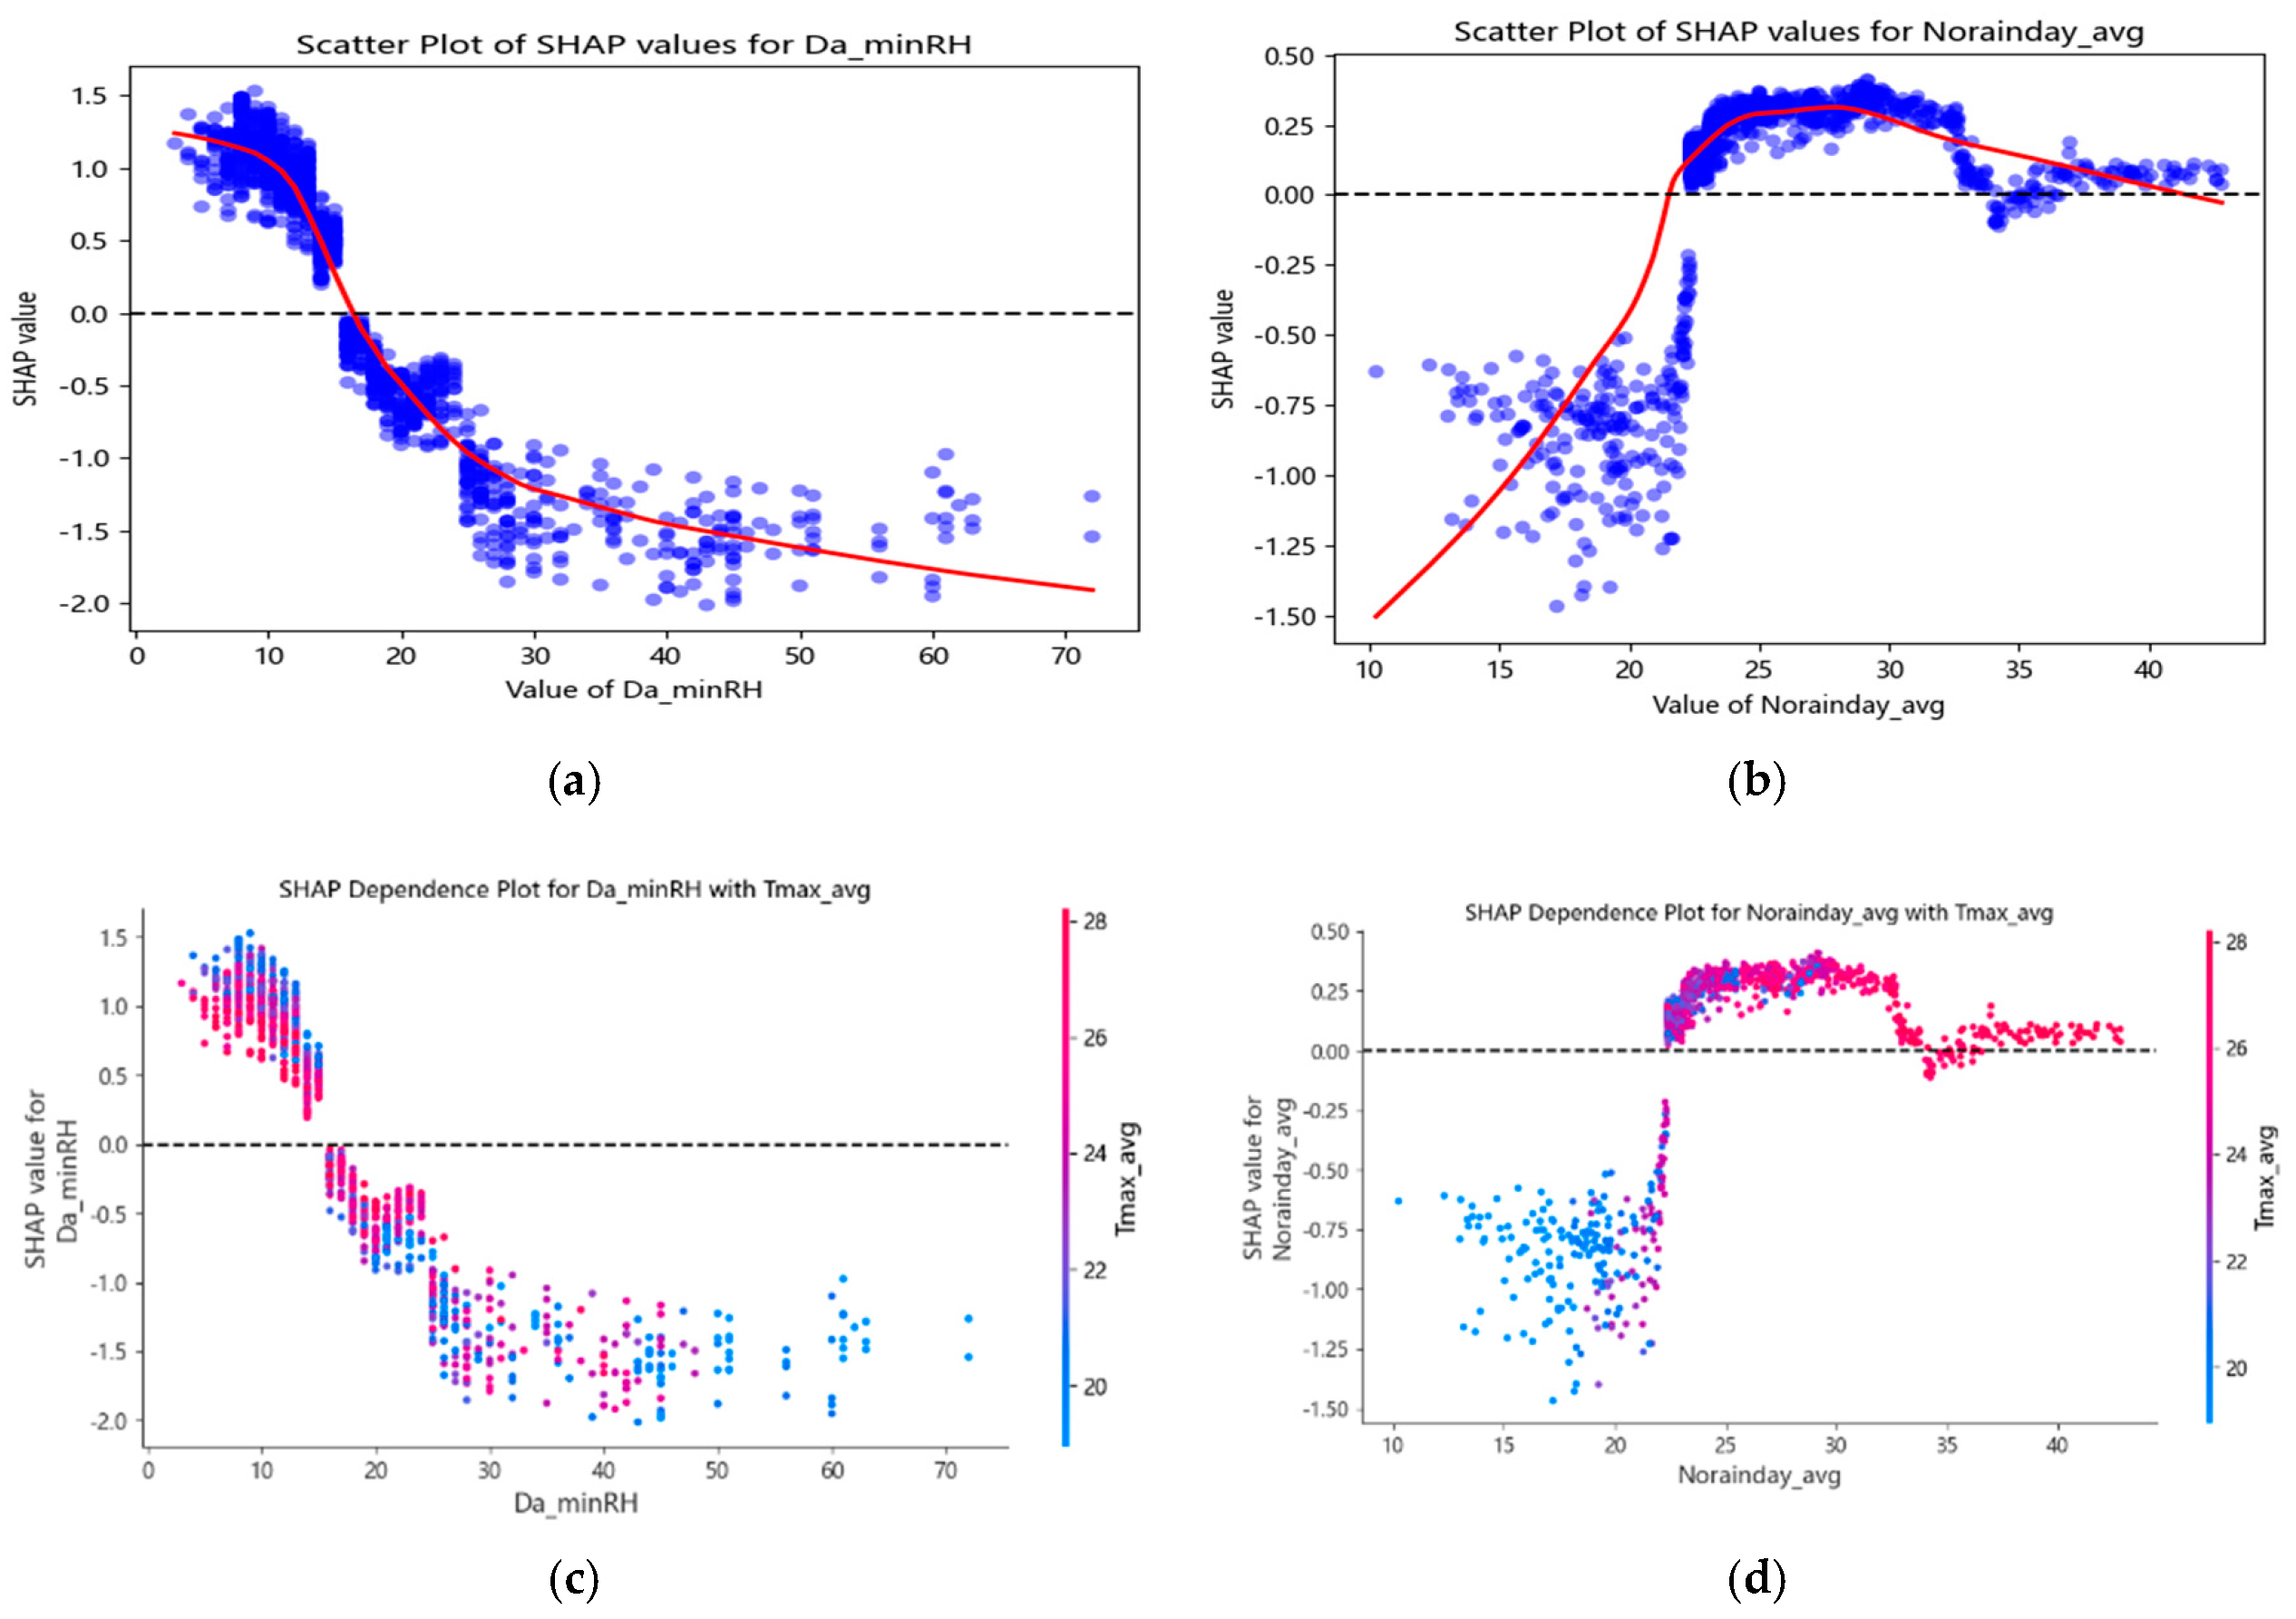


| Variable Type | Variable Name | Code | Resolution/Units | Source |
|---|---|---|---|---|
| Meteorological element | Average number of rainless days of fire season (the year of fire) | Norainday_avg | 1 km/day | Comprehensive Meteorological Information Service System (CIMISS): http://www.ncdc.ac.cn/portal/ (accessed on 1 January 2024) |
| Average precipitation of fire season (the year of fire) | Pre0_avg | 1 km/mm | Ibid | |
| Average relative humidity of fire season (the year of fire) | RH0_avg | 1 km/% | Ibid | |
| Average temperature of fire season (the year of fire) | T0_avg | 1 km/°C | Ibid | |
| Average minimum temperature of fire season (the year of fire) | Tmin_avg | 1 km/°C | Ibid | |
| Average maximum temperature of fire season (the year of fire) | Tmax_avg | 1 km/°C | Ibid | |
| Daily mean temperature | Da_Tave | Daily/°C | Ibid | |
| Daily maximum temperature | Da_Tmax | Daily/°C | Ibid | |
| Daily minimum temperature | Da_Tmin | Daily/°C | Ibid | |
| Daily precipitation | Da_pre | Daily/mm | Ibid | |
| Daily maximum windspeed | Da_maxwind | Daily/m·s−1 | Ibid | |
| Daily mean relative humidity | Da_RH | Daily/% | Ibid | |
| Daily minimum relative humidity | Da_minRH | Daily/% | Ibid | |
| Daily evaporation | Da_EVP | Daily/°C | Ibid | |
| Daily mean ground surface temperature | GST_avg | Daily/°C | Ibid | |
| Daily maximum ground surface temperature | GST_max | Daily/°C | Ibid | |
| Daily minimum ground surface temperature | GST_min | Daily/°C | Ibid | |
| Sunshine hours | SSH | Daily/h | Ibid | |
| Topographic | Elevation | Elev | 25 m/m | Shuttle Radar Topography Mission (SRTM): https://SRTM.csi.cgiar.org (accessed on 1 January 2024) |
| Slope | Slope | 25 m/degree | Ibid | |
| Aspect | Aspect | 25 m/% | Ibid | |
| Vegetation | Forest type | Forest_type | 1 km/ha | 1:1 million vegetation data set in China: http://www.ncdc.ac.cn (accessed on 1 January 2024) |
| Fractional vegetation cover | FVC | 1 km/% | National Earth System Science Data Center: http://www.geodata.cn (accessed on 1 January 2024) | |
| Infrastructure | Distance to the nearest settlement | Dis_sett | 1:250,000/km | National Administration of Surveying, Mapping and Geoinformation of China: https://www.webmap.cn (accessed on 1 January 2024) |
| Distance to the nearest road | Dis_road | 1:250,000/km | Ibid | |
| Distance to the nearest railway | Dis_railway | 1:250,000/km | Ibid | |
| Socioeconomic | Density of population | Pop | 1 km/number/km | Chinese Academy of Sciences Resource and Environmental Science Data Center: https://www.resdc.cn (accessed on 1 January 2024) |
| Per capita GDP | GDP | 1 km/RMB | Ibid | |
| Land use/land cover | LULC | 1 km | Geographic remote sensing ecological network platform: https://www.gisrs.cn (accessed on 1 January 2024) |
| Model | Selection Basis | Model Construction | Data Complexity | Model Robustness | Computational Resource Requirements | Advantages | Disadvantages |
|---|---|---|---|---|---|---|---|
| Logistic Regression model (LR) | Generally applicable, suitable for simple binary classification problems, appropriate for situations where variable relationships are relatively simple and linear, and clear interpretation is needed. | The dependent variable follows a binomial distribution. Predicts the probability of wildfire occurrence through the Logit transformation. | Suitable for data with simple and near-linear relationships. | Sensitive to outliers and noise, not robust. | Low | Simple and easy to operate; has a clear expression. | Does not consider spatial correlation and heterogeneity of wildfire influencing factors; does not account for the asymmetric structure of wildfire data; requires separate collinearity diagnostics for variables. |
| Random Forest model (RF) | Suitable for data with complex interactions and nonlinear relationships. | The random forest model predicts wildfire occurrence probability by constructing multiple decision trees, each using bootstrap sampling from the original dataset. The final prediction is determined by the voting results of all decision trees. | Suitable for data with complex interactions and nonlinear relationships. | Robust to outliers and noise, not sensitive to data. | Medium | Can effectively avoid overfitting and underfitting; automatically selects important variables, achieving high prediction results. | No clear expression, model is opaque and difficult to interpret. |
| eXtreme Gradient Boosting Model (XGBoost) | Suitable for data requiring high prediction accuracy and handling complex nonlinear relationships. | The XGBoost model minimizes the prediction error of the previous tree by gradually constructing decision trees. It uses boosting, a technique that combines numerous decision trees to generate a conclusive prediction, as its ensemble learning method. | Suitable for handling complex nonlinear relationships and large-scale data. | Highly robust to outliers and noise. | High | Effectively handles nonlinear relationships and interactions; includes regularization to prevent overfitting while maintaining high computational efficiency. | Requires tuning multiple hyperparameters, computationally intensive. |
| Variables Identified by Intermediate Models | Parameter Estimation | |||||||
|---|---|---|---|---|---|---|---|---|
| Variable | p-Value min | p-Value max | Significant Samples | Direction | Coefficients | Standard Error | Wald Test | p-Value |
| Norainday_avg | <0.0001 | <0.0001 | 5 | − | −1.33 | 0.12 | 118.68 | <0.0001 |
| Pre0_avg | <0.0001 | <0.0001 | 5 | − | −1.03 | 0.19 | 29.22 | <0.0001 |
| RH0_avg | <0.0001 | <0.0001 | 5 | − | −0.50 | 0.14 | 12.52 | <0.0001 |
| Tmin_avg | 0.37 | 0.98 | 0 | + | 0.01 | 0.10 | 0.01 | 0.93 |
| Tmax_avg | 0.007 | 0.17 | 0 | + | 0.22 | 0.10 | 5.06 | 0.03 |
| Da_Tmax | <0.0001 | <0.0001 | 5 | + | 0.48 | 0.11 | 18.17 | <0.0001 |
| Da_Tmin | 0.22 | 0.94 | 0 | − | −0.05 | 0.11 | 0.24 | 0.63 |
| Da_pre | 0.18 | 0.82 | 0 | − | −0.04 | 0.05 | 0.81 | 0.37 |
| Da_maxwind | 0.09 | 0.76 | 0 | + | 0.02 | 0.05 | 0.10 | 0.75 |
| Da_RH | <0.0001 | <0.0001 | 5 | − | −0.50 | 0.10 | 28.34 | <0.0001 |
| Da_minRH | <0.0001 | <0.0001 | 5 | − | −0.98 | 0.12 | 71.48 | <0.0001 |
| Da_EVP | 0.04 | 0.18 | 0 | + | 0.08 | 0.05 | 2.47 | 0.12 |
| GST_max | <0.0001 | <0.0001 | 5 | − | −0.63 | 0.09 | 44.66 | <0.0001 |
| GST_min | <0.0001 | <0.0001 | 5 | − | −0.43 | 0.11 | 15.83 | <0.0001 |
| SSH | <0.0001 | <0.0001 | 5 | + | 0.58 | 0.08 | 59.89 | <0.0001 |
| Variables Identified by Intermediate Models | Parameter Estimation | |||||||
|---|---|---|---|---|---|---|---|---|
| Variable | p-Value min | p-Value max | Variable | p-Value min | p-Value max | Variable | p-Value min | p-Value max |
| Dis_sett | <0.0001 | <0.0001 | 5 | − | −0.16 | 0.04 | 14.88 | <0.0001 |
| Dis_road | <0.0001 | <0.0001 | 5 | + | 0.18 | 0.05 | 14.54 | <0.0001 |
| Dis_railway | 0.114 | 0.765 | 0 | − | −0.05 | 0.04 | 1.67 | 0.20 |
| Forest_type | 0.386 | 0.798 | 0 | + | 0.03 | 0.04 | 0.75 | 0.39 |
| Aspect | 0.318 | 0.934 | 0 | − | −0.01 | 0.04 | 0.04 | 0.84 |
| Slope | <0.0001 | 0.006 | 5 | + | 0.17 | 0.04 | 21.72 | <0.0001 |
| Elev | <0.0001 | <0.0001 | 5 | − | −0.19 | 0.05 | 16.19 | <0.0001 |
| Pop | <0.0001 | <0.0001 | 5 | − | −2.87 | 0.37 | 61.93 | <0.0001 |
| GDP | 0.515 | 0.860 | 0 | + | 0.03 | 0.17 | 0.03 | 0.85 |
| FVC | <0.0001 | <0.0001 | 5 | + | 0.25 | 0.05 | 26.83 | <0.0001 |
| LULC | <0.0001 | 0.001 | 5 | − | −0.13 | 0.04 | 12.05 | <0.0001 |
| Variable | Model Variables | Β | Standard Error (S.E.) | Wald Test | Significant (Sig.) |
|---|---|---|---|---|---|
| Constant | Constant | 0.51 | 0.05 | 94.84 | 0.000 |
| Norainday_avg | x1 | −0.80 | 0.14 | 34.48 | 0.000 |
| Pre0_avg | x2 | −0.81 | 0.19 | 18.10 | 0.000 |
| RH0_avg | x3 | −0.40 | 0.15 | 7.63 | 0.006 |
| Da_Tmax | x4 | 0.38 | 0.10 | 15.16 | 0.000 |
| Da_RH | x5 | −0.53 | 0.09 | 35.30 | 0.000 |
| Da_minRH | x6 | −1.07 | 0.11 | 89.09 | 0.000 |
| GST_max | x7 | −0.66 | 0.09 | 49.68 | 0.000 |
| GST_min | x8 | −0.42 | 0.09 | 20.85 | 0.000 |
| SSH | x9 | 0.60 | 0.08 | 60.75 | 0.000 |
| Dis_sett | x10 | 0.15 | 0.06 | 6.77 | 0.009 |
| Dis_road | x11 | 0.04 | 0.05 | 0.58 | 0.04 |
| Slope | x12 | 0.27 | 0.05 | 31.53 | 0.000 |
| Elev | x13 | −0.19 | 0.07 | 8.71 | 0.003 |
| Pop | x14 | −1.23 | 0.32 | 14.71 | 0.000 |
| FVC | x15 | 0.34 | 0.06 | 35.79 | 0.000 |
| LULC | x16 | −0.17 | 0.05 | 12.55 | 0.000 |
| Model | Training Set Accuracy | Test Set Accuracy | Test Set Recall Rate |
|---|---|---|---|
| LR | 0.79 | 0.80 | 0.88 |
| RF | 0.89 | 0.92 | 0.92 |
| XGB | 0.90 | 0.91 | 0.92 |
| Statistics | LR | RF | XGBoost |
|---|---|---|---|
| Mean | 0.7931 | 0.8941 | 0.8841 |
| Standard Deviation | 0.0194 | 0.0248 | 0.0181 |
| Coefficient of Variation | 0.0245 | 0.0278 | 0.0205 |
Disclaimer/Publisher’s Note: The statements, opinions and data contained in all publications are solely those of the individual author(s) and contributor(s) and not of MDPI and/or the editor(s). MDPI and/or the editor(s) disclaim responsibility for any injury to people or property resulting from any ideas, methods, instructions or products referred to in the content. |
© 2024 by the authors. Licensee MDPI, Basel, Switzerland. This article is an open access article distributed under the terms and conditions of the Creative Commons Attribution (CC BY) license (https://creativecommons.org/licenses/by/4.0/).
Share and Cite
Liu, J.; Wang, Y.; Lu, Y.; Zhao, P.; Wang, S.; Sun, Y.; Luo, Y. Application of Remote Sensing and Explainable Artificial Intelligence (XAI) for Wildfire Occurrence Mapping in the Mountainous Region of Southwest China. Remote Sens. 2024, 16, 3602. https://doi.org/10.3390/rs16193602
Liu J, Wang Y, Lu Y, Zhao P, Wang S, Sun Y, Luo Y. Application of Remote Sensing and Explainable Artificial Intelligence (XAI) for Wildfire Occurrence Mapping in the Mountainous Region of Southwest China. Remote Sensing. 2024; 16(19):3602. https://doi.org/10.3390/rs16193602
Chicago/Turabian StyleLiu, Jia, Yukuan Wang, Yafeng Lu, Pengguo Zhao, Shunjiu Wang, Yu Sun, and Yu Luo. 2024. "Application of Remote Sensing and Explainable Artificial Intelligence (XAI) for Wildfire Occurrence Mapping in the Mountainous Region of Southwest China" Remote Sensing 16, no. 19: 3602. https://doi.org/10.3390/rs16193602
APA StyleLiu, J., Wang, Y., Lu, Y., Zhao, P., Wang, S., Sun, Y., & Luo, Y. (2024). Application of Remote Sensing and Explainable Artificial Intelligence (XAI) for Wildfire Occurrence Mapping in the Mountainous Region of Southwest China. Remote Sensing, 16(19), 3602. https://doi.org/10.3390/rs16193602


