Abstract
In the context of global climate change and rapid population growth, more people in cities are facing heat threats. Although health risk assessment is critical for reducing heat-related morbidity and mortality, previous studies have not accurately identified the spatial details of heat risk levels on a fine scale within a complete framework. Therefore, this study developed a systematic method to conduct a spatially explicit assessment of heat-related health risks using local climate zones (LCZs) in Shanghai, China. First, multisource data were used to map LCZs in Shanghai. Second, a modified temperature-humidity index, population density, and ecological parameters were employed to construct a heat hazard–exposure–vulnerability framework for heat risk assessment. Finally, the differences in heat-related health risks among LCZs were compared. The results indicate that in Shanghai (1) the LCZ concept could help estimate the heat health risk (HHR) at the fine block level, and the area proportion of LCZ5 (open mid-rise buildings) accounted for more than 50%; (2) detailed spatial patterns of heat risk levels were similar in spring, summer, and autumn, but different in winter due to seasonal variations in heat hazards; and (3) the built LCZs usually had higher heat risk levels than natural land cover LCZs, with LCZ2 (compact mid-rise), LCZ3 (compact low-rise), and LCZ5 facing the most serious heat risks. The high-rise LCZs might reduce the heat risk level in hot seasons owing to shading effects but add to this risk in winter. These findings contribute to our understanding of HHR assessment.
1. Introduction
Owing to their large number of socioeconomic activities and complete infrastructural facilities, cities have become attractive places for more people to live [1,2]. According to the sixth report released by the Intergovernmental Panel on Climate Change (IPCC), the world surface temperature was approximately 1.1 °C above 1850 to 1900 levels during 2011 to 2020 [3], which had a significantly negative impact on the daily lives of city dwellers [4,5,6,7]. Accordingly, the combination of climate change and rapid urbanization will result in greater heat health risks (HHRs) for more people in the future [8,9,10,11]. Therefore, it is essential to strengthen our understanding of heat-related health risks faced by urban residents and make cities more resilient to disasters and challenges [12,13].
A reasonable and reproducible HHR assessment framework is crucial for obtaining accurate heat risk patterns [14,15,16]. However, the concept of HHR has become complicated, and research methodologies have evolved in recent years [16,17,18,19,20]. To date, most HHR assessment studies have employed Crichton’s risk triangle as a research paradigm, which uses three essential indicators: hazard, exposure, and vulnerability [18]. The IPCC used the same heat risk assessment framework in its fifth and sixth assessment reports [3]. Owing to the profound influence of the IPCC, an increasing number of studies have used a hazard–exposure–vulnerability framework [15,16,19,21,22,23,24,25]. Hazard refers to the potential intensity of the thermal environment that affects human health, where high temperatures are usually selected as the indicator [15]. Exposure refers to the presence of people who might be affected, with population density widely used as a parameter [20,26]. Vulnerability focuses on people who are sensitive to heatwaves, such as the elderly, children, low-income residents, and disadvantaged people [19,27,28]. Some studies have found that heat risk is not equally distributed across urban spaces, resulting in a more serious threat to these people [23,26,29,30].
Although previous heat risk assessment studies employing the hazard–exposure–vulnerability framework have proven reliable, there are still many theoretical and methodological questions that require further exploration. First, the selection of parameters to characterize the hazard, exposure, and vulnerability indicators has not reached consensus because the HHR index is a complex combination of the three. Some studies have employed only a single parameter to represent the indicator or assigned the indicator the same weight [15,29]; however, this approach may have overlooked other important influencing factors. For instance, previous studies have tended to use land surface temperature (LST), air temperature or the wet-bulb globe temperature (WBGT) to characterize heat hazards (exposure), which may overestimate or underestimate their negative effects on human health [31,32,33,34]. As a result, the use of outdoor thermal comfort as a parameter to assess the effect of heat or cold waves on human health may be a better choice because of its close correlation with the perception of humans [35,36,37,38]. Many human comfort indicators have been proposed, such as the discomfort index (DI), universal thermal climate index (UTCI), and modified temperature-humidity index (MTHI) [39,40,41,42]. Although these comfort indices consider meteorological elements that affect human health—such as humidity and wind speed—they have rarely been used in the current literature to assess heat hazards [43,44]. However, a large number of parameters are involved in heat risk assessment, making it difficult for decision makers to identify the dominant driving factor. For example, 28 parameters were selected in a previous study to evaluate heat vulnerability in Chicago [24].
Second, most previous studies were conducted at administrative units where districts were usually selected as the spatial analysis unit, mainly because of the difficulty in accessing population data [8,19,45]. Typically, census data are collected at the administrative level and cannot provide fine-scale information to capture the detailed spatial patterns of heat risks. Fortunately, the local climate zone (LCZ) concept was proposed in 2012 and has been widely adopted as a framework for conducting urban climate studies [46,47,48,49]. The standard LCZ concept has 10 built and seven land-cover LCZ types, obtaining reliable results of relationships between urban morphology and the urban thermal environment [50,51,52]. Therefore, it might be beneficial to use LCZs as a fine spatial analysis unit for heat risk assessment [15,53]. Third, heat risk assessments should not only focus on hot seasons, as cold waves can also pose a severe threat to human health [8,54,55]. Therefore, it is important to explore seasonal variations in HHRs.
Given the current research gaps, Shanghai, the core city in eastern China, was selected as a case study to assess the spatial patterns and seasonal variations in HHRs at a fine spatial unit. The main objectives of this study were to (1) map and analyze the spatial characteristics of the LCZs in Shanghai using multi-source data; (2) construct an innovative heat risk assessment framework to quantify heat-related health risk levels by combining heat hazard, exposure, and vulnerability; and (3) compare the differences in HHR levels among different LCZ types and explore the potential reasons for these. The results will provide a scientific basis for urban management and planning.
2. Materials
2.1. Study Area
Shanghai—one of the largest industrial and commercial cities in China and with an administrative region covering approximately 6340.5 km2—is located south of the Yangtze River Estuary and north of Zhangzhou Bay. By the end of 2021, Shanghai had a population of 24.89 million with an average life expectancy of 84.11 years. Shanghai has a subtropical monsoon climate with an average temperature of 17.9 °C and precipitation of 1474.5 mm. According to the standards of the Shanghai Meteorological Administration, spring (March and April) and autumn (October and November) are usually short in Shanghai, whereas summer (May, June, July, August, September) and winter (December, January, February) are long. The average altitude of Shanghai is 2.19m, and the highest point, on Dajinshan Island, is 103.7 m above sea level. Shanghai is a developed city with a high population and building density, making it an ideal sample to explore the variations in heat-related health risks across different LCZ types. Consequently, an urban core located on the Outer Ring Expressway of Shanghai was selected as the study area (Figure 1).
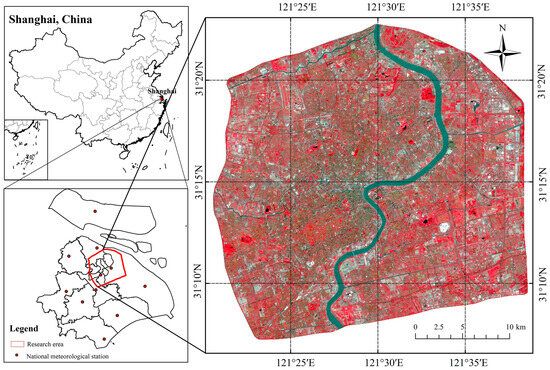
Figure 1.
Study area location.
2.2. Data Sources
Multiple data sources—including satellite imagery, road networks, building data, population density, and other auxiliary data—were integrated to obtain LCZ maps and assess heat-related health risks. Cloud-free seasonal Landsat 8 images from 2020 to 2022 collected from the United States Geological Survey were employed to retrieve seasonal LST, Normalized Difference Vegetation Index (NDVI), and Modified Normalized Difference Water Index (MNDWI), which were the basis for quantifying heat hazards using the MTHI. Additionally, the area proportions of different land cover types—such as water, vegetation, and impervious surface areas (ISAs)—that were required in the process of LCZ mapping were also obtained from Landsat images. All originally downloaded Landsat 8 images were preprocessed using radiation correction. The road network was obtained from OpenStreetMap and modified via visual interpretation to generate an LCZ boundary. Building data, including information on building outline and height, were gathered from the Resource and Environment Science and Data Center, China. The WorldPop dataset (2020) was used to characterize the population distribution and density of each LCZ. Detailed information on the data used in this study is presented in Table 1.

Table 1.
Data sources in this study.
3. Methods
The framework and working steps used in this study are illustrated in Figure 2. First, the heat-related health risk assessment framework was used as a guideline. The workflow was then divided into four steps: (1) the input of multi-source data; (2) the generation of LCZ maps using building height, area proportion of land cover, and decision tree based on the road network; (3) the application of the HEV model to conduct the HHR assessment; and (4) the spatial and temporal analysis for the LCZs and health risk using ArcGIS 10.8.
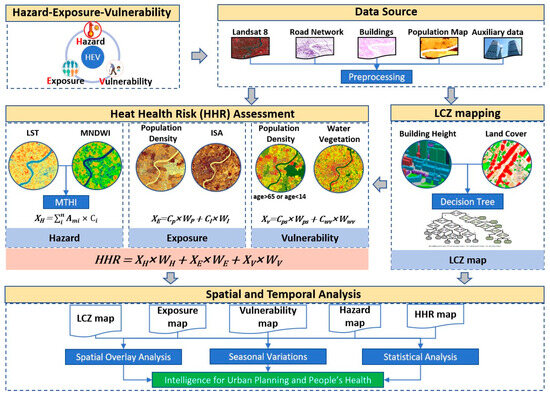
Figure 2.
Study framework and workflow.
3.1. LCZ Mapping
3.1.1. LCZ Classification Adjustment
Based on a survey of Shanghai’s current situation, the industrial zone is typically located outside the study area, and the proportion of lightweight low-rise areas is quite low [56]. Therefore, we reclassified the original standard-built LCZ 7–10 types to LCZ 7–9 according to the values of the geometric and surface cover properties for standard LCZ 1–6. Consequently, in our study, LCZ 7, 8, and 9 refer to sparse high-rise, sparse mid-rise, and sparse low-rise areas, respectively [37]. However, no changes were observed in the original land-cover LCZ types in this study. Detailed information regarding the classification criteria for the LCZ types can be found in a previous study [46,57].
3.1.2. LCZ Parameter Calculations
Building height and land cover area fraction were the two basic elements in the LCZ mapping process. The mean building height is the average height of all buildings located inside a block boundary and is calculated based on the building data, which can be expressed as follows:
where n is the number of buildings in the block, is the height of building . The BH thresholds to distinguish high-rise, mid-rise, and low-rise were >25 m, 10–25 m, and <10 m, respectively.
The linear spectral mixture analysis (LSMA) model was applied to Landsat 8 images to estimate the area fractions of ISA, vegetation, and soil in each block [58]. LSMA can be described as follows:
where is the reflectance of band b; n is the number of endmembers; is the area proportion of endmember ; is the reflectance of endmember in band b. In addition, NDVI was employed to identify LCZ A-D, and MNDWI was used to obtain the areas of water bodies [59]. The formulae for NDVI and MNDWI are as follows:
where NIR, R, GREEN, and SWIR in Landsat 8 refer to band5, band4, band6, and band3, respectively. The most widely used method in GIS-based LCZ is decision-making algorithms, which is to match the calculated LCZ parameters with their reference ranges [60]. Therefore, the decision tree method was used to classify the LCZ in this paper.
3.2. Hazard–Exposure–Vulnerability Assessment
3.2.1. Heat Hazard Assessment
Urban outdoor thermal comfort was used to describe the degree of human perception of the current thermal environment. Compared with traditional air temperature or LST, outdoor thermal comfort is more closely related to human health [25,61]. In addition, MTHI has higher spatial resolution and the required data are more easily accessible compared to other thermal comfort indicators such as PET, UTCI, and H. Therefore, the MTHI was used to assess thermal outdoor comfort [39]. Typically, outdoor thermal discomfort is considered a high heat hazard. The MTHI is estimated as follows:
where NDMI is the Normalized Difference Moisture Index. LST can be retrieved using the Radiative Transfer Equation algorithm [62]. To explore seasonal variations in the MTHI under the same conditions, the mean standard deviation method was applied to represent relative thermal comfort [39,63]. The MTHI was reclassified into five categories, as listed in Table 2. The higher the MTHI, the greater the heat hazard.

Table 2.
Classification of outdoor thermal comfort levels.
The heat hazard for each LCZ was estimated by the following formula:
where is the heat hazard level for the LCZ, is the area proportion of level i for the MTHI inside the corresponding LCZ, and is the MTHI level. Therefore, the heat hazard is also a relative assessment.
3.2.2. Heat Exposure Assessment
Population density is usually selected as an exposure indicator because if there are no people, there is no exposure [15]. Additionally, there is a strong positive correlation between ISA and LST, indicating that a high ISA fraction affects population exposure [64,65]. Therefore, a modified population ISA-weighted heat exposure assessment framework is proposed here to explore the spatial patterns of human exposure to heat hazards using the following formula:
where is the estimated heat exposure for the LCZ, is the population density level for the LCZ, which is set according to the distribution of population data in Shanghai. is the level for the area proportion of ISA inside the LCZ, which is set according to the setting range of the proportion of building area by Zhou et al. [53]. and are the weights of the population density and area fraction of ISA, respectively. Here, both and were set to 0.5. Similar to the MTHI classification, both the population density and ISA fraction were reclassified into five levels (Table 3). Finally, the estimated heat exposure levels were classified into five categories: very low, low, medium, high, and very high.

Table 3.
Classification of population density and ISA fraction.
3.2.3. Heat Vulnerability Assessment
Heat vulnerability is defined as an individual’s sensitivity and capacity to adjust, cope with, and recover from outdoor thermal heat risks [29,66]. The elderly and children are more easily affected by an uncomfortable thermal environment [67,68]; therefore, the population density for certain age structures (<14 and >65 years) was selected as a vulnerability indicator. Moreover, vegetation and water can regulate micro-urban climates by cooling high temperatures, which is beneficial for sensitive populations. As a result, the proportions of vegetation and water in the area were chosen as vulnerability indicators as low proportions of vegetation and water can contribute to vulnerability [69]. Heat vulnerability can be calculated as follows:
where is the estimated heat vulnerability for the LCZ, is the sensitive population density level for the LCZ, and is the area proportion level of water and vegetation inside the LCZ. Based on the experience of previous studies [15,25,70], (0.5) and are the weights of population density and area fraction of the ISA, respectively.
3.3. Heat Health Risk Assessment
Based on the hazard–exposure–vulnerability assessment framework, the final HHR was estimated using a combination of normalization indicators with different weights, as follows:
where HHR is the heat health risk level for each LCZ; represent the heat hazard, heat exposure, and heat vulnerability indicators, respectively; refer to the weights of the hazard, exposure, and vulnerability indices, respectively.
To guarantee that the three components were comparable and enabled aggregation, all three HHR indicators were classified into five levels. In addition, all high-level indicators were designed to have a positive relationship with the HHR. Relative weights were identified using the Analytic Hierarchy Process analysis, and the values for were 0.5, 0.2, and 0.3, respectively. Finally, the HHR was classified into five levels: very low (1–1.5), low (1.5–2.5), medium (2.5–3.5), high (3.5–4.5), and very high (4.5–5) in ArcGIS 10.8.
4. Results
4.1. LCZ Spatial Patterns
The spatial distribution of the LCZs in Shanghai is shown in Figure 3. For descriptive statistical features, there were 4501 LCZs in total, and detailed information is presented in Table 4. The proportions of built LCZ types and natural land cover LCZ types in the study area accounted for 83.16 and 16.84%, respectively, indicating high artificial building and surface fractions in Shanghai city. Among all LCZ types, LCZ5 (open mid-rise) covered the largest area (52.63 km2), accounting for 56.37% of the study area. LCZ1 (compact high-rise) accounted for only 0.12% of the total area, with the lowest coverage. The vegetation LCZ types (LCZ A–D) accounted for 11.24%, and the proportion of the water body (LCZ G) was 3.00%. For the spatial pattern features, LCZ5 was distributed throughout the study area, whereas the compact LCZ types (LCZ 1–3) were mainly distributed in the city center. Natural LCZs were mainly located in the eastern and southeastern regions.
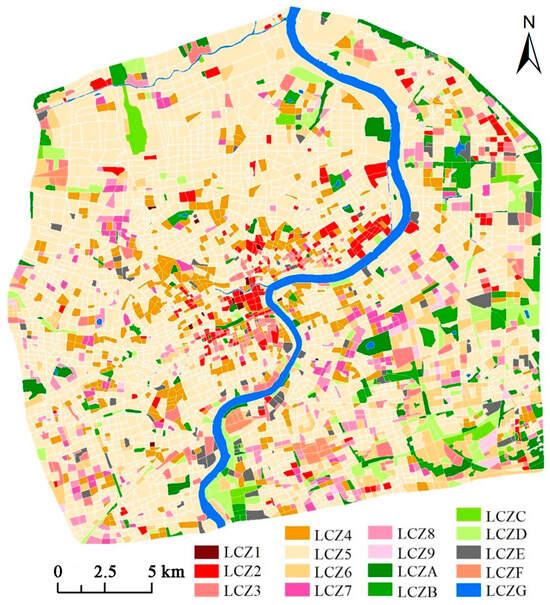
Figure 3.
LCZ spatial patterns in Shanghai.

Table 4.
Descriptive characteristics of LCZs in Shanghai.
4.2. Spatial Heat Hazard Patterns
4.2.1. Seasonal Spatial Patterns of LSTs in Shanghai
Figure A1 shows the time series of Landsat LST in the study area from 2020 to 2022, calculated by Climate Engine [71]. Due to cloud cover limitations, the mean LST values for the four seasons were slightly lower than the actual conditions, particularly for the summer image (31 July 2020), which significantly reduced the overall mean (Table A2). However, in this study, four clear-sky scenes were selected to represent the corresponding seasons, which better reflect the real conditions. Therefore, the slightly higher LST values are reasonable and meet the needs of thermal risk research.
The seasonal spatial patterns of the LST in Shanghai are shown in Figure 4. For seasonal variations, the distributions of LST in spring, summer, and autumn were similar, with high LSTs located in the northern and northeastern parts, whereas the southeastern region had lower LSTs. In winter, there were no obvious LST distribution features, which differed from those of the other seasons. Overall, the built LCZ types had a higher LST, whereas the vegetation and water LCZ types had a lower LST owing to heat absorption and shading. Descriptive statistics show large LST differences among the LCZ types in spring and summer (Table 5). For example, in summer, LCZ2 (compact mid-rise) had the highest LST (35.13 °C), followed by LCZ3, LCZ F, LCZ5, LCZ1, LCZ E, and LCZ6 at 34.59, 34.21, 33.9, 33.82, 33.43, and 33.15 °C, respectively, while the LST of LCZ G (water body) was the lowest (29.5 °C). Typically, the compact LCZ types (LCZ1–3) had higher LSTs than the open and sparse LCZ types (4–9) regarding other spatial features (building height). Another interesting phenomenon was that if the building density was similar, the mid-rise LCZ types had a higher LST than the high- and low-rise LCZ types, possibly due to the shading and cooling effect of the high-LCZ types (LCZ1, 4, and 7) [72,73].
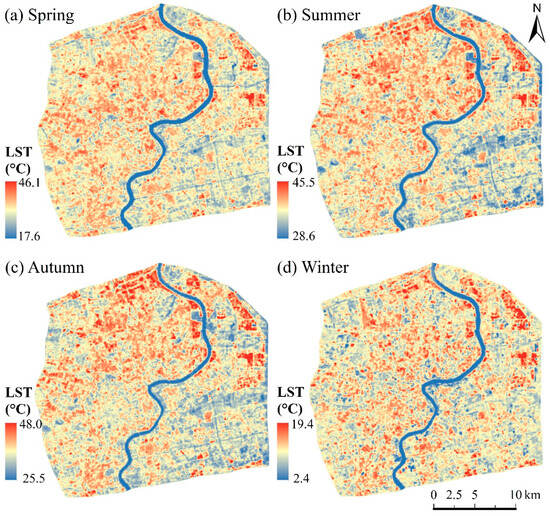
Figure 4.
Spatial distributions of LST in Shanghai.

Table 5.
LST values of LCZs in Shanghai.
4.2.2. MTHI Spatial Patterns
The characteristics of the seasonal spatial distribution of thermal comfort in Shanghai are shown in Figure 5. As Shanghai has a Cfa (warm temperate, fully humid, hot summer) climate based on the Köppen–Geiger climate classification, the weather was humid and hot except for winter [74]. Therefore, the spatial pattern of the MTHI corresponded to a combination of LST and NDMI. Typically, high and low LST (in winter) generate a high level of heat hazard. The dominant MTHI levels in Shanghai in spring, summer, and autumn were hot and very hot, whereas those in most regions in winter were cold and slightly cold.
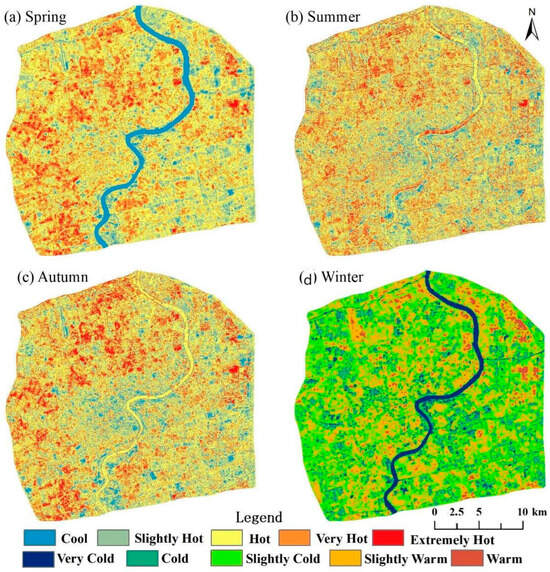
Figure 5.
Spatial patterns of thermal comfort in Shanghai.
The area proportions of different MTHI levels among the LCZ types are shown in Figure 6. It can be seen that the built LCZs had more extremely hot areas than the natural ones. In addition, LCZ 2, 5, and 8 generated a high-level heat hazard more easily, indicating that the mid-rise LCZ types seemed to have the most uncomfortable thermal environments. For seasonal variations, extremely hot levels were found in almost all LCZ types in summer and autumn but were not observed in spring. However, the heat hazard level was mainly estimated using LST and NDWI, and a high hazard did not indicate high heat risk, which required exposure and vulnerability to assess its level.
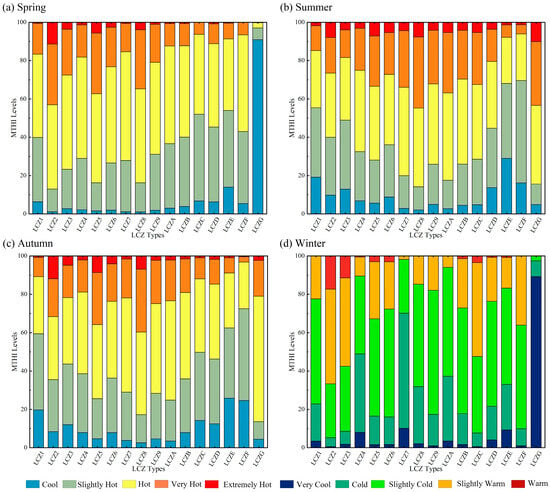
Figure 6.
Area proportions of different MTHI levels among LCZ types in Shanghai.
4.3. Spatial Patterns of Heat Exposure
The spatial patterns of population density, ISA proportion, and heat exposure levels among the LCZs are shown in Figure 7a–c, respectively. Figure 7d shows the area proportions of different exposure levels for the entire study area and among the LCZ types. Figure 7a shows that the population density on the west bank of the Huangpu River was significantly higher than that in the east. The most densely populated area was found in the city center, and the population density of some LCZs was greater than 100,000/km2. The proportion of LCZs with high ISA fractions (>60%) was 67.01%, indicating that Shanghai has a dense built environment. For the entire study area, a very high level of heat exposure accounted for only 3.93%, but high-level exposure was 36.01%. For different LCZ types, the proportion of areas with very high heat exposure was higher in LCZ1 5 and LCZ E than in the other areas. Conversely, LCZ9 and LCZ A–C exhibited the lowest heat exposure levels with very low and low heat exposure levels in LCZ A accounting for more than 70% of the total.
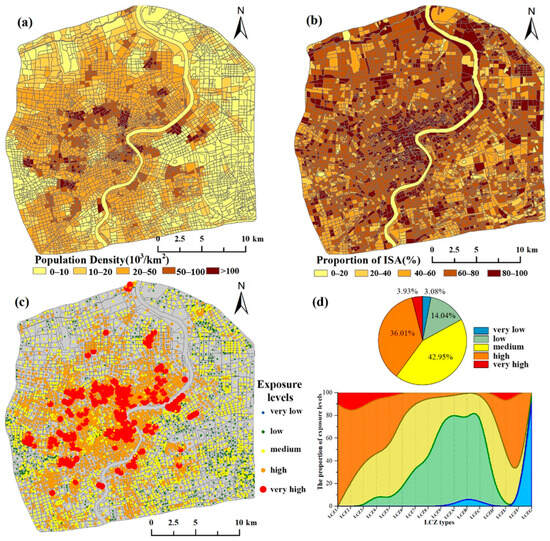
Figure 7.
Spatial patterns of population density (a), ISA (b), exposure levels (c), and the area proportion of different exposure levels for the whole area and among LCZ types (d).
4.4. Spatial Patterns of Heat Vulnerability
Figure 8 shows the spatial distributions of sensitive population density, a combination of water and vegetation, heat vulnerability levels, and the area fractions of different vulnerabilities for Shanghai and among different LCZ types. The spatial patterns of the sensitive population were similar to that of the entire population; however, the population density was much lower. Almost 60% of the LCZs have a sensitive population density less than 5000/km2. The spatial pattern of water and vegetation was opposite to that of ISA, indicating that the low area of natural land cover for most LCZs in Shanghai might add to the level of heat vulnerability. Figure 8c shows that the very high levels of heat vulnerability were mainly distributed in the city center, where the region has a high sensitive population density and sparse natural water and vegetation. The total area proportions of high and very high levels of heat vulnerability accounted for 27.78%; the value for LCZ1 was 80.52%, followed by 66.15% for LCZ2. Compared to the compact (LCZ1–3) and open (LCZ4–6) LCZ types, the sparse LCZ types (7–9) had lower heat vulnerability owing to their lower population levels.
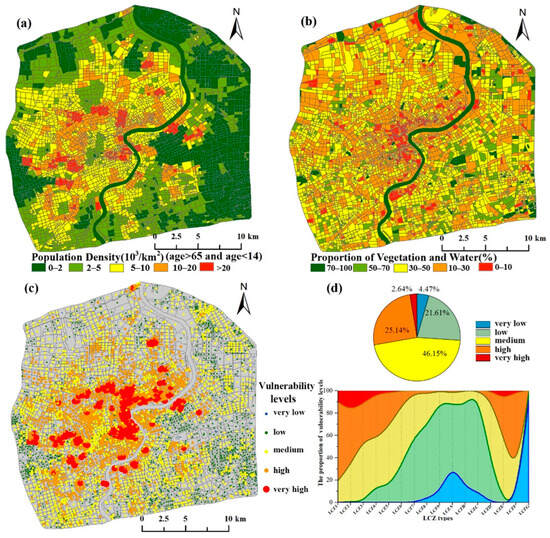
Figure 8.
Distribution of sensitive populations (a), proportion of vegetation and water (b), vulnerability levels (c), and the proportion of different heat vulnerabilities among LCZ types (d).
4.5. Spatial and Seasonal Variations in HHRs
The seasonal spatial patterns of HHRs, derived from the hazard–exposure–vulnerability framework, are shown in Figure 9. The HHR to the west of the Huangpu River was much higher than to the east, and a very high level of risk was concentrated in the northern and western parts, which were very close to the city center. The spatial patterns of the high-risk region (defined as “very high” and “high”) were similar to high-heat hazards—defined as “extremely hot” and “very hot”—characterized by the MTHI in spring, summer, and autumn. In winter, the high-risk region was mainly located in the city center, which was similar to exposure and vulnerability. Notably, the high-risk region in winter had a very cold thermal environment, which was different from that in other seasons.
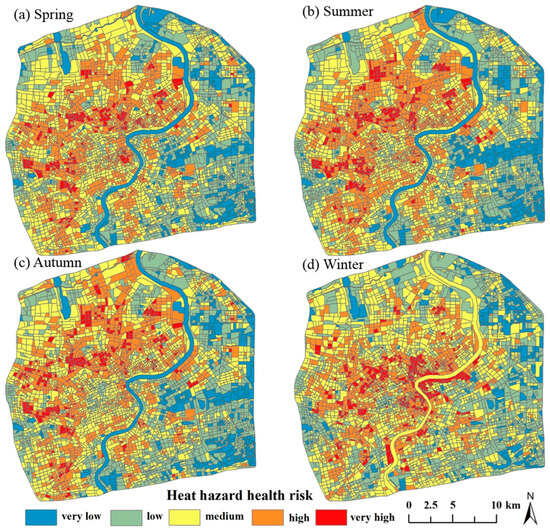
Figure 9.
Seasonal spatial patterns of heat hazard health risk for Shanghai in spring (a), summer (b), autumn (c), and winter (d).
Figure 10 shows the area proportions of different HHR levels among the seasons. High-risk regions accounted for 26.26, 27.66, and 28.36% of the total area in spring, summer, and autumn, respectively. The high-risk region was 23.07% in winter, indicating that winter had a lower heat-related health risk than other seasons. Overall, based on our results, a level of 26–28% indicated that a substantial number of areas of Shanghai were experiencing high heat risk, even though high-risk areas did not constitute the largest proportion.
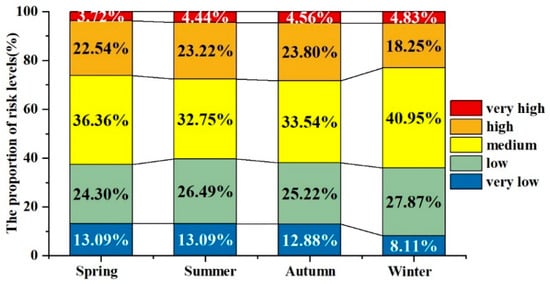
Figure 10.
Area proportion of different HHR levels among seasons.
5. Discussion
5.1. Selection of Indicators for the HHR Assessment Framework
In the context of global climate change and rapid urbanization, it is estimated that more urban area residents will face severe thermal risks, such as heat or cold waves [6,75]. Therefore, it is essential to construct a scientific and practical framework to assess the heat risk at fine spatial scales, as most current studies focus on administrative or district levels [14,15].
A framework that combines heat hazard, exposure, and vulnerability was proposed in this study to assess the differences in heat risk among the LCZ types. Most previous studies have only used air temperature or LST to characterize heat hazards and ignored thermal reflection [31,76]. Therefore, the thermal comfort characterized by the MTHI was employed in this study to assess the heat hazard, which better reflects human perception in a spatially explicit way owing to the application of remote sensing and enables a more comprehensive heat hazard quantification. Additionally, compared to the limited number of meteorological stations, application of the MTHI made it possible to assess heat hazard seasonal variations for each LCZ at a neighborhood level. For the heat exposure and vulnerability assessment, population density was selected as a key element because we believe that the impacts of heat risk depend not only on hazards but also on the number of residents. Specifically, children and the elderly were both considered in our vulnerability assessment, whereas previous studies selected only the latter. Here, the final HHR was the weighted sum of the three indicators rather than equal weights, because they contributed differently to the heat risk. Overall, the HHR assessment proposed here can help quantify heat risk in a more comprehensive way, especially at a finer scale, owing to the selection of the three indicators and their reasonable multiplication.
5.2. HHR Differences among LCZ Types
The urban thermal environment can change significantly over short distances because of the complicated landscape patterns in cities, which profoundly affects the heat risk of human habitation [37]. Since its emergence in 2012, the new LCZ classification system has become a popular and standard research framework for studying urban heat islands [46]. However, only a few heat risk assessment studies have employed the LCZ concept [15]; therefore, its application here as an analysis unit to quantify heat risk was undoubtedly qualified and innovative.
The area proportions of different HHR levels among the LCZ types across seasons are shown in Figure 11. Overall, the area of high-risk regions—referring to “high” and “very high” levels—in built LCZ types was much larger than that in landcover LCZ types except for LCZ E (bare rock or paved) and LCZ F (bare soil) where there is little ecological land, which was consistent with a previous study [15]. For seasonal variations, spring, summer, and autumn faced similar heat risks owing to their comparable spatial patterns of MTHI, which weighted 50% of the HHR. The very high heat risk levels in winter in LCZ1 and LCZ4 were much higher than those in the other seasons possibly due to the high buildings in these areas that create large areas of shading and generate a low LST, leading to very cold areas in winter. However, the cooling effect of high-rise LCZ types (1, 4, and 7) produced by shading might be helpful for residents in finding cool places to mitigate the negative impacts of heat waves in hot seasons [77]. This result was opposite to that of a previous study, in which compact high-rise buildings increased LST [37]. Our results also provided evidence that LCZ2, 3, and 5 faced the most severe heat risk at the neighborhood level, which was consistent with previous studies where LCZ2 and 5 had negative effects on the inhabitants [15]. The high population density of these LCZ types may be a reason for their high heat risk. However, by comparing Figs. 5 and 9, an interesting phenomenon was noted where a high fraction of high-hazard regions was found in LCZ8 (sparse mid-rise), which had a low proportion of high-risk regions, possibly because LCZ8 has low heat exposure and vulnerability due to its sparse population and more natural land cover [78].
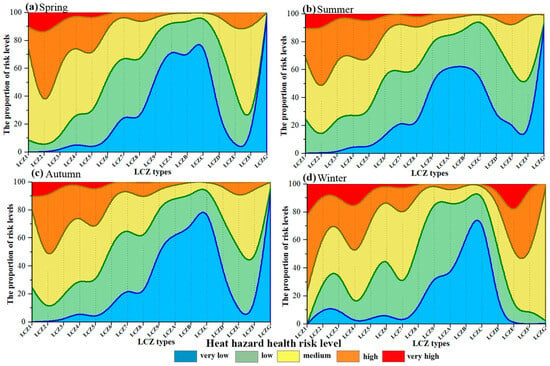
Figure 11.
Area proportion of different HHR levels for Shanghai city in (a) spring, (b) summer, (c) autumn, and (d) winter.
5.3. Implications for Urban Management and Planning
There are contradictory or even opposing results of heat risk assessments in the current literature [15,53]. For instance, Ma suggested that urban planners may select LCZ6 to implement adaptation and mitigation strategies [15], whereas Zhou found that the area of high-risk regions was higher in LCZ6 than in LCZ4 [53]. Therefore, policy and decision makers should have a clear understanding of the specific data, methods, and results of different studies. From the results of this study, the HHR exhibited obvious variations among the LCZs in Shanghai city. Our results indicate that heat health risks increased with an increase in building density. Therefore, in urban renewal demolition or reconstruction—through the intensive use of land—LCZ2 (compact mid-rise) can be changed to LCZ6 (open low-rise) or 7 (sparse high-rise) to reduce heat risks. If the areas cannot be rebuilt, adding more vegetation and water, such as in pocket parks, could also improve living environments [79,80]. Additionally, Shanghai still has some LCZ E (bare paved) and LCZ F (bare soil) areas that can be utilized when planning future developments. Another suggestion is that all three indicators—hazard, exposure, and vulnerability—should be considered during urban planning.
5.4. Study Limitations and Future Work
This study had some limitations wherein, compared to the traditional heat-hazard assessment, the MTHI does not employ meteorological data such as wind speed and humidity, important elements for characterizing human feelings regarding the thermal environment [41]. Furthermore, the results of the heat hazard assessment were limited by the time of the remote sensing data acquisition. To assess heat exposure and vulnerability, more meaningful socio-ecological-economic parameters—unemployed population density, GDP, number of air conditioners, and distance to the closest hospital—should be considered in future studies [81].
6. Conclusions
A heat health risk assessment framework that employed heat hazards, exposure, and vulnerability was proposed in this study to quantify the spatial and seasonal variations in Shanghai city, focusing on the risk differences among different LCZ types. Multisource data, including Landsat 8 images, road networks, building data, and population density data, were employed to generate the LCZ and HHR maps using GIS spatial analysis methods. The main findings are summarized as follows.
- (1)
- Multi-source data can effectively generate Shanghai LCZ types at the neighborhood level. The results showed that the built LCZ types in Shanghai accounted for 83.16%, whereas natural land cover accounted for only 16.84%. LCZ5 (open mid-rise) and LCZ4 (open high-rise) accounted for the largest area proportions, whereas LCZ1 (compact high-rise) accounted for less than 1%.
- (2)
- The HHR index used here could not only quantify the spatial details of heat risk levels on a fine scale, but also describe seasonal variations. Spring, summer, and autumn had similar spatial patterns of heat risk, characterized by high temperatures, and they had a higher proportion of high-risk regions (27%) than winter (23%).
- (3)
- The HHR showed significant differences among different LCZ types. Typically, the built LCZ had a higher heat risk than the natural land cover LCZs, except for LCZ E (bare paved). LCZ2, 3, and 5 posed a more serious heat risk, while LCZ 6–9 were mainly exposed in low-risk regions. Generally, compact LCZs generate severe heat risks; however, in the context of similar building density, high-rise buildings would reduce the heat risk level in hot seasons owing to shading effects but add risks in winter.
Therefore, these findings would aid policymakers in future decisions. Particular attention should be devoted to the heat risks in blocks containing compact mid-rise buildings, while providing guidance for the construction of sparse high-rise blocks. Furthermore, in areas characterized by compact buildings, augmenting blue and green spaces can effectively regulate microclimate temperatures and mitigate heat-related risks. In addition, the proposed HHR assessment framework at the community level could add to our knowledge of the relationship between urban structures and thermal HHRs.
Author Contributions
Conceptualization, C.Y. and W.Z.; methodology, L.Y. and C.Y.; software, L.Y.; validation, C.W. and L.L.; formal analysis, L.Y.; investigation, C.Y.; resources, C.Y. and X.C.; data curation, C.W. and L.L.; writing—original draft preparation, L.Y.; writing—review and editing, C.Y.; visualization, C.Y.; project administration, C.Y. and W.Z.; funding acquisition, C.Y. and X.C. All authors have read and agreed to the published version of the manuscript.
Funding
This study was funded by the National Natural Science Foundation of China (grant number 42201123) and the China Postdoctoral Science Foundation (grant number 2022M713309). This study was also supported by the Open Fund of the Key Laboratory of Urban Land Resources Monitoring and Simulation (KF-2022-07-002), Ministry of Natural Resources.
Data Availability Statement
The data presented in this study are available on request from the corresponding author. The data are not publicly available due to privacy.
Conflicts of Interest
The authors declare no conflicts of interest.
Appendix A

Table A1.
Local climate zone types.
Table A1.
Local climate zone types.
| Building LCZs | Natural LCZs | ||||
|---|---|---|---|---|---|
| LCZ1 |  | Compact high-rise (more than 9 floors) | LCZA |  | Dense trees |
| LCZ2 |  | Compact mid-rise (4–8 floors) | LCZB |  | Scattered trees |
| LCZ3 |  | Compact low-rise (1–3 floors) | LCZC |  | Bush, scrub |
| LCZ4 |  | Open high-rise (more than 9 floors) | LCZD |  | Low plants |
| LCZ5 |  | Open mid-rise (4−8 floors) | LCZE |  | Bare rock or paved |
| LCZ6 |  | Open low-rise (1–3 floors) | LCZF |  | Bare soil or sand |
| LCZ7 |  | Sparse high-rise (more than 9 floors) | LCZG |  | Water |
| LCZ8 |  | Sparse mid-rise (4−8 floors) | LCZ1–3: building density greater than 0.4 LCZ4–6: building density is between 0.2 and 0.4 LCZ7–9: building density less than 0.2 | ||
| LCZ9 |  | Sparse low-rise (1−3 floors) | |||

Table A2.
LST of Landsat images available in the study area from 2020 to 2022.
Table A2.
LST of Landsat images available in the study area from 2020 to 2022.
| Data | Mean | Max | Min | Data | Mean | Max | Min | Data | Mean | Max | Min | |
|---|---|---|---|---|---|---|---|---|---|---|---|---|
| Winter | 13 January 2020 | 8.69 | 19.24 | 2.75 | 30 December 2020 | 1.49 | 18.58 | −12.73 | 2 January 2022 | 9.07 | 22.62 | 4.63 |
| 21 January 2020 | 13.18 | 24.91 | 7.26 | 15 January 2021 | 14.17 | 30.76 | −0.07 | 18 January 2022 | 9.46 | 20.71 | 2.40 | |
| 29 January 2020 | 10.59 | 26.43 | 3.58 | 8 February 2021 | −8.77 | 2.38 | −14.26 | 27 February 2022 | 18.53 | 39.13 | 8.86 | |
| 22 February 2020 | 18.49 | 36.77 | 10.12 | 24 February 2021 | 18.93 | 35.57 | 7.32 | 11 December 2022 | 9.81 | 19.93 | 5.44 | |
| 14 December 2020 | 8.35 | 20.94 | 3.20 | 1 December 2021 | 10.64 | 24.66 | −6.38 | 20 December 2022 | 12.36 | 28.56 | 4.82 | |
| 22 December 2020 | 12.36 | 27.32 | 5.38 | 17 December 2021 | 10.65 | 20.11 | 6.63 | |||||
| Spring | 17 March 2020 | 24.51 | 49.21 | 12.55 | 28 March 2021 | 25.66 | 49.90 | 14.73 | 7 March 2022 | 7.03 | 28.61 | −10.01 |
| 25 March 2020 | 23.26 | 38.65 | 0.71 | 5 April 2021 | 22.91 | 45.03 | 12.60 | 15 March 2022 | 24.11 | 44.27 | 13.09 | |
| 2 April 2020 | 21.66 | 41.35 | 7.51 | 13 April 2021 | 26.83 | 47.28 | 14.38 | 23 March 2022 | 20.50 | 43.43 | 4.07 | |
| 10 April 2020 | 15.95 | 25.20 | 11.24 | 21 April 2021 | 29.23 | 48.53 | 16.03 | 8 April 2022 | 32.94 | 55.75 | 18.24 | |
| 26 April 2020 | 21.58 | 31.83 | 13.86 | 29 April 2021 | 33.63 | 58.99 | 19.90 | 16 April 2022 | 24.22 | 35.28 | 11.40 | |
| Summer | 4 May 2020 | 30.61 | 49.49 | 19.67 | 24 June 2021 | 32.76 | 48.44 | 21.02 | 27 June 2022 | 27.02 | 47.33 | 10.25 |
| 12 May 2020 | 37.39 | 61.83 | 24.02 | 10 July 2021 | 42.08 | 64.10 | 29.03 | 5 July 2022 | 49.47 | 68.87 | 31.77 | |
| 20 May 2020 | 33.36 | 56.83 | 18.96 | 18 July 2021 | 45.12 | 66.74 | 27.53 | 13 July 2022 | 46.24 | 78.14 | 26.31 | |
| 28 May 2020 | 29.51 | 35.99 | 18.64 | 3 August 2021 | 30.56 | 38.02 | 21.17 | 28 July 2022 | 38.42 | 62.06 | 30.13 | |
| 23 July 2020 | 42.44 | 62.68 | 25.45 | 19 August 2021 | 39.56 | 57.99 | 28.77 | 29 July 2022 | 48.07 | 64.21 | 32.83 | |
| 31 July 2020 | 0.90 | 23.87 | −57.64 | 27 August 2021 | 32.85 | 51.21 | 14.29 | 6 August 2022 | 36.52 | 51.72 | 2.47 | |
| 16 August 2020 | 45.47 | 70.29 | 33.93 | 20 September 2021 | 29.14 | 53.51 | 11.15 | 9 August 2022 | 41.68 | 62.64 | −72.62 | |
| 24 August 2020 | 40.00 | 67.06 | 28.47 | 28 September 2021 | 36.35 | 63.98 | 24.24 | 14 August 2022 | 42.06 | 67.15 | 30.65 | |
| 1 September 2020 | 40.36 | 54.84 | 26.72 | 2 May 2022 | 32.80 | 61.41 | 18.43 | 22 August 2022 | 50.54 | 77.53 | 38.29 | |
| 9 September 2020 | 37.56 | 63.17 | 23.05 | 18 May 2022 | 32.28 | 50.12 | 17.01 | 30 August 2022 | 42.19 | 61.75 | 21.88 | |
| 25 September 2020 | 28.68 | 40.72 | 17.54 | 21 May 2022 | 29.16 | 59.77 | 19.12 | 7 September 2022 | 39.41 | 66.33 | 29.40 | |
| 7 May 2021 | 33.70 | 57.76 | 20.23 | 7 June 2022 | 27.03 | 40.10 | 16.38 | 17 September 2022 | 33.32 | 54.22 | 22.48 | |
| 15 May 2021 | 40.10 | 67.04 | 20.64 | 11 June 2022 | 36.08 | 54.81 | 25.83 | 23 September 2022 | 32.48 | 49.67 | 20.41 | |
| Autumn | 11 October 2020 | 29.08 | 56.79 | 14.27 | 4 November 2021 | 22.46 | 29.99 | 16.56 | 21 October 2022 | 23.69 | 39.07 | 13.22 |
| 27 October 2020 | 15.85 | 21.71 | 11.84 | 7 November 2021 | 19.78 | 26.79 | 9.62 | 25 October 2022 | 25.03 | 40.36 | 10.32 | |
| 12 November 2020 | 22.68 | 41.57 | 6.26 | 15 November 2021 | 18.41 | 37.84 | 3.02 | 2 November 2022 | 24.78 | 43.07 | 17.46 | |
| 28 November 2020 | 14.57 | 31.33 | 1.78 | 23 November 2021 | 11.24 | 22.95 | 4.41 | 7 November 2022 | 19.45 | 33.83 | 8.79 | |
| 6 October 2021 | 32.52 | 35.48 | 26.06 | 1 October 2022 | 36.97 | 52.96 | 26.47 | 10 November 2022 | 28.98 | 48.31 | 20.03 | |
| 22 October 2021 | 20.29 | 35.77 | 13.11 | 9 October 2022 | 26.53 | 46.75 | 13.31 | 26 November 2022 | 22.54 | 34.19 | 16.80 | |
| 30 October 2021 | 23.55 | 44.15 | 8.47 | 17 October 2022 | 25.03 | 36.55 | 18.75 |
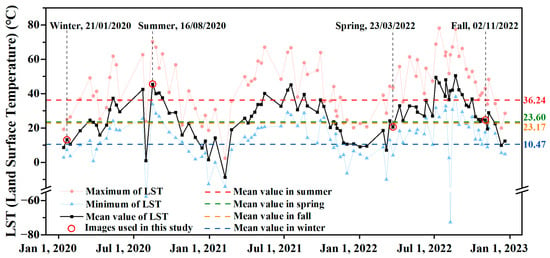
Figure A1.
The Landsat LST time series from 1 January 2020 to 31 December 2022; Winter: January, February, December; Spring: March, April, May; Summer: June, July, August, September; Fall: October, November.
References
- Guardaro, M.; Hondula, D.M.; Redman, C.L. Social capital: Improving community capacity to respond to urban heat. Local Environ. 2022, 27, 1133–1150. [Google Scholar] [CrossRef]
- Cohen, B. Urbanization in developing countries: Current trends, future projections, and key challenges for sustainability. Technol. Soc. 2006, 28, 63–80. [Google Scholar] [CrossRef]
- IPCC. Climate Change 2022: Impacts, Adaptation and Vulnerability. Working Group II Contribution to the Sixth Assessment Report of the Intergovernmental Panel on Climate Change. Available online: https://www.ipcc.ch/report/ar6/wg2/resources/press/press-release/ (accessed on 28 February 2022).
- Wang, D.; Lau, K.K.L.; Ren, C.; Goggins, W.; Shi, Y.; Ho, H.C.; Lee, T.C.; Lee, L.S.; Woo, J.; Ng, E. The impact of extremely hot weather events on all-cause mortality in a highly urbanized and densely populated subtropical city: A 10-year time-series study (2006–2015). Sci. Total Environ. 2019, 690, 923–931. [Google Scholar] [CrossRef] [PubMed]
- He, B.J.; Wang, J.S.; Zhu, J.; Qi, J.D. Beating the urban heat: Situation, background, impacts and the way forward in China. Renew. Sustain. Energy Rev. 2022, 161, 112350. [Google Scholar] [CrossRef]
- Levermore, G.; Parkinson, J.; Lee, K.; Laycock, P.; Lindley, S. The increasing trend of the urban heat island intensity. Urban Clim. 2017, 24, 360–368. [Google Scholar] [CrossRef]
- Giannaros, C.; Agathangelidis, I.; Papavasileiou, G.; Galanaki, E.; Kotroni, V.; Lagouvardos, K.; Giannaros, T.M.; Cartalis, C.; Matzarakis, A. The extreme heat wave of July–August 2021 in the Athens urban area (Greece): Atmospheric and human-biometeorological analysis exploiting ultra-high resolution numerical modeling and the local climate zone framework. Sci. Total Environ. 2023, 857, 159300. [Google Scholar] [CrossRef]
- Kephart, J.L.; Sánchez, B.N.; Moore, J.; Schinasi, L.H.; Bakhtsiyarava, M.; Ju, Y.; Gouveia, N.; Caiaffa, W.T.; Dronova, I.; Arunachalam, S.; et al. City-level impact of extreme temperatures and mortality in Latin America. Nat. Med. 2022, 28, 1700–1705. [Google Scholar] [CrossRef]
- Ren, Z.B.; Fu, Y.; Dong, Y.L.; Zhang, P.; He, X.Y. Rapid urbanization and climate change significantly contribute to worsening urban human thermal comfort: A national 183-city, 26-year study in China. Urban Clim. 2022, 43, 101154. [Google Scholar] [CrossRef]
- Mcmichael, A.J.; Woodruff, R.E.; Hales, S. Climate change and human health: Present and future risks. Lancet 2006, 367, 859–869. [Google Scholar] [CrossRef]
- Chen, M.; Chen, L.; Zhou, Y.; Hu, M.; Jiang, Y.; Huang, D.; Gong, Y.; Xian, Y. Rising vulnerability of compound risk inequality to ageing and extreme heatwave exposure in global cities. npj Urban Sustain. 2023, 3, 38. [Google Scholar] [CrossRef]
- McPhearson, T.; Andersson, E.; Elmqvist, T.; Frantzeskaki, N. Resilience of and through urban ecosystem services. Ecosyst. Serv. 2015, 12, 152–156. [Google Scholar] [CrossRef]
- Tong, P. Characteristics, dimensions and methods of current assessment for urban resilience to climate-related disasters: A systematic review of the literature. Int. J. Disaster Risk Reduct. 2021, 60, 102276. [Google Scholar] [CrossRef]
- Maggiotto, G.; Miani, A.; Rizzo, E.; Castellone, M.D.; Piscitelli, P. Heat waves and adaptation strategies in a mediterranean urban context. Environ. Res. 2021, 197, 111066. [Google Scholar] [CrossRef] [PubMed]
- Ma, L.; Huang, G.A.; Johnson, B.A.; Chen, Z.J.; Li, M.C.; Yan, Z.Y.; Zhan, W.F.; Lu, H.; He, W.Q.; Lian, D.J. Investigating urban heat-related health risks based on local climate zones: A case study of Changzhou in China. Sustain. Cities Soc. 2023, 91, 104402. [Google Scholar] [CrossRef]
- Jedlovec, G.; Crane, D.; Quattrochi, D. Urban heat wave hazard and risk assessment. Results Phys. 2017, 7, 4294–4295. [Google Scholar] [CrossRef]
- Buchin, O.; Hoelscher, M.T.; Meier, F.; Nehls, T.; Ziegler, F. Evaluation of the health-risk reduction potential of countermeasures to urban heat islands. Energy Build. 2016, 114, 27–37. [Google Scholar] [CrossRef]
- Crichton, D. The risk triangle. Nat. Disaster Manag. 1999, 102, 102–103. [Google Scholar]
- Ellena, M.; Melis, G.; Zengarini, N.; Di Gangi, E.; Ricciardi, G.; Mercogliano, P.; Costa, G. Micro-scale UHI risk assessment on the heat-health nexus within cities by looking at socio-economic factors and built environment characteristics: The Turin case study (Italy). Urban Clim. 2023, 49, 101514. [Google Scholar] [CrossRef]
- Krstic, N.; Yuchi, W.; Ho, H.C.; Walker, B.B.; Knudby, A.J.; Henderson, S.B. The Heat Exposure Integrated Deprivation Index (HEIDI): A data-driven approach to quantifying neighborhood risk during extreme hot weather. Environ. Int. 2017, 109, 42–52. [Google Scholar] [CrossRef]
- Wang, S.Q.; Sun, Q.C.; Huang, X.; Tao, Y.G.; Dong, C.Y.; Das, S.; Liu, Y. Health-integrated heat risk assessment in Australian cities. Environ. Impact Assess. Rev. 2023, 102, 107176. [Google Scholar] [CrossRef]
- Estoque, R.C.; Ooba, M.; Seposo, X.T.; Togawa, T.; Hijioka, Y.; Takahashi, K.; Nakamura, S. Heat health risk assessment in Philippine cities using remotely sensed data and social-ecological indicators. Nat. Commun. 2020, 11, 1581. [Google Scholar] [CrossRef] [PubMed]
- Zeng, P.; Sun, F.; Shi, D.; Liu, Y.; Zhang, R.; Tian, T.; Che, Y. Integrating anthropogenic heat emissions and cooling accessibility to explore environmental justice in heat-related health risks in Shanghai, China. Landsc. Urban Plan. 2022, 226, 104490. [Google Scholar] [CrossRef]
- Johnson, D.P.; Stanforth, A.; Lulla, V.; Luber, G. Developing an applied extreme heat vulnerability index utilizing socioeconomic and environmental data. Appl. Geogr. 2012, 35, 23–31. [Google Scholar] [CrossRef]
- Dong, J.; Peng, J.; He, X.; Corcoran, J.; Qiu, S.; Wang, X. Heatwave-induced human health risk assessment in megacities based on heat stress-social vulnerability-human exposure framework. Landsc. Urban Plan. 2020, 203, 103907. [Google Scholar] [CrossRef]
- Wu, S.; Yu, W.; Chen, B. Observed inequality in thermal comfort exposure and its multifaceted associations with greenspace in United States cities. Landsc. Urban Plan. 2023, 233, 104701. [Google Scholar] [CrossRef]
- Arnberger, A.; Allex, B.; Eder, R.; Ebenberger, M.; Wanka, A.; Kolland, F.; Wallner, P.; Hutter, H.P. Elderly resident’s uses of and preferences for urban green spaces during heat periods. Urban For. Urban Green. 2017, 21, 102–115. [Google Scholar] [CrossRef]
- Zhang, W.J.; Du, Z.C.; Zhang, D.M.; Yu, S.C.; Hao, Y.T. Quantifying the adverse effect of excessive heat on children: An elevated risk of hand, foot and mouth disease in hot days. Sci. Total Environ. 2016, 541, 194–199. [Google Scholar] [CrossRef]
- Macintyre, H.L.; Heaviside, C.; Taylor, J.; Picetti, R.; Symonds, P.; Cai, X.M.; Vardoulakis, S. Assessing urban population vulnerability and environmental risks across an urban area during heatwaves—Implications for health protection. Sci. Total Environ. 2018, 610–611, 678–690. [Google Scholar] [CrossRef]
- He, B.-J. Cause-related injustice, process-related injustice, effect-related injustice and regional heat action planning priorities: An empirical study in Yangtze River Delta and Chengdu-Chongqing urban agglomerations. Landsc. Urban Plan. 2023, 237, 104800. [Google Scholar] [CrossRef]
- Yuan, B.; Zhou, L.; Hu, F.N.; Zhang, Q. Diurnal dynamics of heat exposure in Xi’an: A perspective from local climate zone. Build. Environ. 2022, 222, 109400. [Google Scholar] [CrossRef]
- Jung, W.; Kim, H. Evaluation of Heat Stress Levels Inside Greenhouses during Summer in Korea. Int. J. Environ. Res. Public Health 2022, 19, 12497. [Google Scholar] [CrossRef]
- Hisato, O.; Mori, T.; Shinagawa, K.; Nakayama, S.; Hosobuchi, H.; Mushtaha, E. Risk Assessment of Heat Stroke during the Marathon of the Tokyo 2020 Olympics in Sapporo, Hokkaido. Sustainability 2023, 15, 3997. [Google Scholar] [CrossRef]
- Brimicombe, C.; Lo, C.H.B.; Pappenberger, F.; Di Napoli, C.; Maciel, P.; Quintino, T.; Cornforth, R.; Cloke, H.L. Wet Bulb Globe Temperature: Indicating Extreme Heat Risk on a Global Grid. Geohealth 2023, 7, e2022GH000701. [Google Scholar] [CrossRef] [PubMed]
- Nikolopoulou, M.; Baker, N.; Steemers, K. Thermal comfort in outdoor urban spaces: Understanding the human parameter. Sol. Energy 2001, 70, 227–235. [Google Scholar] [CrossRef]
- Kim, Y.; Li, D.Y.; Xu, Y.Y.; Zhang, Y.; Li, X.Y.; Muhlenforth, L.; Xue, S.L.; Brown, R. Heat vulnerability and street-level outdoor thermal comfort in the city of Houston: Application of google street view image derived SVFs. Urban Clim. 2023, 51, 101617. [Google Scholar] [CrossRef]
- Ren, J.Y.; Yang, J.; Zhang, Y.Q.; Xiao, X.M.; Li, X.M.; Wang, S.H.; Xia, J.C. Exploring thermal comfort of urban buildings based on local climate zones. J. Clean. Prod. 2022, 340, 130744. [Google Scholar] [CrossRef]
- Wu, J.S.; Liu, C.; Wang, H.L. Analysis of Spatio-temporal patterns and related factors of thermal comfort in subtropical coastal cities based on local climate zones. Build. Environ. 2022, 207, 108568. [Google Scholar] [CrossRef]
- Feng, L.; Zhao, M.M.; Zhou, Y.N.; Zhu, L.J.; Tian, H.H. The seasonal and annual impacts of landscape patterns on the urban thermal comfort using Landsat. Ecol. Indic. 2020, 110, 105798. [Google Scholar] [CrossRef]
- Binarti, F.; Koerniawan, M.D.; Triyadi, S.; Utami, S.S.; Matzarakis, A. A review of outdoor thermal comfort indices and neutral ranges for hot-humid regions. Urban Clim. 2020, 31, 100531. [Google Scholar] [CrossRef]
- Dzyuban, Y.; Ching, G.N.Y.; Yik, S.K.; Tan, A.J.; Banerjee, S.; Crank, P.J.; Chow, W.T.L. Outdoor thermal comfort research in transient conditions: A narrative literature review. Landsc. Urban Plan. 2022, 226, 104496. [Google Scholar] [CrossRef]
- Mijani, N.; Alavipanah, S.K.; Firozjaei, M.K.; Arsanjani, J.J.; Hamzeh, S.; Weng, Q.H. Modeling outdoor thermal comfort using satellite imagery: A principle component analysis-based approach. Ecol. Indic. 2020, 117, 106555. [Google Scholar] [CrossRef]
- Zhang, J.; Guo, W.; Cheng, B.; Jiang, L.; Xu, S. A review of the impacts of climate factors on humans’ outdoor thermal perceptions. J. Therm. Biol. 2022, 107, 103272. [Google Scholar] [CrossRef]
- Potchter, O.; Cohen, P.; Lin, T.-P.; Matzarakis, A. A systematic review advocating a framework and benchmarks for assessing outdoor human thermal perception. Sci. Total Environ. 2022, 833, 155128. [Google Scholar] [CrossRef]
- Bao, J.; Li, X.; Yu, C. The Construction and Validation of the Heat Vulnerability Index, a Review. Int. J. Environ. Res. Public Health 2015, 12, 7220–7234. [Google Scholar] [CrossRef]
- Stewart, I.D.; Oke, T.R. Local climate zones for urban temperature studies. Bull. Am. Meteorol. Soc. 2012, 93, 1879–1900. [Google Scholar] [CrossRef]
- Leconte, F.; Bouyer, J.; Claverie, R.; Pétrissans, M. Using Local Climate Zone scheme for UHI assessment: Evaluation of the method using mobile measurements. Build. Environ. 2015, 83, 39–49. [Google Scholar] [CrossRef]
- Bechtel, B.; Demuzere, M.; Mills, G.; Zhan, W.F.; Sismanidis, P.; Small, C.; Voogt, J. SUHI analysis using Local Climate Zones—A comparison of 50 cities. Urban Clim. 2019, 28, 100451. [Google Scholar] [CrossRef]
- Aslam, A.; Rana, I.A. The use of local climate zones in the urban environment: A systematic review of data sources, methods, and themes. Urban Clim. 2022, 42, 101120. [Google Scholar] [CrossRef]
- Zhou, L.; Yuan, B.; Hu, F.N.; Wei, C.Z.; Dang, X.W.; Sun, D.Q. Understanding the effects of 2D/3D urban morphology on land surface temperature based on local climate zones. Build. Environ. 2022, 208, 108578. [Google Scholar] [CrossRef]
- Unal Cilek, M.; Cilek, A. Analyses of land surface temperature (LST) variability among local climate zones (LCZs) comparing Landsat-8 and ENVI-met model data. Sustain. Cities Soc. 2021, 69, 102877. [Google Scholar] [CrossRef]
- Liu, Y.; Li, Q.; Yang, L.; Mu, K.K.; Zhang, M.Y.; Liu, J.P. Urban heat island effects of various urban morphologies under regional climate conditions. Sci. Total Environ. 2020, 743, 140589. [Google Scholar] [CrossRef] [PubMed]
- Zhou, Y.; Zhang, G.; Jiang, L.; Chen, X.; Xie, T.; Wei, Y.; Xu, L.; Pan, Z.; An, P.; Lun, F. Mapping local climate zones and their associated heat risk issues in Beijing: Based on open data. Sustain. Cities Soc. 2021, 74, 103174. [Google Scholar] [CrossRef]
- Yin, Q.; Cao, Y.; Sun, C. Research on outdoor thermal comfort of high-density urban center in severe cold area. Build. Environ. 2021, 200, 107938. [Google Scholar] [CrossRef]
- Xu, M.; Hong, B.; Mi, J.Y.; Yan, S.S. Outdoor thermal comfort in an urban park during winter in cold regions of China. Sustain. Cities Soc. 2018, 43, 208–220. [Google Scholar] [CrossRef]
- Sun, F.Y.; Liu, M.; Wang, Y.C.; Wang, H.; Che, Y. The effects of 3D architectural patterns on the urban surface temperature at a neighborhood scale: Relative contributions and marginal effects. J. Clean. Prod. 2020, 258, 120706. [Google Scholar] [CrossRef]
- Yang, J.; Ren, J.; Sun, D.; Xiao, X.; Xia, J.; Jin, C.; Li, X. Understanding land surface temperature impact factors based on local climate zones. Sustain. Cities Soc. 2021, 69, 102818. [Google Scholar] [CrossRef]
- Yang, C.B.; He, X.Y.; Yan, F.Q.; Yu, L.X.; Bu, K.; Yang, J.C.; Chang, L.P.; Zhang, S.W. Mapping the influence of land use/land cover changes on the urban heat island effect—A case study of Changchun, China. Sustainability 2017, 9, 312. [Google Scholar] [CrossRef]
- Chen, X.; Zhang, Y. Impacts of urban surface characteristics on spatiotemporal pattern of land surface temperature in Kunming of China. Sustain. Cities Soc. 2017, 32, 87–99. [Google Scholar] [CrossRef]
- Huang, F.; Jiang, S.D.; Zhan, W.F.; Bechtel, B.; Liu, Z.H.; Demuzere, M.; Huang, Y.; Xu, Y.; Ma, L.; Xia, W.J.; et al. Mapping local climate zones for cities: A large review. Remote Sens. Environ. 2023, 292, 113573. [Google Scholar] [CrossRef]
- Imran, H.M.; Hossain, A.; Islam, A.K.M.S.; Rahman, A.; Bhuiyan, M.A.E.; Paul, S.; Alam, A. Impact of Land Cover Changes on Land Surface Temperature and Human Thermal Comfort in Dhaka City of Bangladesh. Earth Syst. Environ. 2021, 5, 667–693. [Google Scholar] [CrossRef]
- Yang, C.B.; Zhu, W.H.; Sun, J.B.; Xu, X.L.; Wang, R.H.; Lu, Y.F.; Zhang, S.W.; Zhou, W.Q. Assessing the effects of 2D/3D urban morphology on the 3D urban thermal environment by using multi-source remote sensing data and UAV measurements: A case study of the snow-climate city of Changchun, China. J. Clean. Prod. 2021, 321, 128956. [Google Scholar] [CrossRef]
- Yi, T.; Wang, H.; Liu, C.; Li, X.; Wu, J. Thermal comfort differences between urban villages and formal settlements in Chinese developing cities: A case study in Shenzhen. Sci. Total Environ. 2022, 853, 158283. [Google Scholar] [CrossRef] [PubMed]
- Yang, C.B.; Yan, F.Q.; Lei, X.L.; Ding, X.L.; Zheng, Y.; Liu, L.F.; Zhang, S.W. Investigating Seasonal Effects of Dominant Driving Factors on Urban Land Surface Temperature in a Snow-Climate City in China. Remote Sens. 2020, 12, 3006. [Google Scholar] [CrossRef]
- Yuan, F.; Bauer, M.E. Comparison of impervious surface area and normalized difference vegetation index as indicators of surface urban heat island effects in Landsat imagery. Remote Sens. Environ. 2007, 106, 375–386. [Google Scholar] [CrossRef]
- Fard, B.J.; Mahmood, R.; Hayes, M.; Rowe, C.; Abadi, A.M.; Shulski, M.; Medcalf, S.; Lookadoo, R.; Bell, J.E. Mapping Heat Vulnerability Index Based on Different Urbanization Levels in Nebraska, USA. GeoHealth 2021, 5, e2021GH000478. [Google Scholar] [CrossRef] [PubMed]
- Zhu, W.; Yuan, C. Urban heat health risk assessment in Singapore to support resilient urban design—By integrating urban heat and the distribution of the elderly population. Cities 2023, 132, 104103. [Google Scholar] [CrossRef]
- Zhang, H.B.; Chen, Y.; Rui, J.W.; Yoshino, H.; Zhang, J.F.; Chen, X.; Liu, J. Effects of thermal environment on elderly in urban and rural houses during heating season in a severe cold region of China. Energy Build. 2019, 198, 61–74. [Google Scholar] [CrossRef]
- Jamei, E.; Rajagopalan, P.; Seyedmahmoudian, M.; Jamei, Y. Review on the impact of urban geometry and pedestrian level greening on outdoor thermal comfort. Renew. Sustain. Energy Rev. 2016, 54, 1002–1017. [Google Scholar] [CrossRef]
- Chen, Q.; Ding, M.; Yang, X.; Hu, K.; Qi, J. Spatially explicit assessment of heat health risk by using multi-sensor remote sensing images and socioeconomic data in Yangtze River Delta, China. Int. J. Health Geogr. 2018, 17, 15. [Google Scholar] [CrossRef]
- Huntington, J.L.; Hegewisch, K.C.; Daudert, B.; Morton, C.G.; Abatzoglou, J.T.; McEvoy, D.J.; Erickson, T. Climate Engine: Cloud Computing and Visualization of Climate and Remote Sensing Data for Advanced Natural Resource Monitoring and Process Understanding. Bull. Am. Meteorol. Soc. 2017, 98, 2397–2410. [Google Scholar] [CrossRef]
- Hwang, R.-L.; Lin, T.-P.; Matzarakis, A. Seasonal effects of urban street shading on long-term outdoor thermal comfort. Build. Environ. 2011, 46, 863–870. [Google Scholar] [CrossRef]
- Guo, Z.; Zhang, Z.W.; Wu, X.G.; Wang, J.; Zhang, P.D.; Ma, D.; Liu, Y. Building shading affects the ecosystem service of urban green spaces: Carbon capture in street canyons. Ecol. Model. 2020, 431, 109178. [Google Scholar] [CrossRef]
- Kottek, M.; Grieser, J.; Beck, C.; Rudolf, B.; Rubel, F. World map of the Köppen-Geiger climate classification updated. Meteorol. Z. 2006, 15, 259–263. [Google Scholar] [CrossRef] [PubMed]
- Lin, X.R.; Zhu, G.F.; Qiu, D.D.; Ye, L.L.; Liu, Y.W.; Chen, L.H.; Liu, J.W.; Lu, S.Y.; Wang, L.; Zhao, K.L.; et al. Stable precipitation isotope records of cold wave events in Eurasia. Atmos. Res. 2023, 296, 13. [Google Scholar] [CrossRef]
- Naikoo, M.W.; Islam, A.R.M.T.; Mallick, J.; Rahman, A. Land use/land cover change and its impact on surface urban heat island and urban thermal comfort in a metropolitan city. Urban Clim. 2022, 41, 101052. [Google Scholar]
- Park, Y.; Guldmann, J.-M.; Liu, D. Impacts of tree and building shades on the urban heat island: Combining remote sensing, 3D digital city and spatial regression approaches. Comput. Environ. Urban Syst. 2021, 88, 101655. [Google Scholar] [CrossRef]
- Zhou, L.; Ma, L.; Johnson, B.A.; Yan, Z.Y.; Li, F.X.; Li, M.C. Patch-Based Local Climate Zones Mapping and Population Distribution Pattern in Provincial Capital Cities of China. ISPRS Int. J. Geo-Inf. 2022, 11, 420. [Google Scholar] [CrossRef]
- Lehnert, M.; Brabec, M.; Jurek, M.; Vladimír, T.; Geletic, J. The role of blue and green infrastructure in thermal sensation in public urban areas: A case study of summer days in four Czech cities. Sustain. Cities Soc. 2021, 66, 102683. [Google Scholar] [CrossRef]
- Pamukcu-Albers, P.; Ugolini, F.; La Rosa, D.; Gradinaru, S.R.; Azevedo, J.C.; Wu, J.G. Building green infrastructure to enhance urban resilience to climate change and pandemics. Landsc. Ecol. 2021, 36, 665–673. [Google Scholar] [CrossRef]
- Chen, G.Z.; Hua, J.Y.; Shi, Y.; Ren, C. Constructing air temperature and relative humidity-based hourly thermal comfort dataset for a high-density city using machine learning. Urban Clim. 2023, 47, 101400. [Google Scholar] [CrossRef]
Disclaimer/Publisher’s Note: The statements, opinions and data contained in all publications are solely those of the individual author(s) and contributor(s) and not of MDPI and/or the editor(s). MDPI and/or the editor(s) disclaim responsibility for any injury to people or property resulting from any ideas, methods, instructions or products referred to in the content. |
© 2024 by the authors. Licensee MDPI, Basel, Switzerland. This article is an open access article distributed under the terms and conditions of the Creative Commons Attribution (CC BY) license (https://creativecommons.org/licenses/by/4.0/).