Article

Robust Direction Estimation of Terrestrial Signal via Sparse Non-Uniform Array Reconfiguration under Perturbations

School of Electronic and Information Engineering, Beihang University, Beijing 100191, China
*
Author to whom correspondence should be addressed.
Remote Sens. 2024, 16(18), 3482; https://doi.org/10.3390/rs16183482
Submission received: 24 July 2024 / Revised: 14 September 2024 / Accepted: 17 September 2024 / Published: 19 September 2024

Abstract

:
DOA (Direction of Arrival), as an important observation parameter for accurately locating the Signals of Opportunity (SOP), is vital for navigation in GNSS-challenged environments and can be effectively obtained through sparse arrays. In practical application, array perturbations affect the estimation accuracy and stability of DOA, thereby adversely affecting the positioning performance of SOP. Against this backdrop, we propose an approach to reconstruct non-uniform arrays under perturbation conditions, aiming to improve the robustness of DOA estimation in sparse arrays. Firstly, we theoretically derive the mathematical expressions of the Cramér–Rao Bound (CRB) and Spatial Correlation Coefficient (SCC) for the uniform linear array (ULA) with perturbation. Then, we minimize CRB as the objective function to mitigate the adverse effects of array perturbations on DOA estimation, and use SCC as a constraint to suppress sidelobes. By doing this, the non-uniform array reconstruction model is formulated as a high-order 0–1 optimization problem. To effectively solve this nonconvex model, we propose a polynomial-time algorithm, which can converge to the optimal approximate solution of the original model. Finally, through a series of simulation experiments utilizing frequency modulation (FM) signal as an example, the exceptional performance of this method in array reconstruction has been thoroughly validated. Experimental data show that the reconstructed non-uniform array excels in DOA estimation accuracy compared to other sparse arrays, making it particularly suitable for estimating the direction of terrestrial SOP in perturbed environments.

1. Introduction

Global navigation satellite systems (GNSS) has limitations, such as its inability to be used for navigation and positioning in urban canyons, indoor environments, and those under malicious attacks (e.g., spoofing or jamming) [1]. In these environments, it requires an alternative to GNSS for safe and reliable navigation. Radio-based navigation is an alternative approach, which utilizes ambient terrestrial signals of opportunity (SOP) in the environment, such as frequency/amplitude modulation (AM/FM) radio, long term evolution (LTE), digital television [2,3,4]. These terrestrial SOP are not intended for position, navigation, and timing (PNT) purposes; nevertheless, the literature shows that they can be exploited for such purposes [5,6]. However, unlike the states of a GNSS space vehicle, SOP states are typically unknown. Hence, accurately locating the terrestrial signal source transmitters is fundamental for navigation using SOP.
Direction of Arrival (DOA) is a vital measurement in locating terrestrial signal source. The accuracy of DOA estimation directly influences the performance of such systems, whether they are based solely on DOA or assisted by other measurements [7,8,9,10]. Consequently, the accurate estimation technique of DOA has consistently been an important research topic. Over the past few decades, researchers have proposed numerous classic DOA estimation algorithms that leverage the characteristics of received signals and employ various approaches to parameter estimation. These algorithms include, but are not limited to, Maximum Likelihood (ML)–based algorithms, sparse reconstruction algorithms, subspace-based methods, and other high-performance DOA estimation algorithms [11,12,13,14,15,16,17].
The aforementioned studies rely on uniform array structures. Recent research has demonstrated that sparse arrays, which can be designed more flexibly and efficiently, can enhance their performance while maintaining a fixed number of antennas, in comparison to uniformly spaced arrays [18,19,20,21,22]. In the design approach of sparse arrays, the fundamental objective lies in determining the optimal placement of a prescribed number of sensors, taking into account various optimization metrics [23,24,25,26,27]. For example, in the context of beamforming, an optimal array configuration is characterized by its ability to achieve a high signal-to-interference-plus-noise ratio (SINR) [28,29,30]. For the purpose of enhancing spatial resolution, it is imperative to maximize the degrees of freedom (DOF) in sparse arrays [31,32,33,34]. And in direction finding applications, the ultimate goal is to achieve optimal DOA estimation performance [35,36,37,38]. Thus, accurately estimating the DOA of SOP signal source is the primary objective of sparse arrays for achieving accurate location. In other words, establishing suitable performance indicators for DOA estimation as the objective function for array reconstruction ensures that the resulting array possesses exceptional DOA estimation capabilities.
Indicators such as the Weiss–Weinstein Bound (WWB), Ziv–Zakai Bound (ZZB), and Bayesian Cramér–Rao Bound (BCRB) [39,40,41] serve as key indicators for assessing DOA estimation performance. These lower bounds are all based on the maximum a posteriori probability (MAP) estimator, which rely on the prior probability distribution of the parameters. Additionally, there are non-Bayesian-based lower bounds, such as Barankin Bounds (BB) [42] and Cramér–Rao bound (CRB) [43]. Although BB outperforms CRB in terms of tightness by selecting multiple test points under low signal-to-noise ratio (SNR) conditions, it also results in an increase in processing complexity. Therefore, we select CRB as the objective function for ULA reconstruction model. When reconstructing omnidirectional antenna arrays, sparse arrays that are reconstructed solely using CRB can theoretically yield optimal estimation of DOA. In practice, when employing the reconstructed array for DOA estimation, a phenomenon of high sidelobes may occur in the spatial spectrum, significantly compromising its overall performance and limiting its application effectiveness [44,45].
High sidelobes can be regarded as interference signals. Therefore, to enhance the practical application performance of the reconstructed array, it is crucial to incorporate additional parameters into the reconstruction model, enabling effective interference suppression. Specifically, a parameter called Spatial Correlation Coefficient (SCC) is proposed. SCC quantifies the array’s interference suppression performance as a bounded parameter, where a smaller value indicates a higher level of interference suppression capability [46,47,48,49]. Thus, to ensure high-precision DOA estimation for SOP in the reconstructed array, incorporating SCC as a constraint in the reconstruction model with DOA estimation performance indicators as the objective function is a rational choice.
The aforementioned methods for sparse array construction often depend on idealized conditions, which are often difficult to satisfy in practical applications. Consequently, the challenge of adaptively designing non-uniform sparse arrays under perturbed conditions while achieving accurate localization of SOP has emerged as an important research topic.
In this work, we study the reconstruction method for Uniform Linear Array (ULA) in the presence of array perturbations. Our objective in sparse array reconstruction is to achieve robust DOA estimation for SOP, enabling accurate location for practical applications. Firstly, CRB and SCC of ULA with perturbation errors are derived, and their expressions are simplified to obtain more generalized forms. Then, utilizing these parameters, the array reconstruction model is formulated as a higher-order 0–1 optimization problem. Due to the non-convex nature of the reconstruction model, and the fact that stable points of non-convex problems can be viewed as optimal approximate solutions [50,51,52], we propose a novel iterative algorithm called Taylor approximation block iterative (TABI) to obtain an optimal approximate solution, which leverages convex relaxation and convex approximation techniques. We construct an upper-bound function based on Taylor expansion to approximate the non-convex objective function and relax the non-convex constraints. In the process of approximating the non-convex objective function, we propose a reliable initial value selection scheme that can avoid infeasible situations during the solution process. Moreover, we proof that TABI converges towards the optimal approximate solution of the original problem. Finally, the performance of the reconstructed sparse array by TABI is evaluated through several experiments. For ease of presentation, in the case of the ULA with perturbations, the array reconstructed by TABI is denoted as E-ReA, the array reconstructed without considering perturbation errors and the original array are denoted as noE-ReA and ULA respectively.
The contributions of this paper are summarized as follows:
  • Derivation of reconstruction parameters for ULA with perturbations: We derive the CRB and SCC for ULA under perturbed conditions, which are crucial indicators for array reconstruction. Additionally, we simplify these indicators and obtain generalized expressions.
  • Construction and solution of the reconstruction model: Based on the simplified indicators, we formulate the reconstruction model as a higher-order 0–1 optimization problem. After that, we propose the TABI algorithm to solve this non-convex model. By analyzing the convergence of the TABI, we prove its ability to obtain the optimal approximate solution.
  • Validation through experiments: The performances of three arrays, E-ReA, noE-ReA, and ULA, are compared. In DOA estimation performance, E-ReA outperforms noE-ReA by 3dB to 5dB. In the comparative experiments with different perturbation errors, the robustness of E-ReA is evidenced. Furthermore, the adaptability of E-ReA to various DOA estimation methods is also be illustrated. The experiments indicate that the array reconstructed using the TABI algorithm is highly suitable for estimating the direction of terrestrial SOP.
The paper is structured as follows: Section 2 describes the signal model of ULA with perturbation errors, then we derive and simplify the CRB and SCC for ULA, which are under perturbed condition. Using those expressions, we construct the reconstruction model for ULA as a higher-order 0–1 optimization problem. In Section 3, the TABI algorithm is presented to solve the reconstruction model using continuous convex approximation. Moreover, based on the analysis of algorithm convergence, we demonstrate that TABI can converge to the approximate optimal solution of the original reconstruction model and analyze its complexity. In Section 4, several simulation experiments are presented with FM as an example, primarily comparing the performance of E-ReA, noE-ReA, and ULA. Additionally, we test the applicability of different DOA estimation algorithms in the reconstructed array, and the concluding remarks are provided in the last section. The conventions used throughout the paper are followed
  • T . Transpose.
  • H . Hermitian (complex conjugate) transpose.
  • Re A . Take the real part of the elements in matrix A .
  • diag . Indicates the diagonal matrix with corresponding elements on its diagonal.
  • blkdiag . Signifies the arrangement of individual submatrices in a block diagonal form.
  • tr . Means taking the trace of matrix.
  • A 1 . The inverse matrix of A .
  • A i , j . The element in i-th row and j-th column of A .
  • a . Column vector.
  • I . Identity matrix.
  • ⊙. Hadamard product.
  • ⊗. Kronecker product.
  • vec . means matrix vectorization.
  • f x . The first derivative of f x with respect to x .

2. Problem Formulation and Analysis

In this section, we first present the signal model of ULA under perturbation and derive the CRB and SCC, which are the crucial indicators for array reconstruction. Next, an optimization problem involving the mining CRB and suppression sidelobes by SCC is formulated to improve the DOA estimation performance of sparse array. Finally, we analyze the function’s behavior of the reconstruction model. The important notations in this paper and their meanings are shown in Table 1.

2.1. Signal Model

We consider a ULA operating at wavelength λ , which comprises M omnidirectional antennas. Consequently, the steering vector of ULA should be expressed as
v s = 1 , e j k 0 d sin θ , , e j k 0 M 1 d sin θ T
where θ is the DOA of s t , d = λ λ 2 2 means the spacing between adjacent antennas in ULA, and k 0 = 2 π 2 π λ λ . Additionally, arrays often suffer from perturbation errors. In this work, perturbation errors are modeled as gain errors and phase errors, represented by two diagonal matrices. Therefore, after radio frequency (RF) processing and digital sampling of a far-field signal s t with wavelength λ , the received signal of the ULA can be expressed as
s t = v ˜ s s t + n t v ˜ s = G Φ v s
where G and Φ are diagonal matrices of gain errors and phase errors respectively. The elements of G and Φ are G i , i = g i , Φ i , i = e j φ i , and g i N 0 , σ g 2 , φ i N 0 , σ φ 2 . n t = n 1 t n M t T is assumed to be the random additive white noise, n i t N 0 , σ n 2 , and i = 1 M .
When the ULA receives K snapshots of s t , Equation (2) should be expressed as
s = v ˜ s ˜ + n ˜
where v ˜ = v ˜ s , 1 T v ˜ s , k T T , v ˜ s , k is the steering vector of ULA at the k-th sampling instant in the presence of perturbation errors. s ˜ = [ s ( 1 ) s ( k ) ] 1 M × 1 , n ˜ = n T 1 n T k T , and k = 1 K .

2.2. Indicators for Array Reconstruction under Perturbation Errors

This section theoretically derives and simplifies CRB and SCC under the presence of perturbation errors in ULA. The CRB serves as a metric to evaluate the performance of DOA estimation, and the SCC measures the spatial correlation of the steering vector and can be utilized for sidelobe suppression. These two parameters are the essential parameters for the array reconstruction presented in this article.

2.2.1. CRB

As widely known, CRB serves as a crucial indicator for evaluating the performance of DOA estimation. However, in scenarios that the ULA is subject to perturbation errors, CRB is influenced not only by θ , but also by g = g 1 g M K T and φ = φ 1 φ M K .
According to Equation (3) and the section of stochastic error model in [25], the data covariance matrix can be expressed as
R ˜ = P s E v s H v s k = 1 K Γ k + σ n 2 I
where P s is the power of s t , σ n 2 is the power of noise, Γ k = γ k γ k T and γ k = g k e j φ k g k + M e j φ k + M T .
Thus, the FIM should be expressed as
J ˜ = J θ θ J θ g J θ φ J θ g T J g g + σ g 2 I J g φ J θ φ T J g φ T J φ φ + σ φ 2 I
where J x y = R ˜ 1 R ˜ x R ˜ 1 R ˜ y . Drawing on the computational process in [53], the elements in Equation (5) can be calculated as
J θ θ = Re Σ d ˜ θ H P ˜ V d ˜ θ T , J θ g = Re Σ d ˜ g H P ˜ V d ˜ θ T J θ φ = Re d ˜ θ H P ˜ V d ˜ φ Σ T , J gg = Re d ˜ g Σ d ˜ g H P ˜ V T J g φ = Re d ˜ g Σ d ˜ φ H P ˜ V T , J φ φ = Re d ˜ φ Σ d ˜ φ H P ˜ V T
where P ˜ V and Σ are
P ˜ V = I v ˜ v ˜ H v ˜ 1 v ˜ H Σ = K P s E k = 1 K v ˜ s , k H R ˜ 1 v ˜ s , k
In Equation (6), d ˜ θ , d ˜ g , and d ˜ φ represent the derivatives of v ˜ with respect to θ , g i and φ i respectively. Thus, Equation (8) can be derived
d ˜ θ = v ˜ θ = G Φ D v d ˜ φ = v ˜ φ i = j G Φ v i = 1 M K d ˜ g = v ˜ g i = Φ v i = 1 M K
where v = v s , 1 T v s , k T T , G = blkdiag G 1 G k , Φ = blkdiag Φ 1 Φ k and D = diag d .
d = j k 0 cos θ vec 0 , d , , M 1 d T 1 K × 1 T
Since g i N 0 , σ g 2 , v ˜ H v ˜ in Equation (7) can be calculated as
v ˜ H v ˜ = k = 1 K v ˜ s , k H v ˜ s , k = k = 1 K v s , k H G k 2 v s , k M K σ g 2 = ρ
Obviously ρ is a constant. In (4), Γ k i , j = g i g j e j φ i φ j , g i and φ i are the elements of G k and Φ k respectively. Since E k = 1 K Γ k = σ g 2 , i = j 0 , i j , R ˜ is a constant matrix, and Σ is a constant denoted as c. Then the elements in Equation (5) can be simplified,
J θ g = 0 1 × M J g φ = 0 M × M Λ g = J gg + σ g 2 I Λ φ = J φ φ + σ φ 2 I
We postulate that the phase perturbation error σ φ 2 0 , π π 18 18 2 0 , 0.03 , thus Λ φ σ φ 2 I . By substituting Equation (11) into Equation (5), a general expression of CRB for single source under the condition that ULA with perturbation errors can be expressed as:
C θ = 2 c σ n 2 d ˜ θ H P ˜ V d ˜ θ c J θ φ T Λ φ J θ φ 1
Since 2 c σ n 2 is a constant, the primary factor influencing the DOA estimation performance of ULA is d ˜ θ H P ˜ V d ˜ θ c J θ φ T Λ φ J θ φ . Equation (12) reveals that d ˜ θ H P ˜ V d ˜ θ c J θ φ T Λ φ J θ φ is related to the structure of ULA.
According to Equations (6) and (8), d ˜ θ H P ˜ V d ˜ θ can be calculated as:
d ˜ θ H P ˜ V d ˜ θ = k 0 2 cos 2 θ v s H T 1 v s v s H T 2 v s 2 v s H T 2 v s 2 ρ ρ
where T 1 = k = 1 K G k 2 T d 2 , T 2 = k = 1 K G k 2 T d , T d = d i a g d ¯ , and d ¯ = 0 , d , , M 1 d T .
J θ φ T Λ φ J θ φ can be simplified as:
J θ φ T Λ φ J θ φ = k 0 2 cos 2 θ σ φ 2 · v s H T 3 v s 2 v s H T 2 v s t 2 T α v s H T 2 v s t 2 T α ρ ρ + v s H T 2 v s 2 α T α v s H T 2 v s 2 α T α ρ ρ
where T 3 = k = 1 K G k 4 T d 2 , t 2 = T 2 1 , 1 T 2 M , M T , α = G ^ 1 , 1 G ^ M , M T and G ^ = k = 1 K G k 2 . Based on Equations (12)–(14), the CRB can be expressed as:
C θ = ς a c σ φ 2 b 1
where ς = 2 c ρ σ n 2 , a = ρ v s H T 1 v s v s H T 2 v s 2 , and b = ρ v s H T 3 v s 2 v s H T 2 v s t 2 T α + v s H T 2 v s 2 α T α . It is evident that CRB is influenced by SNR, θ and a c σ φ 2 b , where a c σ φ 2 b is associated with the array structure. Hence, in array reconstruction, maximizing a c σ φ 2 b can achieve optimal DOA estimation performance.

2.2.2. SCC

In previous work [46,47,48,49] proposed that SCC is a bounded parameter to measure the spatial correlation between the desired signal and the sidelobes signal, and thus, SCC can be utilized to suppress sidelobes in array reconstruction. In non-ideal conditions, we introduced a sidelobes signal j t with the DOA being ϕ . The steering vector of j t is described as
v ˜ j = G Φ v j
where v j is the steering vector of j t in ideal condition. Thus, the SCC with perturbation error should be defined as
SCC = Δ κ = v ˜ j H v ˜ s v ˜ j H v ˜ j v ˜ s H v ˜ s 2

2.2.3. Reconstruction Model of ULA with Perturbation Errors

The prior research has pointed out that array reconstruction based solely on the CRB often exhibits high sidelobes [44,45]. In DOA estimation, sidelobes can be considered as interference, thus SCC can be employed as the constrain in array reconstruction model. Since the steering vectors v s and v j satisfy v s H v s = v j H v j = M , the matrices T 1 , T 2 , and T 3 in Equations (13) and (14) are all diagonal matrices. Equation (18) is introduced to simplify the representation of the CRB in a sparse array, recasting it as an array reconstruction problem involving the selection of elements. In Equation (18), v represents any M-dimensional vector satisfying v H v = M , 1 is an M-dimensional vector with all elements being 1, and P is any M-dimensional diagonal matrix.
v H P v = 1 T P 1 = 1 T p p = P 1 , 1 P M , M T v H P v 2 = 1 T P ¯ 1 P ¯ = p p T
Let x be a selection vector of dimension M, with L elements set to 1 and the remaining elements set to 0, where L < M . Similar to the elements a and b of CRB in Equation (15), they can be expressed as a function of x in the reconstruction model, based on Equation (18).
a ¯ x = ρ x T t 1 x T Q 1 x b ¯ x = ρ x T t 3 2 x T Q 2 x + x T Q 1 x x T Q 3 x t i = T i 1 , 1 T i M , M T i = 1 , 2 , 3 Q 1 = t 2 t 2 T Q 2 = t 2 α t 2 T Q 3 = G ^ 2
Thus, the objective function for reconstructing a sparse array that achieves the best DOA estimation performance is given by
max x a ¯ x c σ φ 2 b ¯ x
Similarly, by expressing Equation (17) as a function of x , Equation (21) can be obtained.
κ x = x T k = 1 K W k x / x T k = 1 K G ^ k x W k = Re v j s k v j s k H v j s k = v ˜ j k v ˜ s k
where κ x represents the expression of SCC under array perturbation error, and κ x 0 , 1 has been demonstrated in [46,47,48,49]. By setting a threshold δ for κ x , the model for reconstructing ULA can be formulated as
min x a ¯ x c σ φ 2 b ¯ x s . t . x 0 , 1 M x T x = L κ x δ
In Equation (22), minimizing the CRB to obtain the best DOA estimation performance of sparse array is equivalent to minimizing a ¯ x c σ φ 2 b ¯ x because the CRB is the inverse of the FIM. The constraint κ x δ enables the sparse array to exhibit improved sidelobe suppression performance, and x T x = L implies L elements are selected from ULA with M to elements construct sparse array.
The Hessian matrix of f x = a ¯ x c σ φ 2 b ¯ x can be calculated as:
H x = Q ¯ 1 + c σ φ 2 2 Q ¯ 2 + q 3 Q ¯ 1 + Q ¯ 1 x x T Q ¯ 3 + q 1 Q ¯ 3 + Q ¯ 3 x x T Q ¯ 1
where Q ¯ n = Q n + Q n T , q n = x T Q n x > 0 n = 1 , 2 , 3 . Since the elements in t 2 , α , x and diagonal matrix Q ¯ 3 are all greater or equal to 0, which make the elements of Q ¯ 1 , Q ¯ 2 , Q ¯ 3 , Q ¯ 1 x x T Q ¯ 3 and Q ¯ 3 x x T Q ¯ 1 are all greater than or equal to 0. Besides, the sum of eigenvalues of matrix is equal to the trace of this matrix, t r 2 c σ φ 2 Q ¯ 2 makes it cannot determine the sign of t r H x . On the other hand, although Q 1 and Q 2 are all rank −1 matrices with non-negative eigenvalues, there is no guarantee that the rank of Q ¯ n is 1. Consequently, even when t r H x > 0 , it cannot be ensured that every eigenvalue of H x is non-negative. Thus, it cannot be guaranteed that H x in Equation (23) is a positive semidefinite matrix, and make the objective function in Equation (22) non-convex. Furthermore, the SCC constraint specified in Equation (21) is also non-convex. In summary, the reconstruction model Equation (22) represents a non-convex problem.

3. Solution of Reconstruction Model

In this section, we employ convex approximation and block-wise algorithms to obtain the optimal approximate solution, and analyze the convergence and complexity of the proposed algorithm.
Let g x represent the Taylor approximation of f x at x 0 .
g x = f x 0 + x x 0 T f x x = x 0 f x = ρ t 1 + Q ¯ 1 x + c σ φ 2 ρ t 2 2 Q ¯ 2 x + q 3 Q ¯ 1 x + q 1 Q ¯ 3 x
And we construct an upper bound function of g x , denoted as g ¯ x .
g ¯ x = g x + x x 0 T x x 0
Additionally, since κ x δ represents a non-convex constraint, we also need to relax this constraint as
0 x T k = 1 K W k δ k = 1 K G ^ k + ζ I x ζ L
and for binary constraints, we relax x 0 , 1 M to be x 0 , 1 and 1 T x = L .
Therefore, Equation (22) can be approximated as minimizing the upper bound function g ¯ x .
min x g ¯ x s . t . 0 x T k = 1 K W k δ k = 1 K G ^ k + ζ I x ζ L 1 T x = L
Equation (27) is a convex Quadratically Constrained Quadratic Programming (QCQP) with a unique optimal solution. The subsequent theorem will demonstrate that the optimal solution of Equation (27) is also the optimal approximate solution for Equation (22).
Theorem 1.
As for the non-convex function  f x , within the constraint within the feasible region C, when  x ^ satisfies
y x ^ T f x ^ 0 y C
  f x ^  attains its stationary point, where  x ^  represents a solution of Equation (27).
Proof. 
For  x , y C  and  0 η 1 , according to the Mean Value Theorem for Taylor series, there exists a constant  ξ 0 , 1  such that Equation (29) holds.
f x + η y x = f x + η f x + ξ η y x T y x
Since  f x  is a differentiable function, we have
f 1 η x + η y 1 η f x + η f y
By substituting Equation (30) into (29), Equation (31) can be obtained.
f y f x + f x + ξ η y x T y x = f x + f x T y x η 0
Assuming  x = x ^ C  is the optimal approximate solution of (22), then by further simplifying Equation (31), we obtain  f x ^ T y x ^ T = 0 . When the solution  x ^  of Equation (27) satisfies Equation (28),  f x ^  achieves its stationary point. □
Theorem 1 demonstrates that when the solution x ^  of Equation (27) satisfies Equation (28), this solution corresponds to the solution of Equation (22). Thus, solving the problem of Equation (22) involves updating x 0  in Equations (24) and (25) and iteratively solving Equation (27) until a solution satisfying Equation (28) is found.
The TABI Algorithm:
Step 1:
Based on Equation (32), compute the initial value x i n i t i a l = x 0  and set the threshold λ .
min x 0 x 0 T k = 1 K W k δ k = 1 K G ^ k x 0 s . t . 1 T x 0 = L
Step 2:
Calculate Equations (24) and (25), solve Equation (27), and denote the solution of Equation (27) as x ^ n .
Step 3:
Compute the minimum value of (27) using x ^ n  and denote it as η n .
Step 4:
If 0 η n < ϑ  and x ^ n T k = 1 K W k δ k = 1 K G ^ k x ^ n < 0 , output the solution x ^  and exit; otherwise, assign x i n i t i a l = x ^ n  and return to Step 2 for iteration.
Equation (32) outlines a method for selecting initial values, which ensures that x 0  falls within the constraint interval to prevent infeasible solutions. When Equation (22) attains its optimal approximate solution, lim x x ^ f x T y x = 0 . By setting a smaller threshold λ , we can facilitate the TABI algorithm in approaching the solution of Equation (22) closely.
Next, we present Theorem 2, demonstrating that the iteration of the TABI algorithm converges to the solution of Equation (22).
Theorem 2.
Utilizing TABI for solving Equation (22) can converge to the optimal approximate solution.
Proof. 
f x g x  and  g ¯ x  are continuously differentiable within C. Furthermore, since  g x  is a Taylor approximation of  f x  at  x n  and  g ¯ x  is a upper bound function of  g x  at  x n , it follows that  g ¯ x n = g x n = f x n  within C. Additionally,  C r C  such that  g ¯ x f x , x r C r .
Let  h x = g ¯ x f x , x C r , when  h x  attains its optimal value,  x = x n . At this time, there exists  h x n = g ¯ x f x n = 0  and  g ¯ x n = g x n = f x n . The above analysis demonstrates that the following conditions are satisfied.
C1:
Equation (22) has stationary point.
C2:
The convex approximation problem Equation (27) is a QCQP with a unique optimal solution.
C3:
f x , g x  and g ¯ x  are continuously differentiable within the constraint C.
C4:
x n C , g ¯ x n = f x n .
C5:
C r C , g ¯ x f x .
C6:
x n C r , g ¯ x n = f x n .
Let the number of iterations in TABI be denoted as  n = 1 r , then Equation (33) can be obtained from C1.
f x 1 f x 2 f x r
Denote the stationary point of Equation (22) as  z . Based on the continuity in C3, (34) can be gotten.
lim r f x r = f z
Therefore, the convergence of TABI essentially lies in proving that the solution of the sub-optimization problem in Equation (27) can converge to  z . For ease of notation, we represent Equation (27) as
x r = arg min x C r g ¯ r x
Then, the convergence of TABI is equivalent to demonstrating that  x r + 1 z .
In the course of proving, we adopt the method of contradiction. Assuming that  x r + 1  cannot converge to  z , let  γ ¯ > 0 , and then establish Equation (36)
γ ¯ = x r + 1 x r , r
Normalize the error of two consecutive iterations and denote it as:
s r = . x r + 1 x r γ ¯
Clearly,  s r = 1 . Hence,  s r  is a bounded set with the existence of an extremum  s ¯ r . By leveraging this property in conjunction with C4 and C5, we can obtain
f x r + 1 g ¯ r + 1 x r + 1 = g ¯ r x r + γ ¯ s r g ¯ r x r + ε γ ¯ s r , ε 0 , 1 g ¯ r x r = f x r
When the number of iterations  r ,
f z g ¯ r x r + ε γ ¯ s ¯ r f x r , ε 0 , 1
Since C1,  lim r f z = f x r . Then
f z = g ¯ r x r + ε γ ¯ s ¯ r , ε 0 , 1
Based on C2, Equation (40) can be written as
g ¯ r x r + ε γ ¯ s ¯ r = f x r f x r 1 g r x r 1
According to C4, we can simplify Equation (41) as
g ¯ r x r + ε γ ¯ s ¯ r = g ¯ r x r + 1 = f z g ¯ r z x r + 1 z , x r C r
where  C r  represents the set of optimal solutions when  g r x  achieves the minimum value, and  C r C . Equation (42) demonstrates that the aforementioned proposition does not hold, hence  x r + 1  can converge to  z .
Typically, in the n-th iteration ( n < r ), even though  g ¯ n x  achieves the optimal value, the optimal solution  x n  corresponding to  f x n  is not  z . Then, we can obtain
f z f x n , x n C n , n = 1 r
Based on C4 and C5, Equation (43) can be written as
f z g ¯ n x n = f x n < g ¯ x , x n C n
According to Equations (37), (41), (42) and (44), it can be observed that as  C n  undergoes continuous updates, the optimal solution of Equation (27) gradually converges to the optimal solution of Equation (22). □
In terms of complexity analysis, we take into account both array reconstruction and DOA estimation. When reconstructing the array using the TABI algorithm, the Step 1 involves solving Equation (32), which is a quadratic programming (QP) problem. According to [52], the complexity of solving Equation (32) is O M 2 . Since Equations (24) and (25) in Step 2 involve matrix multiplication operations, their complexity can be neglected. Furthermore, since Equation (27) represents a QCQP subproblem, its complexity is also O M 2 . In Step 3, calculating the value of the objective function in Equation (27) is also a matrix multiplication operation. Step 4 utilizes the output of Step 3 as the iterative decision criterion to determine whether to exit the loop. Since TABI belongs to the block coordinate descent (BCD) method, according to [53], the number of iterations of TABI is related to the threshold ϑ , so the total number of iterations of TABI is at most log 1 1 ϑ ϑ . The complexity of reconstructing array based on TABI is O M 2 + log 1 1 ϑ ϑ · M 2 . As for DOA estimation, we take the Multiple Signal Classification (MUSIC) algorithm as an example for analysis. Due to its involving covariance matrix, matrix decomposition, and angle search, the complexity is O M 3 . After array reconstruction, the number of array elements involved in DOA estimation is L L < M . Consequently, the overall computational complexity of the proposed method is O M 2 + L 3 + log 1 1 ϑ ϑ · M 2 , which is significantly lower than that of the original ULA, since log 1 1 λ λ M .
In summary, this study proposes not only an array reconstruction model for ULA with perturbation errors, but also the TABI algorithm specifically designed to solve this model. The TABI algorithm constructs an upper-bound function based on Taylor expansion to approximate the nonconvex objective function and relax the nonconvex constraints. Through iterative updates of initial values and objective functions, the algorithm gradually approaches and ultimately converges to an optimal approximate solution that satisfies the convergence criteria. Theorem 2 further verifies that the iterative strategy adopted by the TABI algorithm effectively converges to the solution of the original problem. Additionally, the utilization of the TABI algorithm for array reconstruction significantly reduces system complexity, thereby enhancing overall performance.

4. Numerical Simulations

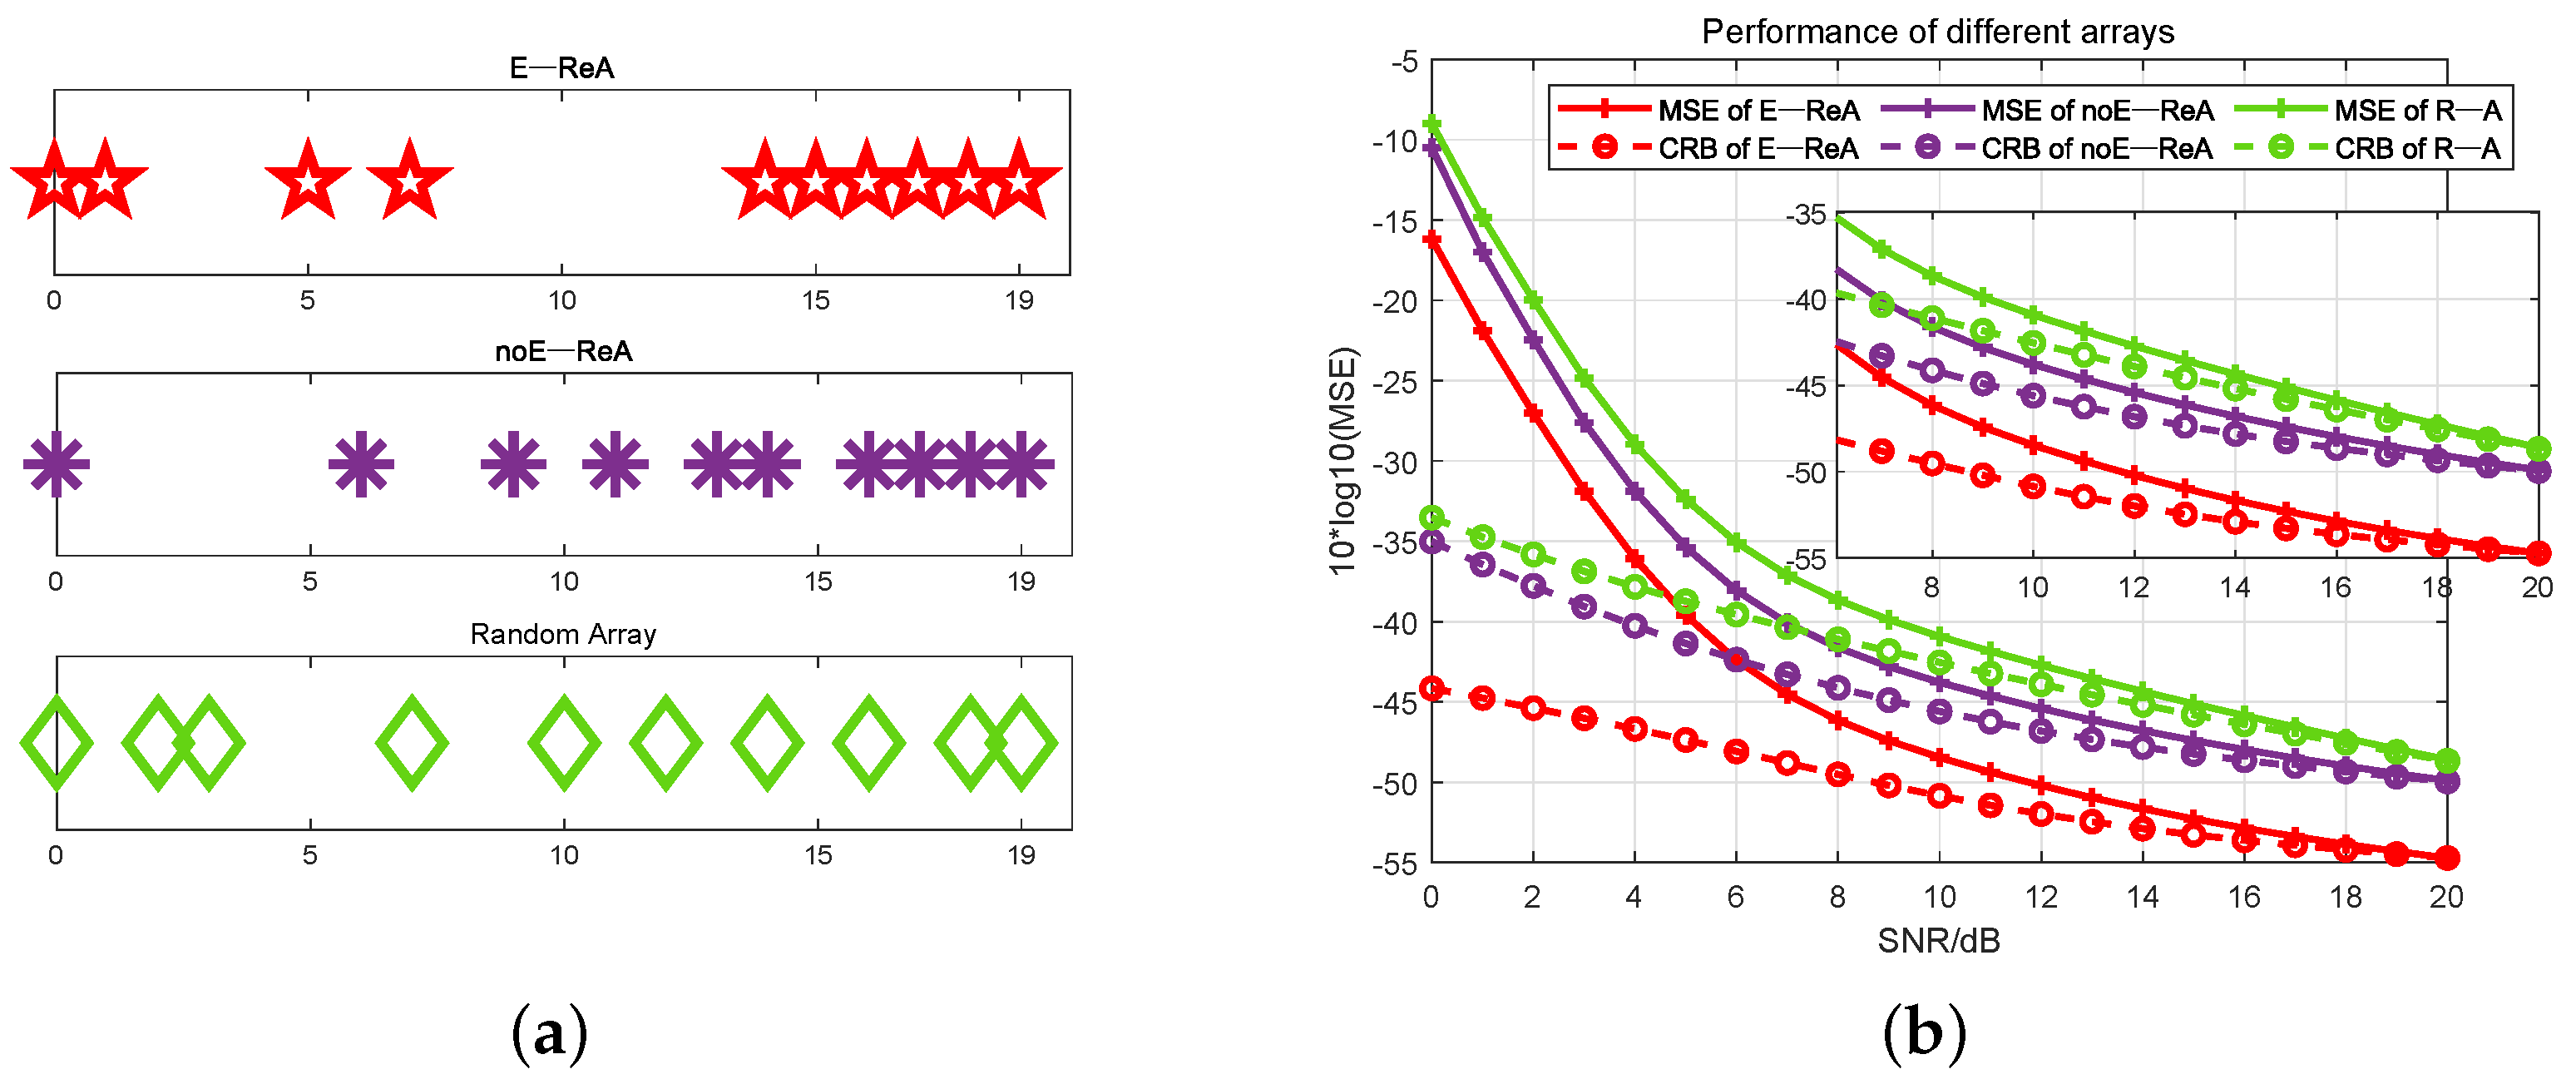
In this section, we compare the performances of different arrays in the presence of perturbation errors. In subsequent experiments, FM is the signal source, and the MUSIC algorithm and compressive sensing (CS) methods are chosen as the approaches for DOA estimation. Firstly, we employ the MUSIC algorithm to estimate the DOA for FM based on E-ReA and ULA. A comparison is made between the mean square error (MSE) and the CRB of those arrays to demonstrate that the proposed sparse array can achieve satisfactory performance using only half of the array elements. Subsequently, in evaluating the performances of sparse arrays, we compare the DOA estimation performances of E-ReA, noE-ReA (mentioned in [50], which enhances the performance of sparse arrays through the structural design of adaptive sparse arrays under ideal condition), and randomly generated sparse arrays (R-A). The results demonstrate that E-ReA exhibits the best estimation performance. Furthermore, the main lobe in the beam pattern of E-ReA is narrower than that of noE-ReA. Finally, to analyze the robustness of the DOA estimation performance, we examine the MSE of E-ReA and noE-ReA, considering variances of different errors and the application of different DOA estimation algorithms in non-uniform sparse arrays. Experimental results indicate that, in the presence of array perturbation errors, E-ReA exhibits improved robustness.
In the following experiments, the signal model of FM source is
s ( t ) = A cos 2 π f c t + m f · sin 2 π f m t
where the carrier frequency f c = 105 MHz, the frequency modulation index m f = 10 and the baseband frequency f m = 1 k Hz . The number of elements in ULA and sparse arrays are M = 20 and L = 10 respectively. The formula employed for calculating MSE is given by
MSE = 1 N i = 1 N θ θ ^ 2
where N represents the number of Monte Carlo simulations, and it is set to 1000. θ refers to the true DOA, whereas θ ^ denotes the estimated DOA. In all Monte Carlo simulation experiments, 1000 statistical trials are conducted for each time the parameter is changed. Additionally, we fix the DOA of FM at 30 , excluding the random angle experiments described in Section 4.3.

4.1. Comparison of E-ReA and ULA

In experiments, the variances of g i and φ i are 0.4 and π π 36 36 respectively. Figure 1a illustrates the results of DOA estimation using ULA and E-ReA based on MUSIC, with an SNR of 10 dB. It is evident from these results that although the number of elements is significantly reduced by half compared to the ULA, the E-ReA demonstrates remarkable capabilities in estimating DOA. And the reliability performance is qualitatively analyzed under different SNRs. The SNR is varied from 0 dB to 20 dB, and a Monte Carlo experiment is conducted at various SNR levels. Figure 1b demonstrates that, when the SNR is 0 dB, the CRB of E-ReA exhibits a performance loss of 2.64 dB compared to ULA. As the SNR increases, both the estimation variance of E-ReA and ULA converge towards the CRB. Specifically, when the SNR reaches 20 dB, E-ReA exhibits only a minor performance loss of 1.53 dB compared to ULA.

4.2. Comparison of Sparse Arrays

This subsection explores the performances of DOA estimation among various sparse arrays. The variances of perturbation errors are same as those mentioned in Section 4.1. Figure 2a details the structure of three arrays: E-ReA, noE-ReA, and R-A. These three arrays are composed of 10 elements and maintain the same array aperture. In Figure 2b, we present the analysis of the MSE and CRB of DOA estimation. Obviously, regardless of the variation in SNR, E-ReA exhibits the best DOA estimation performance among different arrays, and has obtained a significant improvement of 5.63 dB compared to noE-ReA.
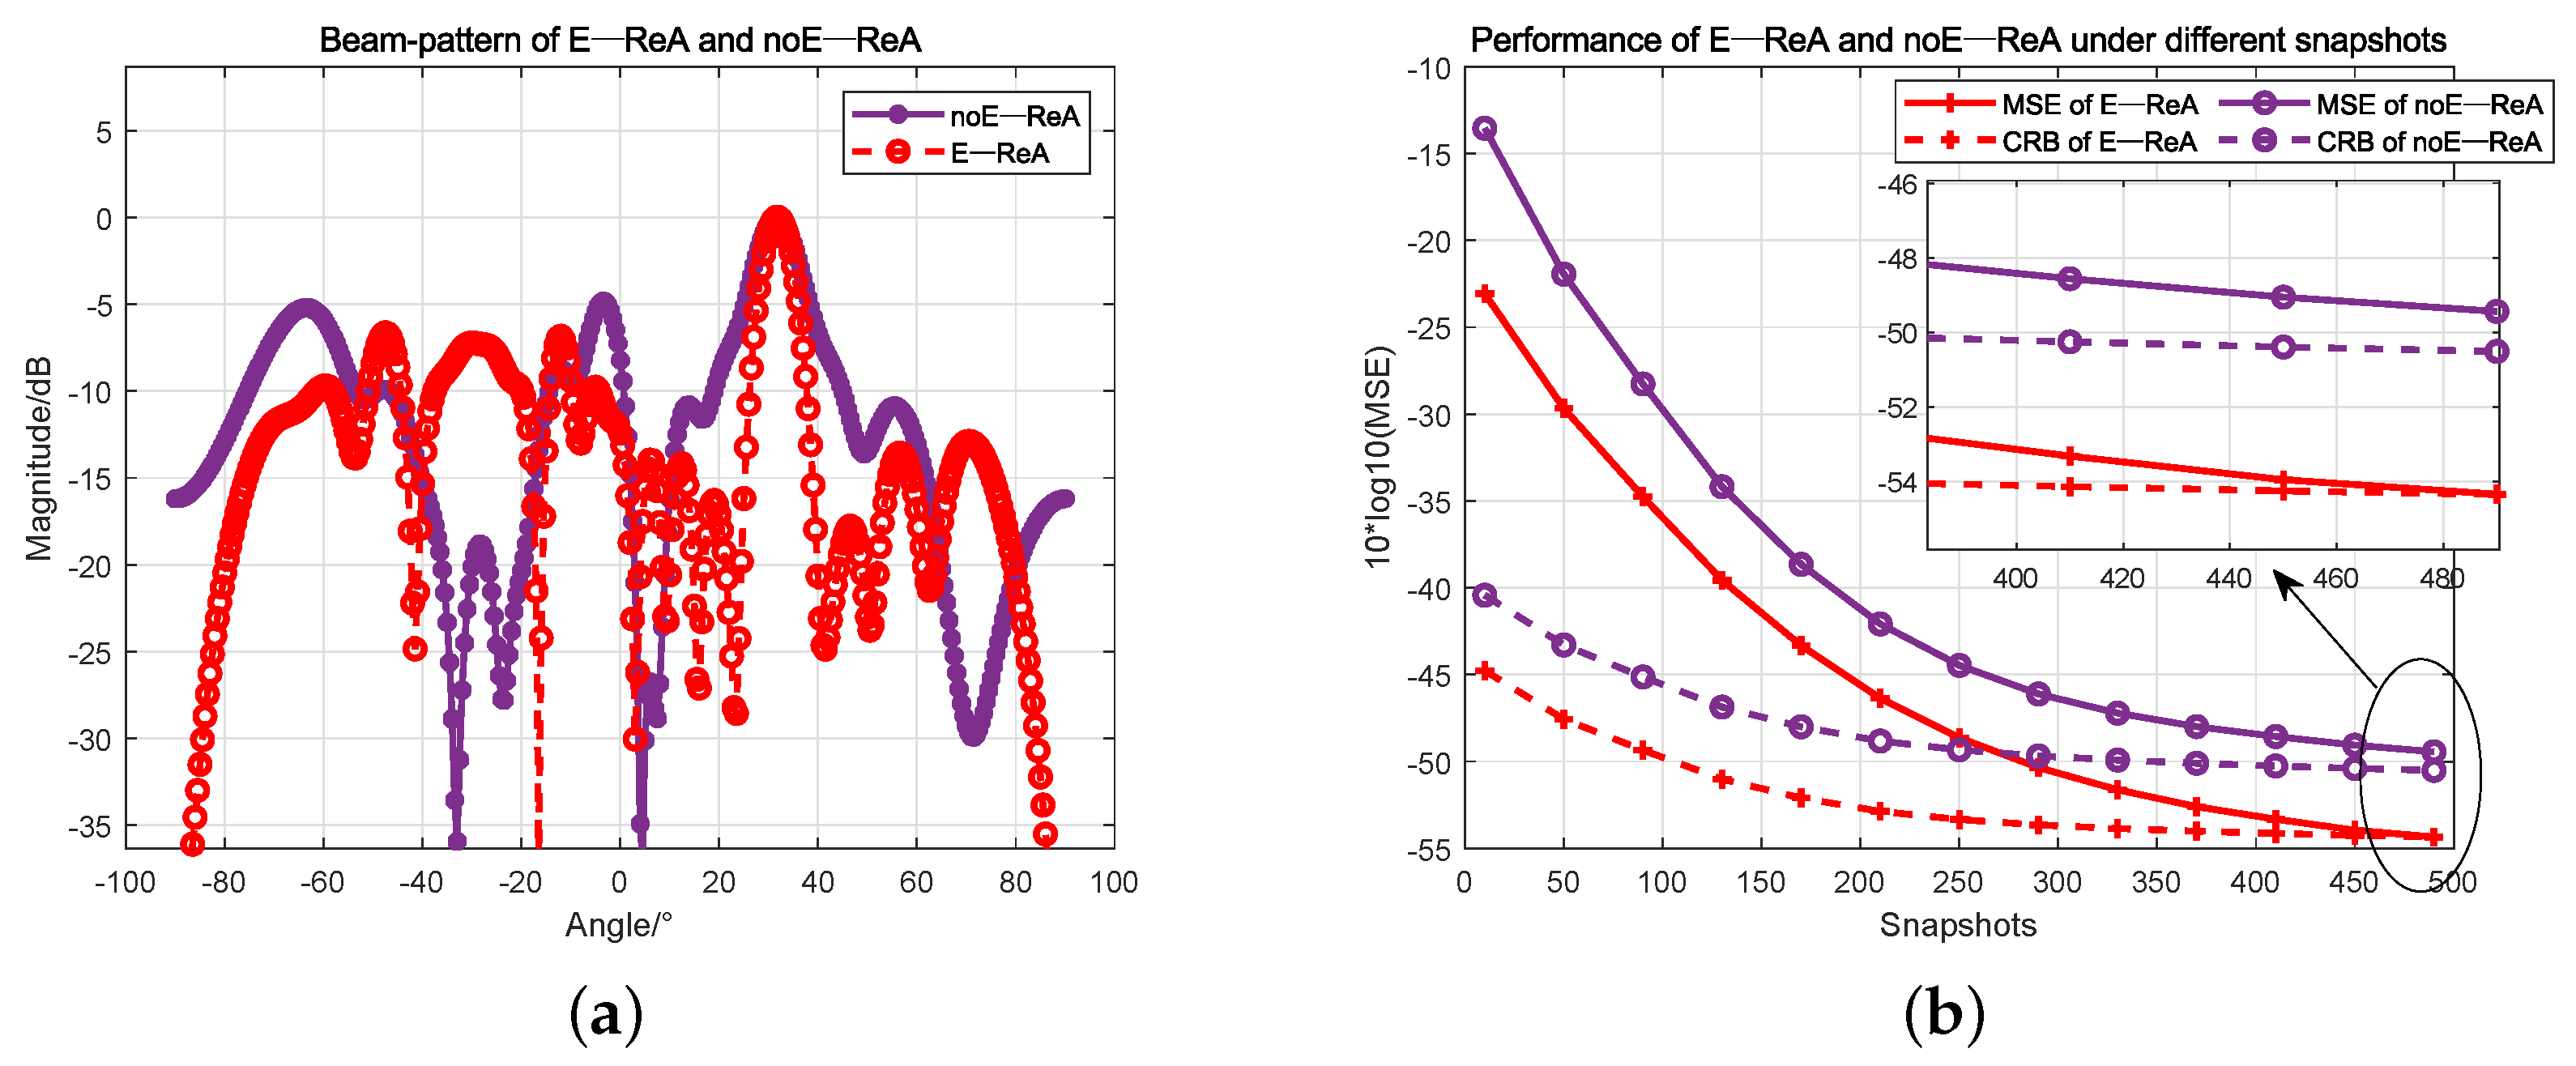
Figure 3a presents the directional patterns of E-ReA and noE-ReA. Here, E-ReA exhibits a narrower main lobe width and lower sidelobes in the vicinity of the DOA of s t , thus indicating its superior directivity. Since the number of snapshots is a factor that affects DOA estimation, we conduct an experiment to investigate its impact. In the experiment, the variances of perturbation errors are same as those mentioned in Section 4.1 and set the SNR to 10 dB. The range of snapshot counts is selected from 10 to 500. The experimental results are depicted in Figure 3b. It is evident from the results that the CRB of E-ReA is 4.34 dB lower than that of noE-ReA. Furthermore, E-ReA consistently exhibits lower MSE, indicating its superior performance.

4.3. Investigation of Robustness

In the robustness analysis experiment, we first maintain the variance of perturbation errors consistent with the previous experiments, and then randomly generate 10 sets of DOAs for FM. The MSE for E-ReA and noE-reA are presented in Table 2 to evaluate the robustness.
As can be observed from Table 2, the MSE of E-ReA consistently remains lower than that of noE-ReA, indicating that the DOA estimation performance of E-ReA is superior to noE-ReA across all angles.
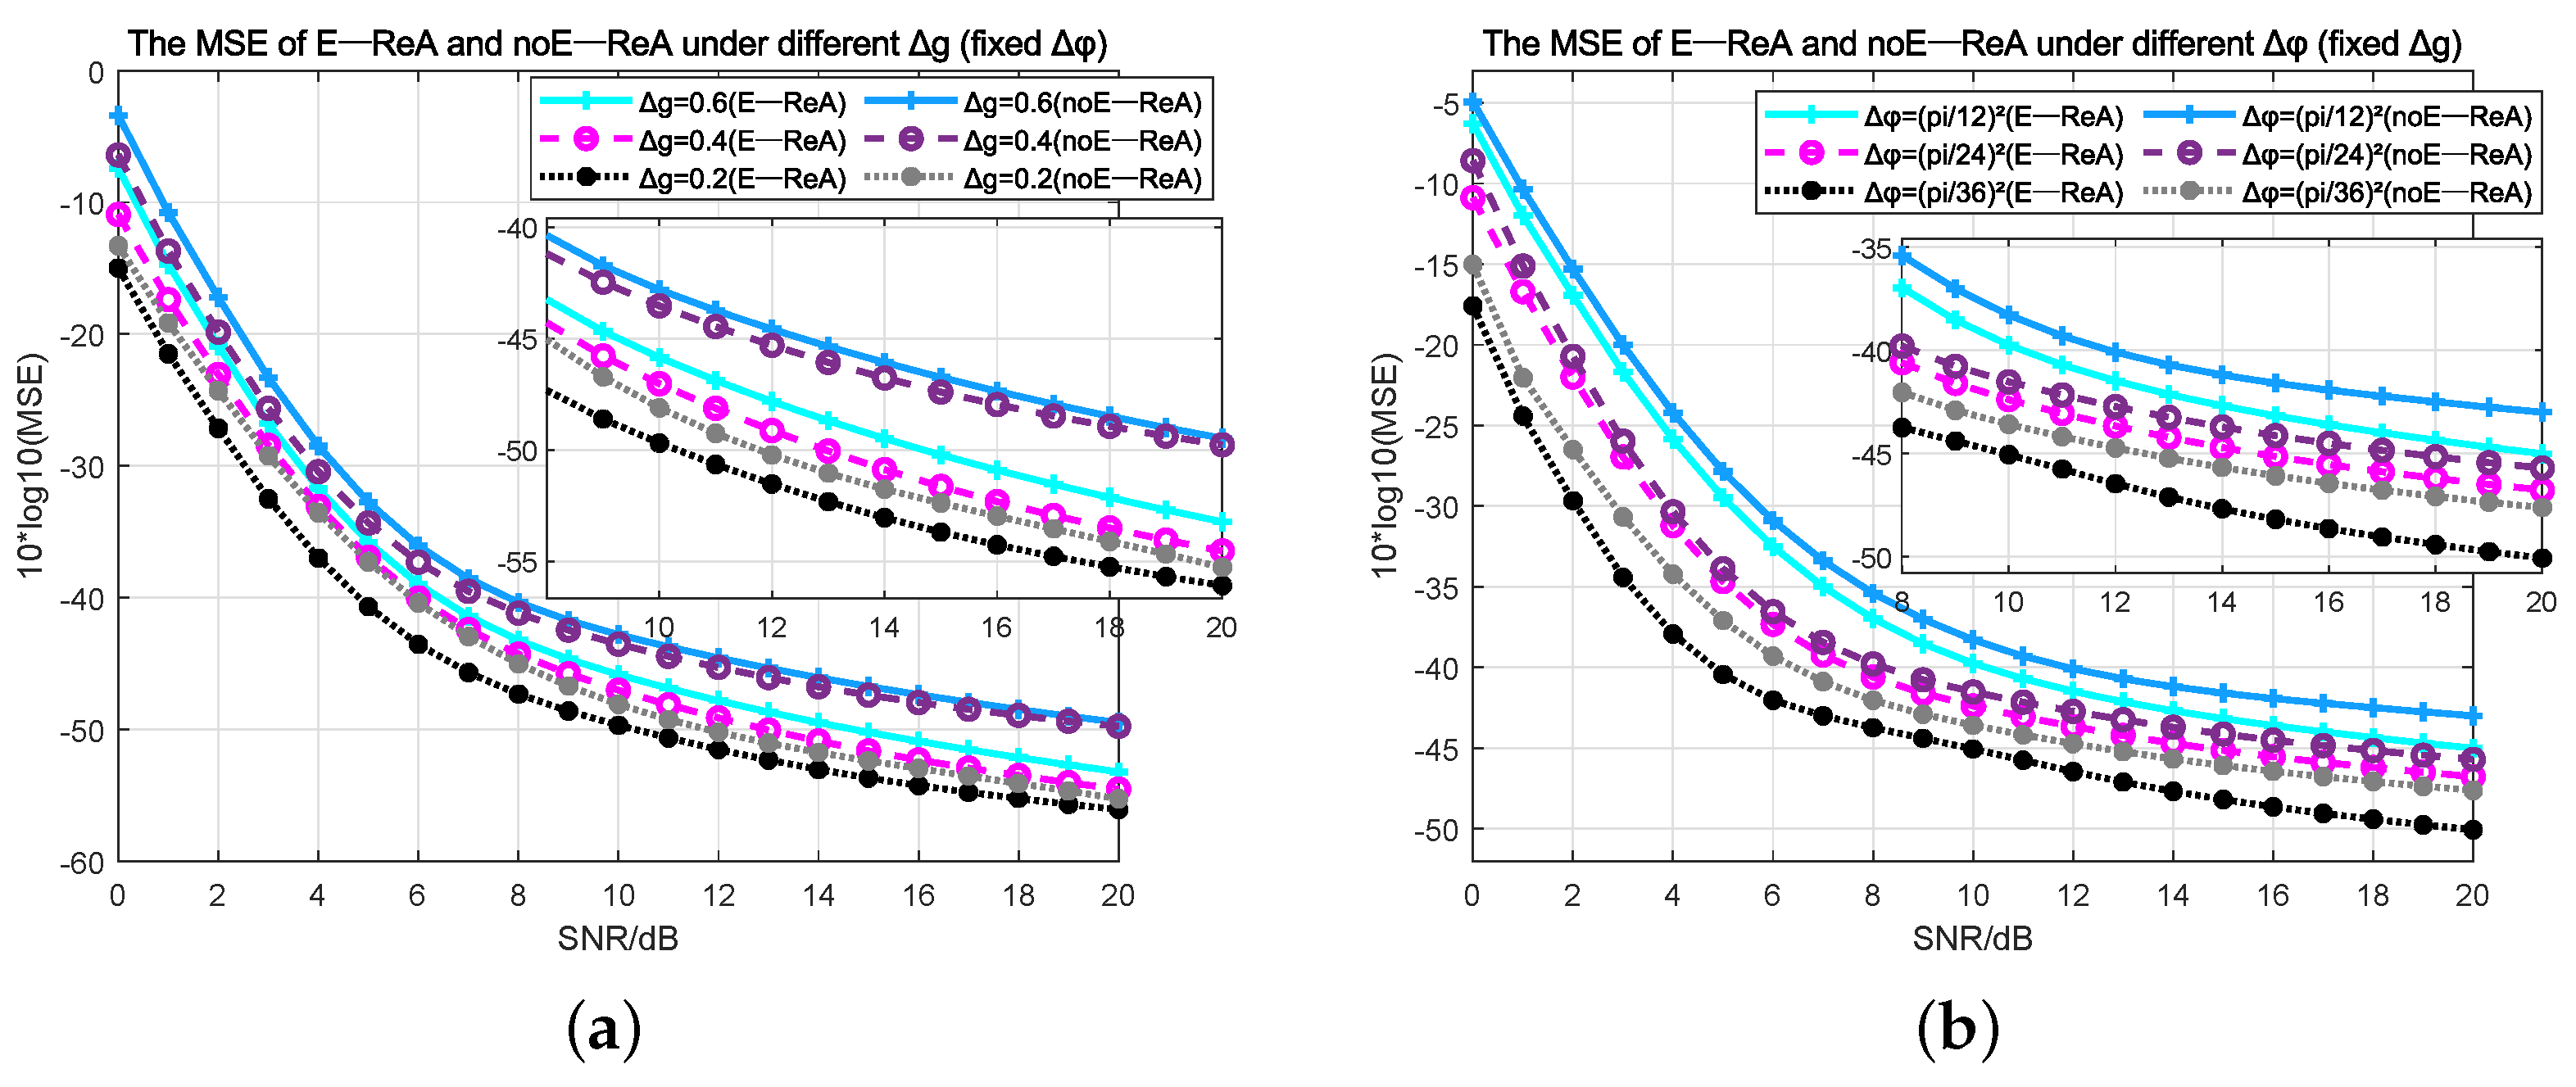
Then, we fix the variance of φ i at π π 36 36 , while varying the variances of g i to 0.2 , 0.4 , and 0.6 , respectively. The experimental results are depicted in Figure 4a. It is evident that the performance of both E-ReA and noE-ReA declines as the variance of g i increases. Overall, across varying variances of g i , E-ReA exhibits a performance improvement of 4 dB compared to noE-ReA.
Next, we keep the variance of g i fixed at 0.4 while varying the variances of φ i to π π 12 12 , π π 24 24 , and π π 36 36 respectively. The experimental results under different variances of φ i are depicted in Figure 4b. It can be seen that the performance of both E-ReA and noE-ReA decreases as the variance of φ i increases. E-ReA consistently outperforms noE-ReA, which aligns with the conclusions drawn from the analysis of the influence of the variance of g i .
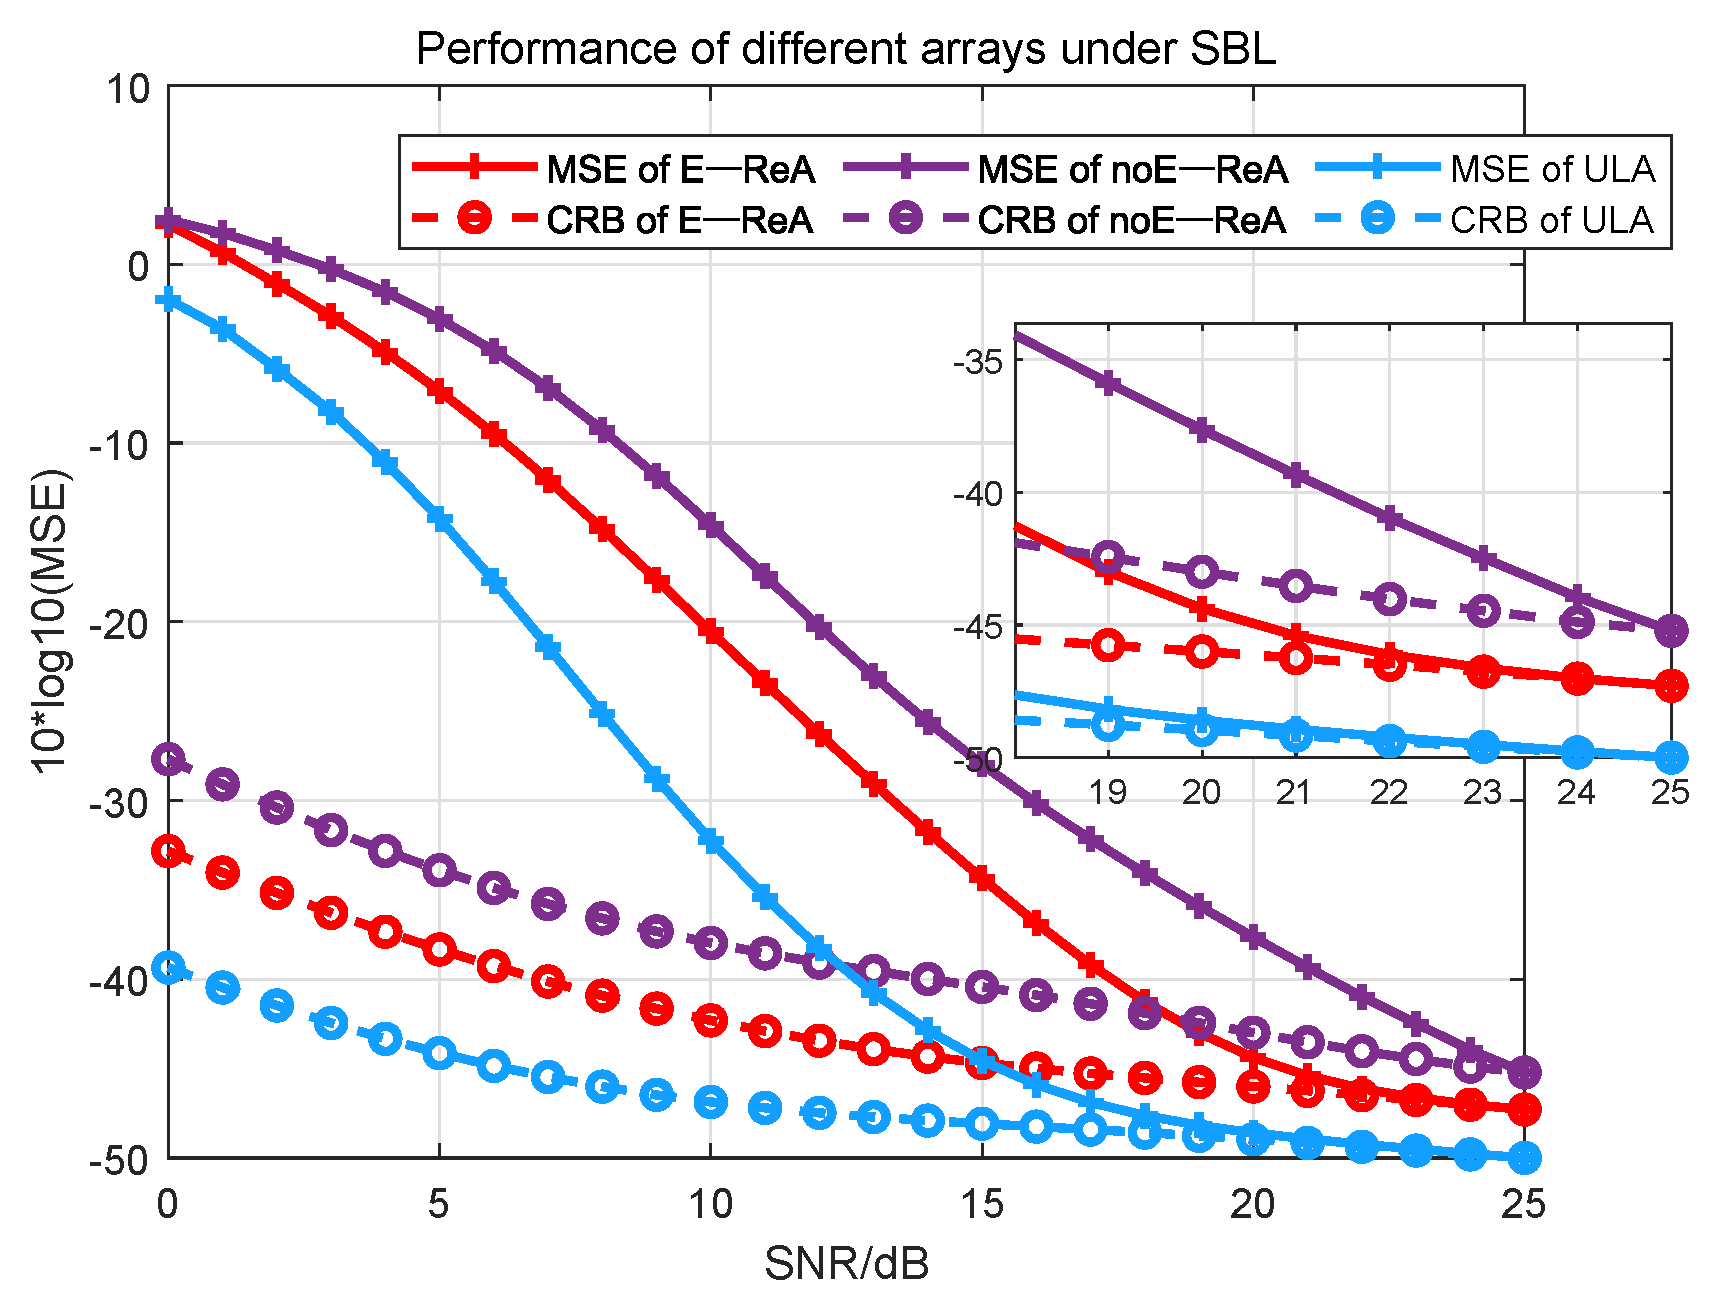
To evaluate the suitability of different DOA estimation algorithms for different arrays, a CS algorithm is employed. In the experiments, the variances of perturbation errors are same as those mentioned in Section 4.1. The Sparse Bayesian Learning (SBL) algorithm [12] is employed for DOA estimation. As illustrated in Figure 5, it is evident that in the presence of perturbation errors in the array, the SBL algorithm can only ensure accurate DOA estimation under conditions of high SNR. As the SNR gradually increases, the MSEs of both E-ReA and ULA are able to rapidly approach their respective CRBs. However, noE-ReA requires a significantly higher SNR to converge to its CRB. Furthermore, it is noteworthy that within the application of the SBL algorithm, E-ReA exhibits a 2.6 dB performance enhancement over noE-ReA.

5. Conclusions

This study explores the efficient and reliable reconstruction of ULA in the presence of perturbation errors. The objective is to accurately obtain the DOA of terrestrial SOP transmitters, thereby accurately locating the SOP. Initially, we calculate and simplify the CRB and SCC of the ULA affected by perturbation errors. The CRB serves as a crucial metric for evaluating the performance of DOA estimation in arrays, while the SCC assesses the interference suppression capabilities of the array. The combined utilization of these two parameters not only enhances the overall performance of DOA estimation but also significantly eliminates high sidelobes in the directional patterns of reconstructed non-uniform sparse arrays, thereby reducing the complexity of DOA estimation. Subsequently, recognizing that the reconstruction model inherently poses a high-order 0–1 optimization problem, we specifically propose the TABI algorithm for its solution. This algorithm adopts the approach of continuous convex approximation, construction of upper bound functions, and design of convergence criteria to transform the original non-convex problem into an iteratively solved convex problem, ensuring the feasibility and stability of the optimization model. Furthermore, through a thorough analysis of the TABI iterative process, we demonstrate the algorithm’s convergence to the optimal approximate solution of original reconstruction model. Finally, we comprehensively evaluate the performance of E-ReA through a series of simulation experiments. The results demonstrate that E-ReA significantly outperforms other sparse arrays, achieving an enhancement of up to 5 dB compared to the noE-ReA. Additionally, experimental results based on the CS DOA estimation algorithm further underscore the adaptability of E-ReA to different DOA estimation techniques, firmly establishing the preeminence of the TABI algorithm in reconstructing ULA.

Author Contributions

In this study, R.L. and H.X. conceived the idea, designed the experiments, and wrote this paper. F.G. performed experiments and analyzed data. All authors have read and agreed to the published version of the manuscript.

Funding

This work was supported in part by the National Natural Science Foundation of China under Grant 62371022.

Data Availability Statement

Dataset available on request from the authors.

Acknowledgments

The authors of this work express their gratitude to the National Natural Science Foundation of China (Grant No. 62371022) for the financial support of this research..

Conflicts of Interest

The authors declare no conflicts of interest.

References

  1. Morton, Y.; Diggelen, F.; Spilker, J.; Parkinson, B.; Lo, S.; Gao, G. Position, Navigation, and Timing Technologies in the 21st Century: Integrated Satellite Navigation, Sensor Systems, and Civil Applications; John Wiley and Sons: Hoboken, NJ, USA, 2021; Volume 1. [Google Scholar]
  2. Psiaki, M.; Slosman, B. Tracking digital FM OFDM signals for the determination of navigation observables. NAVIGATION J. Inst. Navig. 2022, 69, navi.521. [Google Scholar] [CrossRef]
  3. Yang, C.; Soloviev, A. Mobile positioning with signals of opportunity in urban and urban canyon environments. In Proceedings of the 2020 IEEE/ION Position, Location and Navigation Symposium (PLANS), Portland, OR, USA, 20–23 April 2020; pp. 1043–1059. [Google Scholar]
  4. Neinavaie, M.; Khalife, J.; Kassas, Z.M. Cognitive opportunistic navigation in private networks with 5G signals and beyond. IEEE J. Sel. Top. Signal Process. 2021, 16, 129–143. [Google Scholar] [CrossRef]
  5. Abdallah, A.A.; Kassas, Z.M. UAV navigation with 5G carrier phase measurements. In Proceedings of the 34th International Technical Meeting of the Satellite Division of The Institute of Navigation (ION GNSS+ 2021), Online, 20–24 September 2021; pp. 3294–3306. [Google Scholar]
  6. Nguyen, A.A.; Shadram, Z.; Kassas, Z.M. A lower bound for the error covariance of radio SLAM with terrestrial signals of opportunity. In Proceedings of the 34th International Technical Meeting of the Satellite Division of The Institute of Navigation (ION GNSS+ 2021), Online, 20–24 September 2021; pp. 2294–2306. [Google Scholar]
  7. Yin, J.; Wan, Q.; Yang, S.; Ho, K. A simple and accurate TDOA-AOA localization method using two stations. IEEE Signal Process. Lett. 2015, 23, 144–148. [Google Scholar] [CrossRef]
  8. Yue, Z.; Gao, F.; Xiong, Q.; Wang, J.; Huang, T.; Yang, E.; Zhou, H. A Novel Semi-Supervised Convolutional Neural Network Method for Synthetic Aperture Radar Image Recognition. Cogn. Comput. 2021, 4, 795–806. [Google Scholar] [CrossRef]
  9. Gao, F.; Kong, L.Z.; Lang, R.L.; Sun, J.P.; Wang, J.; Hussain, A.; Zhou, H.Y. SAR Target Incremental Recognition Based on Features with Strong Separability. IEEE Trans. Geosci. Remote Sens. 2024, 63, 5202813. [Google Scholar] [CrossRef]
  10. Huang, H.; Gao, F.; Sun, J.; Wang, J.; Hussain, A.; Zhou, H. Novel Category Discovery without Forgetting for Automatic Target Recognition. IEEE J. Sel. Top. Appl. Earth Obs. Remote Sens. 2024, 17, 4408–4420. [Google Scholar] [CrossRef]
  11. Xu, L.; Wen, F.; Zhang, X. A Novel Unitary PARAFAC Algorithm for Joint DOA and Frequency Estimation. IEEE Commun. Lett. 2019, 23, 660–663. [Google Scholar] [CrossRef]
  12. Wu, X.; Yang, X.; Jia, X.; Tian, F. A Gridless DOA Estimation Method Based on Convolutional Neural Network with Toeplitz Prior. IEEE Signal Process. Lett. 2022, 29, 1247–1251. [Google Scholar] [CrossRef]
  13. Fan, R.; Si, C.; Yi, W.; Wan, Q. YOLO-DoA: A New Data-Driven Method of DoA Estimation Based on YOLO Neural Network Framework. IEEE Sens. Lett. 2023, 7, 7000604. [Google Scholar] [CrossRef]
  14. Li, B.; Zhang, X.; Li, J.; Ma, P. DOA Estimation of Non-Circular Source for Large Uniform Linear Array with a Single Snapshot: Extended DFT Method. IEEE Commun. Lett. 2021, 25, 3843–3847. [Google Scholar] [CrossRef]
  15. Tian, Q.; Cai, R. A Low-Complexity DOA Estimation Algorithm for Distributed Source Localization. IEEE Trans. Instrum. Meas. 2023, 72, 1–4. [Google Scholar] [CrossRef]
  16. Chen, P.; Chen, Z.; Zheng, B.; Wang, X. Efficient DOA estimation method for reconfigurable intelligent surfaces aided UAV swarm. IEEE Trans. Signal Process. 2022, 70, 743–755. [Google Scholar] [CrossRef]
  17. Barthelme, A.; Utschick, W. DoA estimation using neural network-based covariance matrix reconstruction. IEEE Signal Process. Lett. 2021, 28, 783–787. [Google Scholar] [CrossRef]
  18. Pal, P.; Vaidyanathan, P.P. Nested arrays: A novel approach to array processing with enhanced degrees of freedom. IEEE Trans. Signal Process. 2010, 58, 4167–4181. [Google Scholar] [CrossRef]
  19. Zheng, Z.; Wang, W.Q.; Kong, Y.; Zhang, Y.D. MISC array: A new sparse array design achieving increased degrees of freedom and reduced mutual coupling effect. IEEE Trans. Signal Process. 2019, 67, 1728–1741. [Google Scholar] [CrossRef]
  20. Bao, Y.; Zhang, H.; Liu, X.; Jiang, Y.; Tao, Y. Design of Robust Sparse Wideband Beamformers with Circular-Model Mismatches Based on Reweighted l2,1 Optimization. Remote Sens. 2023, 15, 4791. [Google Scholar] [CrossRef]
  21. Wu, Z.; Zhu, S.; Xu, J.; Lan, L.; Li, X.; Zhang, Y. Frequency Increment Design Method of MR-FDA-MIMO Radar for Interference Suppression. Remote Sens. 2023, 15, 4070. [Google Scholar] [CrossRef]
  22. Li, H.; Ran, L.; He, C.; Ding, Z.; Chen, S. Adaptive Beamforming with Sidelobe Level Control for Multiband Sparse Linear Array. Remote Sens. 2023, 15, 4929. [Google Scholar] [CrossRef]
  23. Robin, R.; Visa, K. Sparse Symmetric Linear Arrays with Low Redundancy and a Contiguous Sum Co-Array. IEEE Trans. Signal Process. 2021, 69, 1697–1712. [Google Scholar]
  24. Steven, W.; Koichi, I. xMISC: Improved Sparse Linear Array via Maximum Inter-Element Spacing Concept. IEEE Signal Process. Lett. 2023, 30, 1327–1331. [Google Scholar]
  25. Wang, M.; Zhang, Z.; Nehorai, A. Performance Analysis of Coarray-Based MUSIC in the Presence of Sensor Location Errors. IEEE Trans. Signal Process. 2018, 66, 3074–3085. [Google Scholar] [CrossRef]
  26. Steven, W.; Koichi, I. A Sum-Difference Expansion Scheme for Sparse Array Construction Based on the Fourth-Order Difference Co-Array. IEEE Signal Process. Lett. 2022, 29, 2647–2651. [Google Scholar]
  27. Steven, W.; Koichi, I. Hybridization of Bayesian Compressive Sensing and Array Dilation Technique for Synthesis of Linear Isophoric Sparse Antenna Arrays. IEEE Trans. Antennas Propag. 2023, 71, 4066–4074. [Google Scholar]
  28. Geng, L.; Li, Y.; Dong, L.; Tan, Y.; Cheng, W. Efficiently Refining Beampattern in FDA-MIMO Radar via Alternating Manifold Optimization for Maximizing Signal-to-Interference-Noise Ratio. Remote Sens. 2024, 16, 1364. [Google Scholar] [CrossRef]
  29. Dai, Y.; Sun, C.; Liu, X. On the 2D Beampattern Optimization of Sparse Group-Constrained Robust Capon Beamforming with Conformal Arrays. Remote Sens. 2024, 16, 421. [Google Scholar] [CrossRef]
  30. Han, B.; Qu, X.; Yang, X.; Zhang, Z.; Li, W. DRFM Repeater Jamming Suppression Method Based on Joint Range-Angle Sparse Recovery and Beamforming for Distributed Array Radar. Remote Sens. 2023, 15, 3449. [Google Scholar] [CrossRef]
  31. Sahmoudi, M.; Amin, M.G. Optimal robust beamforming for interference and multipath mitigation in GNSS arrays. In Proceedings of the 2007 IEEE International Conference on Acoustics, Speech and Signal Processing-ICASSP’07, Honolulu, HI, USA, 16–20 April 2007; Volume 3, p. 693. [Google Scholar]
  32. Steven, W.; Koichi, I. Sparse Array Design for DOA Estimation of Non-Circular Signals: Reduced Co-Array Redundancy and Increased DOF. IEEE Sens. J. 2021, 21, 27928–27937. [Google Scholar]
  33. Li, S.; Zhang, X.P. Dilated Arrays: A Family of Sparse Arrays with Increased Uniform Degrees of Freedom and Reduced Mutual Coupling on a Moving Platform. IEEE Trans. Signal Process. 2021, 69, 3367–3382. [Google Scholar] [CrossRef]
  34. Yang, Z.; Shen, Q.; Liu, W.; Eldar, Y.C.; Cui, W. High-Order Cumulants Based Sparse Array Design Via Fractal Geometries—Part I: Structures and DOFs. IEEE Trans. Signal Process. 2023, 71, 327–342. [Google Scholar] [CrossRef]
  35. Gazzah, H.; Abed-Meraim, K. Optimum ambiguity-free directional and omnidirectional planar antenna arrays for DOA estimation. IEEE Trans. Signal Process. 2009, 57, 3942–3953. [Google Scholar] [CrossRef]
  36. Fu, M.; Zheng, Z.; Wang, W.Q. 2-D DOA Estimation for Nested Conformal Arrays via Sparse Reconstruction. IEEE Commun. Lett. 2021, 3, 980–984. [Google Scholar] [CrossRef]
  37. Aboumahmoud, I.; Muqaibel, A.; Alhassoun, M.; Alawsh, S. A Review of Sparse Sensor Arrays for Two-Dimensional Direction-of-Arrival Estimation. IEEE Access 2021, 9, 92999–93017. [Google Scholar] [CrossRef]
  38. Gao, S.; Ma, H.; Liu, H.; Yang, J.; Yang, Y. A Gridless DOA Estimation Method for Sparse Sensor Array. Remote Sens. 2023, 15, 5281. [Google Scholar] [CrossRef]
  39. Weinstein, E.; Weiss, A.J. A general class of lower bounds in parameter estimation. IEEE Trans. Inf. Theory 1988, 34, 338–342. [Google Scholar] [CrossRef]
  40. Reuven, I.; Messer, H. A Barankin-type lower bound on the estimation error of a hybrid parameter vector. IEEE Trans. Inf. Theory 1997, 43, 1084–1093. [Google Scholar] [CrossRef]
  41. Routtenberg, T.; Tabrikian, J. Bayesian periodic Cramer-Rao bound. IEEE Signal Process. Lett. 2022, 29, 1878–1882. [Google Scholar] [CrossRef]
  42. Chaumette, E.; Galy, J.; Quinlan, A.; Larzabal, P. A new Barankin bound approximation for the prediction of the threshold region performance of maximum likelihood estimators. IEEE Trans. Signal Process. 2008, 56, 5319–5333. [Google Scholar] [CrossRef]
  43. Todros, K.; Tabrikian, J. General classes of performance lower bounds for parameter estimation—Part I: Non-Bayesian bounds for unbiased estimators. IEEE Trans. Inf. Theory 2010, 56, 5045–5063. [Google Scholar] [CrossRef]
  44. Karo, I.Y.; Dvorkind, T.G.; Cohen, I. Source localization with feedback beamforming. IEEE Trans. Signal Process. 2020, 69, 631–640. [Google Scholar] [CrossRef]
  45. Wang, C.; Zhu, X.; Li, X. Signal separation and target localization for FDA radar. IEEE Access 2020, 8, 180222–180230. [Google Scholar] [CrossRef]
  46. Yuan, G.; Vinck, H.; Kaiser, T. Massive MIMO antenna selection: Switching architectures, capacity bounds, and optimal antenna selection algorithms. IEEE Trans. Signal Process. 2017, 66, 1346–1360. [Google Scholar]
  47. Zhang, J.A.; Huang, X.; Guo, Y.J.; Yuan, J.; Heath, R.W. Multibeam for joint communication and radar sensing using steerable analog antenna arrays. IEEE Trans. Veh. Technol. 2018, 68, 671–685. [Google Scholar] [CrossRef]
  48. Wang, X.; Aboutanios, E.; Amin, M.G. Adaptive array thinning for enhanced DOA estimation. IEEE Signal Process. Lett. 2014, 22, 799–803. [Google Scholar] [CrossRef]
  49. Wang, X.; Greco, M.S.; Gini, F. Adaptive sparse array beamformer design by regularized complementary antenna switching. IEEE Trans. Signal Process. 2021, 69, 2302–2315. [Google Scholar] [CrossRef]
  50. Razaviyayn, M.; Hong, M.; Luo, Z.Q. A unified convergence analysis of block successive minimization methods for nonsmooth optimization. SIAM J. Optim. 2013, 23, 1126–1153. [Google Scholar] [CrossRef]
  51. Du, D.; Pardalos, P.M. Handbook of Combinatorial Optimization; Springer Science and Business Media: Berlin/Heidelberg, Germany, 1998; Volume 4. [Google Scholar]
  52. Ren, C.; Liu, F.; Zhou, J. MIMO radar waveform design with practical constraints: A low-complexity approach. In Proceedings of the I2018 IEEE 18th International Conference on Communication Technology (ICCT), Chongqing, China, 8–11 October 2018; pp. 94–98. [Google Scholar]
  53. Van, T.; Harry, L.; Bell, K.L. Excerpts from Part III of Detection, Estimation, and Modulation Theory; Wiley-IEEE Press: Hoboken, NJ, USA, 2007. [Google Scholar]
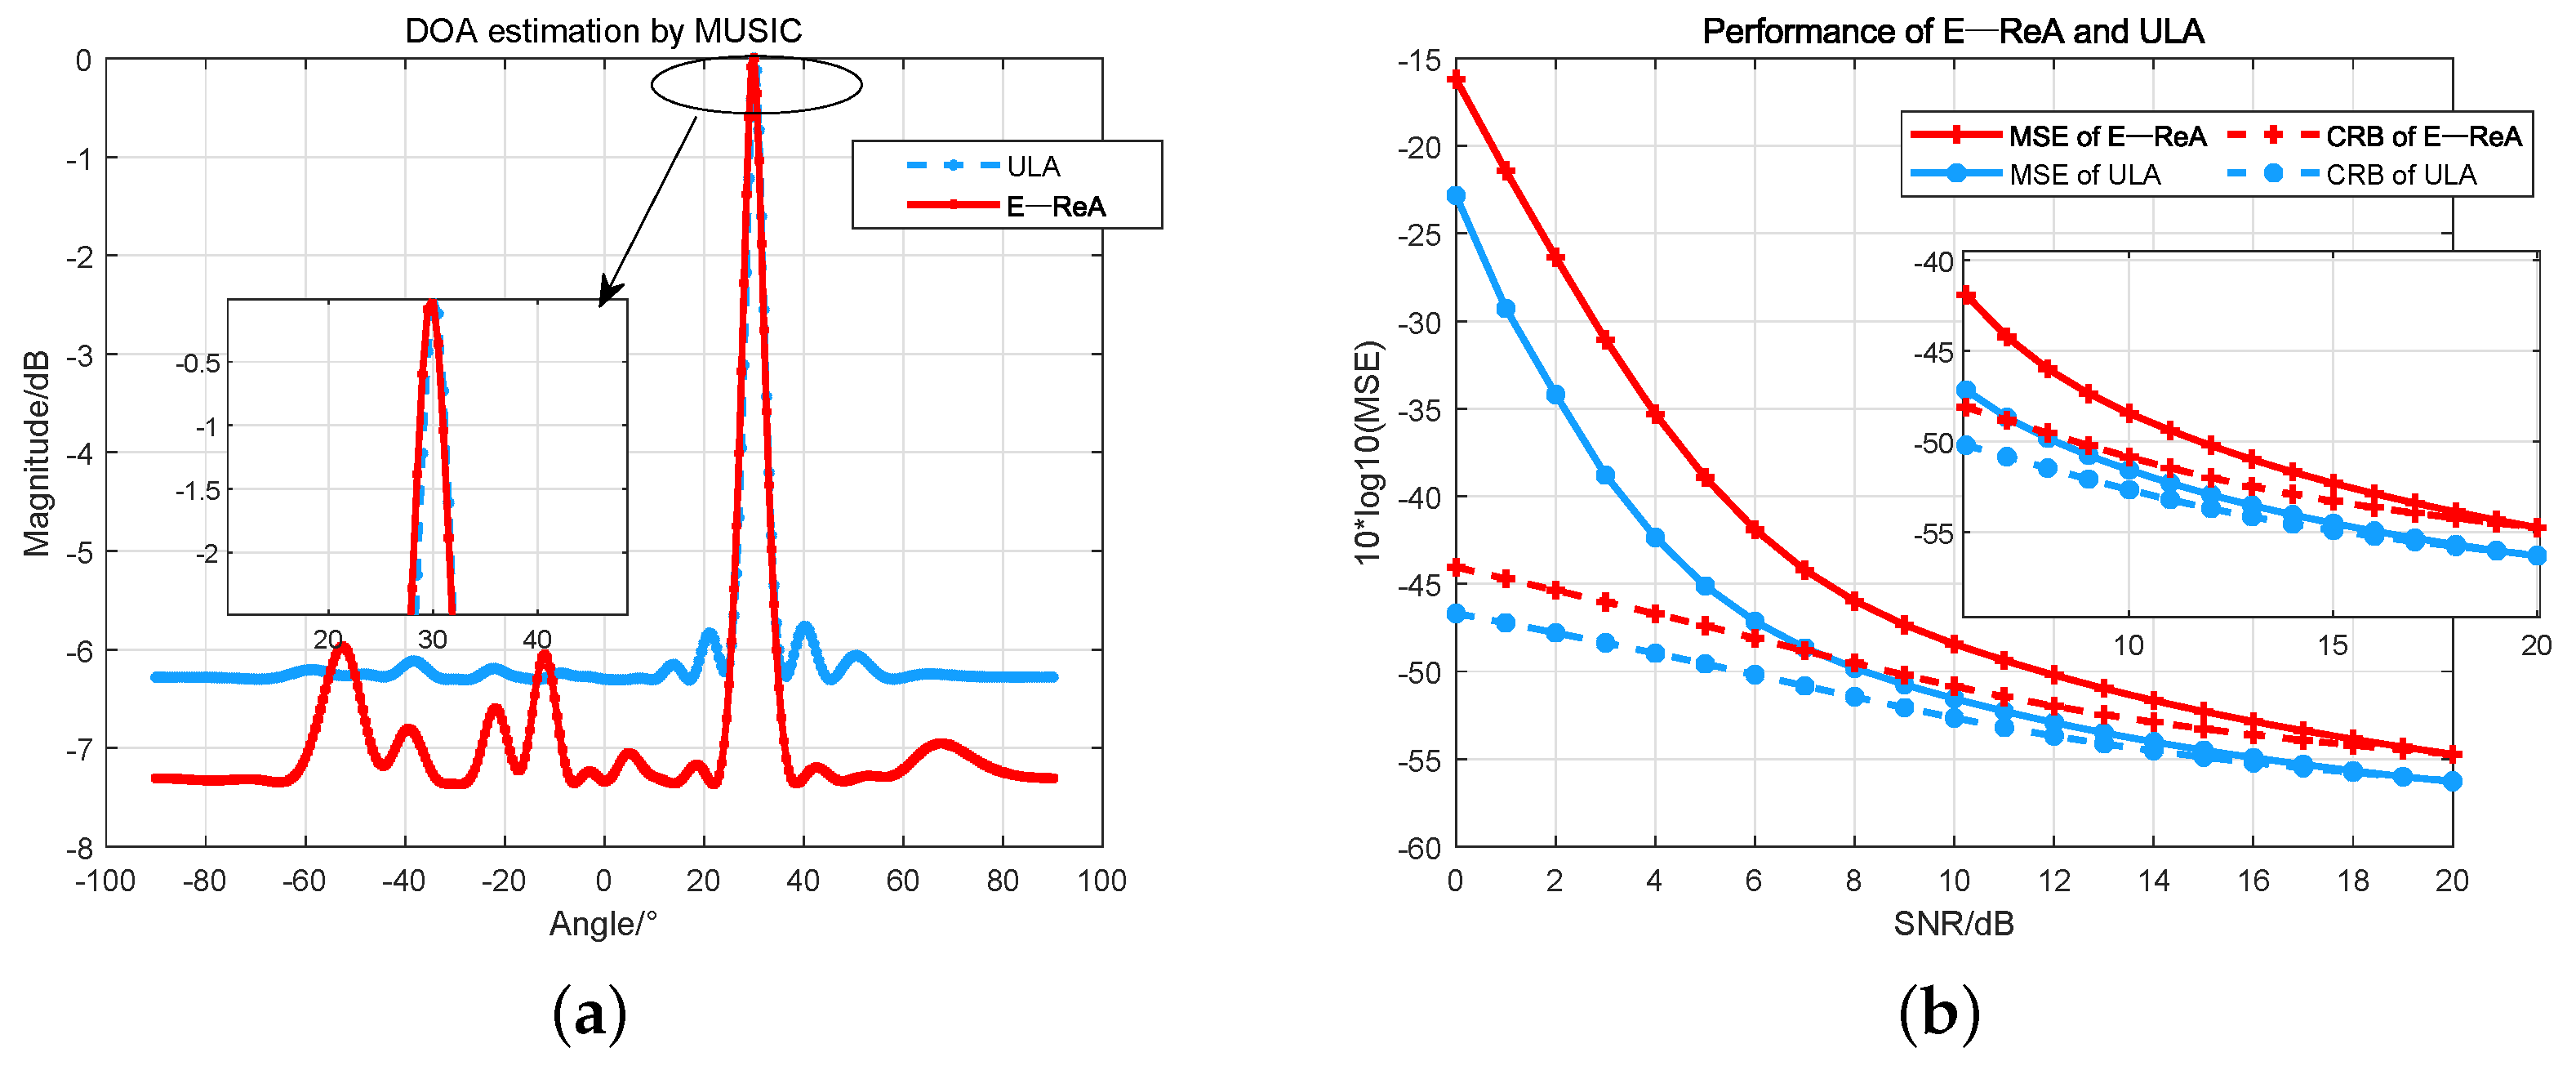
Figure 1. The DOA estimation performance of E-ReA and ULA. (a) Shows DOA estimation results on ULA and E-ReA based on MUSIC algorithm respectively. (b) Shows the MSE and CRB curves of E-ReA and ULA for estimating the DOA using MUSIC algorithm.
Remotesensing 16 03482 g001
Figure 2. The DOA estimation performance of different sparse arrays. (a) Shows the structures of sparse arrays. (b) Shows the MSE and CRB curves of E-ReA, noE-ReA and R−A for estimating the DOA using MUSIC algorithm.
Remotesensing 16 03482 g002
Figure 3. The performance of E-ReA and noE-ReA. (a) Shows the directional patterns of E-ReA and noE-ReA. (b) Shows the MSE and CRB curves of E-ReA and noE-ReA with different snapshot numbers.
Remotesensing 16 03482 g003
Figure 4. Robustness analysis of E-ReA and noE-ReA. (a) Shows the performance of E-ReA and noE-ReA with different Δ g . (b) Shows the performance of E-ReA and noE-ReA with different Δ φ .
Remotesensing 16 03482 g004
Figure 5. Comparative of DOA estimation performance based on SBL with different arrays.
Remotesensing 16 03482 g005
Table 1. The important notations and their meanings.
v s and v j The steering vector of s t and j t
v ˜ s and v ˜ j The steering vector of s t and j t under perturbation
G and Φ Perturbation error matrixes
G k and Φ k Perturbation error at the k-th snapshot
R ˜ Covariance matrix of the signal under perturbation
J ˜ Fisher Information Matrix (FIM) under perturbation
C θ CRB under perturbation
v ˜ j s k The correlation steering vector of the k-th snapshot under perturbation
κ x SCC of sparse arrays under perturbation
x and x 0 , 1 M The M-dimensional selection vector, and its elements are either 0 or 1
Table 2. Monte Carlo experiments with random angles.
12345
noE-ReA−30.05 dB−32.14 dB−37.78 dB−39.75 dB−20.98 dB
E-ReA−37.86 dB−36.02 dB−42.43 dB−43.19 dB−25.59 dB
678910
noE-ReA−36.57 dB−35.08 dB−26.36 dB−29.14 dB−37.68 dB
E-ReA41.27 dB−41.18 dB−30.17 dB−34.05 dB−40.04 dB
Disclaimer/Publisher’s Note: The statements, opinions and data contained in all publications are solely those of the individual author(s) and contributor(s) and not of MDPI and/or the editor(s). MDPI and/or the editor(s) disclaim responsibility for any injury to people or property resulting from any ideas, methods, instructions or products referred to in the content.