Article

MDFA-Net: Multi-Scale Differential Feature Self-Attention Network for Building Change Detection in Remote Sensing Images

1
School of Information Science and Technology, Beijing Forestry University, Beijing 100083, China
2
Engineering Research Center for Forestry-Oriented Intelligent Information Processing of National Forestry and Grassland Administration, Beijing 100083, China
*
Author to whom correspondence should be addressed.
Remote Sens. 2024, 16(18), 3466; https://doi.org/10.3390/rs16183466
Submission received: 19 August 2024 / Revised: 14 September 2024 / Accepted: 17 September 2024 / Published: 18 September 2024

Abstract

:
Building change detection (BCD) from remote sensing images is an essential field for urban studies. In this well-developed field, Convolutional Neural Networks (CNNs) and Transformer have been leveraged to empower BCD models in handling multi-scale information. However, it is still challenging to accurately detect subtle changes using current models, which has been the main bottleneck to improving detection accuracy. In this paper, a multi-scale differential feature self-attention network (MDFA-Net) is proposed to effectively integrate CNN and Transformer by balancing the global receptive field from the self-attention mechanism and the local receptive field from convolutions. In MDFA-Net, two innovative modules were designed. Particularly, a hierarchical multi-scale dilated convolution (HMDConv) module was proposed to extract local features with hybrid dilation convolutions, which can ameliorate the effect of CNN’s local bias. In addition, a differential feature self-attention (DFA) module was developed to implement the self-attention mechanism at multi-scale difference feature maps to overcome the problem that local details may be lost in the global receptive field in Transformer. The proposed MDFA-Net achieves state-of-the-art accuracy performance in comparison with related works, e.g., USSFC-Net, in three open datasets: WHU-CD, CDD-CD, and LEVIR-CD. Based on the experimental results, MDFA-Net significantly exceeds other models in F1 score, IoU, and overall accuracy; the F1 score is 93.81%, 95.52%, and 91.21% in WHU-CD, CDD-CD, and LEVIR-CD datasets, respectively. Furthermore, MDFA-Net achieved first or second place in precision and recall in the test in all three datasets, which indicates its better balance in precision and recall than other models. We also found that subtle changes, i.e., small-sized building changes and irregular boundary changes, are better detected thanks to the introduction of HMDConv and DFA. To this end, with its better ability to leverage multi-scale differential information than traditional methods, MDFA-Net provides a novel and effective avenue to integrate CNN and Transformer in BCD. Further studies could focus on improving the model’s insensitivity to hyper-parameters and the model’s generalizability in practical applications.

Graphical Abstract

1. Introduction

Change detection (CD) using remote sensing is a well-developed field that aims to identify the changes, especially land cover changes, between multiple remote sensing images taken at different times in the same geographical area [1]. One of the primary land cover changes is the change in buildings, including new constructions and demolitions due to natural or manufactured disasters. Building change detection (BCD) using remote sensing aims to monitor building construction and demolition at a large scale by comparing and analyzing multi-temporal images of the same area, which has already become an imperative topic in terms of its direct contributions to smart city studies, e.g., urban planning, environmental management, and public policy [2,3].
Traditional BCD methods using remote sensing can be classified into two groups: pixel-based and object-based. Pixel-based methods tend to overlook the overall spatial characteristics of changes, leading to incomplete extraction of change areas [4]. On the other hand, object-based methods rely on manual definitions and prior knowledge, thus resulting in limited robustness in generalization [5]. To this end, traditional BCD methods have limited accuracies and struggle to adapt to various scenarios and applications [6,7,8].
Deep learning (DL) algorithms have been introduced into BCD since 2015 due to their excellent capabilities in feature extraction and representation [9]. Existing DL BCD methods can be categorized into three types based on their underlying network structures: convolutional-neural-networks (CNNs)-based, Transformer-based, and hybrid. CNN was first introduced and demonstrated in BCD by directly extracting change maps from multitemporal images by Gong et al. [9]. Since then, various CNN backbones and their modification strategies, e.g., dense attention mechanism [10], multiscale feature model [11], and end-to-end superpixel-enhanced network [12], have been implemented in BCD, all of which made significant accuracy improvements in BCD. However, as highlighted by Zheng et al. [13], CNN has shortcomings in modeling long-range features due to its local receptive field, which tends to lead to ambiguities and omissions in prediction, particularly when building changes may vary significantly in structure, scale, and context [14].
In contrast, Transformer has emerged as a powerful framework in computer vision tasks for modeling long-range feature dependencies through attention mechanisms [15]. It offers a compelling alternative to traditional CNN models in BCD. The Bitemporal Image Transformer (BIT) model first implemented Transformer (attention mechanism) in change detection in 2021 [16]. BIT utilized a bi-temporal image Transformer to effectively capture contextual relationships within a spatial–temporal framework, which has demonstrated impressive performance on several BCD datasets. Another work that should be noted is the cross-temporal difference (CTD) attention, whose mechanism enhances the extraction of changed features by focusing on the relational dynamics among objects over time [16]. Although implementing the Transformer in BCD is a prevailing topic, simple Transformer-based BCD architectures usually face challenges in preserving local texture details of buildings and tend to exhibit high computational complexity.
To address the above limitations in both CNN-based and Transformer-based methods, scholars have explored the hybrid methods integrating CNN and Transformer in BCD. Theoretically, the hybrid approaches are able to combine the local feature extraction capabilities of CNN and the global contextual modeling strengths of Transformer. Existing experimental results prove that such integration can enhance both the accuracy and efficiency of BCD methods [17]. The most pressing issue in BCD using remote sensing is how to leverage CNN and self-attention mechanism in an integrated way. Currently, various methods have been proposed for this issue. For example, the attention-based multi-scale Transformer network (AMTNet) showcases the effective application of attention mechanisms within a CNN–Transformer framework [18]. It employs a Siamese architecture to extract multi-scale features while adeptly modeling contextual information [19]. Recently, CSDNet has implemented a feature decoupling strategy that separates structural and contextual features through a feature difference extractor. This approach significantly enhances the accuracy of damage detection across various scenarios, including post-earthquake assessments [20]. One study that should be noted is the ultralightweight spatial–spectral feature cooperation network (USSFC-Net) proposed by Lei et al. in 2023, which designed a multiscale decoupled convolution and an effective spatial–spectral feature cooperation strategy, achieving the state of the art in BCD datasets [21].
However, existing CNN–Transformer BCD frameworks still encounter challenges in detecting subtle changes for the following reasons. First, although current studies have explored extending the local receptive field in CNN via modifications, e.g., leveraging an attention mechanism Transformer [22], existing studies still have an inherent local bias in CNN-based feature extraction, i.e., USSFC-Net [21], where subtle building changes are unevenly treated. Second, current hybrid BCD models leverage the self-attention mechanism directly on concatenated differential feature maps, thus resulting in insufficient attention to small-scale difference features [23].
To address the abovementioned issues, we proposed a novel multi-scale differential feature self-attention net (MDFA-Net) model to effectively integrate the convolutional feature extractor and the self-attention mechanism in BCD. The MDFA-Net model was designed based on a pseudo-Siamese U-Net framework. Specifically, two new modules were designed in MDFA-Net: (1) A hierarchical multi-scale dilated convolution (HMDConv) module was developed, which leveraged hybrid dilations in non-weight-sharing hierarchical convolutions to better extract multi-scale features than before; (2) a differential feature self-attention (DFA) module was developed, where the self-attention mechanism was implemented in each multi-scale difference feature map to provide compensation for subtle feature expression.
The rest of the paper is organized as follows. In Section 2, related work, especially detailed related deep learning change detection technologies, is introduced. In Section 3, the detailed model framework, including two novel modules, is introduced in Methods. In Section 4, the experimental settings and results are presented. In Section 5, we evaluate the performance of the proposed model and discuss its advantages and limitations. Conclusions are presented in Section 6.

2. Related Work

In related work, we introduced previous DL CD technologies from the following three aspects: general frameworks, multi-scale bi-temporal feature extraction, and implementations of the attention mechanism.

2.1. General DL Frameworks

Taking advantage of DL has catalyzed significant advancements in CD using remote sensing. The general DL frameworks in CD can be predominantly categorized into two types. As shown in Figure 1a, the fusion image produced from the comparison of bi-temporal images T1 and T2 is utilized as a singular input of the following deep neural networks. This method allows for the collective processing of bi-temporal images, enabling direct change detection from the fused representation. However, as highlighted by Daudt et al. [24], this approach often oversimplifies the complexities of change detection tasks, which may lead to inaccuracies stemming from neglecting unique characteristics inherent to BCD.
The other type of general DL framework in CD, particularly those employing the Siamese network framework, has gained traction as a more robust alternative. As shown in Figure 1b, this framework independently extracts features from both the bi-temporal images T1 and T2, followed by a comparative analysis of the integrated features [25]. The weight-sharing mechanism inherent in the Siamese framework enhances feature extraction efficiency while reducing the overall parameter count, thus promoting computational efficiency. Significant strides in this domain include the adaptation of the U-Net backbone for change detection, as noted by Shen et al. [26]. One typical example adapting U-Net in a Siamese framework is SNUNet proposed by Fang et al. [27], which incorporated dense connections and multi-scale feature aggregation, thus leading to the emergence of this model. This study underscores the importance of accurately modeling temporal relationships in change detection tasks.
Therefore, utilizing a U-Net backbone in a Siamese framework has proven to be an effective form of the CD model by addressing feature misalignment issues arising from excessive intermediate and upsampling during deconvolution. However, it should be noted that the weight-sharing mechanism in the Siamese framework will compromise the ability to extract subtle change features [27]. To this end, we utilized a non-weight-sharing pseudo-Siamese U-net as the backbone to balance efficiency and accuracy.

2.2. Multi-Scale Bi-Temporal Feature Extraction

One important task in CD is multi-scale feature extraction, which enables classifiers to comprehensively leverage features in different scales, as low-level features help target localization and high-level features provide semantic context. This capability is essential for representing spatial and contextual information, particularly for detecting subtle changes [28]. Recent progress in multi-scale feature extraction has involved the integration of dense connections and attention mechanisms [29]. Nonetheless, existing methods often grapple with limitations in computational efficiency and feature redundancy. As highlighted by Zhang et al. [30], excessive information in feature maps will negatively affect classification outcomes. Therefore, designing novel feature extraction techniques that minimize redundancy while maximizing the representation of critical changes remains essential and challenging.
In addition, bi-temporal feature extraction is another fundamental task to change information detection from sequential images. Although traditional methods, such as feature concatenation, addition, and subtraction [31], have been employed to derive differential information, these approaches often fail to retain significant details while effectively filtering background noise [32]. Concatenation and addition can lead to excessive background retention, while subtraction may eliminate valuable edge details [33]. To ameliorate this problem, Neural Architecture Search (NAS-FPN), proposed by Ghiasi et al. [28], has yielded new feature pyramid architectures that facilitate cross-scale connections. This approach illustrates advanced strategies for fusing multilevel features, highlighting potential applications in both object detection and pixel-level change detection tasks. This evolution paves the way for utilizing cascade architectures to enhance change detection performance through dual-decoder networks. These networks strategically separate change localization from boundary refinement tasks, aligning with the increasing demand for finer granularity in understanding and delineating changes [34]. Unlike feature pyramid frameworks, USSFC-Net leveraged a multiscale decoupled convolution (MSDConv) to extend the receptive field in a CNN-based feature extractor, which had multi-scale convolutions and a unique dilation module [21]. Although this model achieved state-of-the-art performance in several BCD datasets, there is still space to improve, especially its performance in subtle change detection.
To this end, in this paper, multi-scale features were extracted in an HMDConv module, which is a modification of MSDConv in USSFC-Net. It is important to notice that the HMDConv module implemented a hybrid dilated convolution in CNN-based feature extractors instead of a constant dilation convolution to extend a limited receptive field at each scale and self-attention in connecting multi-scale patterns. The specific structure will be introduced in Section 3.

2.3. Attention Mechanisms

The incorporation of the attention mechanisms empowered BCD using remote sensing images by enabling models to focus on relevant features and filtering out noises. The attention mechanisms can dynamically learn weighting coefficients, allowing neural networks to prioritize regions exhibiting changes, thereby improving detection performance [30]. Given that CD aims to identify alterations in imagery, i.e., distinguishing dynamic from static elements, the attention mechanisms prove particularly effective.
Recent studies have illustrated the effectiveness of several attention-based CD methods. For instance, Zuo et al. [31] developed the Attention Residual Recurrent U-Net (R2AU-Net), which integrates attention into the traditional U-Net architecture, enhancing performance in both binary and multi-class change detection tasks for hyperspectral imagery. Woo et al. proposed the Convolutional Block Attention Module (CBAM) in 2018 [35], which integrated channel attention mechanisms (CAM) and spatial attention mechanisms (SAM) sequentially, enhancing feature representation by focusing on informative regions and channels. CAM and SAM are lightweight modules, so the attention mechanism can be leveraged efficiently. Chen et al. [36] introduced a spatial-channel double attention mechanism that captures long-range dependencies, thus improving feature representation. Jiang et al. [37] designed a pyramid-feature-based attention-guided Siamese network (PGA-SiamNet), employing multi-layer attention to manage feature dependencies across different scales. Gong et al. [38] developed a spectral and spatial attention network (S2AN) designed to systematically amplify change-related features using adaptive Gaussian distributions. A landmark study was DSIFN, proposed by Zhang et al. [13], which used a Siamese network to extract two-branch features in the encoding stage and used the attention mechanism to improve the boundary integrity of the change map. Another study that should be noted is Change Former [39], which integrated the hierarchical Transformer as the Encoder and the multilayer perceptron (MLP) as the Decoder within a Siamese framework, thus having the ability to accurately present long-range dependencies for CD.
To sum up, current related methods usually implement the self-attention mechanism in two ways [40,41,42]: implementing self-attention as a feature extractor directly, e.g., CBAM [36], BIT [16], and Change Former [39], or implementing self-attention on differential feature maps after a CNN-based extractor, e.g., DSIFN [13], MSGFNet [43], and USSFC-Net [22]. These two attention strategies are shown in Figure 1. In this paper, we proposed DFA to leverage a self-attention feature extractor on a multi-scale differential feature map specifically. Therefore, subtle local changes are supposed not to be eliminated in multi-scale feature fusion.

3. Methods

Building change detection (BCD) identifies urban landscape changes to support urban planning and monitoring. We introduce the MDFA-Net to perform this task efficiently. Given a pre-change remote sensing image I a and a post-change remote sensing image I b , our model is designed to output a detailed map highlighting the precise areas of transformation I o u t .

3.1. Overview

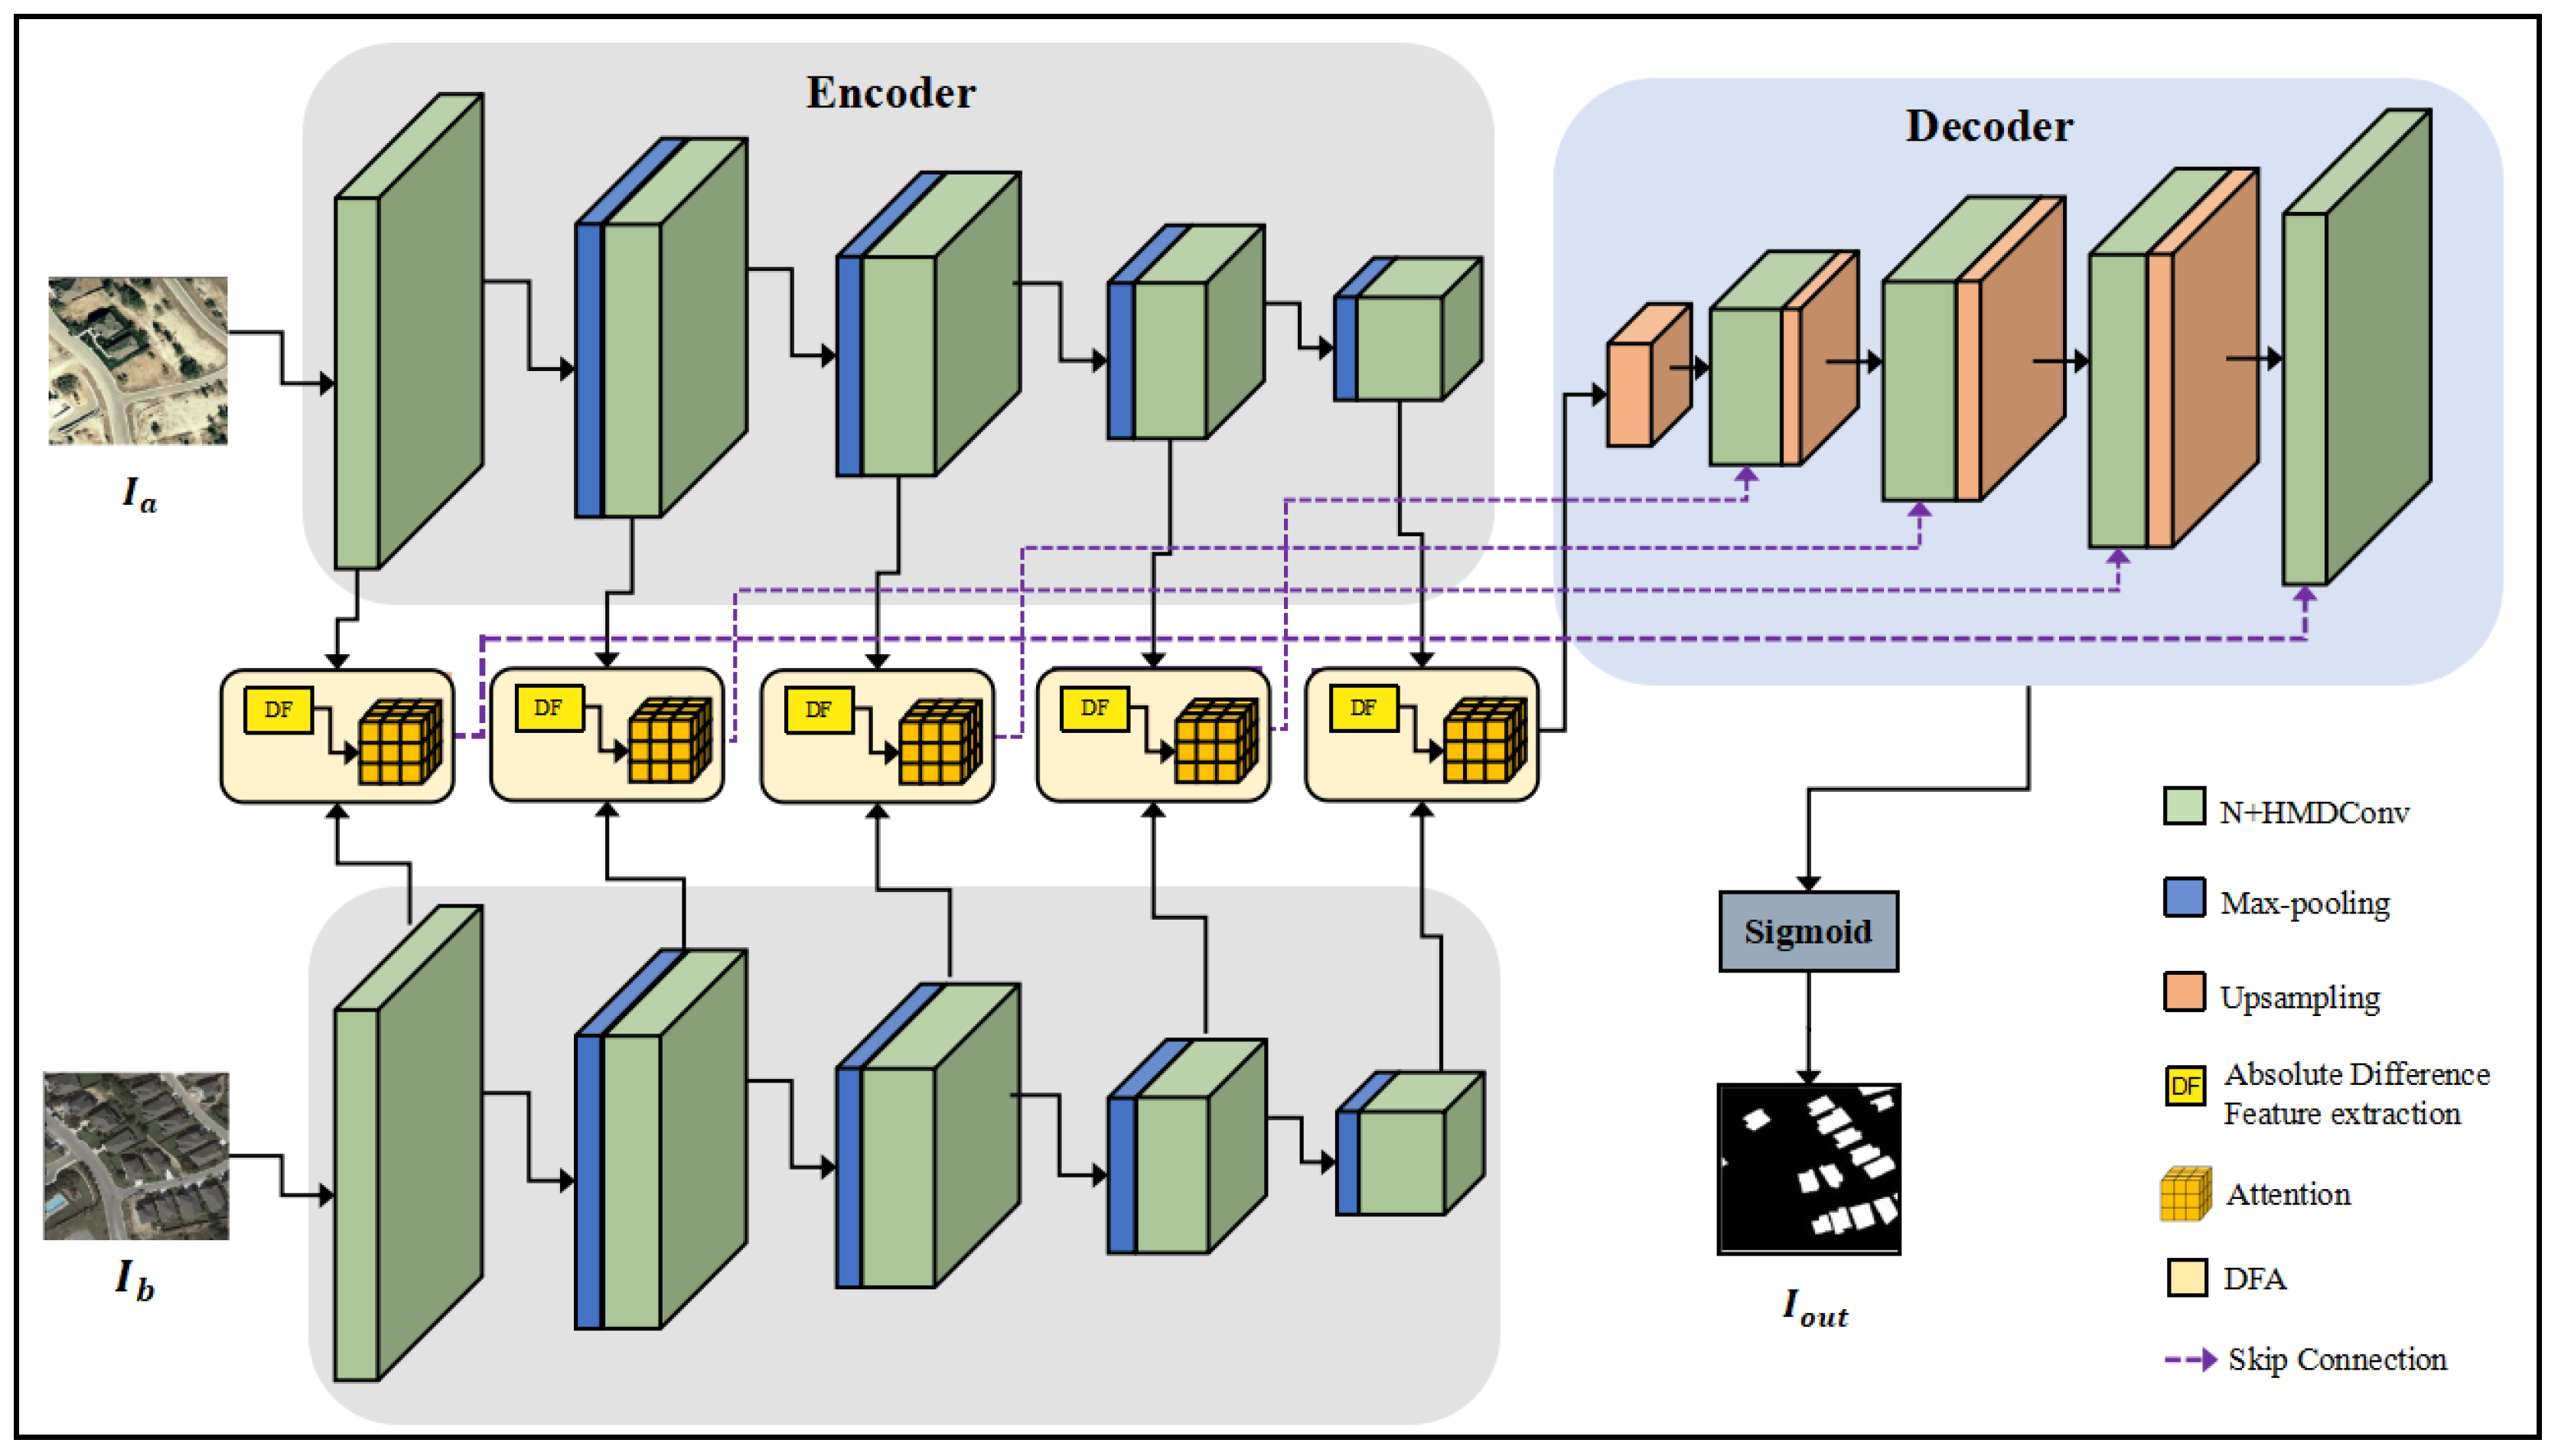
This section presents the architecture of our proposed MDFA-Net, which is based on a non-weighted-sharing Siamese U-Net framework. As shown in Figure 2, MDFA-Net comprises three components: Encoder, DFA module, and Decoder.
The Encoder utilizes Native Feature Module and HMDConv (N + HMDConv) to accurately extract salient features from dual-temporal remote sensing images. Subsequently, a differential compensation module, DFA, is implemented to enhance feature representation through self-attention mechanisms. In the Decoder, a deconvolution upsampling layer is coupled with a feature recovery layer within an N + HMDConv module, ensuring robust feature restoration. We adopt the skip connection strategy from U-Net, aligning the Encoder and DFA outputs with the Decoder’s corresponding layers to preserve spatial coherence. The Decoder culminates with a 1 × 1 convolution and normalization process, delivering the final building change detection (BCD) results with precision and clarity.
The MDFA-Net is distinguished by its multi-scale feature extraction through the N + HMDConv module and the differential compensation via the DFA module. Subsequent sections will detail these core components and elaborate on further aspects of the MDFA-Net framework.

3.2. N + HMDConv Module

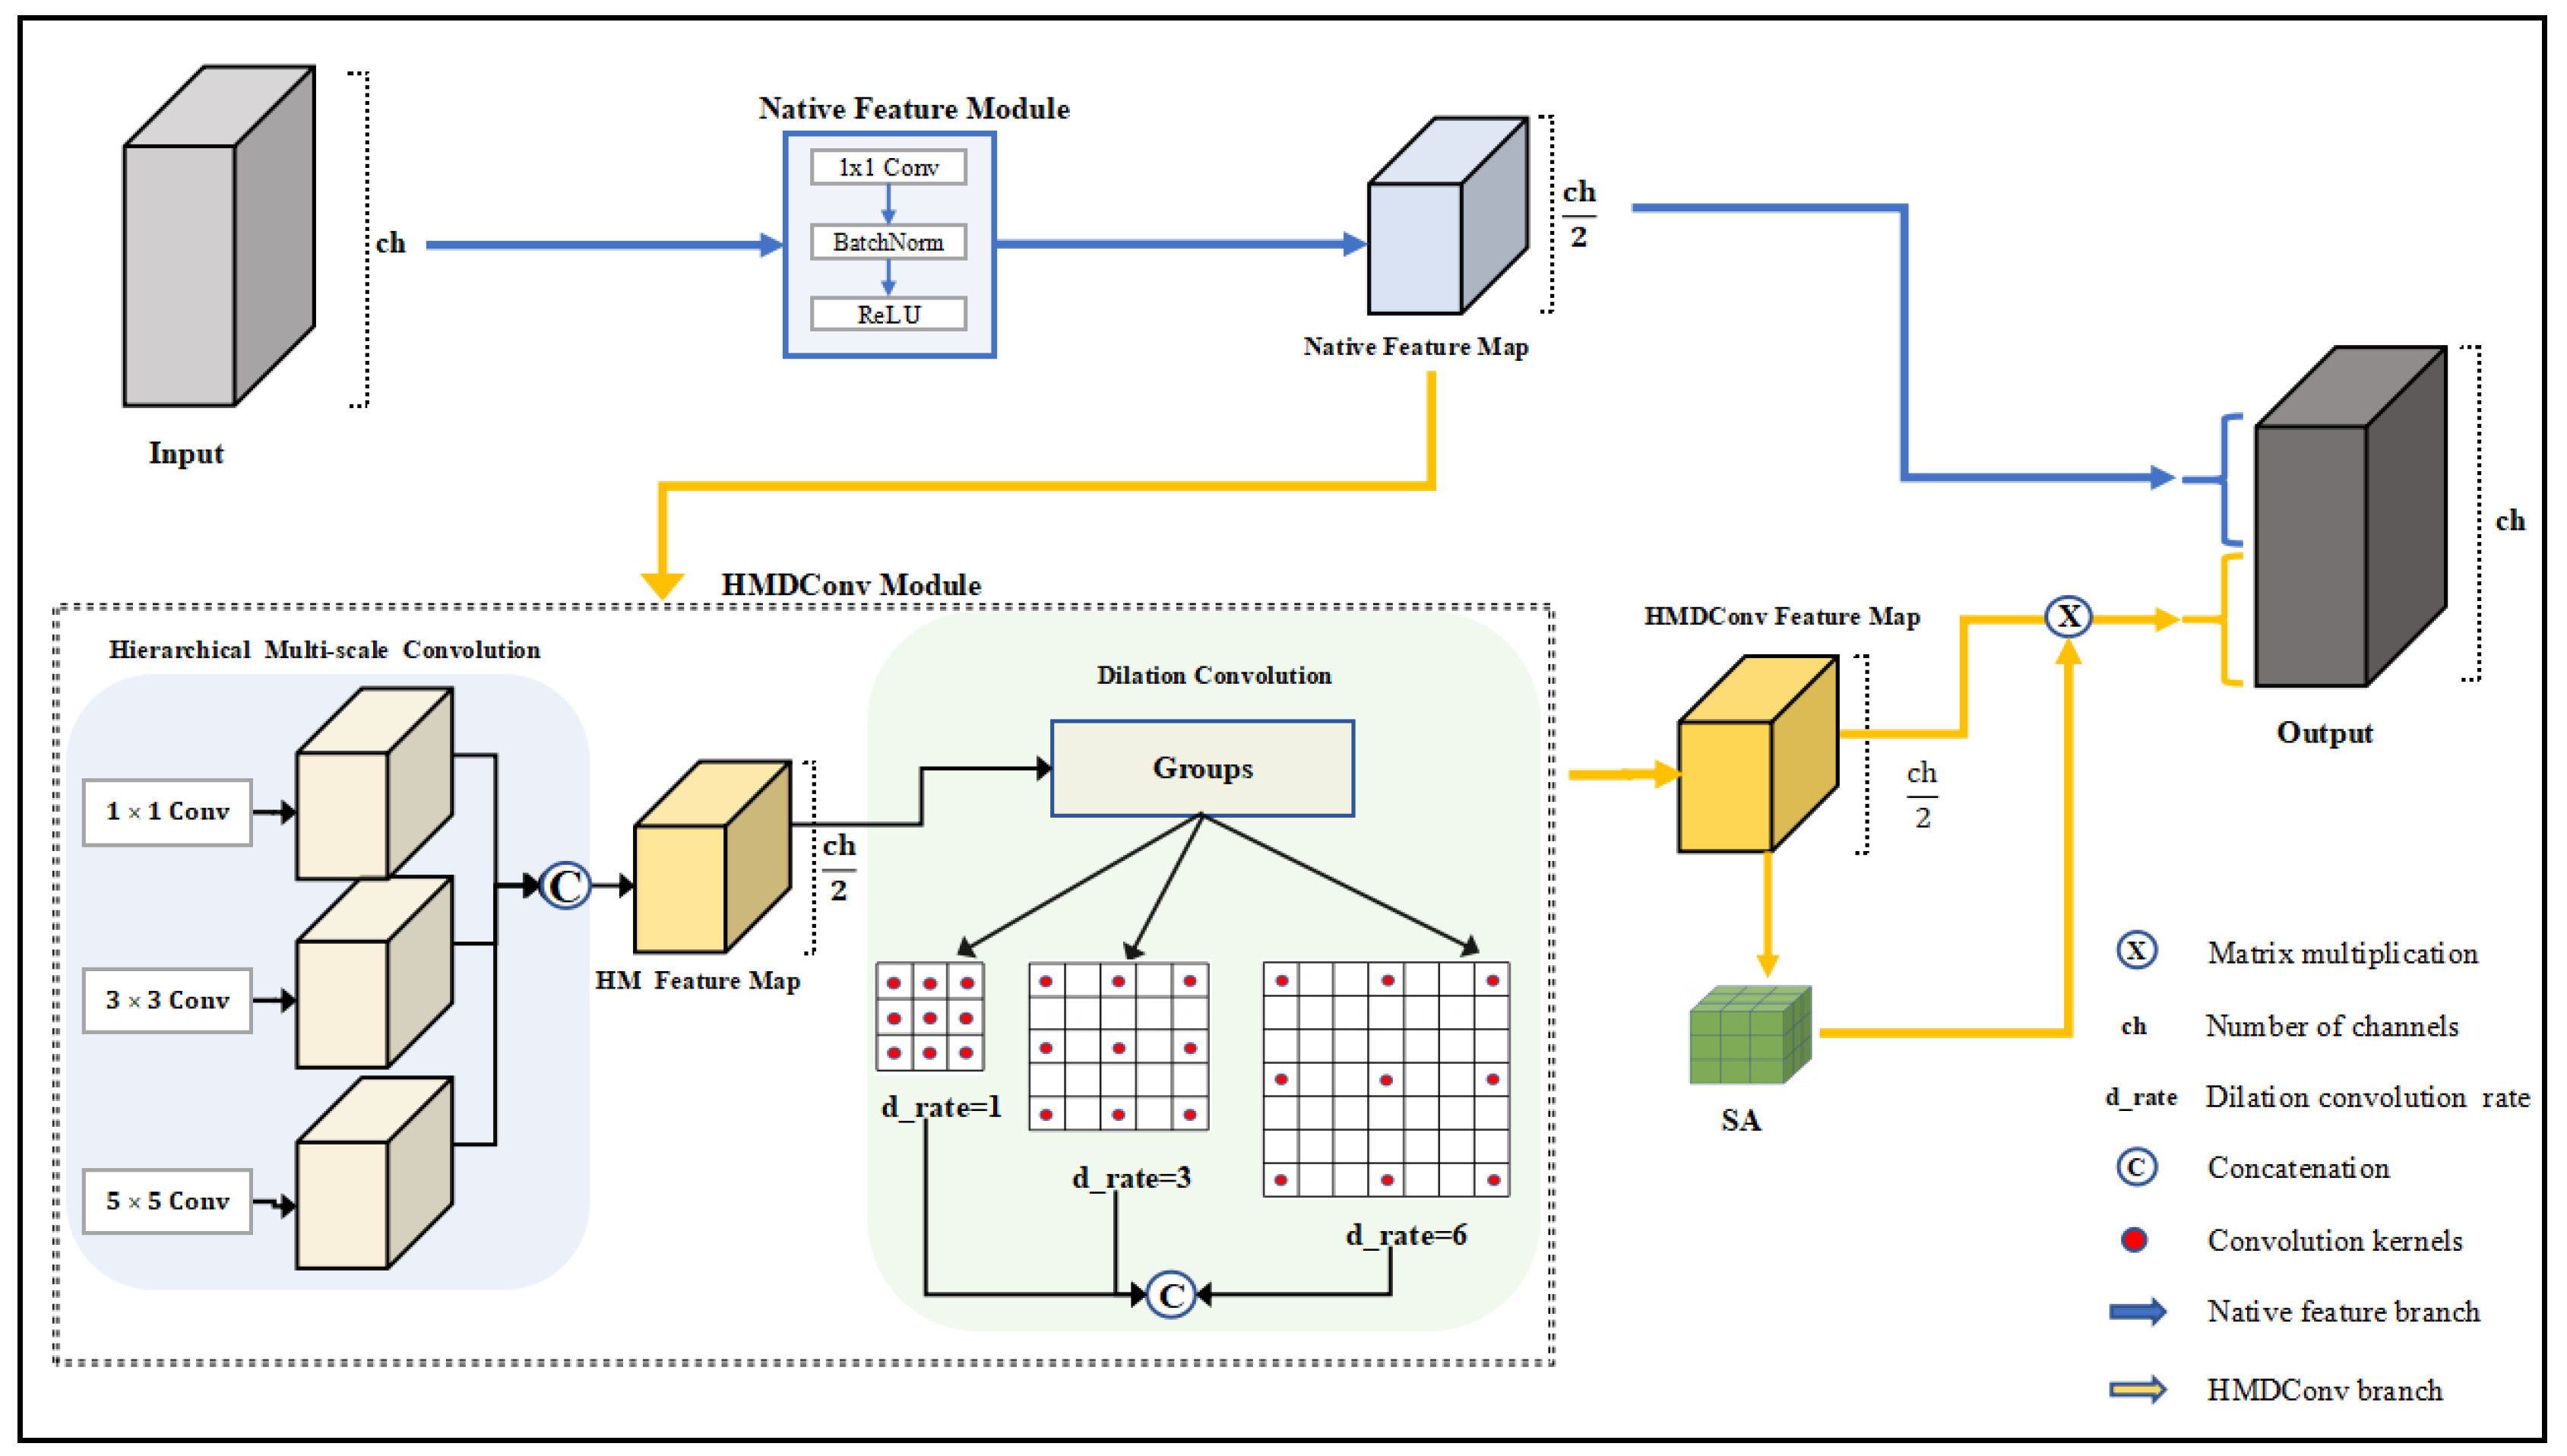
As shown in Figure 3, the N + HMDConv module mainly consists of a native feature branch and an HMDConv branch.

3.2.1. Native Feature Branch

The N + HMDConv module is developed to extract multi-scale features in the Encoder. Similar to USSFC-Net [21], an N + HMDConv module consists of a native feature (N) branch and an HMDConv branch. As shown in Figure 3, the input was first processed in the N branch, then processed in the HMDConv branch, which has an HMDConv module and a spatial attention (SA) module, and finally concatenated with the output from the N branch.

3.2.2. HMDConv Branch

In the native feature branch, standard convolutions were employed, followed by batch normalization and ReLU activation to capture primary features from the input tensor. The extracted native feature map X n a t i v e was used for the input of HMDConv and the concatenation of the final output.
(1)
HM Convolution
In convolution operations, larger convolution nuclei acquire global information but lose details, while smaller convolution nuclei capture local information more carefully [44]. Therefore, we used a combination of kernel sizes, such as (1, 3, 5), in HM convolutions. Specifically, the input feature map is denoted as X R C i n × H × W , where C i n is the number of input channels and H and W represent the height and width of the feature map. HM convolution is represented in Equation (1):
X H M = C o n c a t C o n v k X n a t i v e ,         k 1 , 3 , 5
Small convolution kernels, such as 1 × 1 and 3 × 3, are proficient in extracting detailed local features, thereby minimizing the model’s parameters and computational complexity. Conversely, larger kernels, such as 5 × 5, are crucial for capturing extensive contextual information. The strategic integration of these multi-scale kernels within HM convolutions achieves a balanced feature representation, adeptly blending the precision of local feature extraction with the breadth of contextual understanding. This approach is corroborated by recent studies [45] which endorse the use of a diverse kernel size array in the HM convolution module, enhancing the model’s ability to process complex datasets effectively.
(2)
Dilated Convolution (DConv)
After the extraction of multi-scale features by the N module, the HMDConv module employs dilated convolutions to broaden the receptive field, which is a technique that maintains the parameter count. Lei et al. have researched the optimal combination of dilation rates within the context of CD network feature extraction, identifying the dilation rates of (1, 3, 6) as yielding the highest accuracy [21,46]. This method involves applying different dilation convolutions by channel grouping, as depicted in Equations (2)–(5). Given an input feature map with c h i n channels and an output feature map with y channels, the process is conducted across G groups:
c h i n , g = c h i n G
c h o u t , g = c h o u t G
Y g = c h = 1 c h i n , g K g , c h × X H M g , c h
X H M D C o n v = c o n c a t ( y 0 , y 1 y G 1 )
As shown in Figure 3, in the DConv, groups are obtained by the number of channels, and each group independently uses a different expansion rate for expansion convolution. Convolution with expansion rates of 1 can focus on local features, while expansion rates of 3 and 6 can capture contextual information farther away. In the context of expanded convolutions, we employ grouped convolutions to mitigate computational complexity. Specifically, this approach leverages the structural properties of the input channels to determine the number of groups. This research paradigm is analogous to techniques utilized in image detection, which have consistently demonstrated remarkable performance across various studies. By adopting this strategy, we effectively reduce the computational burden of the model while maintaining robust feature extraction capabilities, thereby enhancing overall performance.
(3)
Spatial Attention Module (SA)
Following the HMDConv, we multiplied with the SA matrix and concatenated with X to complete the convolution processing of the whole N + HMDConv. We introduced an SA module following the feature extraction layers, facilitating the dynamic emphasis on significant spatial regions in the feature. SA aims to magnify the distances between altered and unaltered pixels across the spatial dimension, thereby enhancing the model’s ability to detect changes. The design of the SA module is inspired by the Spatial Attention Mechanism (SAM) in the Convolutional Block Attention Module (CBAM) [35].

3.3. DFA Module

As shown in Figure 2, the DFA module serves as a critical interface between the Encoder and the Decoder. To effectively leverage the dual multi-scale feature maps extracted by the Encoder, the DFA module was designed to enhance the model’s capacity to discern subtle changes within feature maps. The components of DFA, including absolute differential feature calculation, multi-head self-attention (MHSA), channel attention (CA), and Transformer blocks, are introduced in this section.

3.3.1. Absolute Differential Feature Calculation

The input of DFA is each multi-scale feature extracted from two temporally adjacent images I a and I b by the Encoder:
F a = E n c o d e r I a
F b = E n c o d er I b
Simple subtraction operations may diminish the strength of certain change signals due to positive and negative cancellation. To address this issue, we compute the differential feature map Fab through pixel-wise subtraction, followed by taking the absolute value of the result, as shown in Equation (8):
F a b = F a F b
Employing the absolute value can enhance the robustness of the differential feature map and improve the clarity of the variation regions, which may facilitate accurate subtle change detection.

3.3.2. Multi-Head Self Attention

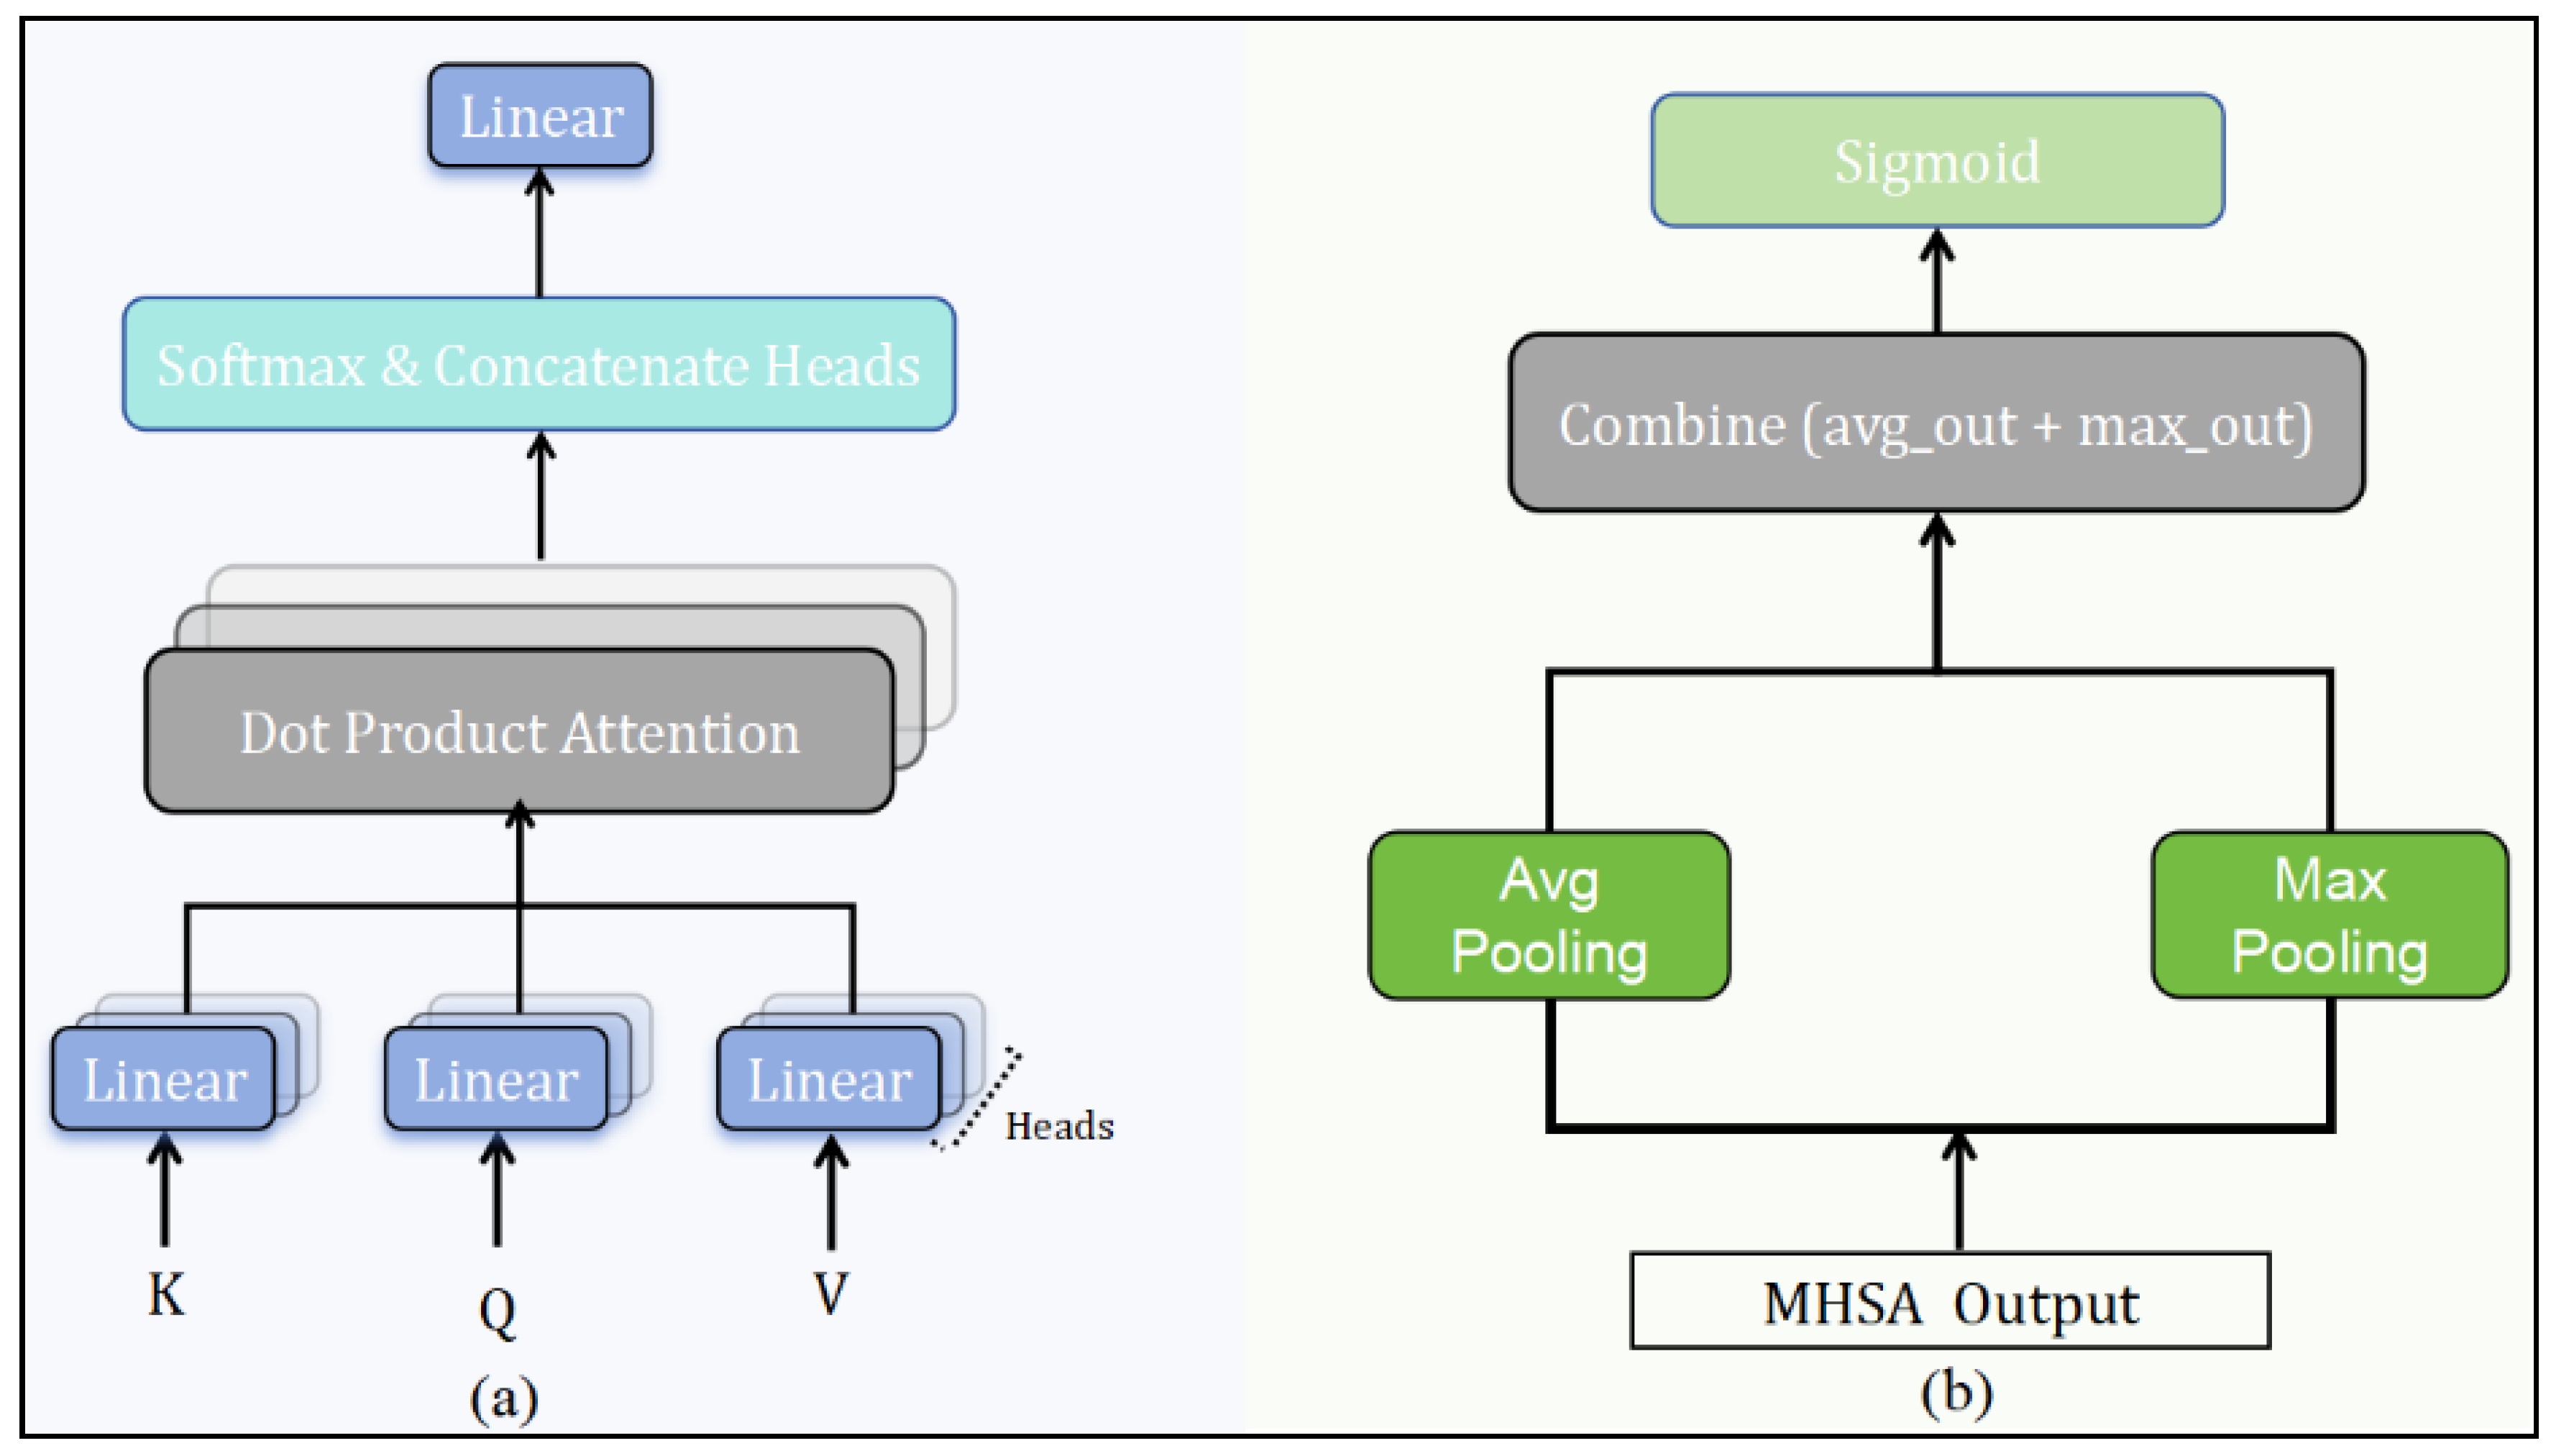
MHSA was employed in the DFA module to capture complex interdependencies among different regions of the feature map. As shown in Figure 4a, the attention scores across multiple heads are computed using the formulation:
A t t e n t i o n Q , K , V = s o f t m a x Q × K T d k × V
In Equation (9), Q, K, and V are the query, key, and value matrices derived from the feature maps, with d k indicating the dimension of the key vectors. This approach allows the model to learn both local and global contextual information, thereby enhancing its ability to detect changes in the input images.
In practice, a multi-head attention module with multiple heads is often used instead of the single attention function shown in the above equation [17]. As shown in Figure 4, the MHSA module attention results are concatenated as Equation (10):
M H S A ( Q , K , V ) = W p C o n c a t ( A t t 1 , A t t 2 , , A t t h )
where the information from different heads is connected. Then, the connected outputs are fused together using the projection matrix W p , which allows the model to effectively incorporate information from multiple attention heads. In our MHSA, we take 8 heads of multiple parallel attention operations.

3.3.3. Channel Attention

The CA mechanism highlights the most informative channels in differential feature maps, enabling the model to focus on significant variations. As shown in Figure 4b, the CA mechanism generates two key channel representations by calculating attention scores based on the average and maximum values across the spatial dimensions of the feature map, where H and W denote its height and width, respectively.
a v g _ s c o r e s c = 1 H × W i = 1 H j = 1 W F a b , c , i , j
m a x _ s c o r e s c = max i , j ( F a b , c , i , j )
The attention weights for each channel are derived as follows:
a t t _ w e i g h t c = σ ( a v g _ s c o r e s c + m a x _ s c o r e s c )
In Equation (13), σ denotes the sigmoid activation function. The purpose of CA is to reduce the background noise and enhance the signal-to-noise ratio by emphasizing relevant channels. This selective amplification is supported by the theoretical foundation of CA, which aggregates both average and maximum pooled features to create robust channel representations. The employment of selective amplification in CA has been demonstrated to be effective in improving the performance of CD by a recent study [47].

3.3.4. Transformer Blocks

To be specific, stacked Transformer blocks were utilized to build the DFA module. Transformer blocks are fundamental components designed to enhance feature extraction through self-attention mechanisms, which can preserve the integrity of the context and improve its feature extraction process. As shown in Figure 5, each block consists of the following main components: MHSA layer, CA layer, feedforward neural network, and residual connection normalization.
MHSA and CA have been introduced above. MHSA converts the input feature maps into query, key, and value vectors and then feeds the MHSA-processed results into the CA layer. This combined attention processing is essential to effectively capture spatial and channel information. Following that, the output is combined with the original input via a residual connection, which helps preserve vital information and addresses gradient vanishing issues. Layer normalization is applied to stabilize training. The attention-enhanced features are then processed through a feedforward neural network comprising two linear transformations separated by a ReLU activation, further refining the feature representation.

3.4. The Other Compositions of the MDFA-Net Architecture

3.4.1. Other Compositions of the Encoder

The Encoder employs an unweighted shared Siamese backbone to extract bi-temporal image features. The architecture integrated five consecutive down-sampling modules to enhance the depth of the feature maps, allowing for sufficient representation of spatial information. Besides the N + HMDConv module, the Encoder comprises four crucial components:
(1)
Multi-Stage Convolutional Layers
The Encoder architecture incorporates multi-stage convolutional layers that systematically apply learned filters to extract spatial features from input images. This structure is vital for recognizing intricate patterns and textures in remote sensing imagery, thus enabling effective differentiation of diverse land cover types. The hierarchical design of the model allows it to capture both local and global features, which is essential for robust change detection.
(2)
Activation Functions
Post-convolution, non-linear activation functions, primarily the ReLU, are employed to enable the model to learn complex, non-linearly separable representations. ReLU enhances representational capacity and mitigates vanishing gradient issues.
(3)
Batch Normalization
Batch normalization is applied after each convolutional layer to stabilize learning by normalizing outputs. This technique reduces internal covariate shifts and ensures consistent feature distributions, which accelerates convergence and improves overall model performance.
(4)
Max Pooling
Max pooling is applied after each convolutional block using a 2 × 2 pooling window with a stride of 2, which reduces the spatial dimensions of feature maps by half. By selecting the maximum value in each pooling window, it retains key features while discarding less critical information and helps reduce computational complexity.

3.4.2. Other Compositions of the Decoder

The Decoder is designed to reconstruct high-resolution change detection maps from the refined features outputted by the Encoder. This reconstruction plays a crucial role in accurately delineating areas of change. The architecture of the Decoder comprises four components, as follows:
(1)
Upsampling Layers
The Decoder begins with a series of upsampling operations that incrementally increase the spatial dimensions of the feature maps. Each upsampling layer is denoted as U p n , where n corresponds to the respective level in the network.
(2)
Feature Concatenation
At each step of the up-sampling process, we concatenate the up-sampled feature map with the feature map of the corresponding layer in the Encoder. It better leverages both high-resolution spatial information and the refined semantic features from the earlier and deeper layers. It can be expressed mathematically as:
d n = c a t x n 1 , U p s a m p l e d n + 1 , d i m = 1
where d n represents the feature map at level n, dim = 1 indicates concatenating feature maps along the channel dimension, and x n 1 denotes the features from the Encoder. This setup maintains spatial dimensions, preserving the U-Net architecture’s structural integrity and multi-scale feature capture and enhancing representational capacity by enabling effective feature fusion through combining high-resolution spatial information with deep semantic data.
(3)
Convolutional Refinement
Following concatenation, a series of convolutional layers, termed Up Convolutions, are set to refine the combined feature maps. This can enhance the model’s expressiveness and improve change of boundary detection results.
(4)
Final Output Layer
Final Output Layer: The final step includes a 1 × 1 convolution that reduces the feature maps to the desired output channels. A Sigmoid activation function is applied to produce pixel-wise probabilities, enabling the identification of change areas in remote sensing imagery. This transformation empowers us to discern the minute details of change within the vast canvas of remote sensing imagery, with each pixel’s value now representing its likelihood of being part of an area undergoing change. As a result, we obtain the final I o u t .

3.5. Loss Function

To optimize MDFA-Net, we employ a Binary Cross–Entropy Loss (BCELoss) as our objective function, designed to quantify the divergence between the model’s predicted outputs and the actual binary labels indicative of change. This choice is grounded in its proven effectiveness in binary classification tasks, especially in minimizing false positives and negatives, which is critical for accurate change detection in remote sensing imagery. The BCELoss is formulated as follows:
B C E L o s s = 1 N i = 1 N y i log ( p i ) + ( 1 y i ) log 1 p i
where N is the total number of samples (or pixels), y i is the ground-truth label for the i-th sample, and p i denotes the predicted probability of change. In other applications, BCELoss can effectively measure the discrepancy between predicted and actual values, guiding the training process to enhance the model’s accuracy in distinguishing between altered and unaltered areas.

4. Results

4.1. Experimental Setup

4.1.1. Datasets

In this study, we employ three distinct datasets to rigorously evaluate the performance of our proposed MDFA-Net in remote sensing image change detection. They are the WHU-CD dataset [48], CDD dataset [49], and LEVIR-CD dataset [50]. Detailed information about these datasets is shown in Table 1.
WHU-CD Dataset: WHU-CD was developed by Wuhan University, documenting post-earthquake construction activities in a specific region of New Zealand following a 6.3 magnitude earthquake in 2011. This dataset consists of pairs of high-resolution remote sensing images, captured in 2012 and 2016, with spatial dimensions of 32,507 × 15,354 pixels. To facilitate efficient GPU memory usage and mitigate the risk of overfitting, the large-scale image pairs are segmented into smaller patches of 256 × 256 pixels. The resulting dataset is randomly divided into three subsets: 6096 pairs allocated for training, 762 pairs for validation, and 762 pairs for testing. Each subset includes images from the two different temporal phases (T1 and T2), alongside the respective change labels.
CDD Dataset: The CDD dataset is a publicly available change detection resource that captures pronounced seasonal variations within a specific geographic area, sourced from Google Earth imagery. CDD Dataset is a combination of various change types, primarily including buildings, roads, and vehicles. To enhance the usability of the dataset, the original images underwent systematic cropping and rotation, resulting in 16,000 patches with sizes of 256 × 256 pixels. The dataset is organized into three distinct subsets: 10,000 pairs designated for training, 3000 pairs for validation, and 3000 pairs for testing. Each subset contains images captured at two different temporal instances (T1 and T2), accompanied by the requisite change labels for comprehensive evaluation.
LEVIR-CD Dataset: The LEVIR-CD dataset is a comprehensive public change detection dataset meticulously curated from Google Earth. This dataset includes 637 pairs of bi-temporal remote sensing images, each exhibiting complex change features captured over temporal spans ranging from 5 to 14 years. The images possess dimensions of 1024 × 1024 pixels. To optimize GPU memory utilization and mitigate the risk of overfitting, the original images are processed into 13,072 non-overlapping patches of size 256 × 256 pixels. Subsequently, the dataset is organized into three subsets: 10,000 pairs for training, 1024 pairs for validation, and 2048 pairs for testing. Each subset contains images captured at two distinct temporal instances (T1 and T2), with corresponding change labels provided.

4.1.2. Implementation Details

We implemented the proposed MDFA-Net model using the PyTorch library (version 1.10.0). The training and inference were conducted on a single A40 GPU (48 GB of memory) provided by AutoDL, a cloud service provider. The experiments were carried out in a computing environment that included Python 3.8, Ubuntu 20.04, and CUDA 11.3. The system was also equipped with a CPU featuring 15 vCPUs based on the AMD EPYC 7543 32-Core Processor. Furthermore, the network parameters were optimized using the Adam optimizer (form PyTorch version 1.10.0), with a momentum value set to 0.9 and a weight decay of 0.0001. The loss function was BCELoss, which is suitable for the binary classification nature of change detection. The initial learning rate was configured at 0.0001, and a batch size of 16 was chosen to balance memory efficiency and computational performance. During training, we employed a poly-scheduling strategy to gradually adjust the learning rate to zero over the course of 200 epochs. At the end of each training epoch, inference on the validation was performed to evaluate the model’s change detection performance. Subsequently, the model with the highest F1 score for evaluation on the test set was selected as the optimal model to ensure comparability in quantitative results.

4.1.3. Evaluation Metrics

The primary objective of CD is to accurately identify changed and non-changed pixels, which fundamentally constitutes a binary classification problem. To assess the performance of the proposed MDFA-Net, we utilized a comprehensive set of evaluation metrics that are pivotal in reflecting the model’s efficacy in distinguishing between altered and unaltered regions in remote sensing images. The evaluation metrics employed in this study include precision (Pre), recall (Rec), F1 score (F1), Intersection over Union (IoU), and Overall Accuracy (OA). Each metric serves a distinct purpose and provides insight into different facets of model performance.
Precision (Pre) quantifies the proportion of true positive predictions among all instances classified as positive by the model. It is mathematically represented as:
P r e = T P T P + F P
where TP denotes true positives and FP signifies false positives. A higher precision value indicates a higher correctness rate in the model’s positive predictions, thus minimizing the occurrence of false alarms.
Recall (Rec) evaluates the model’s ability to identify all relevant instances, reflecting the ratio of true positive predictions to the total number of positive samples. It is formulated as:
R e c = T P T P + F N
Here, FN represents false negatives. A higher recall score signifies that a greater proportion of actual positives have been successfully detected, which is critical in applications where missing changes can have significant consequences.
F1 score (F1) is the harmonic mean of precision and recall, providing a single measure that balances both metrics. It is particularly useful in cases where there is an uneven class distribution. The F1 score is articulated as:
F 1 = 2 × P r e × R e c P r e + R e c
An elevated F1 score indicates enhanced detection accuracy, reflecting the model’s robustness in correctly identifying changes while maintaining a low false positive rate.
Intersection over Union (IoU) is a critical metric for evaluating change detection accuracy. It quantifies the overlap between the predicted and actual regions, thereby providing a measure of how well the model identifies changing areas. Mathematically, IoU is defined as:
I o U = T P T P + F N + F P
where TP denotes true positives, FP signifies false positives, and FN represents false negatives. The value of IoU ranges from 0 to 1, with a higher score indicating better performance in accurately identifying changes. In many practical applications, a threshold for IoU is often established to determine the validity of the model’s predictions.
Overall Accuracy (OA) serves as a general metric to evaluate the model’s performance across all classifications, encapsulating both correct and incorrect predictions. It is defined as:
O A = T P + T N T P + T N + F P + F N
where TN signifies true negatives. A higher OA percentage denotes an overall effective classification performance, ensuring that the model not only detects changes but also accurately identifies stable regions.
In summary, integrating precision, recall, F1 score, and Overall Accuracy into the evaluation framework provided a comprehensive assessment of MDFA-Net performance in the BCD task.

4.2. Comparative Studies of State-of-the-Art Methods

4.2.1. Overview of Baseline Models and State-of-the-Art Approaches

Nine state-of-the-art BCD methods using remote sensing images are compared with our method, including the fully convolutional early fusion network (FC-EF) [24], the fully convolutional early fusion network (FC-Siam-Diff) [24], the fully convolutional Siamese-concatenation network (FC-Siam-Conc) [24], the spatial–temporal attention-based network (STANet) [51], Change Former [39], the deeply supervised image fusion network (DSIFN) [13], BIT [42], the densely connected Siamese nested U-shape network (SNUNet) [27], and the USSFC-Net [21]. As previously mentioned, USSFC-Net has achieved state-of-the-art performance across several datasets in 2023. In addition, some thoughts from USSFC-Net were applied and modified in our work. Therefore, we selected USSFC-Net as our primary reference for the comparison.

4.2.2. Accuracy Performance Comparison

We compared the accuracy performance of MDFA-Net with those of the other models using three datasets, as shown in Table 2, Table 3 and Table 4.
(1)
Comparison on WHU-CD
The experimental results on the WHU-CD dataset are presented in Table 2. The proposed MDFA-Net was demonstrated to have superior performance to other methods, while USSFC-Net achieved second place. Specifically, when comparing our model to USSFC-Net, a higher F1 score, Rec, and IoU could be observed, showing 1.13%, 0.80%, and 1.94% improvement, respectively. Although Pre was slightly lower in MDFA-Net than in USSFC-Net, the notable increase in F1 score indicates a better balance between precision and recall in our model than in USSFC-Net. The effectiveness of MDFA-Net on WHU-CD was verified, as it achieved a state-of-the-art accuracy performance.
(2)
Comparison on CDD
The experimental results on the CDD dataset are presented in Table 3. In particular, the experimental results of each model in Table 3 were obtained using CDD datasets containing various types of changes. Our MDFA-Net model demonstrated superior performance compared to existing methods, indicating significant improvements. In the F1 score, Pre, IoU, and OA, MDFA-Net achieved the best performances among all models and were ahead of the second by 1.06%, 2.18%, 1.92%, and 0.31%, respectively. Regarding recall, our MDFA-Net achieved second place, only behind USSFC-Net by 0.08%. Therefore, these two models have comparable performances in recall on the CDD dataset. But MDFA-Net outperformed in terms of overall performance, which demonstrates the effectiveness of MDFA-Net in promoting CD accuracy on the CDD dataset.
(3)
Comparison on LEVIR-CD
The experimental results on the LEVIR-CD dataset are listed in Table 4. The proposed model had the highest values in F1-score, IoU, and OA, all of which are overall performance evaluations. Also, the proposed method had the second highest accuracy in Pre and Rec, which indicates that the proposed method can balance precision and recall to achieve state-of-the-art overall performance on the LEVIR-CD dataset. It is noteworthy that the original paper that proposed USSFC-Net did not provide IoU or OA [21]. Nevertheless, our model achieved superior performance in both of these metrics when compared to other models. Again, the proposed model was effective on the LEVIR-CD dataset.

4.3. Comparative Analysis

To evaluate the effectiveness of the proposed modules, i.e., HMDConv and DFA, we conducted separate ablation experiments. The non-weighted shared Siamese U-Net was utilized as a baseline, as modules were added to this baseline to systematically evaluate their functionality. Regarding to its data size, we employed the LEVIR-CD dataset in this evaluation. F1 score, Pre, Rec, IoU, and OA are presented in Table 5.
According to the experimental results, the introduction of HMDConv improved F1 by 1.29% on top of the baseline. Furthermore, the introduction of DFA greatly improved the detection accuracy, as Pre and F1 score were 4.28% and 1.99% higher than the baseline, respectively. The combination of HMDConv and DFA showed the best performance in the experiment. Therefore, HMDConv and DFA are both valid in terms of improving the model’s performance.

5. Discussion

In this section, the advantages and limitations of the proposed model are discussed based on the experimental results and comparative analysis.

5.1. Advantages

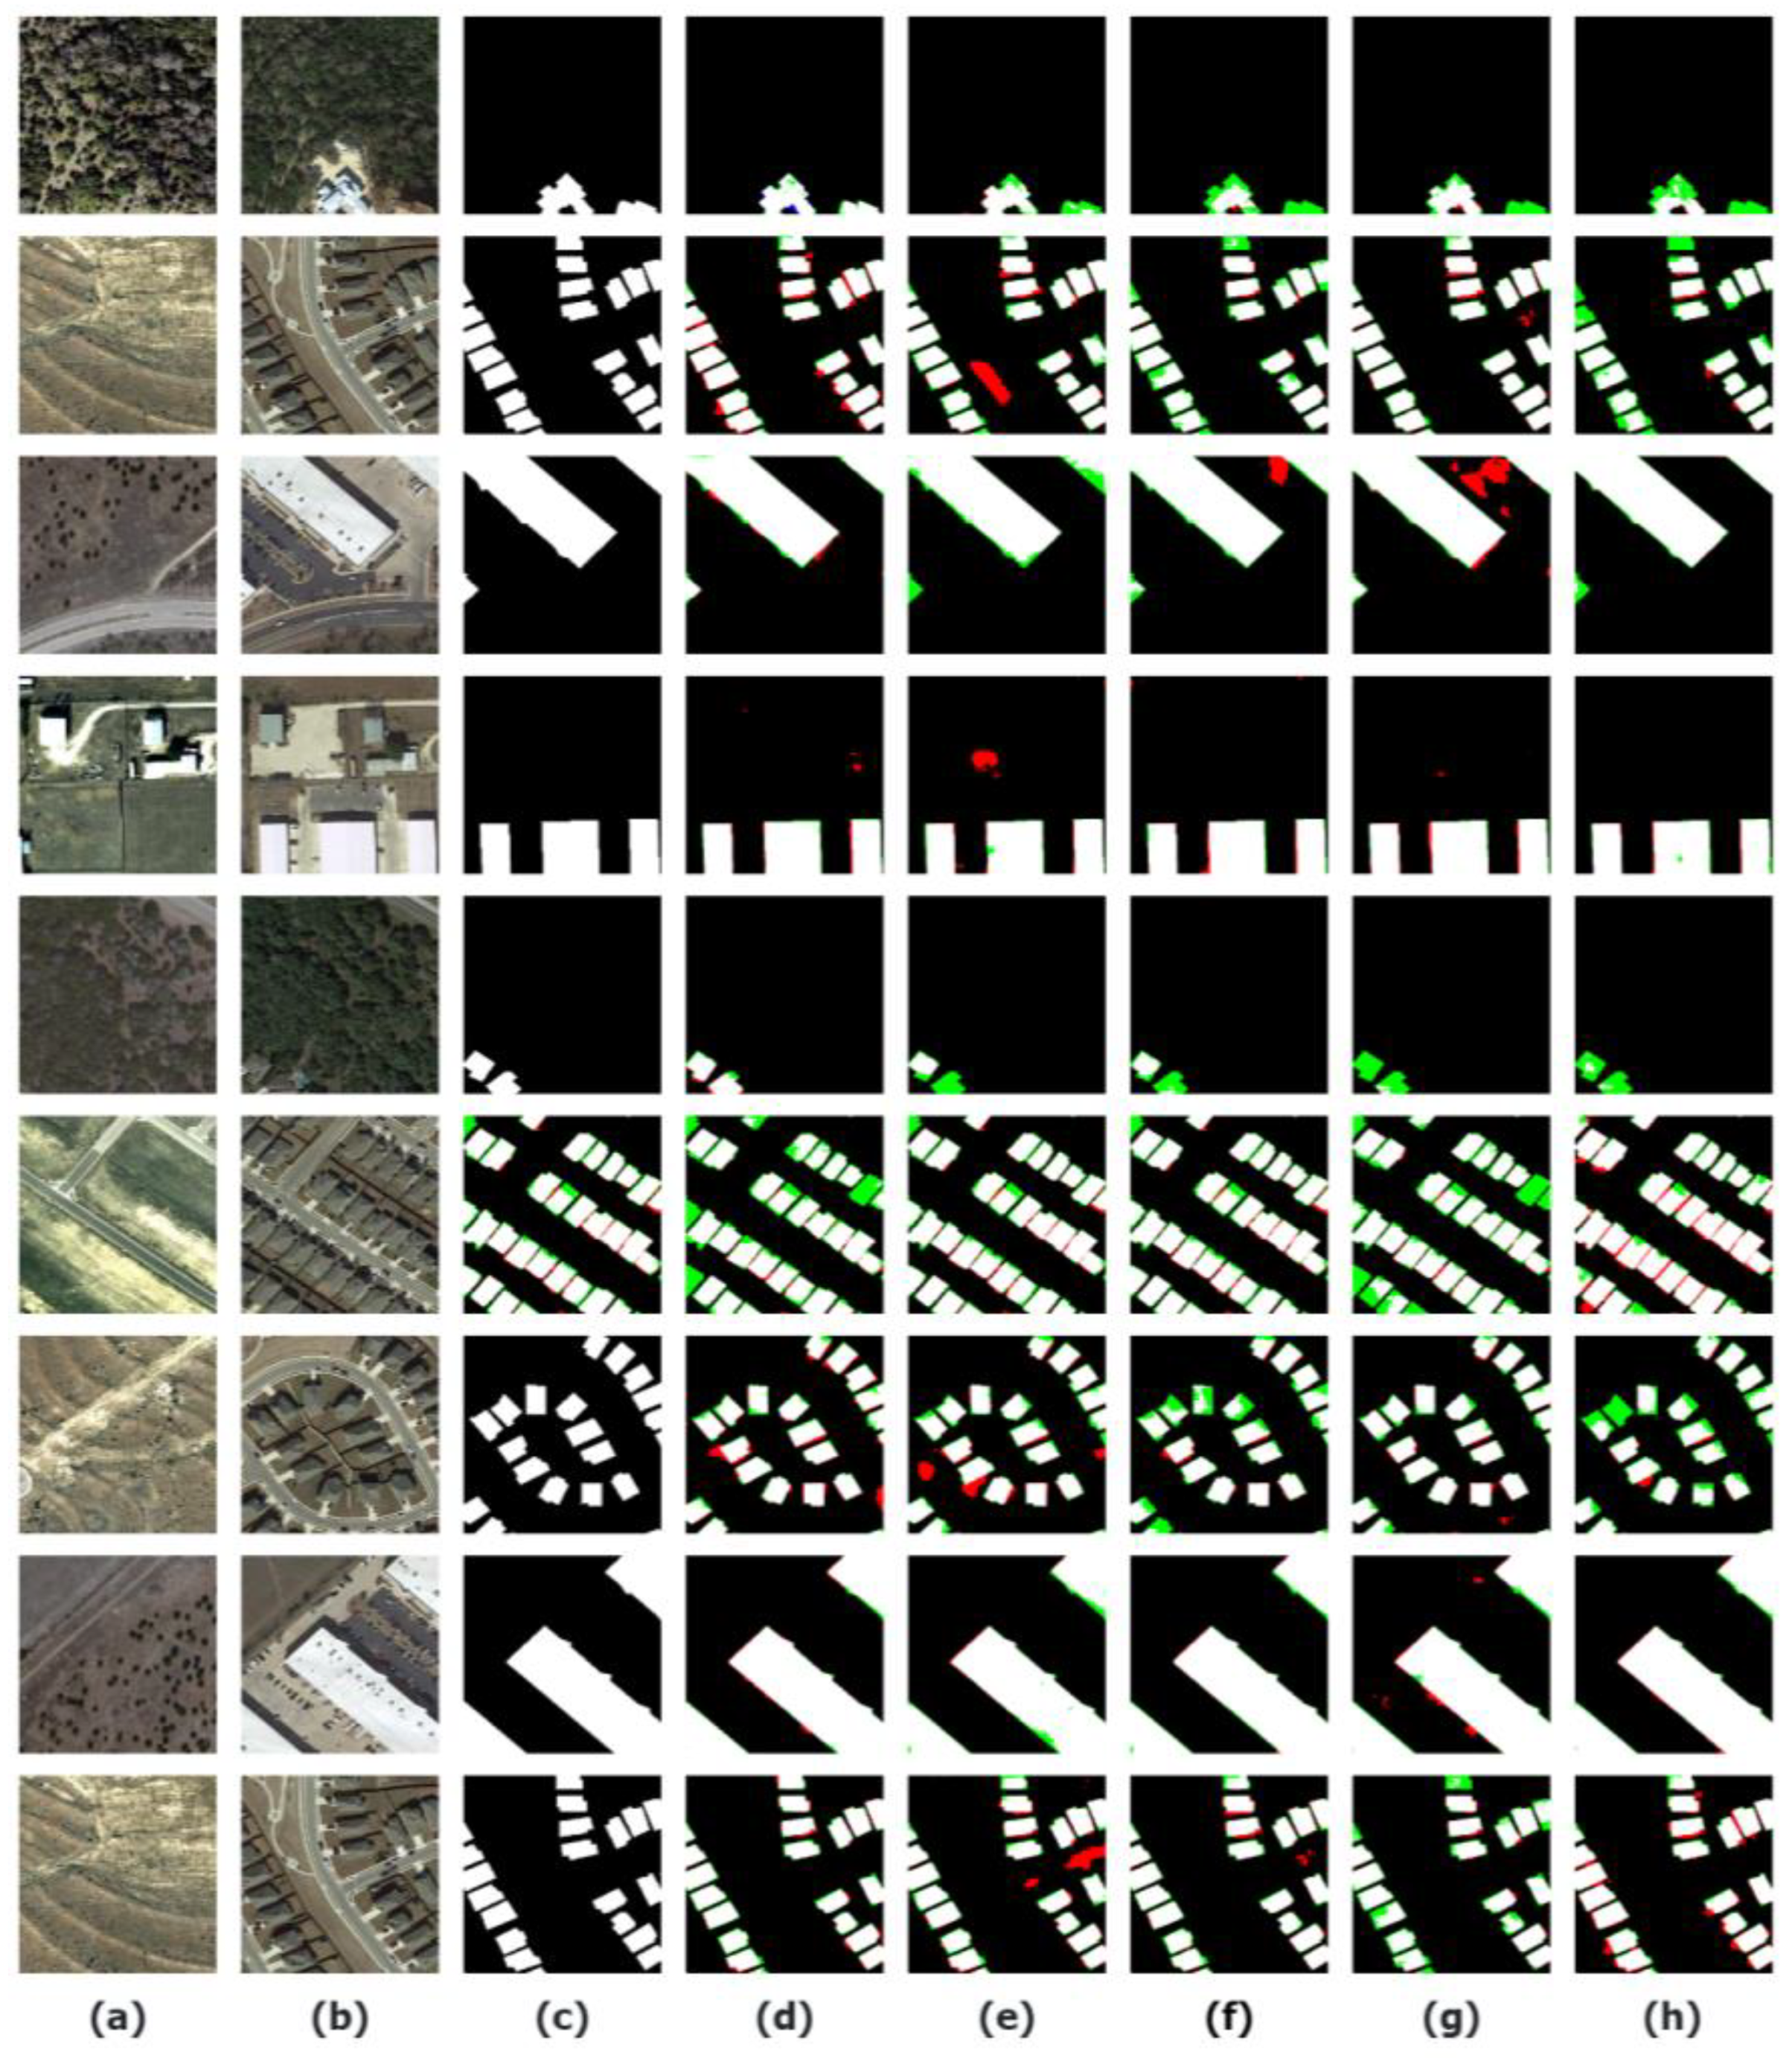
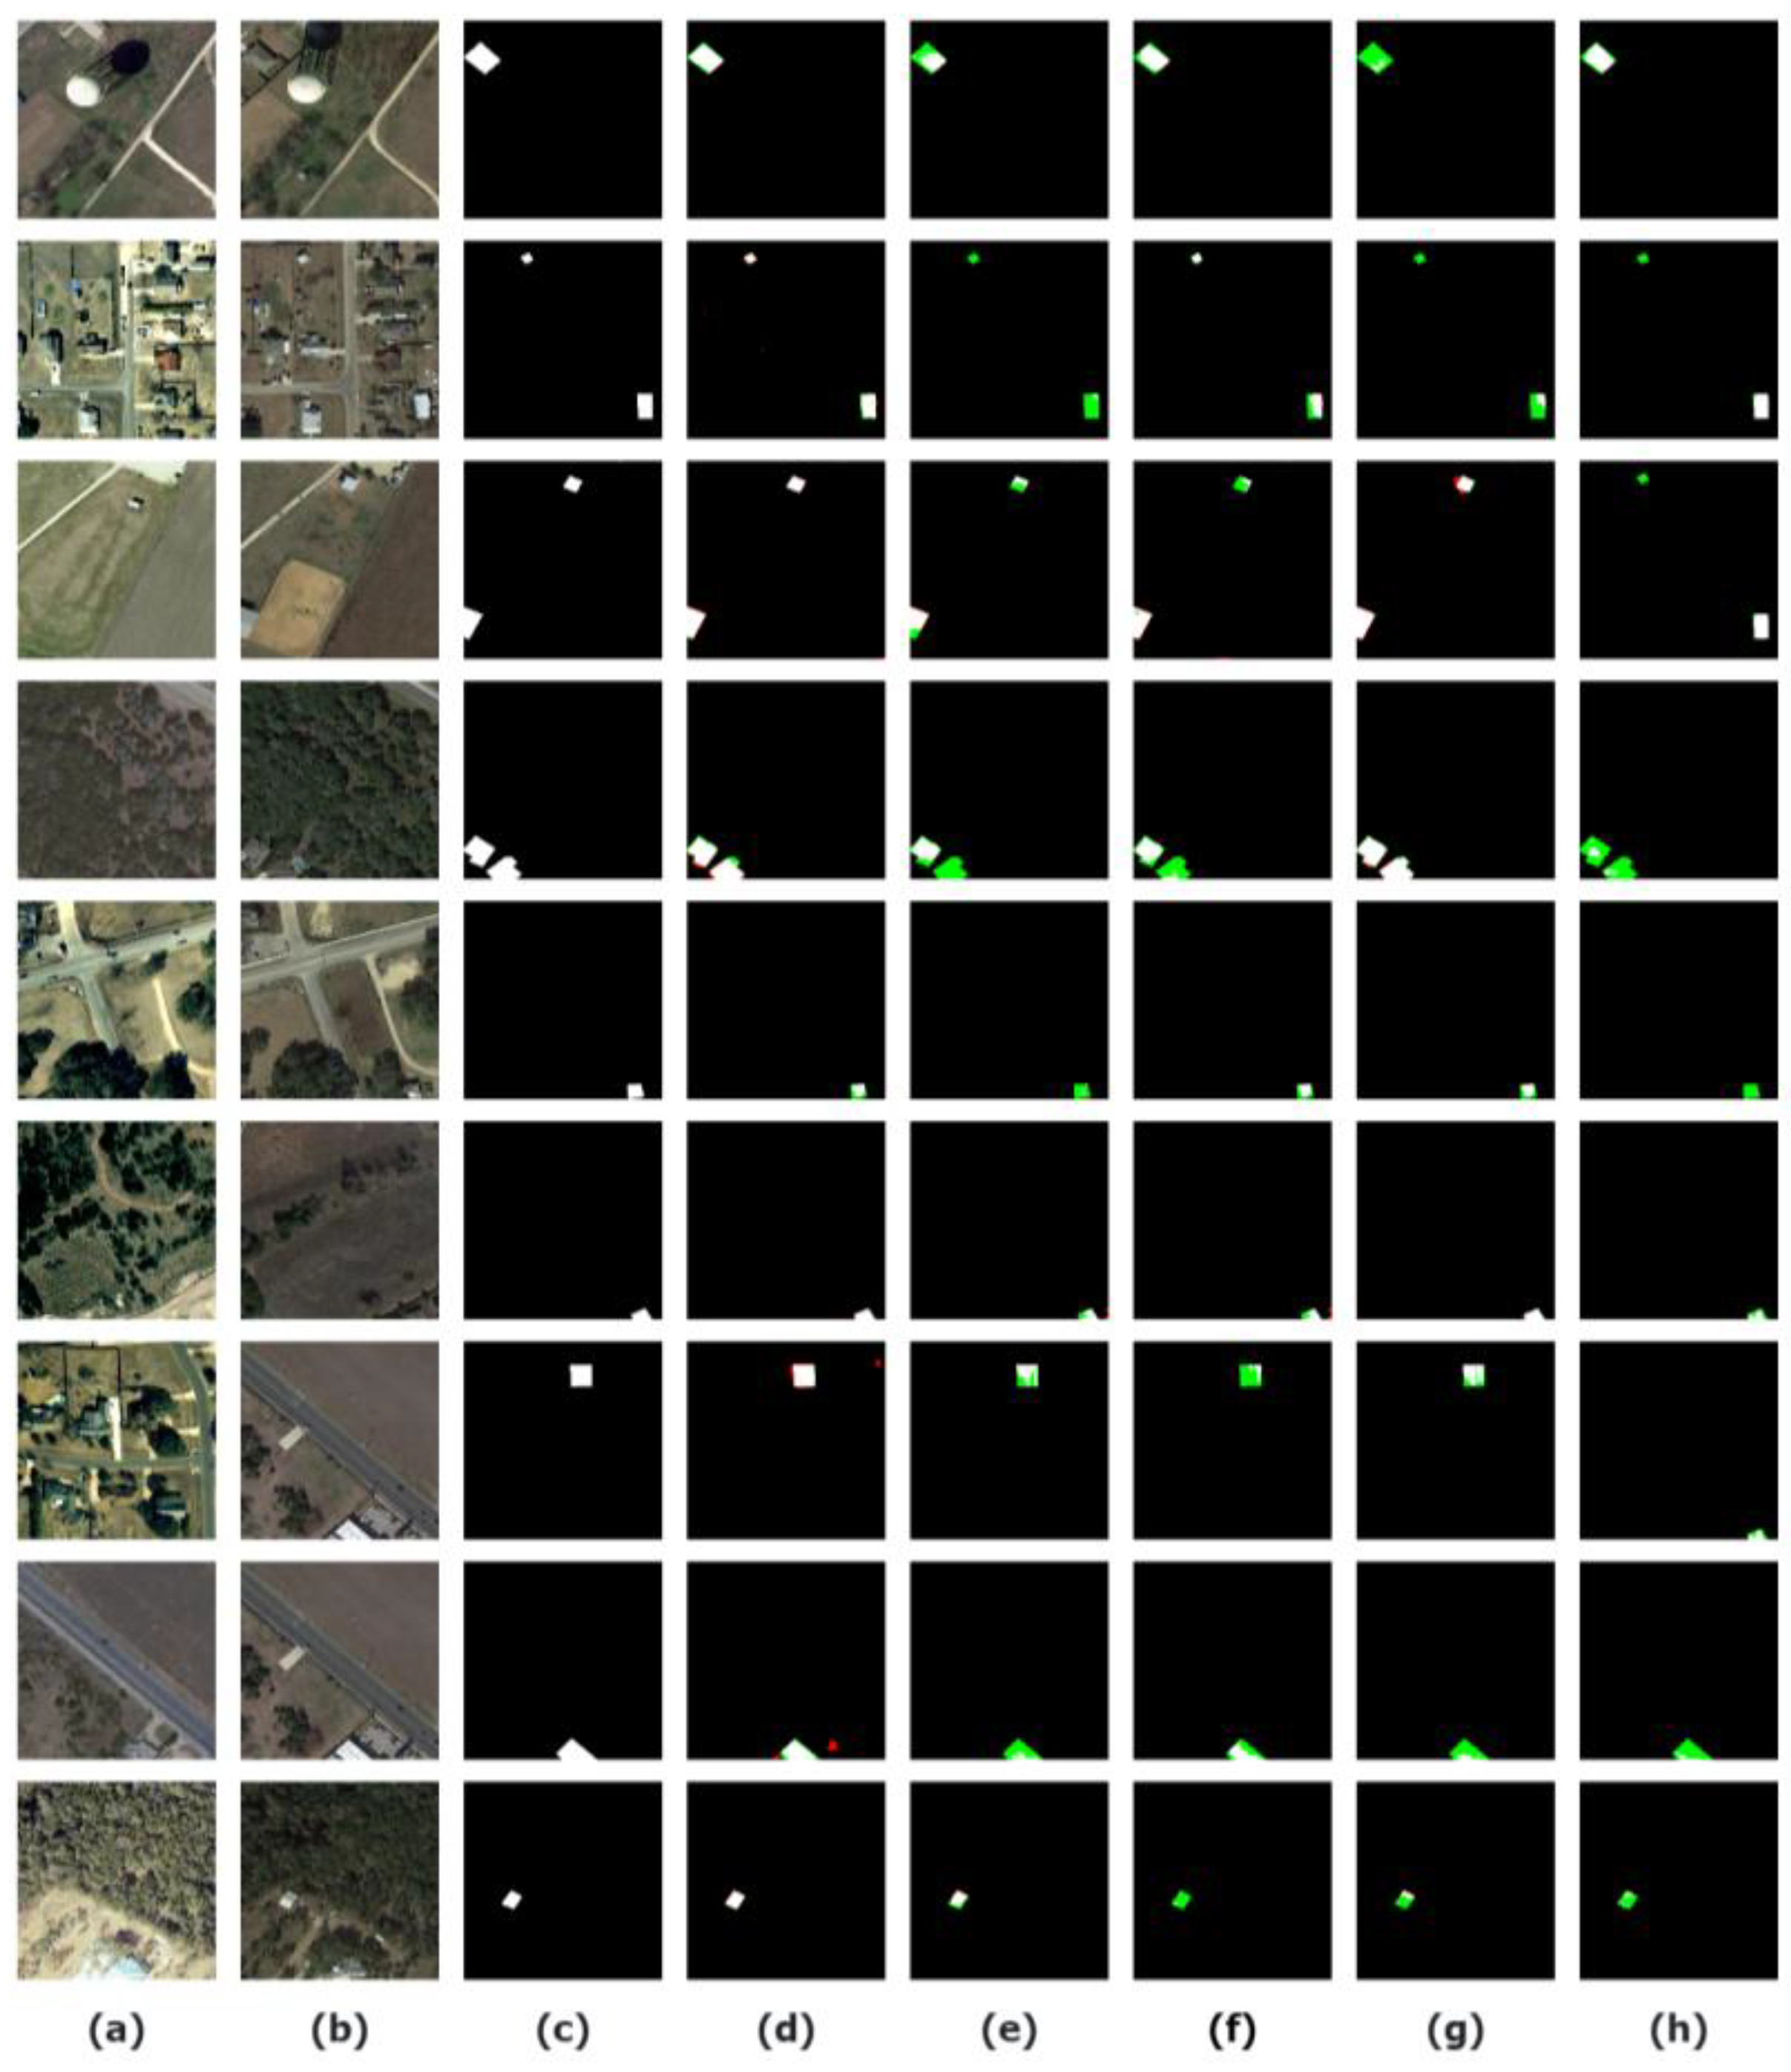
In Section 4.2, MDFA-Net outperformed all other models in overall performance, i.e., F1 score and OA, in all three open datasets. In addition, MDFA-Net achieved top 2 in all precision and recall tests. These results indicate state-of-the-art performance in the BCD task. To better understand its performance, examples in LEVIR-CD by MDFA-Net, BIT, Change Former, SNUNet, and USSFC-Net were selected for manual checking. We randomly selected nine scenarios in each figure to present the detection results comprehensively (Figure 6, Figure 7 and Figure 8). In Figure 6, different colors are used to represent the detection effect. TP is represented by the white ratio, TN by black, FP by red, and FN by green. As shown in Figure 6, MDFA-Net achieved better results than other models in the following two aspects: 1. Small and sparse building changes were falsely detected in other models as the FN (green) areas were larger and more frequent than MDFA-Net. Notably, MDFA-Net had fewer FP (red) results, which conforms to its highest precision among all models. 2. MDFA-Net performed better in dealing with irregular building boundary detection of changing regions than other models because its change map had smoother and more complete boundaries. To this end, MDFA-Net achieved a balance in precision and recall and likely showed an outstanding performance in subtle change detection.
Effective subtle change detection is an ever-present challenge in CD. In BCD, existing methods have problems in terms of missing detailed information in feature extraction of small target buildings, which is prone to false and missed detection. To verify the advantage of MDFA-Net in subtle change detection, examples whose building areas were less than 32 × 32 pixels were selected from the LEVIR dataset. In Figure 7, the red areas indicate multiple detection areas that did not change, but were incorrectly detected as changing (FP). The green areas are missed change areas that actually changed but were not recognized by the model (FN). As shown in Figure 7f,g, we can tell that there were many FN areas in results from other models. In contrast, the proposed MDFA-Net had much less FN in small building change detection and showed more accurate edge detection results. To this end, MDFA-Net was demonstrated to have more effective subtle (small-sized building) change detection among other models.
We believe the outstanding performance of MDFA-Net is mainly owing to the proposed DFA and HMDConv modules. As previously mentioned in Section 4.3, the results demonstrated that either or both DFA and HMDConv can improve model performance. Furthermore, the results presented a remarkable improvement in accuracy when DFA was employed, highlighting its contribution to the proposed framework.
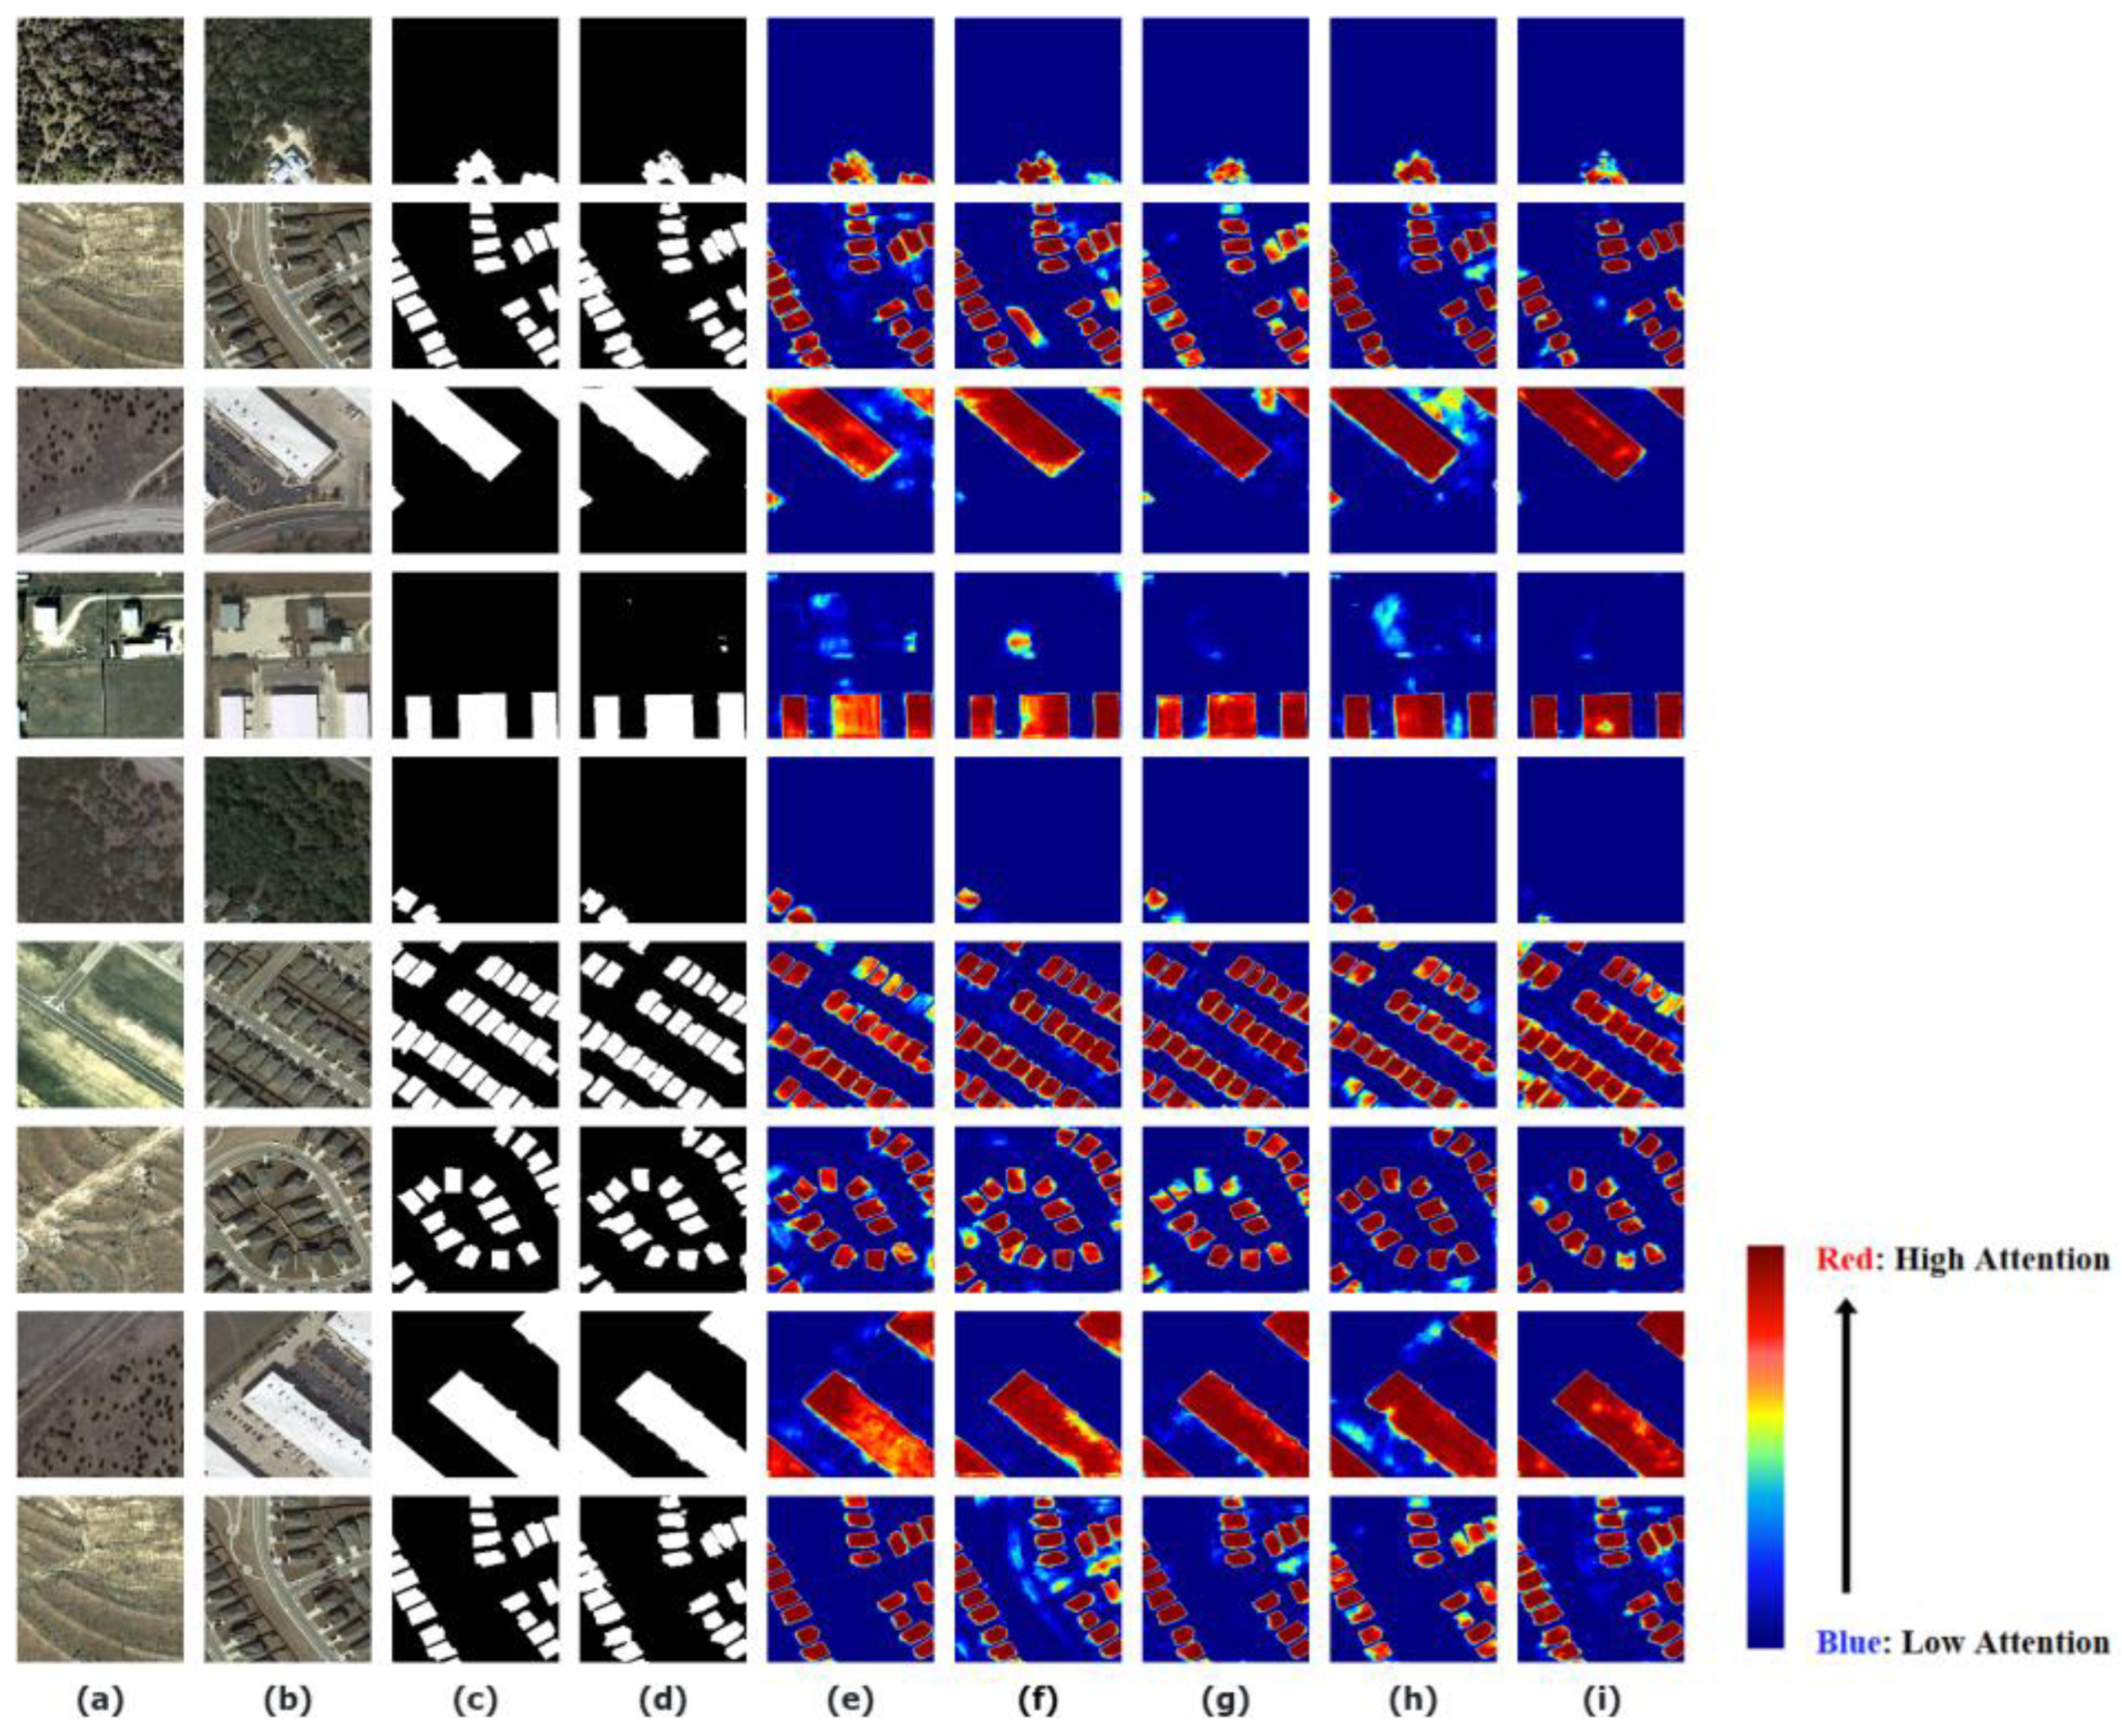
DFA was proposed to address the problem identified by Shen et al., where direct fusion of native and auxiliary feature maps can lead to significant feature redundancy [11]. DFA is supposed to refine the saliency of change regions, empowering the network to dynamically modulate attention weights across diverse areas in the feature maps. To further verify the effectiveness of DFA, we examined the attention activation map of Figure 8 below for the final differential feature output in the model on the LEVIR-CD dataset. In Figure 8, feature attentions from the MDFA-Net are better activated in building areas, where less false detection and clearer building boundaries exist compared to other results. Theoretically, DFA mitigates the potential for redundancy present in the auxiliary feature maps while simultaneously preserving vital features that contribute to subtle change detection. The innovative approach of leveraging maximum aggregated differential features as key parameters for generating attention scores markedly enhances the model’s sensitivity and precision in identifying subtle changes.
On the other hand, HMDConv complements the strengths of DFA significantly. Abundant building features generated by HMDConv provide a robust foundation upon which the advantages of DFA can be further realized. This synergistic relationship not only improves the framework’s overall efficacy, but also ensures a comprehensive representation of both broad and subtle changes in images.
Moreover, the inclusion of various change targets in the CDD dataset provides a broader scope of test scenarios. As our research is primarily focused on building change detection, the promising results on the CDD dataset indicate its great potential in detecting other types of changes as well. The robustness and generalization capability of MDFA-Net have been explored across different types of changes.

5.2. Limitations and Further Directions

The proposed model has the following limitations: (1) Sensitivity to hyper-parameters. The proposed model could be sensitive to hyper-parameters in training, e.g., batch size and learning rate, and parameters in model structure, e.g., dilation convolution size. Current parameter settings mainly rely on previous settings. More tests could be implemented in further studies to explore better hyper-parameter settings and more combinations of mixed convolutions. (2) Questionable generalizability in other datasets or applications. Although the proposed MDFA-Net has been validated in three open-access datasets, its performance in a larger range of high-resolution image datasets or real applications remains unknown. Further methodological improvements may be needed for building change mapping in a specific region. (3) Real-time detection limitation. The complexity introduced by the Transformer-based DFA mechanism and multi-scale HMDConv fusion may lead to an increase in computational requirements. Therefore, the capability of real-time BCD and the deployment in other environments is limited [52]. In future studies, the computational efficiency of MDFA-Net needs further improvement.

6. Conclusions

In this paper, we introduced MDFA-Net to effectively integrate CNN and Transformer in BCD. To overcome the subtle change detection challenge in current studies, we developed two novel modules, HMDConv and DFA. The HMDConv module can extract local features with hybrid dilation convolutions to alleviate the local bias effect in traditional CNN. The DFA module implements the self-attention mechanism at multi-scale difference feature maps to overcome the problem that local details may be lost in the global receptive field in the traditional self-attention mechanism. Experimental results in three remote sensing BCD datasets demonstrated that MDFA-Net has the best overall performance compared to other models, especially outperforming the state-of-the-art USSFC-Net. Visual interpretation established that its outstanding performance mainly relied on better subtle change detection results. Thanks to two novel modules, MDFA-Net achieved a balance between precision and recall in three open-access BCD datasets and showed a great performance in handling the subtle change challenge. In future studies, the robustness of the proposed model could be explored by optimizing hyper-parameters and applying it in various applications.

Author Contributions

Conceptualization, Y.L., S.Z. and T.Z.; Methodology, Y.L.; Resources, T.Z. and X.S.; Data curation, Y.L.; Writing—original draft, Y.L.; Writing—review & editing, S.Z.; Supervision, S.Z., T.Z. and X.S.; Project administration, X.S.; Funding acquisition, S.Z. and X.S. All authors have read and agreed to the published version of the manuscript.

Funding

This research was funded by Beijing Forestry University grant number BLX202363.

Data Availability Statement

All three datasets, LEVIR-CD, WHU-CD, and CDD, are open-access. LEVIR-CD: https://justchenhao.github.io/LEVIR/ (accessed on 24 October 2023); WHU-CD: http://gpcv.whu.edu.cn/data/building_dataset.html (accessed on 1 December 2023); CDD: https://paperswithcode.com/dataset/cdd-dataset-season-varying (accessed on 1 March 2024).

Conflicts of Interest

The authors declare no conflict of interest.

References

  1. Singh, A. Review article digital change detection techniques using remotely-sensed data. Int. J. Remote Sens. 1989, 10, 989–1003. [Google Scholar] [CrossRef]
  2. Smith, J.; Doe, J.; Brown, A. A comprehensive study on remote sensing techniques. IEEE Trans. Geosci. Remote Sens. 2024, 62, 123–132. [Google Scholar]
  3. Yuan, Z.; Mou, L.; Xiong, Z.; Zhu, X.X. Change detection meets visual question answering. IEEE Trans. Geosci. Remote Sens. 2022, 60, 5630613. [Google Scholar] [CrossRef]
  4. Liu, Y.; Pang, C.; Zhan, Z.; Zhang, X.; Yang, X. Building change detection for remote sensing images using a dual-task constrained deep Siamese convolutional network model. IEEE Geosci. Remote Sens. Lett. 2020, 18, 811–815. [Google Scholar] [CrossRef]
  5. Cheng, G.; Han, J. A survey on object detection in optical remote sensing images. ISPRS J. Photogramm. Remote Sens. 2016, 117, 11–28. [Google Scholar] [CrossRef]
  6. Liu, S.; Bruzzone, L.; Bovolo, F.; Zanetti, M.; Du, P. Sequential spectral change vector analysis for iteratively discovering and detecting multiple changes in hyperspectral images. IEEE Trans. Geosci. Remote Sens. 2015, 53, 4363–4378. [Google Scholar] [CrossRef]
  7. Jabari, S.; Rezaee, M.; Fathollahi, F.; Zhang, Y. Multispectral change detection using multivariate Kullback-Leibler distance. ISPRS J. Photogramm. Remote Sens. 2019, 147, 163–177. [Google Scholar] [CrossRef]
  8. Huang, L.; Zhang, G.; Li, Y. An object-based change detection approach by integrating intensity and texture differences. In Proceedings of the 2010 2nd International Asia Conference on Informatics in Control, Automation and Robotics (CAR 2010), Wuhan, China, 6–7 March 2010; IEEE: Piscataway, NJ, USA, 2010; pp. 258–263. [Google Scholar]
  9. Gong, M.; Zhao, J.; Liu, J.; Miao, Q.; Jiao, L. Change detection in synthetic aperture radar images based on deep neural networks. IEEE Trans. Neural Netw. Learn. Syst. 2015, 27, 125–138. [Google Scholar] [CrossRef]
  10. Wang, D.; Chen, X.; Jiang, M.; Du, S.; Xu, B.; Wang, J. ADS-Net: An attention-based deeply supervised network for remote sensing image change detection. Int. J. Appl. Earth Obs. Geoinf. 2021, 101, 102348. [Google Scholar]
  11. Shen, L.; Wang, Y.; Wu, Z. Multi-scale feature model for object detection. IEEE Trans. Image Process. 2020, 29, 4223–4235. [Google Scholar]
  12. Zhang, Y.; Li, J.; Song, Q. End-to-end superpixel-enhanced network for semantic segmentation. IEEE Trans. Neural Netw. Learn. Syst. 2021, 32, 4567–4576. [Google Scholar]
  13. Zhang, C.; Yue, P.; Tapete, D.; Jiang, L.; Shangguan, B.; Huang, L.; Liu, G. A deeply supervised image fusion network for change detection in high resolution bi-temporal remote sensing images. ISPRS J. Photogramm. Remote Sens. 2020, 166, 183–200. [Google Scholar] [CrossRef]
  14. Wahbi, M.; El Bakali, I.; Ez-zahouani, B.; Azmi, R.; Moujahid, A.; Zouiten, M.; Alaoui, O.Y.; Boulaassal, H.; Maatouk, M.; El Kharki, O. A deep learning classification approach using high spatial satellite images for detection of built-up areas in rural zones: Case study of Souss-Massa region, Morocco. Remote Sens. Appl. Soc. Environ. 2023, 29, 100898. [Google Scholar] [CrossRef]
  15. Yang, G.; Tang, H.; Ding, M.; Sebe, N.; Ricci, E. Transformer-based attention networks for continuous pixel-wise prediction. In Proceedings of the IEEE/CVF International Conference on Computer Vision, Montreal, BC, Canada, 11–17 October 2021; pp. 16269–16279. [Google Scholar]
  16. Chen, H.; Qi, Z.; Shi, Z. Remote sensing image change detection with transformers. IEEE Trans. Geosci. Remote Sens. 2021, 60, 15607514. [Google Scholar] [CrossRef]
  17. Cheng, G.; Huang, Y.; Li, X.; Lyu, S.; Xu, Z.; Zhao, H.; Zhao, Q.; Xiang, S. Change detection methods for remote sensing in the last decade: A comprehensive review. Remote Sens. 2024, 16, 2355. [Google Scholar] [CrossRef]
  18. Zang, J.; Lian, C.; Xu, B.; Zhang, Z.; Su, Y.; Xue, C. AmtNet: Attentional multi-scale temporal network for phonocardiogram signal classification. Biomed. Signal Process. Control 2023, 85, 104934. [Google Scholar] [CrossRef]
  19. Liu, W.; Lin, Y.; Liu, W.; Yu, Y.; Li, J. An attention-based multiscale transformer network for remote sensing image change detection. ISPRS J. Photogramm. Remote Sens. 2023, 202, 599–609. [Google Scholar] [CrossRef]
  20. Zheng, Z.; Ma, P.; Wu, Z. A context-structural feature decoupling change detection network for detecting earthquake-triggered damage. ISPRS Int. J. Appl. Earth Obs. Geoinf. 2024, 131, 103961. [Google Scholar] [CrossRef]
  21. Lei, T.; Geng, X.; Ning, H.; Lv, Z.; Gong, M.; Jin, Y.; Nandi, A.K. Ultralightweight spatial–spectral feature cooperation network for change detection in remote sensing images. IEEE Trans. Geosci. Remote Sens. 2023, 61, 4402114. [Google Scholar] [CrossRef]
  22. Lin, H.; Wang, X.; Li, M.; Huang, D.; Wu, R. A multi-task consistency enhancement network for semantic change detection in HR remote sensing images and application of non-agriculturalization. Remote Sens. 2023, 15, 5106. [Google Scholar] [CrossRef]
  23. Li, W.; Xue, L.; Wang, X.; Li, G. ConvTransNet: A CNN–transformer network for change detection with multiscale global–local representations. IEEE Trans. Geosci. Remote Sens. 2023, 61, 5610315. [Google Scholar] [CrossRef]
  24. Daudt, R.C.; Le Saux, B.; Boulch, A. Fully convolutional Siamese networks for change detection. In Proceedings of the 25th IEEE International Conference on Image Processing (ICIP), Athens, Greece, 7–10 October 2018; pp. 4063–4067. [Google Scholar]
  25. He, Y.; Zhang, H.; Ning, X.; Zhang, R.; Chang, D.; Hao, M. Spatial-Temporal Semantic Perception Network for Remote Sensing Image Semantic Change Detection. Remote Sens. 2023, 15, 4095. [Google Scholar] [CrossRef]
  26. Shen, Q.; Huang, J.; Wang, M.; Tao, S.; Yang, R.; Zhang, X. Semantic feature-constrained multitask siamese network for building change detection in high-spatial-resolution remote sensing imagery. ISPRS J. Photogramm. Remote Sens. 2022, 189, 78–94. [Google Scholar] [CrossRef]
  27. Fang, S.; Li, K.; Shao, J.; Li, Z. SNUNet-CD: A densely connected Siamese network for change detection of VHR images. IEEE Geosci. Remote Sens. Lett. 2022, 19, 8007805. [Google Scholar] [CrossRef]
  28. Ghiasi, G.; Lin, T.Y.; Le, Q.V. NAS-FPN: Learning scalable feature pyramid architecture for object detection. In Proceedings of the IEEE/CVF Conference on Computer Vision and Pattern Recognition, Long Beach, CA, USA, 15–19 June 2019; pp. 7036–7045. [Google Scholar]
  29. Wang, Z.; Zhao, Y.; Chen, J. Multi-scale fast Fourier transform based attention network for remote-sensing image super-resolution. IEEE J. Sel. Top. Appl. Earth Obs. Remote Sens. 2023, 16, 2728–2740. [Google Scholar] [CrossRef]
  30. Zhang, J.; Shao, Z.; Ding, Q.; Huang, X.; Wang, Y.; Zhou, X.; Li, D. AERNet: An attention-guided edge refinement network and a dataset for remote sensing building change detection. IEEE Trans. Geosci. Remote Sens. 2023, 61, 5617116. [Google Scholar] [CrossRef]
  31. Zuo, Q.; Chen, S.; Wang, Z. R2AU-Net: Attention recurrent residual convolutional neural network for multimodal medical image segmentation. Secur. Commun. Netw. 2021, 2021, 6625688. [Google Scholar] [CrossRef]
  32. Li, Z.; Tang, C.; Liu, X.; Zhang, W.; Dou, J.; Wang, L.; Zomaya, A.Y. Lightweight remote sensing change detection with progressive feature aggregation and supervised attention. IEEE Trans. Geosci. Remote Sens. 2023, 61, 5602812. [Google Scholar] [CrossRef]
  33. Zhao, Y.; Chen, P.; Chen, Z.; Bai, Y.; Zhao, Z.; Yang, X. A triple-stream network with cross-stage feature fusion for high-resolution image change detection. IEEE Trans. Geosci. Remote Sens. 2023, 61, 5600417. [Google Scholar] [CrossRef]
  34. Li, L.; Liu, H.; Li, Q.; Tian, Z.; Li, Y.; Geng, W.; Wang, S. Near-infrared blood vessel image segmentation using background subtraction and improved mathematical morphology. Bioengineering 2023, 10, 726. [Google Scholar] [CrossRef] [PubMed]
  35. Woo, S.; Park, J.; Lee, J.Y.; Kweon, I.S. CBAM: Convolutional Block Attention Module. In Proceedings of the European Conference on Computer Vision (ECCV 2018), Munich, Germany, 8–14 September 2018. [Google Scholar]
  36. Chen, P.; Zhang, B.; Hong, D.; Chen, Z.; Yang, X.; Li, B. FCCDN: Feature constraint network for VHR image change detection. ISPRS J. Photogramm. Remote Sens. 2022, 187, 101–119. [Google Scholar] [CrossRef]
  37. Jiang, H.; Hu, X.; Li, K.; Zhang, J.; Gong, J.; Zhang, M. PGA-SiamNet: Pyramid feature-based attention-guided Siamese network for remote sensing orthoimagery building change detection. Remote Sens. 2020, 12, 484. [Google Scholar] [CrossRef]
  38. Gong, M.; Jiang, F.; Qin, A.K.; Liu, T.; Zhan, T.; Lu, D.; Zheng, H.; Zhang, M. A Spectral and Spatial Attention Network for Change Detection in Hyperspectral Images. IEEE Trans. Geosci. Remote Sens. 2022, 60, 5521614. [Google Scholar] [CrossRef]
  39. Zhang, J.; Wu, T.; Wang, Z.; Liang, J.; Liu, W. ChangeFormer: A Change Detection Framework Based on Transformer for Remote Sensing Images. IEEE Trans. Geosci. Remote Sens. 2022, 60, 1–13. [Google Scholar]
  40. Feng, Y.; Jiang, J.; Xu, H.; Zheng, J. Change Detection on Remote Sensing Images Using Dual-Branch Multilevel Intertemporal Network. IEEE Trans. Geosci. Remote Sens. 2023, 61, 4401015. [Google Scholar] [CrossRef]
  41. Ma, H.; Zhao, L.; Li, B.; Niu, R.; Wang, Y. Change Detection Needs Neighborhood Interaction in Transformer. Remote Sens. 2023, 15, 5459. [Google Scholar] [CrossRef]
  42. Zhang, K.; Zhao, X.; Zhang, F.; Ding, L.; Sun, J.; Bruzzone, L. Relation changes matter: Cross-temporal difference transformer for change detection in remote sensing images. IEEE Trans. Geosci. Remote Sens. 2023, 61, 5611615. [Google Scholar] [CrossRef]
  43. Wang, Y.; Wang, M.; Hao, Z.; Wang, Q.; Wang, Q.; Ye, Y. MSGFNet: Multi-Scale Gated Fusion Network for Remote Sensing Image Change Detection. Remote Sens. 2024, 16, 572. [Google Scholar] [CrossRef]
  44. Li, D.; Li, L.; Chen, Z.; Li, J. Shift-ConvNets: Small convolutional kernel with large kernel effects. arXiv 2024, arXiv:2401.12736. [Google Scholar]
  45. Fan, C.-L. Multiscale Feature Extraction by Using Convolutional Neural Network: Extraction of Objects from Multiresolution Images of Urban Areas. ISPRS Int. J. Geo-Inf. 2024, 13, 5. [Google Scholar] [CrossRef]
  46. Li, D.; Yao, A.; Chen, Q. PSConv: Squeezing Feature Pyramid into One Compact Poly-Scale Convolutional Layer. In Proceedings of the European Conference on Computer Vision (ECCV), Cham, Switzerland, 23–28 August 2020. [Google Scholar]
  47. Guo, Y.; Zhang, Y.; Chen, Z.; Wu, B. Attention Mechanisms for Change Detection in Remote Sensing: A Comprehensive Review. ISPRS J. Photogramm. Remote Sens. 2023, 194, 85–98. [Google Scholar]
  48. Ji, S.; Wei, S.; Lu, M. Fully convolutional networks for multisource building extraction from an open aerial and satellite imagery data set. IEEE Trans. Geosci. Remote Sens. 2019, 57, 574–586. [Google Scholar] [CrossRef]
  49. Lebedev, M.; Vizilter, Y.V.; Vygolov, O.; Knyaz, V.A.; Rubis, A.Y. Change detection in remote sensing images using conditional adversarial networks. Int. Arch. Photogramm. Remote Sens. Spat. Inf. Sci. 2018, 42, 565–571. [Google Scholar] [CrossRef]
  50. Chen, H.; Shi, Z. A spatial-temporal attention-based method and a new dataset for remote sensing image change detection. Remote Sens. 2020, 12, 1662. [Google Scholar] [CrossRef]
  51. Codegoni, A.; Lombardi, G.; Ferrari, A. TINYCD: A (not so) deep learning model for change detection. Neural Comput. Appl. 2023, 35, 8471–8486. [Google Scholar] [CrossRef]
  52. Sayed, A.N.; Himeur, Y.; Bensaali, F. Deep and transfer learning for building occupancy detection: A review and comparative analysis. Eng. Appl. Artif. Intell. 2022, 115, 105254. [Google Scholar] [CrossRef]
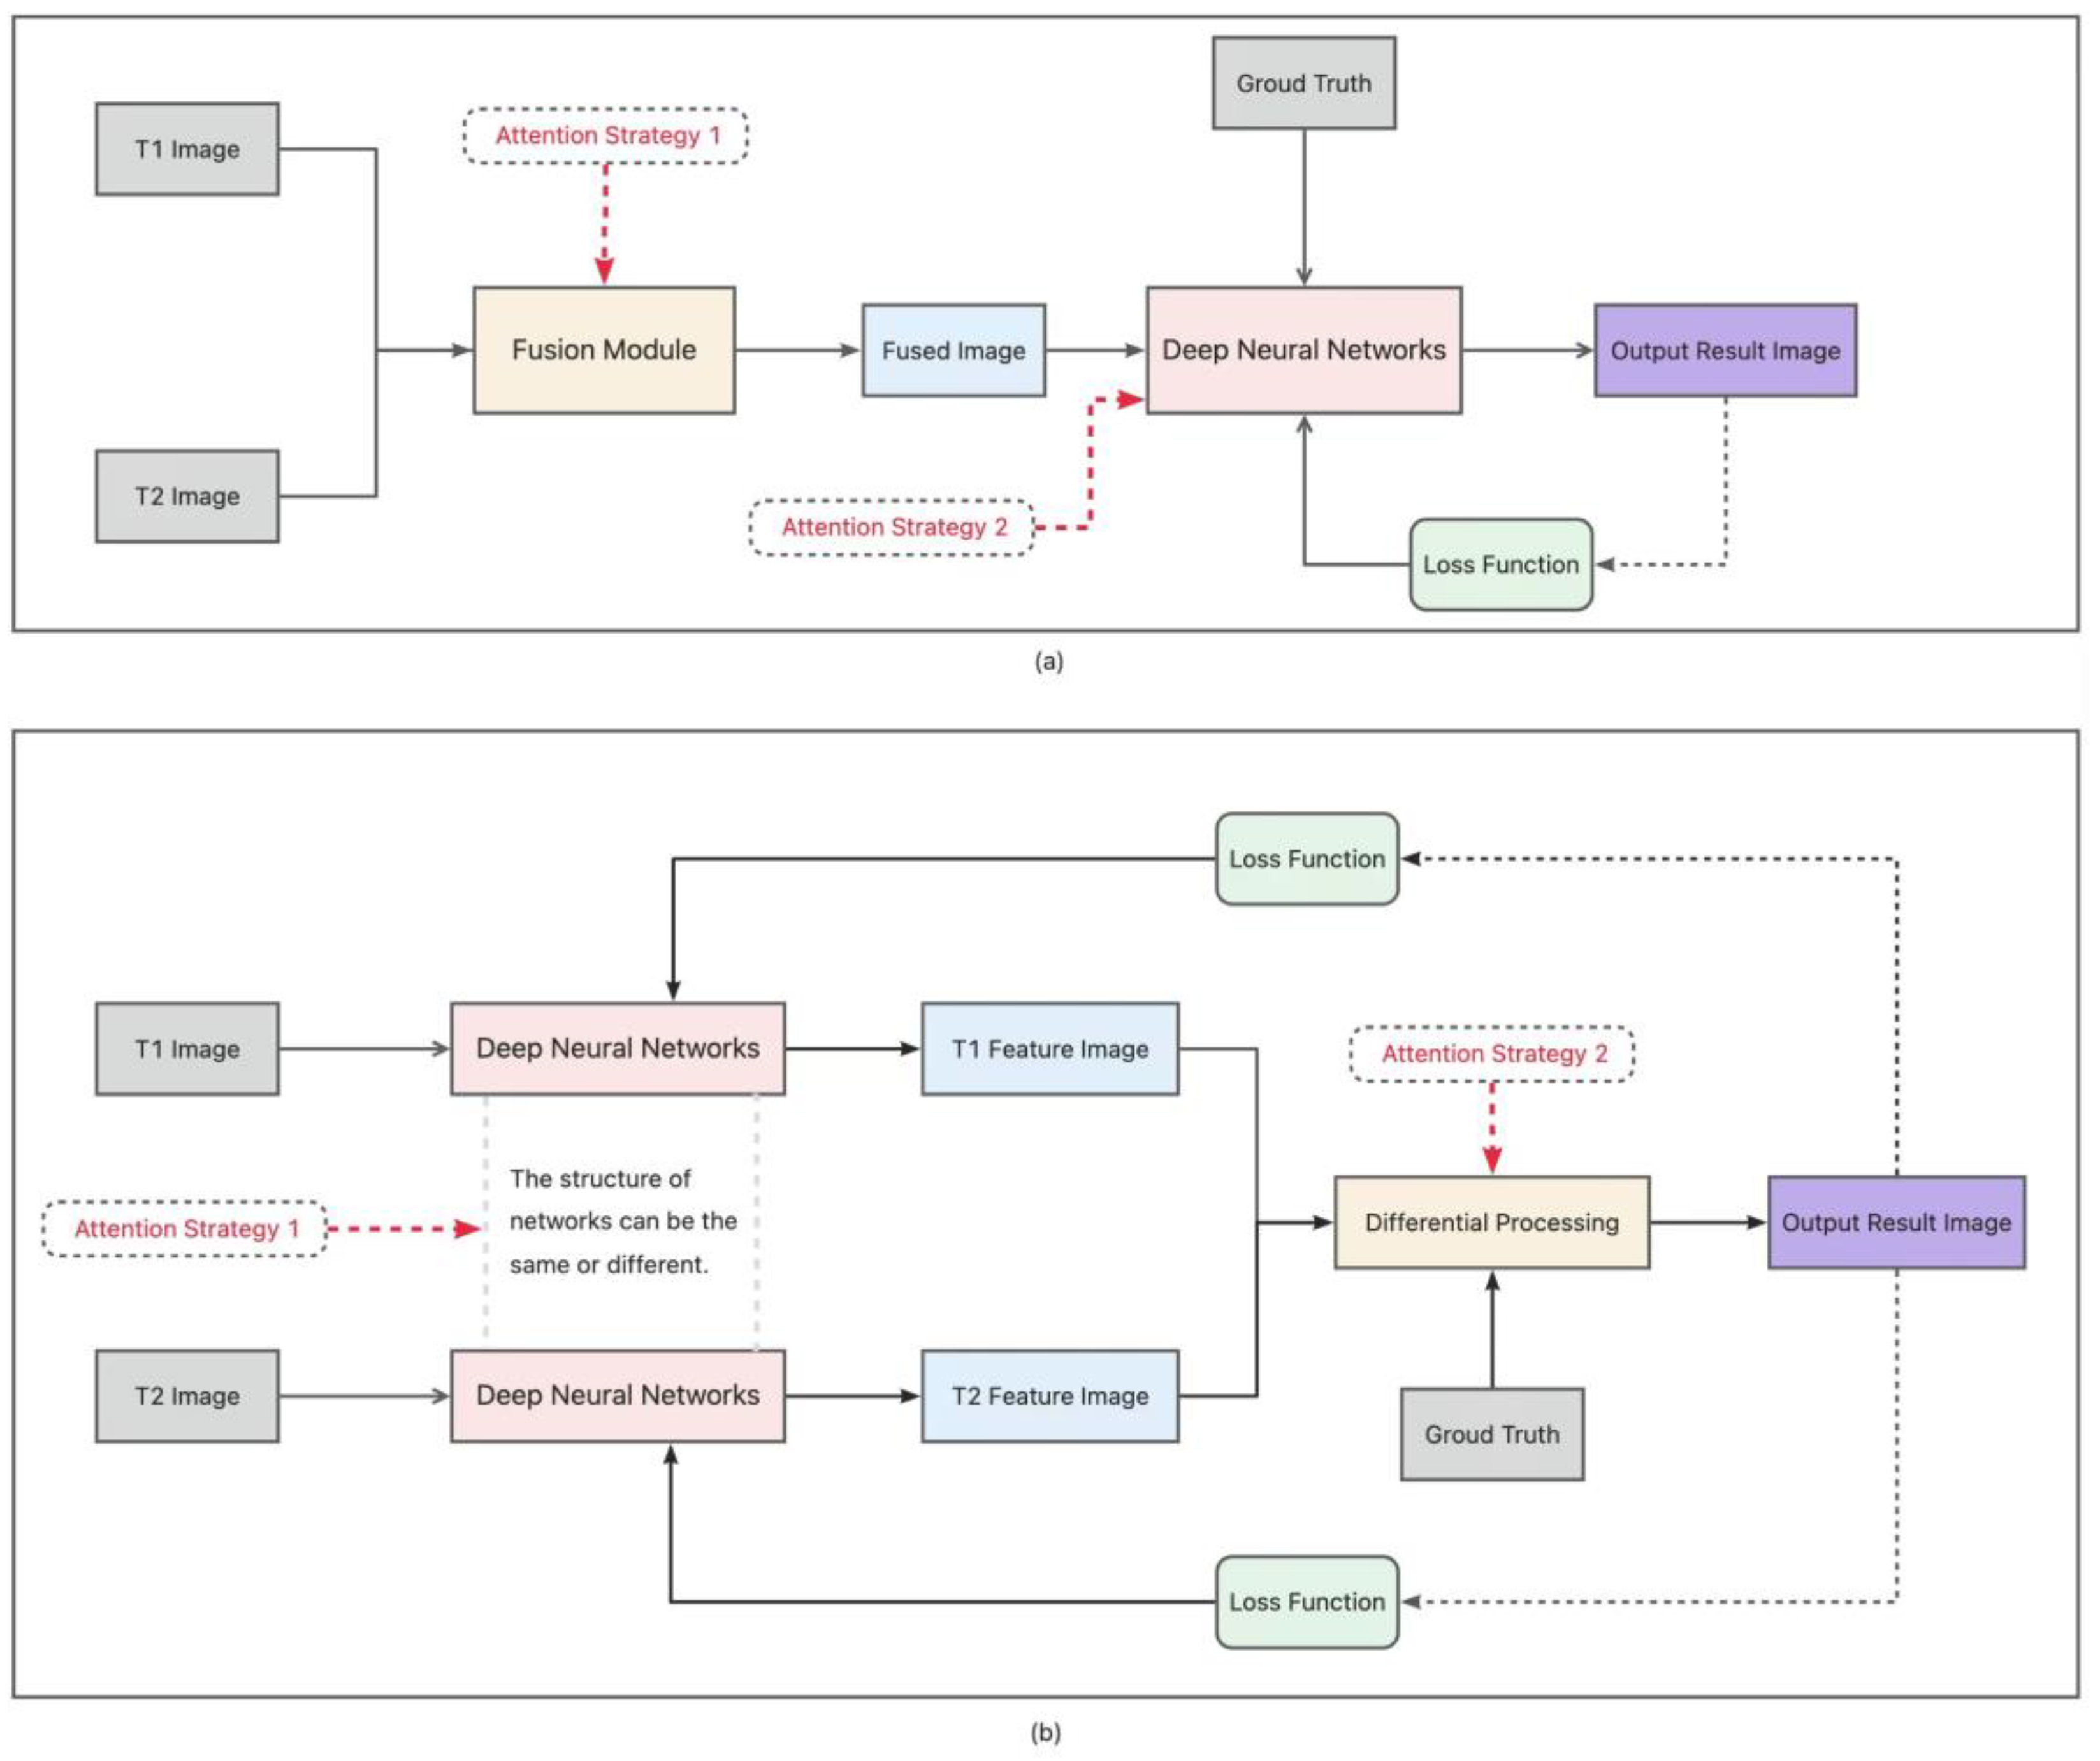
Figure 1. The overall general DL frameworks in CD: (a) The difference fusion image produced from the temporal comparison of bi-temporal images T1 and T2 is utilized as a singular input for deep neural networks. (b) This framework independently extracts features from both bi-temporal images T1 and T2, followed by a comparative analysis of the integrated features. The red dashed arrows illustrate the various strategies employed within the BCD network to implement the self-attention mechanism, while the black dashed arrows represent the calculation of the loss function based on the ground truth and the output result image.
Remotesensing 16 03466 g001
Figure 2. The overall architecture of the proposed MDFA-Net: a pair of images are input into a non-weight-sharing Encoder with N + HMDConv; then, the extracted feature maps are passed to the DFA module, and the difference images from each stage are forwarded to the Decoder.
Remotesensing 16 03466 g002
Figure 3. The architecture of the N + HMDConv. There are two branches in N + HMDConv: a native feature branch (N) and an HMDConv branch.
Remotesensing 16 03466 g003
Figure 4. The attention mechanisms of the DFA: (a) the MHSA mechanism; (b) the CA mechanism.
Remotesensing 16 03466 g004
Figure 5. The architecture of the DFA module. This figure delineates the information flow through the Transformer block, highlighting the integration of attention mechanisms, residual connections, and the resultant feature extraction process.
Remotesensing 16 03466 g005
Figure 6. The building change visualization map: (a) T1 image. (b) T2 image. (c) Ground truth. (d) Our MDFA-Net. (e) BIT. (f) Change Former. (g) SNUNet. (h) USSFC-Net. Red indicates incorrectly identified pixels, while green indicates missed pixels.
Remotesensing 16 03466 g006
Figure 7. The small target buildings’ change visualization map: (a) T1 image. (b) T2 image. (c) Ground truth. (d) Our MDFA-Net. (e) BIT. (f) Change Former. (g) SNUNet. (h) USSFC-Net. Red indicates incorrectly identified pixels, while green indicates missed pixels.
Remotesensing 16 03466 g007
Figure 8. The attention mechanisms of the DFA: (a) T1 image. (b) T2 image. (c) Ground truth. (d) MDFA-Net result. (e) Our MDFA-Net. (f) BIT. (g) Change Former. (h) SNUNet. (i) USSFC-Net.
Remotesensing 16 03466 g008
Table 1. Detailed information of three datasets.
DatasetsSpace
Resolution
CoverageTraining Dataset SizeValidation Dataset SizeTest
Dataset Size
Changed Objects
WHU-CD0.2 m/pixelChristchurch, New Zealand.5947 pairs743 pairs744 pairsbuilding
CDD-CD0.03~1 m/pixelMultiple regions around the world10,000 pairs3000 pairs3000 pairsbuilding, road
LEVIR-CD0.5 m/pixelTwenty cities in Texas, USA.7120 pairs1024 pairs2048 pairsbuilding
Table 2. Accuracy performance comparison on WHU-CD test set.
NetworkF1 (%)Pre (%)Rec (%)IoU (%)OA (%)
FC-EF76.8879.3374.5862.4597.10
FC-Siam-Diff86.3189.6183.2275.9195.90
FC-Siam-Conc65.3168.9362.0648.5489.89
STANet87.1186.1188.1477.1796.52
Change Former90.2591.2385.4684.9898.17
DSIFN88.5285.8991.3179.4098.49
BIT85.7182.0489.7474.9698.00
SNUNet87.7687.8487.6878.1998.16
USSFC-Net92.6893.3794.0486.3799.25
Our Model
(MDFA-Net)
93.8192.7994.8488.3499.36
The highest values in each indicator are highlighted in red, and the second highest values in each indicator are marked in blue.
Table 3. Accuracy performance comparison on CDD test set.
NetworkF1 (%)Pre (%)Rec (%)IoU (%)OA (%)
FC-EF68.6779.7961.2853.0589.90
FC-Siam-Diff72.6774.8370.6457.0892.17
FC-Siam-Conc70.9889.7158.7355.0292.57
STANet83.3476.9792.9173.0096.02
Change Former92.4794.6990.8688.9797.98
DSIFN93.3992.3394.4887.6098.11
BIT93.5492.7994.5687.9498.56
SNUNet92.3193.4191.2485.7398.38
USSFC-Net94.2693.0595.5089.1498.51
Our Model
(MDFA-Net)
95.3295.2395.4291.0698.85
The highest values in each indicator are highlighted in red, and the second highest values in each indicator are marked in blue.
Table 4. Accuracy performance comparison on LEVIR-CD test set.
NetworkF1 (%)Pre (%)Rec (%)IoU (%)OA (%)
FC-EF72.9181.3866.0758.8297.48
FC-Siam-Diff86.8489.4584.6676.8398.01
FC-Siam-Conc83.9690.4878.6072.4598.37
STANet87.3390.5384.7177.7998.81
Change Former90.5090.8390.1882.6699.00
DSIFN87.5887.3088.2777.8299.01
BIT90.1191.6787.3880.6798.97
SNUNet89.7190.6289.4781.7798.96
USSFC-Net91.0489.7092.42--
Our Model
(MDFA-Net)
91.2191.0491.3984.1099.07
The highest values in each indicator are highlighted in red, and the second highest values in each indicator are marked in blue.
Table 5. Accuracy comparison with baseline models on LEVIR-CD.
NetworkF1 (%)Pre (%)Rec (%)IoU (%)OA (%)
Baseline88.4686.2990.7579.3298.85
Baseline + HMDConv89.7586.5393.2381.4198.99
Baseline + DFA90.4590.5790.3482.5799.03
Baseline + HMDConv + DFA91.2191.0491.3984.1099.07
Disclaimer/Publisher’s Note: The statements, opinions and data contained in all publications are solely those of the individual author(s) and contributor(s) and not of MDPI and/or the editor(s). MDPI and/or the editor(s) disclaim responsibility for any injury to people or property resulting from any ideas, methods, instructions or products referred to in the content.