Article

Impact of Assimilating Geostationary Interferometric Infrared Sounder Observations from Long- and Middle-Wave Bands on Weather Forecasts with a Locally Cloud-Resolving Global Model

1
International Center for Climate and Environment Sciences, Institute of Atmospheric Physics, Chinese Academy of Sciences, Beijing 100029, China
2
University of Chinese Academy of Sciences, Beijing 100049, China
3
State Key Laboratory of Numerical Modeling for Atmospheric Sciences and Geophysical Fluid Dynamics, Institute of Atmospheric Physics, Chinese Academy of Sciences, Beijing 100029, China
4
School of the Atmospheric Sciences, Chengdu University of Information Technology, Chengdu 610025, China
*
Author to whom correspondence should be addressed.
Remote Sens. 2024, 16(18), 3458; https://doi.org/10.3390/rs16183458
Submission received: 23 July 2024 / Revised: 9 September 2024 / Accepted: 13 September 2024 / Published: 18 September 2024

Abstract

:
The Geostationary Interferometric InfraRed Sounder (GIIRS) provides a novel opportunity to acquire high-spatiotemporal-resolution atmospheric information. Previous studies have demonstrated the positive impacts of assimilating GIIRS radiances from either long-wave temperature or middle-wave water vapor bands on modeling high-impact weather processes. However, the impact of assimilating both bands on forecast skill has been less investigated, primarily due to the non-identical geolocations for both bands. In this study, a locally cloud-resolving global model is utilized to assess the impact of assimilating GIIRS observations from both long-wave and middle-wave bands. The findings indicate that the GIIRS observations exhibit distinct inter-channel error correlations. Proper inflation of these errors can compensate for inaccuracies arising from the treatment of the geolocation of the two bands, leading to a significant enhancement in the usage of GIIRS observations from both bands. The assimilation of GIIRS observations not only markedly reduces the normalized departure standard deviations for most channels of independent instruments, but also improves the atmospheric states, especially for temperature forecasting, with a maximum reduction of 42% in the root-mean-square error in the lower troposphere. These improvements contribute to better performance in predicting heavy rainfall.

1. Introduction

Hyperspectral infrared sounders have thousands of channels, providing abundant information on atmospheric states at a higher vertical resolution. The Atmospheric InfraRed Sounder was the first hyperspectral infrared sounder to be assimilated in numerical weather prediction (NWP) [1]. Since then, other hyperspectral infrared sounders, such as the Infrared Atmospheric Sounding Interferometer (IASI) and the Cross-track Infrared Sounder (CrIS), have been launched. Several studies have evaluated and assimilated the observations from these hyperspectral infrared sounders, and demonstrated that they have beneficial effects on the quality of weather forecasting [2,3,4,5,6,7,8]. These hyperspectral infrared sounders are aboard low-Earth-orbit satellites, which can only observe a given location twice a day (in polar regions, a polar orbiter can make multiple overpasses of the same location). To achieve high temporal resolution over a fixed area, however, a hyperspectral infrared sounder aboard a geostationary equatorial orbit satellite would be more suitable.
The Geostationary Interferometric InfraRed Sounder (GIIRS), aboard the new generation of Chinese geostationary meteorological satellite FengYun-4A (FY-4A), is the first hyperspectral infrared sounder aboard a geostationary orbit satellite in the world. GIIRS has 1650 infrared channels and 32 visible channels, and the resolutions for these channels are 16 km and 2 km at nadir, respectively. Therefore, GIIRS can continuously monitor high-impact weather processes, such as local storms, tropical cyclone and tornadoes, at high spatiotemporal resolution, which is beneficial for the nowcasting and safety of lives and property [9]. The 1650 infrared channels which are of most interest to the NWP centers are grouped into a long-wave band that primarily measures atmospheric temperature and a middle-wave band that primarily measures atmospheric humidity. The quality of GIIRS observations has been studied by some researchers. Yin et al. [10] investigated the first 120 long-wave temperature channels of GIIRS in the Global/Regional Assimilation and PrEdiction System–Global Forecast System (GRAPES-GFS) using gas optical depth coefficients generated by Di et al. [11] and the Radiative Transfer Model for TOV (RTTOV; [12]). They found that the biases for these channels depend on the field-of-view (FOV) and latitude, and that the upper tropospheric channels exhibit diurnal variation of biases. They also proposed an offline bias correction scheme based on the field-of-regard (FOR), which reduced the biases and rendered the difference between observations and backgrounds (OMB) simulated by the GRAPES-GFS close to an unbiased Gaussian distribution. However, Burrows [13] identified some differences in the gas optical depth coefficients used by Yin et al. [10], and showed that there was weak correlation between the OMB and satellite zenith angle when using the gas optical depth coefficients provided by the Numerical Weather Prediction Satellite Application Facility (NWP SAF). With these coefficients, Dussarrat and Burrows [14] evaluated both the long-wave and middle-wave bands of GIIRS, and identified the contaminated bands around channels 37–66 and up to approximately channel 850 in the middle-wave spectral region. They also showed that the biases are smaller and more consistent in the long-wave band than in the middle-wave band, and that a broad north–south variation exists across the detector array.
Based on the comprehensive evaluations of GIIRS observation quality, several studies have assessed the potential impact of GIIRS in weather forecasts. Yin et al. [15] assimilated the clear-sky radiances from the long-wave band of GIIRS in a global model with about 25 km resolution and evaluated the impact on Typhoon Maria in 2018. They found that assimilating GIIRS at a high-temporal resolution of 15 min captured more detailed structures of Typhoon Maria, leading to evident improvement in typhoon forecasting. Zhang et al. [16] also studied the improvement in tropical cyclone forecasting by assimilating the temperature channels of GIIRS in a regional model with 9 km resolution. Yin et al. [17] investigated the impact of assimilating the middle-wave band of GIIRS on extreme precipitation processes in Henan Province of China on 20 July 2021 in a regional model with about 3 km resolution, and found that the assimilation improved the model water vapor analysis and reduced the forecast error of the location of maximum 24 h accumulated rainfall. However, these studies focused only on the impacts of either the long-wave band or the middle-wave band of GIIRS on specific weather processes. The reason for that may be due to the different geolocations between the long-wave band and the middle-wave band. Figure 1 illustrates the geographical positioning of pixels across the two bands. The numerals enclosed within the boxes represent the sequential order of the pixels for each band. A noticeable shift of one pixel is observed between the two bands. For instance, the pixel labeled as “1” in the long-wave band is situated south of the “1” pixel in the middle-wave band.
The forecast performances of assimilating GIIRS observations from both long-wave and middle-wave bands are less evaluated, despite preliminary GIIRS assimilation trials in the European Centre for Medium-Range Weather Forecasts (ECMWF) that achieved modest improvements in the fits of the short-range forecasts over the GIIRS scanning domain. In this study, the geolocations from the long-wave band are used for both bands to evaluate the impact of assimilation of GIIRS observations. This preprocessing of the GIIRS observations leads to an inaccurate geolocation for the middle-wave band and may degrade the quality of humidity analyses. However, it facilitates cloud detection (the results from the cloud detection applied to the long-wave temperature band easily influence the usage of the observations from the middle-wave water vapor band) and inter-channel observation error estimation (using the FOV-dependent first guess and analysis departure statistics).
Accurate simulation of atmospheric states is critical for effective utilization of observations. For example, the calculation of simulated radiances in satellite data assimilation necessitates atmospheric temperature, humidity profiles, and other surface variables. The precision of these atmospheric states directly influences the accuracy of the simulated radiances, thereby minimizing the discrepancy between observed and simulated radiances. One approach to obtaining accurate atmospheric state simulations is to increase the model’s resolution. However, the high computational cost associated with running a high-resolution global model and data assimilation presents a challenge. For regional models, high-resolution simulation over a limited domain is more efficient, but the risk of propagating systematic biases from other global models through boundary conditions persists [18].
In this study, a non-hydrostatic global model, Super Dynamics on the Cube (SD3), capable of simulating clouds without the need for deep convective parameterization, with 3.5 km resolution over China (via grid stretching), is used to evaluate the performance of assimilating GIIRS observations from both bands on weather forecasts. This locally cloud-resolving global model allows for high-resolution simulation without the constraints of boundary conditions and enables a full cycle of data assimilation without the need for large-scale information from other global models. These unique capacities distinguish it from other limited area models, such as the Weather Research and Forecasting model and the Rapid Refresh model [19], and provide a chance to evaluate the forecast performance of assimilating the high-temporospatial GIIRS observations. The rest of this paper is organized as follows. The methods used in this study are described in Section 2, and the experimental configurations are provided in Section 3. Section 4 presents the results from the assimilation experiments, before conclusions are drawn in Section 5.

2. Methods

2.1. GIIRS/FY-4A Observations

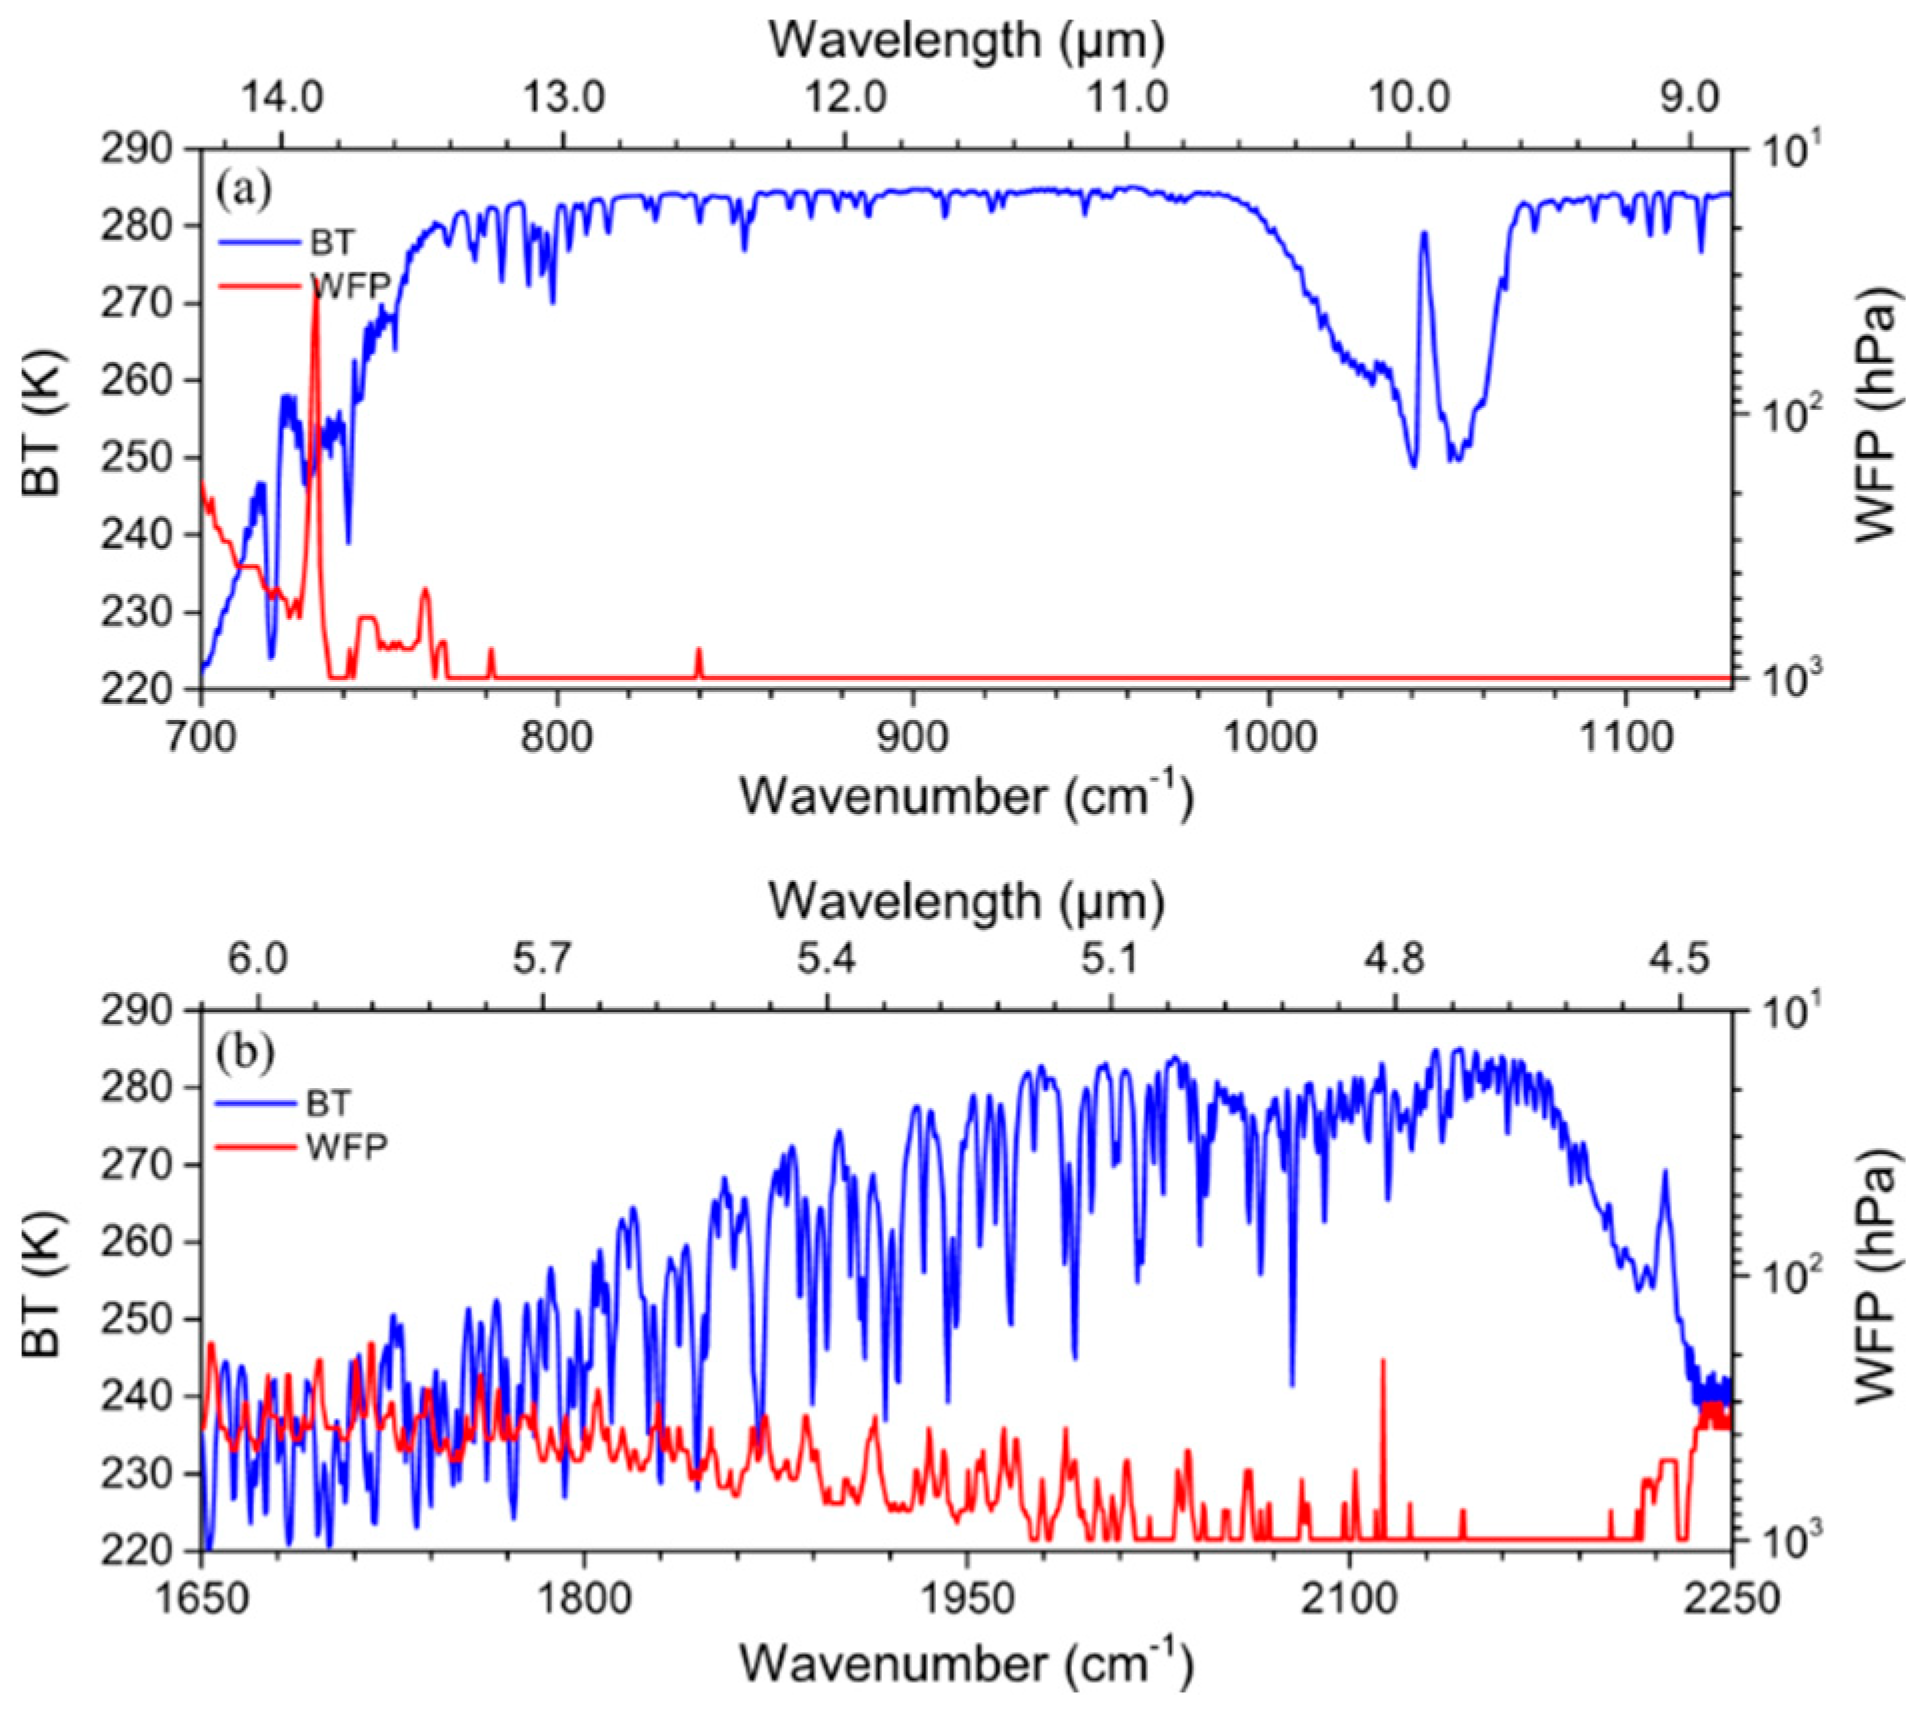
The GIIRS instrument [20] has 689 channels covering from 700 cm−1 to 1130 cm−1 in the long-wave infrared spectrum, and 961 channels covering from 1650 cm−1 to 2250 cm−1 in the middle-wave infrared spectrum, as well as 32 channels covering from 0.55 μm to 0.90 μm in the visual spectrum. In this study, only the infrared bands are selected to carry out evaluation, and the spectral interval for them is 0.625 cm−1, which is the same as for the CrIS instrument in the long-wave band covering from 650 cm−1 to 1095 cm−1. Figure 2 shows the brightness temperatures (blue line) and weighting function peaks (red line) for long- (Figure 2a) and middle-wave (Figure 2b) channels. The first 130 long-wave infrared channels (covering from 700 cm−1 to 780.625 cm−1), are mainly chosen by the NWP centers to improve forecast skills as their weighting function cover from the surface to 30 hPa. Other long-wave temperature channels are sensitive to the surface, with their weighting function peak at the lowest troposphere. Furthermore, the middle-wave infrared channels are mainly sensitive to water vapor in the middle and lower troposphere. The simultaneous usage of these two bands can yield a wealth of information about tropospheric temperature and humidity conditions.
GIIRS takes 90 min to cover Asia (10~60°N, 45~165°E) with seven east–west scans (59 FORs per scan). Each FOR contains 128 pixels composed of a 32 × 4 array of squared FOVs with horizontal resolution of about 16 km. There are two operating modes with different temporal resolutions for GIIRS: one is the China area (5000 × 5000 km2), with a 60 min temporal resolution; the other is the mesoscale area (1000 × 1000 km2), with a resolution of less than 30 min. These are beneficial to monitoring weather systems.

2.2. SD3 Model

The SD3 model is an improved and highly optimized (computationally) version of the Finite-Volume Cubed-Sphere Dynamical Core (FV3) [21,22]. It inherits key components from the FV3 dynamical core, but with improvements in the total energy conservation and refinements in the advection algorithm and vertical remapping. For local grid refinement, Schmidt’s transformation is applied to enable a very high resolution over a large region (i.e., over China), with a smooth and gradual transition to a lower resolution on the rest of the globe. For computational efficiency on modern hybrid (CPU and GPU) computing system, the code has been completely re-written using Cuda-C, which allows the model to complete global simulation within 60 min at 12 km resolution.
For the convenience of reading, the characteristics for FV3 are briefly described here. The FV core, as an offline transport model, was initially applied in a climate model with the development and application of monotonicity-preserving finite-volume schemes at the National Aeronautics and Space Administration/Goddard Space Flight Center. Lin and Rood [23] developed a mass conservation shallow-water model with high-order momentum monotonic advection employed, which was applied for the first time in computational geophysical fluid dynamics. With these algorithms, a full 3D hydrostatic dynamical core, that is, the FV core, was purposed [24]. In this core, the evaluation of the pressure-gradient force satisfies Newton’s third law of motion, which is the same as for the mass conservative flux-form transport scheme. On the other hand, the Lagrangian vertical coordinate implemented in the FV3 core is a terrain-following pressure coordinate, and a conservative flux-form semi-Lagrangian algorithm is employed in the discretization of 2D horizontal-to-Lagrangian-surface transport and dynamical processes [25]. As for grid resolution, the FV3 has the capacity for grid nesting, grid stretching, and telescoping nesting.

2.3. GSI Analysis System

The GSI system [26] used in this study is a unified data assimilation system for both global and regional application, which is the operational data assimilation system in the National Centers for Environmental Prediction (NCEP). It was developed by the NCEP/Environmental Modeling Center and can be run for two-dimensional variational, three-dimensional variational, three-dimensional ensemble variational, four-dimensional ensemble variational, and three-/four-dimensional hybrid ensemble variational schemes. The three-dimensional variational assimilation scheme is applied in this study, which obtains a statistically optimal analysis through an iterative minimization of a prescribed cost function:
J x a = 1 2 x a x b Τ B 1 x a x b + 1 2 y o H x a Τ R 1 y o H x a
where x a , x b , and y o are the analysis fields, background fields, and observations, respectively. H is a nonlinear observation operator, and B and R represent the background and observation error covariance matrix, respectively. The background error covariance is estimated by the National Meteorological Center Method [27] using the differences in the 48 and 24 h forecasts at the same time from a sample of over 400 cases. There are seven analysis variables used in GSI analysis, that is, stream function ( ψ ), unbalanced velocity potential ( χ u ), unbalanced surface pressure ( P s , u ), unbalanced virtual temperature ( T u ), normalized relative humidity ( R H s ), ozone mixing ratio, and cloud condensate mixing ratio. For sensors excluding the GIIRS, the Community Radiative Transfer Model (CRTM; [28]) is applied, which is the GSI system’s default observation operator for satellite data assimilation. Since the CRTM does not provide the optical depth coefficients for the GIIRS/FY-4A, the RTTOV (Version 13.1) with default settings recommended by NWP SAF was implemented in the GSI system to calculate radiances for GIIRS. In addition, data ingest and quality control procedures were also implemented for the GIIRS in the GSI system.

2.4. Bias Correction

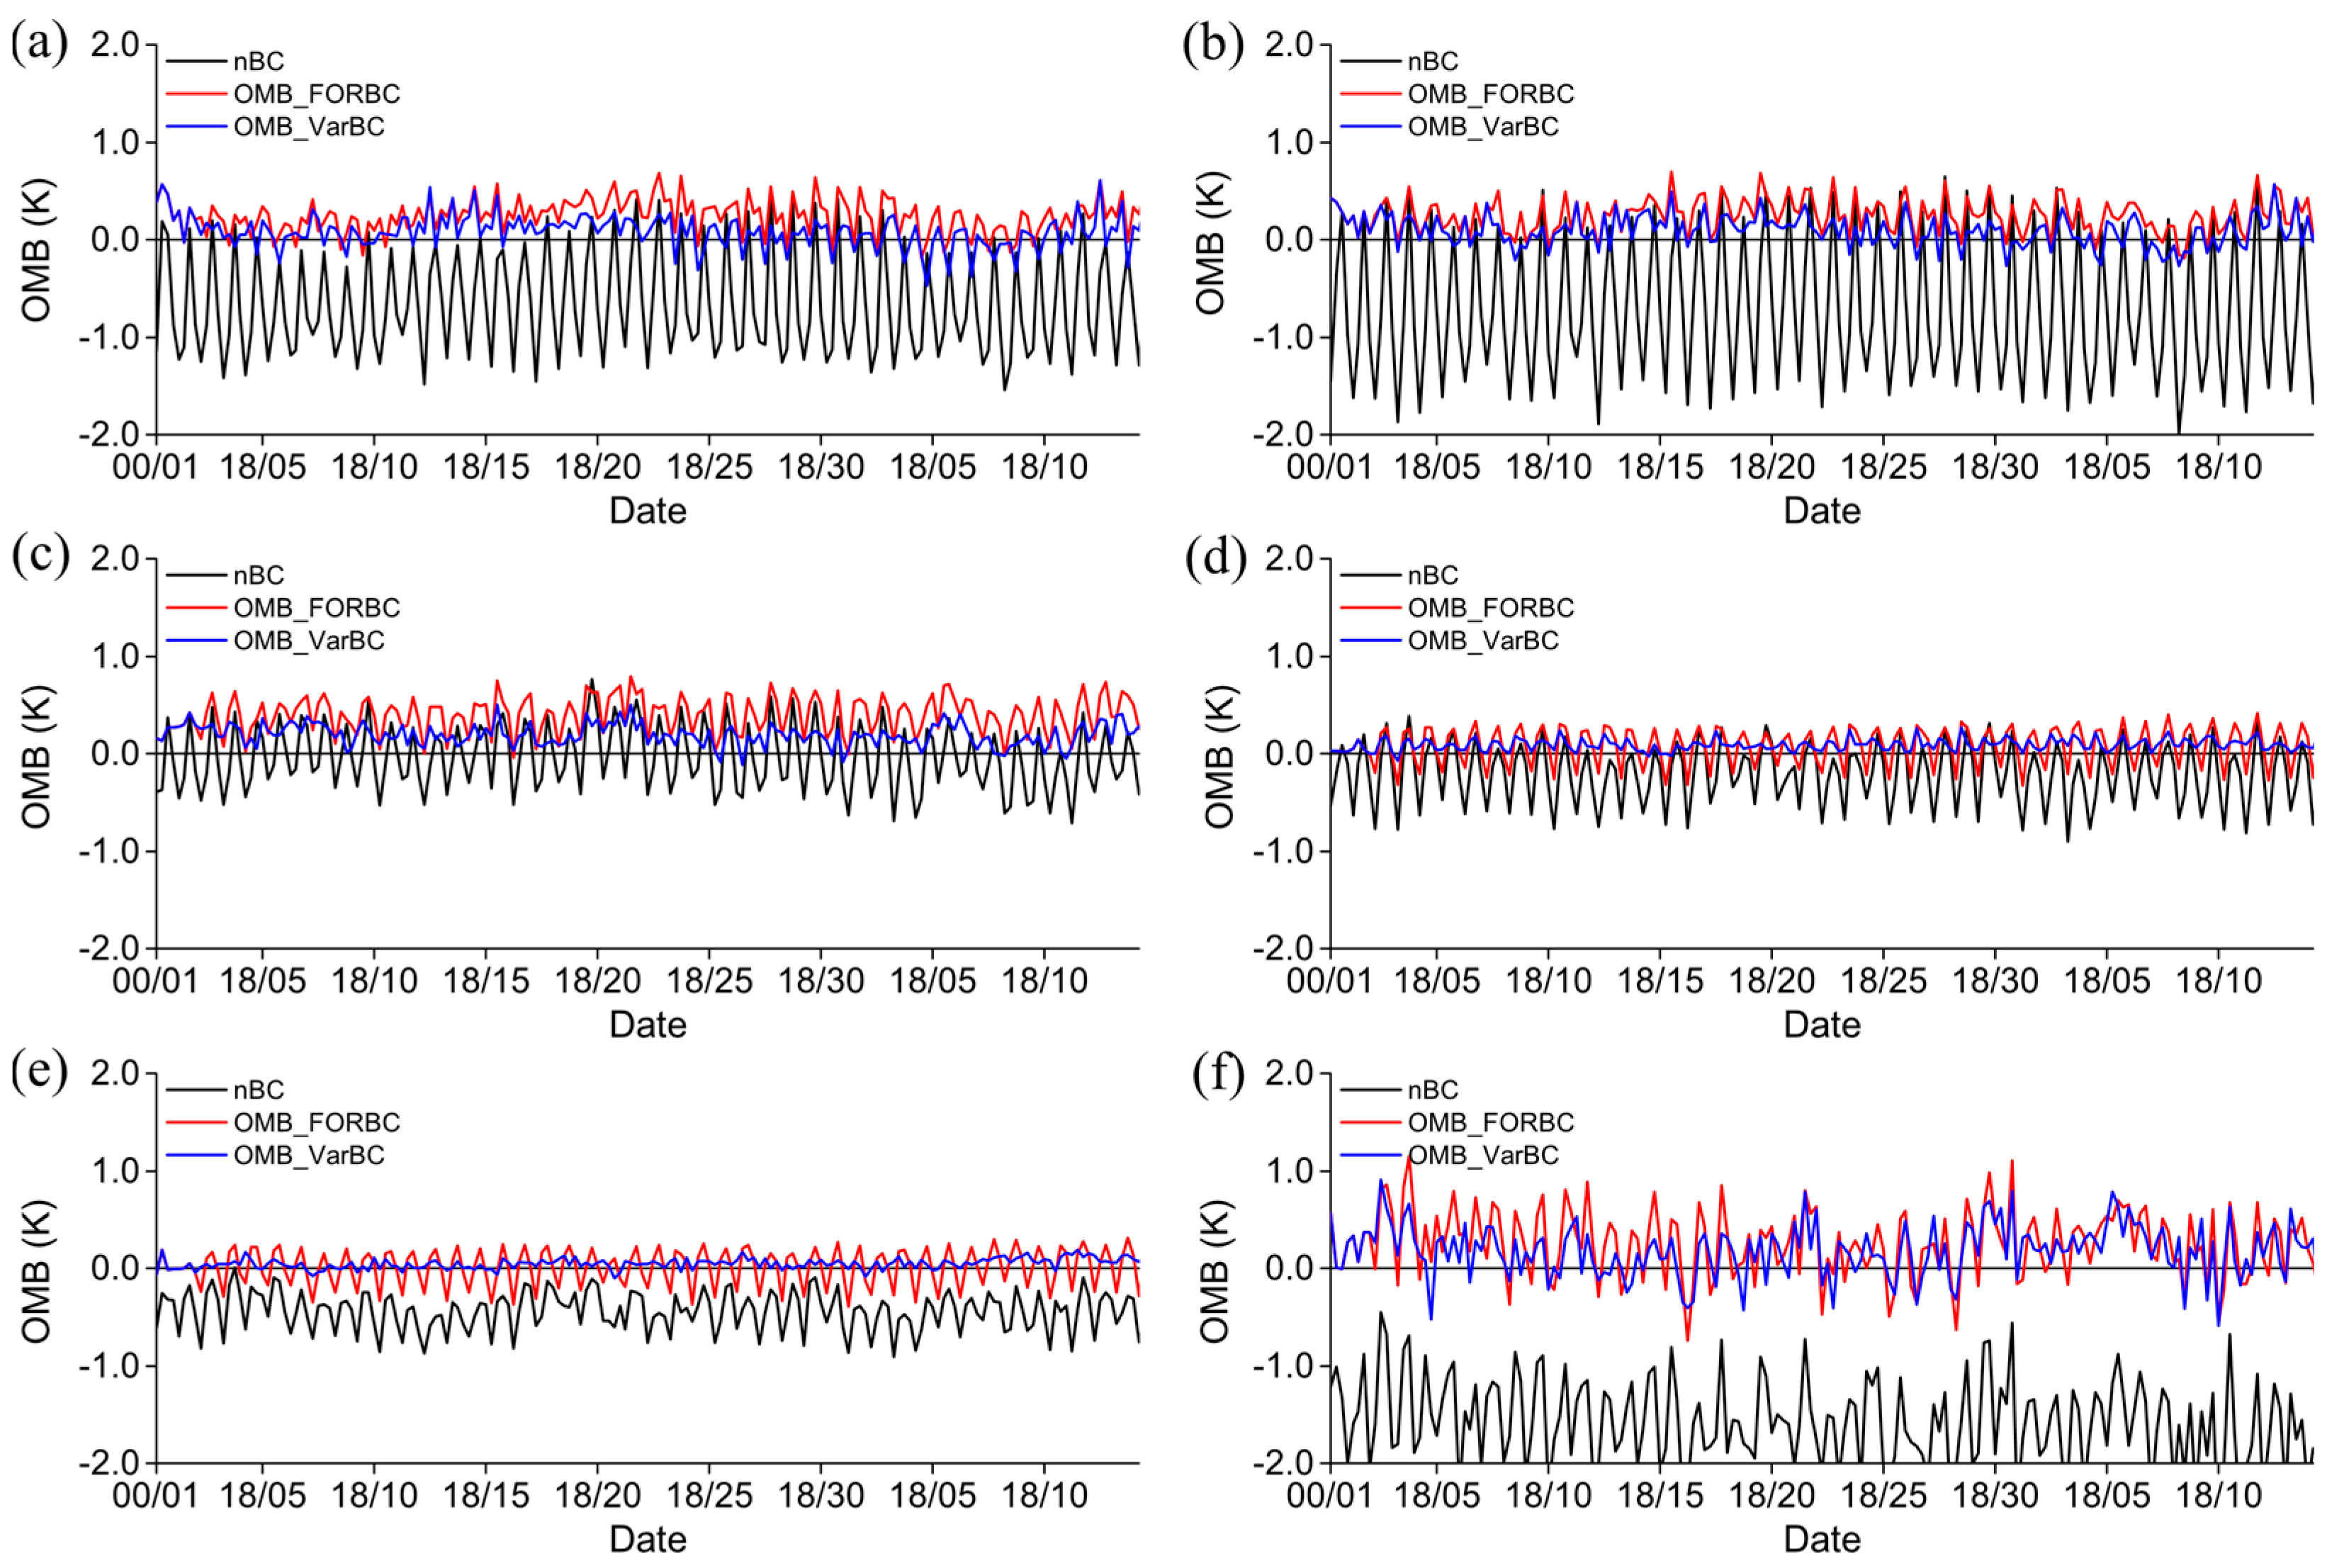
Data assimilation requires unbiased observations, while systematic error (bias) always exists in observations and must be corrected. To characterize the bias of the GIIRS/FY-4A observation, cloud- and precipitation-contaminated data should be excluded since the accuracy of simulated radiances by the RTTOV and model in clear-sky conditions is higher than that in cloudy and precipitating conditions. Therefore, the 873.125 cm−1 (channel 278) infrared window channel is used to identify cloud-contaminated observations and the remaining clear-sky data sample is used to evaluate the quality of GIIRS observations. Figure 3 shows the time series of the differences between observed and simulated radiances (6 h forecasts) for channels 7, 27, 87, 262, 347, and 1174. Channels 7 and 27 (Figure 3a,b, black lines), whose weighting functions peak at the upper and middle troposphere, respectively, show evident diurnal variations, namely, a cold bias in daytime and a warm bias in nighttime. For example, channels 7 and 27 exhibit their minimum biases at 00 UTC; then, these biases gradually become warm and reach their maximum at 12 UTC; afterwards, these biases tend to cool down. For other channels, they exhibit smooth diurnal variations, i.e., small differences between the minimum bias and maximum bias. These characteristics of diurnal variations have also been reported by Yin et al. [10], who only assessed the long-wave band. A recent report [29] revealed that the FY-4B GIIRS observations exhibit an obvious antiphase characteristic in the long-wave band as compared with the FY-4A GIIRS. This suggests that the diurnal variation mainly originates from the GIIRS observations, and the reason for that may be due to some long-wave channels being contaminated by solar radiation.
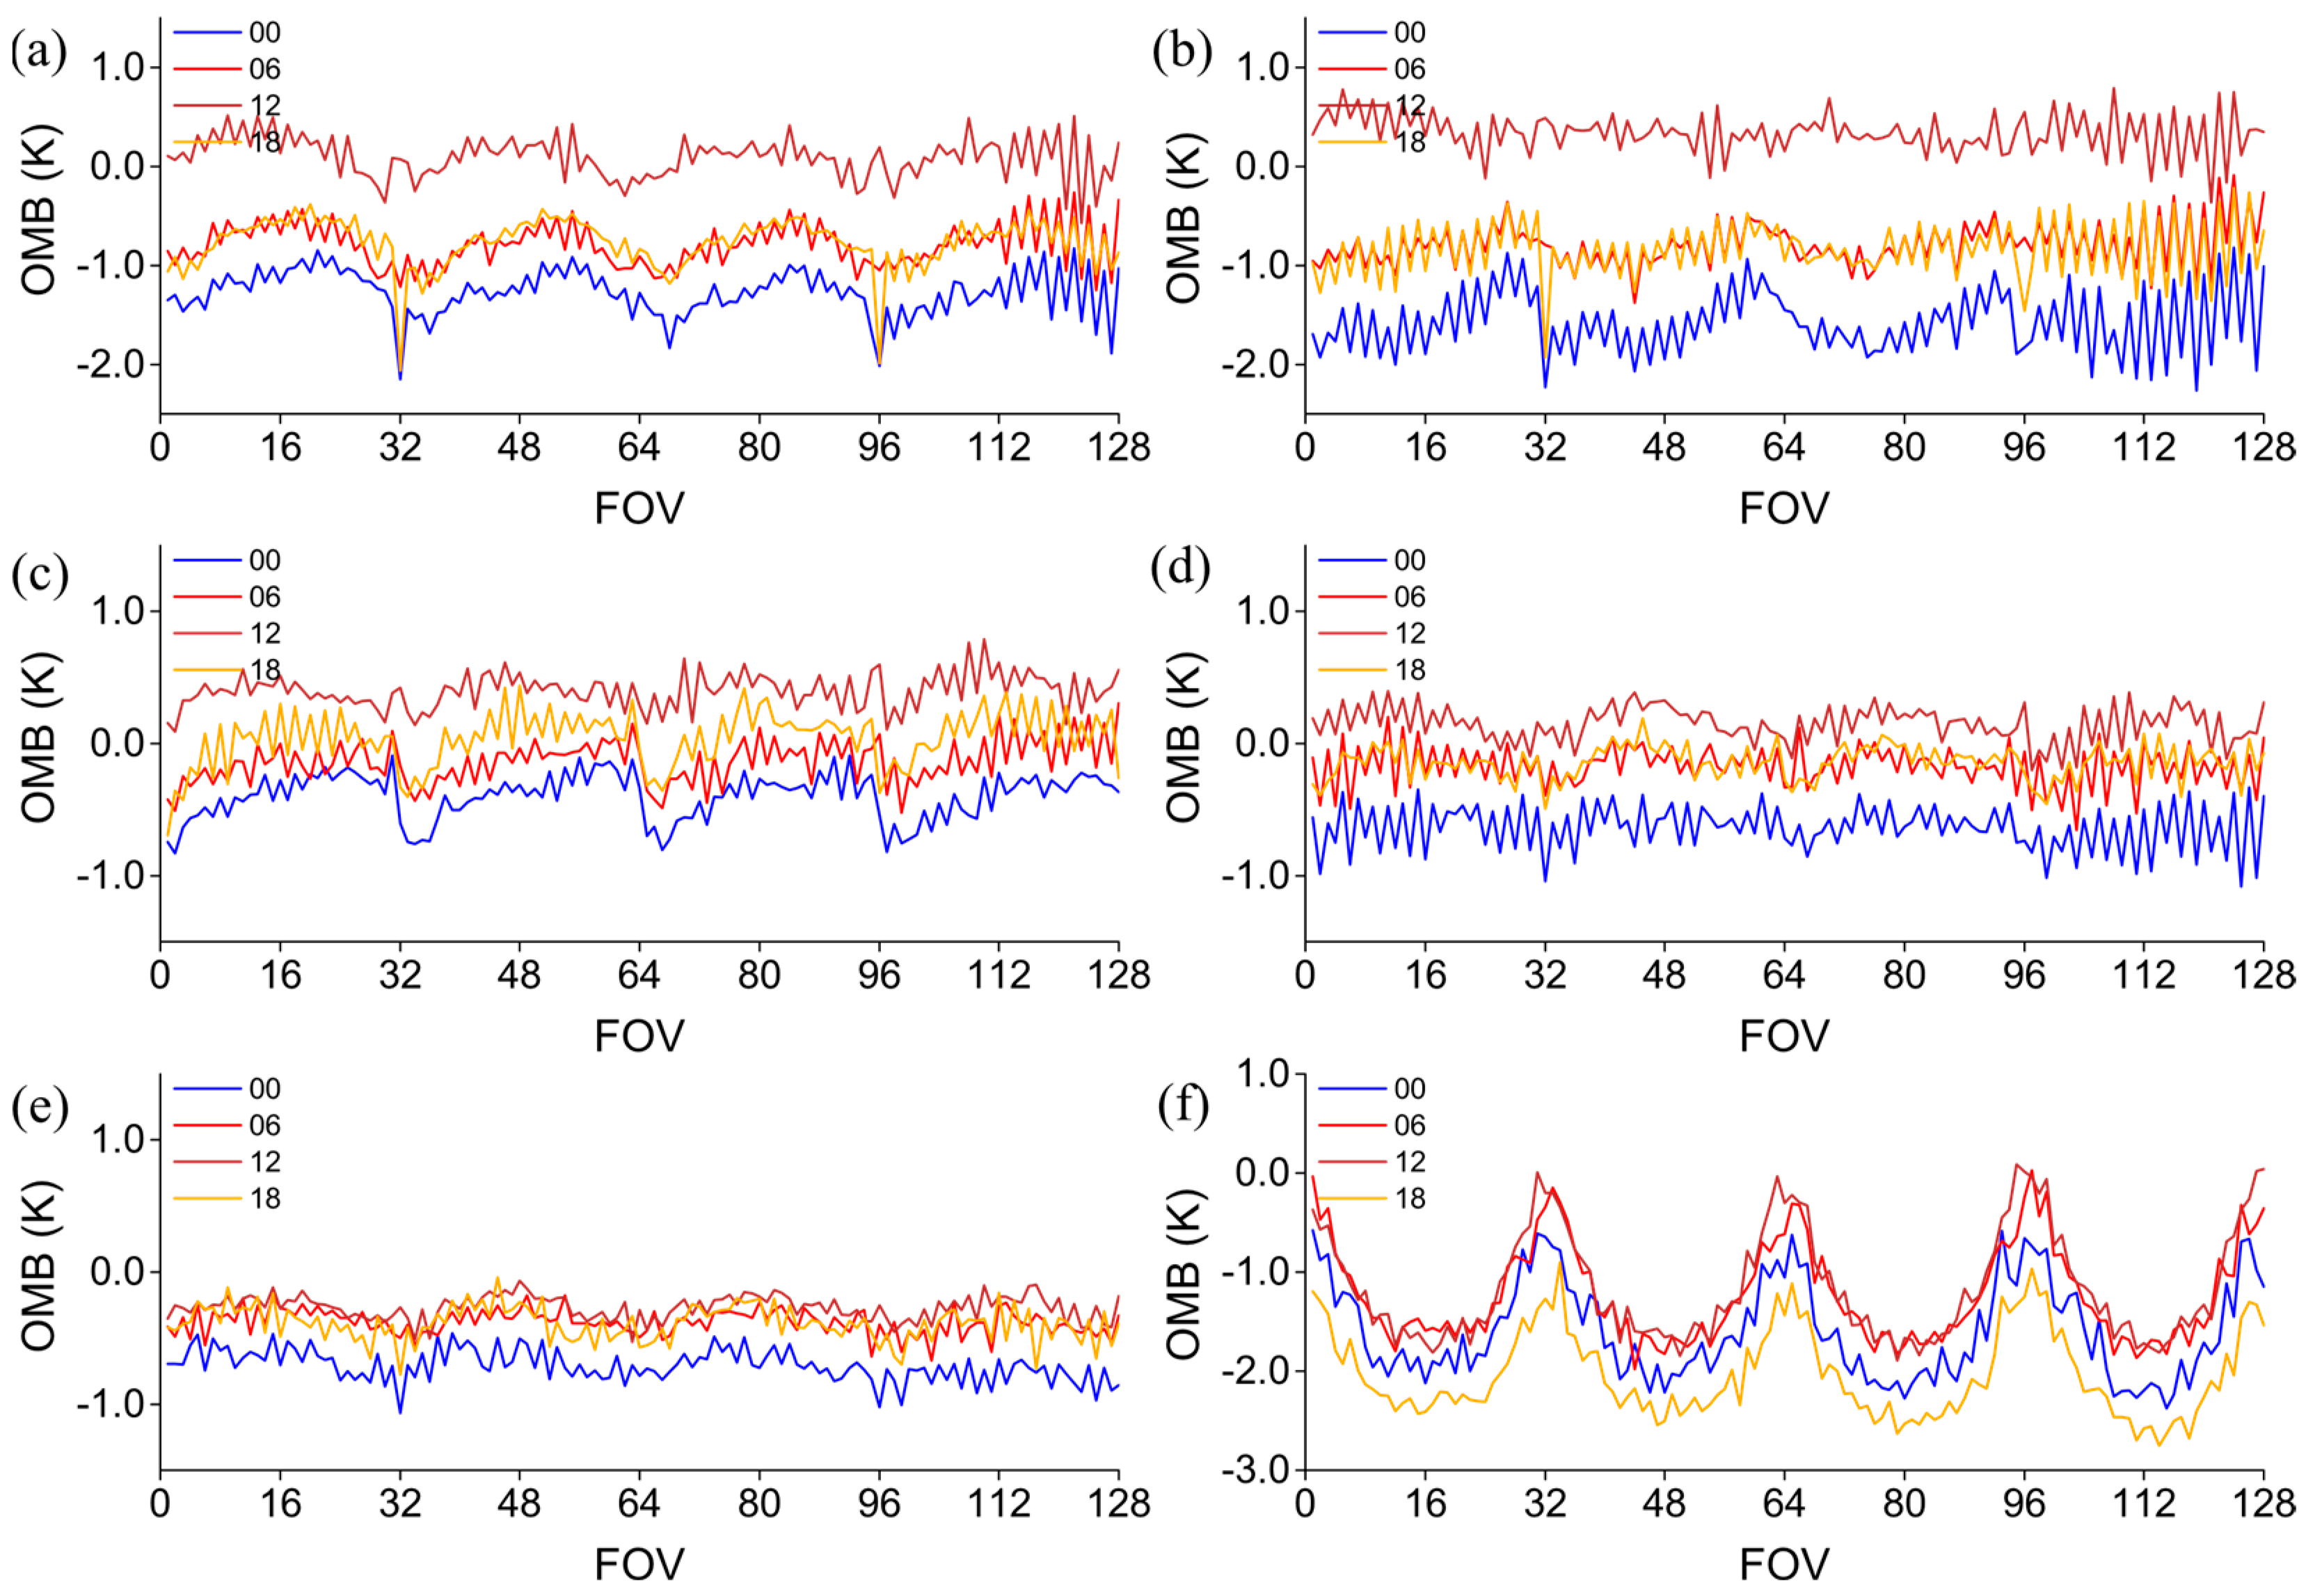
The characteristics of diurnal variation can also be seen from the mean OMBs for each pixel (Figure 4). The mean OMBs for long-wave infrared channels for all pixels vary at different analysis times and reach their minimum and maximum at 00 UTC and 12 UTC, respectively. Channels 7 and 27 exhibit large variations in OMBs, and these characteristics are consistent with Figure 3a,b. On the other hand, four groups of pixels (i.e., FOVs 1–32, 33–64, 65–96, and 97–128) show consistent-looking characteristics at different analysis times. The variations in OMBs are dramatic for channels 7 and 1174 but smooth for other channels. In addition, there are significantly different characteristics for OMBs between the fourth group and the first three groups of pixels (Figure 4a–d). For middle-wave channels, they show totally different characteristics of FOR bias, and the mean OMBs in the center of each pixel group (i.e., FOVs 16, 48, 80, and 112) are larger than those of the other FOVs. In general, the long-wave infrared band shows the same characteristics of diurnal variations and FOR biases, which are different from those of the middle-wave infrared channels.
The diurnal variations should be considered and corrected when assimilating GIIRS radiances. Based on the bias characteristics discussed above, an offline FOR-based bias correction scheme used by Yin et al. [10] was also applied to correct the diurnal variation. The bias correction coefficients were calculated at different analysis times. Figure 3 shows that the FOR-based bias correction effectively alleviates the diurnal variation and greatly reduces the magnitudes of the OMBs (red lines) for most channels. For instance, the average OMBs decrease from −0.67 K to 0.24 K, from −0.73 to 0.25, and from −0.20 K to 0.08 K for channels 7, 27, and 262, respectively. After removing the FOR biases, an enhanced radiance bias correction scheme [30], that is, variational bias correction (VarBC) scheme, was also used in this study. This enhanced scheme not only combines the air-mass component and scan angle component, but also has capability to detect any new/missing/recovering radiance data and performs bias correction for passive channels. In this study, the VarBC’s bias coefficients for the GIIRS and other sensors are accumulated from 0000 UTC 1 June to 1800 UTC 27 June, which allow the bias coefficients to vary with the atmospheric states and to be stable. Additionally, the predictors for air-mass bias correction include global offset, temperature lapse rate, and the square of the temperature lapse rate. As shown in Figure 3, the OMBs are larger for all channels at the initial time; after that, the OMBs quickly settle down to a reasonable level from zero in the first several analysis cycles (red lines). Note that the magnitude of OMBs is still relatively larger for middle-wave channels after applying the FOR-based bias correction and VarBC scheme as compared with the long-wave channels.

2.5. Observation Errors

Observation error includes a range of errors, for example, instrument error, random error, representativeness error, and quality control error. Previous studies have revealed noticeable inter-channel or spatial error correlations in certain hyperspectral channels (e.g., AIRS, IASI), especially in water vapor channels [31,32,33]. Taking the inter-channel error correlation into consideration in the assimilation of hyperspectral radiances positively influences the quality of analyses and forecasts [32,34]. This study employs a common method proposed by Desroziers et al. [35] to estimate the GIIRS’s correlated observation error, using departure statistics. The detailed procedures are as follows: (1) Apply an equation R = ( R org + R org T ) / 2 to make the correlated observation error matrix symmetrical, where R , R org , and R org T are the symmetrical full observation error covariance matrix, and the original full observation error covariance matrix produced by the Desroziers method and its transpose, respectively. (2) The diagonal values of R are multiplied by an empirical inflation factor. The need to inflate observation errors stems from the partial validity of the assumptions made during the derivation of the diagnosed matrix for certain spectral structures [34]. Spatial error correlations are overlooked in this context. Furthermore, inaccuracies in the geolocations for the middle-wave water vapor band result in a discrepancy between the observed and simulated radiances. Consequently, inflating the observation error can help to compensate for these deficiencies and representativeness errors.
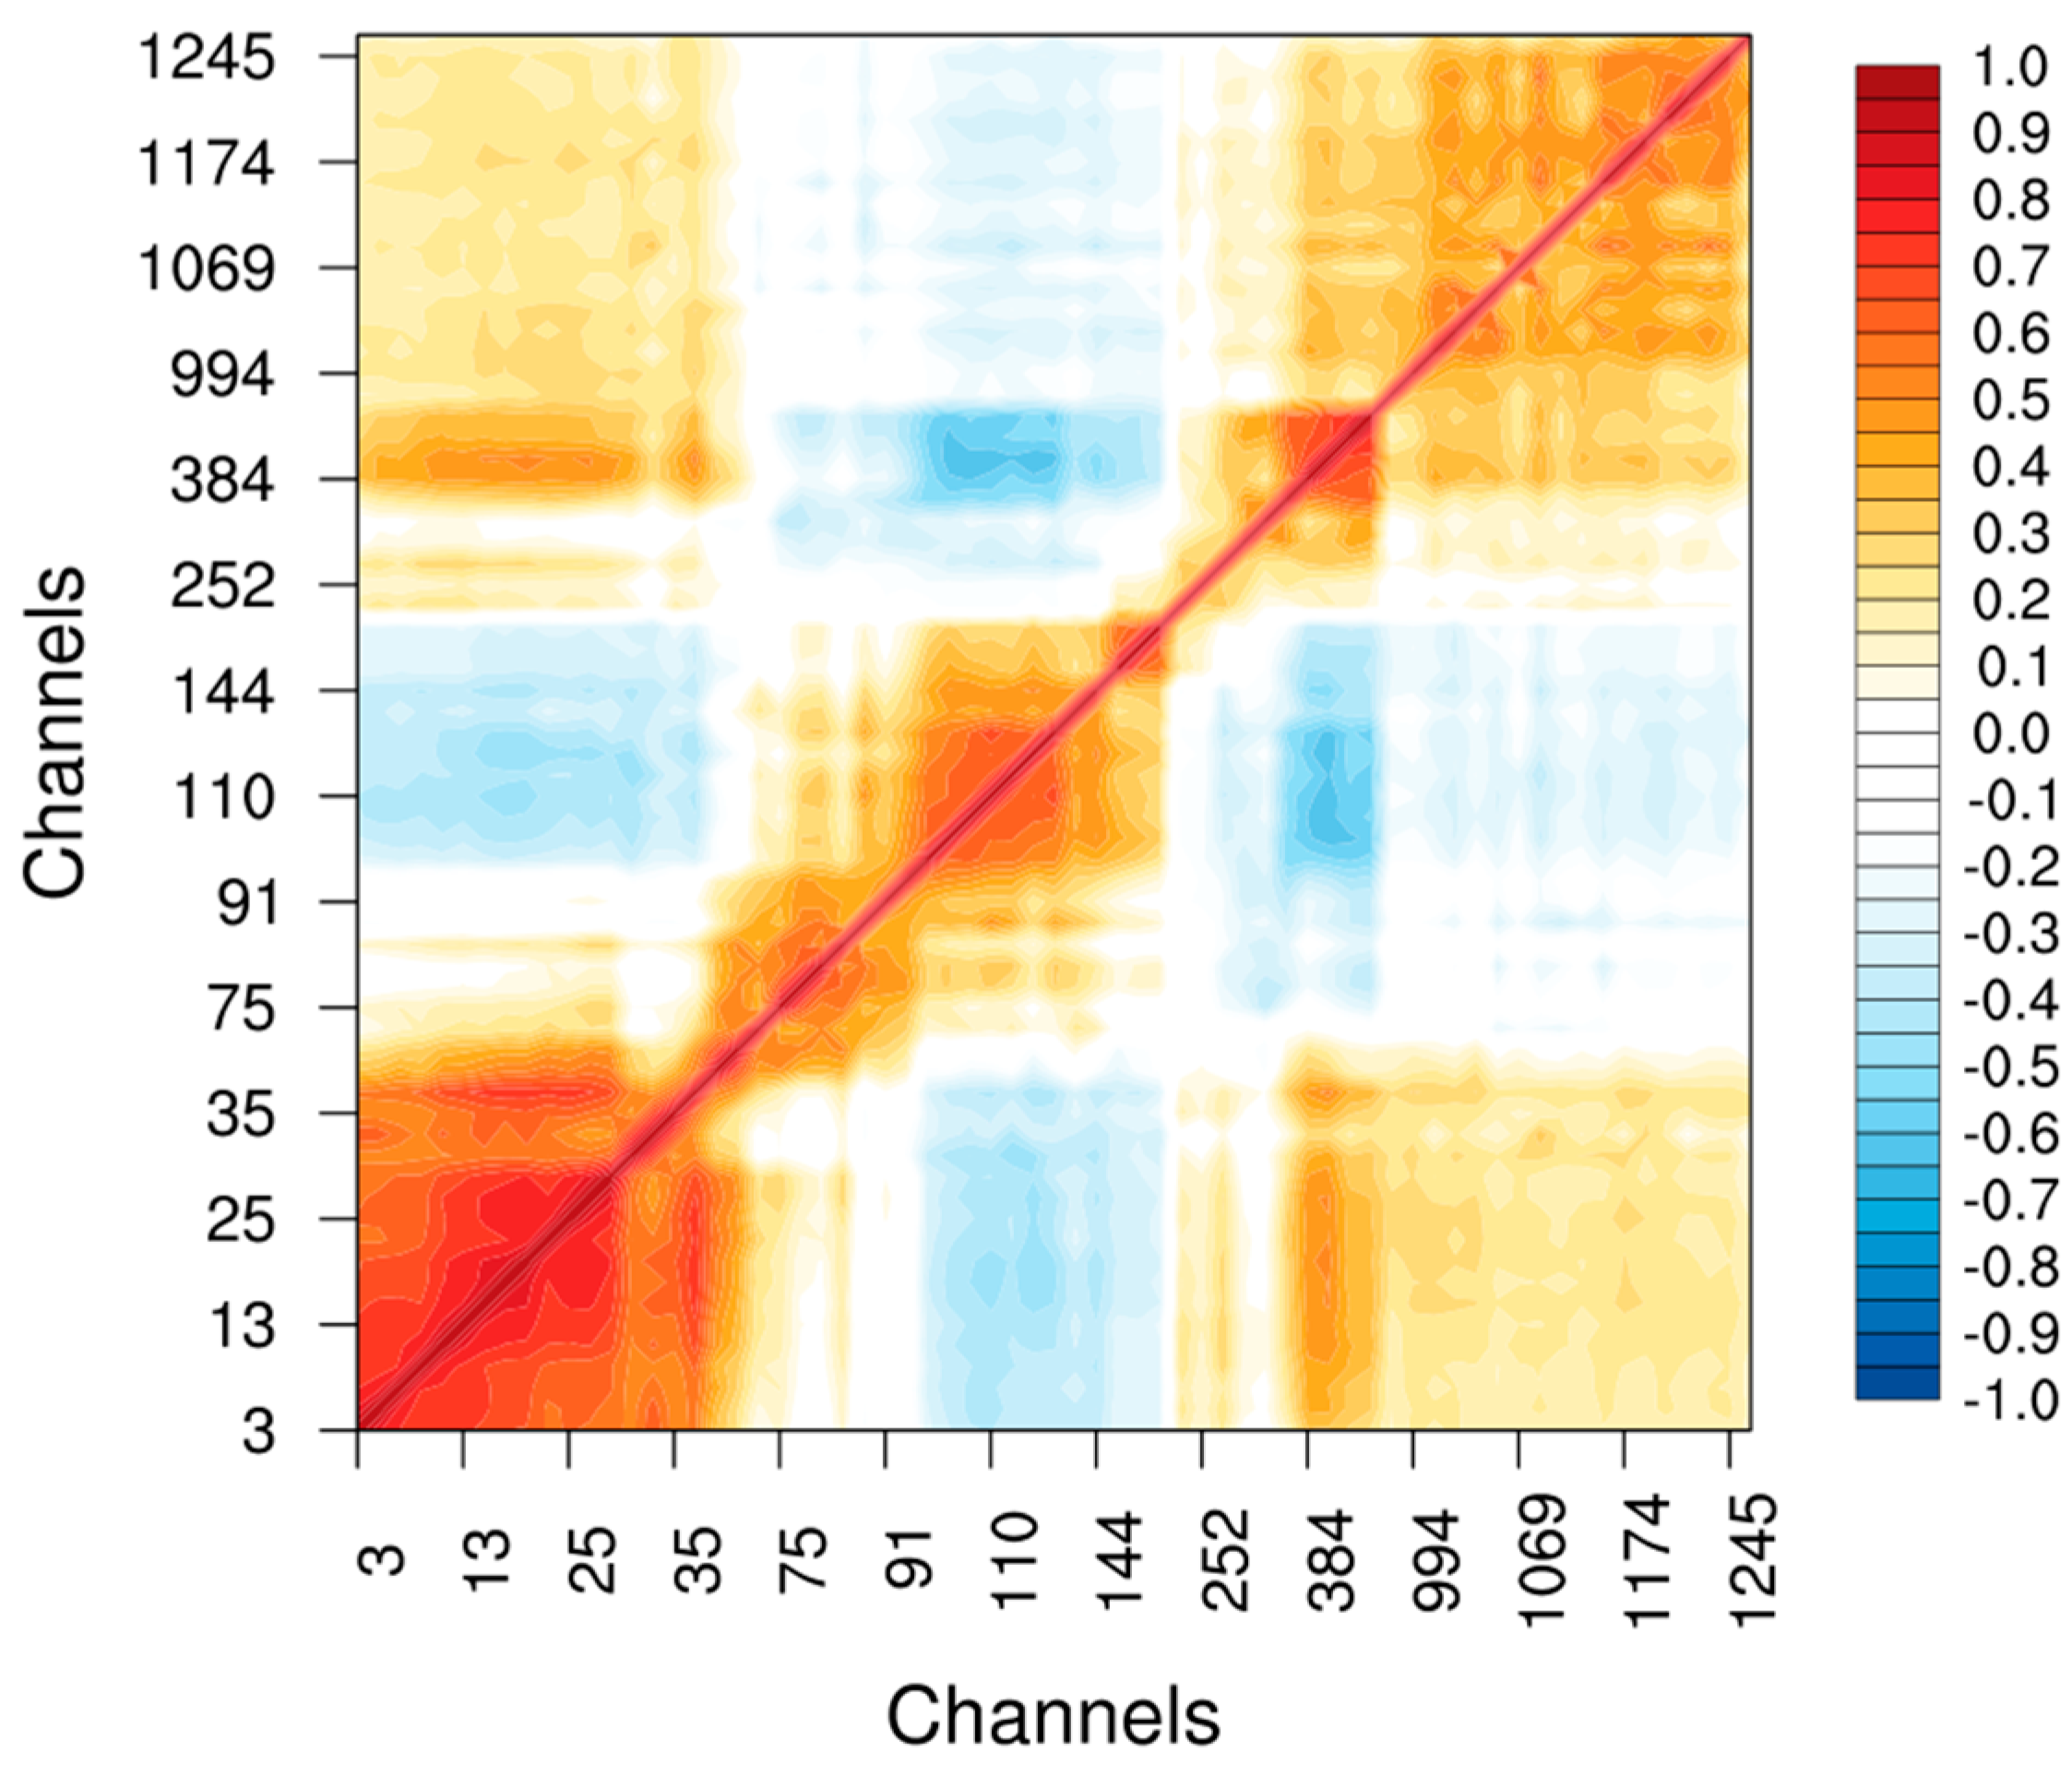
In this study, the approach of Bathmann and Collard [36] was adopted to inflate the diagonal of the correlated observation errors matrix. Specifically, the diagonal values of diagnosed observation-error estimations over sea are scaled by 1.3, 1.8, and 1.6 for humidity, window, and other channels, respectively. In contrast, the observation errors over land are derived from the clear-sky sample, as outlined in Section 2.4, without accounting for the correlated observation errors. According to Bormann et al. [34], inflation factors of 2–3 are common. Given the evident diurnal variation biases exhibited in the GIIRS compared to CrIS and the inaccurate geolocations for the middle-wave water vapor band, we have chosen other scales of 2.5 and 3.0 to adjust the diagnosed observation-error matrix for all channels, respectively. Additionally, the inter-channel observation error is taken into consideration over both sea and land. It is important to emphasize that the selection of inflation factors is empirical. These settings allow us to compare the forecast performances of the assimilation of GIIRS observations from both bands with different scaled observation errors. Figure 5 shows the correlation matrix for the assimilated channels (described in next section) after applying the above steps. The result of the Desroziers method is generally symmetrical, and the condition number after error inflation is about 40, which is comparable to CrIS’s. The calculated correlation matrix exhibits three blocks, namely, long-wave temperature (channels 3–75), window (channels 77–211 and channels 231–449), and water vapor (channels 985–1251), which indicates that these channels have a strong correlation in each block. For example, the correlations are between 0.4 and 0.8 for long-wave temperature channels, and between 0.3 and 0.6 for water vapor channels.

2.6. Quality Control

Quality control is essential for the GIIRS observations in data assimilation. The quality control for GIIRS observations consists of the following steps: (1) An FOV check, which excludes the first and last two rows and the fourth column of each FOR array according to the quality evaluation of the GIIRS observations in previous sections. (2) A satellite zenith angle check, which excludes observations with a satellite zenith angle exceeding 60 degrees. (3) An observation brightness temperature check, which excludes observations below 150 K or above 350 K. (4) A gross value check, which excludes first-guess departures exceeding three times the specified observation errors. (5) Thinning, which reduces the GIIRS to a spacing of 60 km. In addition, a minimum residual method [37], employed in the GSI system to detect clouds for infrared radiances, was also applied to the GIIRS radiances in clear-sky conditions. The minimum residual method selects “clear channels” to retain the channels less sensitive to clouds, even if the pixel is cloud-contaminated. In this study, the selection of channels used for assimilation is similar to that for CrIS, that is, 3, 5, 7, 9, 11, 13, 15, 17, 19, 23, 25, 27, 29, 31, 33, 35, 67, 69, 71, 73, 75, 77, 79, 83, 87, 91, 95, 99, 103, 107, 110, 114, 117, 120, 131, 144, 195, 199, 211, 231, 252, 262, 309, 330, 347, 384, 402, 421, and 449; and 18 additional water vapor channels are selected, i.e., 985, 994, 1011, 1018, 1030, 1055, 1069, 1091, 1099, 1111, 1139, 1174, 1191, 1209, 1216, 1223, 1245, and 1251.

3. Experimental Settings

To assess the effects of assimilating FY-4A GIIRS radiances within the SD3 model and the GSI system on analysis and forecasting, four experiments were conducted. The first experiment, referred to as CONTROL, assimilated various data sources, including surface reports, radiosonde, pibal and aircraft reports, atmospheric motion vectors, Global Positioning System bending-angle observations, radiance data from multiple satellite instruments, and ozone observations. The second experiment, GIIRS_INF1, includes all the data sources of the first and also adds GIIRS observations. In addition, the inter-channel observation errors are scaled using the Bathmann and Collard method. The third and fourth experiments, GIIRS_INF2 and GIIRS_INF3, are the same as the second experiment but the inter-channel observation errors are scaled by 2.5 and 3.0, respectively, as described in Section 2.5. The C768 SD3 global model, with a center over China using a stretching grid, was employed in this study. The model had an average resolution of approximately 3.5 km over China and averaged 12 km elsewhere (Figure 6). This high-resolution configuration allowed the model to simulate clouds explicitly without the need of deep convection parameterization. The C768 SD3 model has 6 tiles with 768 grid cells in both the x- and y-directions per tile, 100 vertical levels, and a model top at 0.01 hPa. All experiments ran from 0000 UTC 28 June 2021 to 1800 UTC 31 July 2021 with cycling forecast analysis. Analyses were generated every 6 h in the cycling experiments. In this study, only the 5-day forecasts that were issued at 0000 UTC and 1200 UTC analysis times were evaluated. The first analysis used a forecast initialized from the NCEP analysis at 1800 UTC 27 June 2021 as the background, and subsequent cycles used SD3 model forecasts initialized from the previous cycle’s analyses as the backgrounds. Note that both the GSI analysis system and the SD3 model background had approximately 12 km resolution for all experiments.

4. Results

4.1. The Performance of SD3 Model

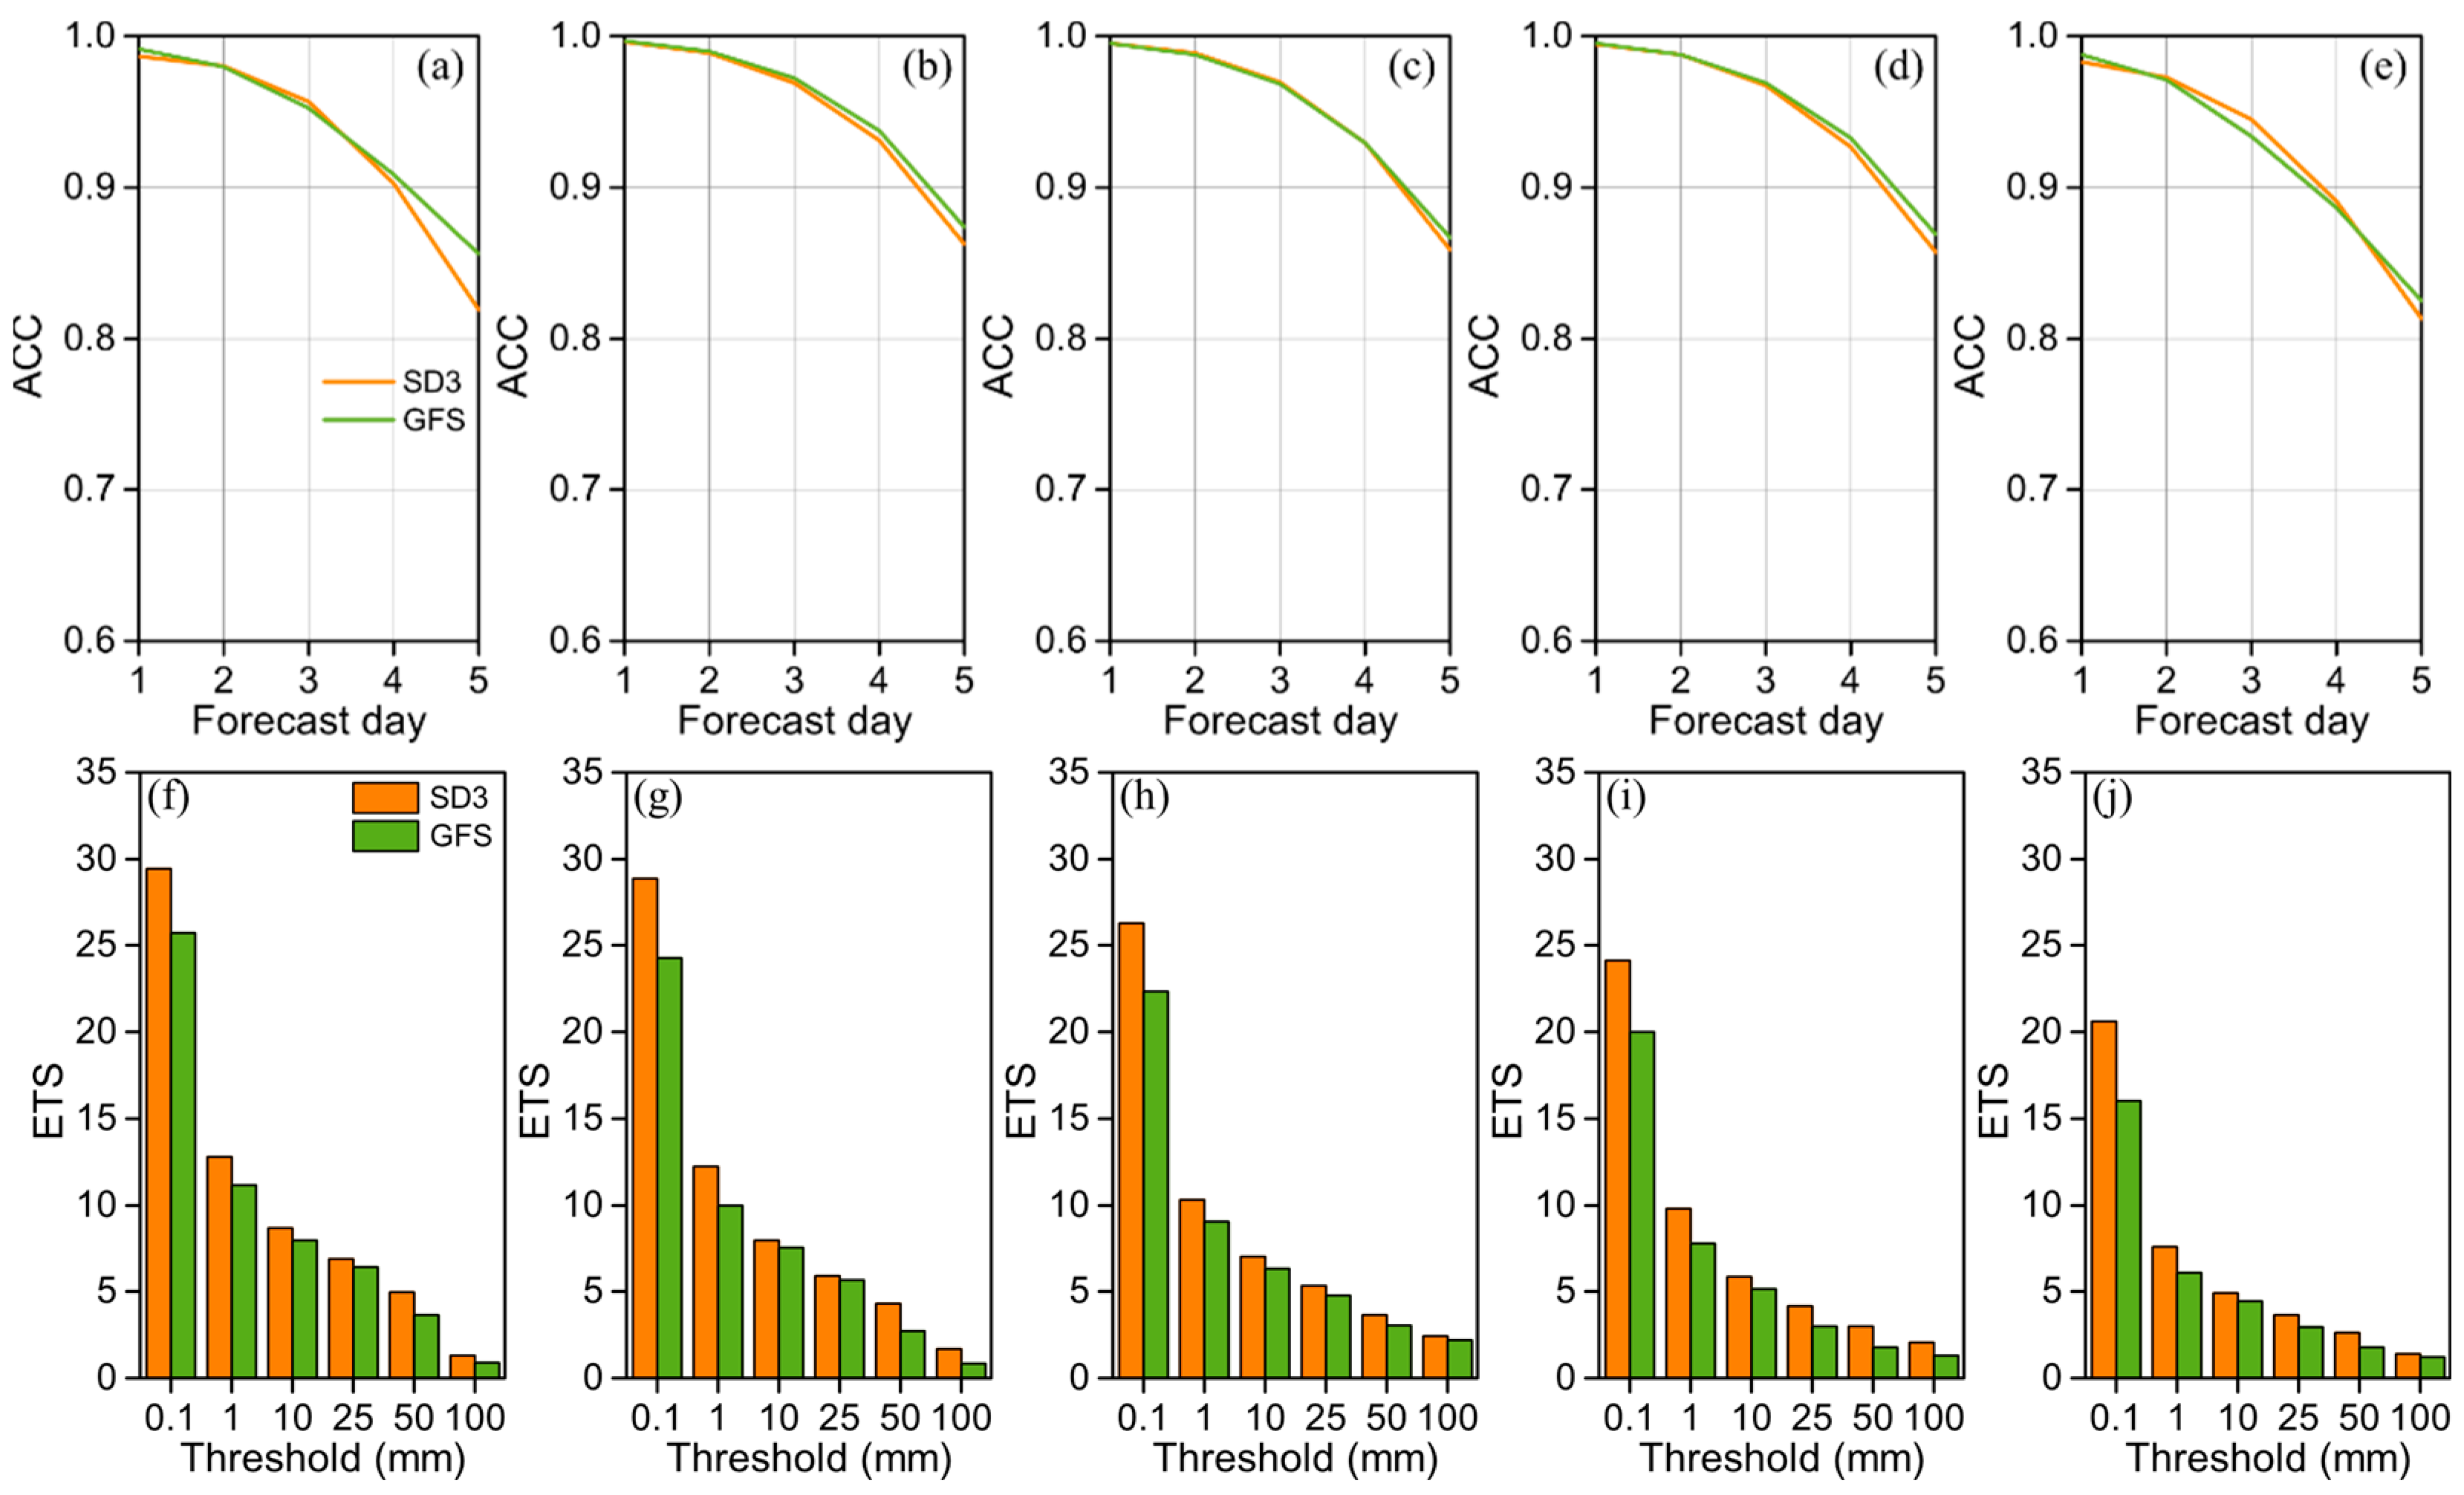
Figure 7 presents the performance of the C768 SD3 forecasting system in terms of the anomaly correlation coefficient (ACC) and the 5-day precipitation forecasts over China evaluated from 0000 UTC 1 June 2021 to 1200 UTC 30 June 2021. The forecasts produced from the SD3 model are initialized using the NCEP analyses, with the NCEP-GFS’s forecasts serving as benchmarks. The ACC scores of SD3 model are comparable to those of the GFS, that is, the ACC scores are above 0.8 for all areas (Asia, northern hemisphere, global, southern hemisphere, and China). This suggests that the large-scale representations of 500 hPa geopotential height are accurately depicted in the SD3 model, which employs a stretching grid over China domain, especially from day 1 to day 3. On the other hand, the C768 SD3 model outperforms the GFS’s results in terms of 5-day precipitation prediction across all rainfall thresholds. Notable improvements are observed for the thresholds of 0.1 mm, 1 mm, and 50 mm, with higher ETS scores in the C768 SD3 model as compared with the GFS’s results. These results indicate that the performances of the C768 SD3 model are robust and sufficiently reliable to conduct data assimilation and the following evaluation of the impact of assimilating GIIRS observations on weather forecasting.

4.2. Short-Rang Forecast Impact

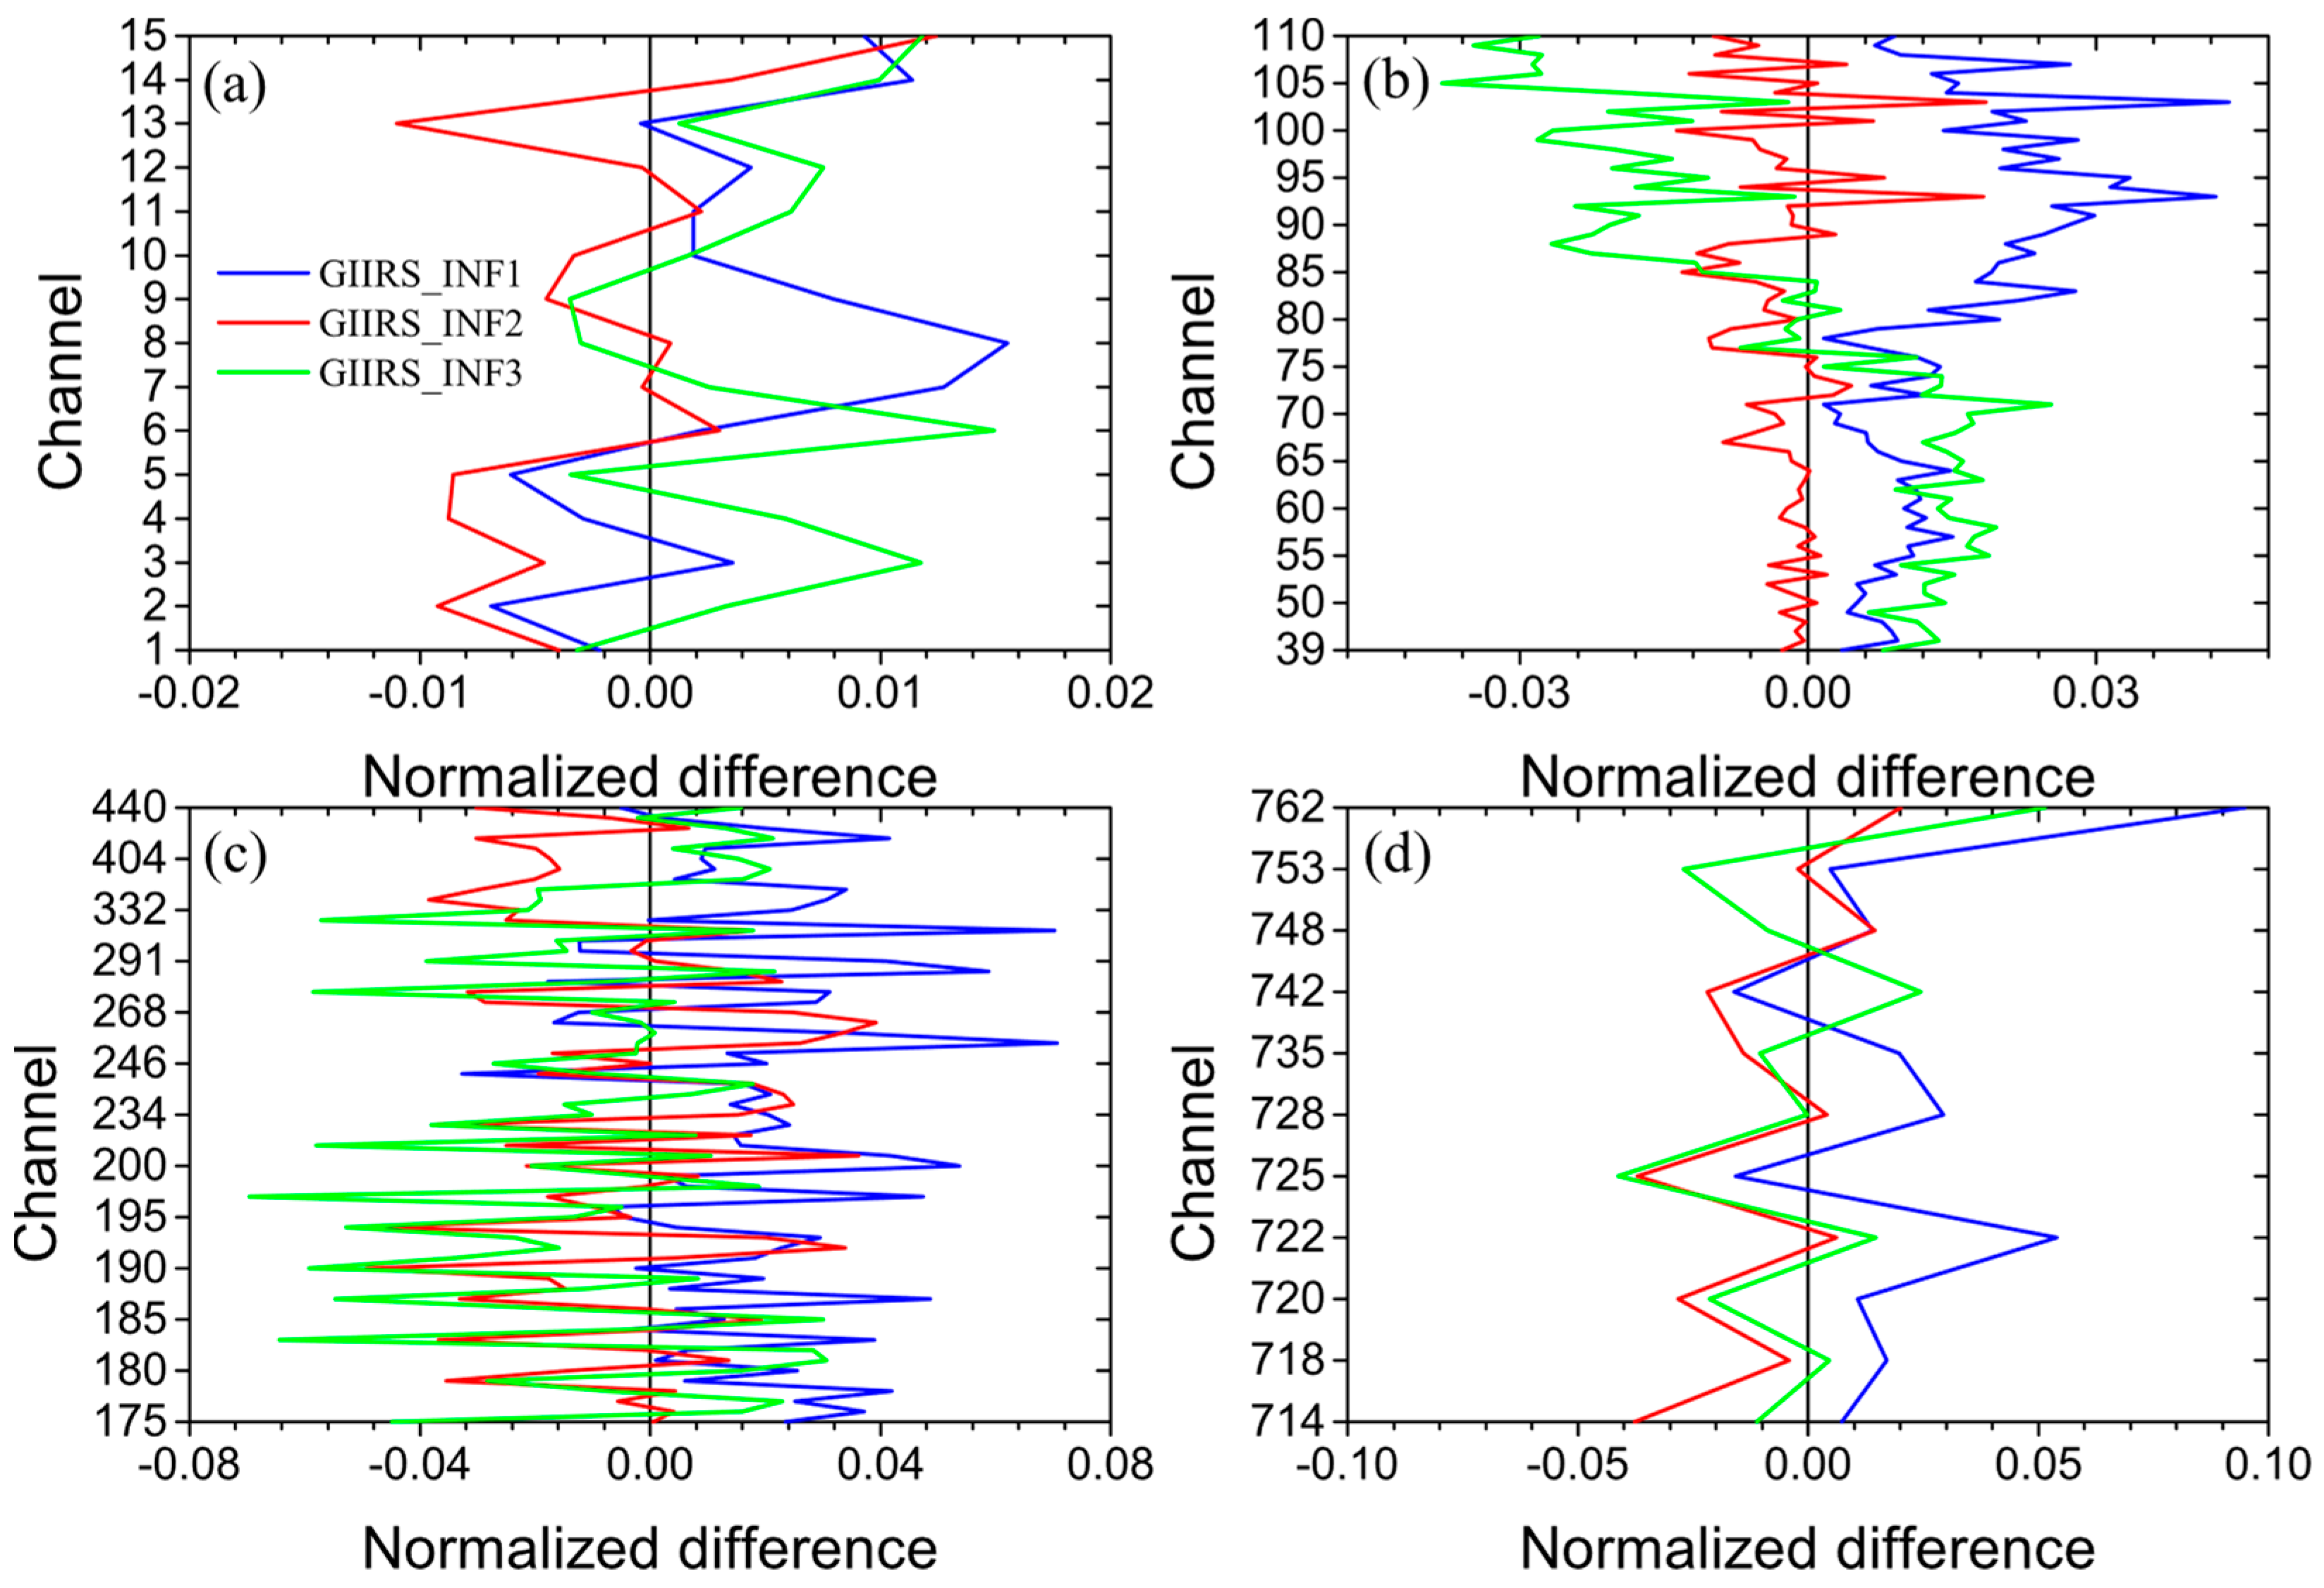
The analysis of OMB statistics of independent observations provides a valuable approach for assessing the impact of assimilating GIIRS radiances on the short-range forecast (6 h). Figure 8 shows the normalized changes in background fit for selected instruments, specifically ATMS and CrIS, in the GIIRS_INF1 (blue lines), GIIRS_INF2 (red lines), and GIIRS_INF3 (green lines) experiments for the domain over China. The CONTROL experiment is represented by the zero line, with negative values indicating an improved fit of the short-range forecasts to the selected instrument when GIIRS is assimilated.
Upon verifying against radiances from the ATMS instrument (Figure 8a), the assimilation of GIIRS observations, with the correlated observation errors scaled by 2.5, generally exhibits neutral to positive impacts on the reductions in normalized background departure standard deviations. Specifically, reductions in departure standard deviations of approximately 0.8% and 1.2% are observed in temperature channels 1–5 and 13 of the ATMS, respectively. The GIIRS_INF1 experiment displays similar impact profiles, but the points generally lie to the right of the zero line, indicating negative impacts on the reduction in the departure standard deviations of ATMS. Conversely, the GIIRS_INF3 experiment, which scales the observation errors by 3.0, demonstrates a more pronounced negative effect than the other two experiments in channels 1–7.
Further evaluation against the CrIS long-wave temperature channels (Figure 8b,c) reveals noticeable differences between the three error inflation experiments. The GIIRS_INF1 experiment, with minor error inflation, significantly increases the departure standard deviations for almost all channels of the CrIS instrument. However, the GIIRS_INF2 experiment, applying a scale of 2.5, achieves neutral to positive impacts (Figure 8b). Channels 39–75, sensitive to stratospheric temperature, and channels 80–110, sensitive to upper- and middle-tropospheric temperature, both show neutral to slightly positive impacts on the reductions in departure standard deviations. Some degradations are observed in the lower troposphere, such as channels 93–95 and 103, but the GIIRS_INF2 experiment still outperform the GIIRS_INF1 experiment. In contrast, the GIIRS_INF3 experiment yields a negative impact for the stratospheric temperature channels and a positive impact for the upper- and middle-tropospheric temperature channels.
For the window channels of CrIS (Figure 8c), the impact is generally neutral but significantly positive in channels 180–195 and 332–440, with about 4.8% reductions in departure standard deviations in the GIIRS_INF2 experiment. Further improvements are observed in the GIIRS_INF3 experiment, especially for channels 180–234. However, the GIIRS_INF1 experiment shows significant degradations in these window channels.
On the other hand, the performance of the short-range forecast of humidity is evaluated against the water vapor channels of CrIS (Figure 8d). Approximately 4.0% improvements are achieved in channels 714–742, while other channels show neutral to negative impacts for the CrIS’s water vapor channels in the GIIRS_INF2 experiment. These impact profiles are also observed in the GIIRS_INF3 experiment, but some degradations are observed for channels 742 and 762. However, more evident negative impacts are exhibited in the GIIRS_INF1 experiment. Overall, the GIIRS_INF2 experiment outperforms the GIIRS_INF1 and GIIRS_INF3 experiments in terms of the short-range forecast of temperature and humidity. Moreover, the improvement of temperature is larger than that of humidity in the GIIRS_INF2 experiment.

4.3. Middium-Rang Forecast Impact

The performance of 5-day forecasts is evaluated based on the normalized change in root-mean-square (RMS) error:
RMS   error = 1 n i = 1 n x obs ,   i x model ,   i
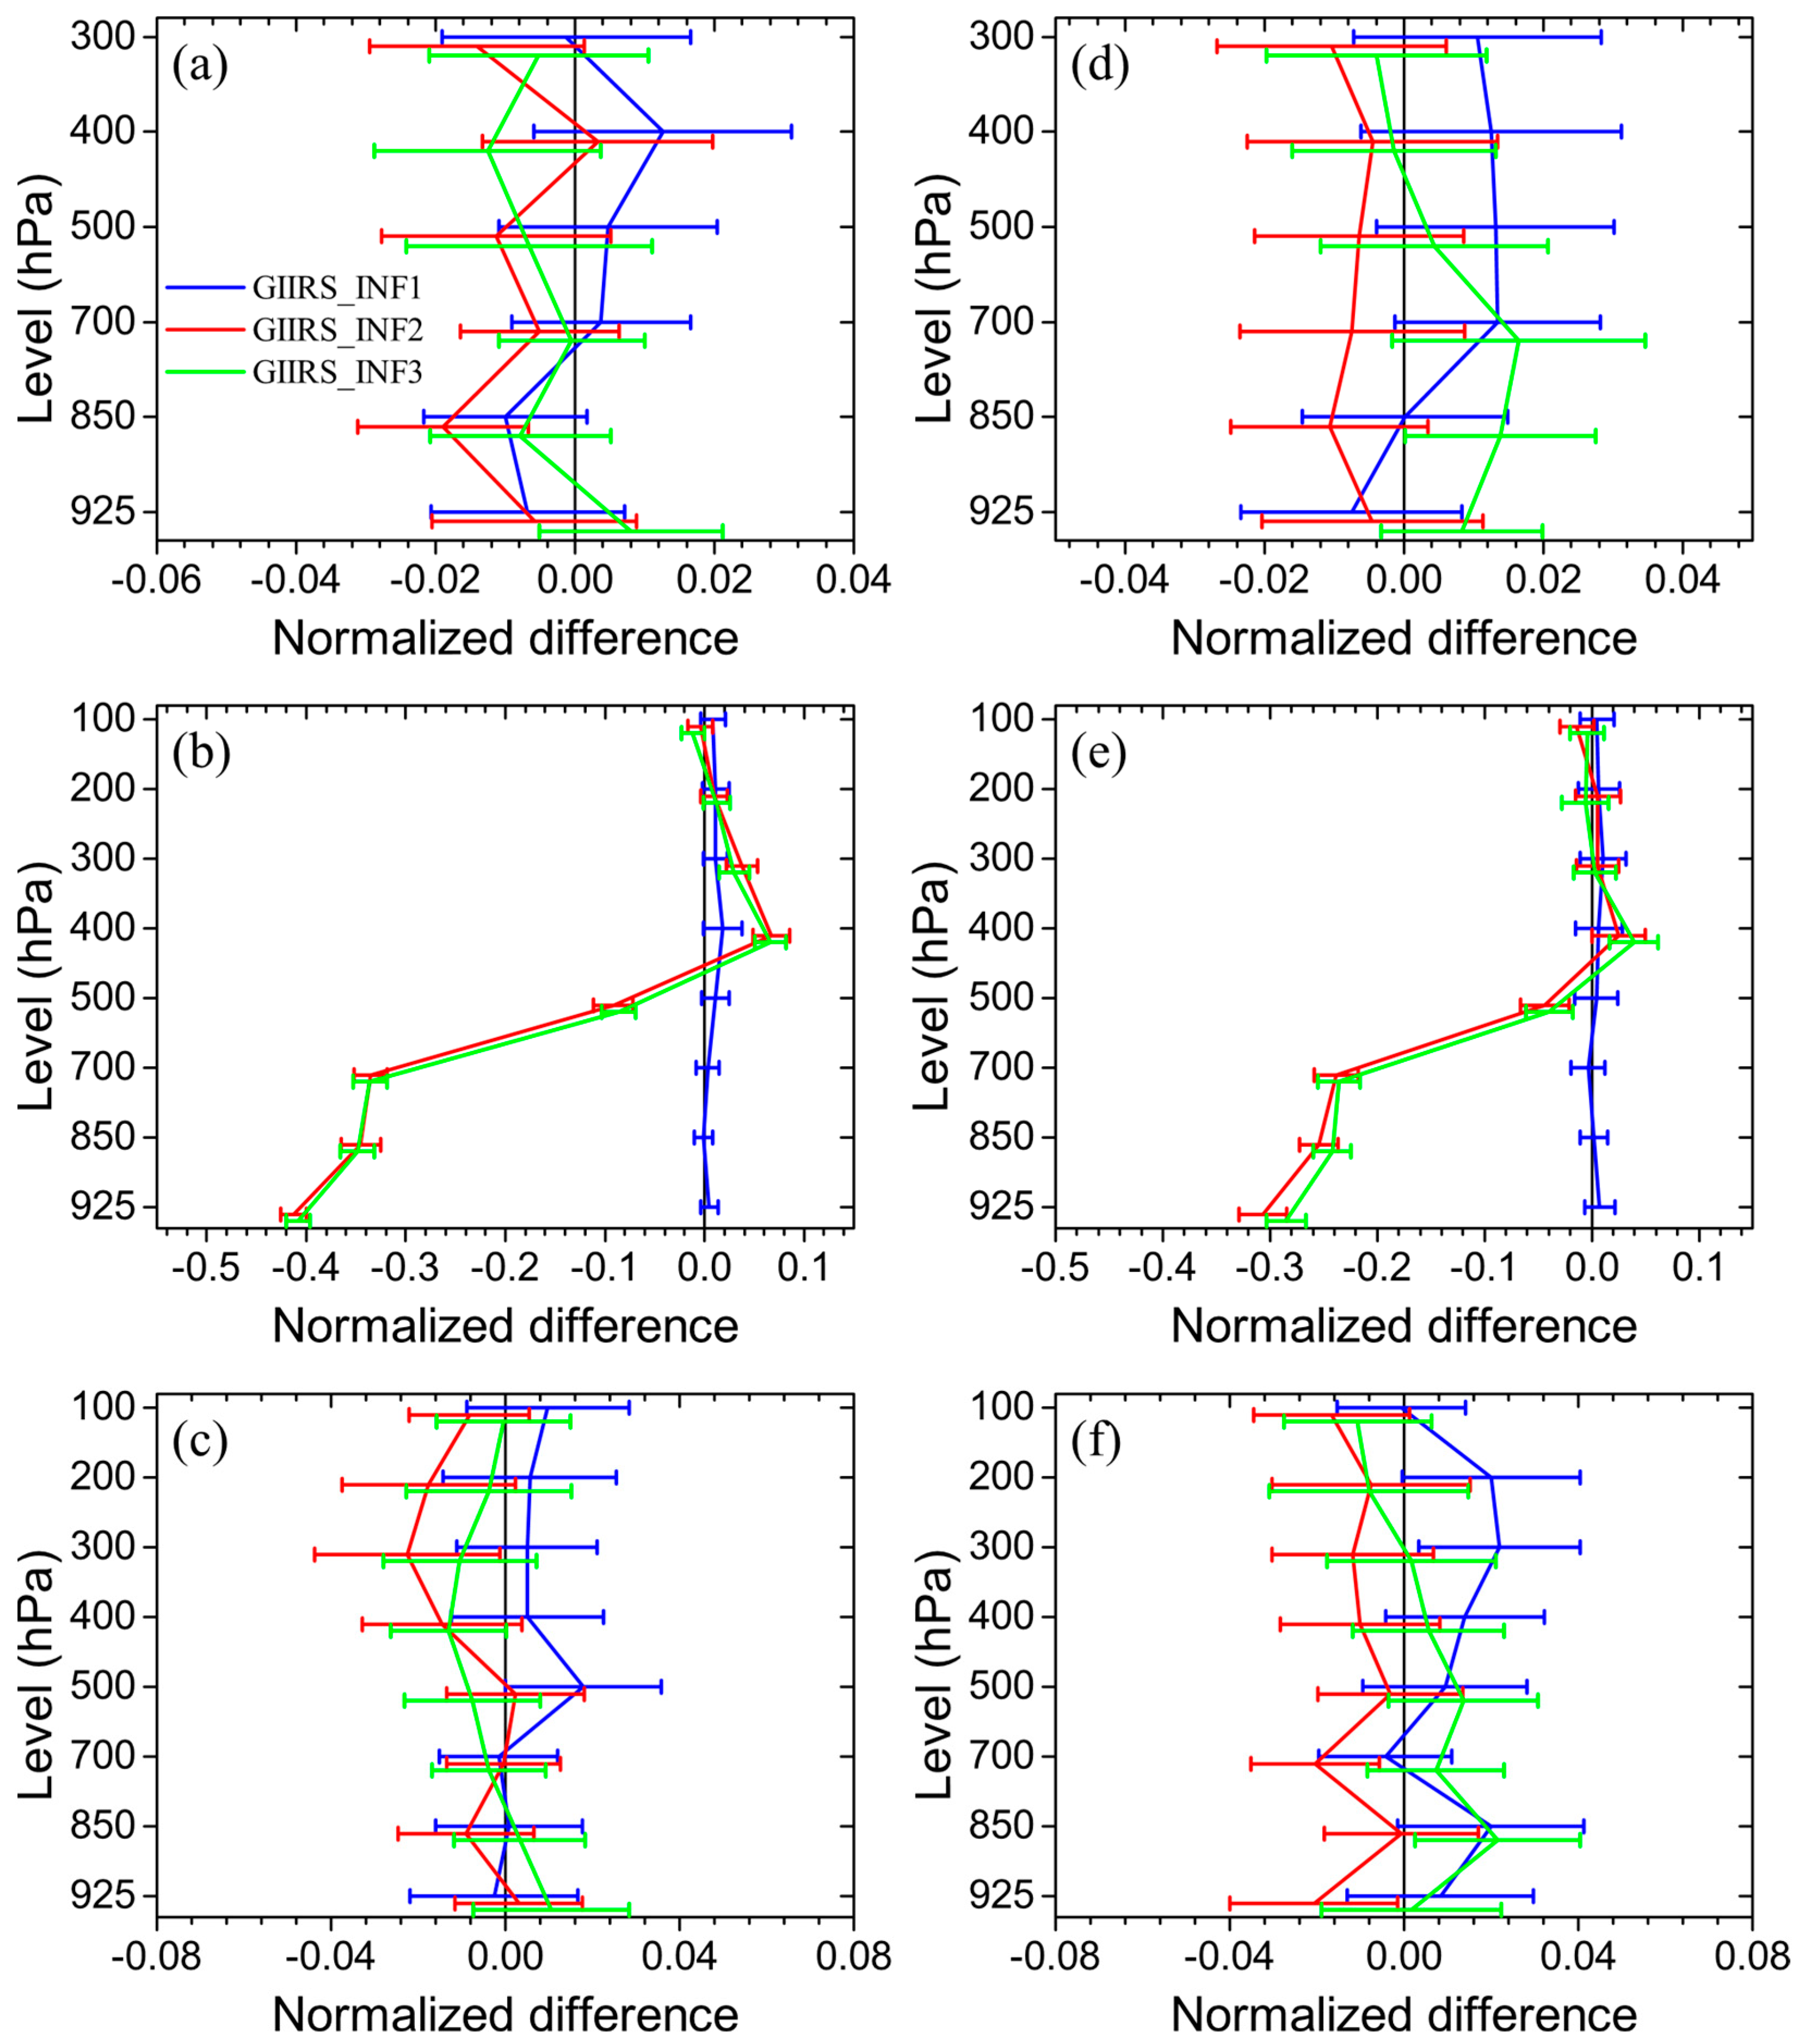
where x obs ,   i is the observed value, x model ,   i is the model value, and n is the number of observations. For specific humidity forecasts, the three experiments assimilating GIIRS observations exhibit a consistent impact profile on the day-2 forecast (Figure 9a). Notably, the GIIRS_INF2 experiment reduces the RMS errors at most levels, particularly at 850 hPa and 300 hPa, with borderline statistical significance, compared to the GIIRS_INF1 experiment. This suggests that an increase in the scale of error inflation has a positive effect on the atmospheric humidity forecasts. However, the impact profile in the GIIRS_INF3 experiment, which applies a scale of 3.0 to the observation errors, generally lies to the right of that in the GIIRS_INF2 experiment, despite an observed improvement at 400 hPa. For the temperature forecast, the performances in the GIIRS_INF2 and GIIRS_INF3 experiments are identical, demonstrating statistically significant improvements in the lower and middle troposphere and reducing the RMS errors by a maximum of 42% in the lower troposphere (Figure 8b). However, the GIIRS_INF1 experiment exhibits a neutral signal across the troposphere, and the GIIRS_INF2 and GIIRS_INF3 experiments both show negative impacts from 400 hPa to 300 hPa. The impact profile of the wind forecast is almost the same as that of specific humidity in the GIIRS_INF2 experiment, with statistically significant improvements observed from 400 hPa to 200 hPa, while neutral impacts occur at the lowest (925 hPa) and middle (from 700 hPa to 500 hPa) troposphere on the day-2 forecast (Figure 9c). Again, the impact profile of the wind forecast in the GIIRS_INF3 experiment generally lies to the right of that in the GIIRS_INF2 experiment.
For the day-4 forecast (Figure 9d–f), the GIIRS_INF1 experiment shows further degradation for specific humidity and wind fields at most levels, that is, the RMS errors for these variables become larger. However, the experiment, inflating the observation errors by a scale of 2.5, still produces a beneficial forecast with smaller RMS errors. For example, positive impacts on specific humidity forecast are observed in the GIIRS_INF2 experiment. Although these improvements are not statistically significant, the points generally lie to the left of the zero line compared to the GIIRS_INF1 experiment. For the temperature forecast, the positive impact continues at day 4, and reductions in RMS errors are observed in the middle and upper troposphere. In addition, statistically significant wind improvements are observed at 925 hPa, 700 hPa, and 100 hPa. These results suggest that the improvement in the temperature forecast is more evident as compared with other variables, which is consistent with the results of the short-range forecast as discussed above. However, the GIIRS_INF3 experiment shows a different impact profile compared to the GIIRS_INF2 experiment. For instance, negative impacts are shown in the middle- and lower-tropospheric humidity and wind fields. The three assimilation experiments, which apply different scales to the observation errors, show that applying a scale of 2.5 to the correlated observation errors positively impacts the temperature, humidity, and wind forecasts.

4.4. Precipitation Forecast Impact

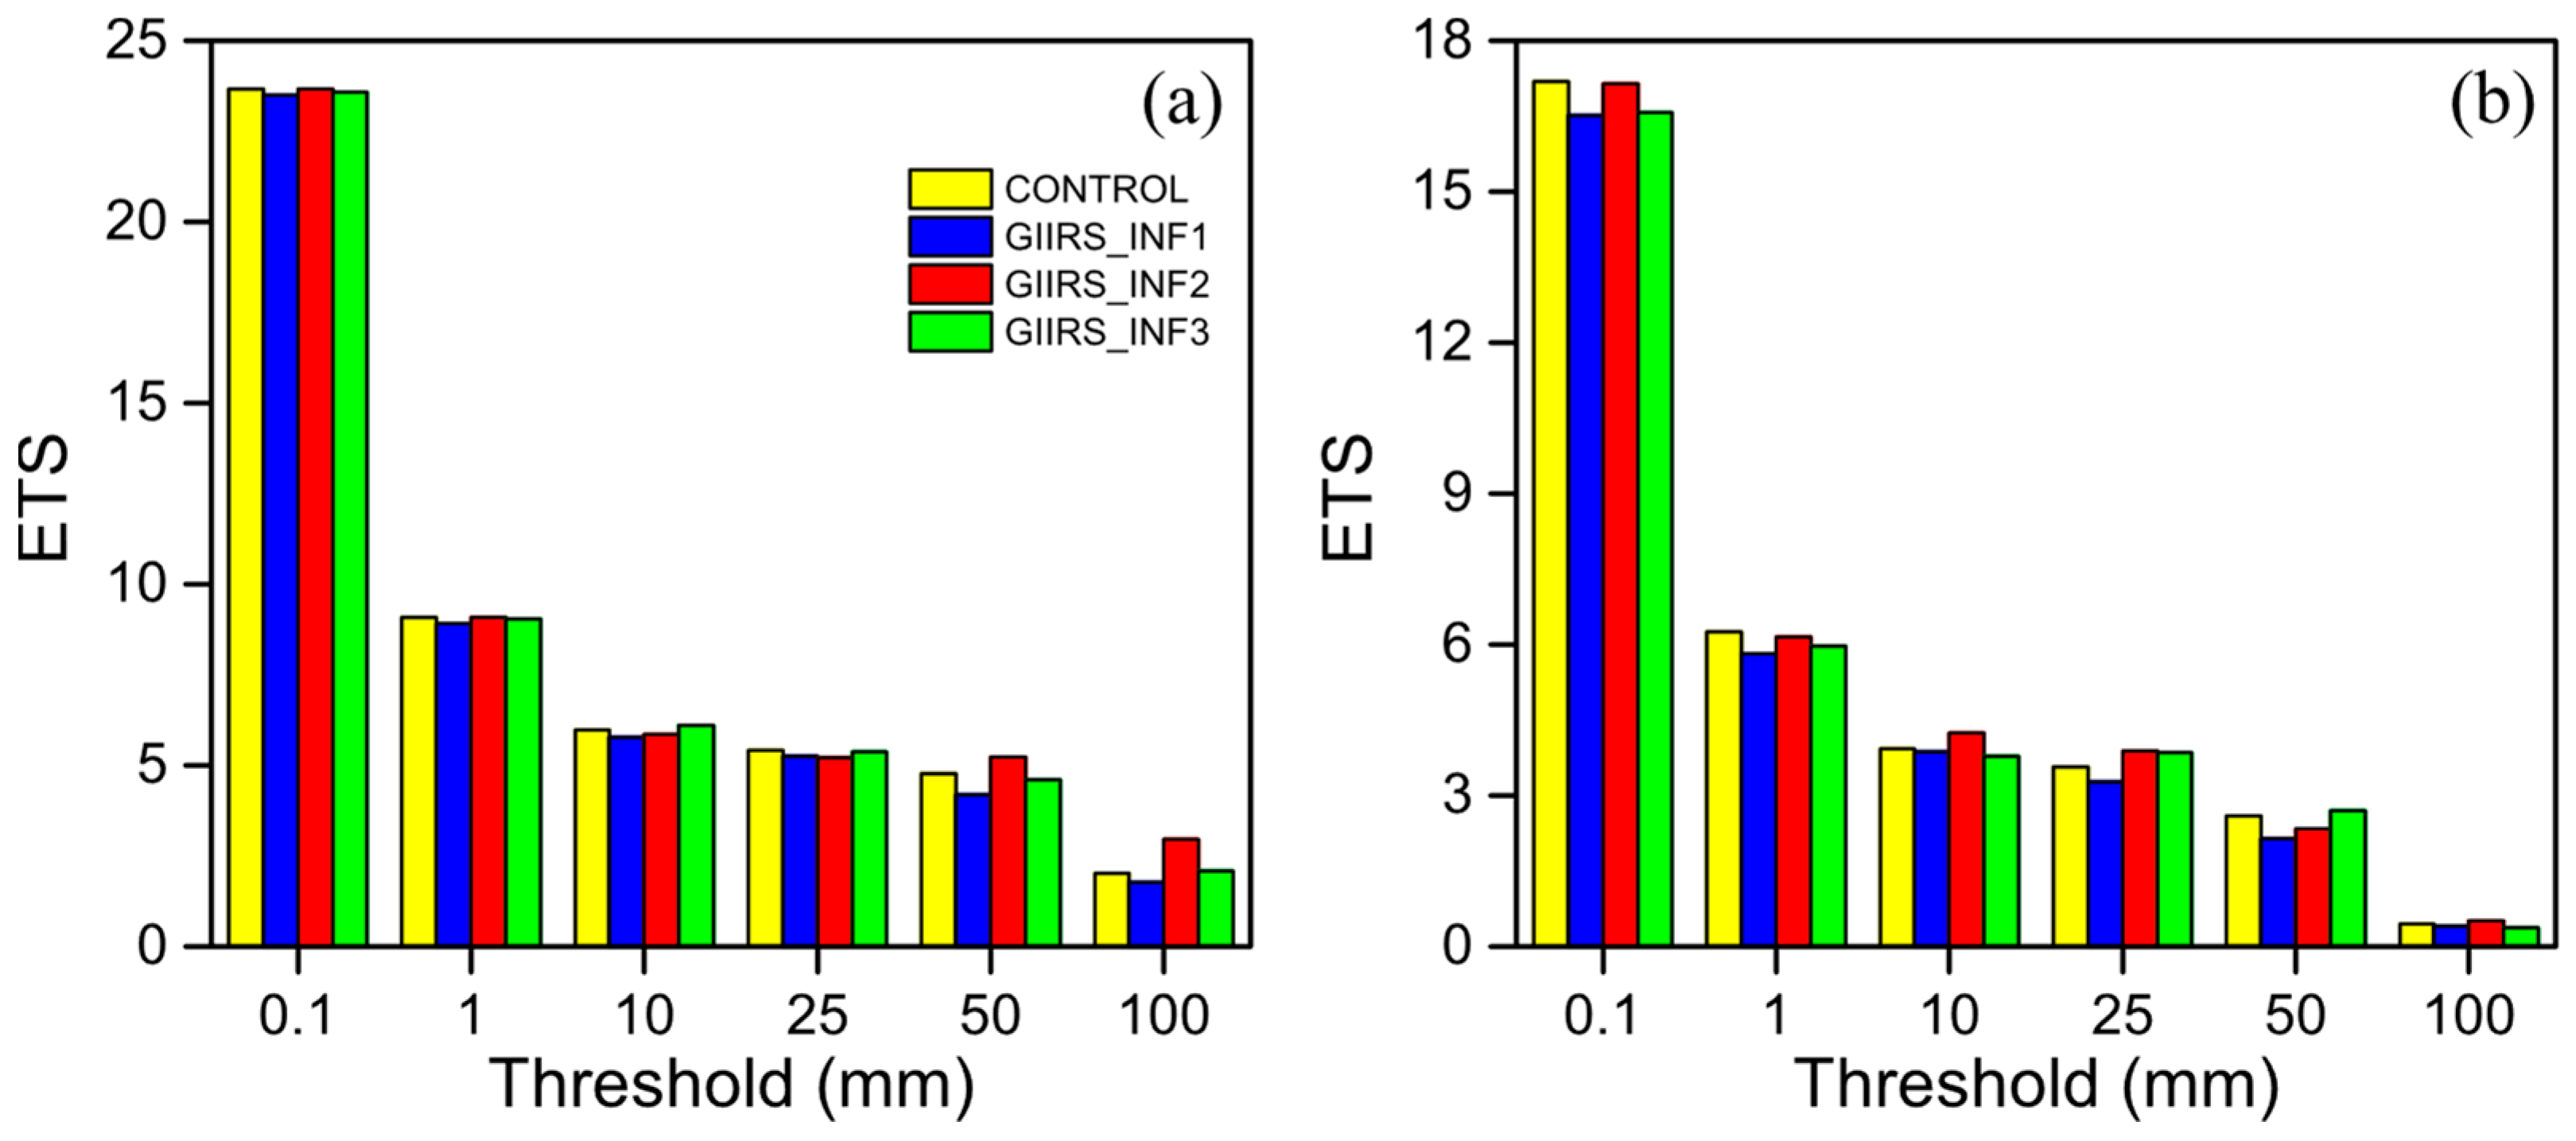
The performance of 5-day precipitation forecasts is also evaluated, against over 60,000 observations from the China Meteorological Administration (CMA) over the China domain. Figure 10 shows the equitable threat score (ETS) of the accumulated precipitation at day 2 and day 4 in the CONTROL, GIIRS_INF1, GIIRS_INF2, and GIIRS_INF3 experiments. The GIIRS_INF1 experiment adversely impacts the precipitation forecasts at all thresholds in day-2 and day-4 forecasts, compared to the CONTROL experiment, which does not assimilate the GIIRS observations, for instance, precipitation thresholds over 50 mm at day 2 and all thresholds at day 4. These degradations are consistent with the results of the forecasts of the temperature, humidity, and wind fields. However, the GIIRS_INF2 experiment, which scales the observation errors by 2.5, exhibits positive impacts on the rainfall predictions. For instance, the GIIRS_INF2 experiment excels in predicting heavy rainfall (thresholds above 50 mm) at day 2, outperforming both the CONTROL, GIIRS_INF1, and GIIRS_INF3 experiments. In the day-4 precipitation forecast, the performance of the GIIRS_INF2 experiment surpasses that of the GIIRS_INF1 experiment. The forecast quality in the GIIRS_INF2 experiment is comparable to that in the CONTROL experiment at most thresholds, but it outperforms at the 10 mm and 25 mm thresholds. In the GIIRS_INF3 experiment, some evident degradations are observed at the thresholds over 50 mm in day-2 forecasts and at the thresholds lower than 10 mm in day-4 forecasts. The averaged biases for all experiments over 5-day precipitation forecasts are −1.20 mm, −1.21 mm, −1.13 mm, and −1.18 mm, respectively, and the GIIRS_INF2 experiment has the smallest biases in the first 3-day forecast. As previously discussed, the improvements in the atmospheric states, namely temperature, humidity, and wind, are the primary contributors to the positive impacts on the precipitation forecasts in the GIIRS_INF2 experiment.

5. Discussion

Similar to other hyperspectral infrared instruments, GIIRS exhibits clear inter-channel observation error, necessitating consideration in data assimilation. Three experiments were conducted to evaluate the impact of assimilating the GIIRS observations. The only difference among the three experiment is in the scale size used to inflate the diagonal values of diagnosed correlated observations errors. One experiment employed the method utilized by Bathmann and Collard [36], in which the correlated observation errors were scaled by 1.3, 1.8, and 1.6 for humidity, window, and other channels, respectively. The second experiment applied a scale of 2.5 for all channels. The third experiment was the same as the second experiment but scaled the observation errors by 3.0. The evaluation of short-range forecasts suggests that the treatment of observation errors, as applied by Bathmann and Collard for CrIS radiances, is not suitable for GIIRS observations. This method noticeably increases the background departure standard deviations of the ATMS and CrIS instruments relative to the experiment that did not assimilate the GIIRS observations. However, inflating the observation errors by a scale of 2.5 results in significant reductions in the departure standard deviations for most temperature channels of ATMS and CrIS, as well as some water vapor channels of CrIS. When inflating the observation error by a scale of 3.0, further improvements are observed in most of the CrIS tropospheric temperature channels, but significant degradations are exhibited in the ATMS temperature channels and the CrIS stratospheric temperature channels. For the medium-range forecast, the GIIRS assimilation experiment, in which the observation errors were scaled by 2.5, positively impacts the forecasts of temperature, humidity, and wind fields This influence is particularly pronounced in comparison to the experiment that employed a smaller error inflation scale. The most notable improvement is observed in the temperature forecast, which exhibits a substantial reduction of 42% in the RMS errors in the lower troposphere. A similar, significant enhancement is also evident in the temperature forecast when the observation errors are scaled by 3.0. These marked improvements in the temperature forecast may be because more temperature channels are assimilated. However, scaling the observation errors by 3.0 results in a degradation in the forecasts for humidity and wind fields, compared to the results obtained from the experiment that inflates the errors by a scale of 2.5. The adjustments and improvements in the atmospheric states in the experiment in which the observation errors are scaled by 2.5 lead to enhanced performances in precipitation predictions.
Bormann et al. [34] highlighted that certain channels for hyperspectral instruments exhibit inter-channel and/or spatial error correlations. The common method used to derive the correlated observation error necessitates specific assumptions. Consequently, inflating the diagnosed correlated observation errors may counteract deficiencies arising from partially valid assumptions made during the derivation of correlated observation errors and some neglected errors. These errors include spatial errors and the mismatch between the spatial scales represented in the forecasts and observations. Note that the GIIRS geolocations for the long-wave temperature and the middle-wave water vapor bands are not identical, and the geolocations from the long-wave band are used for both bands. In this study, inflating the observations errors helps to address the inaccurate geolocations for the middle-wave water vapor band. Beneficial impacts are achieved when scaling the errors by 2.5. However, further increasing the inflation size degrades the quality of the forecast. These findings are similar to those from the study carried out by Bormann et al. [34], who tested the sensitivity of forecast performances to a series of inflation scales. It suggests that applying a scale of 3.0 to the observation error does not better reflect the error characteristics of the GIIRS data, resulting in an unreasonable weighting of the GIIRS observations in data assimilation. Overall, these results demonstrate that the assimilation of both temperature and water vapor channels, by applying an inflation factor of 2.5 to the inter-channel observation errors, positively impacts the humidity, temperature, and wind forecasts, even if these channels do not share identical geolocations. The improvements in the atmospheric states and precipitation prediction suggest that a scale of 2.5 is the optimal factor to inflate the observation error when assimilating GIIRS observations from both bands with the locally cloud-resolving global model.

6. Conclusions

The GIIRS instrument aboard FY-4A is the first hyperspectral infrared sounder on a geostationary platform, offering high spatiotemporal resolution of the atmospheric states. This study investigates the impact of assimilating GIIRS radiance observations from long- and middle-wave bands on short- and medium-range weather forecasts using a non-hydrostatic SD3 global model with 3.5 km resolution over China (via grid stretching) and the GSI analysis system.
The FOR-based bias correction and VarBC scheme effectively eliminate diurnal variation in the middle and upper tropospheric temperature channels, meeting the requirements of data assimilation. Additionally, GIIRS exhibits a clear inter-channel observation error, and three experiments inflating the observation error were conducted to evaluate the impact of assimilating GIIRS observations. The results indicate that inflating the observation errors by a scale of 2.5 significantly reduces the departure standard deviations for most channels of ATMS and CrIS. Furthermore, it shows a substantial reduction in the RMS errors in the lower troposphere, leading to improved performances in heavy rainfall prediction (over 50 mm) of 48 h accumulated precipitation.

Author Contributions

Conceptualization, Z.X., J.Z. and S.-J.L.; methodology, Z.X., J.Z. and S.-J.L.; software, S.-J.L., Z.L. and X.C.; validation, Z.X., J.Z. and K.C.; writing—original draft preparation, Z.X.; writing—review and editing, J.Z., S.-J.L., X.C. and K.C.; visualization, Z.X.; supervision, J.Z.; funding acquisition, X.C. and K.C. All authors have read and agreed to the published version of the manuscript.

Funding

This research was funded by the Strategic Priority Research Program of Chinese Academy of Sciences (Grant: XDB0760300), the National Natural Science Foundation of China (Grant: 42288101, 42275174, 42375151) and Chinese Academy of Science Light of the West Interdisciplinary Research (Grant: xbzg-zdsys-202104).

Data Availability Statement

Data are contained within the article.

Acknowledgments

The authors are grateful the TianJi Weather Science and Technology Company to provide the SD3 model.

Conflicts of Interest

The authors declare no conflicts of interest.

References

  1. McNally, A.P.; Watts, P.D.; Smith, J.A.; Engelen, R.; Kelly, G.A.; Thépaut, J.N.; Matricardi, M. The assimilation of AIRS radiance data at ECMWF. Q. J. R. Meteorol. Soc. A J. Atmos. Sci. Appl. Meteorol. Phys. Oceanogr. 2016, 132, 935–957. [Google Scholar] [CrossRef]
  2. Collard, A.D.; McNally, A.P. The assimilation of infrared atmospheric sounding interferometer radiances at ECMWF. Q. J. R. Meteorol. Soc. 2009, 135, 1044–1058. [Google Scholar] [CrossRef]
  3. Hilton, F.; Atkinson, N.C.; English, S.J.; Eyre, J.R. Assimilation of IASI at the Met Office and assessment of its impact through observing system experiments. Q. J. R. Meteorol. Soc. 2009, 135, 495–505. [Google Scholar] [CrossRef]
  4. Guidard, V.; Fourrié, N.; Brousseau, P.; Rabier, F. Impact of IASI assimilation at global and convective scales and challenges for the assimilation of cloudy scenes. Q. J. R. Meteorol. Soc. 2011, 137, 1975–1987. [Google Scholar] [CrossRef]
  5. Smith, A.; Atkinson, N.; Bell, W.; Doherty, A. An initial assessment of observations from the Suomi-NPP satellite: Data from the Cross-track Infrared Sounder (CrIS). Atmos. Sci. Lett. 2015, 16, 260–266. [Google Scholar] [CrossRef]
  6. Eresmaa, R.; Letertre-Danczak, J.; Lupu, C.; Bormann, N.; McNally, A.P. The assimilation of Cross-track Infrared Sounder radiances at ECMWF. Q. J. R. Meteorol. Soc. 2017, 143, 3177–3188. [Google Scholar] [CrossRef]
  7. Wang, P.; Li, J.; Li, Z.; Lim, A.H.; Li, J.; Schmit, T.J.; Goldberg, M.D. The impact of Cross-track Infrared Sounder (CrIS) cloud-cleared radiances on Hurricane Joaquin (2015) and Matthew (2016) forecasts. J. Geophys. Res. Atmos. 2017, 122, 13–201. [Google Scholar] [CrossRef]
  8. Li, X.; Zou, X.; Zeng, M. An alternative bias correction scheme for CrIS data assimilation in a regional model. Mon. Weather Rev. 2019, 147, 809–839. [Google Scholar] [CrossRef]
  9. Li, J.; Li, J.; Otkin, J.; Schmit, T.J.; Liu, C.Y. Warning information in a preconvection environment from the geostationary advanced infrared sounding system—A simulation study using the IHOP case. J. Appl. Meteorol. Climatol. 2011, 50, 776–783. [Google Scholar] [CrossRef]
  10. Yin, R.; Han, W.; Gao, Z.; Di, D. The evaluation of FY4A’s Geostationary Interferometric Infrared Sounder (GIIRS) long-wave temperature sounding channels using the GRAPES global 4D-Var. Q. J. R. Meteorol. Soc. 2020, 146, 1459–1476. [Google Scholar] [CrossRef]
  11. Di, D.; Li, J.; Han, W.; Bai, W.; Wu, C.; Menzel, W.P. Enhancing the fast radiative transfer model for Fengyun-4 GIIRS by using local training profiles. J. Geophys. Res. Atmos. 2018, 123, 12–583. [Google Scholar] [CrossRef]
  12. Saunders, R.; Hocking, J.; Turner, E.; Rayer, P.; Rundle, D.; Brunel, P.; Vidot, J.; Roquet, P.; Matricardi, M.; Geer, A.; et al. An update on the RTTOV fast radiative transfer model (currently at version 12). Geosci. Model Dev. 2018, 11, 2717–2737. [Google Scholar] [CrossRef]
  13. Burrows, C. Assimilation of radiance observations from geostationary satellites: Third year report. In EUMETSAT/ECMWF Fellowship Programme Research Report; European Centre for Medium-Range Weather Forecasts: Reading, UK, 2020. [Google Scholar] [CrossRef]
  14. Dussarrat, P.; Burrows, C. Preparing for the exploitation of MTG-S IRS in NWP using FY4-A GIIRS observations. In ECMWF Technical Memoranda; European Centre for Medium-Range Weather Forecasts: Reading, UK, 2022. [Google Scholar] [CrossRef]
  15. Yin, R.; Han, W.; Gao, Z.; Li, J. Impact of high temporal resolution FY-4A Geostationary Interferometric Infrared Sounder (GIIRS) radiance measurements on Typhoon forecasts: Maria (2018) case with GRAPES global 4D-Var assimilation system. Geophys. Res. Lett. 2021, 48, 15. [Google Scholar] [CrossRef]
  16. Zhang, L.; Niu, Z.; Weng, F.; Dong, P.; Huang, W.; Zhu, J. Impacts of direct assimilation of the FY-4A/GIIRS long-wave temperature sounding channel data on forecasting Typhoon In-Fa (2021). Remote Sens. 2023, 15, 355. [Google Scholar] [CrossRef]
  17. Yin, R.; Han, W.; Wang, H.; Wang, J. Impacts of FY-4A GIIRS water vapor channels data assimilation on the forecast of “21·7” extreme rainstorm in Henan, China with CMA-MESO. Remote Sens. 2022, 14, 5710. [Google Scholar] [CrossRef]
  18. Kim, Y.; Evans, J.P.; Sharma, A. Multivariate bias correction of regional climate model boundary conditions. Clim. Dyn. 2023, 61, 3253–3269. [Google Scholar] [CrossRef]
  19. Benjamin, S.G.; Weygandt, S.S.; Brown, J.M.; Hu, M.; Alexander, C.R.; Smirnova, T.G.; Olson, J.B.; James, E.P.; Dowell, D.C.; Grell, G.A.; et al. A north American hourly assimilation and model forecast cycle: The Rapid Refresh. Mon. Weather Rev. 2016, 144, 1669–1694. [Google Scholar] [CrossRef]
  20. Yang, J.; Zhang, Z.; Wei, C.; Lu, F.; Guo, Q. Introducing the new generation of Chinese geostationary weather satellites, Fengyun-4. Bull. Am. Meteorol. Soc. 2017, 98, 1637–1658. [Google Scholar] [CrossRef]
  21. Harris, L.; Zhou, L.; Lin, S.J.; Chen, J.H.; Chen, X.; Gao, K.; Morin, M.; Rees, S.; Sun, Y.; Tong, M.; et al. GFDL SHiELD: A unified system for weather-to-seasonal prediction. J. Adv. Model. Earth Syst. 2020, 12, 10. [Google Scholar] [CrossRef]
  22. Chen, J.H.; Lin, S.J.; Zhou, L.; Chen, X.; Rees, S.; Bender, M.; Morin, M. Evaluation of tropical cyclone forecasts in the next generation global prediction system. Mon. Weather Rev. 2019, 147, 3409–3428. [Google Scholar] [CrossRef]
  23. Lin, S.-J.; Rood, R.B. An explicit flux-form semi-lagrangian shallow-water model on the sphere. Q. J. R. Meteorol. Soc. 1997, 123, 2477–2498. [Google Scholar]
  24. Lin, S.-J. A finite-volume integration method for computing pressure gradient force in general vertical coordinates. Q. J. R. Meteorol. Soc. 1997, 123, 1749–1762. [Google Scholar] [CrossRef]
  25. Lin, S.-J. A “vertically lagrangian” finite-volume dynamical core for global models. Mon. Weather Rev. 2004, 132, 2293–2307. [Google Scholar] [CrossRef]
  26. Kleist, D.T.; Parrish, D.F.; Derber, J.C.; Treadon, R.; Wu, W.S.; Lord, S. Introduction of the GSI into the NCEP global data assimilation system. Weather Forecast. 2009, 24, 1691–1705. [Google Scholar] [CrossRef]
  27. Parrish, D.F.; Derber, J.C. The National Meteorological Center’s spectral statistical-interpolation analysis system. Mon. Weather Rev. 1992, 120, 1747–1763. [Google Scholar] [CrossRef]
  28. Han, Y. JCSDA Community Radiative Transfer Model (CRTM)—Version 1. NOAA Tech. Rep. NESDIS 2006, 122, 33. [Google Scholar]
  29. Niu, Z.; Zhang, L.; Han, Y.; Dong, P.; Huang, W. Performances between the FY-4A/GIIRS and FY-4B/GIIRS Long-Wave Infrared (LWIR) channels under clear-sky and all-sky conditions. Q. J. R. Meteorol. Soc. 2023, 149, 1612–1628. [Google Scholar] [CrossRef]
  30. Zhu, Y.; Derber, J.; Collard, A.; Dee, D.; Treadon, R.; Gayno, G.; Jung, J.A. Enhanced radiance bias correction in the National Centers for Environmental Prediction’s Gridpoint Statistical Interpolation data assimilation system. Q. J. R. Meteorol. Soc. 2014, 140, 1479–1492. [Google Scholar] [CrossRef]
  31. Garand, L.; Heilliette, S.; Buehner, M. Interchannel error correlation associated with AIRS radiance observations: Inference and impact in data assimilation. J. Appl. Meteorol. 2007, 46, 714–725. [Google Scholar] [CrossRef]
  32. Bormann, N.; Collard, A.; Bauer, P. Estimates of spatial and interchannel observation-error characteristics for current sounder radiances for numerical weather prediction. II: Application to AIRS and IASI data. Q. J. R. Meteorol. Soc. 2010, 136, 1051–1063. [Google Scholar] [CrossRef]
  33. Stewart, L.; Dance, S.; Nichols, N.; Eyre, J.; Cameron, J. Estimating interchannel observation-error correlations for IASI radiance data in the Met Office system. Q. J. R. Meteorol. Soc. 2013, 140, 1236–1244. [Google Scholar] [CrossRef]
  34. Bormann, N.; Bonavita, M.; Dragani, R.; Eresmaa, R.; Matricardi, M.; McNally, A. Enhancing the impact of IASI observations through an updated observation-error covariance matrix. Q. J. R. Meteorol. Soc. 2016, 142, 1767–1780. [Google Scholar] [CrossRef]
  35. Desroziers, G.; Berre, L.; Chapnik, B.; Poli, P. Diagnosis of observation, background and analysis-error statistics in observation space. Q. J. R. Meteorol. Soc. 2005, 131, 3385–3396. [Google Scholar] [CrossRef]
  36. Bathmann, K.; Collard, A. Surface-dependent correlated infrared observation errors and quality control in the FV3 framework. Q. J. R. Meteorol. Soc. 2021, 147, 408–424. [Google Scholar] [CrossRef]
  37. Eyre, J.R.; Menzel, W.P. Retrieval of cloud parameters from satellite sounder data: A simulation study. J. Appl. Meteorol. Climatol. 1989, 28, 267–275. [Google Scholar] [CrossRef]
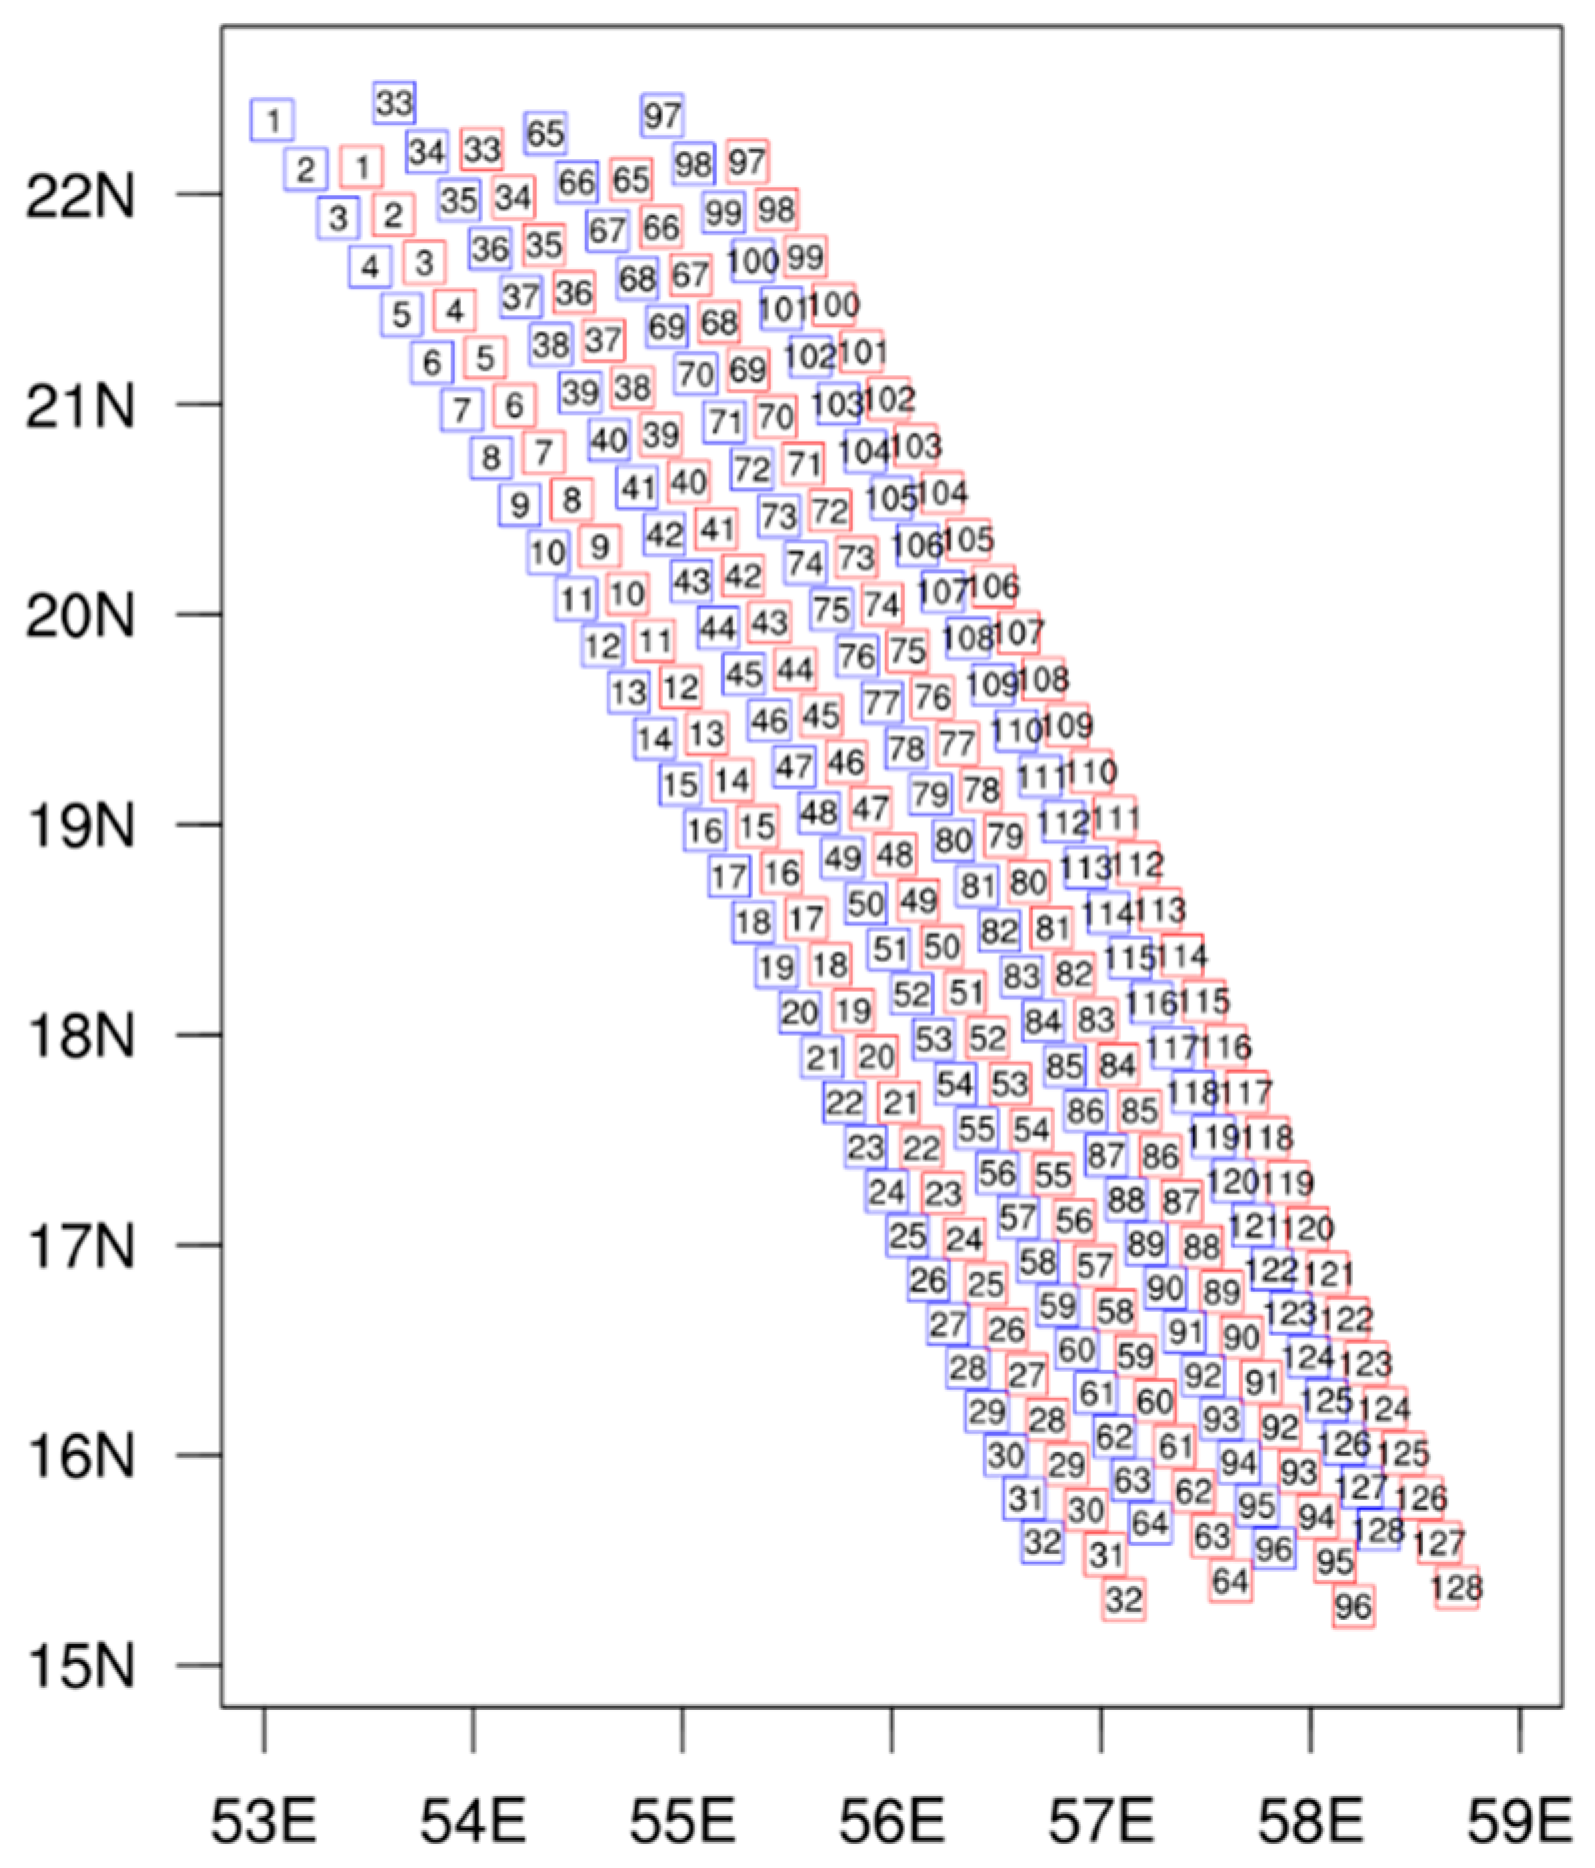
Figure 1. The geolocation of the long-wave (red) and middle-wave (blue) bands of the GIIRS observations (the numbers in the boxes indicate the pixel order).
Remotesensing 16 03458 g001
Figure 2. The brightness temperatures (blue) and weighting function peaks (red) for long-wave (a) and middle-wave (b) bands.
Remotesensing 16 03458 g002
Figure 3. The time series of the OMBs for channels 7 (a), 27 (b), 87 (c), 262 (d), 347 (e), and 1174 (f) from 0000 UTC 1 June 2021 to 0000 UTC 15 July 2021 at 6 h intervals (the format of the x-axis label: hour/day; black line: without any bias corrections; red line: with FOR bias correction; blue line: with variational bias correction).
Remotesensing 16 03458 g003
Figure 4. The averaged OMBs of each FOV at 0000 UTC (blue), 0600 UTC (red), 1200 UTC (brown), and 1800 UTC (yellow) analysis time for channels 7 (a), 27 (b), 87 (c), 262 (d), 347 (e), and 1174 (f) from 0000 UTC 1 June 2021 to 0000 UTC 15 July 2021.
Remotesensing 16 03458 g004
Figure 5. Observation error correlation matrix for GIIRS as diagnosed by the Desroziers method.
Remotesensing 16 03458 g005
Figure 6. The resolution (interval: 4 km) of the C768 SD3 global model (the contour labeled with 4 indicates the study region).
Remotesensing 16 03458 g006
Figure 7. The ACCs of the 500 hPa geopotential height over Asia (a), southern hemisphere (b), northern hemisphere (c), global (d), and China (e), as well as the 24 h (f), 48 h (g), 72 h (h), 96 h (i), and 120 h (j) accumulated precipitation forecasts over China in the C768 SD3 model (orange), initialized with NCEP analyses, compared to NCEP-GFS.
Remotesensing 16 03458 g007
Figure 8. Normalized change in the standard deviation of OMBs for the ATMS (a), CrIS’s long-wave temperature channels (b,c), and water vapor channels (d) over China in the GIIRS_INF1 (blue), GIIRS_INF2 (red), and GIIRS_INF3 (green) experiments (the zero line indicates the CONTROL experiment).
Remotesensing 16 03458 g008
Figure 9. Normalized change in the RMS errors versus the radiosonde measurements of specific humidity ((a,d); unit: 10−2 mg kg−1), virtual temperature ((b,e); unit: K), and zonal wind ((c,f); unit: m s−1) in day-2 (left) and day-4 (right) forecasts in the GIIRS_INF1 (blue), GIIRS_INF2 (red), and GIIRS_INF3 (green) experiments. Error bars give the 95% confident range.
Remotesensing 16 03458 g009
Figure 10. The ETSs of the accumulated precipitation on day 2 (a) and day 4 (b) in the CONTROL (yellow), GIIRS_INF1 (blue), GIIRS_INF2 (red), and GIIRS_INF3 (green) experiments.
Remotesensing 16 03458 g010
Disclaimer/Publisher’s Note: The statements, opinions and data contained in all publications are solely those of the individual author(s) and contributor(s) and not of MDPI and/or the editor(s). MDPI and/or the editor(s) disclaim responsibility for any injury to people or property resulting from any ideas, methods, instructions or products referred to in the content.