Abstract
Interferometric radars are widely used sensors for structural health monitoring. They are able to perform dynamic measurements of displacement with sub-millimeter precision. Today, the Ku-band is the most common, due to the spread of commercial systems operating in this band. At the same time, the W-band sensors are gaining ever more interest. Other popular systems work in the X-band. Since the characteristics of the measurements dramatically depend on the operative frequency, it is essential to highlight their differences. For instance, higher frequency allows for high displacement resolution, but it is more subject to phase wrapping and decorrelation effects. In this paper, a direct comparison between radars operating in X, Ku, and W-band for bridge monitoring is carried out. The radars provide frequency-modulated continuous-wave signals. Experimental campaigns were performed both in controlled and realistic scenarios (a stayed bridge). The results of the experiments demonstrate that all the three sensors are suitable for performing dynamic structure monitoring despite their differences. It is worth noting that this comparative analysis has highlighted the role of amplitude variation in phase/displacement measurement. Regarding this point, the three different bands exhibit significant differences.
1. Introduction
The vibration monitoring of industrial and civil structures plays an important role in preventing damage and ensuring their safety. Bridges are civil structures that demand periodic monitoring by performing both static and dynamic measurements, in order to evaluate possible damages. Over the last twenty years, much attention has been paid to technologies capable of carrying out such investigations. Vibration sensors, such as accelerometers [1,2,3], are largely employed for the periodic and continuous monitoring of buildings and bridges, and provide accurate displacement measurements. However, these sensors have to physically be installed on the structure. In some cases, this operation is not possible. To overcome this problem, research has been conducted on non-contact sensors.
Ground-based radars (GBRs) have received much interest over the past two decades, and today they play an important role in monitoring the stability of infrastructures [4]. GBRs allow for non-contact dynamic and static measurements of multiple points of the structure [5,6]. Specifically, radar interferometry allows for very accurate measurements of target displacement along the radar line of sight, with sub-millimeter precision [7]. The use of GBRs for monitoring buildings and bridges dates back to the beginning of 2000s [8]. Today, despite being an established technology, it remains an active and intense field of scientific research [4,9,10,11]. Efforts are dedicated, for instance, to developing techniques able to obtain the three-dimensional displacement vector, exploiting the bistatic [12] or the multi-monostatic technique [13,14], using multiple-input multiple-output (MIMO) sensors.
The first radar systems for structural monitoring exploited Stepped Frequency Continuous Waveform (SFCW) signals [5]. The most recent radars operate in Frequency Modulated CW (FMCW). In fact, the SFCW signal varies the frequency step by step, with each tone lasting for a certain interval, corresponding to the time of flight from the radar to the farthest target. This imposes severe limitations to the acquisition speed [15]. As a result, especially in long-range scenarios, the achievable acquisition frequency does not allow for the measurement of fast movements. FMCW radars, instead, transmit a continuous ramp in frequency and retrieve the target distance, exploiting the frequency difference between the transmitted and received signal. This permits minimizing the duration of data collection, and therefore, increasing the acquisition frequency [4,16].
For civil use, to date, only a few radar bands have been licensed. The Ku-band is the most used in the GBR field. Commercial Ku-band radars are now widely used for monitoring landslides [17], open-pit mines [18], buildings [19], and bridges [20]. Specifically, for dynamic monitoring of bridges, the Ku-band has been shown to successfully perform vibration measurements with sub-millimeter precision [7]. Thanks to its wide and consolidated use, the Ku-band can be considered a reference in the field of structural health monitoring.
In recent years, the X-band has also gained interest. X-band satellite SAR systems have been widely used for the long-term health monitoring of bridges [21,22]. As for ground-based radars, the X-band has been largely used for monitoring landslides and rockfalls [23,24,25]. Some studies have also been conducted on its use for monitoring the health status of structures. For instance, in [26] a practical system for the dynamic measurements of structures is proposed, with the aim of being portable and easily usable in engineering studies.
Nowadays, W-band radars are spreading among several application fields. The high operating frequency allows for low cost, small and light weight equipment, allowing the use of miniaturized and easily installable systems. These radars are characterized by a fast repetition rate (up to 1500 Hz), which makes them the best candidates for dynamic investigations. Radars operating in the W-band were initially used in the automotive field [27,28]. In recent years, the spread of millimeter wave radars has also favored their use in other applications, including the structural monitoring of buildings and bridges [29]. In [30], a distributed millimeter-wave radar system is exploited for three-dimensional deformation monitoring of the tunnel cross-section structure during its construction. Authors of [31] proposed a displacement estimation technique that successfully fuses measurements acquired by an accelerometer and by an FMCW millimeter wave radar. In [32], the same authors presented a technique capable of fusing accelerometer, strain gauge and millimeter-wave radar data to perform displacement estimation, with the use of an artificial neural network model. In this work, the intermittent occlusion of the radar target, common in long-term displacement monitoring, was considered. A joint measurement campaign using W-band and Ku-band radars is presented in [33]. The radars were tested for bridge monitoring at two test sites. The results obtained showed an agreement of approximately 0.1 mm. In [34], a W-band MIMO radar was used for bridge monitoring, both in the synthetic aperture modality and in the monostatic one, exploiting the MIMO architecture. This miniaturized synthetic aperture radar performs fast scans, in less than 8 s, and dynamic acquisitions at 500 Hz sampling frequency.
The operative frequency is a key parameter for radar systems. For instance, increasing the frequency increases the resolution of the displacement measurement [16]. W-band radars are promising sensors for measuring small displacements, owing to their short wavelength. At the same time, however, higher frequencies are subject to more decorrelation effects [35]. Moreover, when the displacement between consecutive measurements overcomes a specific threshold, i.e., when the interferometric phase exceeds , ambiguity in the interferometric phase occurs. This effect is known as phase wrapping [36]. Since the threshold is proportional to the wavelength, phase wrapping can be critical for millimeter-wave radars. Therefore, when choosing the radar, it is necessary to make a trade-off based on the scenario and the characteristics of the measurement.
The scope of this study is the direct comparison of three radars operating in different bands (X, Ku, and W) in order to highlight the differences. The study of these three frequency bands is of particular interest. In fact, they are among the few for which widespread commercial systems already exist in the sector.
For the experiment presented in this paper, experimental tests were performed in a controlled scenario, using corner reflectors, and in a realistic case study, at “Ponte all’Indiano” (Indiano bridge) a long-span, stayed bridge, in Florence, Italy. In this last case, two different datasets were acquired. The first aimed to measure the vibrations of the stays, while the second to monitor the dynamic movement of the access ramp to the bridge.
2. Materials and Methods
The radars used for the comparison operate FMCW signals. The transmitted FMCW signal is characterized by the frequency slope (), by the sweep time () and by the number of frequency samples (, as shown in orange in Figure 1. With these three variables, it is possible to retrieve the bandwidth (, the range resolution (), and the unambiguous range (), where is the speed of light. The pulse repetition frequency () is the inverse of the time between two consecutive sweeps, considering a possible idle time. In Figure 1, the blue line represents the signal received from a target located at a distance , where is two times the time of flight from radar to target. Defining the beat frequency as , the target distance can be written as .
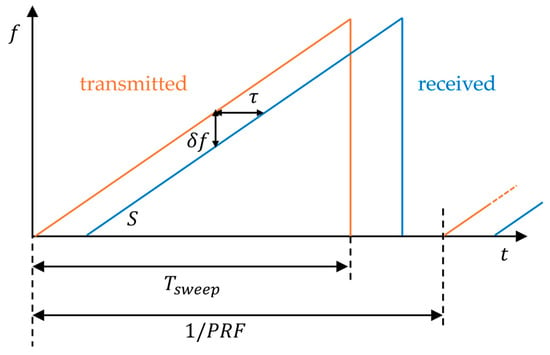
Figure 1.
Scheme of the FMCW working principle.
Demodulating the received signal [37], the resulting signal for a single target at a distance , for the i-th sample, can be written as
Here, is the fast time and is the slow time. Therefore, the result of a measurement at time is a complex number, called echo, composed by in-phase () and quadrature () terms for each frequency sample :
The radar image () can be retrieved by calculating the fast Fourier transform (FFT) of the echo along the index :
where is the range distance. The echo is usually windowed along the frequency samples before calculating the FFT to reduce the side lobe level. The amplitude of identifies the distance of the targets in the radar field of view. The phase of can be used for measuring the displacement of targets by interferometry.
Interferometry calculates the phase difference between two radar measurements acquired at different times, through the following formula
Figure 2 schematically shows the interferometric principle. The phase difference between two measurements, , is proportional to the displacement of the target:
where is the wavelength of the radar signal corresponding to the central frequency. It should be noted that a displacement larger than causes phase wrapping. Several algorithms can be used to unwrap the phase and recover correct displacement information [38,39,40].
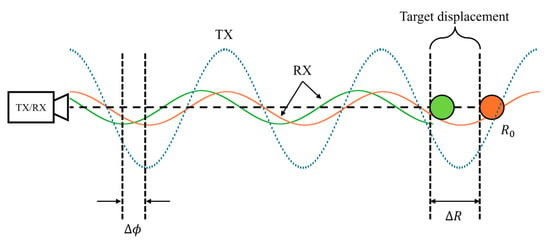
Figure 2.
Interferometric principle.
According to Equation (5), the displacement measurement result depends on the operating wavelength. Therefore, by assuming any other characteristic constant, the higher the frequency, the higher the displacement resolution. At the same time, the higher the frequency, the smaller the displacement that can be measured not affected by phase wrapping. One possibility to avoid phase wrapping is to use a high PRF. In this paper, the radars have been configured to have an appropriate PRF, such that phase wrapping does not occur.
When the PRF of the interferometric radar is high enough (larger than 50/100 Hz), it is possible to measure the dynamic behavior of a structure. In this case, it is possible to retrieve the vibration frequency spectrum and the modal shape of the structure.
Equipment
The radars used for the comparison are shown in Figure 3. The Ku-band radar (Figure 3b) is a commercial radar for interferometric measurements produced by IDS Georadar, Pisa, Italy [41]. The Ku-band radar is based on an heterodyne system that provides complex I and Q outputs. The radar provides an FMCW signal from 17.1 GHz with 199.86 MHz of bandwidth, 3997 frequency samples, and a PRF of about 247 Hz. This radar is a multiple input multiple output (MIMO) with two TX channels and two RX channels, but in this paper, only one TX and one RX channel were used.

Figure 3.
Radar equipment: (a) X-band radar; (b) Ku-band radar; (c) W-band radar.
The X-band radar (Figure 3a) is a prototype based on RockSpot, by the IDS georadar [25,42], which provides an FMCW signal from 10.4 GHz to 10.6 GHz, with 512 frequency samples. The PRF of the X-band radar was 7246 Hz. The system has one TX channel and four RX channels. The four RX channels are independent and receive the signal simultaneously. The receiving architecture is based on a down converter to baseband. This radar provides only the in-phase signal. In order to improve the signal-to-noise ratio (SNR), the four RX channels have been averaged.
Finally, the W-band radar is a AWR1843BOOST by Texas Instruments [43]. It provides a FMCW signal from 77.077 GHz to 77.257 GHz, with 350 frequency samples, and a PRF of 2564 Hz. The radar AWR1843BOOST was connected to an acquisition board (DCA1000EVM) to acquire raw data. The acquisition board sends the data to the local computer via ethernet. The W-band radar is a MIMO radar. The radar transmits sequentially from the three TX channels, and receives simultaneously from the four RX channels. The radar has a complex baseband architecture, which uses a quadrature mixer and dual IF and ADC chains to provide complex I and Q outputs for each receiver channel. The TX and RX channels are averaged to increase the SNR.
Table 1 resumes the radar parameters. It can be observed that the three radars have a different PRF. This is because they have different architectures, and the ADC acquisition frequency changes, depending on the instrument. The three radars were configured to have approximately the same range resolution (0.75 cm). Again, due to different sensor architectures, the range resolution of the W-band radar is slightly different than those of the other bands.

Table 1.
Radar parameters.
The data acquired by the radars were compared with the data measured by a seismic accelerometer during the test in a controlled scenario, to validate the radar measurements. The seismic accelerometer used was a 393B31 model by PCB, NY, US. The accelerometer uses a piezoelectric technology with sensitivity of 1.02 V/(m/s2) and a frequency range between 0.1 Hz and 200 Hz. The acquisition frequency of the accelerometer was 2 KHz.
3. Results
The comparison presented in this paper is based on experimental data.
The data acquired by the three radars were analyzed using the same processing flow. First, for each dataset, the complex radar echo was windowed using a Kaiser window. Then, the FFT was calculated, according to Equation (3), to obtain the radar images. Then, the complex signals of selected targets were processed using the interferometric technique (Equations (4) and (5)) to obtain the displacement over time. The displacement spectrum was then calculated using an FFT in the time dimension, to determine the fundamental frequencies.
3.1. Experimental Results: Controlled Scenario
Figure 4 shows the experimental setup of the controlled scenario, arranged in a garden at the University of Florence. A corner reflector (CR) was placed on a metallic bar, which was bound to the lower end. The CR was located 19.5 m away from the position of the radars. A second CR was located on a tripod, on the left, a few meters away from the other CR. This CR was not subject to displacements during the measurements and was used as a reference target. In this scenario, several series of measurements lasting approximately 2 min were performed. After the measurement starts, the metal bar, previously held under tension, is released and begins to oscillate. This experiment allowed us to test the performance of the three sensors in a scenario where the targets are clearly distinguishable, and the movement of the CRs is known and independently measured.
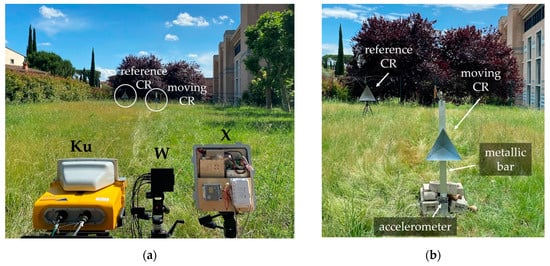
Figure 4.
Experimental setup in controlled scenario: (a) picture of the three radars (Ku-band, W-band, and X-band) during the measurements performed on CRs; (b) the two CRs, with the static one on the left, and the one placed on an oscillating bar on the right.
Figure 5 shows the images obtained by the three radars, after Kaiser windowing and range compression through FFT. The signal amplitude was normalized to the reference CR, to allow for adequate comparison. The three radars clearly identified both CRs. The signal-to-noise-ratio (SNR) of the radar signals was evaluated. It was calculated by considering the magnitude of the peak of the reference target and the average squared magnitude of the radar signal in one area where there were no targets. We obtained an SNR of 58.5 dB for the X-band, 76.9 dB for the Ku-band, and 50.7 dB for the W-band. Even if the three radars present values of PRF different from each other, the obtained values of SNR are not dramatically different. Therefore, their experimental results could be reasonably compared.
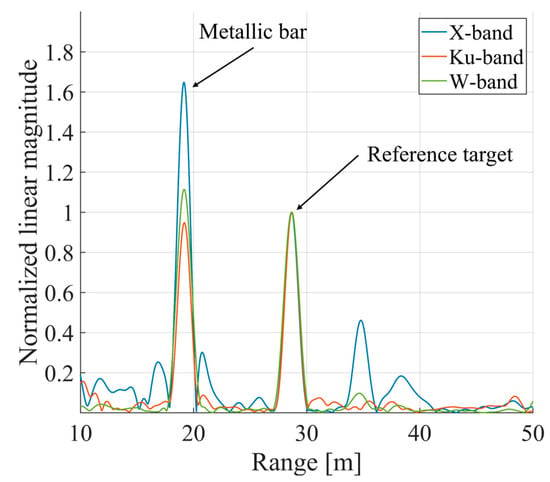
Figure 5.
Radar images acquired by the three sensors. The targets’ amplitude was normalized to the reference target value.
The movement of the oscillating CR was measured through interferometry by the three radars. The information from the reference CR was used to perform the atmospheric correction, using a linear range model [44]. Displacement information acquired by the seismic accelerometer was retrieved by double integration. After each integration, the resulting signal was filtered with a Butterworth bandpass filter between 1 Hz and 1000 Hz. Figure 6 shows the resulting displacement obtained, considering a time interval of about 20 s. The accelerometer behavior before time , is an artifact caused by the filter. Indeed, the numeric filter used requires more than 5 s to converge.
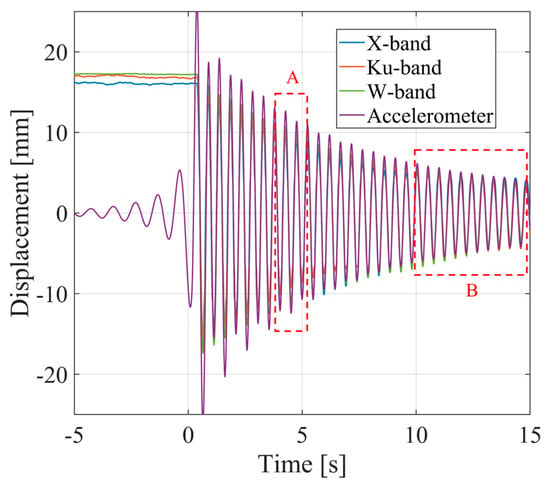
Figure 6.
Interferometric displacement of the oscillating CR measured by the three radars and by the accelerometer, after correction using the reference CR. The dotted squares highlight the specific time intervals used for the analysis.
Figure 7 shows the details of displacement for the time interval from 9 s to 14 s, corresponding to box B in Figure 6. In this interval, the peak-to-peak amplitude of oscillation is about 12 mm. As can be seen from Figure 7, a good agreement is found for the four sensors, both for the displacement magnitude and for the time of oscillation. Specifically, the average value of the root-squared deviation from the accelerometer data was calculated for the three radars: it was 0.52 mm for the X-band, 0.43 mm for the Ku-band, and 0.51 mm for the W-band.
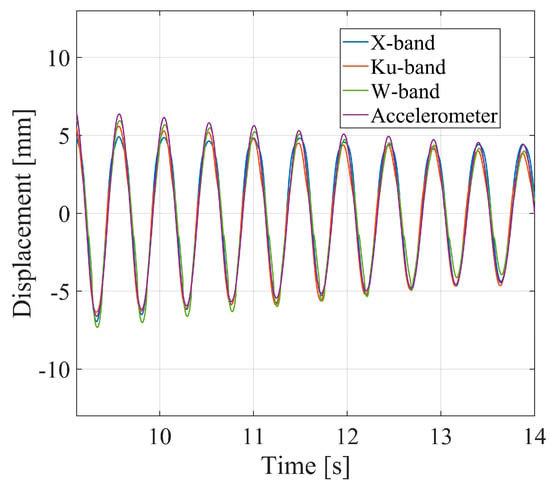
Figure 7.
Interferometric displacement of the oscillating CR measured by the three radars and by the accelerometer. Details of the B interval highlighted in Figure 6.
Figure 8 shows the displacement details of one other time interval, from about 3.5 s to 5.5 s, corresponding to the box A in Figure 6. The displacements measured by the three radars differ slightly from those measured by the accelerometer. While the displacement measured by the accelerometer is a sinusoid, the other curves show different trends. These behaviors also differ between one radar and the others.
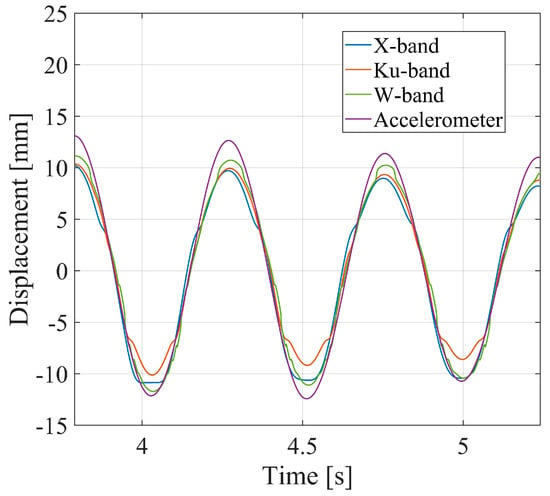
Figure 8.
Interferometric displacement of the oscillating CR measured by the three radars and by the accelerometer, after correction using the reference CR. Details of the A interval are highlighted in Figure 6.
This behavior is probably a fading effect due to multiple reflections between the CR and the metal bar that supports it [45]. The range resolution was 0.75 m for the X-band and the Ku-band, 0.83 m for the W-band. Therefore, the backscattered signal was the sum of the electromagnetic wave backscattered by the CR and the electromagnetic wave backscattered by the bar supporting the CR. How these signals add up can vary depending on their position relative to the radars. A positive or negative interference results in a variation (increase or decrease) of the signal amplitude. This is confirmed by results shown in Figure 9. Here, the CR displacement of Figure 8 is presented for each radar ((a) X-band, (b) Ku-band, and (c) W-band), compared to the corresponding amplitude value normalized with respect to the mean, i.e.,
where is the complex value calculated in Equation (3) at the range of the CR, and denotes the absolute value operator. In Figure 9, it can be observed that the displacement behavior differs from that of the accelerometer when has minimum values. When there is a destructive interference, while when the signals interfere constructively. This effect changes with the signal wavelength. From Figure 9, it can be observed, as expected, that the rate of changes for the X-band (Figure 9a) is lower than that for the W-band (Figure 9c). That is, the amplitude variation rate increases with the radar frequency.

Figure 9.
Interferometric displacement compared to the quantity (Equation (6)): (a) X-band radar; (b) Ku-band radar; (c) W-band radar. The right axis represents the quantity, while the left axis represents the interferometric displacement.
The displacement spectrum was calculated for all the acquired datasets by calculating the FFT of the displacement time series. Figure 10 shows the obtained spectrum and Table 2 the fundamental frequency obtained for the four sensors. The uncertainty related to the frequency is the inverse of the time interval used to calculate the FFT. Excellent agreement can be observed between the four results, with the calculated oscillation frequencies perfectly matching.
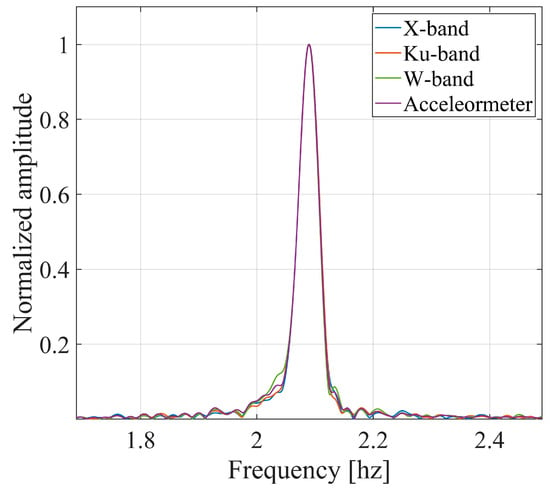
Figure 10.
Spectrum of the displacement obtained for the three radars and for the accelerometer data.

Table 2.
Oscillation frequency obtained from the displacement spectrum.
3.2. Experimental Results: Bridge Stays Case Study
The second measurement campaign was performed at the Indiano Bridge, in Florence, Italy, to measure the vibrations of the bridge stays. In this scenario, it was not possible to use an independent sensor to validate the performance of the radars. Since the Ku-band system is an established commercial system specifically designed for these applications, it was used as a reference to compare the performance of the other radars. The experimental setup is shown in Figure 11. Several measurements, lasting approximately 2 min, were carried out.
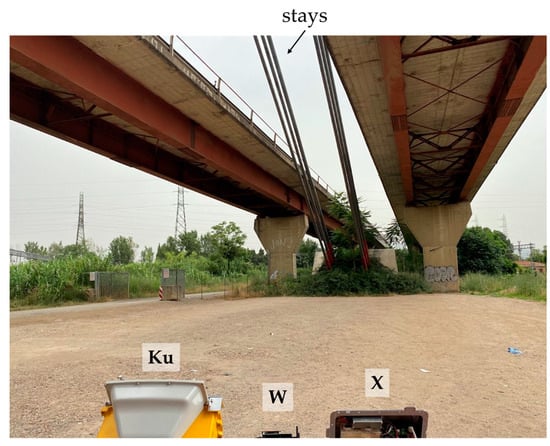
Figure 11.
Experimental setup at the Indiano Bridge for the measurement of the vibrations of the bridge stays.
For these measurements, the radars were installed close to the bridge pillar, pointed towards the stays, with an inclination of about 45° with respect to the vertical axis. The radar images obtained via FFT are shown in Figure 12, with the amplitude normalized to the maximum value. It can be observed that the radar images do not perfectly match: the three radars do not identify all of the same targets. Nevertheless, the peak at 16 m from the radars was selected as common to the three radars.
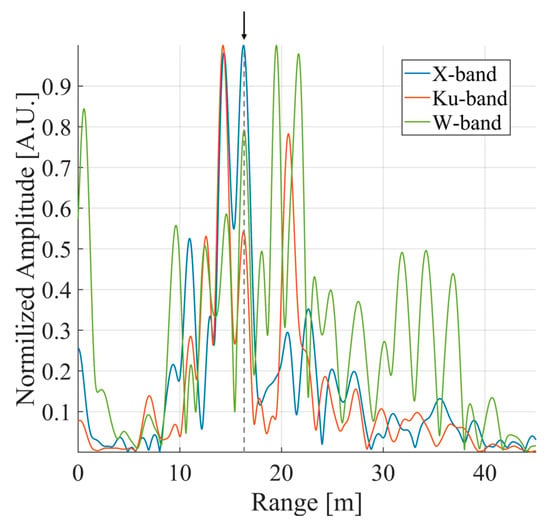
Figure 12.
Radar images acquired by the three radars. The arrow indicates the target chosen for the analysis presented below.
The cumulative interferometric displacement of the peak 16 m away was calculated according to Equation (5). Figure 13 shows the results obtained for the three radars, for a time interval of about 20 s, in which an intense impulsive stimulus occurred, due to the passage of a heavy vehicle.
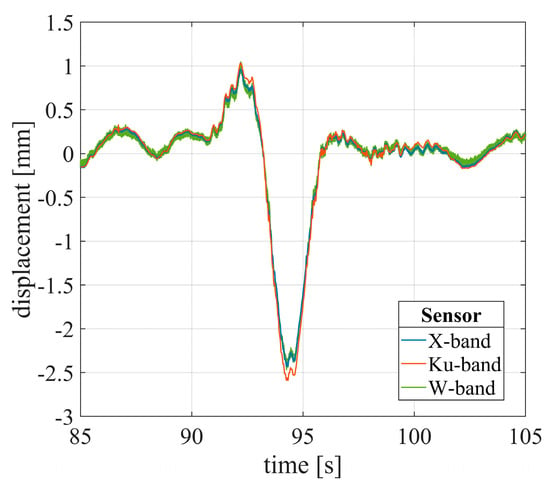
Figure 13.
Interferometric displacement of the stay of the bridge, obtained for the three radars.
The normalized amplitude was calculated for the three radars to investigate whether fading could occur in this measurement. The result is shown in Figure 14, for the same time interval as in Figure 13. In this case, a low fading contribution is expected since the structure is slender. Indeed, the X-band amplitude data show very small variations, less than 1.6% of the average amplitude. The Ku-band data exhibit a maximum approximately at the greatest displacement, but small variations elsewhere. Instead, the W-band data present higher and faster amplitude variations. This could be due to the low SNR of the W-band data. In fact, for the considered target, the SNR is 76.9 dB for the Ku-band, 50.6 dB for the X-band, and 29.8 dB for the W-band.
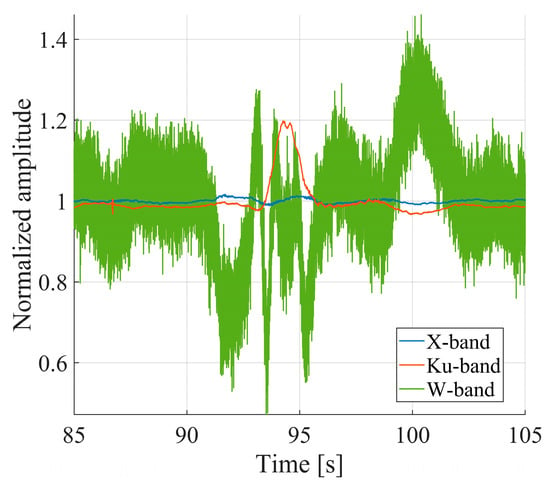
Figure 14.
Normalized amplitude (Equation (6)) of the bridge stay target for the three radars.
To quantitatively assess the performance of the X-band and W-band radars, their obtained displacements were compared to that of the Ku-band, since it was not possible to install other sensors on the structure. After interpolation on a unique time vector, the root of the quadratic deviation from the Ku-band data was calculated for the X-band, and the W-band data. Results for a measurement lasting about two minutes are shown in Figure 15. For the X-band, the deviations are below 0.2 mm, whereas for the W-band, they are below 0.25 mm. It is worth noting that the nominal uncertainty for interferometric radars is 0.1 mm [7]. Therefore, the obtained deviations correspond to the sum of the individual uncertainties of the Ku-band and X/W-band data. The mean value of the root-squared deviation from the Ku-band data was calculated. It was equal to 0.03 mm for the X-band data and 0.04 mm for the W-band data.
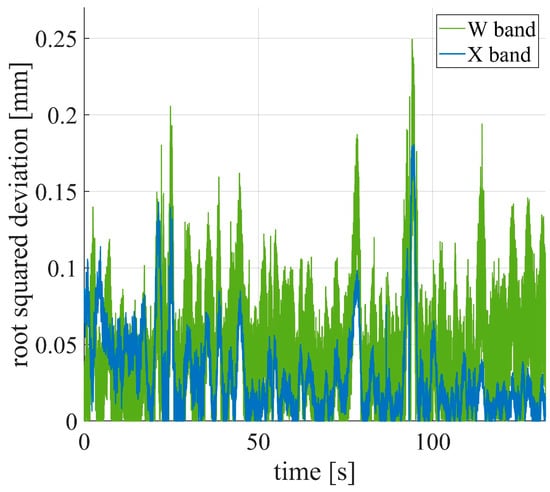
Figure 15.
Root-squared deviation of the stay displacements from the Ku-band data, evaluated for the W-band and X-band data.
Finally, the Fourier transform of the time series of displacements was calculated to determine the spectrum. Figure 16 presents the obtained frequency spectrum, normalized with respect to the frequency for the three radars. Table 3 presents the values of the fundamental frequency retrieved from Figure 16. Excellent agreement is also found in this case.
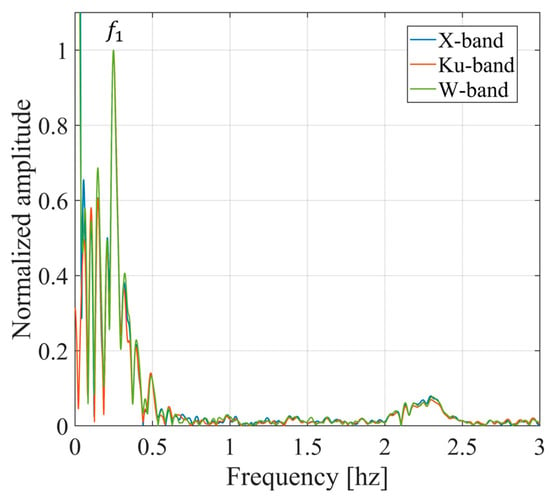
Figure 16.
Spectrum of the displacement of the bridge stay, obtained for the three radars.

Table 3.
Oscillation frequency obtained from the displacement spectrum of the bridge stay.
3.3. Experimental Results: Bridge Access Ramp Case Study
A third dataset was acquired at the Indiano Bridge for measuring the dynamic displacement of the access ramp to the bridge. Figure 17 shows the experimental setup. The radars were installed under the bridge ramp, at 8.60 m vertical distance from the span, near a pillar, and pointed towards the bridge span. The lower part of the bridge span has a complex structure, including metallic and concrete parts, as it can be observed in Figure 17. In this case, multiple reflections can occur. Moreover, because of the different operating frequencies, the radar image may be different for the three radars, making it difficult to clearly recognize the targets. To investigate this point, a three-dimensional scan of the structure of the bridge span was performed using a laser sensor, the MS60 by Leica. Four measurements were performed, lasting approximately 10 min.
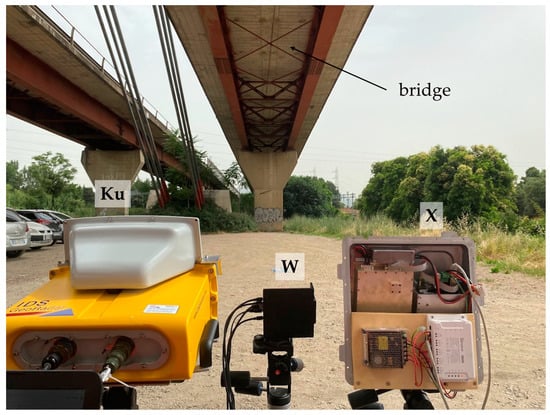
Figure 17.
Experimental setup at the Indiano Bridge for the measurement of the dynamic displacement of the bridge access ramp.
Figure 18 shows the radar images obtained for the three sensors, normalized to the maximum, together with the horizontal and vertical sections of the bridge obtained from the three-dimensional scan. The dashed lines highlight the peak-to-target correspondence. The identified targets correspond to the edges of the metal structure under the bridge span. The images of the three radars partially differ from each other. Although many targets do not coincide in the three images, some targets are seen by all three sensors. The results obtained for a target at 21.4 m away from the radars are shown in Figure 19, Figure 20, Figure 21 and Figure 22. The distance projected on the horizontal direction on the bridge span is 19 m.
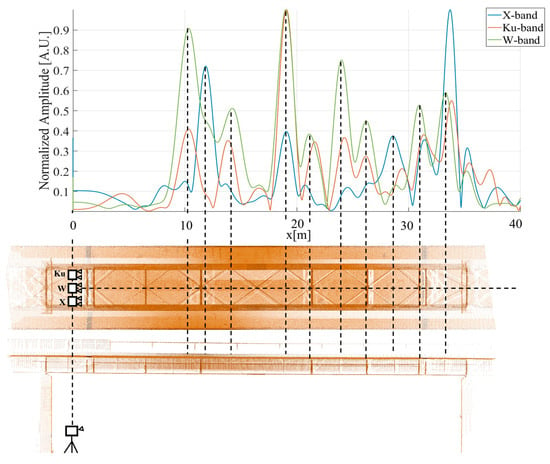
Figure 18.
Radar images acquired by the three radars (top). Horizontal and vertical sections of the three-dimensional scan of the bridge obtained with Leica MS60 (bottom).
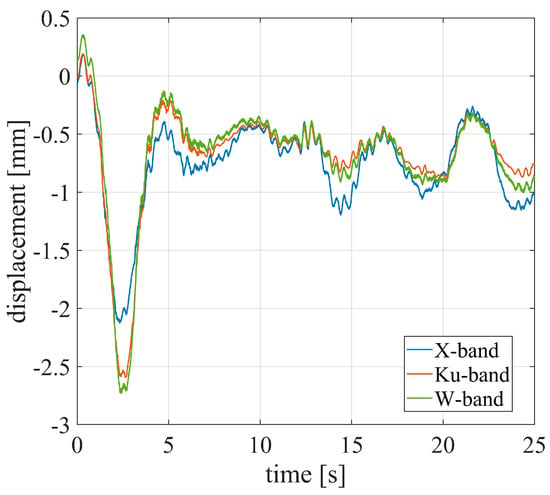
Figure 19.
Measured displacements of a target located under the access ramp, at 21.4 m away from the radars.
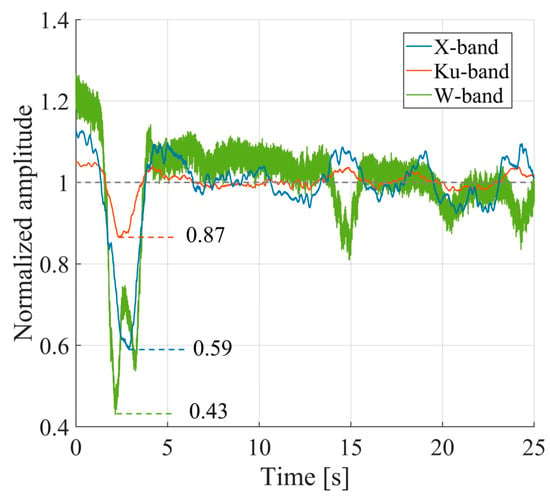
Figure 20.
Normalized amplitude (Equation (6)) of a target at 21.4 m form the radars, on the bridge access ramp, for the three radars.
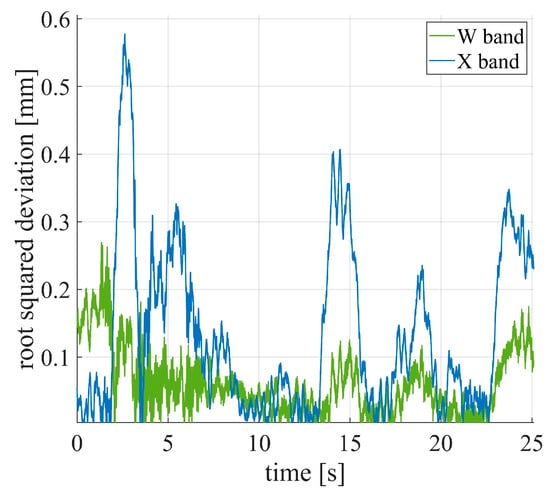
Figure 21.
Root-squared deviations from Ku-band data for X and W-band data for the target on the bridge access ramp, at 21.4 m from the radars.
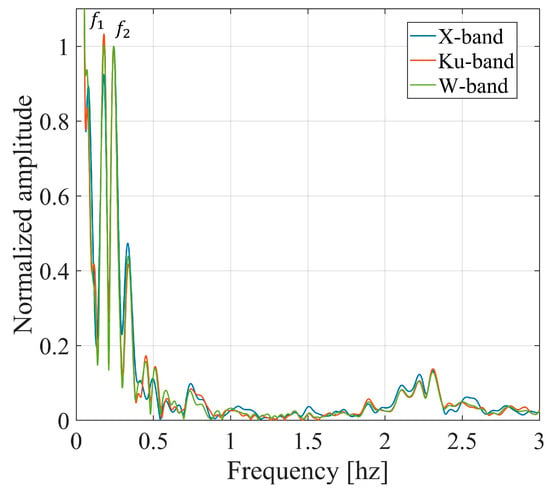
Figure 22.
Frequency spectrum of displacement of the target on the bridge access ramp, at 21.4 m from the radars, obtained for the three radars.
The analysis was focused on time intervals when the intensive impulsive stimulus occurred. Within these intervals, the complex signal of the selected target was processed by interferometric analysis. The SNR of this target was 80.1 dB for the Ku-band, 42 dB for the X-band, and 43.1 dB for the W-band. The resulting displacement is shown in Figure 19, for a time interval of about 25 s. A displacement larger than 2.5 mm was measured. Very good agreement can be observed between the Ku-band and W-band data, while the X-band data slightly differ from the others.
To investigate whether fading could occur in this scenario, the normalized amplitude for this target was calculated for each radar, using Equation (6). Figure 20 shows the results obtained for the time interval considered in Figure 19. A decrease in the normalized amplitude corresponding to the largest displacement can be seen. In Figure 20, the minimum values of the normalized amplitude are highlighted. The amplitude variation is different for the three bands: a decrease from the average value of 12% for the Ku-band, 41% for the X-band, and 48% for the W-band. The time behavior is also different for the three bands. For instance, the W-band data appear noisier. In contrast, the Ku-band data show smaller amplitude variations: normalized amplitude values remain approximately 1 after the intense stimulus.
The three displacements were interpolated on a unique time vector, and the root-squared deviation from Ku-band data was evaluated for X, and W-band data. Figure 21 shows the obtained results for the same time interval as Figure 19. In this case, the maximum deviation is 0.58 mm for X-band data, and 0.27 mm for W-band data. The average values of the root-squared deviations are comparable with the precision of the reference systems: 0.14 mm for the X-band, and 0.06 mm for the W-band.
The displacement spectrum is shown in Figure 22, normalized to the value of the frequency . Very good agreement can be observed, especially between the Ku-band and the W-band data. Two fundamental frequencies are identified, specified in Table 4, with the corresponding measurement errors. Even if the X-band normalized spectrum differs slightly from the others, the recovered frequency matches that determined from the the Ku-band and the W-band.

Table 4.
Oscillation frequencies obtained from the displacement spectrum of the target on the bridge access ramp.
4. Discussion
In Section 3, three experimental datasets acquired by radars operating in the X-band, Ku-band, and W-band were presented, and a direct comparison was carried out. When it was not possible to use one other independent sensor, the Ku-band system, a commercial interferometric radar by IDS Georadar was taken as a reference for the interferometric measurements.
Table 5 summarizes the results obtained in the three experiments from the three radars. The frequencies of the oscillations detected by each radar are shown. As for the interferometric result, for the X-band and the W-band, the maximum and average root-squared deviation from the Ku-band displacement are shown. The displacements measured by the three radars showed a good agreement both in the controlled scenario and in the realistic case study. For instance, as can be seen in Figure 15 and Figure 21, the deviation of the X-band and the W-band data from the Ku-band data is in the order of 0.1 mm. Furthermore, for all the measurements carried out, the displacement spectrum and the fundamental frequencies measured by the three radars coincide. However, some aspects deserve further investigation.

Table 5.
Comparison of the measurement results obtained in the three experiments, for the three radars. RSD is the root square deviation from the Ku-band data.
In Figure 9, signal fading was analyzed for the controlled scenario. The displacements of an oscillating CR are compared with the normalized amplitude value, given by Equation (6), for the three radars. It can be observed that the minima of the normalized amplitude correspond to the maximum difference between the displacements of the radars and the accelerometer. As already mentioned, this effect is probably due to the reflection by the metallic bar that acts as a support for the CR. The W-band system shows a higher rate of amplitude variation. However, as can be observed in Figure 8, cumulatively, the effect on the interferometric displacement is not dramatic. On the contrary, the effect on the displacement appears more critical for the X- and Ku-bands.
A similar effect was observed in Figure 20 for a target on the access ramp to the bridge. In this case, the normalized amplitude shows minima when the displacement is maximum. This effect is most pronounced for the X-band and W-band data, for which the largest amplitude deviation is 41% and 57% of the mean value, respectively. The displacement deviation of the X-band data from the Ku-band data, which can be observed in Figure 21, could be related to signal fading. However, it should be noted that the maximum deviation is less than 0.6 mm. It can therefore be stated that, in this case, fading does not dramatically influence the interferometric displacement.
In Figure 12 and Figure 18, it can be noted that the radar images acquired by the three radars do not perfectly coincide, even though they have the same range resolution. This could be due to the different backscattering behaviors at different frequency bands.
In Figure 18, radar images acquired on the access ramp to the bridge were compared with the three-dimensional scan obtained with the Leica MS60. The targets identified correspond to the edges of the metal structure under the bridge span. It can be noted that there is not a perfect match for the closest targets. This is probably due to multipath effects, which are more evident for short-range targets.
5. Conclusions
In this work, a direct comparison is carried out between three radars for structural dynamic monitoring. The sensors, operating in the X-band, Ku-band, and W-band with FMCW signals, were simultaneously tested. The aim was to compare the performance of the systems for the dynamic monitoring of civil structures such as bridges, highlighting possible advantages provided by one or the other bands. Three measurement campaigns are presented: in a controlled scenario, using an oscillating CR, and in a realistic scenario, for monitoring the stays and the access ramp of a bridge.
The results obtained demonstrate that the radar frequency band does not limit the possibility of performing dynamic monitoring. In fact, in the controlled scenario, the fundamental frequencies determined from the displacement spectrum for the three radars coincide with that of the accelerometer. Even in the realistic scenario, the displacement results obtained for X and W-band radars show good agreement with those of the Ku-band, a commercial system developed specifically for this application. These results demonstrate the great potential of FMCW radars operating in these three bands for structural dynamic monitoring. The analysis of the interferometric measurements brought up other interesting considerations.
In the realistic case studies, the radar images acquired in the three bands look different from each other, even when they have the same range resolution. Therefore, it is not easy to clearly recognize targets, especially in complex scenarios. This could be due to the different backscattering behavior at different wavelengths.
Phase wrapping could be challenging for interferometric high-frequency systems. However, the experimental results obtained demonstrate that by using a high acquisition frequency it is possible to measure dynamic displacements without phase wrapping even in the W-band.
Signal fading was observed, both in controlled and realistic scenarios. It was demonstrated that studying signal fading is useful for radar interferometric dynamic monitoring. In fact, a connection was observed between signal fading and target displacement. When large displacements are measured, this effect produces a deviation of the interferometric measurement. When small displacements are monitored a connection is observed between amplitude variations and the degradation of signal quality, but the interferometric measurement is not dramatically affected. The experimental results show that fading varies with the frequency band. It is not easy to quantify fading effects and their relation to interferometric accuracy. This problem is of great importance for monitoring complex structures and deserves more in-depth studies. This study could be the starting point for more advanced analyses and techniques.
Author Contributions
Methodology, L.M. and M.P.; validation, L.P. and A.C.; formal analysis, L.M. and A.B.; investigation, L.P., A.B., A.C., L.M. and J.S.; resources, M.P.; data curation, L.M.; writing—original draft preparation, A.B.; writing—review and editing, L.M. and M.P.; supervision, M.P. and L.M.; project administration, M.P.; funding acquisition, M.P. All authors have read and agreed to the published version of the manuscript.
Funding
This research received no external funding.
Data Availability Statement
No data are available.
Conflicts of Interest
The authors declare no conflicts of interest.
References
- Ma, Z.; Chung, J.; Liu, P.; Sohn, H. Bridge displacement estimation by fusing accelerometer and strain gauge measurements. Struct. Control Health Monit. 2021, 28, e2733. [Google Scholar] [CrossRef]
- Morichika, S.; Sekiya, H.; Zhu, Y.; Hirano, S.; Maruyama, O. Estimation of Displacement Response in Steel Plate Girder Bridge Using a Single MEMS Accelerometer. IEEE Sens. J. 2021, 21, 8204–8208. [Google Scholar] [CrossRef]
- Mazzei, M.; Lellis, A.M.D. Capacitive accelerometers at low frequency for infrastructure monitoring. Procedia Struct. Integr. 2023, 44, 1212–1219. [Google Scholar] [CrossRef]
- Wu, S.; Zhang, B.; Ding, X.; Zhang, L.; Zhang, Z.; Zhang, Z. Radar Interferometry for Urban Infrastructure Stability Monitoring: From Techniques to Applications. Sustainability 2023, 15, 14654. [Google Scholar] [CrossRef]
- Pieraccini, M.; Parrini, F.; Fratini, M.; Atzeni, C.; Spinelli, P.; Micheloni, M. Static and dynamic testing of bridges through microwave interferometry. NDT E Int. 2007, 40, 208–214. [Google Scholar] [CrossRef]
- Zhang, B.; Ding, X.; Werner, C.; Tan, K.; Zhang, B.; Jiang, M.; Zhao, J.; Xu, Y. Dynamic displacement monitoring of long-span bridges with a microwave radar interferometer. ISPRS J. Photogramm. Remote Sens. 2018, 138, 252–264. [Google Scholar] [CrossRef]
- Pieraccini, M.; Fratini, M.; Parrini, F.; Atzeni, C.; Bartoli, G. Interferometric radar vs. accelerometer for dynamic monitoring of large structures: An experimental comparison. NDT E Int. 2008, 41, 258–264. [Google Scholar] [CrossRef]
- Tarchi, D.; Rudolf, H.; Pieraccini, M.; Atzeni, C. Remote monitoring of buildings using a ground-based SAR: Application to cultural heritage survey. Int. J. Remote Sens. 2000, 21, 3545–3551. [Google Scholar] [CrossRef]
- Michel, C.; Keller, S. Advancing Ground-Based Radar Processing for Bridge Infrastructure Monitoring. Sensors 2021, 21, 2172. [Google Scholar] [CrossRef]
- Zou, L.; Feng, W.; Masci, O.; Nico, G.; Alani, A.M.; Sato, M. Bridge Monitoring Strategies for Sustainable Development with Microwave Radar Interferometry. Sustainability 2024, 16, 2607. [Google Scholar] [CrossRef]
- Pagnini, L.; Miccinesi, L.; Beni, A.; Pieraccini, M. Transversal Displacement Detection of an Arched Bridge with a Multimonostatic Multiple-Input Multiple-Output Radar. Sensors 2024, 24, 1839. [Google Scholar] [CrossRef] [PubMed]
- Miccinesi, L.; Pieraccini, M. Bridge Monitoring by a Monostatic/Bistatic Interferometric Radar Able to Retrieve the Dynamic 3D Displacement Vector. IEEE Access 2020, 8, 210339–210346. [Google Scholar] [CrossRef]
- Miccinesi, L.; Beni, A.; Pieraccini, M. Multi-Monostatic Interferometric Radar for Bridge Monitoring. Electronics 2021, 10, 247. [Google Scholar] [CrossRef]
- Miccinesi, L.; Pieraccini, M.; Beni, A.; Andries, O.; Consumi, T. Multi-Monostatic Interferometric Radar with Radar Link for Bridge Monitoring. Electronics 2021, 10, 2777. [Google Scholar] [CrossRef]
- Pramudita, A.A.; Lin, D.-B.; Dhiyani, A.A.; Ryanu, H.H.; Adiprabowo, T.; Yudha, E.A. FMCW Radar for Noncontact Bridge Structure Displacement Estimation. IEEE Trans. Instrum. Meas. 2023, 72, 2960. [Google Scholar] [CrossRef]
- Pieraccini, M.; Miccinesi, L. Ground-Based Radar Interferometry: A Bibliographic Review. Remote Sens. 2019, 11, 1029. [Google Scholar] [CrossRef]
- Li, Y.; Jiao, Q.; Hu, X.; Li, Z.; Li, B.; Zhang, J.; Jiang, W.; Luo, Y.; Li, Q.; Ba, R. Detecting the slope movement after the 2018 Baige Landslides based on ground-based and space-borne radar observations. Int. J. Appl. Earth Obs. Geoinf. 2020, 84, 101949. [Google Scholar] [CrossRef]
- Liu, B.; Ge, D.; Li, M.; Zhang, L.; Wang, Y.; Zhang, X. Using GB-SAR technique to monitor displacement of open pit slope. In Proceedings of the 2016 IEEE International Geoscience and Remote Sensing Symposium (IGARSS), Beijing, China, 10–15 July 2016; pp. 5986–5989. [Google Scholar] [CrossRef]
- Sofi, M.; Lumantarna, E.; Zhong, A.; Mendis, P.A.; Duffield, C.; Barnes, R. Determining dynamic characteristics of high rise buildings using interferometric radar system. Eng. Struct. 2018, 164, 230–242. [Google Scholar] [CrossRef]
- Luzi, G.; Crosetto, M.; Fernández, E. Radar Interferometry for Monitoring the Vibration Characteristics of Buildings and Civil Structures: Recent Case Studies in Spain. Sensors 2017, 17, 669. [Google Scholar] [CrossRef]
- Jung, J.; Kim, D.; Vadivel, S.K.P.; Yun, S.-H. Long-Term Deflection Monitoring for Bridges Using X and C-Band Time-Series SAR Interferometry. Remote Sens. 2019, 11, 1258. [Google Scholar] [CrossRef]
- Lazecky, M.; Hlavacova, I.; Bakon, M.; Sousa, J.J.; Perissin, D.; Patricio, G. Bridge Displacements Monitoring Using Space-Borne X-Band SAR Interferometry. IEEE J. Sel. Top. Appl. Earth Obs. Remote Sens. 2017, 10, 205–210. [Google Scholar] [CrossRef]
- de Macedo, K.A.C.; Ramos, F.L.G.; Gaboardi, C.; Moreira, J.R.; Vissirini, F.; da Costa, M.S. A Compact Ground-Based Interferometric Radar for Landslide Monitoring: The Xerém Experiment. IEEE J. Sel. Top. Appl. Earth Obs. Remote Sens. 2017, 10, 975–986. [Google Scholar] [CrossRef]
- Michelini, A.; Coppi, F.; Bicci, A.; Alli, G. SPARX, a MIMO Array for Ground-Based Radar Interferometry. Sensors 2019, 19, 252. [Google Scholar] [CrossRef]
- Viviani, F.; Michelini, A.; Mayer, L. RockSpot: An Interferometric Doppler Radar for Rockfall/Avalanche Detection and Tracking. In Proceedings of the 2020 IEEE Radar Conference (RadarConf20), Florence, Italy, 21–25 September 2020; pp. 1–5. [Google Scholar] [CrossRef]
- Papi, F.; Donati, N.; Pieraccini, M. Handy Microwave Sensor for Remote Detection of Structural Vibration. In Proceedings of the EWSHM—7th European Workshop on Structural Health Monitoring, Nantes, Frances, 8–11 July 2014; Available online: https://inria.hal.science/hal-01020380 (accessed on 12 July 2024).
- Hasch, J.; Topak, E.; Schnabel, R.; Zwick, T.; Weigel, R.; Waldschmidt, C. Millimeter-Wave Technology for Automotive Radar Sensors in the 77 GHz Frequency Band. IEEE Trans. Microw. Theory Tech. 2012, 60, 845–860. [Google Scholar] [CrossRef]
- Venon, A.; Dupuis, Y.; Vasseur, P.; Merriaux, P. Millimeter Wave FMCW RADARs for Perception, Recognition and Localization in Automotive Applications: A Survey. IEEE Trans. Intell. Veh. 2022, 7, 533–555. [Google Scholar] [CrossRef]
- Li, S.; Xiong, Y.; Ren, Z.; Peng, Z. Structural Health Monitoring of Large Structures via mmWave Sensing. J. Phys. Conf. Ser. 2022, 2184, 012042. [Google Scholar] [CrossRef]
- Lian, W.; Wang, G.; Liu, S.; Zhu, G. Real-Time Deformation Monitoring for Tunnels Using Distributed Millimeter Wave Radar. In Proceedings of the 2022 4th International Academic Exchange Conference on Science and Technology Innovation (IAECST), Guangzhou, China, 9–11 December 2022; pp. 664–668. [Google Scholar] [CrossRef]
- Ma, Z.; Choi, J.; Yang, L.; Sohn, H. Structural displacement estimation using accelerometer and FMCW millimeter wave radar. Mech. Syst. Signal Process. 2023, 182, 109582. [Google Scholar] [CrossRef]
- Ma, Z.; Choi, J.; Sohn, H. Continuous bridge displacement estimation using millimeter-wave radar, strain gauge and accelerometer. Mech. Syst. Signal Process. 2023, 197, 110408. [Google Scholar] [CrossRef]
- Pagnini, L.; Beni, A.; Cioncolini, A.; Miccinesi, L.; Voci, F.; Pieraccini, M. Application of a W-band Radar for Dynamic Monitoring of Bridges. In Proceedings of the 2024 4th URSI Atlantic Radio Science Meeting (AT-RASC), Gran Canaria, Spain, 19–24 May 2024; pp. 1–4. [Google Scholar] [CrossRef]
- Miccinesi, L.; Consumi, T.; Beni, A.; Pieraccini, M. W-band MIMO GB-SAR for Bridge Testing/Monitoring. Electronics 2021, 10, 2261. [Google Scholar] [CrossRef]
- Beni, A.; Miccinesi, L.; Pieraccini, M. Correlation between Coherence and Atmospheric Parameters in S, C, AND Ku-Band GBSAR Systems. In Proceedings of the IGARSS 2023—2023 IEEE International Geoscience and Remote Sensing Symposium, Pasadena, CA, USA, 16–21 July 2023; pp. 4844–4847. [Google Scholar] [CrossRef]
- Costantini, M.; Farina, A.; Zirilli, F. A fast phase unwrapping algorithm for SAR interferometry. IEEE Trans. Geosci. Remote Sens. 1999, 37, 452–460. [Google Scholar] [CrossRef]
- Cidronali, A.; Pagnini, L.; Collodi, G.; Passafiume, M. A Highly Linear Ka-Band GaN-on-Si Active Balanced Mixer for Radar Applications. IEEE Trans. Circuits Syst. I Regul. Pap. 2022, 69, 4453–4464. [Google Scholar] [CrossRef]
- Ma, Z.-F.; Jiang, M.; Khoshmanesh, M.; Cheng, X. Time Series Phase Unwrapping Based on Graph Theory and Compressed Sensing. IEEE Trans. Geosci. Remote Sens. 2022, 60, 5204412. [Google Scholar] [CrossRef]
- Zhou, L.; Yu, H.; Lan, Y. Artificial Intelligence in Interferometric Synthetic Aperture Radar Phase Unwrapping: A Review. IEEE Geosci. Remote Sens. Mag. 2021, 9, 10–28. [Google Scholar] [CrossRef]
- Pu, L.; Zhang, X.; Zhou, Z.; Li, L.; Zhou, L.; Shi, J.; Wei, S. A Robust InSAR Phase Unwrapping Method via Phase Gradient Estimation Network. Remote Sens. 2021, 13, 4564. [Google Scholar] [CrossRef]
- IBIS-FM EVO. Available online: https://idsgeoradar.com/products/interferometric-radar/ibis-fm-evo (accessed on 15 July 2024).
- RockSpot. Available online: https://idsgeoradar.com/products/interferometric-radar/rockspot (accessed on 15 July 2024).
- AWR1843BOOST Evaluation Board|TI.com. Available online: https://www.ti.com/tool/AWR1843BOOST (accessed on 3 August 2023).
- Iglesias, R.; Fabregas, X.; Aguasca, A.; Mallorqui, J.J.; López-Martínez, C.; Gili, J.A.; Corominas, J. Atmospheric Phase Screen Compensation in Ground-Based SAR With a Multiple-Regression Model Over Mountainous Regions. IEEE Trans. Geosci. Remote Sens. 2014, 52, 2436–2449. [Google Scholar] [CrossRef]
- Bush, T.F.; Uloby, F.T. Fading Characteristics of Panchromatic Radar Backscatter from Selected Agricultural Targets. IEEE Trans. Geosci. Electron. 1975, 13, 149–157. [Google Scholar] [CrossRef]
Disclaimer/Publisher’s Note: The statements, opinions and data contained in all publications are solely those of the individual author(s) and contributor(s) and not of MDPI and/or the editor(s). MDPI and/or the editor(s) disclaim responsibility for any injury to people or property resulting from any ideas, methods, instructions or products referred to in the content. |
© 2024 by the authors. Licensee MDPI, Basel, Switzerland. This article is an open access article distributed under the terms and conditions of the Creative Commons Attribution (CC BY) license (https://creativecommons.org/licenses/by/4.0/).