Abstract
In developing modern intelligent transportation systems, integrated sensing and communication (ISAC) technology has become an efficient and promising method for vehicle road services. To enhance traffic safety and efficiency through real-time interaction between vehicles and roads, this paper proposes a searching–deciding scheme for an alternation radar-communication (radar-comm) system. Firstly, its communication performance is derived for a given detection probability. Then, we process the echo data from real-world millimeter-wave (mmWave) radar into four-dimensional (4D) point cloud datasets and thus separate different hybrid modes of single-vehicle and vehicle fleets into three types of scenes. Based on these datasets, an efficient labeling method is proposed to assist accurate vehicle target detection. Finally, a novel vehicle detection scheme is proposed to classify various scenes and accurately detect vehicle targets based on deep learning methods. Extensive experiments on collected real-world datasets demonstrate that compared to benchmarks, the proposed scheme obtains substantial radar performance and achieves competitive communication performance.
1. Introduction
With the advancement of 5G and 6G wireless networks, integrating advanced technologies has become essential for improving communication efficiency and applications in both the military and civilian arenas [1]. Effective communication between the base station (BS) and vehicles is crucial in developing intelligent transportation systems [2]. Seamless communication links enable vehicles to receive critical information, such as road conditions and traffic updates, which is vital for future services like autonomous driving [3]. Beamforming technology is pivotal in this setup, enhancing the signal-to-noise ratio (SNR) by directing pencil-shaped beams toward vehicles based on real-time vehicle positions. To solve this, the BS must possess target detection capabilities in the area. Integrated sensing and communication (ISAC) technology is a promising solution for enabling effective target sensing and communication, ensuring efficient traffic management and safer roads [4].
Target detection in traffic primarily relies on camera vision and radar technologies, and integrating vehicle position information significantly contributes to beamformer design [5]. With the maturation of image-based vehicle target detection technology, the efficient detection and tracking of vehicle targets have become crucial research domains [6,7]. Traditional approaches involve capturing images to extract relevant target position and motion data, forming the basis for subsequent semantic analysis tasks. Deep learning advancements have led to the emergence of highly efficient target detection algorithms, notably the region-based convolutional neural networks (RCNNs) and you only look once (YOLO) series [8,9,10,11]. However, environmental factors can compromise the quality of collected image or video data, affecting the accuracy and efficiency of target detection and tracking processes [12,13]. These challenges underscore the need for robust solutions to ensure reliable performance in real-world scenarios.
To tackle the above challenges, there has been a growing interest from both industry and academia in enhancing the target sensing performance across various environments through leveraging wireless communication technology [14]. Radar and lidar can offer superior sensing capabilities compared to cameras. However, lidar systems are very expensive. Therefore, radar systems have been widely developed in advanced driver assistance systems [15]. In contrast to lidar, millimeter-wave (mmWave) radar can penetrate through fog, smoke, and dust, a capability that translates into near-all-weather and all-time operation, rendering it highly reliable [16]. Operating within the wavelength range between microwave and centimeter waves, mmWave radar combines the advantages of radar and lidar technologies [17]. Furthermore, mmWave radar demonstrates over 90% accuracy in distinguishing and identifying weak targets [18]. The transmission and reception of mmWave radar electromagnetic signals are far less susceptible to adverse weather conditions and variations in lighting, whether strong or weak. Consequently, mmWave radar delivers exceptional target positioning and detection performance, even in challenging environmental scenes [19]. It is also cost-effective and proficient in simultaneously identifying multiple targets across a wide range of practical applications.
The main contributions of this paper are as follows:
- 1.
- This paper first proposes a novel searching–deciding scheme for radar-communication (radar-comm) systems, which are designed to operate in a dual-functional mode, balancing the demands of both radar sensing and wireless communication. Then, the theoretical analysis underscores the significance of detection probability in enhancing the communication performance of the system. Finally, we propose a vehicle detection scheme to achieve superior radar-comm system integration by enhancing detection probability.
- 2.
- In real-world conditions, we process the echo data from mmWave radar into the 4D point cloud datasets. By comprehensively understanding vehicle target features, the datasets encompass three distinct scenes. Then, an efficient labeling method is proposed to accurately detect vehicle targets, which is not contingent on camera image quality and is versatile for various conditions.
- 3.
- Based on the collected 4D radar point cloud dataset, this paper presents a novel six-channel self-attention neural network architecture to detect vehicle targets. It integrates the multi-layer perceptron (MLP) layer, max-pooling layer, and transformer block to achieve more accurate and robust detection of vehicle targets. The MLP layer provides a powerful non-linear mapping capability, allowing the network to learn complex patterns within the point cloud data. The max-pooling layer effectively reduces the spatial dimensions of the data, which helps reduce the computational load. The transformer block enables the model to capture contextual information across the point cloud.
- 4.
- Extensive experiments on collected real-world datasets demonstrate that compared to benchmarks, the proposed scheme obtains substantial radar performance and achieves competitive communication performance.
2. Related Work
In mmWave radar target sensing, two primary dataset types are employed, radar spectrogram and radar point cloud. In radar spectrogram, target sensing involves a multi-step process. Initially, the raw radar echo signals undergo a series of fast Fourier transforms (FFTs) to produce a spectrogram [20]. Reference [21] utilizes the peak algorithm’s extracted targets from the radio frequency. Nevertheless, setting detection thresholds can be susceptible to widespread false and missed detects. To solve this challenge, reference [22] has addressed it by employing a deep learning algorithm to combine a range angle (RA) spectrogram with camera images or videos. This integrated approach enhances target detection accuracy and mitigates the issues associated with traditional threshold methods [23]. Reference [24] explores the feasibility of utilizing deep-learning algorithms for sensing targets based on the range velocity (RV) spectrogram. Regardless of the spectrogram type, it is essential to label the targets using camera images before applying deep learning models for classification. When integrating camera images for target annotation, the process is constrained by image quality and inevitably incorporates clutter information within the target bounding box. This clutter information hampers the accurate extraction and tracking of subsequent targets [25]. Compared with radar spectrograms, radar point clouds contain more detailed target feature information and have found widespread application in the field of target detection. Reference [26] employs a virtual point cloud (VPC) as an auxiliary teacher in conjunction with mmWave radar point clouds (RPCs) for human pose estimation. Through extensive experiments, the study validates the effectiveness of utilizing radar point cloud data for human pose estimation. According to [27], radar point cloud data are used for vehicle sensing and power allocation, and the experiment demonstrates that radar point cloud data outperforms RV spectrograms in performance and efficiency metrics. The precise detection of targets contributes to a more rational allocation of communication resources.
The integration of sensing and communication functionalities, commonly referred to as ISAC, has emerged as a pivotal technology in the development of next-generation wireless systems. ISAC offers the potential to enhance the efficiency of spectrum utilization and reduce hardware costs by combining the traditionally separate domains of radar sensing and wireless communication into a unified framework. This integration is achieved through various design schemes, each addressing different aspects of the dual-functional system requirements and performance. As the demand for more sophisticated and versatile systems grows, the exploration of ISAC techniques becomes increasingly crucial, paving the way for innovations in signal design, system architecture, and algorithm development.
In the background of target sensing, ISAC technology is typically approached through four prevalent design schemes. The first scheme is the symbol-level optimized signals for both sensing and communication. In [28], the authors design and optimize transceiver waveforms for a multi-input–multi-output (MIMO) dual functional radar-communication (DFRC) system. In this system, the dual-functional base station (BS) transmits the integrated signal optimized by the successive convex approximation method. In [29], an emerged symbol-level precoding approach for ISAC is proposed, where the real-time data transmission is based on the Riemannian Broyden–Fletcher–Goldfarb–Shanno (RBFGS) algorithm. Continuous real-time optimization of these signals is necessary, which imposes significant demands on computing and storage resources. Furthermore, its implementation requires substantial modifications to the existing system architecture.
The second is employing radar signals for communication functions. Reference [30] extends the DFRC system based on index modulation to incorporate sparse arrays and frequency-modulated continuous waveforms (FMCWs). The proposed FMCW-based radar-communication system utilizes fewer radio frequency modules and integrates narrowband FMCW signals to minimize cost and complexity. Reference [31] introduces a novel DFRC scheme as hybrid index modulation (HIM), which operates on a frequency-hopping (FH-MIMO) radar platform. However, the restriction imposed by the radar pulse repetition frequency in this scheme presents a challenge to achieving high communication rates.
The third scheme involves using communication signals for sensing functions. Reference [32] proposes utilizing the spread spectrum communication signal echo reflected by the target to achieve sensing functions. The proposed dual-function radar and communication system demonstrated the capability to reach speeds of up to 10 Megabits/s. Reference [33] presents a novel sparse vector-coding-based ISAC waveform, designed to minimize sidelobes for radar sensing and ensure ultra-reliable communication transmission. This scheme exhibits enhancing performance. This scheme frequently overlooks the design considerations of sidelobes during waveform construction, resulting in inadequate sensing resolution and failure to meet the required standards.
The final scheme is the alternating design of sensing and communication, facilitating seamless transitions between the two models within the system, which offers increased flexibility in adapting to dynamic environmental conditions. In reference [34], the authors investigate the coexistence of a MIMO radar system with cellular base stations, specifically focusing on interfering channel estimation. The radar operates in a “search and decide” mode, while the base station receives interference from the radar. In addition, the authors propose several hypothesis testing methods to identify the radar’s operating mode and obtain the interference channel state information (ICSI) through various channel estimation schemes. In reference [35], advanced deep learning methodologies are devised to capitalize on radar sensor data, facilitating mmWave beam prediction. These methodologies seamlessly incorporate radar signal processing techniques to extract pertinent features for the learning models, enhancing their efficiency and reducing inference time.
Considering the ease of engineering implementation, this study employs mmWave radar for target sensing and implements a search-deciding scheme for wireless data transmission. Firstly, we collect the echo data using our measurements with the FMCW mmWave radar sensor and process them to four-dimensional (4D) radar point clouds as the input of the neural network. Then, we propose a novel approach based on the radar point cloud datasets to enhance vehicle target detection performance, in the search model. Based on the detection results, we can optimize communication resource allocation. The proposed search-deciding alternation radar-comm system is designed for real-time processing. Finally, compared to the benchmarks, the proposed scheme achieves superior integrated system performance.
3. System Model
This section focuses on a mmWave radar signal processing and communication performance analysis. As depicted in Figure 1, in an urban road, the proposed alternation radar-comm system includes an mmWave radar sensing system and a communication system. This paper utilizes a self-developed mmWave radar 80 GHz FMCW mmWave radar sensor to capture 4D radar point clouds, with a range resolution from 0.4 m to 1.8 m and angular resolutions of 1° in azimuth and 2° in elevation. The radar sensor is deployed 6 m above the roadway. Data are collected on sunny days in urban environments with moderate traffic. At the same time as the camera records the lane situation, the mmWave radar is used to sense vehicles and collect data, and then the data are stored in the computer.
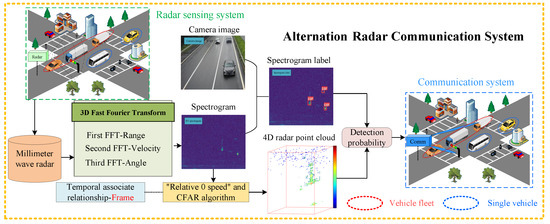
Figure 1.
System model of alternation radar communication system driven by 4D radar point clouds.
The initial step involved preprocessing the radar data to effectively filter out clutter, resulting in usable 4D radar point cloud datasets. Combining video frames and radar frames with the same timestamp, we performed manual data annotation to construct the dataset. These datasets were systematically categorized into different traffic scenarios, focusing on distinct hybrid modes, including single-vehicle instances and vehicle fleets. Each scene has approximately 300 points, and the vehicle fleet on a city road means vehicles are close together and travel in a line. Building on this foundation, we proposed a novel vehicle detection scheme designed to accurately classify these diverse scenes and detect vehicle targets. The methodology also involved analyzing the communication resource allocation for vehicles, guided by the detection probabilities derived from the radar data to allocate communication resources.
3.1. Radar Signal Processing
The echo signal processing primarily of FMCW radar involves three fundamental components: range estimation, velocity estimation, and angle estimation. The specific processing steps are outlined below [36].
Range estimation is fundamental to processing mmWave radar echo signals. It involves calculating the distance between the BS and the vehicle target, corresponding to the round-trip time delay of electromagnetic wave propagation. An approximate range estimation can be obtained by conducting the first FFT on the radar echo signal [37]. The mmWave radar echo signal is defined as
where is the amplitude of the signal, is propagation delay, c is the speed of light, is the carrier frequency, is the initial phase of the echo signal, is the time duration, the frequency sweep slope is , and B is the scanning bandwidth.
The complex signal representation of the mixed echo signal can be written as
which can be rewritten in a discrete form as
where is the sampling interval, n is the number of sampling points, is the Doppler frequency deviation, is the frequency generated by the range between the target and the mmWave radar, and is the delay at the initial position.
Firstly, we show the data processing procedure for each antenna in a group of chirp waves received by the radar radio frequency front [37]. In the time interval, the radar echo signal of each vehicle target is defined by
where is the number of pulses and v is the velocity of a vehicle with the initial distance of .
The peak of Equation (4) is influenced by the range and velocity of the target. The first FFT is applied to approximate the range information between the vehicle and the radar. Once the distance information is obtained, the second FFT is performed to extract the velocity information of the target. The specific description is as follows:
where
and variable l can be denoted as
According to Equations (6) and (7), and can be obtained, where formula (5) reaches the peak value. Subsequently, the velocity and range information of the vehicle can be acquired. Following the processing of the mmWave radar echo signal by the first and second FFTs, the corresponding range velocity spectrograms are generated. In multi-antenna reception, the received signals of target number T with angle directions and on each element of the receiving array can be represented as a weighted form of T echoes [5]:
where represents the guiding vector of the array and can be calculated by
and is the j-th received signal on the receiving antenna. Angle estimation necessitates employing multiple-antenna reception and can be derived through the third FFT, which is denoted by
Finally, the SNR of the vehicle and clutter can be obtained based on the range (R), velocity (V), and angle (A) information [38].
After obtaining the RVA spectrogram and SNR, we filter out points with zero speed in the RV spectrogram using zero-speed detection. Subsequently, we apply the constant false alarm rate (CFAR) detection algorithm to eliminate clutter points with low SNR values [23]. This helps reduce the workload of labeling the data.
3.2. Alternation Radar-Comm System Model
For the radar-comm system with M transmission antennas [5], the steering vector is
The transmission waveform with length L, , can be defined as
where is the beamforming matrix with , which can be denoted by
is the power allocation diagonal matrix with the total transmission power , which can be calculated by
and is the random complex signal, which can be expressed by
The transmission radiation pattern towards the angle is represented as
where
is the spatial sample covariance matrix. Following [34], the radar-comm system consists of two main operation schemes including the search–deciding mode. The searching mode is used to detect vehicles in the area, which determines the initial positions and velocity of vehicle targets. The beam pattern is omnidirectional, and each angle is constant. We must have , which leads to a feasible solution where and is an all-zero vector except the i-th element is 1. We model T true targets are distributed in the area and vehicle targets are detected at time k.
In the deciding mode, the radar-comm system forms several beams aligning the detected targets with a maximum M. The beams contain the downlink communication data, and the reflected echoes are used for target detection. In the case of many antennas, the array forms a pencil beam. The feasible solution of the beamformers are , where are the target angles [34].
The channel capacity of the -th target in targets at the slot time k epoch is
where G is the antenna gain, is the distance between -th target and BS at the slot time k, is the transmission power of -th target at the slot time k, , is the wavelength of the wireless signal, and is the noise power. Thus, the total capacity of the radar-comm system is
The total communication channel capacity when the q-th target of T targets is detected at slot time k can be expressed as
where represents the detection status of the q-th target at slot time k. If the target is detected, , and otherwise, . Then, the average performance of in the deciding model can be represented as
which can be selected as the objective function of the radar-comm system optimization problem. The above function can be simplified as
where is the detection probability of the q-th target at slot time k.
In the radar-comm system, the optimization of communication resource allocation typically involves maximizing the total channel capacity, which is written by
In Equation (23), the objective function is a joint concave function concerning power, and this optimization problem can be solved using the Lagrangian method. The optimal power allocation converges to
whose detailed derivation is provided in Appendix A.
Then, the optimal channel capacity can be calculated by
and it can be simplified to
where is the indicator function with
From Equation (26), it becomes apparent that an increment in the parameter or a reduction in results in an augmentation of communication performance , the total channel capacity. Given the , the distance between the target and the BS, which is dependent on data and beyond direct control, the enhancement of hinges on the optimizing . Consequently, the primary challenge in bolstering integration performance relies on designing a more precise target detector.
4. Vehicle Sensing Scheme Based on Radar Point Cloud
In this section, we propose a vehicle target sensing scheme utilizing 4D mmWave radar point cloud features , which can be summarized into three parts. Firstly, leveraging real-world mmWave data, the urban traffic scenes involving vehicles can be classified. Secondly, after post-processing the collected mmWave radar data, this paper constructs the 4D radar point cloud datasets, annotates them with labels, and visualizes the targets within the point cloud. Finally, a novel vehicle target sensing scheme with deep learning techniques and 4D radar point cloud data is introduced.
4.1. Radar-Assisted Vehicle Sensing Scenes
This paper categorizes the collected real-world mmWave radar data into three scenes, as shown in Figure 2, each representing common traffic conditions on urban roads. Each scene depicts distinct urban traffic scenarios.
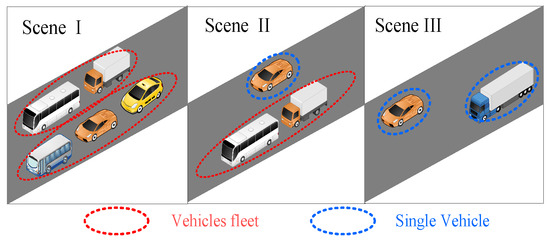
Figure 2.
Single vehicle and a vehicle fleet on urban roads in different scenarios.
- Scene I comprises a multitude of vehicle formations, showcasing diverse vehicle models, with the distance between vehicle targets and the mmWave radar distributed from far to near.
- Scene II constitutes a mixed setting where individual vehicles and vehicle formations coexist, encompassing various vehicle types. Vehicle targets are distributed from far to near the mmWave radar.
- Scene III represents the simplest scenario, consisting solely of individual vehicles of various types. There is no vehicle fleet, and the distance between each vehicle target and the mmWave radar varies from far to near.
4.2. Four-Dimensional Radar Point Cloud Data Processing
The dataset used in this study is partitioned into two distinct segments: RV spectrogram and 4D mmWave radar point cloud data. The RV spectrogram undergoes range and velocity FFT processing, while the mmWave radar point cloud data are processed through FFT and CFAR techniques. This segmentation facilitates our subsequent comparative experiments detecting vehicle targets using 4D mmWave radar point cloud data.
Additionally, each mmWave radar RV spectrogram is paired with a corresponding camera image to facilitate target labeling within the spectrogram. Figure 3a,b provide an illustrative frame of the captured camera image and RV spectrogram dataset. We adopt target sensing labeling methods commonly used in image vision, as shown in Figure 3c. Specifically, for the mmWave radar RV spectrogram, we employ 2D bounding boxes to label vehicle targets [39].

Figure 3.
Visualization scenes and corresponding RV spectrogram. (a) The camera image of vehicles. (b) RV spectrogram. (c) RV spectrogram after labeling.
For 4D radar point cloud data featuring , as shown in Figure 4, we introduce a novel label-labeling approach that does not rely on camera images. Initially, we establish a threshold with a velocity value of 0 to remove obvious clutter points. Subsequently, we apply the CFAR detection algorithm to filter out clutter points with lower SNR values. Finally, we employ the correlation matrix between the frame of radar point cloud data, identifying points with correlation as target points and those without correlation as clutter points. This method significantly reduces the time required for target labeling.
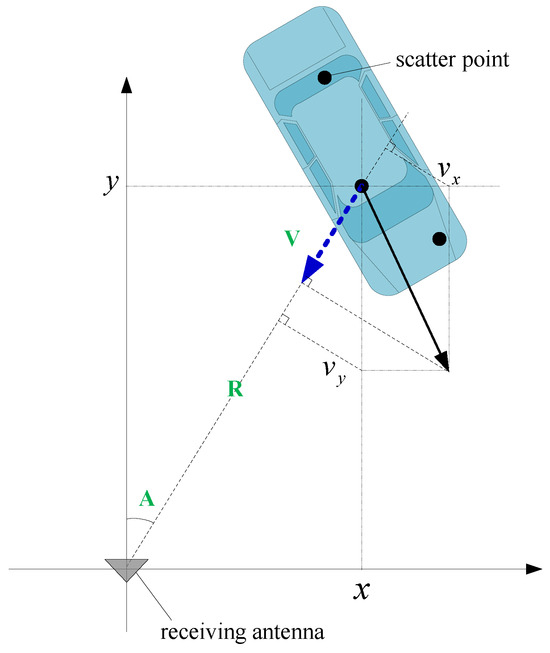
Figure 4.
Individual parameters of vehicle and radar.
As depicted in Figure 5, we have chosen a subset of processed 4D radar point cloud data for visualization. Figure 5a illustrates the distribution of 4D radar point cloud data on a two-dimensional RV plane, where colors denote the SNR values of individual points. Brighter colors indicate higher SNR values. The corresponding three-dimensional scene display is depicted in Figure 5b, and the color of each point is determined by its SNR value, where brighter colors signify higher values.
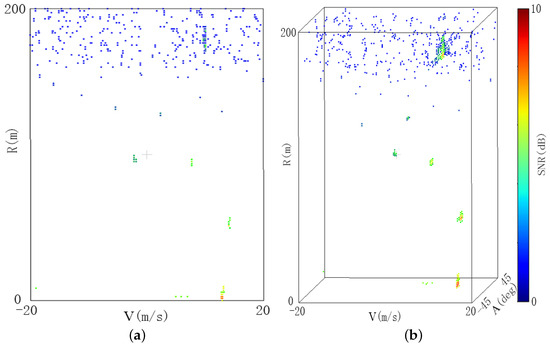
Figure 5.
Visualization of point clouds. (a) Visualization of point clouds corresponding to the RV spectrogram; (b) 4D RVA-SNR point clouds.
In contrast to RV spectrogram data, manually labeling each point within the extensive mmWave radar point cloud data proves highly costly. To solve this problem, we label radar point cloud data by analyzing inter-frame correlation. Specifically, we leverage the correlation between frames in radar point cloud data to build a correlation matrix. Points exhibiting significant correlation across multiple frames are identified as target points, while those lacking such correlation are categorized as clutter points. This method enables us to enhance the precision and dependability of target detection by accurately discerning between target and clutter points. Figure 6a illustrates the 3D bounding box of the vehicle target, while Figure 6b displays point labels in the 4D radar point clouds, where the red dots signify the target, whereas the blue dots represent clutter. This integrated methodology significantly diminishes the time and effort required for labeling.
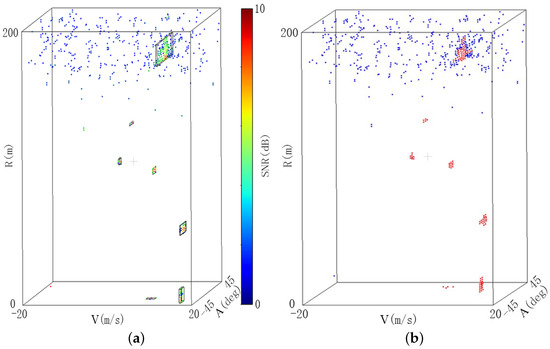
Figure 6.
Visualization of 4D radar point cloud label annotation. (a) The 3D bounding box of the vehicle target. (b) Points labels in 4D radar point clouds.
However, it is worth noting that in some cases, the SNR values of certain clutter points may surpass that of the target points. Consequently, relying solely on straightforward signal processing methods, like the CFAR detection algorithm, may not suffice for effectively distinguishing between clutter and target points. In addition, in the fleet scenes, such as Scene I and Scene II, the radar signal often undergoes multiple reflections between vehicles. This complicates the distinction between clutter points and vehicle target points, presenting a challenge for conventional detection algorithms.
4.3. Vehicle Detection Scheme
Given these challenges and the requirements to achieve more accurate and detailed target detection within mmWave radar point clouds, an effective vehicle target detection method is needed to address these issues. The PointNet algorithm is applied for its ability to effectively process point cloud data, particularly in 3D object classification and segmentation and lidar point cloud detection [40]. On this basis, this paper proposes a novel neural network architecture. This architecture is constructed to handle the 4D point cloud dataset and aims to classify and segment them across diverse scenes. Ultimately, the outcome shows the proposed scheme enhances the precision of vehicle target detection compared with benchmarks.
As depicted in Figure 7, the proposed scheme consists of three integral components: the transformer block, the scene classification block, and the vehicle detection block. The transformer block incorporates a self-attention layer, designed to streamline dimensionality reduction while expediting linear projection and residual connections. Input data comprise a set of six-channel vectors, each pair consisting of . The transformer block is crucial in fostering information exchange among local feature vectors within the point cloud data. This process generates new feature vectors for all points, significantly enriching the interconnections between each point.
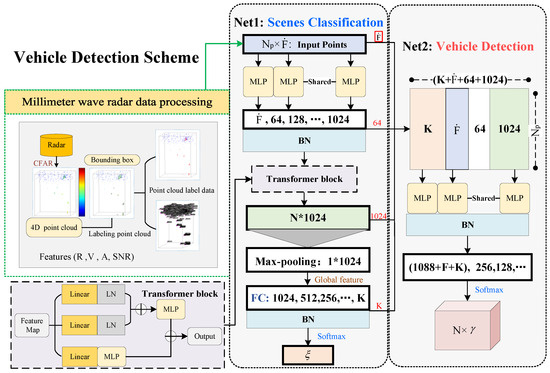
Figure 7.
Framework of the vehicle detection scheme.
The proposed scheme takes 4D mmWave radar point cloud data as the input , where is the maximum number of point clouds in a sample is the point cloud sample, and is the 4D features of point cloud data. In the scene classification block, the multiple multi-layer perceptrons (MLPs) and a maximum pooling layer (MP) are employed to obtain the global feature of sample . Initially, we augment the dimensionality of the point cloud data by passing it through multiple MLP layers and using the batch normalization (BN) layer to prevent overfitting. This process aims to encapsulate as much information as possible for all points within the current sample, which can be written by
where means the input or , is the network output after the first dimension expansion, is the first MLP operation, is the first BN operation, and is the Relu activation function. Then, the subsequent dimension expansion of the point cloud can be represented by
where n represents the number of expansions in dimensionality. Subsequently, the transformer block operation is employed to augment the exchange of information among local feature vectors within the point cloud data sample and obtain .
Subsequently, we utilize a max-pooling layer operation to extract global features from the point cloud data, which is denoted by
where is a one-dimensional vector.
Finally, we employ multiple fully connected (FC) layers and BN layers to integrate and compress features of the point cloud by connecting them to neurons, which is calculated by
where means the fully connected operation, and scene classification accurate probability can be calculated by the softmax function, which is written by
where K is the number of scene categories, means a K-dimensional vector, , and .
For the vehicle detection task, the original features of the point cloud , the initial 64-dimensional expanded features , global features , and the scene classification count are amalgamated to enrich the representation capacity of the point cloud data, which is denoted by
This fusion of feature information from diverse levels aims to capture the local and global information within point clouds more effectively, thereby enhancing the accuracy and resilience of detection tasks.
Since the cascaded feature constitutes a high-dimensional tensor, the multiple MLP layers are employed to effectively reduce the dimensionality of the vector by managing the number of neurons, which can be represented by
Then, the output layer employs the softmax function to compute the probability distribution of each point belonging to various categories, which can be calculated by
where means the prediction probability of the vehicle detection block for the clutter points, is the prediction probability of the vehicle detection block for the vehicle points, and is the j-th point in the point cloud data sample .
4.4. Loss Function and Algorithm Design
The loss function for the proposed vehicle target detection scheme involves both a scene classification task and a vehicle detection task. The loss function for the overall target detection component can be formulated as
where is the loss function of the feature transformation matrix, the feature transformation matrix enables the transformation of point cloud data within local coordinate systems, allowing the network to capture the local features of point cloud data more effectively. is the identity matrix, and is the characteristic alignment matrix. The two losses are weighted by their corresponding parameters and . represents the loss associated with scene classification, and is weighted by the corresponding parameter . is calculated by
where is the sample size of the input, and corresponds to the true label of the i-th sample. represents the probability that the i-th sample belongs to the j-th category as predicted.
The optimization of the loss function is not always directly reflected in the final performance of the model. To fully evaluate the performance of our method, we used two widely recognized evaluation metrics: Mean Average Precision (mAP) and Mean Intersection over Union (mIOU). mAP is a measure of the performance of the object detection model, which takes into account the accuracy and recall rate, which can be calculated by
where is the number of categories, is the area under the Precision–Recall curve for a specific class, which can be calculated by , where precision , recall , is true positives, means false positives, and denotes false negatives.
mIOU is a metric that evaluates the performance of the segmentation task, and it measures the consistency between the predicted segmentation and the real segmentation. It can be denoted as
where is the IOU for class i. For each point in a point cloud, the network predicts a class label. The IoU for each class is calculated as .
By combining mAP and mIOU, we can evaluate the performance from different perspectives. The proposed vehicle-detection algorithm PTDN is summarized in Algorithm 1.
Algorithm 1 Vehicle Detection Scheme Based on 4D Radar Point Cloud Data |
Input: Six-channel 4D point cloud data sample with points , each point is represented by coordinate and features , number of scene classes K, total epoch number , etc.
Output: Predicted scene classfication probabilities and predicted vehicle detection probabilities . |
5. Experimental Results
This paper focuses on a search-deciding alternation procedure, where the system model encompasses both radar sensing and communication components. The experimentation involves scene classification, vehicle detection, and communication performance, and the scene with radar point clouds consists of approximately 300 points. The scenes include up to 10 vehicles, with small vehicles typically represented by around 10 points each and larger vehicles by approximately 30 points.
The training and testing sets are randomly selected from the radar point cloud dataset in different vehicle scenes to ensure that these datasets can fully cover the scenes. The training dataset is used to train the network model, and the test data are used to display the generalization ability of the trained model. The testing dataset is completely disjoint with the training dataset. In total, 80.62% of the radar point cloud data are used for the training of the network, and 19.37% are used for testing.
The proposed methods are conducted by Python -based machine learning frameworks like PyTorch. The simulation runs on an Intel(R) Core(TM) i9-10900K CPU @3.7 GHz and an NVIDIA GeForce RTX 3080. The network model architecture consists of several layers, including multiple transformer encoder layers with eight attention heads per layer, a hidden dimension of 512 units, and a feedforward network with 1024 units. The initial learning rate for the network is set to , and the batch size is 32. For both scene classification and vehicle detection tasks, we conduct 200 iterations (epochs). In addition, a heuristic method is used to select the multi-task loss weights and . In the experiment part of this paper, the weight parameter of the vehicle target is set to , and the weight parameter of the clutter point will be set to . The experiment is divided into scene classification, vehicle detection, and communication resource allocation.
5.1. Scene Classification Results
This paper utilizes the widely used RV spectrogram as input for the YOLO algorithm, which has demonstrated strong performance in radar spectrogram detection. After vehicle detection processing, a threshold judgment method is applied to ascertain the distance between each target, and based on threshold , the scene type is determined. The features are employed for the four-channel PointNet algorithm, and the features are used as the input for the six-channel PointNet and the proposed scheme. The above methods are employed to classify the scene following the equal iterations. As illustrated in Figure 8, it is evident that both during training and testing, the accuracy of the proposed scheme exhibits a consistent upward trend, while the loss function value steadily decreases, ultimately converging, which indicates the convergence of the proposed algorithm.
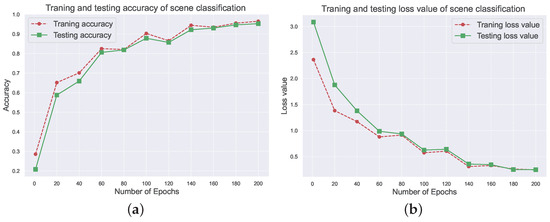
Figure 8.
Scene classification. (a) Training and testing accuracy of scene classification. (b) Training and testing loss value of scene classification.
For scenario classification, we use YOLO, VoxelNet [41], PointNet, and PointPillars [42] as our benchmark experiments, respectively. The scene classification results of the proposed scheme PTDN and the benchmark are shown in Table 1. Comparatively, our scheme attains a final testing accuracy of , with a mIOU value of 0.9223. Notably, higher accuracy corresponds to higher values of mAP and mIOU. Hence, the proposed scheme exhibits competitive performance in the scene classification experiments.

Table 1.
Scene classification results of our scheme and benchmarks.
5.2. Vehicle Detection Results
Following the scene classification experiment, a scene is randomly chosen for the vehicle detection experiment. During this experiment, we amalgamate the initial features or of the mmWave radar point cloud data with the distinctive global features of the selected scene. This fusion of features can extract the relative relationships between each point within the same data sample, thereby enhancing vehicle detection.
5.2.1. Scene I
Scene I comprises a multitude of vehicle formations, showcasing diverse vehicle models, with the distance between vehicle targets and the mmWave radar distributed from far to near.
As depicted in Figure 9a,b, the training and testing accuracy demonstrate a consistent upward trend and ultimately reach 95.45% and 93.46%, while the training and testing loss function values exhibit a downward trend. However, notable fluctuations are observed, which can be attributed to the complexity of the scenario. Figure 9c illustrates the detected vehicle points and clutter points in Scene I, with green points representing vehicles and blue points denoting the clutter points. There is an overlap between the vehicle and clutter points, significantly impacting the accuracy of vehicle target detection.

Figure 9.
Scene I vehicle detection results. (a) Training and testing accuracy of Scene I. (b) Training and testing loss value of Scene I. (c) Visualization of the vehicle detection results in Scene I.
5.2.2. Scene II
Scene II constitutes a mixed setting where individual vehicles and vehicle formations coexist, encompassing various vehicle types. Vehicle targets are distributed from far to near radar.
As shown in Figure 10a,b, the training and testing accuracy demonstrate a consistent upward trend and ultimately reach 96.59% and 95.57%, while the training and testing loss function values exhibit a downward trend. In comparison to Scene I, the Scene II complexity is lower, and it is evident that the accuracy and loss function curves exhibit fewer fluctuations. Figure 10c corroborates this observation by presenting the absence of overlap between vehicle and clutter points. However, in Scene II, the presence of a convoy leads to high similarity and interference between certain points among vehicles, thus hindering vehicle differentiation.

Figure 10.
Scene II vehicle detection results. (a) Training and testing accuracy of Scene II. (b) Training and testing loss value of Scene II. (c) Visualization of the vehicle detection results in Scene II.
5.2.3. Scene III
Scene III represents the simplest scenario, consisting solely of individual vehicles of various types. There is no vehicle fleet, and the distance between each vehicle target and radar varies from far to near.
As depicted in Figure 11a,b, throughout the training and testing phases in Scene III, there is a consistent enhancement observed in the rise in detection accuracy and the reduction in loss function values; and detection accuracy ultimately reaches 98.05% and 97.85%. Compared with the preceding scenes, Scene III demonstrates notably improved detection accuracy and reduced fluctuations in loss function values during training and testing. This improvement can be attributed to the favorable conditions present in Scene III, which contribute to a more stable training process. Notably, the complexity of Scene III is lower than that of Scene I and Scene II, with no overlap between vehicle and clutter points, nor interference among vehicle points themselves, as shown in Figure 11c. Consequently, the detection accuracy of Scene III surpasses that of the previous scenes, while the loss function value is minimized.

Figure 11.
Scene III vehicle detection results. (a) Training and testing accuracy of Scene III. (b) Training and testing loss value of Scene III. (c) Visualization of the vehicle detection results in Scene III.
To assess the vehicle detection performance of the proposed scheme, this paper selects the four-channel and six-channel traditional PointNet algorithms as benchmarks, respectively. As illustrated in Figure 12a,b, the proposed scheme exhibits the highest vehicle detection accuracy and mIOU values across all three scenes. In addition, to illustrate the performance of the proposed algorithm, we conduct additional statistical analyses to complement our experimental results, which include receiver operating characteristic (ROC) curves. As shown in Figure 13, we choose the more complex Scene I for evaluation. The ROC curve of the proposed algorithm consistently stays above the other curves, indicating a higher true positive rate at various false positive rates. This means the proposed algorithm can better identify positive cases while maintaining a lower rate of false positives. The area under the ROC curve (AUC) for the proposed algorithm is presumably higher, which measures the model’s ability to distinguish between positive and negative cases. A higher AUC implies that the model has a better predictive performance.
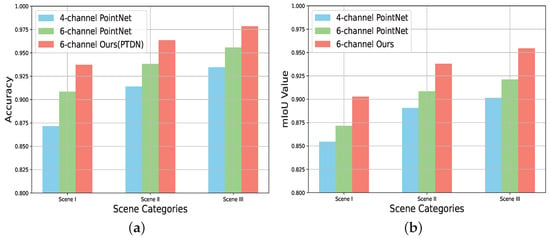
Figure 12.
Results of various models in various scenes. (a) Testing accuracy results of three scenes. (b) The mIoU values of three scenes.
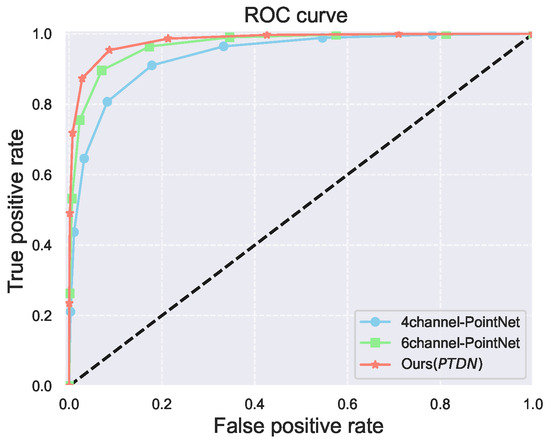
Figure 13.
ROC curves for the proposed algorithm and benchmarks in Scene I.
In summary, an advanced scheme leveraging 4D mmWave radar point cloud data is introduced in this paper. The design of this comparative framework not only underscores the benefits of utilizing point cloud data but also validates the competitive performance of the proposed scheme. Compared to the benchmarks, the proposed scheme achieves competitive performance enhancements, reports acceptable detection accuracy, and achieves an inference time of 21.37 ms, demonstrating its effectiveness.
5.3. Communication Performance
The communication experiments examine the communication performance achieved by the proposed vehicle detection scheme across a three-vehicle scene, the distances from the three vehicles to BS are 100 m, 132 m, and 204 m, respectively, as shown in Figure 3. The Equation (24) is used to calculate the proposed optimization problem (23) wherein power allocation is conducted for three vehicle targets under the constraint of the constant total transmission power W. The outcomes of the power allocation process are depicted in Figure 14a, the power levels of the three vehicles are 2.24 W, 1.91 W, and 0.85 W, respectively, and the water level value is 2.676 W. Specifically, we analyze the power level allocation and channel capacity achieved by the proposed scheme and compare them with the benchmarks. This evaluation provides insights into the overall effectiveness of the proposed scheme in enhancing detection accuracy and communication performance.
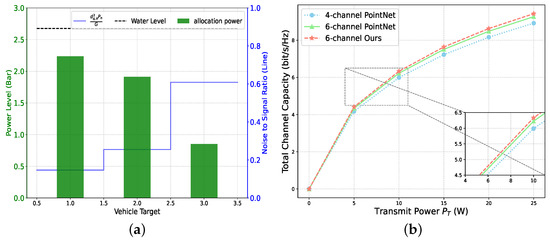
Figure 14.
(a) The power level of different vehicle targets. (b) The total channel capacity versus the total transmit power .
After acquiring the detection probability derived from the proposed vehicle detection scheme, optimizing power allocation with a fixed detection probability can maximize channel capacity. As shown in Figure 14b, it becomes evident that our vehicle detection scheme optimally enhances channel capacity under various transmission power levels, signifying that higher detection accuracy correlates with superior communication performance.
Furthermore, the experiments on the total channel capacity across varying vehicle detection probabilities are conducted, showcasing the overall channel capacity enhancements attributed to the proposed vehicle detection scheme and the benchmark across three distinct scenes. As depicted in Figure 15, the proposed vehicle detection scheme exhibits the most significant communication performance gains among the three scenes and achieves the highest total channel capacity.
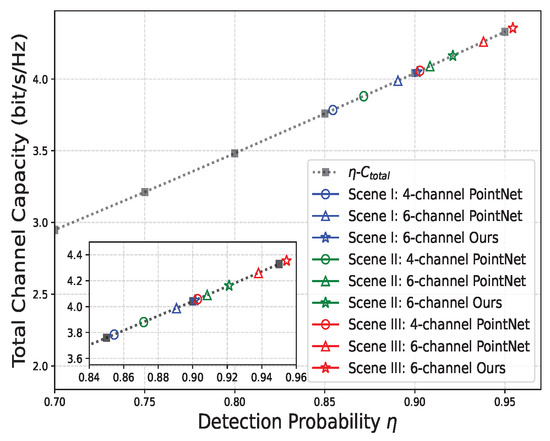
Figure 15.
The total channel capacity versus the detection probability under the total transmit power W.
6. Conclusions
A searching–deciding scheme for an alternation radar-communication (radar-comm) system is proposed to enhance traffic safety and efficiency through real-time interaction between vehicles and roads. We first analyze the channel capacity for the searching–deciding model and conclude that the larger detection probability leads to superior communication performance. Then, we process the echo data from real-world mmWave radar into 4D point cloud datasets, which clearly describe the vehicle features and then improve vehicle detection performance. The proposed vehicle detection scheme can accurately classify various scenes and detect vehicle targets based on deep learning methods. Extensive experiments on collected real-world datasets demonstrate that the proposed scheme outperforms benchmarks in terms of vehicle detection probability and channel capacity. In future work, we will investigate advanced vehicle detection and signal processing techniques for adverse weather conditions, such as rain and snow.
Author Contributions
L.C., K.L., X.W. and Z.Z. developed the theory and system model. L.C., K.L., X.W., K.L. and Z.Z. performed and analyzed the experimental results. L.C., Z.Z., K.L., Q.G. and X.W. wrote and edited the paper. X.W. financially supports for the project leading to this publication. All authors have read and agreed to the published version of the manuscript.
Funding
This work was supported by the National Key Research and Development Program of China under Grant No. 2021YFB1600503, the National Nature Science Foundation of China under Grant No. U2233216, and the Postdoctoral Science Foundation of China under Grant Number GZC20242161.
Data Availability Statement
The data presented in this study are available upon request from the corresponding author. The data are not publicly available due to privacy.
Conflicts of Interest
The authors declare no conflict of interest.
Abbreviations
The following abbreviations are used in this manuscript:
| ISAC | Integrated sensing and communication |
| mmWave | millimeter-wave |
| BS | base station |
| SNR | signal-to-noise ratio |
| RCNN | region-based convolutional neural networks |
| YOLO | you only look once |
| RPC | radar point cloud |
| VPC | virtual point cloud |
| RBFGS | Riemannian Broyden-Fletcher-Goldfarb-Shanno |
| HIM | hybrid index modulation |
| FFT | fast Fourier transforms |
| ICSI | interference channel state information |
| MIMO | multiple-input multiple-output |
| DFRC | dual functional radar-communication |
| FMCW | frequency-modulated continuous waveforms |
| CFAR | constant false alarm rate |
| mAP | mean average precision |
| mIOU | mean intersection over union |
Appendix A
For the optimization problem (23), we consider the Lagrangian function, which can be denoted as
where is the Lagrangian multiplier. The Karush-Kuhn-Tucker condition for optimal power allocation is given by
When , we can obtain
Then, we can derive the expression for the optimal power allocation , which can be written by
where we define , which means to select the maximum value between p and 0. References
References
- Wang, Y.; Cao, Y.; Yeo, T.-S.; Cheng, Y.; Zhang, Y. Sparse Reconstruction-Based Joint Signal Processing for MIMO-OFDM-IM Integrated Radar and Communication Systems. Remote Sens. 2024, 16, 1773. [Google Scholar] [CrossRef]
- Wei, W.; Shen, J.; Telikani, A.; Fahmideh, M.; Gao, W. Feasibility Analysis of Data Transmission in Partially Damaged IoT Networks of Vehicles. IEEE Trans. Intell. Transp. Syst. 2023, 24, 4577–4588. [Google Scholar] [CrossRef]
- Ngo, H.; Fang, H.; Wang, H. Cooperative Perception With V2V Communication for Autonomous Vehicles. IEEE Trans. Veh. Technol. 2023, 72, 11122–11131. [Google Scholar] [CrossRef]
- Liu, F.; Cui, Y.; Masouros, C.; Xu, J.; Han, T.X.; Eldar, Y.C.; Buzzi, S. Integrated Sensing and Communications: Toward Dual-Functional Wireless Networks for 6G and Beyond. IEEE J. Sel. Areas Commun. 2022, 40, 1728–1767. [Google Scholar] [CrossRef]
- Liu, F.; Masouros, C.; Li, A.; Sun, H.; Hanzo, L. MU-MIMO Communications With MIMO Radar: From Co-Existence to Joint Transmission. IEEE Trans. Wirel. Commun. 2018, 17, 2755–2770. [Google Scholar] [CrossRef]
- Li, J.; Huang, X.; Zhan, J. High-Precision Motion Detection and Tracking Based on Point Cloud Registration and Radius Search. IEEE Trans. Intell. Transp. Syst. 2023, 24, 6322–6335. [Google Scholar] [CrossRef]
- Wang, W.; Xia, F.; Nie, H.; Chen, Z.; Gong, Z.; Kong, X.; Wei, W. Vehicle Trajectory Clustering Based on Dynamic Representation Learning of Internet of Vehicles. IEEE Trans. Intell. Transp. Syst. 2021, 22, 3567–3576. [Google Scholar] [CrossRef]
- Girshick, R. Fast R-CNN. In Proceedings of the 2015 IEEE International Conference on Computer Vision (ICCV), Santiago, Chile, 7–13 December 2015; pp. 1440–1448. [Google Scholar]
- Ren, S.; He, K.; Girshick, R.; Sun, J. Faster R-CNN: Towards Real-Time Object Detection with Region Proposal Networks. IEEE Trans. Pattern Anal. Mach. Intell. 2017, 39, 1137–1149. [Google Scholar] [CrossRef]
- He, K.; Gkioxari, G.; Dollár, P.; Girshick, R. Mask R-CNN. In Proceedings of the 2017 IEEE International Conference on Computer Vision (ICCV), Venice, Italy, 22–29 October 2017; pp. 2980–2988. [Google Scholar]
- Redmon, J.; Divvala, S.; Girshick, R.; Farhadi, A. You Only Look Once: Unified, Real-Time Object Detection. In Proceedings of the 2016 IEEE Conference on Computer Vision and Pattern Recognition (CVPR), Las Vegas, NV, USA, 27–30 June 2016; pp. 779–788. [Google Scholar]
- Zhan, J.; Liu, J.; Wu, Y.; Guo, C. Multi-Task Visual Perception for Object Detection and Semantic Segmentation in Intelligent Driving. Remote Sens. 2024, 16, 1774. [Google Scholar] [CrossRef]
- Li, X.; Wu, J. Extracting High-Precision Vehicle Motion Data from Unmanned Aerial Vehicle Video Captured under Various Weather Conditions. Remote Sens. 2022, 14, 5513. [Google Scholar] [CrossRef]
- Gao, Z.; Wan, Z.; Zheng, D.; Tan, S.; Masouros, C.; Ng, D.W.K.; Chen, S. Integrated Sensing and Communication With mmWave Massive MIMO: A Compressed Sampling Perspective. IEEE Trans. Wirel. Commun. 2023, 22, 1745–1762. [Google Scholar] [CrossRef]
- Cheng, Y.; Su, J.; Jiang, M.; Liu, Y. A Novel Radar Point Cloud Generation Method for Robot Environment Perception. IEEE Trans. Robot. 2022, 38, 3754–3773. [Google Scholar] [CrossRef]
- Kim, J.; Khang, S.; Choi, S.; Eo, M.; Jeon, J. Implementation of MIMO Radar-Based Point Cloud Images for Environmental Recognition of Unmanned Vehicles and Its Application. Remote Sens. 2024, 16, 1733. [Google Scholar] [CrossRef]
- Montañez, O.J.; Suarez, M.J.; Fernez, E.A. Application of Data Sensor Fusion Using Extended Kalman Filter Algorithm for Identification and Tracking of Moving Targets from LiDAR–Radar Data. Remote Sens. 2023, 15, 3396. [Google Scholar] [CrossRef]
- Chen, X.; Liu, K.; Zhang, Z. A PointNet-Based CFAR Detection Method for Radar Target Detection in Sea Clutter. IEEE Geosci. Remote Sens. Lett. 2024, 21, 3502305. [Google Scholar] [CrossRef]
- Peng, Y.; Wu, Y.; Shen, C.; Xu, H.; Li, J. Detection Performance Analysis of Marine Wind by Lidar and Radar under All-Weather Conditions. Remote Sens. 2024, 16, 2212. [Google Scholar] [CrossRef]
- Klinefelter, E.; Nanzer, J.A. Automotive Velocity Sensing Using Millimeter-Wave Interferometric Radar. IEEE Trans. Microw. Theory Tech. 2021, 69, 1096–1104. [Google Scholar] [CrossRef]
- Akter, R.; Doan, V.-S.; Lee, J.-M.; Kim, D.-S. CNN-SSDI: Convolution neural network inspired surveillance system for UAVs detection and identification. Comput. Netw. 2021, 201, 108519. [Google Scholar] [CrossRef]
- Wang, Y.; Jiang, Z.; Li, Y.; Hwang, J.N.; Liu, H. RODNet: A Real-Time Radar Object Detection Network Cross-Supervised by Camera-Radar Fused Object 3D Localization. IEEE J. Sel. Top. Signal Process. 2021, 15, 954–967. [Google Scholar] [CrossRef]
- Rosu, F. Dimension Compressed CFAR for Massive MIMO Radar. IEEE Geosci. Remote Sens. Lett. 2023, 20, 1–5. [Google Scholar] [CrossRef]
- Zhang, Z.; Chang, Q.; Xing, J.; Chen, L. Deep-learning methods for integrated sensing and communication in vehicular networks. Veh. Commun. 2023, 40, 100574. [Google Scholar] [CrossRef]
- Liu, S.; Cao, Y.; Yeo, T.-S.; Wu, W.; Liu, Y. Adaptive Clutter Suppression in Randomized Stepped-Frequency Radar. IEEE Trans. Aerosp. Electron. Syst. 2021, 57, 1317–1333. [Google Scholar] [CrossRef]
- Cao, Z.; Mei, G.; Guo, X.; Wang, G. Virteach: MmWave Radar Point Cloud Based Pose Estimation with Virtual Data as a Teacher. IEEE Internet Things J. 2024, 11, 17615–17628. [Google Scholar] [CrossRef]
- Chen, L.; Liu, K.; Zhang, Z.; Li, B. Beam Selection and Power Allocation: Using Deep Learning for Sensing-Assisted Communication. IEEE Wirel. Commun. Lett. 2024, 13, 323–327. [Google Scholar] [CrossRef]
- Du, Y.; Liu, Y.; Han, K.; Jiang, J.; Wang, W.; Chen, L. Multi-User and Multi-Target Dual-Function Radar-Communication Waveform Design: Multi-Fold Performance Tradeoffs. IEEE Trans. Green Commun. Netw. 2023, 7, 483–496. [Google Scholar] [CrossRef]
- Liu, R.; Li, M.; Liu, Q.; Swindlehurst, A.L. Dual-Functional Radar-Communication Waveform Design: A Symbol-Level Precoding Approach. IEEE J. Sel. Top. Signal Process. 2021, 15, 1316–1331. [Google Scholar] [CrossRef]
- Ma, D.; Shlezinger, N.; Huang, T.; Liu, Y.; Eldar, Y.C. FRAC: FMCW-Based Joint Radar-Communications System Via Index Modulation. IEEE J. Sel. Top. Signal Process. 2021, 15, 1348–1364. [Google Scholar] [CrossRef]
- Xu, J.; Wang, X.; Aboutanios, E.; Cui, G. Hybrid Index Modulation for Dual-Functional Radar Communications Systems. IEEE Trans. Veh. Technol. 2023, 72, 3186–3200. [Google Scholar] [CrossRef]
- Temiz, M.; Peters, N.J.; Horne, C.; Ritchie, M.A.; Masouros, C. Radar-Centric ISAC Through Index Modulation: Over-the-air Experimentation and Trade-offs. In Proceedings of the 2023 IEEE Radar Conference (RadarConf23), San Antonio, TX, USA, 1–5 May 2023; pp. 1–6. [Google Scholar]
- Zhang, R.; Shim, B.; Yuan, W.; Renzo, M.D.; Dang, X.; Wu, W. Integrated Sensing and Communication Waveform Design With Sparse Vector Coding: Low Sidelobes and Ultra Reliability. IEEE Trans. Veh. Technol. 2022, 71, 4489–4494. [Google Scholar] [CrossRef]
- Liu, F.; Garcia-Rodriguez, A.; Masouros, C.; Geraci, G. Interfering Channel Estimation in Radar-Cellular Coexistence: How Much Information Do We Need? IEEE Trans. Wirel. Commun. 2019, 18, 4238–4253. [Google Scholar] [CrossRef]
- Demirhan, U.; Alkhateeb, A. Radar Aided 6G Beam Prediction: Deep Learning Algorithms and Real-World Demonstration. In Proceedings of the 2022 IEEE Wireless Communications and Networking Conference (WCNC), Austin, TX, USA, 10–13 April 2022; pp. 2655–2660. [Google Scholar]
- Rojhani, N.; Passafiume, M.; Sadeghibakhi, M.; Collodi, G.; Cidronali, A. Model-Based Data Augmentation Applied to Deep Learning Networks for Classification of Micro-Doppler Signatures Using FMCW Radar. IEEE Trans. Microw. Theory Tech. 2023, 71, 2222–2236. [Google Scholar] [CrossRef]
- Patole, S.M.; Torlak, M.; Wang, D.; Ali, M. Automotive radars: A review of signal processing techniques. IEEE Signal Process. Mag. 2017, 34, 22–35. [Google Scholar] [CrossRef]
- Sun, S.; Petropulu, A.P.; Poor, H.V. MIMO Radar for Advanced Driver-Assistance Systems and Autonomous Driving: Advantages and Challenges. IEEE Signal Process. Mag. 2020, 37, 98–117. [Google Scholar] [CrossRef]
- Girshick, R.; Donahue, J.; Darrell, T.; Malik, J. Rich Feature Hierarchies for Accurate Object Detection and Semantic Segmentation. In Proceedings of the 2014 IEEE Conference on Computer Vision and Pattern Recognition, Columbus, OH, USA, 23–28 June 2014; pp. 580–587. [Google Scholar]
- Charles, R.Q.; Su, H.; Kaichun, M.; Guibas, L.J. PointNet: Deep Learning on Point Sets for 3D Classification and Segmentation. In Proceedings of the 2017 IEEE Conference on Computer Vision and Pattern Recognition (CVPR), Honolulu, HI, USA, 21–26 July 2017; pp. 77–85. [Google Scholar]
- Nobis, F.; Shafiei, E.; Karle, P.; Betz, J.; Lienkamp, M. Radar Voxel Fusion for 3D Object Detection. Appl. Sci. 2021, 11, 5598. [Google Scholar] [CrossRef]
- Xu, B.; Zhang, X.; Wang, L.; Hu, X.; Li, Z.; Pan, S.; Li, J.; Deng, Y. RPFA-Net: A 4D RaDAR Pillar Feature Attention Network for 3D Object Detection. In Proceedings of the 2021 IEEE International Intelligent Transportation Systems Conference (ITSC), Indianapolis, IN, USA, 19–22 September 2021; pp. 3061–3066. [Google Scholar] [CrossRef]
Disclaimer/Publisher’s Note: The statements, opinions and data contained in all publications are solely those of the individual author(s) and contributor(s) and not of MDPI and/or the editor(s). MDPI and/or the editor(s) disclaim responsibility for any injury to people or property resulting from any ideas, methods, instructions or products referred to in the content. |
© 2024 by the authors. Licensee MDPI, Basel, Switzerland. This article is an open access article distributed under the terms and conditions of the Creative Commons Attribution (CC BY) license (https://creativecommons.org/licenses/by/4.0/).