Abstract
The Meijiayan landslide in Pengshui County within Chongqing City is a medium-scale soil landslide triggered by the excavation of roadbeds. To delve into the influencing factors and assess the stability of this landslide, it is crucial to meticulously map the subterranean geological framework of the area. Such an analysis lays the groundwork for evaluating and mitigating the risks of future landslide instabilities. In this context, the semi-airborne transient electromagnetic method (SATEM), which is complemented by a receiving system mounted on an aerial platform, stands out as an innovative geophysical exploration technique. This method is adept at conducting swift measurements across complex terrains, making it particularly valuable for areas prone to such geological events. This paper presents the utilization of a cutting-edge loop source SATEM system, which was operationalized via a rotor-based unmanned aerial vehicle (UAV). The system was employed to conduct shallow geological structure detection experiments on the Meijiayan landslide. The SATEM detection outcomes have unveiled fluctuations in the electrical distribution across the upper strata, which are indicative of the subsurface geological boundaries, faults, and areas potentially rich in water within the landslide region. These discoveries affirm the viability of utilizing loop source SATEM for the identification of shallow geological structures in regions susceptible to landslides. The findings indicate that while the landslide is currently in a stable condition, it poses a significant risk of movement, especially during the rainy season, with the potential for landslides to be exacerbated by extreme or sustained rainfall events.
1. Introduction
Geological disasters are rock and soil movement events that significantly disrupt human life, property, and the living environment on Earth’s surface due to natural or human factors [1,2]. Their causes are dual-natured, involving natural evolution and human-induced factors [3]. With the increasingly intimate interaction between human engineering, economic activities, and the natural environment, geological disasters have become more frequent [3,4,5]. The sudden and destructive occurrence of geological disasters has become an important factor restricting social and economic development and affecting people’s well-being [6,7,8]. According to incomplete statistics, over the past 10 years, China has experienced an average of over ten thousand geological disasters each year, resulting in over a hundred deaths and missing persons and economic losses amounting to billions of Yuan [3]. In some areas, geological disasters have severely impacted local economic development. Landslides are one of the most widespread, serious, and complex geological phenomena in mountainous deformations and pose the greatest threat of geological disasters [9,10].
Relying solely on drilling methods for landslide investigations in complex mountainous terrains is inefficient, costly, and not feasible on a large scale. In recent years, geophysical exploration methods have made significant strides in developing exploration instruments, as well as in digital signal acquisition, processing, and analysis techniques [11,12,13,14,15]. The signal-to-noise ratio and resolution have gradually improved, and the application fields are continuously expanding. Geophysical exploration methods have become an important means of investigating geological hazards and are widely recognized for their advantages, such as low cost, high efficiency, and intuitive results [16,17,18].
The seismic method, electrical method, and electromagnetic method are the main geophysical methods for detecting landslides, and these methods are often combined to detect the volume and internal structure of landslide bodies [19,20]. The reflection seismic method is effective for detecting shallow structures, sliding surface detection, three-dimensional structure detection, and the identification of saturated clay fault sliding surfaces [21,22,23]. Seismic refraction tomography (SRT) is another practical, non-destructive technique for determining the inner structure of landslides [19,24]. In addition, the micromotion exploration method is an effective method for detecting shallow structures. At present, research on extracting surface wave information from micromotion signals to obtain shallow crustal structures is also ongoing [25,26,27]. The main advantage of microseismic exploration compared to artificial seismic methods is that it does not require artificial seismic sources, making it suitable for densely populated, heavily trafficked urban areas and areas with strong interference. Electrical resistivity tomography (ERT) in the resistivity method is widely used in the detection of shallow structures. It combines the advantages of the electrical profiling method and the electrical sounding method while providing the characteristics of lateral and vertical electrical changes within a certain depth range underground and has high detection accuracy [28,29,30]. The ground transient electromagnetic method and its combined application with magnetic resonance sounding (MRS) are also used in the detection and monitoring of landslides [31]. It is sensitive to low-resistance bodies and has achieved good application results in the detection of sliding surfaces and water-containing structures. However, in the intricate landscape of mountainous regions characterized by rolling terrain or dense vegetation, traditional ground geophysical techniques often fall short of delivering the anticipated outcomes and can even prove impractical for field data acquisition. In contrast, airborne and semi-airborne electromagnetic methods emerge as the ideal approaches for detection in such challenging environments. [32,33,34].
At present, most airborne electromagnetic methods are based on fixed-wing aircraft or helicopters, which are more suitable for large-scale investigations, requiring expensive maintenance and dedicated airports [35,36,37,38]. The ATEM system based on rotor drones has not yet achieved full practicality in its data acquisition technology. Therefore, the semi-airborne electromagnetic method (SATEM) has gradually been applied to the detection of complex terrain areas in multiple fields by combining the advantages of ground-based large magnetic moment emissions and rapid aerial measurements [33,39,40]. SATEM is one of the electromagnetic exploration methods that lay the transmitting system on the ground surface, and the receiving system is mounted on an unmanned aerial vehicle (UAV). The advantages of the loop source SATEM include: First, the transmission loop is not constrained by grounding conditions, which ensures that lightweight instruments can generate significant magnetic moments. Second, it allows for the measurement of signal strength inside the loop. Third, the loop source facilitates control over the transmission waveform, utilizing short emission ramp time to capture more high-frequency components, which benefits shallow to medium-depth detection. Fourth, pure secondary field acquisition with aerial channel stacking allows for the acquisition of continuous data points; high-precision synchronization ensures earlier secondary field acquisition, capturing more shallow information. SATEM is a newly developed electromagnetic detection method that is currently a focal point of research in the geological exploration industry [33]. It features a strong emission magnetic moment, significant detection depth, high resolution, and a swift measurement speed. In areas of complex terrain, conventional surface geophysical methods encounter challenges in data collection, particularly in critical regions. SATEM, which is based on an unmanned aerial vehicle platform, effectively resolves the issue of efficiently acquiring surface geophysical technology in areas with complex topography. It significantly enhances the capability and level of unmanned, intelligent, deep, and high-precision rapid measurement. It is necessary to deploy transmitting sources on the ground to establish a field to excite the target geological body [41,42]. Although the efficiency of deploying a transmitting loop on the ground is the same as that of working on the ground, the main advantage of its efficiency is reflected in the fast acquisition of small point distances. Using landslide detection as an example, the deployment of a transmitting loop on the ground can be carried out in non-sliding areas that can be manually traversed. However, landslide areas are mostly characterized by loose soil with collapsed rock blocks mixed in, greatly reducing the efficiency of ground geophysical data collection and posing huge safety risks. The SATEM based on UAVs is not limited by terrain in the data collection process, with fast data collection speed and dense spacing between measurement points. Therefore, as a method that falls between airborne and ground geophysical methods, SATEM is an important component of the comprehensive geophysical exploration system.
There is currently no fast, reliable, economical, and applicable detection technology for areas with complex terrain or dense vegetation in mountainous regions, and reducing the detection blind zone for shallow exploration has always been a challenge for electromagnetic detection methods. In order to conduct research on rapid detection technology for the shallow electrical structure of landslides in mountainous areas with complex terrain, a semi-airborne transient electromagnetic method with a loop source was selected to conduct a geophysical exploration experiment at the Meijiayan landslide in Pengshui County to assess the practical application effect of this method in shallow soil-rock type landslides. Some measures have been implemented in field data collection and instrument equipment to reduce the blind zone in shallow exploration. This study will provide an important detection method for the investigation of shallow geological disasters represented by landslides. In addition, the areal detection results of the semi-airborne transient electromagnetic method can also provide important references for the formulation of geological disaster management strategies.
2. Methodology
SATEM is a configuration that transmits from the ground and receives in the air [43,44,45,46,47]. As shown in Figure 1, the loop source SATEM utilizes a loop to transmit on the ground and quickly measures the secondary field generated in the underground target geological body using a receiving system mounted on a drone flight platform [48,49]. An ungrounded loop uses a bipolar pulse current to generate an excitation electromagnetic field. This electromagnetic field induces eddy currents in the conductive geological body. When the transmission loop’s pulse current drops from the peak to zero, the primary field vanishes immediately, whereas the induced eddy currents in the underground conductor persist momentarily. This persistence is a transient process, and its characteristics are related to the underground electrical structure. The better the conductivity of a conductor, the lower the heat loss from the eddy currents and the longer the transient process will last. This transient eddy current process generates a corresponding transient magnetic field in space known as a secondary transient electromagnetic field or anomalous field. During the pulse current’s off-time, transient electromagnetic fields can be observed at different air positions. By studying the spatial and temporal characteristics of secondary transient electromagnetic fields, we can discover the presence of underground conductive geological bodies and determine their spatial distribution.
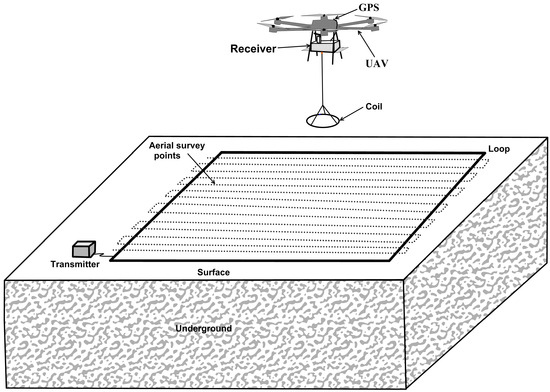
Figure 1.
Configuration of loop source SATEM.
As shown in Figure 2, the schematic diagram illustrates a dipole antenna placed on a horizontally layered, isotropic Earth’s surface. The Earth consists of n layers, each characterized by its resistivity (ρi) and thickness (hi). The transmitting source is a dipole antenna of length L positioned along the x direction at the Earth’s surface. The dipole antenna is excited by a harmonic current I. The coordinate origin O is located at the center of the dipole antenna, with the Z axis pointing downwards. Consider an arbitrary point M in the air, with its projection on the Earth’s surface at a distance R from the origin and an angle θ with respect to the Z axis.
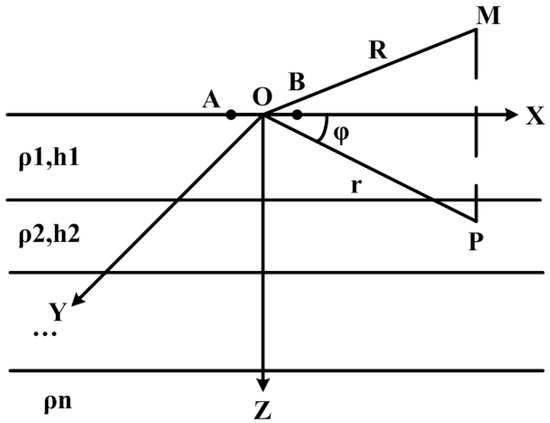
Figure 2.
Electric dipole on the surface of isotropy horizontally layered earth.
Similar to the case of a homogeneous Earth, we analyzed the symmetry of the electric vector potential generated by the dipole antenna, starting from the Helmholtz equation satisfied by the electric vector potential. By considering the boundary conditions satisfied by the electric vector potential at the Earth’s surface, along with the curl relationship between the magnetic field and the electric vector potential, we can obtain the magnetic field components generated by the horizontal electric dipole source in isotropic horizontally layered Earth at any arbitrary point in the air:
where , , I represents the current intensity measured in amperes, ds denotes the length of the electric dipole in meters,, is referred to as the wavenumber of the medium, represents the angular frequency with f as the frequency measured in hertz, μ stands for the permeability with units of H/m, typically taken as for vacuum permeability, σ is the conductivity of the medium, and ε is the permittivity of the medium. In the scenario of low-frequency conduction in dielectric media, neglecting displacement current, we have , .
It has been confirmed that when employing a step waveform as the transmission waveform for the time-domain electromagnetic method, there exists the following correspondence between the frequency-domain magnetic field and the time-domain magnetic field:
Here, p = z and p = r represent the vertical and horizontal components of the magnetic field, respectively, while H0p signifies the magnetic field corresponding to the DC component at zero frequency. The computation in the above equation can be achieved through sine and cosine transforms [50].
Especially for a homogeneous half-space, the response of the vertical component is given as follows [45]:
where t denotes time, r represents offset distance, Bz(t) signifies the vertical magnetic field, εz(t) represents the vertical induced voltage, , S denotes the effective area of the receiving coil, and stands for the probability integral.
In the case of a transmission line source, we approximate its electromagnetic response in this article by means of a finite summation. We partition the transmission line source into n dipoles along the transmission line and subsequently superimpose the fields generated by them, expressed as:
Here, represents the field generated by each small segment, which can be viewed as an electric dipole source.
In transient electromagnetic data processing, the method of defining an “apparent resistivity” is widely employed for its computational efficiency and unique outcomes [51,52]. This apparent resistivity definition is particularly suitable for initial interpretations and quality checks in practical tasks, providing a clearer and more intuitive description of underground resistivity compared to raw response data, thus holding significant practical value. Generally, the apparent resistivity represents the resistivity of a homogeneous half-space model that, under the same acquisition parameters, can generate responses identical to the observed data. Mathematically speaking, the apparent resistivity can be viewed as the inverse function of the varying resistivity in the electromagnetic response. However, due to the complexity of the Transient Electromagnetic (TEM) response function, it is almost theoretically impossible to find an explicit expression for its inverse function; it can only be represented in implicit form. To define and analyze the apparent resistivity of TEM responses, an iterative apparent resistivity definition is utilized here.
In general, the transient electromagnetic response on a homogeneous half-space can be simplified and expressed as:
Here, ε represents the transient electromagnetic response, X denotes the measurement point position, t represents the sampling time, ρ denotes the resistivity of the homogeneous half-space, W represents the transmission waveform parameters, L represents the transmission line geometric parameters, and g is the transient electromagnetic response function. By omitting the transient electromagnetic emission parameters and acquisition parameters, the expression of the transient electromagnetic response function can be further simplified as:
Once the inverse function of the above equation is obtained, the apparent resistivity corresponding to the transient electromagnetic response can be directly calculated. However, as mentioned earlier, the inverse function of the above equation cannot be explicitly expressed. To tackle this issue, an iterative approach is employed for inverse function determination. Let:
Thus, the problem of determining the inverse function is equivalent to solving the equation:
Assuming ρ(k) is an approximation of the zero point ρs of the response function g(ρ), a Taylor expansion is conducted around ρ(k) in the vicinity, neglecting higher-order terms above the second order, leading to the construction of the iterative format:
It has been theoretically proven that this iterative format converges linearly. After multiple iterations, the apparent resistivity ρs of the transient electromagnetic response can be obtained. This apparent resistivity definition applies equally to the early and late stages of the transient electromagnetic response, as well as to the near and far regions, referred to as the “full field apparent resistivity definition”.
3. Geological Setting
Chongqing is located in the upper reaches of the Yangtze River and the hinterland of the Three Gorges Reservoir Area, characterized by high mountains, steep slopes, barren land, severe soil erosion, and frequent natural disasters such as landslides, collapses, and mudslides. These pose a serious threat to the ecological security of the Yangtze River Basin and the safe operation of the Three Gorges Project [53,54,55,56]. Pengshui Miao and Tujia Autonomous County, located in the southeast of Chongqing at the confluence of the Wujiang and Yujiang rivers, is part of the Wuling Mountains. Pengshui County experiences over 300 types of geological disasters [57], with landslides being the most prevalent, accounting for about 60%. A significant proportion of these landslides are caused by human engineering activities. The Meijiayan landslide is situated near Zhangjiaba Village in the Pengshui Miao and Tujia Autonomous County, located in the southeastern part of Chongqing, China. The construction of Highway 38 in the newly developed areas of Pengshui County led to the sliding deformation of the cut soil slope on the northern side due to the roadbed excavation, culminating in a landslide mass with a lateral width of approximately 120 m and a longitudinal length of around 250 m within Zhangjiaba Village.
The research area features a complex terrain of mid- to low-elevation mountains that have undergone tectonic erosion. The exposed strata in the work area primarily consist of the Middle Triassic Badong Formation, along with Quaternary residual and colluvial slope layers and the Holocene artificial fill layers. The lithology is generally composed of muddy limestone, silty clay interbedded with fragmented stone layers, fragmented stones, and silty clay. The strata have a strike angle of 312–320° and a dip of 30–45°. The landslide area is situated near the core of the eastern wing of the Puzi syncline, with the syncline axis extending in a northeast–southwest direction.
The Meijiayan landslide is a medium-sized soil landslide with a longitudinal “n” shape on the plane (as depicted in Figure 3). It covers an area of approximately 2.24 × 10⁴ m2, with the main sliding direction at 104°. Additionally, groundwater is a significant factor in landslide formation as it can permeate and weaken the rock-soil matrix within the slide zone, reducing shear strength. Static and dynamic water pressure can augment the sliding force, potentially triggering sudden landslides or slope instability. However, the groundwater in landslide-prone areas is often discontinuously distributed in veins, pits, and bands, contrasting with the more uniformly layered water in terrace pebble layers. Consequently, detecting the favorable water-rich zones that form in landslide areas is also a primary objective.
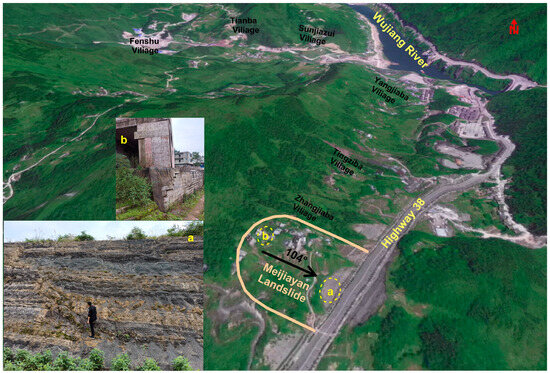
Figure 3.
Topography and landforms of the study area. (a) Landslide profile located at the foot of the slope; (b) Damaged buildings located at the top of the slope.
4. Field Data Acquisition
To detect the underground geological structure within the Meijiayan landslide area, a SATEM detection experiment was conducted. The field data collection utilized the DK-100 type loop source SATEM system, which was recently developed by the Institute of Geophysical and Geochemical Exploration.
Figure 4 illustrates the distribution of transmitting loops and aerial data collection points over the Meijiayan landslide, featuring a loop size of 200 m × 200 m. Given the extent of the landslide and the requirements for shallow detection, a lithium battery pack powered the transmitter, and voltage stabilization technology was applied to continuously adjust and ensure stable transmission voltage during the power supply process. The loop source for transmission negates the need for grounding within the transmission loop. The cable used in the loop has a resistance specification of about 3 Ω/km, resulting in a loop perimeter of approximately 860 m and an actual resistance of 2.6 Ω. Under these conditions, the transmitter’s power requirement is minimal. In this data collection exercise, a low-power transmitter was employed, capable of a maximum supply voltage of 36 V and a maximum current of 10 A. The transmission waveform is a bipolar square wave with a 50% duty cycle and a controllably linear ramp. During field measurements, the transmitting current was 8 A, achieving a magnetic moment of 32 × 104 A.m2. The transmitter was placed near the small path on the east side of the transmission loop, as indicated in Figure 4.
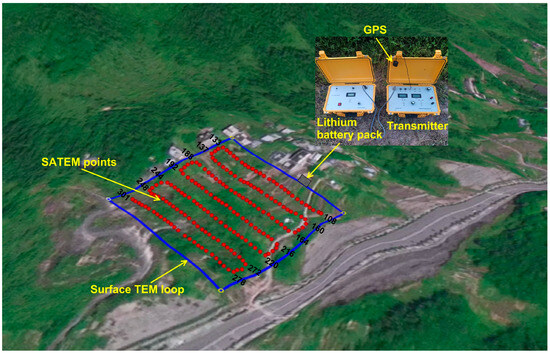
Figure 4.
Transmitting system and measuring points location of SATEM. The blue lines represent the transmitting loop laid on the surface, and the red dots represent the measuring points.
The receiving system comprises a rotary unmanned aerial vehicle (UAV) as the flight platform, a receiver, and an induction coil (as depicted in Figure 5). The receiver is mounted below the UAV, and the induction coil is connected via a cable and hangs beneath the drone (as illustrated in Figure 6). The onboard receiver employs an ARM9 core processor to manage control, sampling, processing, storage, transmission, and additional functions. With the use of a four-level programmable floating-point amplifier and an 18-bit, 500 kHz A/D converter, it ensures a wide dynamic range and precise conversion accuracy. The receiver’s sampling rate is 250 kHz with an input equivalent noise of 0.5 μV. This receiver collects the secondary field once the current is switched off. The aerial sensor, an induction coil depicted in Figure 5c, has a frequency of 100 kHz and an equivalent area of 3100 m2. Figure 6 captures a scene from the SATEM field measurements at the Meijiayan landslide, displaying damaged buildings amidst high-voltage and several other power lines. The surface of the landslide area is primarily composed of vegetable fields owned by local residents. During data collection, the drone’s actual flight altitude is maintained at 40 m to avoid interference from high-voltage lines and tall trees. The strategy for receiver acquisition involves real-time channel stacking and continuous point number collection. Upon completing a predetermined stacking cycle, a measurement point data block is created, and real-time GPS spatial position information is incorporated into this data block. The synchronization between the transmitter and aerial receiver utilizes both crystal and GPS. The high-precision GPS primarily serves to timestamp and record the spatial coordinates of the sensors. During fieldwork, the UAV travels at a speed of 3 m/s, with a stacking frequency set to 64 times and a collection timebase of 10 ms. The actual distance between adjacent measurement points is approximately 6 m.
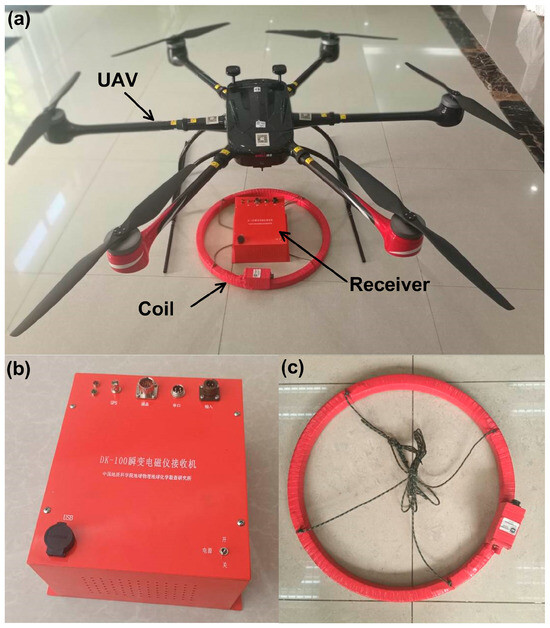
Figure 5.
Photos of SATEM aerial receiving system. (a). Receiving system; (b). Receiver; (c). Induction coil.
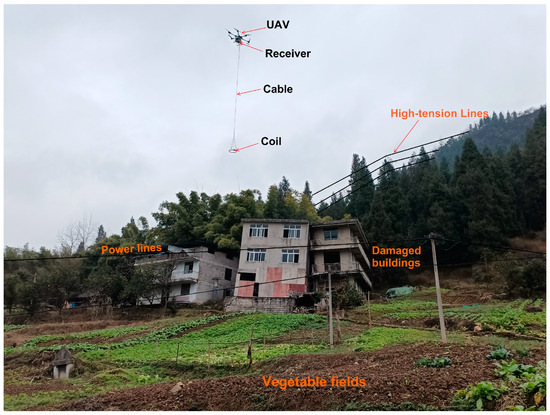
Figure 6.
SATEM field measurement photo on the Meijiayan landslide.
To meet the detection requirements for the shallow geological structure of typical soil-rock type landslides, comparative experiments were carried out using sensors with different frequency bands on the ground. At the same measurement point within the loop’s center, Crone PEM inductive sensors (10 K) and self-developed coils DK (30 K) and DK (100 K) were utilized for testing.
Figure 7 presents a comparative diagram of the measurement curves obtained from different sensors. Several similarities and differences are discernible in the figure. First, the PEM and DK receivers exhibit differences in the early time channels due to varying acquisition time windows, with the earliest channels being at 54 µs for the PEM and 14 µs for the DK, respectively. This discrepancy leads to some loss of early signals in the PEM curve. Second, the curve measured by the PEM sensor shows the lowest early response, while the curve measured by the DK (100 K) coil displays the strongest early response. This discrepancy can be attributed to the low-frequency sensors’ difficulty in capturing effective high-frequency signals. Third, in the middle and late time windows, the measurement curves of the three sensors show no significant differences and almost coincide. From this comparison, it is clear that the early signals captured by the DK (100 K) are more abundant and provide a better reflection of shallow information, making it more suitable for detecting shallow geological structures in landslides. Therefore, the DK (100 K) sensor was used for this landslide detection.
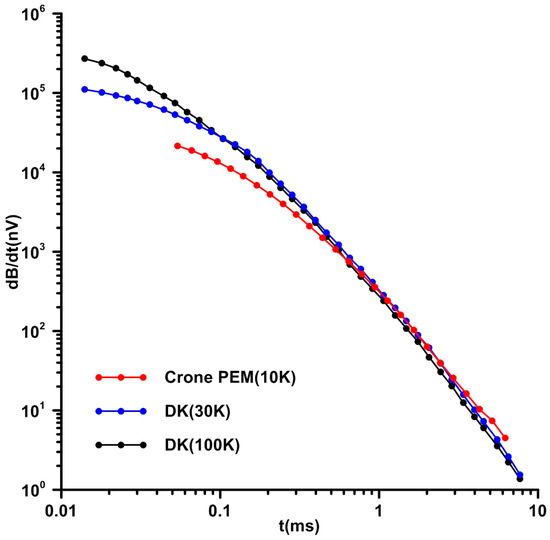
Figure 7.
Comparison of measured curves of sensors with different bandwidths.
5. Results
To obtain a comprehensive understanding of the actual effectiveness of detecting landslides using the loop source SATEM, this study selected survey lines 164–188 from the original data as a representative sample for comparative analysis. The locations of the survey points are depicted in Figure 4. Figure 8 displays the initial decay curves of points 164–188 on the Meijiayan landslide. Among these stations, 164 to 170 are situated at the landslide’s front edge, while stations 185 to 188 are at the rear edge, with the remaining stations positioned on the body of the landslide. The curves are plotted only for data captured before 1 ms because, beyond this point, the data encountered some interference, compromising the quality to an unacceptable level. The pre-1 ms curves are generally smooth, although some measurements exhibit fluctuations due to the proximity of high-voltage power lines.
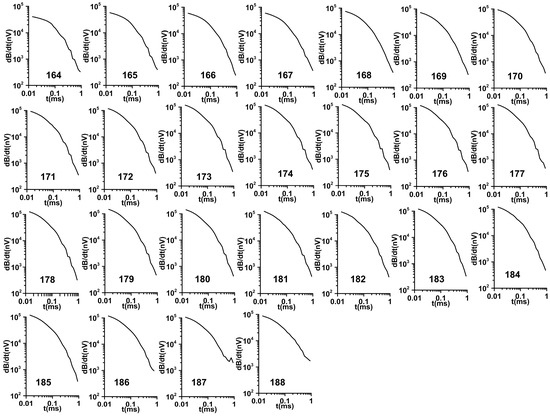
Figure 8.
Original decay curves of SATEM stations from 164 to 188.
Figure 9 presents the original decay curves at measurement points 164–188, consolidated into one graph for comparative purposes. It is evident from the figure that the transient electromagnetic (TEM) response at stations located at the front edge of the landslide generally exhibits lower amplitude compared to that at the rear edge. This disparity can be attributed to two primary factors: first, the receiving system maintains a horizontal flight path during the measurement process, which places the sensor closer to the ground at the landslide’s rear edge, resulting in an elevation discrepancy of approximately 30 m; second, it reflects the electrical variations attributable to different soil compositions and weathering conditions present at various locations across the landslide.
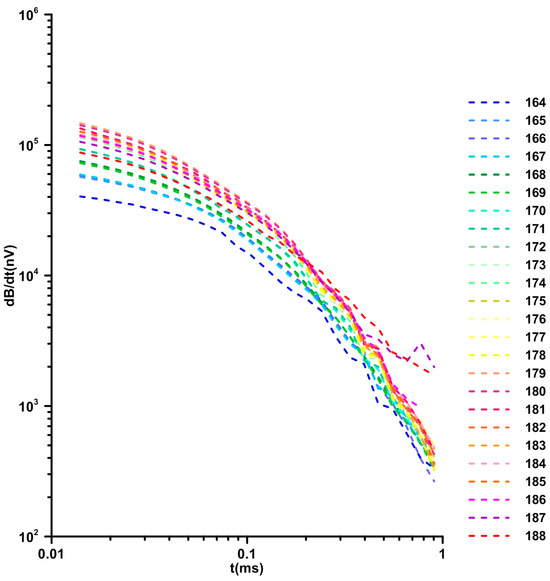
Figure 9.
Comparison plot of original curves of SATEM stations from 164 to 188.
6. Discussions
There are significant differences in the electrical structure between the shallow and deep parts of the landslide area. The shallow strata are relatively intact, while there are locally uneven structures in the deep layers. Figure 10 displays the response plane contour map generated from the original data of all measurement points on the Meijiayan landslide. The figure illustrates the transient response plane contour maps for 74 μs, 204 μs, 284 μs, and 396 μs time channels where red indicates high values and blue signifies low values. High values of transient response are primarily attributed to surface clay with good conductivity, cultivated soil, and local water-bearing areas below.
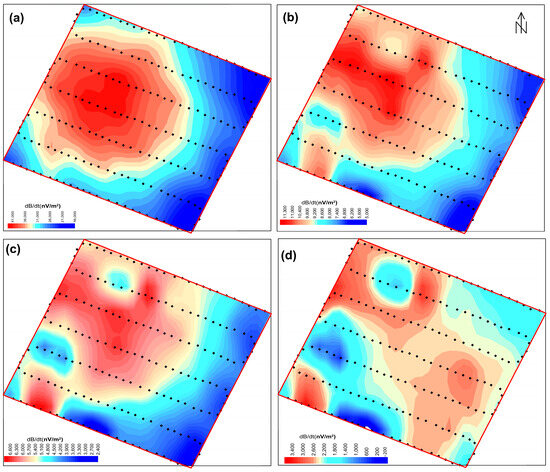
Figure 10.
Contour map of SATEM response plane for Meijiayan landslide. (a). 74 μs, (b). 204 μs, (c). 284 μs, (d). 396 μs.
Additionally, the large loop configuration itself contributes to a high-value area in the center, which is more pronounced in the early stages, while its impact diminishes in the middle and late stages. A comparison of the four time channels reveals that the high-value anomaly zone begins to decrease and change gradually from 74 μs. By 396 μs, the high-value anomaly areas have become relatively dispersed. Analysis suggests that the high-value area depicted in Figure 10a may correspond to the range of landslide bodies dominated by shallow clay and cultivated soil, while the actual high-value area in Figure 10d likely corresponds to parts of the shallow, strongly weathered layer with higher moisture content.
There are significant differences in electrical properties among different strata in the landslide area. Shallow cultivated clay exhibits low resistance characteristics, while deep intact bedrock exhibits high resistance characteristics. The strongly weathered layer shows medium to low resistance, and the weakly weathered layer shows medium to high resistance. The discontinuous electrical resistivity in the strata reflects the tensile cracks formed during the landslide process, while the fluctuating electrical resistivity interface reflects favorable water-rich structures. Figure 11 and Figure 12 present the imaging results of the apparent resistivity for two measuring lines, points 164–188 and points 221–244, respectively. Both lines are aligned with the landslide’s main sliding direction, separated by a distance of 50 m (as seen in Figure 3). Figure 13 offers a three-dimensional rendering of the SATEM apparent resistivity imaging results, providing a visual representation of the spatial distribution of various layers and the discontinuity of stratigraphic faults.
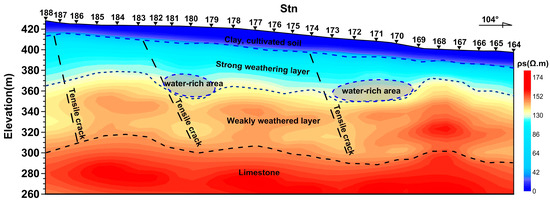
Figure 11.
Imaging of apparent resistivity of measuring stations 164–188.
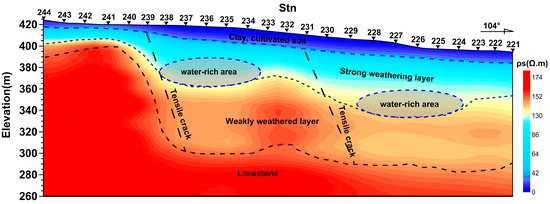
Figure 12.
Imaging of apparent resistivity of measuring stations 221–243.
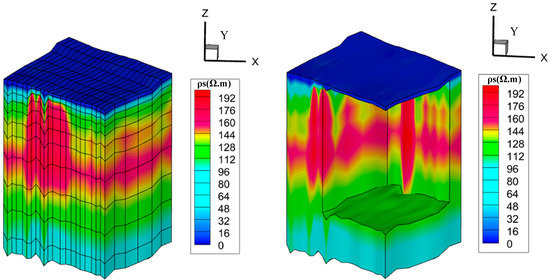
Figure 13.
Three-dimensional rendering of SATEM detection results.
The figure shows that the distribution of shallow clayey cultivated soil is relatively uniform, and the traces of hidden faults underground are not obvious. The high resistivity anomaly in red on the map corresponds to the limestone strata, which have formed undulating shapes due to varying degrees of weathering. The analysis of the causes suggests that it is mainly due to the different main components within the limestone strata; the varying content of argillaceous and dolomite materials leads to different degrees of weathering and erosion. The discontinuities and abrupt changes in resistivity within this stratum clearly reflect the traces of the faults. Overall, the unweathered limestone strata clearly have multiple undulations and depressions, which can be inferred as favorable areas for groundwater enrichment. The low resistivity beneath the high resistivity layer reflects the uniform distribution of shale and carbonaceous shale strata. The interface and undulating morphology of the surface clay, cultivated soil, and the layers below—both strongly and weakly weathered—are vividly displayed in Figure 10 and Figure 11. The research area can be approximately divided into four electrical layers from top to bottom, with resistivity increasing from low to high. Beneath the surface layer, there are several to tens of meters of silty clay and fragmented stones interbedded with silty clay, characterized by low resistivity averaging less than 30 Ω. m. This stratum’s permeability makes it susceptible to landslides. The second layer, ranging in thickness from 20 to 40 m, is presumed to reflect the strongly weathered layer. Its interior is loose and highly porous due to intense weathering. The third layer is identified as a weakly weathered zone, while the fourth layer is posited to be relatively intact and unweathered limestone, exhibiting high resistance characteristics. The interface between the strongly weathered layer and the weakly weathered limestone layer below reveals multiple depressions related to the unevenness of weathering, creating favorable zones for groundwater enrichment, as depicted in Figure 11 and Figure 12. In both images, horizontal discontinuities in electrical resistivity are observed at various locations, with the fault positions in the two cross-sections being roughly consistent. It is hypothesized that multiple sets of tensile faults formed by the landslide body and running perpendicular to the main sliding direction provide pathways for surface water infiltration and accumulation in water-rich areas within the strongly weathered layers. Groundwater plays a crucial role in landslide formation, not only by increasing the weight of the rock and soil but also by infiltrating and softening the rock and soil in the sliding zone, thereby reducing their shear strength. The presence of a water-rich area keeps the strongly weathered layer at the contact surface in a state of high moisture content for extended periods, making it a weak structural surface prone to landslide development.
A comprehensive analysis of the SATEM detection results indicates that the occurrence and development of the Meijiayan landslide are influenced by a combination of factors, including geological structure, lithology, topography, precipitation, and human engineering activities. The middle and rear parts of the landslide consist of natural slopes, whereas the front part comprises an artificial excavation surface created by the construction of Highway 38. This excavation has caused the front part to lose support, disrupting the original equilibrium. Additionally, Pengshui County’s subtropical humid climate, characterized by abundant and concentrated rainfall, exacerbates the landslide risk. The shallow lithology in the landslide area, primarily consisting of powdery clay and fragmented stones interbedded with powdery clay, possesses high porosity and good permeability. This composition allows it to absorb and retain significant amounts of water during rainfall events, thereby increasing the weight of the sliding mass, infiltrating and softening the rock and soil in the sliding zone, and reducing its shear strength. Although the geological structure beneath the water-rich area currently exerts a certain blocking effect, there is a risk of landslide reactivation under heavy precipitation or if the sliding surface becomes fully lubricated and connected. To mitigate this risk, it is advisable to implement measures such as the construction of anti-slip piles and drainage ditches to adequately manage groundwater in the water-rich area.
Through the usability analysis of this study, the potential application limitations include the following three aspects. First, this study is only a test conducted on soil-rock landslides. Since the main body of this type of landslide is loose soil accumulations with high porosity, high water content, and significant electrical differences with the underlying bedrock, the main electrical structures can be detected by electromagnetic methods. However, for rock landslides, the small electrical contrast between the landslide body and the surrounding rock may result in less noticeable detection effects. Third, since the transient electromagnetic method is a detection method aimed at good conductors, the detection of geological disasters with high resistivity as the target will also be one of the main application limitations of the loop-source ground-airborne transient electromagnetic method.
7. Conclusions
Exploring the structure of shallow landslide bodies in mountainous areas with complex terrain or dense vegetation poses challenges for surface drilling and ground-based geophysical exploration. The loop source SATEM we propose is a useful method to address this issue. Considering the representativeness of landslides, we conducted a geophysical exploration at the Meijiayan landslide, which was formed due to human construction and road excavation. The SATEM detection results clearly reflect the stratigraphic structure of the landslide area, the undulating morphology, and the developed tension fractures, providing important references for analyzing the geological structure of the landslide body, favorable water-bearing areas, and mitigation strategies. This is a typical case of applying SATEM in a landslide area. We have proposed customized field collection parameters and instrument specifications for shallow exploration, as well as data processing methods, to meet the analysis of shallow landslide detection results. The detection results at the Meijiayan landslide show that SATEM is accurate and feasible for landslide investigations in complex terrains. The successful application confirms the outstanding advantages of the SATEM method in landslide investigations in complex terrains. In the future, this method can be extended to other types of geological hazard detection and monitoring, metal minerals, groundwater, and engineering exploration.
Author Contributions
Conceptualization: J.W. and Q.Z.; methodology: J.W., Q.Z., Y.L., X.D. and X.W.; data acquisition: all participants; equipment developing: X.C., Y.Z. and Y.H.; funding acquisition: D.X. and B.D.; writing—review and editing: J.W. and Q.Z. All authors have read and agreed to the published version of the manuscript.
Funding
This study was supported by the Fundamental Research Funds of CAGS and China Geological Survey Project (Nos. JY202401, DD20240076, AS2020Y01, JKYQN202348).
Data Availability Statement
The original contributions presented in the study are included in the article, further inquiries can be directed to the corresponding author.
Acknowledgments
We are grateful to Xu, Yong, Wuhan Geological Survey Center of China Geological Survey, and Tie, Yongbo, Chengdu Geological Survey Center of China Geological Survey, for providing the geological data of the study area.
Conflicts of Interest
The authors declare no conflict of interest.
References
- Huang, R. Some catastrophic landslides since the twentieth century in the southwest of China. Landslides 2009, 6, 69–81. [Google Scholar]
- Yin, Y.; Zheng, W.; Li, X.; Sun, P.; Li, B. Catastrophic landslides associated with the M8.0 Wenchuan earthquake. Bull. Eng. Geol. Environ. 2011, 70, 15–32. [Google Scholar] [CrossRef]
- Liu, C.; Chen, C. Achievements and Countermeasures in Risk Reduction of Geological Disasters in China. J. Eng. Geol. 2020, 28, 375–383. [Google Scholar]
- Huang, R. Large-scale landslides and their sliding mechanisms in China since the 20th century. Chin. J. Rock Mech. Eng. 2007, 182, 433–454. (In Chinese) [Google Scholar]
- Zhang, M.; Yin, Y. Dynamics, mobility-controlling factors and transport mechanisms of rapid long-runout rock avalanches in China. Eng. Geol. 2013, 167, 37–58. [Google Scholar] [CrossRef]
- Huang, R. Mechanisms of large-scale landslides in China. Bull. Eng. Geol. Environ. 2012, 71, 161–170. [Google Scholar] [CrossRef]
- Fan, X.; Tang, J.; Tian, S.; Jiang, Y. Rainfall-induced rapid and long-runout catastrophic landslide on 23 July 2019 in Shuicheng, Guizhou, China. Landslides 2020, 17, 2161–2171. [Google Scholar] [CrossRef]
- Melanie, J.; David, N. Global fatal landslide occurrence from 2004 to 2016. Nat. Hazards Earth Syst. Sci. 2018, 18, 2161–2181. [Google Scholar]
- Sun, D.; Chen, D.; Zhang, J.; Mi, C.; Gu, Q.; Wen, H. Landslide Susceptibility Mapping Based on Interpretable Machine Learning from the Perspective of Geomorphological Differentiation. Land 2023, 12, 1018. [Google Scholar] [CrossRef]
- Chen, X.; Zhao, C.; Xi, J.; Lu, Z.; Ji, S.; Chen, L. Deep Learning Method of Landslide Inventory Map with Imbalanced Samples in Optical Remote Sensing. Remote Sens. 2022, 14, 5517. [Google Scholar] [CrossRef]
- Zhou, F.; Tang, H.; Wang, L.; Yan, N. Sudden Slide Mechanism of a Rock Block in Road Cutting Slope with Soft and Hard Interlayered Bedding Structure Based on Energy Balance Theory. KSCE J. Civ. Eng. 2022, 26, 4222–4234. [Google Scholar] [CrossRef]
- Di, Q.; Zhu, R.; Xue, G.; Yin, C.; Li, X. New development of the electromagnetic (EM) methods for deep exploration. Chin. J. Geophys. 2019, 62, 2128–2138. (In Chinese) [Google Scholar]
- He, J.; Xue, G. Review of the key techniques on short-offset electromagnetic detection. Chin. J. Geophys. 2008, 61, 1–8. (In Chinese) [Google Scholar]
- Guo, Z.; Xue, G. Electromagnetic methods for mineral exploration in China: A review. Ore Geol. Rev. 2020, 118, 103357. [Google Scholar] [CrossRef]
- Liu, C.; Zhang, M.; Ma, J.; Zhou, H.; Liang, J.; Lin, J. Divergence of tipper vector imaging for ground–airborne frequency-domain electromagnetic method with orthogonal sources. J. Electromagn. Waves Appl. 2020, 34, 316–329. [Google Scholar] [CrossRef]
- Li, X.; Hu, W.; Xue, G. 3D modeling of multi-radiation source semi-airborne transient electromagnetic response. Chin. J. Geophys. 2021, 64, 716–723. (In Chinese) [Google Scholar]
- Li, J.; Li, B.; He, K.; Gao, Y.; Wan, J.; Wu, W.; Zhang, H. Failure Mechanism Analysis of Mining-Induced Landslide Based on Geophysical Investigation and Numerical Modelling Using Distinct Element Method. Remote Sens. 2022, 14, 6071. [Google Scholar] [CrossRef]
- Lin, S.; Wang, W.; Deng, X.; Zha, Y.; Zhou, H.; Cheng, M. Geophysical observation of typical landslides in Three Gorges Reservoir area and its significance: A case study of Sifangbei Landslide in Wanzhou District. Earth Sci. 2019, 44, 3135–3146. [Google Scholar]
- Himi, M.; Anton, M.; Sendrós, A.; Abancó, C.; Ercoli, M.; Lovera, R.; Deidda, G.P.; Urruela, A.; Rivero, L.; Casas, A. Application of Resistivity and Seismic Refraction Tomography for Landslide Stability Assessment in Vallcebre, Spanish Pyrenees. Remote Sens. 2022, 14, 6333. [Google Scholar] [CrossRef]
- Whiteley, J.S.; Watlet, A.; Uhlemann, S.; Wilkinson, P.; Boyd, J.P.; Jordan, C.; Kendall, J.M.; Chambers, J.E. Rapid characterisation of landslide heterogeneity using unsupervised classification of electrical resistivity and seismic refraction surveys. Eng. Geol. 2021, 290, 106189. [Google Scholar] [CrossRef]
- Marciniak, A.; Kowalczyk, S.; Gontar, T.; Owoc, B.; Nawrot, A.; Luks, B.; Cader, J.; Majdański, M. Integrated geophysical imaging of a mountain landslide–a case study from the Outer Carpathians, Poland. J. Appl. Geophys. 2021, 191, 104364. [Google Scholar] [CrossRef]
- Pertuz, T.; Malehmir, A. Ultrahigh-resolution shear-wave reflection imaging of vertical-component data in a quick-clay prone to landslide area in southwest Sweden. Geophysics 2023, 88, B121–B133. [Google Scholar] [CrossRef]
- Havenith, H.-B.; Torgoev, I.; Ischuk, A. Integrated Geophysical-Geological 3D Model of the Right-Bank Slope Downstream from the Rogun Dam Construction Site, Tajikistan. Int. J. Geophys. 2018, 2018, 1641789. [Google Scholar] [CrossRef]
- Imani, P.; Abd EL-Raouf, A.; Tian, G. Landslide investigation using Seismic Refraction Tomography method: A review. Ann. Geophys. 2021, 64, SE657. [Google Scholar]
- Gao, W.; Gao, W.; Hu, R.; Xu, P.; Xia, J. Microtremor survey and stability analysis of a soil-rock mixture landslide: A case study in Baidian town, China. Landslides 2018, 15, 1951–1961. [Google Scholar] [CrossRef]
- Xu, P.; Du, Y.; Ling, S.; You, Z.; Yao, J.; Zhang, H. Microtremor survey method based on inversion of the spac coefficient of multi-mode rayleigh waves and its application. Chin. J. Geophys. 2020, 63, 3857–3867. [Google Scholar]
- Liu, P.; Wu, J.; Lee, D.H.; Lin, Y. Detecting landslide vulnerability using anisotropic microtremors and vulnerability index. Eng. Geol. 2023, 323, 107240. [Google Scholar] [CrossRef]
- Lapenna, V.; Lorenzo, P.; Perrone, A.; Piscitelli, S.; Rizzo, E.; Sdao, F. 2D electrical resistivity imaging of some complex landslides in Lucanian Apennine chain, southern Italy. Geophysics 2005, 70, B11–B18. [Google Scholar] [CrossRef]
- Szalai, S.; Szokoli, K.; Novák, A.; Tóth, Á.; Metwaly, M.; Prácser, E. Fracture network characterisation of a landslide by electrical resistivity tomography. Nat. Hazards Earth Syst. Sci. Discuss. 2014, 2, 3965–4010. [Google Scholar]
- Di, Q.; Jian-Jun, N. Application of high density resistivity method in landslide detection. IOP Conf. Ser. Earth Environ. Sci. 2021, 743, 012013. [Google Scholar] [CrossRef]
- Li, R.; Hu, X.; Xu, D.; Liu, Y.; Yu, N. Characterizing the 3D hydrogeological structure of a debris landslide using the transient electromagnetic method. J. Appl. Geophys. 2020, 175, 103991. [Google Scholar] [CrossRef]
- Xu, X.; Su, L.; Liang, S. A review of geophysical detection methods of landslide structure characteristics. Prog. Geophys. 2015, 30, 1449–1458. (In Chinese) [Google Scholar]
- Lin, J.; Xue, G.; Li, X. Technological innovation of semi-airborne electromagnetic detection method. Chin. J. Geophys. 2021, 64, 2995–3004. (In Chinese) [Google Scholar]
- Elliott, P. New airborne electromagnetic method provides fast deep-target data turnaround. Lead. Edge 1996, 15, 309–310. [Google Scholar] [CrossRef]
- Yin, C.; Zhang, B.; Liu, Y. Review on airborne EM technology and developments. Chin. J. Geophys. 2015, 58, 2637–2653. (In Chinese) [Google Scholar]
- Liang, S.; Sun, S.; Lu, H. Application of airborne electromagnetics and magnetics for mineral exploration in the Baishiquan–Hongliugou area, northwest China. Remote Sens. 2021, 13, 903. [Google Scholar] [CrossRef]
- Thiery, Y.; Reninger, P.A.; Nachbaur, A. Airborne electromagnetics to improve landslide knowledge in tropical volcanic environments. Appl. Sci. 2021, 11, 3390. [Google Scholar] [CrossRef]
- Yan, D.; Chen, W.; Lan, W. November. Research on intelligent airborne time-domain electromagnetic system based on fixed-wing UAV. In AOPC 2021: Optical Sensing and Imaging Technology; SPIE: Bellingham, WA, USA, 2021; Volume 12065, pp. 56–61. [Google Scholar]
- Liu, R.; Sun, H.; Liu, D.; Wang, X.; Zhou, X.; Zhao, Y.; Zhao, X.; Yang, Y.; Yang, G.; Sun, H. A joint application of semi-airborne and in-tunnel geophysical survey in complex limestone geology. Bull. Eng. Geol. Environ. 2023, 82, 226. [Google Scholar] [CrossRef]
- Liu, S.; Chen, C.; Sun, H. Fast 3D transient electromagnetic forward modeling using BEDS-FDTD algorithm and GPU parallelization. Geophysics 2022, 87, E359–E375. [Google Scholar] [CrossRef]
- Sun, H.; Zhang, N.; Li, D.; Liu, S.; Ye, Q. The first semi-airborne transient electromagnetic survey for tunnel investigation in very complex terrain areas. Tunn. Undergr. Space Technol. 2023, 132, 104893. [Google Scholar] [CrossRef]
- Sun, H.; Chen, C.; Yang, Y.; Lan, R.; Deng, S.; Li, D. Motion noise remove for secondary-field semi-airborne transient electromagnetic data. J. Appl. Geophys. 2022, 202, 104676. [Google Scholar] [CrossRef]
- Li, Y.; Sun, H.; Yang, J. Three-dimensional modeling of semi-airborne transient electromagnetic with loop source. J. China Coal Soc. 2018, 44, 631–642. [Google Scholar]
- Mogi, T.; Tanaka, Y.; Kusunoki, K.I.; Morikawa, T.; Jomori, N. Development of grounded electrical source airborne transient EM (GREATEM). Explor. Geophys. 1998, 29, 61–64. [Google Scholar] [CrossRef]
- Ma, Z.; Di, Q.; Xue, G.; Gao, Y. The research and application of resistivity imaging of semi-airborne transient electromagnetic method. Chin. J. Geophys. 2021, 64, 1090–1105. (In Chinese) [Google Scholar]
- Smirnova, M.; Becken, M.; Nittinger, C.; Yogeshwar, P.; Mörbe, W.; Rochlitz, R. A novel semi-airborne frequency-domain CSEM system. Three-dimensional inversion of semi-airborne data from the flight experiment over an ancient mining area near Schleiz, Germany. Geophysics 2019, 84, E281–E292. [Google Scholar] [CrossRef]
- Ma, Z.; Di, Q.; Lei, D.; Gao, Y.; Zhu, J.; Xue, G. The optimal survey area of the semi-airborne TEM method. J. Appl. Geophys. 2020, 172, 103884. [Google Scholar] [CrossRef]
- Smith, R.; Annan, P.; McGowan, P. A Comparison of Data from Airborne, semi-airborne, and Ground Electromagnetic Systems. Geophysics 2001, 66, 1379–1385. [Google Scholar] [CrossRef]
- Elliott, P. The principles and practice of FLAIRTEM. Explor. Geophys. 1998, 29, 58–60. [Google Scholar] [CrossRef]
- Zhi, Q.; Wang, X.; Wu, J.; Li, X.; Deng, X. The distortion and misinterpretation of TEM responses caused by the IP effect. J. Geophys. Eng. 2024, 21, 844–853. [Google Scholar] [CrossRef]
- Wu, X.; Xue, G.; Fang, G.; Li, X.; Ji, Y. The development and applications of the semi-airborne electromagnetic system in China. IEEE Access 2019, 7, 104956–104966. [Google Scholar] [CrossRef]
- Wu, J.; Li, X.; Zhi, Q.; Qi, Z.; Guo, J.; Deng, X. Full field apparent resistivity definition of Borehole TEM with electric source. Chin. J. Geophys. 2017, 60, 1595–1605. (In Chinese) [Google Scholar]
- Lacroix, P.; Handwerger, A.; Bièvre, G. Life and death of slowmoving landslides. Nat. Rev. Earth Environ. 2020, 1, 404–419. [Google Scholar] [CrossRef]
- Wang, W.; Zhang, C.; Hu, M.; Yang, Q.; Liang, S.; Kang, S. Monitoring and analysis of geological hazards in Three Gorges area based on load impact change. Nat. Hazards 2019, 97, 611–622. [Google Scholar] [CrossRef]
- Yin, Y.; Sun, P.; Zhang, M.; Li, B. Mechanism on apparent dip sliding of oblique inclined bedding rockslide at Jiweishan, Chongqing, China. Landslides 2011, 8, 49–65. [Google Scholar] [CrossRef]
- Li, B.; Gao, Y.; Yin, Y.; Wan, J.; He, K.; Wu, W.; Zhang, H. Rainstorm-induced large-scale landslides in Northeastern Chongqing, China, August 31 to September 2, 2014. Bull. Eng. Geol. Environ. 2022, 81, 271. [Google Scholar] [CrossRef]
- Xu, Q.; Fan, X.; Huang, R.; Yin, Y.; Hou, S.; Dong, X.; Tang, M. A catastrophic rockslide-debris flow in Wulong, Chongqing, China in 2009: Background, characterization, and causes. Landslides 2010, 7, 75–87. [Google Scholar] [CrossRef]
Disclaimer/Publisher’s Note: The statements, opinions and data contained in all publications are solely those of the individual author(s) and contributor(s) and not of MDPI and/or the editor(s). MDPI and/or the editor(s) disclaim responsibility for any injury to people or property resulting from any ideas, methods, instructions or products referred to in the content. |
© 2024 by the authors. Licensee MDPI, Basel, Switzerland. This article is an open access article distributed under the terms and conditions of the Creative Commons Attribution (CC BY) license (https://creativecommons.org/licenses/by/4.0/).