Article

Leveraging Multi-Temporal InSAR Technique for Long-Term Structural Behaviour Monitoring of High-Speed Railway Bridges

1
School of Transportation System Engineering/Korea Railroad Research Institute Campus, University of Science and Technology, Uiwang-si 16105, Republic of Korea
2
Advanced Railroad Civil Engineering Division, Korea Railroad Research Institute, Uiwang-si 16105, Republic of Korea
3
Advanced Railroad Structural Engineering Division, Korea Railroad Research Institute, Uiwang-si 16105, Republic of Korea
*
Author to whom correspondence should be addressed.
Remote Sens. 2024, 16(17), 3153; https://doi.org/10.3390/rs16173153
Submission received: 24 June 2024 / Revised: 12 August 2024 / Accepted: 21 August 2024 / Published: 26 August 2024
(This article belongs to the Special Issue Remote Sensing in Urban Infrastructure and Building Monitoring)

Abstract

:
The effective monitoring of railway facilities is crucial for safety and operational efficiency. This study proposes an enhanced remote monitoring technique for railway facilities, specifically bridges, using satellite radar InSAR (Interferometric Synthetic Aperture Radar) technology. Previous studies faced limitations such as insufficient data points and challenges with topographical and structural variations. Our approach addresses these issues by analysing displacements from 30 images captured by the X-band SAR satellite, TerraSAR-X, over two years. We tested each InSAR parameter to develop an optimal set of parameters, applying the technique to a post-tensioned PSC (pre-stressed concrete) box bridge. Our findings revealed a recurring arch-shaped elevation along the bridge, attributed to temporal changes and long-term deformation. Further analysis showed a strong correlation between this deformation pattern and average surrounding temperature. This indicates that our technique can effectively identify micro-displacements due to temperature changes and structural deformation. Thus, the technique provides a theoretical foundation for improved SAR monitoring of large-scale social overhead capital (SOC) facilities, ensuring efficient maintenance and management.

1. Introduction

The effective monitoring of railway facilities is crucial for ensuring safety and operational efficiency. Interferometric Synthetic Aperture Radar (InSAR) [1,2] has proven its applicability in the infrastructure monitoring domain for decades. However, its results have rarely been processed as significant data for facility maintenance and management because conventional InSAR techniques have primarily focused on observing wide-ranging areas such as volcanoes and crustal movements [3,4]. Recent advancements in satellite performance and analysis algorithms have increased the feasibility of using InSAR for monitoring social overhead capital (SOC) facilities, including bridges.
Persistent Scatterer Interferometric Synthetic Aperture Radar (PS-InSAR), a type of Multi-temporal InSAR (MT-InSAR), is particularly effective for monitoring large concrete structures like buildings and bridges due to the high density of Persistent Scatterers (PSs). PS-InSAR requires multiple radar images taken at different times to correct errors such as atmospheric phenomena or baseline distance variations, allowing for the extraction of detailed time-series data. These data are invaluable for assessing the long-term management and maintenance of infrastructure, identifying potential vulnerabilities and risks of collapse.
Railway facilities, particularly bridges, present unique challenges due to their extensive lengths and the significant labour and costs associated with their maintenance. Satellite InSAR technology offers a cost-effective solution by providing wide coverage and the ability to detect subsidence and deformations with minimal staff involvement [5,6]. However, existing research often struggles with insufficient observation points and the inability to incorporate topographical and structural features into maintenance strategies [7]. This is especially critical in high-density urban areas where advanced transportation infrastructure, such as bridges, plays a vital role.
Several studies have demonstrated the effectiveness of InSAR technology in monitoring large civil engineering structures. Milillo et al. utilised COSMO-SkyMed and Sentinel-1a satellites to observe the 113 m high dam on the Tigris River, revealing cycles of deformation and expansion that correlated with periods of structural reinforcement [8,9]. Similarly, Delgado Blasco et al. employed 160 images from the Sentinel-1a satellite to observe subsidence in Rome’s metropolitan area, using the SNAP-StaMPS system for PS-InSAR analysis [10]. Struhar et al. measured displacements in underground gas storage facilities using 146 Sentinel satellite images, effectively demonstrating repeated and regular displacement patterns through 2D periodogram and clustering techniques [11]. These studies successfully introduced the effectiveness of multi-temporal InSAR techniques for structural monitoring. However, most studies rely on Sentinel satellites and SNAP-based programmes, which are free to use but limited in accuracy. Many researchers have attempted to enhance precision by employing extensive resources, such as a large number of SAR images and extensive areas of interest. This approach increases the likelihood of detecting significant changes over wide areas, focusing primarily on rapid, sudden changes caused by external events such as structural failures or gas and water leaks. For understanding the long-term behaviour of artificial structures, a higher level of precision and a more focused target are required. For these reasons, we decided to focus our targets on high-speed railway bridges, where deformations of a few centimetres can lead to serious systematic failures, making precise monitoring essential.
In the context of railway monitoring, Chang et al. observed a 12 km railway line near Betuweroute, Netherlands, using 248 satellite images over four years, while Yang et al. analysed high-speed railways in France and China using the ENVISAT ASAR and PS-InSAR techniques [12,13]. However, studies on railway monitoring share limitations with the aforementioned studies, including challenges in accurately addressing specific facility behaviours. Qin et al. examined high-speed railway lines in China using TerraSAR-X and ENVISAT ASAR satellites [14]. Their study was significantly enhanced by the precision achieved through the use of satellites with improved resolution. It revealed that China’s high-speed rail network suffers from continuous subsidence due to rapid urbanisation, posing a threat to structural safety due to weak foundations. This finding also suggests that monitoring the girders of railway bridges is crucial for ensuring their structural integrity.
Studies focusing on bridge behaviour have shown promising results. Various methods for validating multi-temporal InSAR results were proposed. The collapse of the Morandi Bridge in Genoa, Italy, was preceded by detectable signs in the PS-InSAR history [15]. Jung et al. validated PS-InSAR findings with terrestrial LiDAR, proving long-span bridge deflections [16]. Lazecky et al. correlated temperature-induced expansion and contraction with concrete girder deformations in Czech bridges using TerraSAR-X data [17]. Markogiannaki et al. utilised D-TomoSAR analysis on 360 Sentinel images to estimate displacements in a long-span bridge, demonstrating high precision in displacement detection [18]. Farneti et al. improved the accuracy of bridge monitoring by proposing a bridge-tailored post-processing methodology, highlighting the importance of error control in PS-InSAR techniques [19].
While these studies demonstrate the utility of InSAR technology, challenges remain in integrating InSAR with other monitoring technologies, such as UAVs and ground-based radar, to enhance monitoring accuracy. Recent advancements in satellite technology, including AI and machine learning for data processing, offer potential solutions to some of these challenges. Comparative analyses of different InSAR techniques and satellite systems, such as Sentinel, COSMO-SkyMed, and TerraSAR-X, are needed to guide researchers in selecting the appropriate technology for specific applications. Additionally, more case studies focusing on high-density urban areas and regions with unique geological conditions could provide useful insights into the practical applications of InSAR technology.
This study aims to enhance the monitoring of railway bridges by employing PS-InSAR technology with high-resolution TerraSAR-X satellite data. By developing optimised parameter sets for deriving structural characteristics and topography conditions, and by comparing these with field measurements, we aim to achieve a safer operation of railways and lower maintenance costs. We analysed relative displacements in the line-of-sight (LOS) direction by establishing a baseline reference height of 0 mm at the observation point. This approach allows us to measure and present relative changes in the height of the girders, effectively identifying concrete deformation. The two-year displacement history is divided into elastic deformation due to temperature and permanent deformation, thereby validating the accuracy of high-resolution SAR satellite measurements. Our goal is to provide a robust theoretical foundation for the improved maintenance and management of railway bridges.
This paper is structured as follows: Section 2 details the methods used in our study, beginning with the evaluation of the target site and an examination of the nature of the PSC box bridge, followed by numerical analyses. Section 3 focuses on the optimisation of InSAR parameters, including details of data acquisition and parametric analysis. In Section 4, we present the results, discussing preliminary displacement patterns, long-term behaviour characteristics, and the effects of seasonal temperature changes. Lastly, Section 5 provides our conclusions, including a discussion of findings, a summary of conclusions, and suggestions for future work.

2. Methods

2.1. Evaluation of the Target Site for Radar Observation

The railway line targeted in this study was opened in 2015. The railway line, spanning 184 km, was designed as a high-performance route for passenger transport. As shown in Figure 1, cast-in-place concrete tracks were applied for high-speed operation.
The line was selected for its advantageous characteristics that facilitate radar observation. The exposure of the track and bridge deck to the sky-transmitted radar minimises concerns about local shading or interference. Specifically, the PS-InSAR analysis method involves stochastically calculating a single subsidence value within a fixed resolution pixel. Hence, it is beneficial for reflectors within the same pixel to possess homogeneous reflection performance and physical attributes. An excellent quality of the reflection is expected, considering that the track and deck in the target line were constructed of concrete.

2.2. Nature of the Post-Tensioned Pre-Stressed Concrete (PSC) Box Bridge

The target structure is a post-tensioned PSC box bridge. The default span is 40 m.
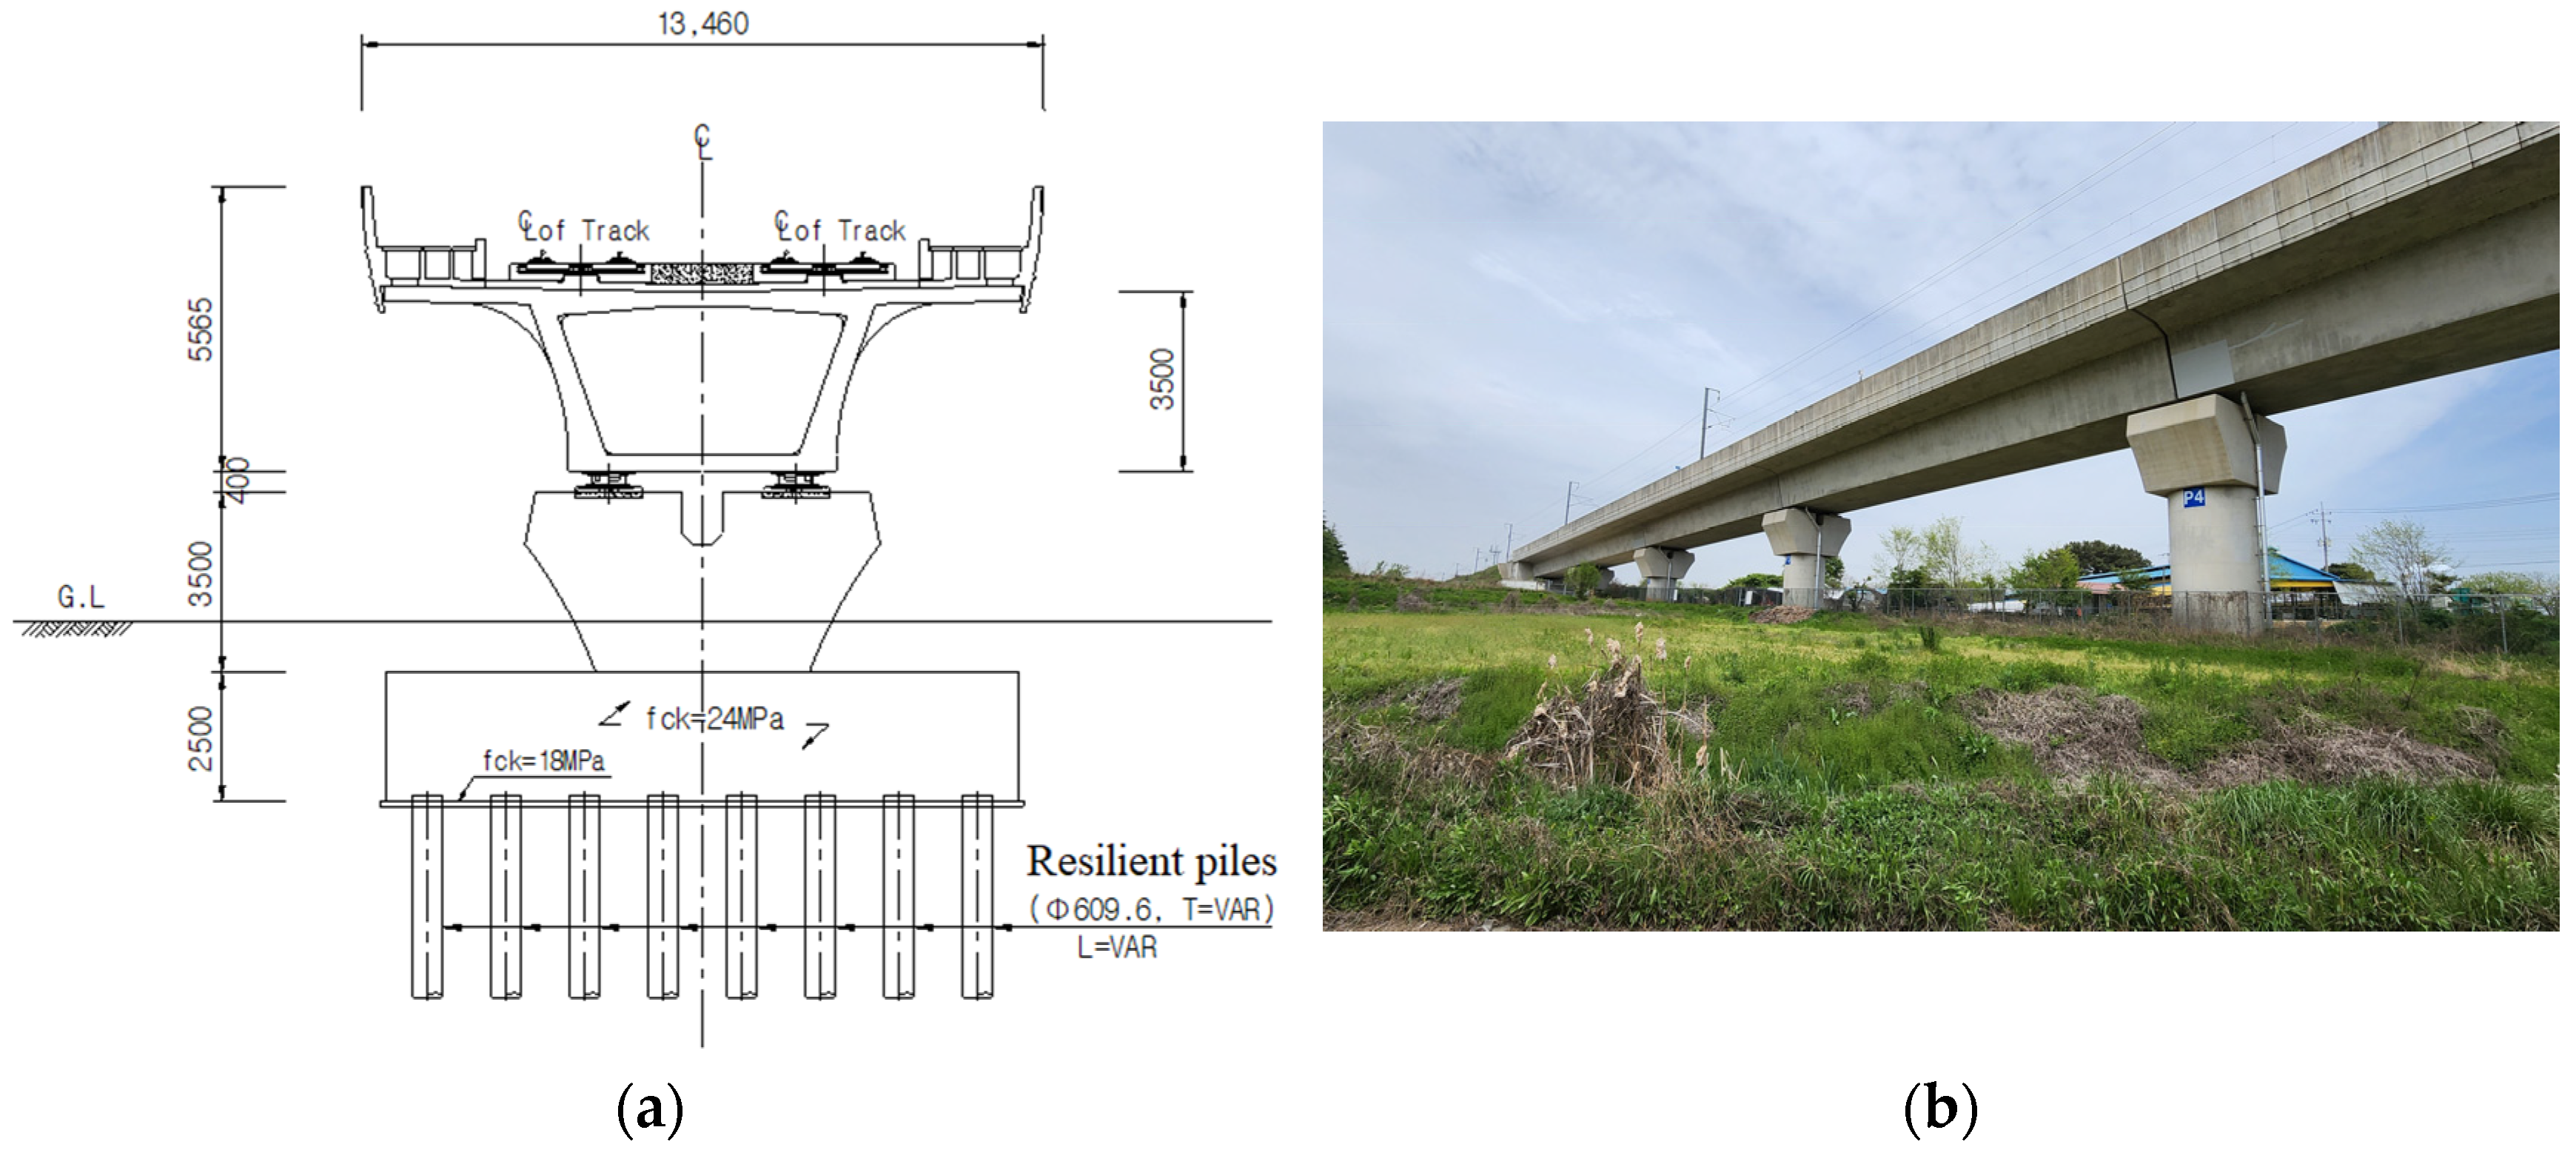
As shown in Figure 2a, the width and height of the straight section are 13.46 and 3.50 m, respectively. The centre of the cross-section is hollow without the concrete being filled. The pile foundation of the piers reaches the bedrock to avoid ground subsidence. Figure 2b is a view from the side of the bridge and the surrounding environment is presented.
It should be stated that this study focuses on detecting micro-level deformations in girders, which typically develop slowly and progressively. In contrast, external events like earthquakes can induce rapid deformations occurring over periods often shorter than the satellite revisit cycle. These rapid changes may disrupt the coherence of radar signals across successive satellite passes, thus posing challenges in tracking and analysing such events with the millimetre precision required by our InSAR analysis. Given these conditions, rapid external events are considered unsuitable for this analysis as they compromise the coherence and consistency needed for accurate evaluation.
Recent bridge designs consider sufficient rigidity for members and apply camber settings and pre-stressed or post-tensioned construction methods to control the long-term deformation of a bridge below an acceptable value. Despite such attempts, because of the difficulty in precisely predicting changes in loading conditions during the long-term operation of a bridge, mm/year-level deformations are often observed in several bridges.
We determined that the following variables induced bridge deformation in relation to temperature changes. As the primary material of the target bridge is reinforced concrete, we assumed that the longitudinal expansion in line with temperature changes would be linear, as expressed in Equation (1), where c is the thermal expansion coefficient of the member, l is the length of the member, and Δ T is temperature change.
t 1 = c × l × Δ T
This seasonal displacement is affected by the initial curing temperature of concrete, mix, wire tension, box thickness, and annual temperature difference. The displacements amplify under the following conditions: (1) The curing temperature deviates considerably from the median value. (2) The mix is used for early strength development. (3) The application of greater tensile force to the steel wire. (4) An increase in the annual temperature difference [20].
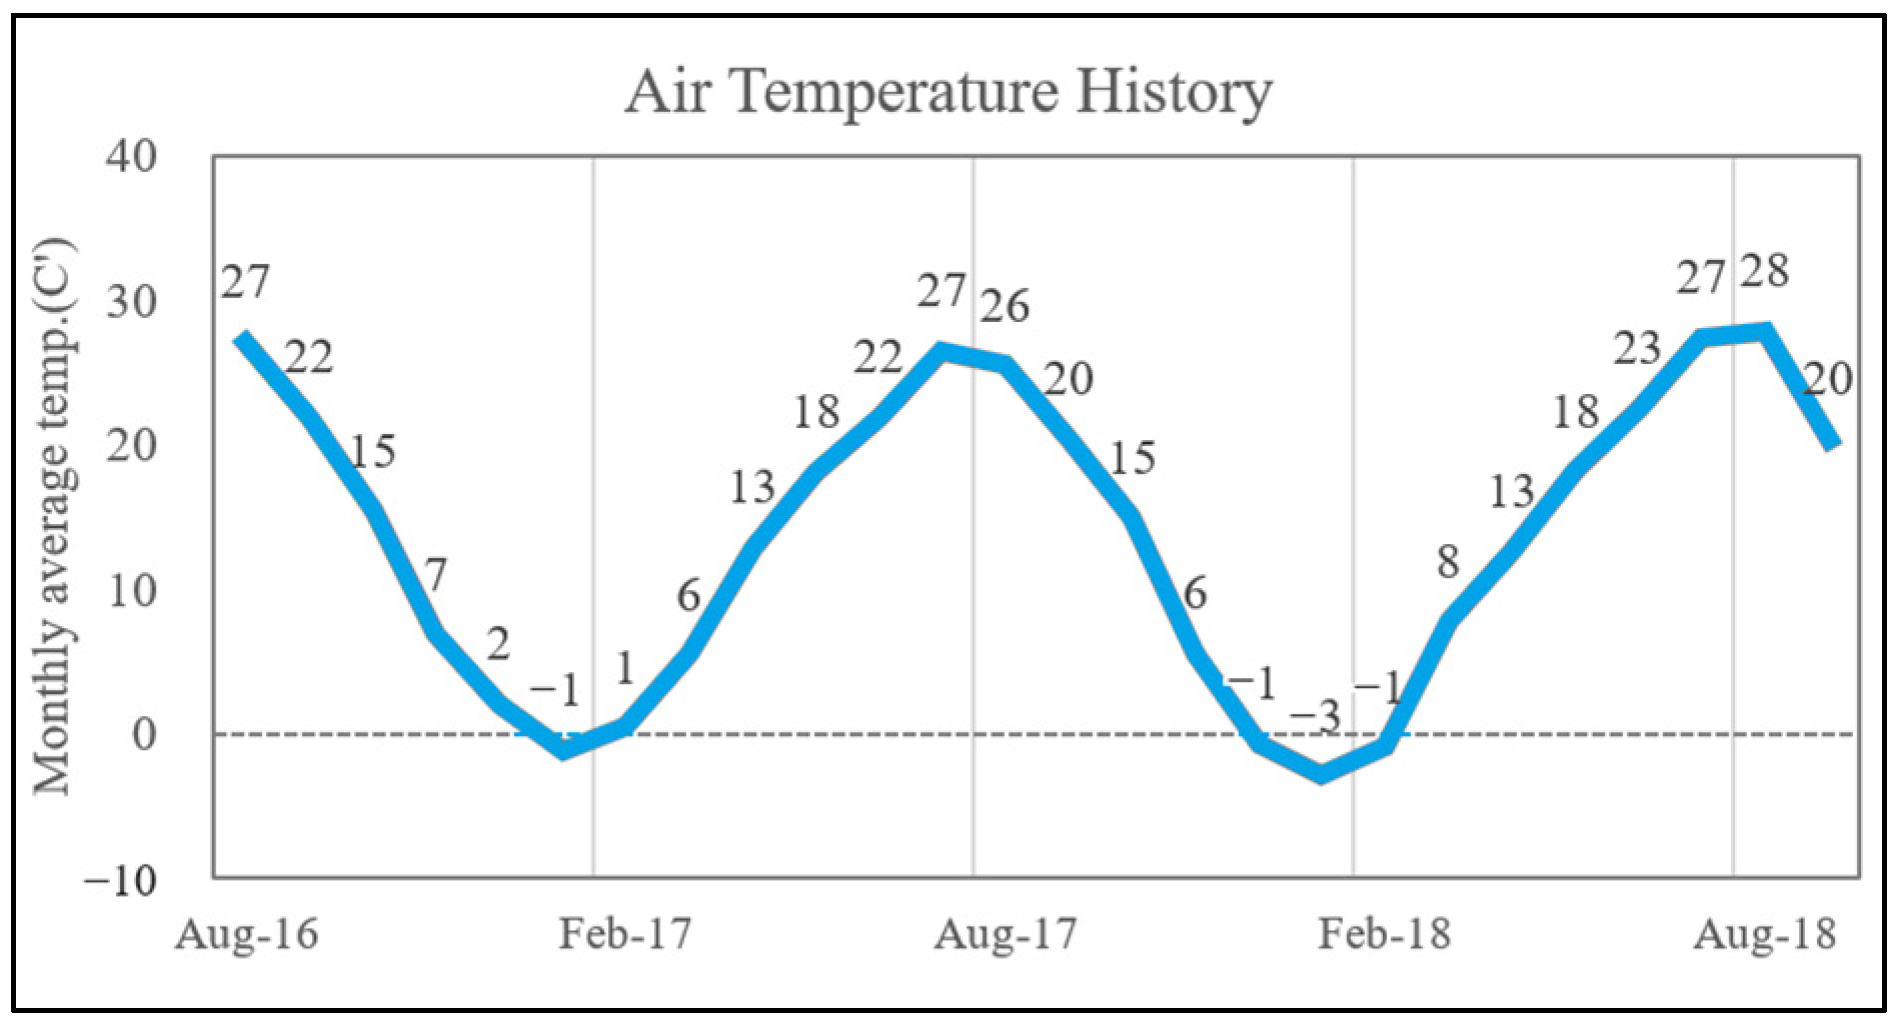
As a result, if the annual average temperature and the displacements at the span centre analysed by InSAR are interpreted on the same time basis, the correlation between those two variables can be reconfirmed, as shown in Equation (1). Such an approach was already suggested in the case of monitoring the longitudinal temperature expansion and contraction of a long-span composite suspension bridge [16]. Figure 3 shows a two-year survey of annual average temperatures in the area with the target bridge. The average annual temperature is 12.8 °C. The period from May to September is the summer season with above-average temperature patterns, while that from November to March is the winter season, with below-average temperature patterns.
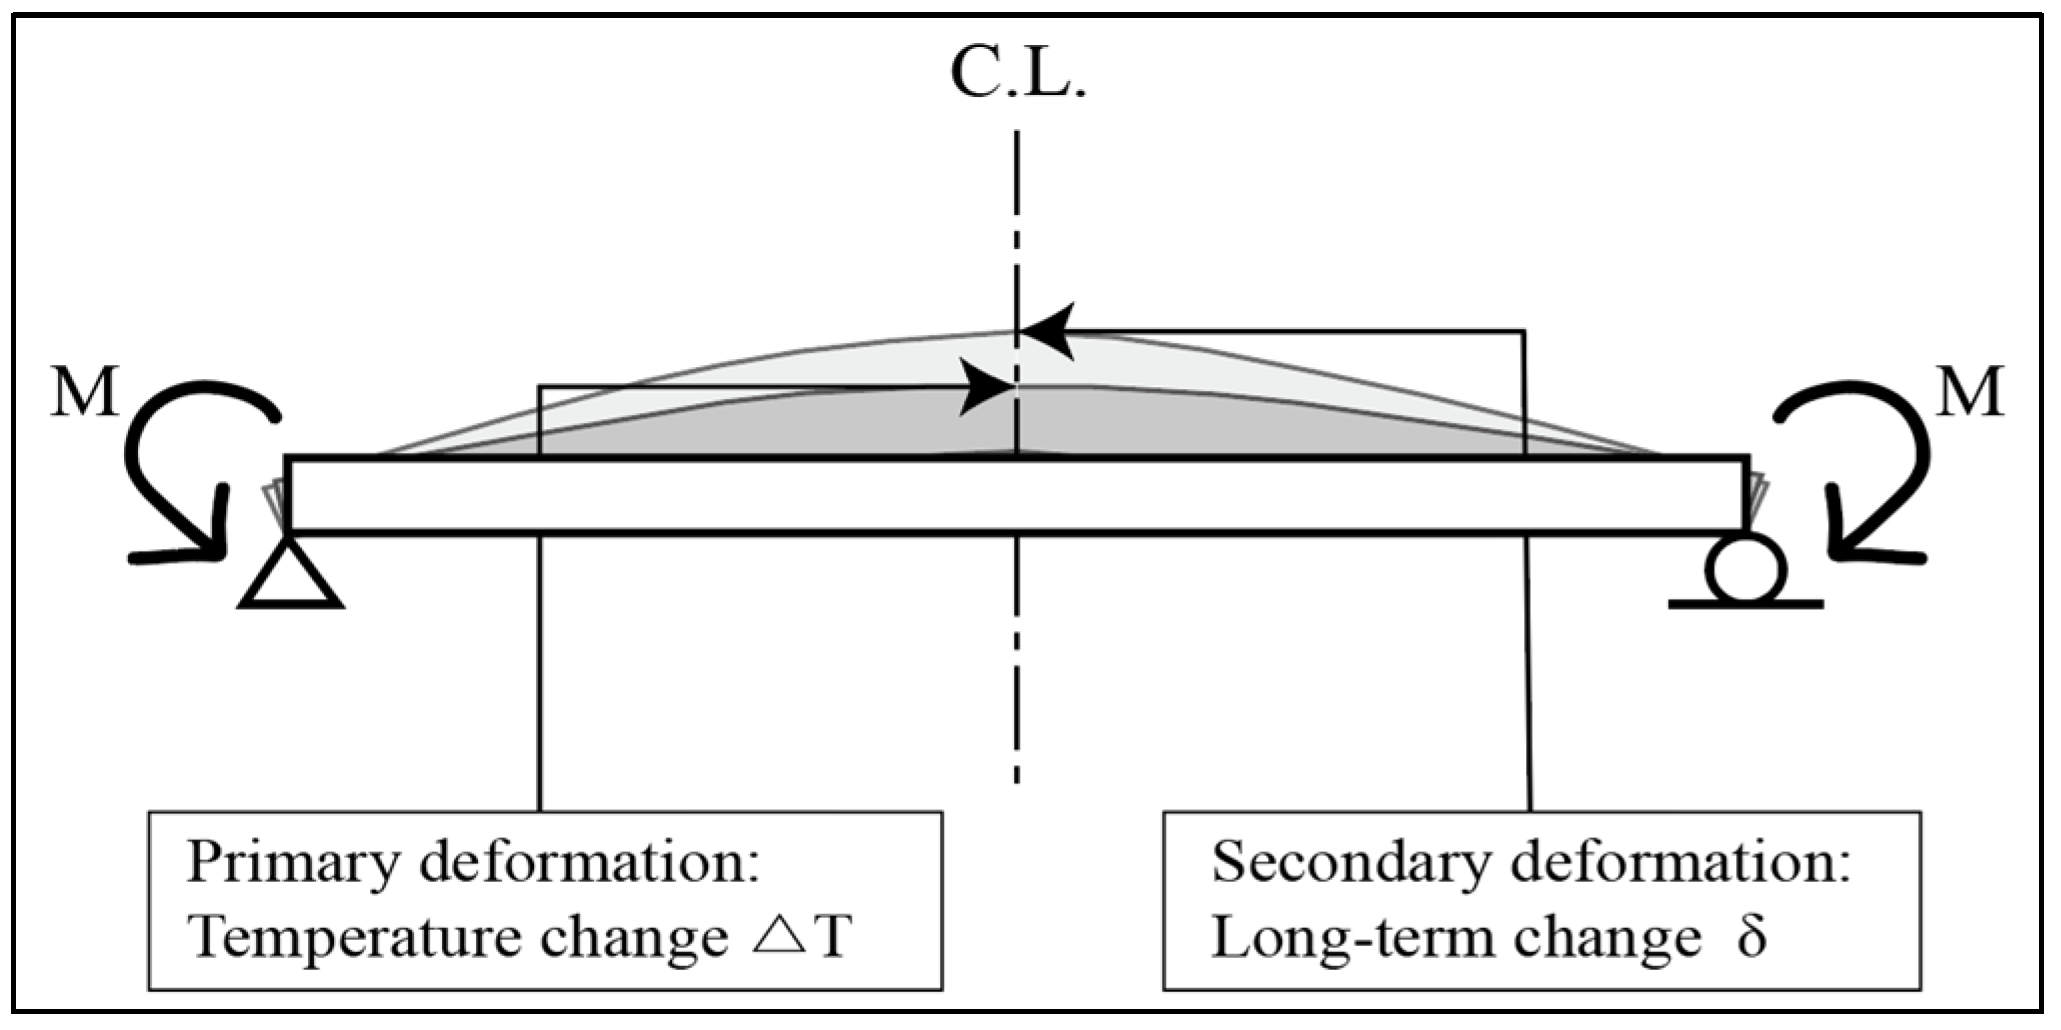
Bridges are subjected to long-term inelastic deformation due to expansion and contraction, owing to temperature changes, self-load, creep, drying shrinkage, and train load. The long-term deformation of a longitudinal flexural member such as a bridge, as shown in Figure 4, can be determined from the pattern wherein both points are fixed and the span centre is elevated or drooped. Although the accurate estimation of deformations is difficult owing to numerous factors with influences, it tends to increase in a near-linear trend, converging at certain points before stabilising. This component was linearly approximated, as shown in Figure 5c, while considering the short observation period.
As expressed in Equation (2), total deformation δ in the vertical direction of the bridge centre at time t is the sum of the sine wave δ t e m p . = μ ( s i n t ) for time t multiplied by the temperature expansion coefficient and the long-term deformations δ p l a . = v t at the corresponding time. The duration of the observation was two years. Consequently, the deformation δ(t) at a point in time t from the start of the observation can be expressed as a sine wave that completes two cycles within this period, as represented by Equation (3). The coefficient ‘μ’ determines the amplitude of the sine function.
δ ( t ) = δ t e m p . + δ p l a .
δ ( t ) = v t + μ ( s i n t )   { 0 v < 4 π }
The displacement history of the span centre presented in Figure 5a shows the prediction of total cumulative deformations of the bridge over two years using Equation (3). Figure 5a indicates the possibility of classifying into the following components: Figure 5b shows the cyclic thermal expansion δ t e m p . = μ ( s i n t ) and Figure 5c shows long-term and linear deformation δ p l a . = v t before convergence.

2.3. Numerical Analysis

PSC box bridges built for railways require the sufficient thickness of the integrated concrete box for structural stability. The thickness of the target bridge’s cross-section is 5.5 m (Figure 2), which can result in a temporary temperature difference between the top and bottom of the box with direct sunlight. The temperature difference results in a difference in the longitudinal expansion/contraction; the top part is subjected to the tensile force, and the bottom part is subjected to compression. Accordingly, the bridge experiences a bending moment in the vertically upward direction owing to the member stress, and the centre of the span is elevated during the heat wave.
As noted in Figure 3, the target line is located in an area with huge differences in annual average temperature between −3 and 28°. Under such circumstances, it is common to design a bridge/railway while considering the bending moment caused by the temperature differences at cross-sections of a bridge. According to the general design criteria for concrete bridges of the Ministry of Land, Infrastructure and Transport Korea (KDS 24 12 20: 2021) [21], it is assumed that the temperature difference between the deck and other parts is set as 5 °C for facile calculation, with the temperature distribution on the other parts being uniform.
Figure 6 presents the temperature gradient of the cross-section of the bridge based on the abovementioned design guidelines. Figure 6a shows the simplified cross-section of a concrete bridge. Figure 6b,c show the temperature distribution models. The horizontal axis indicates temperature, so the thicker parts represent higher temperatures during the daytime. Figure 6b illustrates the real temperature distribution, emphasising that there is a gradual change between the bridge deck and other parts. Figure 6c shows a simplified model for design convenience, as cited from the Railway Design Standards. Colours indicate temperature.
We performed a numerical analysis to identify the shape and amount of camber in the span centre based on the bridge’s cross-section (Figure 2), and temperature distribution on design (Figure 6). We used Abaqus/CAE 2023, a FEM simulation software developed by Dassault Systems. Figure 7a,b show a 3D model with a 40 m long span produced with a given cross-section of the bridge. Figure 7a presents a view from the top and Figure 7b is a horizontal view of the same model.
The thermal expansion coefficient of concrete and reinforcing bars was set as 10 × 10−6 m/°C. After applying ΔT = 5 °C to the deck of the generated model’s upper part, the span centre was elevated in an arch shape, and both ends were deflected (Figure 7). Here, the distance X is the relative distance when an end of the span is set as 0 m and displacement DtZ is based on the condition of neutral temperature.
The numerical analysis under the current design standards revealed that the maximum camber in the span centre driven by annual temperature changes was 2.81 mm and could be deflected by up to 0.66 mm at both ends. The analysis results are presented in Table 1.

2.4. Multi-Temporal InSAR Analysis: PS-InSAR

This study employs the PS-InSAR technique developed by Ferretti et al. (2000, 2001) [1,2] and incorporates ideas from Hooper A. (2004, 2007) [3,4] and Hanssen R. F. (2003) [22] to enhance the precision and reliability of deformation measurements in a multi-temporal InSAR (MT-InSAR) approach, enabling the precise estimation of surface displacements. This is achieved by selecting Persistent Scatterers (PSs) with stable phase signals owing to high reflection intensity and coherence. PS-InSAR, unlike methods using less than two images, offers improved accuracy by correcting spatiotemporal decorrelation in stacked images, also filtering atmospheric effects over larger areas.
The software used for InSAR analysis was ENVI v5.6.3, developed by NV5 Geospatial Solutions. We also utilised the SARscape v5.6.2.1 module, specialised for PSI, provided by sarmap SA. An advantage of using ENVI is that it does not require pre-processing steps from external programmes. This convenience allows the main PSI processes to follow the SARscape guidelines [23,24], with some arrangements made for optimisation. The detailed processes are introduced as follows.
Figure 8 shows the main analysis procedure with five steps to specifically explain the analysis process in this study, as well as detailed explanations of the stages a. to e.
  • A total of 30 SAR images in .slc format are imported into ENVI. Each image contains unique spatiotemporal characteristics. Because an interferogram stack is produced by combining multiple interferograms that share the same primary image, it is important to select a primary image that minimises decorrelation caused by spatial and temporal baselines during the combination stage. The programme automatically calculates the most suitable primary image. Then, a connection graph is produced, indicating the correlation between images on specific dates and the rest with the baseline length.
  • Once the primary image is determined, the remaining images are aligned to the coordinate system of the primary image through co-registration. Subsequently, a flattened radar reflection intensity map is created through convolution calculation, allowing for the correction of look and squint angle errors, which occur when converting a DEM with the divergence of Earth’s curvature to the radar coordinate system.
    Through the interferometry process, N − 1 interferograms are generated as a result of the primary–secondary combination, which is 29, where N represents the total number of SAR images imported.
  • An inversion calculation is performed to create a linear model, as expressed in Equation (4), on the flattened radar reflection intensity map. A PS candidate is selected based on the set PS threshold, with the final relative height and subsidence velocity (mm/yr) at each point at the observation end time calculated through phase unwrapping based on the surrounding reference points.
    D i s p = V × ( t t 0 )
  • In the linear model generated in the previous step, an additional inversion calculation is performed to remove the phase errors owing to the atmosphere, which are expressed as the constant K. The impact on the final displacement is dependent on the strength of atmospheric filter effects, and it is important to determine the appropriate spatiotemporal effect ranges of the filter. This process can result in the calculation of subsidence per filming data, and the composition of a time series. Equation (5) represents the calculation of final displacement D i s p 1 .
    D i s p 1 = K + V × ( t t 0 )
  • Given that the resultant displacement value is relative, the DEM file at the geocoding step is considered to convert it into actual height data. Subsequently, the analysis is finalised by the reprojection of data to the actual geographical coordinates, thus aligning the dataset with real-world locations.
The geocoded data were exported in .shp format and then interpreted using QGIS.
An initial qualitative evaluation was performed in the QGIS interface, utilising a Google Map background layer for reference. The analysis focused on the number of Persistent Scatterers (PSs), as well as their density, target sensitivity, and other relevant parameters.

3. InSAR Parameter Optimisation

3.1. Data Acquisition

We utilised 30 TerraSAR-X images in a descending direction for the PS-InSAR analysis. The filming resolution was 3 × 3 m in strip-map mode. The filming duration was 781 days, with most of the data collected every 22 days, but sometimes every 77 days, concerning the satellite repeat period. Table 2 presents the main specifications of TerraSAR-X.
As the LOS axis of the satellite was different from the Z-axis of the ground, a separate SAR Sensor was required to fix the coordinates through comparisons with each other to estimate the vertical displacement on the surface. Chang et al. [10] and Qin et al. [12] attempted to solve this problem by synthesising vertical vector products through two satellites compatible with Sentinel; however, we estimated the displacement along the LOS direction of TerraSAR-X, which facilitated accuracy improvement.
Selecting the appropriate polarisation is crucial for enhancing the quality of analysis; however, we were limited by the availability of the data. Since TSX images are captured on a request basis, the only available dataset for our area of interest consisted of archived images taken between 2016 and 2018, with no other polarisation options available. Future research may explore optimised sources and a greater number of images to potentially improve analysis outcomes.
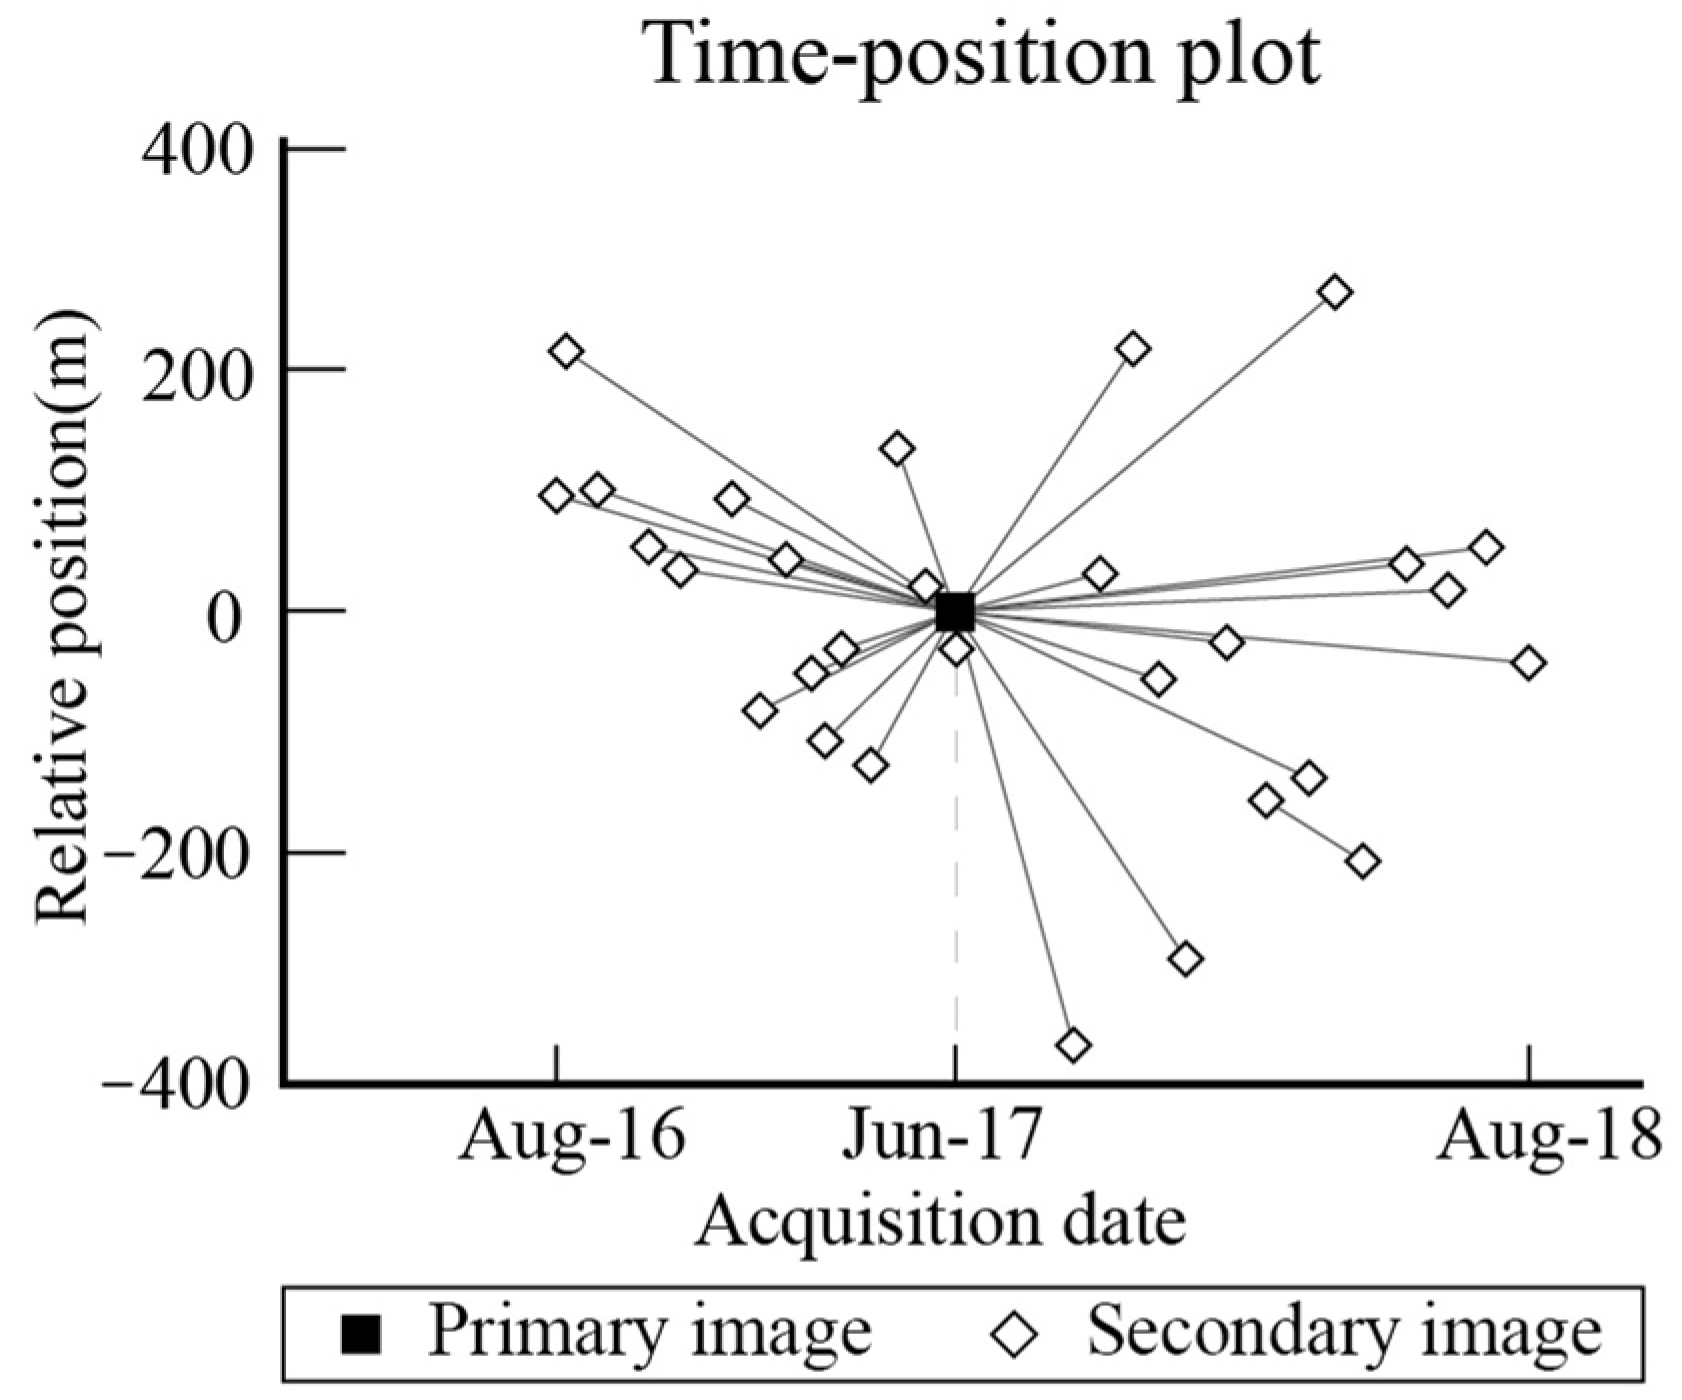
Figure 9 displays a time–position plot generated by the minimum baseline algorithm. The black square at the centre represents the primary image, while the hollow diamonds illustrate the secondary images, showing their relative positions over time. The image captured in June 2017 served as the primary image. This graphical representation helps visualise the temporal and spatial relationships among the images used in our analysis, which complements the practical aspects of data collection.
Complementing the technical data acquisition, the field survey data were also prepared for comparison and fitting of the PS-InSAR data. The railway line was closely monitored by national railway authorities from the construction stage due to significant subsidence, resulting in survey data collected using typical levelling techniques with millimetre accuracy. These data were obtained in a limited portion for research purposes and represent the relative movement of the surface after subtracting the original height from the recording’s end date.
Unfortunately, the field data and PS-InSAR data do not share the same coordinate system; the geocoded data were provided on an azimuth-range basis, which can be converted into real-world units but may have errors due to the sensor’s pixel resolution of approximately 3 m. Future improvements could involve using SAR images with better resolution or implementing an automatic coordinate augmentation system.

3.2. Parametric Analysis

Given the target bridge’s deeply buried foundation, it was not significantly affected by surface subsidence, and we anticipated negligible line-of-sight (LOS) directional changes in the bridge even as changes to the Earth’s surface occurred. However, in such a scenario, the effects of parameter adjustments might not be easily noticeable, and the PS-InSAR analysis method’s stochastic errors could potentially obscure the adjusted values. Hence, we focused on earthwork sections near the bridge, comparing the PS-InSAR analysis results with the field measurements to identify parameter sets that aligned as closely as possible with these measurements.
The choice of embankment data for validation in this study was made primarily to find the optimal parameters. These instances should be seen as examples serving this purpose, rather than a comprehensive analysis of embankment behaviour, but to use these data to refine our methodology.
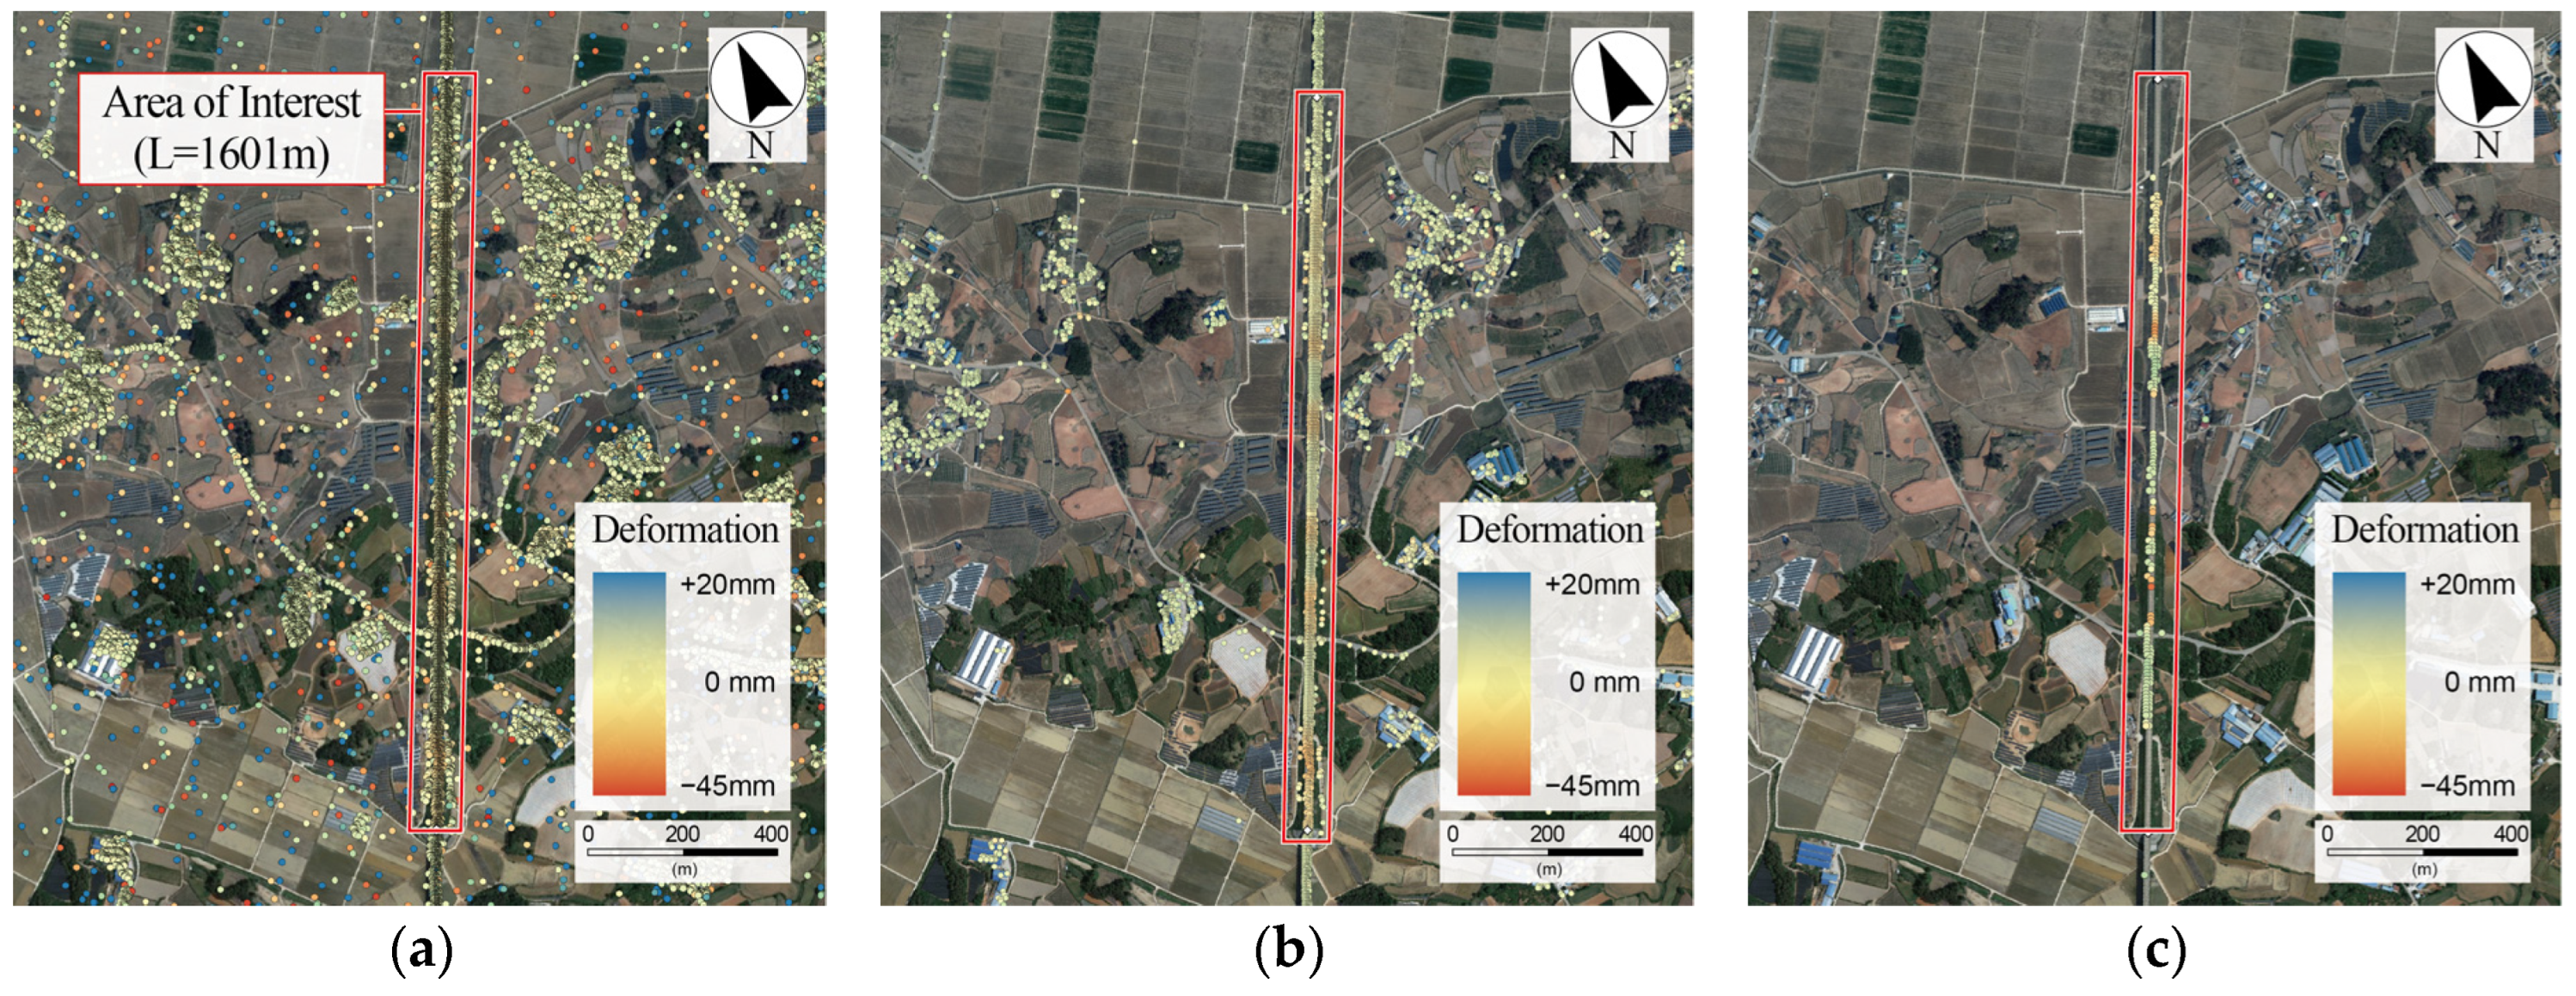
We adjusted parameters such as the interferometry look scale (both azimuth direction and range direction), coherence threshold, and signal-to-noise ratio (SNR) using controls available in ENVI SARscape, as detailed in Table 3. These directly influenced the final PS density. Initially, we expected a more accurate analysis with a higher number of PSs; however, setting these parameters too low resulted in too many PSs, making it difficult to distinguish the embankment and outliers with low coherence. Additionally, calculation time increased geometrically. Through trial and error, we determined an appropriate PS density.
There were practical challenges regarding the PS density. First, it was technically challenging to ensure that PS point clouds exclusively targeted the railway line, as the PS-InSAR process is influenced by the probabilistic nature and varying reflective characteristics of surfaces. This inability to fully control point cloud placement made it necessary to optimise parameter settings to balance precision with computational efficiency.
The next problem is related to the data continuity. PS point clouds represent discrete data points rather than continuous datasets, requiring a minimum number of aligned point clouds to draw meaningful trends.
Figure 10 compares the results by reflecting these differences.
The red boxes outline the area of interest, where the analysis was focused. The scarlet point clouds indicate significant subsidence, while those with blue colour indicate uplift. The values for each are later presented in Figure 11. Figure 10a–c show images of the same area with low, moderate, and high filtering effects, respectively, after adjusting the above-mentioned parameters. Since Figure 10c significantly lacks data, a threshold was set for PS density to ensure continuity, considering results with gaps exceeding 35 m as unfavourable. For example, Figure 10a,b meet this continuity criterion, while Figure 10c does not. Although Figure 10a is predicted to offer the most accurate results, it requires substantial resources, making Figure 10b a more practical compromise between resource use and data accuracy.
For the bridge analysis, we initially set the scale parameters to a double factor to achieve an appropriate PS density, as shown in Figure 10b, and then fine-tuned the relevant parameters. The selection of maximum velocity values at 1.3 times the most drastic subsidence velocity was primarily aimed at optimising the PS-InSAR analysis for stable infrastructures like railway tracks and bridges, which are the main focus of this study. Given the high frequency and sensitivity of the TerraSAR-X sensor, an X-band sensor, our approach was designed to ensure the reliable detection of micro-level changes without overwhelming the analysis with sudden, large-scale displacements potentially caused by extreme events like earthquakes or eruptions.
The atmospheric filter (High, Low) and the minimum PS density parameter (Mu-sigma threshold) influenced PS density and shifted the zero-point on the subsidence graph. The shift was small, making it suitable for fitting to the field measurements.
Through repeated tests, three representative parameter sets (A, B, and C) were prepared for comparison.
Table 3 presents the differences among these parameter sets.
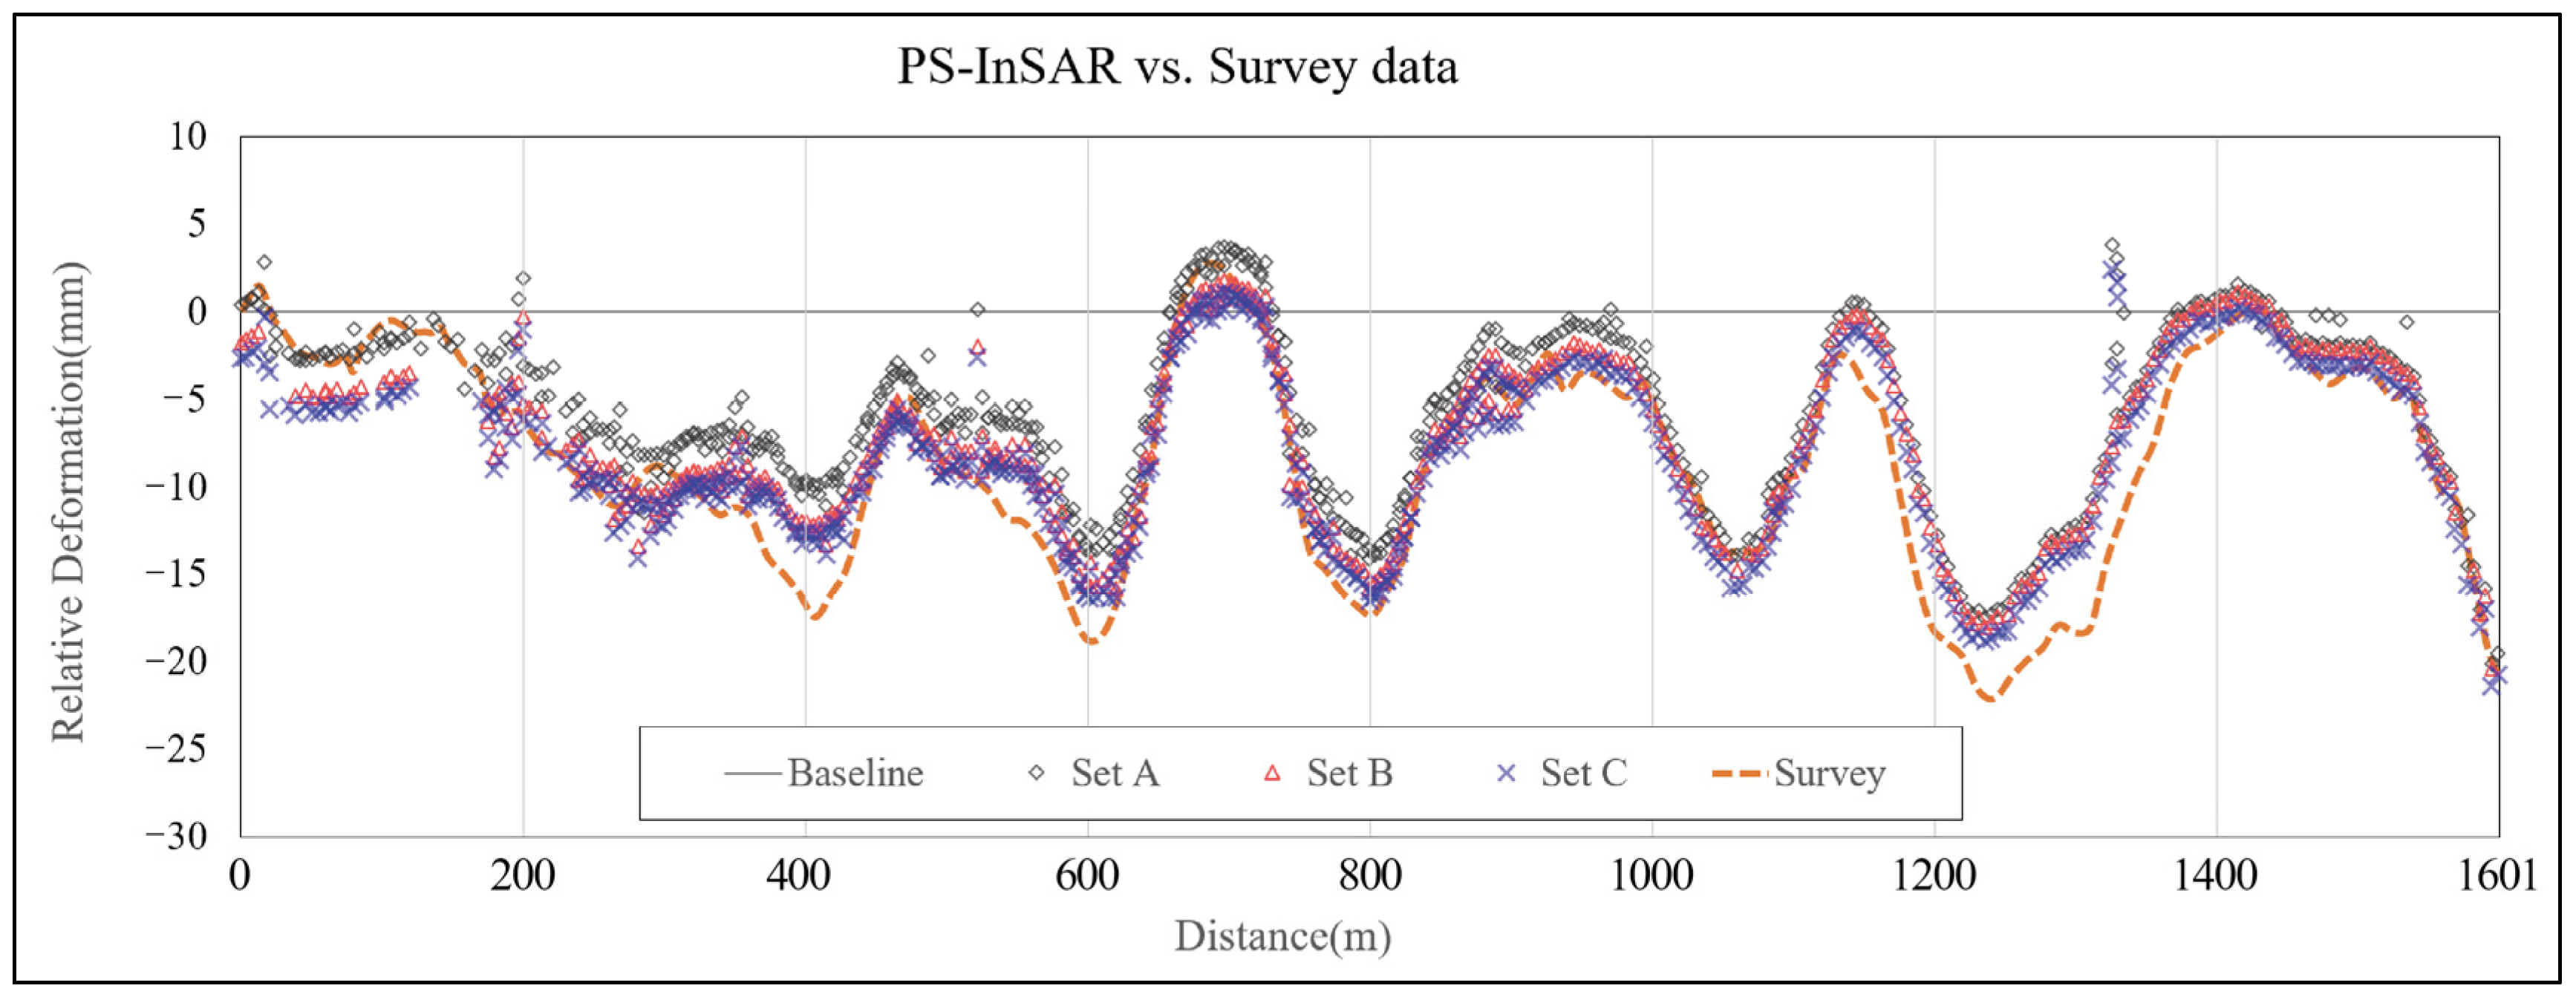
Figure 11 presents the comparison between the three parameter sets (A, B, and C), which were tested in the data zero-point adjustment process, with values of field measurements at the reference embankment. Refer to Figure 10 for the background.
In Set A, we raised the Sub-area Overlap from 25% to 30%. In Sets B and C, we applied weak and strong atmospheric filter effects, respectively. The filter effect became weaker when the low pass filter value was smaller, and the effect became stronger when the high pass filter value was larger.
Set A was well matched with field measurements before 200 m; however, after 200 m, it showed an underestimation tendency compared to Sets B and C. In Sets B and C, the overestimation tendency was observed before 200 m and at approximately 860 m; however, assuming that the underestimation has a higher risk than the overestimation under the purpose of the InSAR analysis, Sets B and C are more suitable than Set A. The difference in the data zero-point between Sets B and C was small (2.5 mm); however, Set C contained more collected PS data. Based on the previous comparison results, we found that Set C was the most suitable as it recorded values closer to peak values at 280, 410, 800 and 1060 m. According to this hypothesis, as the atmospheric filter becomes weaker within the observation range, the zero-point moves toward minus, and a higher number of PSs are found. However, if the filter level is lowered than necessary, the data reliability will be affected. As shown in Table 4, we determined Set C as the optimal parameter for topography conditions and thus applied it for analysing the bridge.

4. Results

4.1. Preliminary Displacement Patterns and Observations

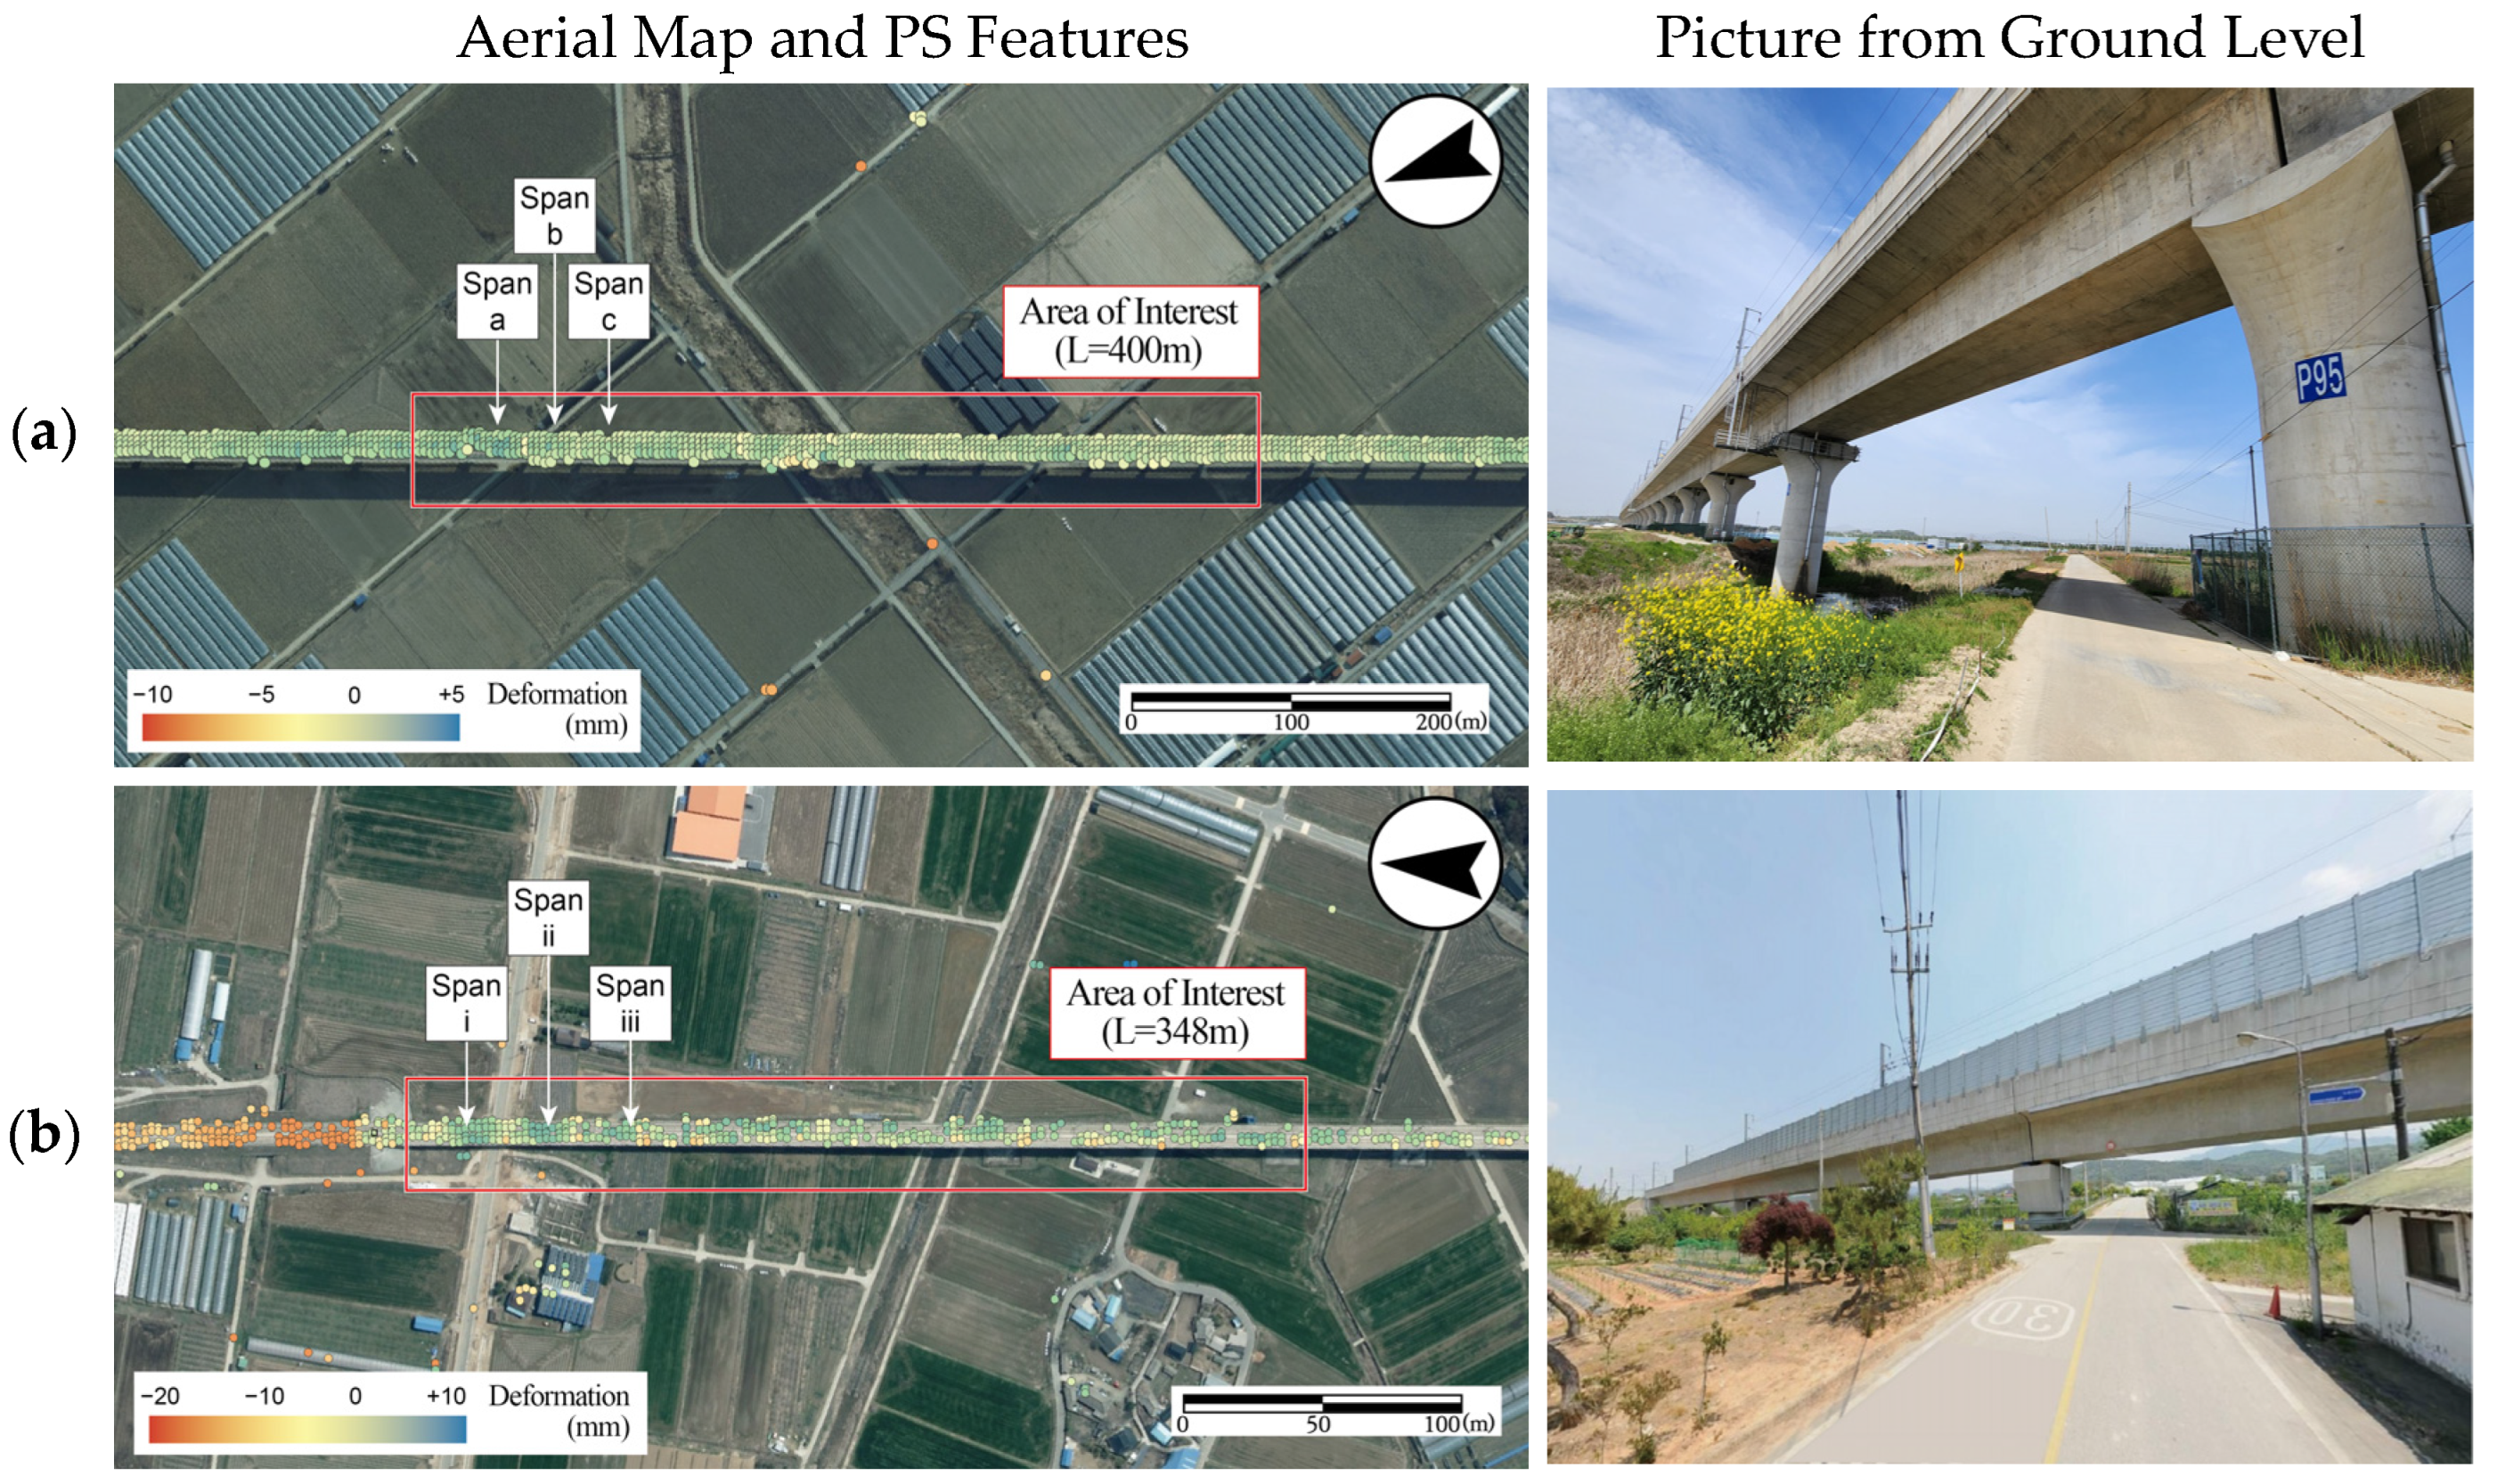
Two independent bridges, Bridges A and B, were chosen from the previously mentioned line. Figure 12 presents the PS-InSAR results of Bridges A and B on the aerial map. The photographs indicate the topographical features of each bridge and the background of structures.
Bridge A (Figure 12a) is a 9.1 km continuous flyover crossing above plain areas. Around the filming areas, specifically within a radius of 2 km from the area, there are no slopes such as mountains or hills. Further, the linearity exhibits a gentle gradient, and the pier height is constant. The area has typical rural area features with few buildings and more agricultural land in the surrounding. There may be a disturbance of the topsoil caused by the water inflow and crop cultivation, which are the features of farmland, leading to no PS point cloud being found except for the target bridge.
Bridge B (Figure 12b) is a relatively short flyover (the length of 730 m) connecting a series of tunnels. Bridge A is located in a gentle plain area, whereas Bridge B is in a mountainous area. Further, Bridge B is also located in rural areas with abundant farmland; however, the presence of small villages around the bridge result in the recognition of fixed structures such as private houses and barns as the PS. Bridge B has a metal soundproof wall on one side of the wall to prevent any noise damage to private houses in the surrounding. Considering that the soundproof wall has an excellent radar reflection characteristic, there must be an impact on the improvement of analysis quality.
Similar to the railways, roads are also strong PS candidates; however, there were only a few point clouds of roads in the analysis result. This is because the coherence threshold was increased during the analysis to leave a clear railway linear pattern in the results. Such an attempt led to the following outcome: roads and several buildings with relatively low coherence were excluded from PS candidates, and the railway bridge, the structure with very high coherence, was retained.
Figure 13 and Figure 14 illustrate the PS-InSAR results along the horizontal profiles of Bridges A and B, respectively. The X-axis represents positions along bridges’ longitudinal direction, while the Y-axis shows the cumulative deformation of the reflective surfaces measured from a 0 mm baseline over two years.
Bridge A exhibited a consistent pattern where the final displacement increased from 0 mm to a maximum of 4 mm and then returned to 0 mm every 40 m over a distance range of 0–320 m. Minimal deformations, close to 0 mm, were observed at both ends of the span (i.e., piers), indicating that the analysis results accurately reflected the shape of the continuous span.
Bridge B displayed similar patterns within the 0 to 160 metre range. However, the absolute displacements reached a maximum of 6 mm, greater than those of Bridge A. Beyond 160 m, the point clouds became sparser and exhibited unclear tendencies, suggesting poorer analysis quality for Bridge B compared to Bridge A.
PS density, defined as the number of PS candidates generated within a certain area, increases with higher sampling rates, image resolution, and reflection intensity. Consequently, PS density is considered a criterion directly related to the quality of analysis results. Table 5 shows the converted density values of all PS point clouds generated at each bridge. The PS density indicates that both Bridges A and B have good reflection features [25,26,27].
The two bridges have certain common features. When closer to the bridge abutment connecting to the earthwork, a clearer displacement trend was found. In contrast, when farther, the analysis quality became poorer, which was attributed to an insufficient coherence of the centre of the bridge extension. The main contributors to lower coherence were the height difference from the ground, vegetation, road intersection, or sparseness of the surrounding PS. The characteristics of radio frequency waves using a high-frequency short wavelength are considered an initial influencer. The deteriorated coherence at road intersections is attributed to the interference of more than two types of strong radar reflection signals. Such radar suppressing effect has been frequently observed in SAR operations and can be partially resolved with the data filtering technique [28,29].
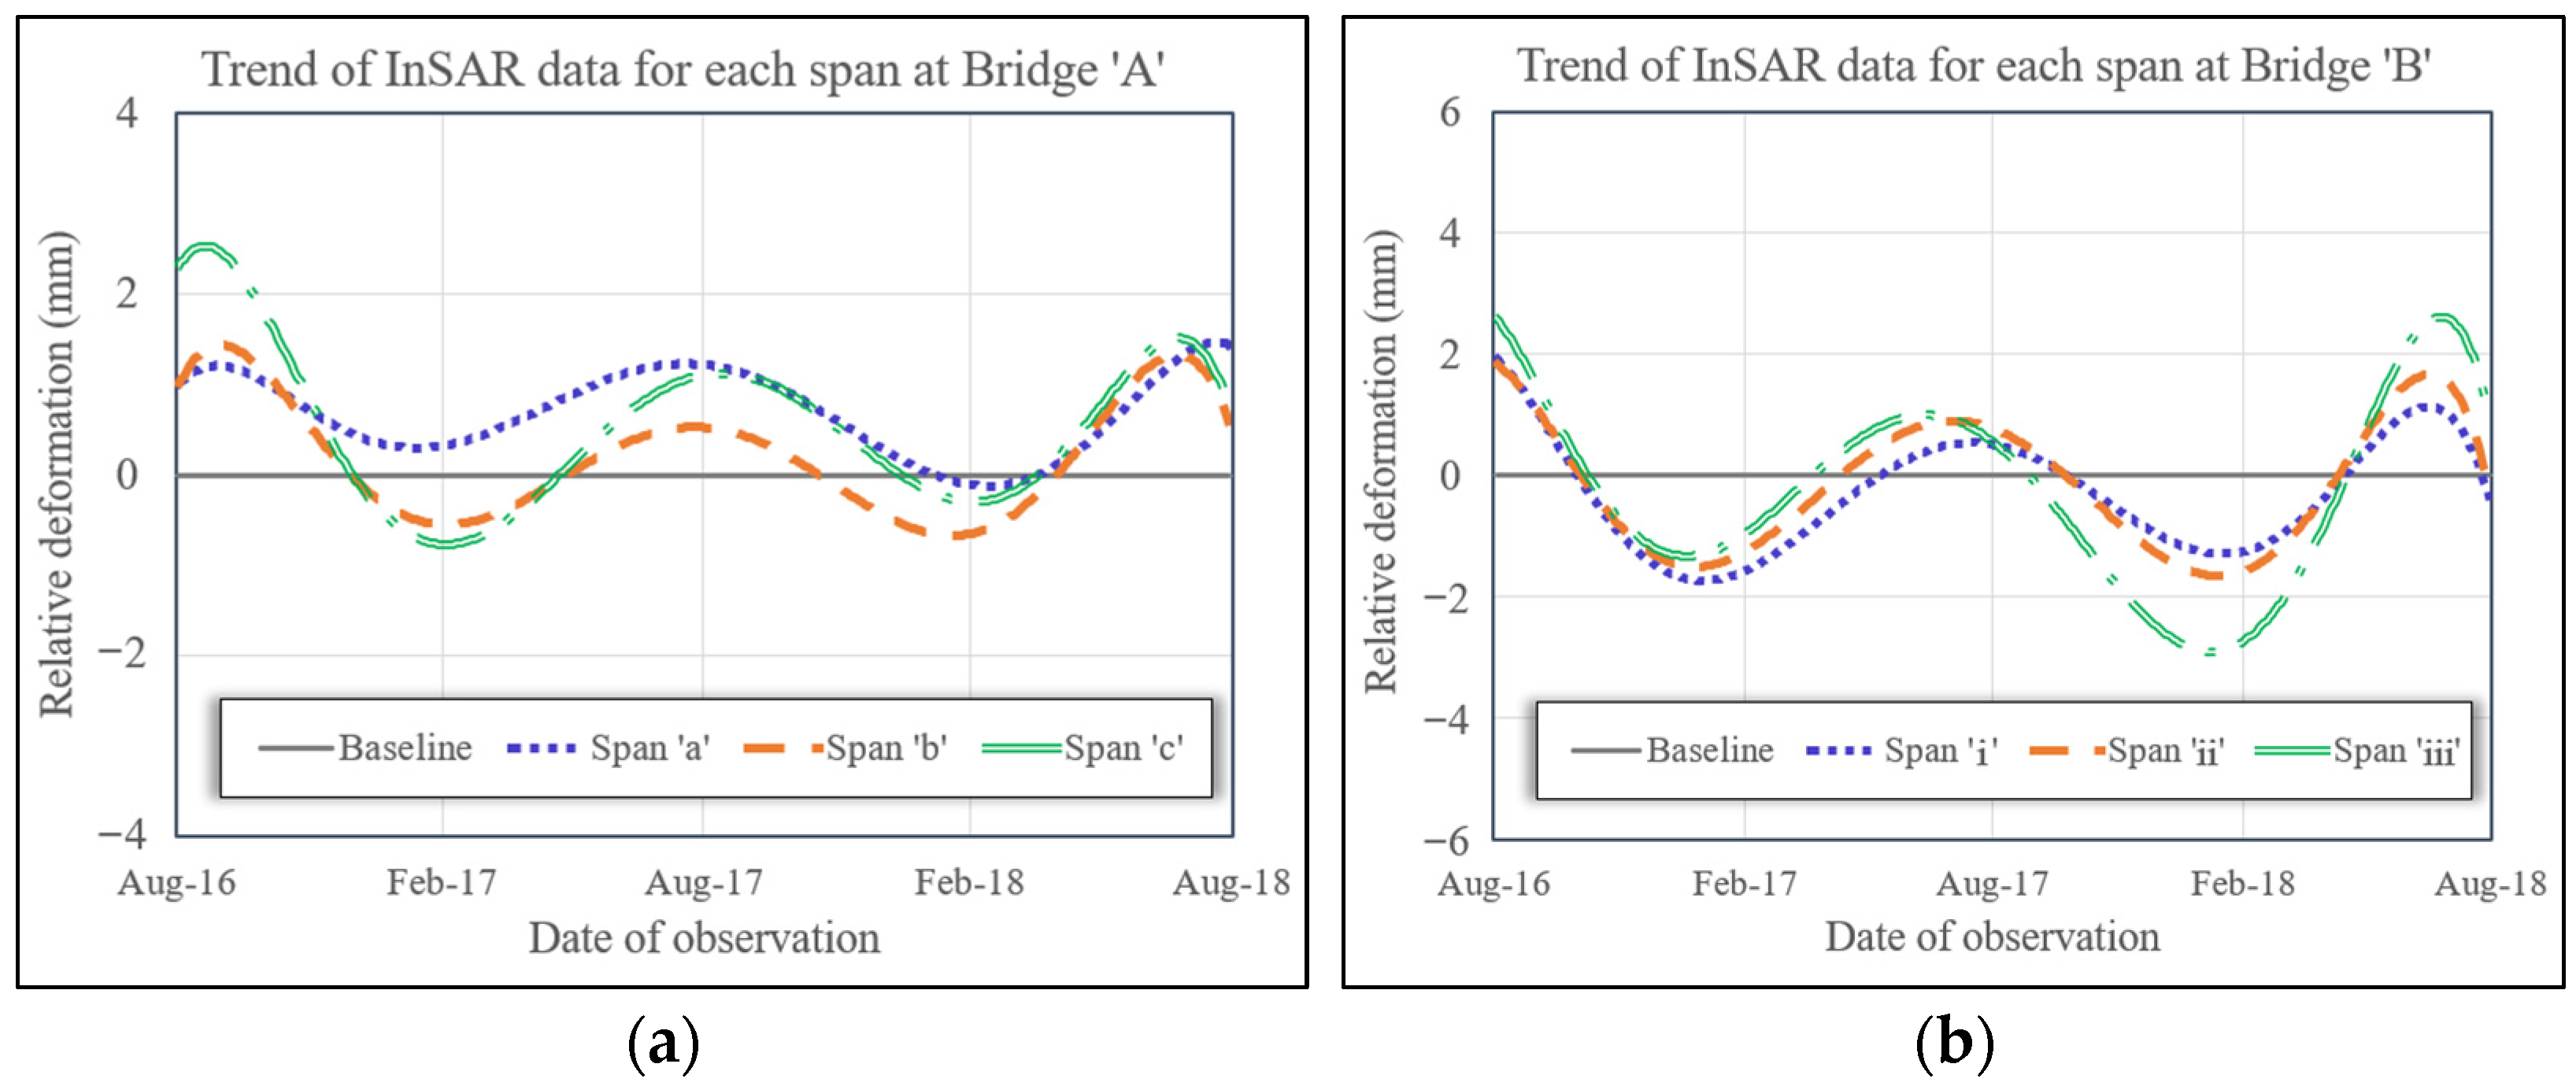
Figure 15 shows the expanded graphs in units of 40 m spans after selecting three consecutive spans (refer to Figure 13 for their specific positions) from the total 400 m out of the PS-InSAR analysis result for Bridge A presented in Figure 12. Here, the longitudinal PS data on the same axis were averaged and synthesised into one point. Figure 16 shows the displacement histories after extracting time-series data from PSs closest to the centre of each span in Figure 12. Further, curve fitting was applied to the arranged displacement data in a chronological sequence to obtain a sine wave increasing over two years.
The PS-InSAR analysis results for Bridge B are also shown in the abovementioned same manner in Figure 17 and Figure 18; each figure represents the expanded graph in units of spans and time-series data from PSs closest to the centre of each span. After applying the polynomial function Fitting, the sine wave was observed to increase over two years.
Fast Fourier Transform (FFT) was applied to quantitatively assess behaviour, especially on the periodicity in the PS-InSAR data across all six spans from Figure 16 and Figure 18, selected due to the data’s sampling characteristics and observed trends. The sampling rate was established at 0.588 samples per day, with a frequency resolution of 2.26 × 10⁻³ Hz. FFT analysis identified a dominant periodicity with a peak frequency corresponding to a cycle of approximately 441 days, slightly longer than the typical annual cycle. This error is due to the rough frequency resolution; further studies with more frequent samples or extended monitoring periods may obtain values closer to 365 days. Nevertheless, Figure 16 and Figure 18 present the PS-InSAR analysis results, confirming a constant trend being repeated on an annual basis in the time-series data of the six spans.
Spans a and ⅰ were closer to the connecting parts of the earthwork, and Spans c and ⅲ showed the reverse trend. As the distance increased from the connecting parts, the displacements at the centre of spans increased, and the slope of the time-series trend line was also higher. This rendered the identification of seasonal effects easier. Time-series data in Bridge A exhibited distribution patterns compared to those of Bridge B. Moreover, as the absolute deformation amount of Bridge A was lower than that of Bridge B, interpretation errors appeared to have a greater impact on Bridge A.

4.2. Characteristics of Long-Term Behaviour (Camber) and Results

The long-term behaviour of reinforced concrete can be explained by the initial rapid displacement, and subsequently based on the accumulation of concrete self-weight, travelling train load, and relaxation of post-tensioning. Considering the time of completion of the target line, the initial deformation period already passed, and the deformation may be linearly accumulated, or be closer to convergence.
If seasonal fluctuations driven by expansion or contraction owing to temperature are eliminated in the initial deformation graph, the long-term behaviour of the girder can be identified. The temperature effect fluctuating in a sine wave is repeated on an annual basis [30]. Assuming that there are no other factors inducing deformation, there is no difference between the deformations found at the same period every year. We excluded the climate change impacts because we assumed that the effects would be insignificant owing to the observation period being only two years.
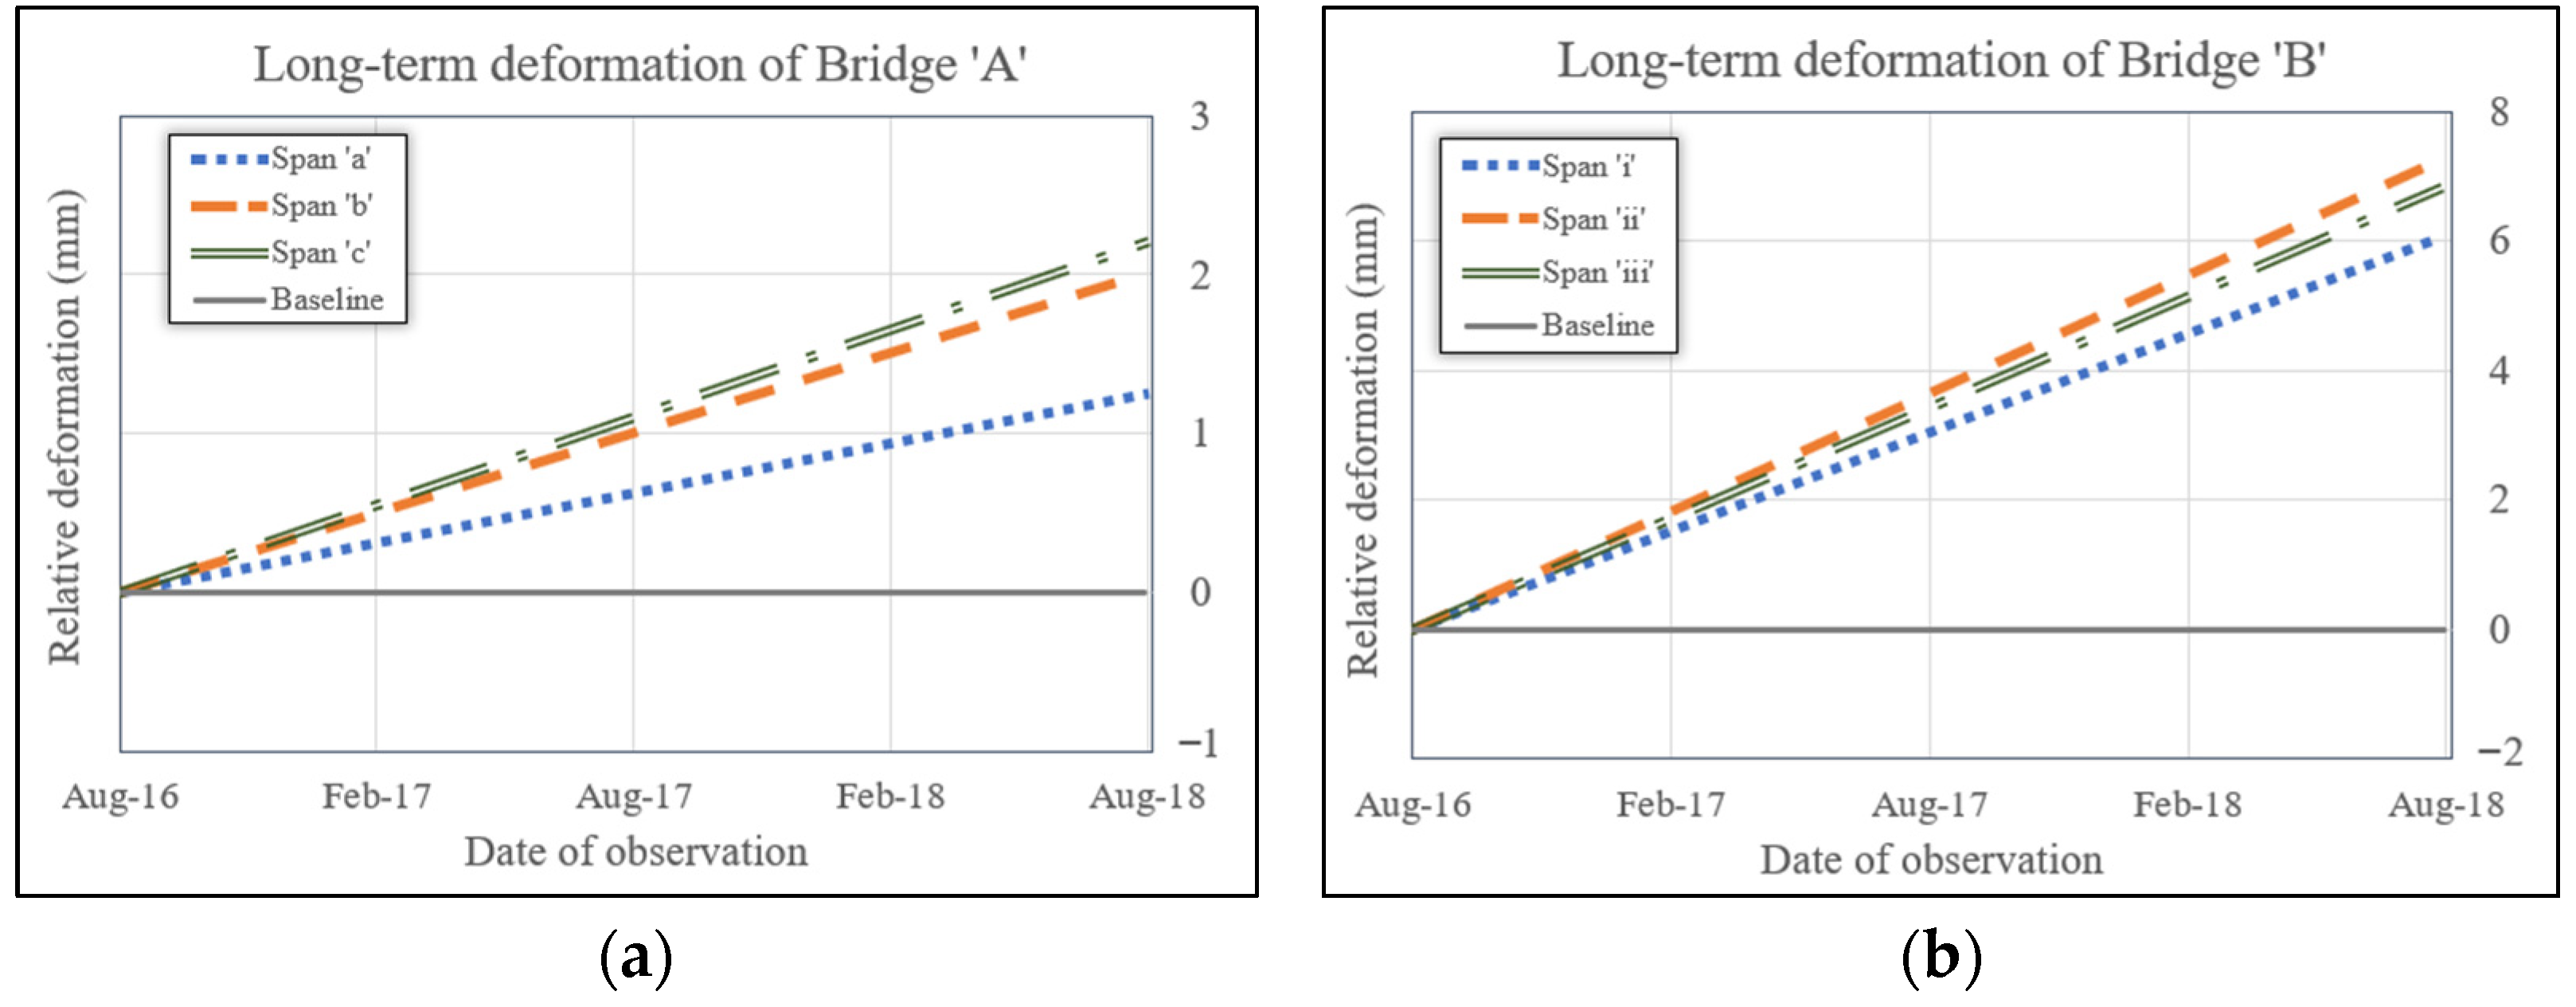
Figure 19 presents the calculation of long-term deformation of reinforced concrete, which considers factors beyond temperature changes. Despite the complexity of external influences that prevent a perfectly linear deformation pattern, a simplified approach based on stress–strain theory was employed [31]. The long-term deformation illustrated in Figure 19 is derived from PS-InSAR results, similar to what is shown in Figure 16 and Figure 18, but with a focus on isolating permanent deformation. This was achieved using Microsoft Excel’s linear trendline feature, with August 2016 set as the baseline reference point. Future studies could further refine this analysis by more precisely evaluating the effects of temperature on long-term deformation.
Table 6 summarises the linear long-term behaviour calculation results.
Bridges A and B both showed a larger displacement of the span centre for the case when the spans were farther from the connecting part to the earthwork, instead of when they were closer to the part. The average displacements of Bridges A and B were 0.91 and 3.34 mm/yr, respectively. The standard deviations were 0.21 and 0.25, respectively, and the span of Bridge A with a smaller absolute displacement was slightly closer to the average. Even bridges designed with the same cross-sections exhibited differences in cumulative displacements owing to complex factors such as the concrete mix, quality difference in used aggregates, relaxation difference in post-tensioned tendons, and annual variation on weekdays owing to topographical differences.

4.3. Expansion or Contraction Owing to Temperature from Seasonal Changes

If the long-term behaviour of concrete, which was assumed to be linear in Figure 19, is subtracted from the results of Figure 16 and Figure 17, the expansion or contraction owing to temperature can be separated, as shown in Figure 20. Satellite observation started around August, which is the period recording the highest temperature of the year according to Figure 3. Consequently, we amended the relative displacements after adding the bridge’s median height throughout the year. Hence, 0 mm in Figure 20 is a relative value for the comparison of the bridge deck. Figure 20 indicates a sine wave fitting curve repeated every two years for Bridges A and B.
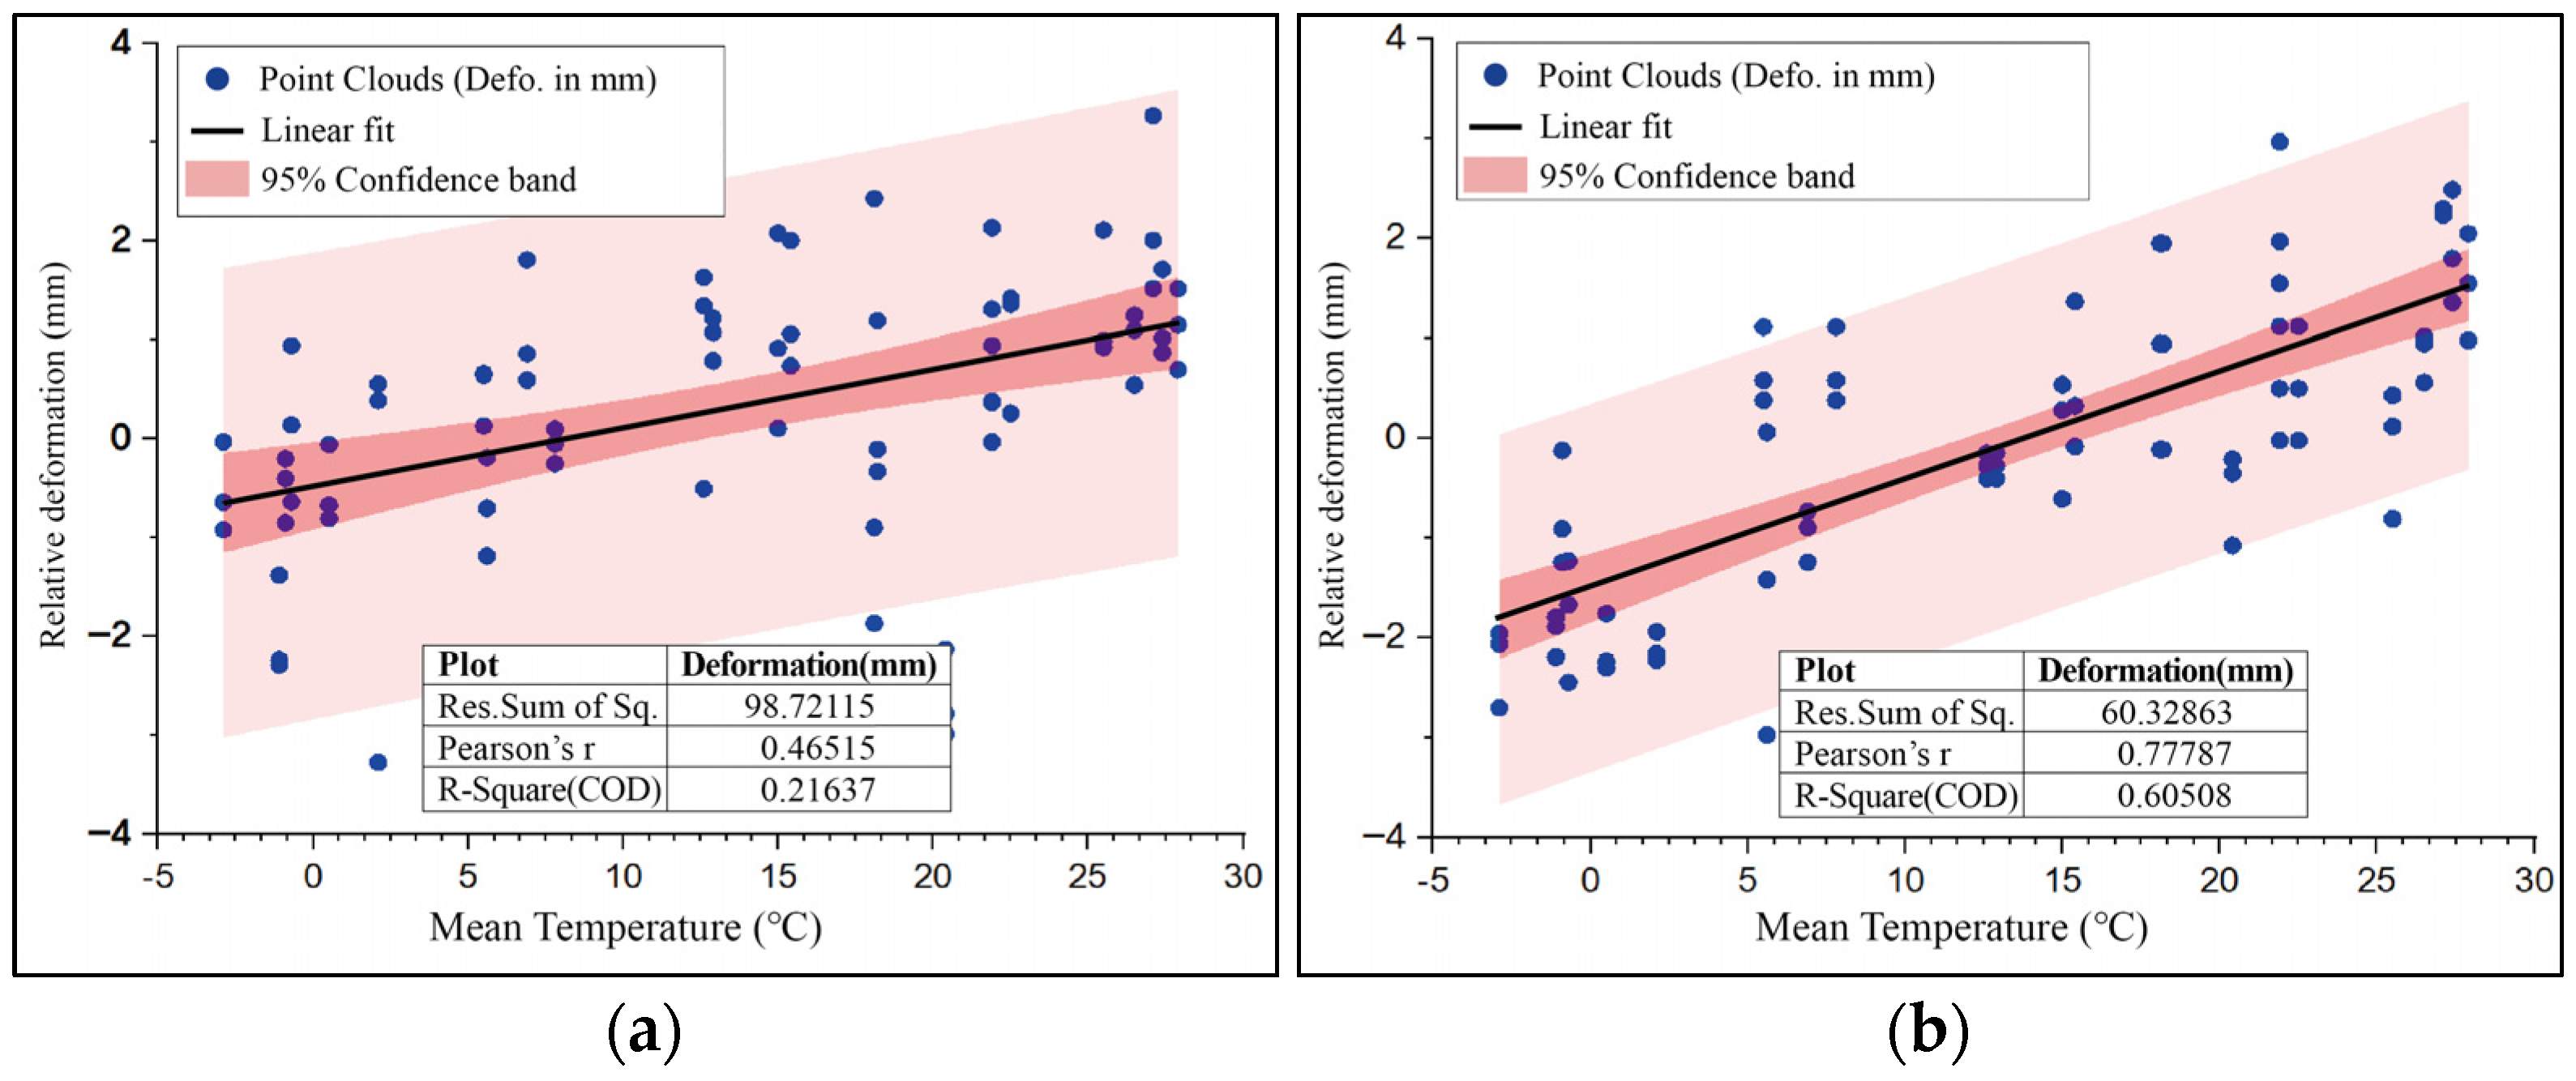
We also compared the average temperature (X-axis) and bridge displacements (Y-axis) at the time when each image was captured, as in Figure 21 to verify whether the measured displacements by InSAR reflected an expansion or contraction owing to temperature [32]. We used OriginPro 2023® ’s (by OriginLab®) linear fitting tool to plot the slope and then calculated Pearson’s r with R2 through residual analysis. We assumed a linear relationship between temperature and bridge expansion or contraction as per Equation (1). Figure 21 indicated the linear trend line wherein an increase in the average temperature at Bridges A and B increased the displacements and vice versa.
The values of Pearson’s r and R2, which were derived from the linear regression analysis, are presented in Table 7.
Based on Pearson’s r value, an indicator of correlation, we assessed that the analysis model showed a better fit in the Bridge B environment than in the Bridge A environment. Overall, both bridges exhibited moderate-to-strong levels of correlation. Regarding the R2 analysis, we found that both bridges showed upward slopes with higher temperatures; however, the increases in temperature changes were greater in Bridge B than in Bridge A. This suggests that the elastic displacement of Bridge B was greater than that of Bridge A. The linear relationship indicated by the R2 analysis method showed a weak-to-moderate fit for both Bridge A and Bridge B, with a stronger fit for Bridge B. Consequently, we observed a correlation between the elastic displacements of concrete derived by the PS-InSAR analysis method and the average annual temperature.
The comparison between the results above and the numerical analysis in the previous design section is presented in Table 8.
When comparing the extreme deformation values in summer and winter, we found that the deformation widths along the LOS direction of the bridges throughout the year were +2.39~−0.78 mm for Bridge A and +2.55~−2.60 mm for Bridge B. In other words, we obtained closer values to the width of the maximum deformation throughout the year (2.81 mm), which was calculated in the numerical analysis for Bridge A (Figure 7). The degree of consistency, calculated by comparing the range of deformation between the PS-InSAR time-series data and the numerical analysis was 78.2% for Bridge A and 154% for Bridge B. Certain values exceeded the expected values at Bridge B because of the possibility of the bridge having a larger behaviour pattern than its design owing to on-site environmental factors that were not reflected at the design stage, and the errors from the analysis method. Additional images can be utilised for more accurate measurement, and the analysis results can be verified by comparable measurement methods such as field surveys or sensor measurements. However, even if an error of approximately 2 mm is considered, the value is still acceptable under railway maintenance and management standards. Considering that road bridges, which are similar civil engineering structures, have shown annual deformations of a maximum of +12.1~−5.4 mm [26], the findings of this study are encouraging in terms of railway maintenance and management and safe operation.

5. Conclusions

5.1. Discussion

This study attempted to optimise the radar InSAR technology of the high-resolution TerraSAR-X satellite to develop a long-distance analysis technique applicable to railway bridges. We examined the reliability of the measurement results of the bridge deck via PS-InSAR and the possibility of detecting changes based on seasons and long-term deformation of concrete. The comparison of atmospheric temperature in corresponding areas, numerical analysis, and levelling measurement confirmed the appropriateness of satellite radar analysis of railway lines with concrete structures through experiments.
Upon examining the extracted data of three spans from each bridge, distinct behaviours were noted: in Bridge A, the annual maximum widths of height changes in the span centre were 1.36, 2.06, and 3.17 mm, respectively; in Bridge B, the widths were 4.00, 3.87, and 5.15 mm. This suggested more significant behaviour in Bridge B. These variations between Bridge A and Bridge B could potentially be attributed to multiple factors, including the specific combination of concrete mix, curing process, differences in used aggregates, differences in tendon relaxation, and annual temperature differences on weekdays due to topographical differences [18,28,29].
In our study, we observed that the height difference at the span centre of bridges, as estimated by PS-InSAR, was greater nearer to the centre of the extension than near the bridge abutment. However, we discovered the quality of analysis was higher at the bridge abutment, likely due to interferences such as height differences from the ground, vegetation, and road intersections as the distance from the bridge abutment increased. We found that the maximum difference between the heights of the centre of spans in summer and winter would be 2.81 mm in a 3D numerical analysis model generated with cross-sections of a bridge. After analysing the displacements of two bridges based on optimised parameter sets, repeated waveforms were found to increase over two years. Subsequently, the graph was separated into the component of structural expansion, with a sine wave reflecting year-round temperatures and the linear component reflecting the long-term deformation of reinforced concrete. By expressing the structural expansion component as a time series, we found a correlation between the displacements along the LOS direction of the bridges measured by PS-InSAR and the surrounding temperatures.

5.2. Summary

To conclude, our study has contributed to the development of a satellite data analysis technique with millimetre-level accuracy. This technique, grounded in our observations and findings, holds potential for establishing more accurate and effective maintenance and management plans for high-speed railways. We compared the displacements we found with the results of a numerical analysis, discovering a notable degree of consistency: 78.2% for Bridge A and 154% for Bridge B. This reinforces our findings and raises the reliability of our approach.

5.3. Future Works

Future research may address the discrepancy in reference systems, which could have caused errors in the results, by using SAR images with higher resolution or implementing an automatic coordinate augmentation programme. Enhancing the precision of InSAR measurements in this way could significantly improve the reliability of deformation assessments. Increasing the number of images could further refine analysis outcomes, while more frequent sampling or extended monitoring periods may enhance resolution, allowing for the capture of additional periodicities related to environmental influences, such as temperature variations.
While this study utilised a single type of satellite sensor, future work could achieve higher displacement measurement accuracy by synthesising vector products from multiple sensor types. Additionally, further studies on different bridge cross-sections and climate conditions would be advantageous.
The achievements will lead to improved designing, managing, and maintaining of railway bridges. By applying the same parameter optimisation and verification systems to large SOC structures such as roads, power plants, dams, and airports, higher accuracy in monitoring can be achieved. Ultimately, the results of this study are expected to contribute to the long-distance, accurate monitoring of the various types of SOC structures.

Author Contributions

Conceptualization, I.L.; methodology, W.K.; software, W.K. and C.L.; validation, C.L., B.-K.K. and K.K.; formal analysis, W.K. and K.K.; investigation, I.L.; resources, K.K.; data curation, B.-K.K.; writing—original draft preparation, W.K.; writing—review and editing, C.L. and B.-K.K.; visualisation, W.K.; supervision, I.L.; project administration, I.L.; funding acquisition, I.L. All authors have read and agreed to the published version of the manuscript.

Funding

This work was supported by the Korea Railroad Research Institute, Republic of Korea through the R&D programs “Multi-Satellite Data Application Strategy in the Development of National Railroad Network Monitoring Technology” grant number RP24150D and “Development of Technology for Recognition, Predicting and Responding to high-risk disasters for Deep Railway Tunnel and Underground Station” grant number MT24015B.

Data Availability Statement

The original contributions presented in the study are included in the article, further inquiries can be directed to the corresponding author.

Conflicts of Interest

The authors declare no conflicts of interest.

References

  1. Ferretti, A.; Prati, C.; Rocca, F. Nonlinear subsidence rate estimation using permanent scatterers in differential SAR interferometry. IEEE Trans. Geosci. Remote Sens. 2000, 38, 2202–2212. [Google Scholar] [CrossRef]
  2. Ferretti, A.; Prati, C.; Rocca, F. Permanent scatterers in SAR interferometry. IEEE Trans. Geosci. Remote Sens. 2001, 39, 8–20. [Google Scholar] [CrossRef]
  3. Hooper, A.; Zebker, H.; Segall, P.; Kampes, B. A new method for measuring deformation on volcanoes and other natural terrains using InSAR persistent scatterers. Geophys. Res. Lett. 2004, 31, 23. [Google Scholar] [CrossRef]
  4. Hooper, A. Persistent Scatterer Radar Interferometry for Crustal Deformation Studies and Modeling of Volcanic Deformation. Ph.D. Thesis, Stanford University, Stanford, CA, USA, 2006. Available online: https://web.stanford.edu/group/radar/people/Hooper_Thesis.pdf (accessed on 24 June 2024).
  5. Luo, Q.; Perissin, D.; Lin, H.; Zhang, Y.; Wang, W. Subsidence monitoring of Tianjin suburbs by TerraSAR-X persistent scatterers interferometry. IEEE J. Sel. Top. Appl. Earth Obs. Remote Sens. 2013, 7, 1642–1650. [Google Scholar] [CrossRef]
  6. Macchiarulo, V.; Milillo, P.; Blenkinsopp, C.; Giardina, G. Monitoring deformations of infrastructure networks: A fully automated GIS integration and analysis of InSAR time-series. Struct. Health Monit. 2022, 21, 1849–1878. [Google Scholar] [CrossRef]
  7. Macchiarulo, V.; Milillo, P.; Blenkinsopp, C.; Reale, C.; Giardina, G. Multi-Temporal InSAR for transport infrastructure monitoring: Recent trends and challenges. Proc. Inst. Civ. Eng. Bridge Eng. 2022, 176, 92–117. [Google Scholar] [CrossRef]
  8. Milillo, P.; Bürgmann, R.; Lundgren, P.; Salzer, J.; Perissin, D.; Fielding, E.; Biondi, F.; Milillo, G. Space geodetic monitoring of engineered structures: The ongoing destabilization of the Mosul dam, Iraq. Sci. Rep. 2016, 6, 37408. [Google Scholar] [CrossRef]
  9. Milillo, P.; Perissin, D.; Salzer, J.; Lundgren, P.; Lacava, G.; Milillo, G.; Serio, G. Monitoring dam structural health from space: Insights from novel InSAR techniques and multi-parametric modeling applied to the Pertusillo dam, Basilicata, Italy. Int. J. Appl. Earth Obs. Geoinf. 2016, 52, 221–229. [Google Scholar] [CrossRef]
  10. Delgado Blasco, J.; Foumelis, M.; Stewart, C.; Hooper, A. Measuring Urban Subsidence in the Rome Metropolitan Area (Italy) with Sentinel-1 SNAP-StaMPS Persistent Scatterer Interferometry. Remote Sens. 2019, 11, 129. [Google Scholar] [CrossRef]
  11. Struhár, J.; Rapant, P. Spatiotemporal visualisation of PS InSAR Generated Space–Time Series Describing Large Areal Land Deformations Using Diagram Map with Spiral Graph. Remote Sens. 2022, 14, 2184. [Google Scholar] [CrossRef]
  12. Chang, L.; Dollevoet, R.; Hanssen, R. Railway infrastructure monitoring using satellite radar data. Int. J. Railw. Technol. 2014, 3, 79–91. [Google Scholar] [CrossRef]
  13. Yang, Z. Monitoring and Predicting Railway Subsidence Using SAR and Time Series Prediction Techniques. Ph.D. Thesis, The University of Birmingham, Birmingham, UK, 2015. [Google Scholar]
  14. Qin, X.; Liao, M.; Zhang, L.; Yang, M. Structural health and stability assessment of high-speed railways via thermal dilation mapping with time-series InSAR Analysis. IEEE J. Sel. Top. Appl. Earth Observ. Remote Sens. 2017, 10, 2999–3010. [Google Scholar] [CrossRef]
  15. Milillo, P.; Giardina, G.; Perissin, D.; Milillo, G.; Coletta, A.; Terranova, C. Pre-collapse space geodetic observations of critical infrastructure: The Morandi Bridge, Genoa, Italy. Remote Sens. 2019, 11, 1403. [Google Scholar] [CrossRef]
  16. Jung, J.; Kim, D.; Palanisamy Vadivel, S.; Yun, S. Long-term deflection monitoring for bridges using X and C-band time-series SAR interferometry. Remote Sens. 2019, 11, 1258. [Google Scholar] [CrossRef]
  17. Lazecky, M.; Hlavacova, I.; Bakon, M.; Sousa, J.J.; Perissin, D.; Patricio, G. Bridge displacements monitoring using space-borne X-band SAR interferometry. IEEE J. Sel. Top. Appl. Earth Observ. Remote Sens. 2016, 10, 205–210. [Google Scholar] [CrossRef]
  18. Markogiannaki, O.; Xu, H.; Chen, F.; Mitoulis, S.A.; Parcharidis, I. Monitoring of a landmark bridge using SAR interferometry coupled with engineering data and forensics. Int. J. Remote Sens. 2022, 43, 95–119. [Google Scholar] [CrossRef]
  19. Farneti, E.; Cavalagli, N.; Costantini, M.; Trillo, F.; Minati, F.; Venanzi, I.; Ubertini, F. A method for structural monitoring of multispan bridges using satellite InSAR data with uncertainty quantification and its pre-collapse application to the Albiano-Magra Bridge in Italy. Struct. Health Monit. 2023, 22, 353–371. [Google Scholar] [CrossRef]
  20. Youssef, G. General Properties of Polymers; Linear elastic behavior of polymers. In Applied Mechanics of Polymers: Properties, Processing, and Behavior, 1st ed.; Elsvier: Amsterdam, The Netherlands, 2022; pp. 33–38, 79–107. [Google Scholar]
  21. Korean Design Standards (KDS). General Design Criteria for Railway Bridges, KDS 24 12 20. 2021. Available online: https://www.kcsc.re.kr/StandardCode/Viewer/40145 (accessed on 24 June 2024).
  22. Hanssen, R.F. Subsidence Monitoring Using Contigous and PS-InSAR Quality Assessment Based on Precision and Reliability. In Proceedings of the 11th FIG Symposium on Deformation Measurements, Santorini, Greece, 25–28 May 2003; Available online: https://w.fig.net/resources/proceedings/2003/2003_comm6_greece.htm (accessed on 11 August 2024).
  23. PS Tutorial Version 5.6.2. Available online: https://www.sarmap.ch/tutorials/PS_v562.pdf (accessed on 24 June 2024).
  24. Synthetic Aperture Radar and SARscape®. Available online: https://www.sarmap.ch/pdf/SAR-Guidebook.pdf (accessed on 24 June 2024).
  25. Berardino, P.; Fornaro, G.; Lanari, R.; Sansosti, E. A new algorithm for surface deformation monitoring based on Small Baseline differential SAR Interferometry. IEEE Trans. Geosci. Remote Sens. 2002, 40, 2375–2383. [Google Scholar] [CrossRef]
  26. Cusson, D.; Trischuk, K.; Hébert, D.; Hewus, G.; Gara, M.; Ghuman, P. Satellite-based InSAR Monitoring of Highway Bridges: Validation Case Study on the North Channel Bridge in Ontario, Canada. Transp. Res. Rec. 2018, 2672, 76–86. [Google Scholar] [CrossRef]
  27. D’Aranno, P.; Di Benedetto, A.; Fiani, M.; Marsella, M.; Moriero, I.; Baeno, J.A.P. An application of persistent scatterer interferometry (PSI) technique for infrastructure monitoring. Remote Sens. 2021, 13, 1052. [Google Scholar] [CrossRef]
  28. Potsis, A.; Reigber, A.; Papathanassiou, K. A phase preserving method for RF interference suppression in P-band synthetic aperture radar interferometric data. In Proceedings of the IEEE 1999 International Geoscience and Remote Sensing Symposium, Hamburg, Germany, 28 June–2 July 1999; Volume 5, pp. 2655–2657. [Google Scholar] [CrossRef]
  29. Reigber, A.; Ferro-Famil, L. Interference suppression in synthesized SAR images. IEEE Geosci. Remote Sens. Lett. 2005, 2, 45–49. [Google Scholar] [CrossRef]
  30. Giordano, P.; Turksezer, Z.; Previtali, M.; Limongelli, M. Damage detection on a historic iron bridge using satellite DInSAR data. Struct. Health Monit. 2022, 21, 2291–2311. [Google Scholar] [CrossRef]
  31. Demirboğa, R. Thermal conductivity and compressive strength of concrete incorporation with mineral admixtures. Build. Environ. 2007, 42, 2467–2471. [Google Scholar] [CrossRef]
  32. Zimmerman, R. Thermal conductivity of fluid-saturated rocks. J. Petrol. Sci. Eng. 1989, 3, 219–227. [Google Scholar] [CrossRef]
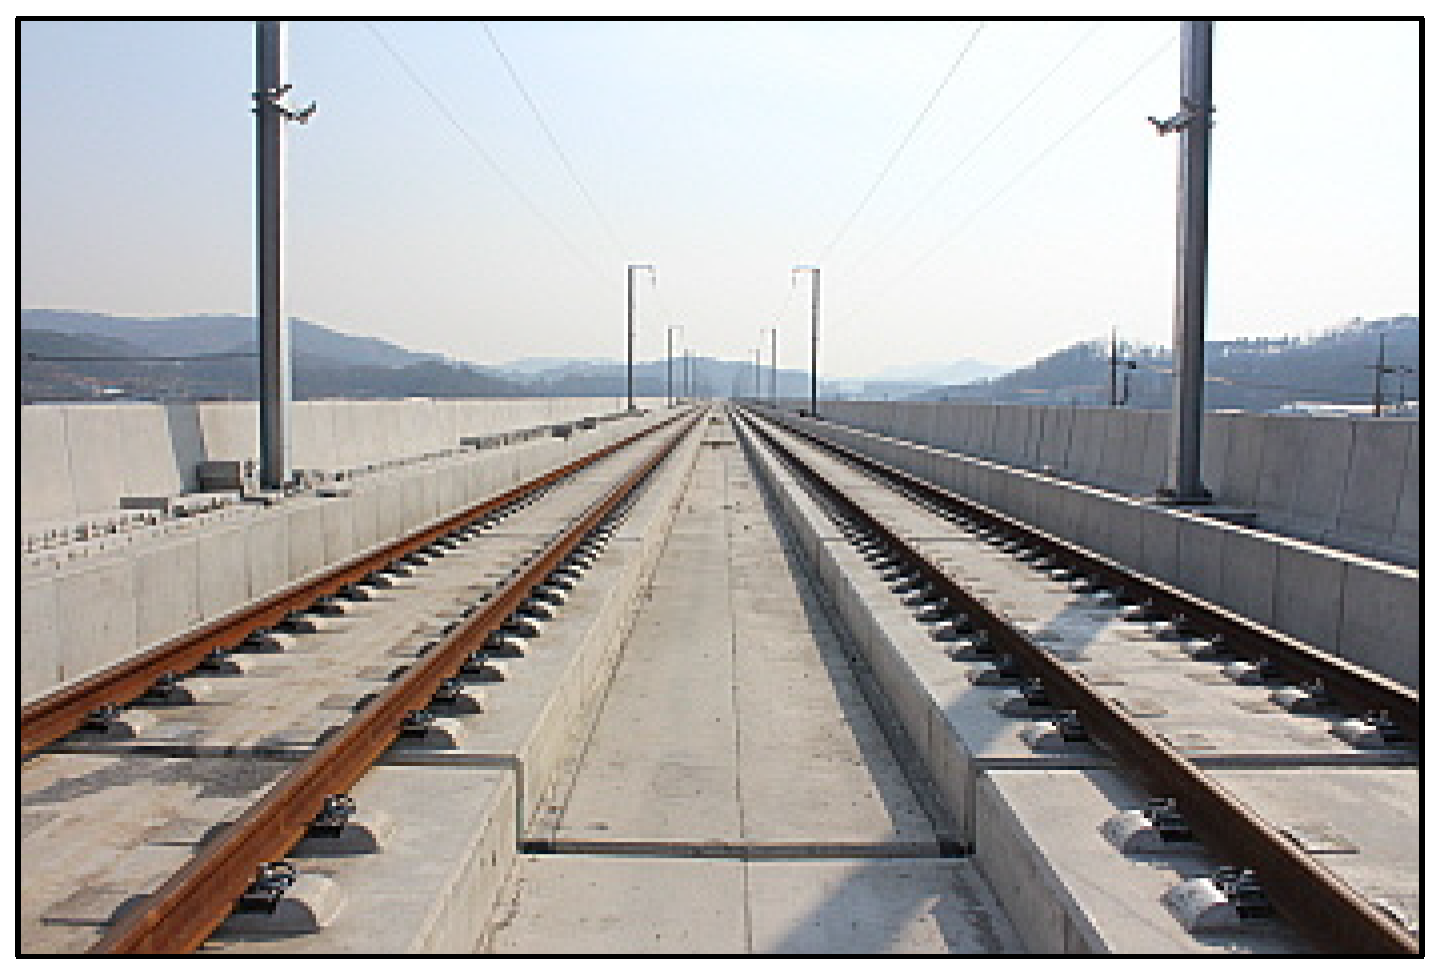
Figure 1. Reinforced concrete railway track.
Remotesensing 16 03153 g001
Figure 2. Structural details of PSC box bridge: (a) cross-section of the bridge; (b) view of the bridge and surrounding environment.
Remotesensing 16 03153 g002
Figure 3. Mean annual air temperature of target region.
Remotesensing 16 03153 g003
Figure 4. Deflecting modes of bridge deck.
Remotesensing 16 03153 g004
Figure 5. Components forming the total displacement at time t : (a) total sum of displacement versus time; (b) cyclic pattern of thermal expansion; (c) long-term deformation of reinforced concrete.
Remotesensing 16 03153 g005
Figure 6. Typical bridge cross-section and temperature gradient: (a) reference bridge cross-section; (b) actual temperature distribution; (c) simplified model.
Remotesensing 16 03153 g006
Figure 7. Typical bridge cross-section and temperature gradient: (a) a view from the top; (b) a horizontal view of the same model.
Remotesensing 16 03153 g007
Figure 8. Stages of PS-InSAR analysis.
Remotesensing 16 03153 g008
Figure 9. Connection graph of SLC images.
Remotesensing 16 03153 g009
Figure 10. PS-density-related parameters: (a) excess amount of PSs; (b) adequate amount of PSs; (c) insufficient amount of PSs.
Remotesensing 16 03153 g010
Figure 11. Comparison of parametric analysis results with survey data.
Remotesensing 16 03153 g011
Figure 12. PS-InSAR results of selected bridges at geocoded state: (a) Bridge A (b) Bridge B.
Remotesensing 16 03153 g012
Figure 13. PS-InSAR result of Bridge A.
Remotesensing 16 03153 g013
Figure 14. PS-InSAR result of Bridge B.
Remotesensing 16 03153 g014
Figure 15. PS-InSAR results of three consecutive spans from Bridge A: (a) span ‘a’, (b) span ‘b’, (c) span ‘c’.
Remotesensing 16 03153 g015
Figure 16. Time-series data of featured point clouds from the peak of each span: (a) span ‘a’, (b) span ‘b’, (c) span ‘c’.
Remotesensing 16 03153 g016
Figure 17. PS-InSAR results of three consecutive spans from Bridge B: (a) span ‘i’, (b) span ‘ii’, (c) span ‘iii’.
Remotesensing 16 03153 g017
Figure 18. Time-series data of featured point clouds from the peak of each span: (a) span ‘i’, (b) span ‘ii’, (c) span ‘iii’.
Remotesensing 16 03153 g018
Figure 19. Linear trend in concrete deformation based on time: (a) Bridge A; (b) Bridge B.
Remotesensing 16 03153 g019
Figure 20. Repeating trend in deformation data: (a) Bridge A; (b) Bridge B.
Remotesensing 16 03153 g020
Figure 21. Deformation of the bridge at corresponding temperature: (a) Bridge A; (b) Bridge B.
Remotesensing 16 03153 g021
Table 1. Summary of numerical analysis.
VariablesPositions
X (m)010203040
DtZ (mm) 1−0.661.802.811.80−0.66
1 All values are relative to its original position.
Table 2. TerraSAR-X image technical facts.
ParametersValues
Repeat Period11 days
OrbitDescending
Inclination97.44°
Altitude at the equator514 km
Centre Frequency9.65 GHz (X band)
PolarisationVV
Table 3. Candidate parameter sets for optimal combination.
Parameter SetABC
Looks [Azimuth, Range][2, 2][2, 2][2, 2]
Sub-area Overlap30%25%25%
Sub-area Merging
Coherence Threshold
0.600.660.66
Mu-sigma Threshold70%60%60%
Low Pass Filter1200 m600 m1200 m
High Pass Filter781 days781 days365 days
Product Coherence Threshold0.650.650.65
Table 4. Final parameter set determined.
StagesAB
Interferometry
Generation
Looks [Azimuth, Range][2, 2]
Interpolation Algorithm4th Cubic Spline Interpolation
Sub-area Coverage25 km2
Inversion:
First Step
Sub-area Overlap25%
Sub-area Merging
Coherence Threshold
0.60
SNR Threshold3.2
Mu-sigma Threshold70%
Inversion:
Second Step
Minimum and Maximum
Displacement Velocity
−40 mm/yr (Min.)
25 mm/yr (Max.) each
Number of Reference Point
Candidates
5
Low Pass Filter1200 m
High Pass Filter782 days
GeocodingGCP/DEM usageSRTM 1 arc-second
Product Coherence Threshold0.65
Table 5. PS density.
SiteLength (m)Number of PS
Point Clouds
PS Density
(Counts/km2)
Bridge A40031458,321
Bridge B34831165,639
Table 6. Linear components of deformation and their characteristics.
SitesTotal Deformation
(mm)
Deformation
Velocity (mm/yr)
Mean Velocity
(mm/yr)
Standard
Deviation σ
BridgeSpan
Aa1.250.620.910.21
b2.011.00
c2.201.10
Bi6.033.013.340.25
ii7.223.61
iii6.793.39
Table 7. Summary of results.
Determination CoefficientsBridge ABridge B
Pearson’s r0.4650.778
R20.2160.605
Table 8. Comparison of Deformation Values between PS-InSAR Measurements and Numerical Analysis for Bridges A and B.
SitesMaximum
Value
(mm)
Minimum
Value (mm)
Range of
Deformation
(mm)
Expected Range of
Variation at
Numerical
Analysis
(MAX. −MIN., mm)
BridgeSpan
Aa1.20−0.161.362.81
b1.35−0.712.06
c2.39−0.783.17
Bi1.99−2.014.00
ii1.95−1.923.87
iii2.55−2.605.15
Disclaimer/Publisher’s Note: The statements, opinions and data contained in all publications are solely those of the individual author(s) and contributor(s) and not of MDPI and/or the editor(s). MDPI and/or the editor(s) disclaim responsibility for any injury to people or property resulting from any ideas, methods, instructions or products referred to in the content.