Abstract
Accurate, detailed, and long-term urban land use mapping is crucial for urban planning, environmental assessment, and health evaluation. Despite previous efforts, mapping essential urban land use categories (EULUCs) across multiple periods remains challenging, primarily due to the scarcity of enduring consistent socio-geographical data, such as the widely used Point of Interest (POI) data. Addressing this issue, this study presents an experimental method for mapping the time-series of EULUCs in Dalian city, China, utilizing Local Climate Zone (LCZ) data as a substitute for POI data. Leveraging multi-source geospatial big data and the random forest classifier, we delineate urban land use distributions at the parcel level for the years 2000, 2005, 2010, 2015, 2018, and 2020. The results demonstrate that the generated EULUC maps achieve promising classification performance, with an overall accuracy of 78% for Level 1 and 71% for Level 2 categories. Features derived from nighttime light data, LCZ, Sentinel-2 satellite imagery, and topographic data play leading roles in our land use classification process. The importance of LCZ data is second only to nighttime light data, achieving comparable classification accuracy to that when using POI data. Our subsequent correlation analysis reveals a significant correlation between POI and LCZ data (p = 0.4), which validates the rationale of the proposed framework. These findings offer valuable insights for long-term urban land use mapping, which can facilitate effective urban planning and resource management in the near future.
1. Introduction
The demand for land resources by humans has been expanding with the accelerating pace of urbanization. Many studies have demonstrated that since World War II, cities worldwide have undergone varying degrees of rapid expansion. A single city in the United States could have expanded by over 20% between 1993 and 2001 [1], while the entire country witnessed a total urban area expansion of 11% between 2001 and 2011 [2]. On a global scale, recent research has indicated that by 2018, the impervious surface area worldwide had expanded to 1.5 times that in 1985 [3]. According to United Nations statistics, in 1990, 42% of the population (2.3 billion people) lived in cities, while this figure jumped to 55% (4.2 billion people) in 2018 [4]. Cities represent vast ecosystems of human habitation, facing challenges including resource limitations, the completeness of urban functions, and the rationality of urban expansion planning [5,6,7,8,9,10,11].
Cities are not homogeneous impervious surfaces, which causes mismatch when land cover guidelines are employed for land use studies [12,13]. Urban land use mapping requires better data support when detailed mapping guidelines are introduced. Similar to land cover studies at comparable scales, the Landsat series and Sentinel series have been widely used to date [14,15,16,17,18]. As research progresses towards finer granularity, synthetic aperture radar (SAR) data [19,20,21] and other high-resolution remote sensing data, such as QuickBird and WorldView data, have also been incorporated into mapping studies [22,23,24,25]. In comparison to daytime remote sensing imagery, nighttime light data can easily describe human activities and populations [26,27,28] and, thus, are often used in relevant research. With the development of the internet and the popularity of social media, researchers also have increasingly applied socio-geographic data to land use mapping, due to their ability to directly explain human activity patterns [29,30,31,32]. The most commonly used data in socio-geographical studies include Point of Interest (POI) data, geolocation data from social media, and traffic data [33,34,35,36,37,38].
While most research was conducted at the pixel level in the past [39,40,41], the basic mapping unit at present often represents a larger logical region, reflecting people’s everyday cognitive processes. In the most common sense, the smallest unit of urban function is usually a building or a block, as we recognize a certain place by a continuous built-up object which is often multiple pixels in remote sensing image. One type of mapping unit is based on actual existing roads, with individual areas surrounded by roads serving as the smallest units in the classification process [42,43,44,45]. We call such mapping units “land parcels”. Another method aims to ensure that pixels within each mapping unit have similar characteristics, often employing clustering segmentation to obtain mapping units smaller than land parcels [46,47,48,49]. We call these mapping units “objects”, and a land parcel may contain multiple objects [25,50,51].
As summarized by previous studies [52,53,54,55], existing methods of urban land use mapping can be generally divided into two groups: traditional machine learning and advanced deep learning. In the former, classic algorithms like maximum likelihood, linear regression, voting, decision tree, random forest, and support vector machine were the most widely adopted approaches [55,56,57,58]. Most of these methods are applied at the parcel level, although some have also been used in pixel-based or object-based urban land use mapping [59,60]. On the other hand, recent advances in deep learning, such as the Convolutional Neural Network (CNN) and the Generative Adversarial Network (GAN), have become more efficient for dealing with high-dimensional data and extracting deeper contextual features [61,62,63]. Due to the nature of these models, they are more commonly employed in pixel-based or object-based mapping initiatives.
Despite these efforts, mapping long time-series of urban land use remains a challenge. Point of Interest (POI) data are a type of data provided by commercial map companies, containing a set of latitude and longitude coordinates of a point and the social functions that this point can provide. Prior studies have underscored the limitations of POI data related to their restricted temporal and spatial coverage [34,64,65,66]. Since socio-geographic data depend on the operational presence of users on a commercial website [67,68], data gaps can occur in times or areas where users are not present. This hinders the tracking of historical urban land use. Moreover, current time-series urban land use mapping efforts often rely on coarse classification categories or focus on changes in a single land use type [69,70,71], which limits their applicability in studies of urban thermal environments, urban expansion simulations, and urban ecology [72,73,74,75].
In response, researchers have turned to alternative indicators, such as elevation and slope, which not only impact floods [76] and landslides [77], but also interact with factors such as hazard probability, thereby influencing urban land use outcomes [78,79,80]. Furthermore, building morphology data—specifically, the Local Climate Zone (LCZ) classification system—have proven invaluable in capturing urban land use [81,82]. LCZ data characterize urban areas based on their surface cover and morphology, exerting a notable influence on local climate [83,84]. These data categorize urban zones into types such as high-rise, low-rise, industrial, parkland, and water bodies, providing critical insights into phenomena such as urban heat islands, energy consumption, and urban planning considerations [85,86]. Given that LCZ data encompass diverse information, including pixel textures, building height data, and built-up density, the researchers can seamlessly integrate this information to form a valuable urban descriptor.
To overcome the research gap of POI absence mentioned above and better inform the spatio-temporal dynamics of urban functions, this study explores time-series EULUC mapping by replacing unavailable POI data with LCZ data. Taking the city of Dalian as an experimental site, we aim to address the following questions: (1) Can the use of LCZ data as an alternative achieve similar accuracy as POI? (2) If this substitution is feasible, what is the relative importance of LCZ in the classification process? (3) With this alternative approach, can we achieve long-term urban land use mapping and effectively visualize and analysis the temporal changes in land use types?
2. Study Area, Data Source, and Methods
2.1. Study Area
The city of Dalian in Liaoning, China, was chosen as our study area (Figure 1). Dalian is a rapidly developing coastal city located on the southern Liaodong Peninsula (38°42′–39°44′N, 120°59′–123°28′E). Given its undulating terrain, Dalian’s roads and urban blocks are irregularly distributed. With a population of over 6.8 million and a coastal line of over 1900 km, Dalian is a significant transportation hub and an important industrial and commercial center in Northeast China that has undergone rapid urbanization and industrialization over the past few decades. According to the global artificial impervious area (GAIA) data [3], Dalian’s total impervious area expanded from 232 km2 in 1985 to 2339 km2 in 2018. Dalian’s unique geography, complex land use patterns, and diverse economic activities make it a unique area for research on land use mapping methods.
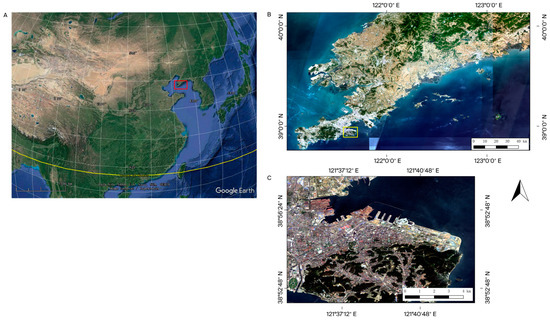
Figure 1.
The study area of Dalian. (A) Location of Dalian (highlighted in red) in East Asia in Google Maps. (B,C) Annual mean composites of Sentinel-2 optical image of Dalian for the year 2018. The extent of subregion B corresponds to the red region in subfigure (A), and the extent of subregion c corresponds to the yellow region in subfigure (B).
2.2. Data Source
As listed in Table 1, the data used in this research comprise four categories: remote sensing data, social data, land surface data, and support data. Each category is introduced in the subsequent sections.

Table 1.
List of data used in the study and their sources.
2.2.1. Remote Sensing Data
The used remote sensing data included Sentinel-2, Landsat-7, Landsat-8 multi-spectral satellite imagery, and Luojia-1 nighttime light data. For Sentinel-2 images, all bands with spatial resolutions ranging from 10 to 60 m were considered in our experiment. As Sentinel-2 data are only available after 2017, we incorporated Landsat-7 and Landsat-8 data to achieve urban land use mapping in earlier years. We also computed additional layers of normalized difference indices, including Normalized Difference Vegetation Index (NDVI), Normalized Difference Build-up Index (NDBI), and Normalized Difference Water Index (NDWI), for all Sentinel-2, Landsat-7, and Landsat-8 data. Luojia-1 nighttime light data detect lights appearing at nighttime with a spatial resolution of 130 m, which represents human night activities and has played a critical role in urban and demographic studies [27,90,91,92,93]. All the satellite products (except Luojia-1) were acquired through the GEE platform, with atmospheric correction and annual mean composition.
2.2.2. Social Data
Social data refer to Gaode POI data. These data were extracted using the Gaode Map API, one of the most common and popular online map services in China. POI data provide information on the point’s name, its coordinates (latitude and longitude), and its function. POI data were gathered and re-classified into 10 categories named after EULUC land use categories, except for the airport (0401) and greenspace (0505) categories. The airport category was removed as the airport itself was removed during land parcel generation [3] and is often unique to a single city. Greenspace was removed for a similar reason; that is, in the GAIA boundaries and further land parcel generation, forests and grasslands were mostly removed [3].
2.2.3. Land Surface Data
The used land surface data encompassed ALOS DSM Global 30 m data, NASA SRTM data, and LCZ data. The ALOS DSM Global 30 m data set is a global digital surface model data set that can be used to calculate elevation height, while the NASA SRTM data provide an alternate choice for the year 2000. Elevation data can serve as a rough reference for human building distribution and indicate the topography of our study area. LCZ data are a type of data that can be used to characterize urban areas based on their distinctive surface cover and morphology, which are often used in local climate and microclimate research. The LCZ data used in this study were provided by Zhao et al. [87]. LCZ data were classified based on the classification system of Steward and Oke [84], which is shown in Table 2. In our research, we changed the alphabet classes into numbers (1–17), reflecting the original alphabetical order.

Table 2.
LCZ classification system.
2.2.4. Support Data
Finally, we refer to the support data sources used in this study. The FROM-GLC10 data set is derived from samples of the FROM-GLC30 global land cover data set, utilizing sample transfer theory and refined mapping techniques to enhance their resolution [88]. This data set offers a detailed depiction of the Earth’s surface, making it instrumental in our study for combination with other data sets, as described later, to determine impervious surface outlines [94,95,96]. In particular, combining the GAIA and Global Urban Boundary (GUB) data sets with the FROM-GLC10 data set allowed us to obtain the fundamental outline of impervious surfaces in urban areas. Building upon this foundation, by segmenting these outlines using OpenStreetMap (OSM) road net data, we derived the land parcels that serve as one of the basic research units in this study.
2.3. Methods
Figure 2 shows the overall workflow of our research design, including five major steps: parcel generation, extractable data preparation, feature extraction, sampling, and supervised classification and mapping. The methodological components will be described in detail in the following sections.
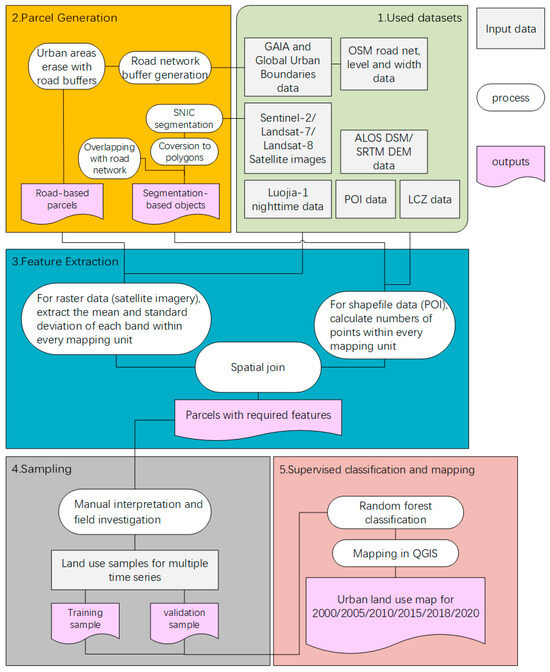
Figure 2.
Workflow of the study for mapping the time-series urban land use categories.
2.3.1. Parcel Generation
We considered two different approaches for parcel generation. One is the fundamental EULUC method [42] with road-cut parcels. The other we named as SEGLUC, which combines image segmentation with EULUC in the approach, as demonstrated in the work of Tu et al. [46].
In the basic EULUC method, the original urban parcels were generated using the impervious layer boundaries (GAIA and GUB data) separated according to the OSM data, road width data, and the FROM-GLC10 water layer [42]. In our research area, 4234 land parcels were generated in our 2018 mapping process.
In the SEGLUC method, land parcels are generated using not only OSM data and the urban boundaries as in the EULUC method, but also segmented Sentinel-2 satellite image boundaries. Sentinel-2 satellite images were segmented with the SNIC algorithm on the GEE platform, where the pixels were clustered and segmented according to their similar band properties [97].
In our research, we chose band 2 (Blue), 3 (Green), 4 (Red), 5, 6, 7 (Vegetation red edge), 8 (near-infrared range-NIR), 11 (short wave infrared spectral range-SWIR) as our segmentation base bands for Sentinel 2 data, and the image we used is an annual mean in the green season (05/01–10/01) for our study area after cloud removal. In Landsat data, the bands were changed to 1 (Blue), 2 (Green), 3 (Red), 4 (Near-Infrared), 5 (Short-wave Infrared), 7 (Mid-Infrared), 8 (Panchromatic (PAN)). The seed grid size parameter was set to 36 after various experiments and human visual judgment were compared to the original satellite image, and the resolution of segmented outputs was set to 10 m. After the segmentation was performed, the boundaries of the super-pixels were extracted and intersected with the basic EULUC land parcels, producing the final mapping objects.
2.3.2. Data Set Combining and Feature Extraction Methods
As mentioned earlier, three types of data were incorporated for EULUC mapping in this research: remote sensing data, social data, and land surface data. To illustrate their respective impacts on classification and to assess the feasibility of substituting POI data with LCZ and DSM data, we designed various data combinations for EULUC mapping, as listed in Table 3.

Table 3.
Data set combinations used in this study.
The extraction of parcel information within the study area was performed using the GEE platform, where different combinations of data sets were employed. Most satellite data were integrated within the GEE platform, except Luojia-1. We therefore obtained the nighttime light data for our study area and imported them manually into the GEE platform. The LCZ data set, sourced from the work of Zhao et al. [87], was also imported into GEE manually, mirroring the process used for the nighttime light data set.
Remote sensing, DSM, and DEM data were processed within the GEE platform using the functions of ‘reduceregion’. This process involved calculating the mean and standard deviation of various bands within every parcel unit in a resampling resolution of 10 m. For the LCZ data set, the ‘count’ function in the same resampling resolution was used to quantify the area and proportion of different LCZ types within each land parcel.
Feature extraction for Points of Interest (POIs) was conducted locally. We imported parcel and POI data into geographical information software QGIS, version 3.38 where we tabulated the count and proportion of each POI category within individual land parcels or objects. Finally, all the computed features were aggregated into a single table to obtain year-specific feature extraction results. We calculated these combinations for 2018, and only the best one was used for the other years.
2.3.3. Function of LCZ Data
LCZ is a classification system that characterizes urban areas based on their distinctive surface cover and morphology, which directly influence the local climate and microclimate. LCZ categorizes different regions within a city into distinct zones that represent distinct urban entities, such as compact high-rise, open low-rise, industrial, parkland, and water bodies, among others. As LCZ classifies the land surface based on remote sensing bands, pixel textures, building height, and density data, it can be considered an excellent urban surface descriptor and, therefore, was employed in our research.
Urban land use types can correspond to recognizable LCZ forms. As illustrated in Figure 3, the residential area in our study area may represent compact mid- to high-rise buildings in LCZ. Specifically, (a) depicts these typical residential areas, characterized by their dense and vertically extended structures. In contrast, Figure 3b shows commercial zones—particularly shopping plazas—which are distinguished by large open spaces and low- to mid-rise buildings. Figure 3c illustrates parks that encompass vegetation and paved open spaces. Finally, Figure 3d highlights industrial zones, marked by open low-rise buildings and industrial machinery. Based on general knowledge, it is evident that different land use types typically exhibit distinct and recognizable LCZ characteristics.
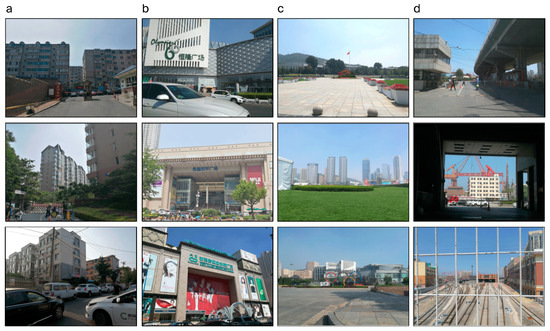
Figure 3.
Different types of land use and their associated building forms. (a) Residential, (b) commercial, (c) park and green space, (d) industrial.
2.3.4. Sampling
Samples were manually selected from the same location with two different parcel division methods. We completed the sampling of the 2018 data set using commercial mapping website including Google Map, Gaode Map, and Baidu Map, along with field visits. We selected portions of the Dalian city data set that overlapped with those used by Gong et al. in EULUC-2018 in 2020 [42], and supplemented additional samples to stabilize the random forest model. In total, approximately 2000 samples from 2018 were used.
After collecting the sample parcels in 2018, we overlaid them onto the segmented study area parcels for other years. By using reference data from historical imagery on Google Earth Pro, version 7.1.8.3036 and manual identification, areas displaying land use changes were adjusted accordingly, resulting in sample parcels for the years 2000, 2005, 2010, 2015, and 2020.
2.3.5. Supervised Classification and Mapping
We partitioned the collected samples into training and validation sets at a ratio of 7:3 and trained a random forest model for each year using these training samples. These models were employed to classify and map parcels corresponding to their respective years. The entire computational process was carried out using the ‘RandomForest’ function in the R language. The model precision approached stability with tree counts surpassing 100—a threshold determined through iterative control sample training. Considering the balance between sample size and local computational load, all models employed 500 trees in the random forest.
We randomly divided the training samples and validation samples, then trained the model. This process was repeated 50 times for each data set, allowing us to obtain stable model accuracy and standard deviation. Further comparisons and data analyses were conducted based on the generated maps and data results. The Level 1 and Level 2 mapping categories were adopted from Gong et al. [42] (see Table 4).

Table 4.
EULUC land use categories from Gong et al. in 2020 [42] (with changes in categories 06 and 07).
There was a partial mismatch between the GAIA and GUB data, which prevented us from accurately depicting the inner and outer extents of the city. Area types such as water bodies, forests, or barren areas due to abandonment or construction were included when we generated the boundary of the study area. At the same time, some reclaimed areas are still marked as ocean in the GUB data. Considering this mismatch, we extended the original EULUC classification framework by introducing a class (06) to describe bare or under-construction land, and another class (07) for urban water bodies. Moreover, the category 0505, which is indicative of parks and green spaces, was expanded to encompass forests or mountains within the city boundaries.
2.3.6. Post-Classification Process
During post-classification, we categorized the SEGLUC mapping results into four types based on the statistical information of objects within each land parcel (Table 5).

Table 5.
Rules for clustering object-scale results into parcel-scale.
As the generated land parcels were based on the segmentation of impervious surfaces and road networks in 2020, there were instances where certain land parcels did not have classification results for earlier years. We designated such cases as having a statistical result of 0.
For land parcels with one or more types of objects, we categorized them as single-type parcels, dominant-type parcels, and mixed-type parcels, based on the proportion of each area type. A single-type parcel corresponds to its own object type. A dominant-type parcel indicates that the land use type with the largest proportion of area exceeds 50% of the total area. The final type of this parcel is determined by the land use type with the largest area in the parcel’s statistics (with the MAX category serving as a placeholder). In contrast, a mixed-type parcel means that there is no land use type with an area exceeding 50% within the parcel. The final result is labeled as a special mixed type (MIX category).
Due to the unique nature of the study area, roads are typically distributed along valleys in mountainous regions, with residential areas on both sides of the roads. This results in larger land parcels that appear as mixed residential and green areas. Therefore, we established a separate MIXB type of parcel to describe this unique near-mountain residential area. The criterion for determining the MIXB type is that the two largest land use types in terms of area must be greenspace and residential land.
Finally, we introduced the Dominant Proportion (P) and the Chaos Index (CI) to further describe the land use mixing of each land parcel. The Dominant Proportion, denoted as P, represents the proportion of the most extensive land use type within the land parcel. The Chaos Index, as proposed by Tu et al. [98], is an empirically validated index used in various research fields to describe the degree of land use type mixing within a land parcel. The index typically ranges between 0 and 1, with values closer to 1 indicating a higher degree of land use type mixing within the land parcel (i.e., roughly equal proportions of various land use types).
3. Results
Figure 4 compares the urban land use mapping results for 2018 between the EULUC and SEGLUC approaches. The SEGLUC method identified 61,950 land parcels for Dalian in 2018, which is 14 times more than the basic EULUC method. Consequently, SEGLUC results display more detailed urban land use patterns, which are closely align with the actual situation of land use depicted in the Sentinel-2 image. In contrast, the EULUC results show noticeable errors, particularly in the southern part of the mapping area, where the land parcels are too large to accurately reflect real conditions. Due to these significant misclassifications in EULUC, we selected SEGLUC as the primary mapping method for subsequent analysis.
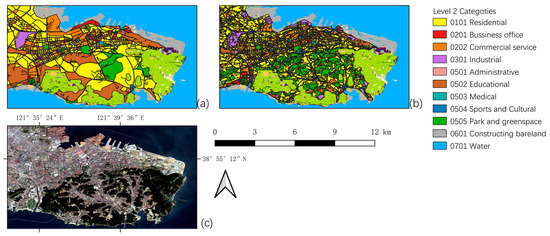
Figure 4.
Classification comparison for EULUC method (a) and SEGLUC method (b) with Sentinel-2 images (c).
3.1. Classification Performance with Difference Data Combinations
Random forest models were used to compare and assess the classification accuracy under different combinations of data sources. The results demonstrated that the combination of multi-source data significantly improved classification accuracy, despite larger variances (Table 6). The inclusion of POI and LCZ data introduced uncertainty into the accuracy results, which derived from the presence of zero values in the distribution of POI and LCZ types for the excluded types in one parcel. While the LCZ data were relatively continuous as raster data, the source POI data could not cover scattered points for all land parcels. As a result, when we randomly split the training and validation samples, it was highly likely that samples with no POI data would be obtained, which could potentially affect the accuracy of the final model.

Table 6.
Accuracy results under various data set combinations.
3.2. Data Set Importance and Correlation Results
Figure 5 displays the top 15 features in the 2018 random forest model using remote sensing data, LCZ data, and DSM data. Nighttime light data, aerosol bands of Sentinel-2 satellite remote sensing data, and LCZ type 8 (large low-rise buildings) data showed significant importance in the assessment. Elevation data and infrared bands of remote sensing data also exhibited high importance. However, certain LCZ types showed a lack of importance, indicating a lack of these LCZ types in the land parcels sampled in the study.
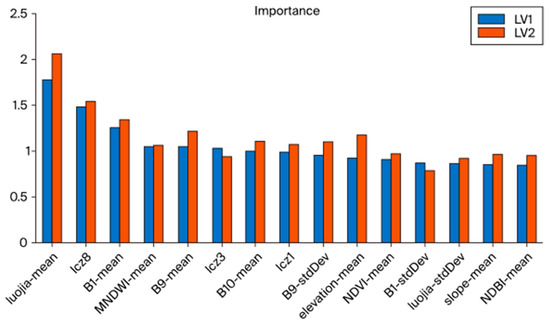
Figure 5.
Top 15 features ranked by importance in the 2018 random forest model.
The nighttime light data serve as valuable evidence reflecting the intensity of human activity [99,100], thus showing a strong association with land use types [93,101,102]. Considering the potential coverage of land surfaces within urban areas, the radiation spectra of vegetation, concrete, glass, and metal exhibit good discrimination results in the shortwave range of 400 nm and the longwave range of 800–900 nm, supporting the high importance of band 1 and 9. The high importance of LCZ type 8 can be attributed to its typical role in accommodating significant commercial or public service functions in urban areas, providing an explanatory interpretation.
We calculated the correlations among all the data factors and obtained a result indicating that most of the correlation indices between our mapping factors were low. Figure 6 presents the correlation heatmap between the POI data (rows 1–21) and LCZ data (rows 22–38). Apart from the internal correlations within the POI data, various open and compact urban morphology types (LCZ categories 1–6) exhibited correlation coefficients exceeding 0.4 with specific POI types. This shows that the POI data used to describe urban land use patterns positively correlate with the LCZ data, which describe the building forms, at least within the considered city.
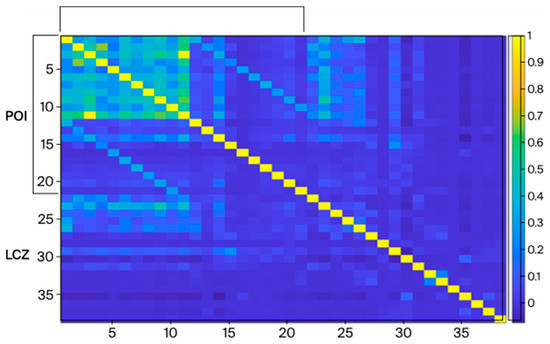
Figure 6.
Correlation results among POI and LCZ features.
3.3. Urban Land Use Dynamics in Dalian for 2000–2020
Furthermore, we conducted detailed EULUC mapping of Dalian for 2000–2020 using optical data, LCZ data, and DSM data (Figure 7 shows 2018 result). The accuracy for the Level 1 and Level 2 maps was 76–77% and 71–73%, respectively, demonstrating the stability of our developed method. Most uncovered impervious surfaces were concentrated near the coastline. Upon comparison with existing maps and visual interpretation, these areas primarily corresponded to ports, aquaculture facilities, and industrial clusters. The mapping results demonstrated that in urban areas with complex surface conditions, object segmentation is more efficient than land parcel segmentation.
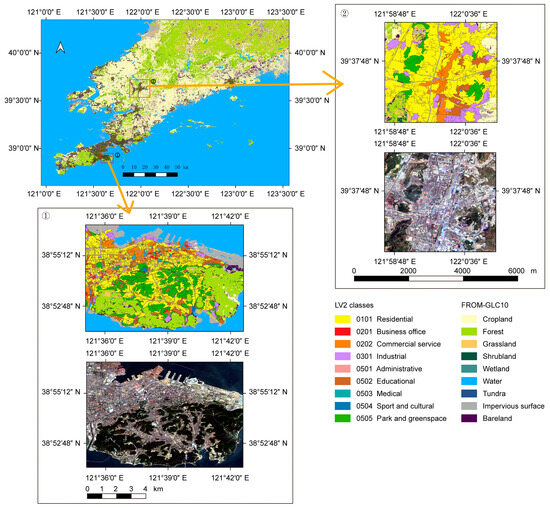
Figure 7.
Mapping result of Dalian in 2018 with FROM-GLC10 as the base map, ① and ② show different zoom in area (Sentinel-2 image included).
To better illustrate the mapping results, we have zoomed in on the maps and highlighted three areas with noticeable changes, denoted as (a), (b), and (c), respectively, in Figure 8.
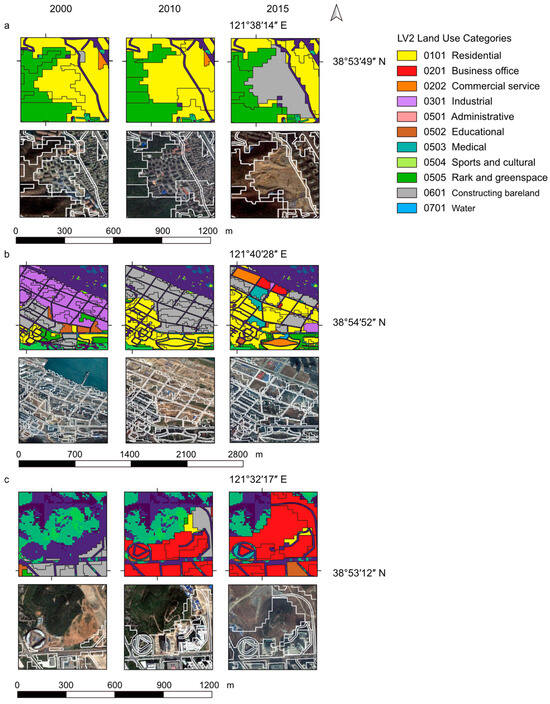
Figure 8.
Comparison of three mapping results and Google Earth historical maps in 2000, 2010, and 2015. (a) for reconstruction residential area, (b) for dismantled industrial zone, (c) for outskirts of the city near the university campus.
Area (a) is a residential area located within the old city district. Based on existing field surveys and Google Maps imagery, this area underwent complete reconstruction between 2012 and 2019. Therefore, both the 2015 imagery and the mapping results show bare land under construction.
Area (b) was an industrial zone along the coast in 2000. According to the same survey results, this area began to be dismantled and relocated around 2009, with the original site being developed into a new upscale residential and commercial district. In the imagery and mapping results, the outcome in 2010 shows bare ground while, by 2015, nearly half of the area had been covered with construction land.
Area (c) is situated on the outskirts of the city near the university campus. In 2000, much of this area consisted of bare ground under construction outside of the old city boundaries. Over the years, there has been a transition to the construction of office buildings, forming an IT industrial park in this area.
To facilitate a more accurate quantitative analysis of land use changes, we integrated the original land use mapping results from object scale to land parcel scale. We selected the historic core of the city, labeled as ①, and the university town located at the junction of the old and new city areas (near area (c), detailed above), labeled as ②, as our study areas. The integrated results for these two regions for each five-year period from 2000 to 2020 are depicted in Figure 9. During the transition of a parcel from one existing land use type to another, the P value gradually decreased and then increased again, while the CI value initially increased and then decreased. In region ① of the old city core area, most land use categories remain consistent, and we notice the transition from industrial land to business offices in the northeast of the region. In region ②, the developed parcels experienced two stages of transformation, with an increase in office land and residential land, ultimately also transitioning into residential parcels near the hillsides.
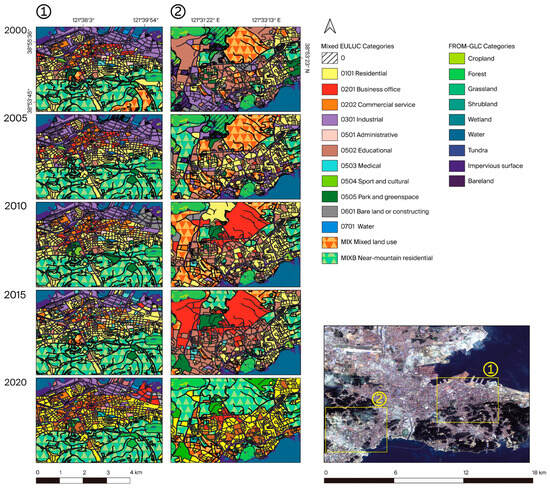
Figure 9.
Land use maps of selected regions in Dalian from 2000 to 2020. ① The old city core area and ② the university town in southwestern Dalian. Note: “Category 0” represents “no mapped object in the land parcel” (see Table 5).
Figure 10 summarizes urban land use change in Dalian during 2000–2020. Overall, the residential, industrial, educational, green, and bare land types showed relatively high proportions across years. Other categories such as commercial, service, and administrative land consistently maintained lower proportions in each year. Temporally, the residential land use type—as the primary contributor to population—exhibited a consistent trend in increasing area, closely mirroring the total impervious surface area. In contrast, the area of educational land use grew at a slower rate. This corresponds to the typical government-planned nature of educational land use and the aging population trend that Dalian—as a relatively modern and early-developed city—experienced between 2000 and 2020. The total area of industrial land use fluctuated throughout the years, reflecting the relocation of many factories from the old core areas of the city during the time frame of our mapping, with these former industrial plots transitioning into residential or commercial and service land use. Notably, the area of green land experienced a significant increase from 2015 to 2020 compared to other periods, suggesting local environmental improvements over time.
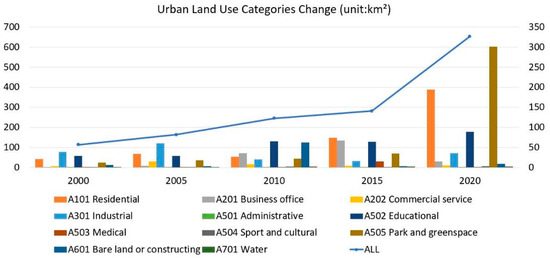
Figure 10.
Urban land use change in Dalian during 2000–2020. The left axis represents the area of the whole city (i.e., the blue line), and the right axis represents the area of each land use category (i.e., bar plots).
We defined the urban land parcels that existed in 2000 as ‘old urban area parcels’, and the land parcels that only appeared by 2020 as ‘new urban area parcels’. For the new parcels, we analyzed their land use types. For the old urban area parcels, we analyzed their original land use types and the types of parcels that had changed by the year 2020. They were then compared in order to illustrate the similarities and differences as in Figure 11.
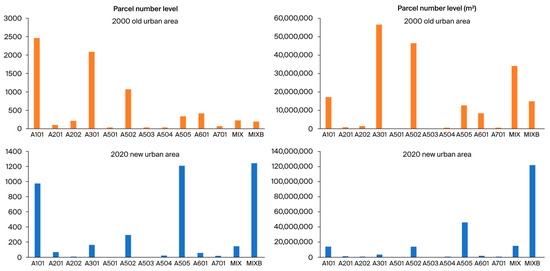
Figure 11.
Land use types in old city area parcels and newly developed parcels.
We observed significant differences in the distribution of land use types between newly developed parcels and old urban area parcels, primarily concentrated in industrial types (labeled as A301), green spaces (labeled as A505), and near-mountain residential types (labeled as MIXB). This indicates that during the urban expansion process, green spaces and residential areas expanded faster, while types such as industrial areas showed a noticeable lag. In the case of land use changes within the old city area, the majority of transformations were other land use types transitioning into residential or near-mountain residential areas (Figure 12). Area-based statistical results further indicated the trend that industrial land types were moving out from the old city area.

Figure 12.
Top 10 land use type changes in old city area parcels.
4. Discussion
This research proposes an integrated method for mapping time-series urban land use categories in Dalian, China. We combined multi-source geospatial big data and machine learning algorithms to generate parcel-level EULUC maps for the period from 2000 to 2020, achieving an overall accuracy of 71–78%. One major contribution of our research to the existing literature is the substitution of POI data with LCZ data, offering a promising approach for long-term time-series urban land use mapping. While social-geographical data such as POI or AOI are widely used as essential inputs in existing studies, their inherent temporal and spatial gaps limit their application for time-series urban land use mapping [34,103,104]. We demonstrate that LCZ data can achieve comparable classification accuracy to POI data with good importance and that the two data types are highly correlated (Table 6, Figure 5 and Figure 6). A further visual comparison reveals that residential POIs (poi101) align closely with residential mapping results across various LCZ categories (Figure 13). Additionally, commercial POIs (poi201) exhibit spatial consistency with the LCZ labeling of compact mid- to high-rise areas. The same phenomenon appears in industry type (poi301) and green space (poi505). In summary, these analyses underscore the effectiveness and rationale of our approach.
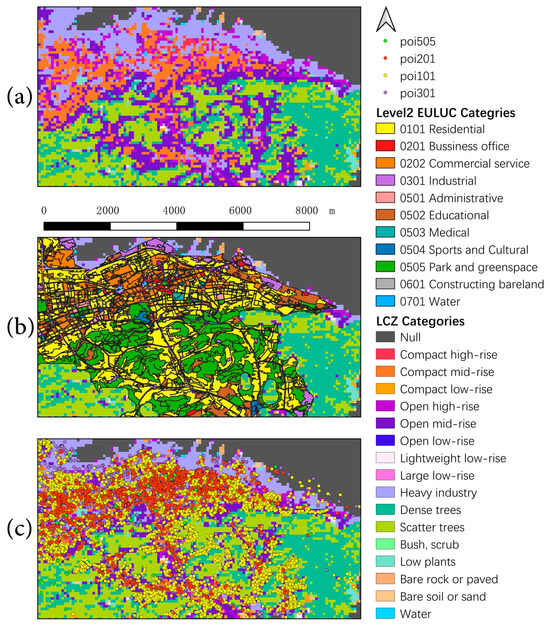
Figure 13.
Comparisons of LCZ, POI, and EULUC mapping result for the Dalian core area in 2018. (a) LCZ data, (b) POI data, and (c) object-based EULUC maps.
Based on the resulting EULUC maps, we analyzed changes in urban land use for the old urban core, the expanding urban fringe, and the entire city of Dalian. We found that although the urban area in our study area has expanded more than five times, the increased area is mainly concentrated in residential land and green space or forest land (Figure 9). We also found that the core area is experiencing intensive residential development, with many factories originally located there relocating to other areas (Figure 10 and Figure 11). In the newly developed outskirts of the city, residential land dominates, raising concerns about the adequacy of public service and commercial land to prevent future traffic and infrastructure issues. These findings offer valuable information on urban land changes in Dalian over the past 20 years, which can inform future urban planning and resource management strategies.
Despite these advancements, several limitations are present in the research. We used existing multi-year urban boundary products to define the urban area, which differed from the actual urban boundaries observed in satellite imagery. This discrepancy highlights the need for more accurate boundary data to capture urban edge expansion effectively. Moreover, to achieve nationwide and long-term urban land use mapping in the future, alternative approaches need to be explored to reduce the significant human effort involved in sampling, especially for large study areas and time scales. At the same time, we should also consider adding logical constraints to the changes in land use types of each mapping unit in subsequent time-series mapping, which will better correct the mapping errors.
5. Conclusions
In this research, we presented an effective approach for mapping time-series EULUCs in Dalian, China, utilizing a combination of multi-source geospatial big data and machine learning techniques. The integration of Local Climate Zone (LCZ) data emerged as a practical substitute for Point of Interest (POI) data in long-term urban land use mapping. Our results demonstrated the effectiveness of pixel-based clustering and road network-based land parcel segmentation in accurately representing urban land use types. The generated EULUC maps achieved satisfactory accuracy levels, with an overall accuracy of 78% for Level 1 and 71% for Level 2 categories for year 2018. We found that LCZ data significantly contributed to the classification process, exhibiting a positive correlation with POI data (p = 0.4). Our subsequent mapping initiatives revealed that residential land experienced the most significant increase and transformation of land use within the study area. The methodology and findings of this study are not only beneficial for urban planning, city development, and resource management efforts, but are also informative in guiding future research towards developing robust methodologies for comprehensive and accurate urban land use mapping across large scales.
Author Contributions
Conceptualization, P.G. and T.T.; methodology, T.T., Y.T. and L.Y.; validation, B.C., L.Y. and P.G.; formal analysis, T.T. and Y.T.; investigation, T.T.; data curation, T.T.; writing—original draft preparation, T.T.; writing—review and editing, L.Y., Y.T. and B.C.; supervision, L.Y., Y.T. and B.C.; project administration, P.G. All authors have read and agreed to the published version of the manuscript.
Funding
This research is supported by the Major Program of the National Natural Science Foundation of China, Smart Mapping of Land Cover at Multiple Scales and Long Time Series (42090015).
Data Availability Statement
Mapping results and comparisons between POI and LCZ can be obtained at the following links: https://code.earthengine.google.com/15a11968d69ba37e8af2f8ce616038f8 (accessed on 19 July 2024).
Conflicts of Interest
The authors declare no conflicts of interest.
References
- Yang, L.M.; Xian, G.; Klaver, J.M.; Deal, B. Urban land-cover change detection through sub-pixel imperviousness mapping using remotely sensed data. Photogramm. Eng. Remote Sens. 2003, 69, 1003–1010. [Google Scholar] [CrossRef]
- Bounoua, L.; Nigro, J.; Zhang, P.; Thome, K.; Lachir, A. Mapping urbanization in the United States from 2001 to 2011. Appl. Geogr. 2018, 90, 123–133. [Google Scholar] [CrossRef]
- Gong, P.; Li, X.C.; Wang, J.; Bai, Y.Q.; Cheng, B.; Hu, T.Y.; Liu, X.P.; Xu, B.; Yang, J.; Zhang, W.; et al. Annual maps of global artificial impervious area (GAIA) between 1985 and 2018. Remote Sens. Environ. 2020, 236, 111510. [Google Scholar] [CrossRef]
- United Nations Department of Economic and Social Affairs Population Division. World Urbanization Prospects: The 2018 Revision; United Nations: New York, NY, USA, 2019. [Google Scholar]
- Pradhan, S.; Dhar, A.; Tiwari, K.N.; Sahoo, S. Spatiotemporal analysis of land use land cover and future simulation for agricultural sustainability in a sub-tropical region of India. Environ. Dev. Sustain. 2022, 25, 7873–7902. [Google Scholar] [CrossRef]
- DeWitt, J.D.; Boston, K.M.; Alessi, M.A.; Chirico, P.G. Quantifying and visualizing 32 years of agricultural land use change in Kabul, Afghanistan. J. Maps 2022, 18, 352–361. [Google Scholar] [CrossRef]
- Ke, C.Q. Modeling urban growth effects on surface runoff: A case study of Qinhuaihe watershed, east China. In Proceedings of the 25th IEEE International Geoscience and Remote Sensing Symposium (IGARSS 2005), Seoul, Republic of Korea, 25–29 July 2005; IEEE: Piscataway, NJ, USA, 2005; pp. 4407–4410. [Google Scholar]
- Roth, K.L.; Roberts, D.A.; Dennison, P.E.; Peterson, S.H.; Alonzo, M. The impact of spatial resolution on the classification of plant species and functional types within imaging spectrometer data. Remote Sens. Environ. 2015, 171, 45–57. [Google Scholar] [CrossRef]
- Raghavswamy, V.; Pathan, S.K.; Mohan, P.R.; Bhanderi, R.J.; Priya, P. IRS-1C applications for urban planning and development. Curr. Sci. 1996, 70, 582–588. [Google Scholar]
- Martin-Duque, J.F.; Pedraza, J.; Sanz, M.A.; Bodoque, J.M.; Godfrey, A.E.; Díez, A.; Carrasco, R.M. Landform classification for land use planning in developed areas:: An example in Segovia Province (Central Spain). Environ. Manag. 2003, 32, 488–498. [Google Scholar] [CrossRef]
- Herold, M.; Scepan, J.; Clarke, K.C. The use of remote sensing and landscape metrics to describe structures and changes in urban land uses. Environ. Plan. A 2002, 34, 1443–1458. [Google Scholar] [CrossRef]
- Anderson, J.R. A Land Use and Land Cover Classification System for Use with Remote Sensor Data; USGS Numbered Series; US Government Printing Office: Washington, DC, USA, 1976.
- Fisher, P.; Comber, A.; Wadsworth, R. Land use and land cover: Contradiction or complement. Re-Present. GIS 2005, 85, 98. [Google Scholar]
- Jordan, J.D.; Shih, S.F. Landsat and spot imagery classification for land-use change analysis in lee-county, Florida. Soil. Crop Sci. Soc. Fla. Proc. 1992, 51, 45–49. [Google Scholar]
- Stefanov, W.L.; Ramsey, M.S.; Christensen, P.R. Monitoring urban land cover change: An expert system approach to land cover classification of semiarid to arid urban centers. Remote Sens. Environ. 2001, 77, 173–185. [Google Scholar] [CrossRef]
- Ke, C.Q.; Liu, X.M.; Shen, C.Y. Urban growth of Hefei, Anhui, east China, using multitemporal satellite data. In Proceedings of the 25th IEEE International Geoscience and Remote Sensing Symposium (IGARSS 2005), Seoul, Republic of Korea, 25–29 July 2005; IEEE: Piscataway, NJ, USA, 2005; pp. 1507–1510. [Google Scholar]
- Boori, M.S.; Choudhary, K.; Kupriyanov, A.; Kovelskiy, V. Four decades urban growth and land use change in Samara Russia through remote sensing and GIS techniques. In Proceedings of the 7th International Conference on Graphic and Image Processing (ICGIP), Singapore, 23–25 October 2015. [Google Scholar]
- Haas, J.; Ban, Y.F. Urban Land Cover and Ecosystem Service Changes based on Sentinel-2A MSI and Landsat TM Data. IEEE J. Sel. Top. Appl. Earth Obs. Remote Sens. 2018, 11, 485–497. [Google Scholar] [CrossRef]
- Ban, Y.F.; Jacob, A. Fusion of Multitemporal Spaceborne SAR and Optical Data for Urban Mapping and Urbanization Monitoring; Springer International Publishing Ag: Cham, Switzerland, 2016; Volume 20, pp. 107–123. [Google Scholar]
- Zhou, T.; Li, Z.F.; Pan, J.J. Multi-Feature Classification of Multi-Sensor Satellite Imagery Based on Dual-Polarimetric Sentinel-1A, Landsat-8 OLI, and Hyperion Images for Urban Land-Cover Classification. Sensors 2018, 18, 373. [Google Scholar] [CrossRef]
- Sun, G.Y.; Cheng, J.; Zhang, A.Z.; Jia, X.P.; Yao, Y.J.; Jiao, Z.J. Hierarchical fusion of optical and dual-polarized SAR on impervious surface mapping at city scale. ISPRS J. Photogramm. Remote Sens. 2022, 184, 264–278. [Google Scholar] [CrossRef]
- Thanapura, P.; Helder, D.L.; Burckhard, S.; Warmath, E.; O’Neill, M.; Galster, D. Mapping urban land cover using QuickBird NDVI and GIS spatial modeling for runoff coefficient determination. Photogramm. Eng. Remote Sens. 2007, 73, 57–65. [Google Scholar] [CrossRef]
- De Pinho, C.M.D.; Fonseca, L.M.G.; Korting, T.S.; De Almeida, C.M.; Kux, H.J.H. Land-cover classification of an intra-urban environment using high-resolution images and object-based image analysis. Int. J. Remote Sens. 2012, 33, 5973–5995. [Google Scholar] [CrossRef]
- Morin, E.; Razafimbelo, N.T.; Yengué, J.L.; Guinard, Y.; Grandjean, F.; Bech, N. Mapping past land cover on Poitiers in 1993 at very high resolution using GEOBIA approach and open data. Data Brief 2024, 52, 109829. [Google Scholar] [CrossRef]
- Li, Z.; Chen, B.; Wu, S.; Su, M.; Chen, J.M.; Xu, B. Deep learning for urban land use category classification: A review and experimental assessment. Remote Sens. Environ. 2024, 311, 114290. [Google Scholar] [CrossRef]
- Jing, W.L.; Yang, Y.P.; Yue, X.F.; Zhao, X.D. Mapping Urban Areas with Integration of DMSP/OLS Nighttime Light and MODIS Data Using Machine Learning Techniques. Remote Sens. 2015, 7, 12419–12439. [Google Scholar] [CrossRef]
- Li, X.; Zhao, L.X.; Li, D.R.; Xu, H.M. Mapping Urban Extent Using Luojia 1-01 Nighttime Light Imagery. Sensors 2018, 18, 3665. [Google Scholar] [CrossRef] [PubMed]
- Huang, X.; Yang, J.; Li, J.; Wen, D. Urban functional zone mapping by integrating high spatial resolution nighttime light and daytime multi-view imagery. ISPRS J. Photogramm. Remote Sens. 2021, 175, 403–415. [Google Scholar] [CrossRef]
- Calegari, G.R.; Carlino, E.; Peroni, D.; Celino, I. Filtering and windowing mobile traffic time series for territorial land use classification. Comput. Commun. 2016, 95, 15–28. [Google Scholar] [CrossRef]
- Yao, Y.; Zhang, J.B.; Hong, Y.; Liang, H.L.; He, J.L. Mapping fine-scale urban housing prices by fusing remotely sensed imagery and social media data. Trans. GIS 2018, 22, 561–581. [Google Scholar] [CrossRef]
- Yin, J.D.; Dong, J.W.; Hamm, N.A.S.; Li, Z.C.; Wang, J.H.; Xing, H.F.; Fu, P. Integrating remote sensing and geospatial big data for urban land use mapping: A review. Int. J. Appl. Earth Obs. Geoinf. 2021, 103, 102514. [Google Scholar] [CrossRef]
- Zinman, O.; Lerner, B. Utilizing digital traces of mobile phones for understanding social dynamics in urban areas. Pers. Ubiquitous Comput. 2020, 24, 535–549. [Google Scholar] [CrossRef]
- Zhang, X.C.; Sun, Y.R.; Zheng, A.Y.; Wang, Y. A New Approach to Refining Land Use Types: Predicting Point-of-Interest Categories Using Weibo Check-in Data. ISPRS Int. J. Geo-Inf. 2020, 9, 124. [Google Scholar] [CrossRef]
- Li, X.T.; Hu, T.Y.; Gong, P.; Du, S.H.; Chen, B.; Li, X.C.; Dai, Q. Mapping Essential Urban Land Use Categories in Beijing with a Fast Area of Interest (AOI)-Based Method. Remote Sens. 2021, 13, 477. [Google Scholar] [CrossRef]
- Yao, Y.; Li, X.; Liu, X.P.; Liu, P.H.; Liang, Z.T.; Zhang, J.B.; Mai, K. Sensing spatial distribution of urban land use by integrating points-of-interest and Google Word2Vec model. Int. J. Geogr. Inf. Sci. 2017, 31, 825–848. [Google Scholar] [CrossRef]
- Cao, K.; Guo, H.; Zhang, Y. Comparison of Approaches for Urban Functional Zones Classification Based on Multi-Source Geospatial Data: A Case Study in Yuzhong District, Chongqing, China. Sustainability 2019, 11, 660. [Google Scholar] [CrossRef]
- Du, S.H.; Zheng, M.Y.; Guo, L.Y.; Wu, Y.H.; Li, Z.J.; Liu, P.Y. Urban building function classification based on multisource geospatial data: A two-stage method combining unsupervised and supervised algorithms. Earth Sci. Inform. 2024, 17, 1179–1201. [Google Scholar] [CrossRef]
- Wang, N.C.; Liu, Y.F.; Wang, J.Z.; Qian, X.J.; Zhao, X.Z.; Wu, J.P.; Wu, B.; Yao, S.J.; Fang, L. Investigating the Potential of Using POI and Nighttime Light Data to Map Urban Road Safety at the Micro-Level: A Case in Shanghai, China. Sustainability 2019, 11, 4739. [Google Scholar] [CrossRef]
- Treitz, P.M.; Howarth, P.J.; Gong, P. Application of satellite and gis technologies for land-cover and land-use mapping at the rural-urban fringe—A case-study. Photogramm. Eng. Remote Sens. 1992, 58, 439–448. [Google Scholar]
- Seto, K.C.; Woodcock, C.E.; Song, C.; Huang, X.; Lu, J.; Kaufmann, R.K. Monitoring land-use change in the Pearl River Delta using Landsat TM. Int. J. Remote Sens. 2002, 23, 1985–2004. [Google Scholar] [CrossRef]
- Thomas, N.; Hendrix, C.; Congalton, R.G. A comparison of urban mapping methods using high-resolution digital imagery. Photogramm. Eng. Remote Sens. 2003, 69, 963–972. [Google Scholar] [CrossRef]
- Gong, P.; Chen, B.; Li, X.; Liu, H.; Wang, J.; Bai, Y.; Chen, J.; Chen, X.; Fang, L.; Feng, S.; et al. Mapping essential urban land use categories in China (EULUC-China): Preliminary results for 2018. Sci. Bull. 2020, 65, 182–187. [Google Scholar] [CrossRef]
- Sun, J.; Wang, H.; Song, Z.L.; Lu, J.B.; Meng, P.Y.; Qin, S.H. Mapping Essential Urban Land Use Categories in Nanjing by Integrating Multi-Source Big Data. Remote Sens. 2020, 12, 2386. [Google Scholar] [CrossRef]
- Guo, Y.W.; Tang, J.B.; Liu, H.M.; Yang, X.X.; Deng, M. Identifying up-to-date urban land-use patterns with visual and semantic features based on multisource geospatial data. Sustain. Cities Soc. 2024, 101, 105184. [Google Scholar] [CrossRef]
- Song, J.C.; Lin, T.; Li, X.H.; Prishchepov, A.V. Mapping Urban Functional Zones by Integrating Very High Spatial Resolution Remote Sensing Imagery and Points of Interest: A Case Study of Xiamen, China. Remote Sens. 2018, 10, 1737. [Google Scholar] [CrossRef]
- Tu, Y.; Chen, B.; Zhang, T.; Xu, B. Regional Mapping of Essential Urban Land Use Categories in China: A Segmentation-Based Approach. Remote Sens. 2020, 12, 1058. [Google Scholar] [CrossRef]
- Zhao, X.; Xia, N.; Li, M.C.; Xu, Y.Y. Mapping urban land type with multi-source geospatial big data: A case study of Shenzhen, China. J. Maps 2023, 19, 2273833. [Google Scholar] [CrossRef]
- Guzder-Williams, B.; Mackres, E.; Angel, S.; Blei, A.M.; Lamson-Hall, P. Intra-urban land use maps for a global sample of cities from Sentinel-2 satellite imagery and computer vision. Comput. Environ. Urban Syst. 2023, 100, 101917. [Google Scholar] [CrossRef]
- Rosentreter, J.; Hagensieker, R.; Okujeni, A.; Roscher, R.; Wagner, P.D.; Waske, B. Subpixel Mapping of Urban Areas Using EnMAP Data and Multioutput Support Vector Regression. IEEE J. Sel. Top. Appl. Earth Obs. Remote Sens. 2017, 10, 1938–1948. [Google Scholar] [CrossRef]
- Herold, M.; Scepan, J.; Müller, A.; Günther, S. Object-oriented mapping and analysis of urban land use/cover using IKONOS data. In Proceedings of the 22nd Symposium of the European-Association-of-Remote-Sensing-Laboratories, Prague, Czech Republic, 4–6 June 2002; pp. 531–538. [Google Scholar]
- Selvaraj, R.; Amali, D.G.B. Assessment of object-based classification for mapping land use and land cover using google earth. Glob. Nest J. 2023, 25, 131–138. [Google Scholar] [CrossRef]
- Xu, J.F.; Yang, J.; Xiong, X.G.; Li, H.F.; Huang, J.F.; Ting, K.C.; Ying, Y.B.; Lin, T. Towards interpreting multi-temporal deep learning models in crop mapping. Remote Sens. Environ. 2021, 264, 112599. [Google Scholar] [CrossRef]
- Chowdhury, M.S. Comparison of accuracy and reliability of random forest, support vector machine, artificial neural network and maximum likelihood method in land use/cover classification of urban setting. Environ. Chall. 2024, 14, 100800. [Google Scholar] [CrossRef]
- Jun, M.-J. A comparison of a gradient boosting decision tree, random forests, and artificial neural networks to model urban land use changes: The case of the Seoul metropolitan area. Int. J. Geogr. Inf. Sci. 2021, 35, 2149–2167. [Google Scholar] [CrossRef]
- Ouma, Y.O.; Keitsile, A.; Nkwae, B.; Odirile, P.; Moalafhi, D.; Qi, J.G. Urban land-use classification using machine learning classifiers: Comparative evaluation and post-classification multi-feature fusion approach. Eur. J. Remote Sens. 2023, 56, 21. [Google Scholar] [CrossRef]
- Wu, R.; Wang, J.; Zhang, D.; Wang, S. Identifying different types of urban land use dynamics using Point-of-interest (POI) and Random Forest algorithm: The case of Huizhou, China. Cities 2021, 114, 103202. [Google Scholar] [CrossRef]
- Tian, Y.; Chen, C.R.; Chen, X.Y.; Zhang, Q.Q.; Sun, R.Z. Research on real-time analysis technology of urban land use based on support vector machine. Pattern Recognit. Lett. 2020, 133, 320–326. [Google Scholar] [CrossRef]
- Wu, H.; Lin, A.; Xing, X.; Song, D.; Li, Y. Identifying core driving factors of urban land use change from global land cover products and POI data using the random forest method. Int. J. Appl. Earth Obs. Geoinf. 2021, 103, 102475. [Google Scholar] [CrossRef]
- Wei, X.B.; Zhang, W.; Zhang, Z.; Huang, H.S.; Meng, L.K. Urban land use land cover classification based on GF-6 satellite imagery and multi-feature optimization. Geocarto Int. 2023, 38, 2236579. [Google Scholar] [CrossRef]
- Li, W.L. Mapping urban land use by combining multi-source social sensing data and remote sensing images. Earth Sci. Inform. 2021, 14, 1537–1545. [Google Scholar] [CrossRef]
- Jia, P.; Chen, C.; Zhang, D.; Sang, Y.; Zhang, L. Semantic segmentation of deep learning remote sensing images based on band combination principle: Application in urban planning and land use. Comput. Commun. 2024, 217, 97–106. [Google Scholar] [CrossRef]
- Srivastava, S.; Vargas-Muñoz, J.E.; Tuia, D. Understanding urban landuse from the above and ground perspectives: A deep learning, multimodal solution. Remote Sens. Environ. 2019, 228, 129–143. [Google Scholar] [CrossRef]
- Wang, J.; Hadjikakou, M.; Hewitt, R.J.; Bryan, B.A. Simulating large-scale urban land-use patterns and dynamics using the U-Net deep learning architecture. Comput. Environ. Urban Syst. 2022, 97, 101855. [Google Scholar] [CrossRef]
- Yin, J.D.; Fu, P.; Hamm, N.A.S.; Li, Z.C.; You, N.S.; He, Y.L.; Cheshmehzangi, A.; Dong, J.W. Decision-Level and Feature-Level Integration of Remote Sensing and Geospatial Big Data for Urban Land Use Mapping. Remote Sens. 2021, 13, 1579. [Google Scholar] [CrossRef]
- Su, M.; Guo, R.Z.; Chen, B.; Hong, W.Y.; Wang, J.Q.; Feng, Y.M.; Xu, B. Sampling Strategy for Detailed Urban Land Use Classification: A Systematic Analysis in Shenzhen. Remote Sens. 2020, 12, 1497. [Google Scholar] [CrossRef]
- Ye, T.T.; Zhao, N.Z.; Yang, X.C.; Ouyang, Z.T.; Liu, X.P.; Chen, Q.; Hu, K.J.; Yue, W.Z.; Qi, J.G.; Li, Z.S.; et al. Improved population mapping for China using remotely sensed and points-of-interest data within a random forests model. Sci. Total Environ. 2019, 658, 936–946. [Google Scholar] [CrossRef] [PubMed]
- Zong, L.L.; He, S.J.; Lian, J.T.; Bie, Q.; Wang, X.Y.; Dong, J.R.; Xie, Y.W. Detailed Mapping of Urban Land Use Based on Multi-Source Data: A Case Study of Lanzhou. Remote Sens. 2020, 12, 1987. [Google Scholar] [CrossRef]
- Chen, W.; Zhou, Y.Y.; Wu, Q.S.; Chen, G.; Huang, X.; Yu, B.L. Urban Building Type Mapping Using Geospatial Data: A Case Study of Beijing, China. Remote Sens. 2020, 12, 2805. [Google Scholar] [CrossRef]
- Chen, D.; Wang, Y.F.; Shen, Z.Y.; Liao, J.F.; Chen, J.Z.; Sun, S.B. Long Time-Series Mapping and Change Detection of Coastal Zone Land Use Based on Google Earth Engine and Multi-Source Data Fusion. Remote Sens. 2022, 14, 1. [Google Scholar] [CrossRef]
- West, G.J.; Glasby, T.M. Interpreting Long-Term Patterns of Seagrasses Abundance: How Seagrass Variability Is Dependent on Genus and Estuary Type. Estuaries Coasts 2022, 45, 1393–1408. [Google Scholar] [CrossRef]
- Phan, D.C.; Trung, T.H.; Truong, V.T.; Sasagawa, T.; Vu, T.P.T.; Bui, D.T.; Hayashi, M.; Tadono, T.; Nasahara, K.N. First comprehensive quantification of annual land use/cover from 1990 to 2020 across mainland Vietnam. Sci. Rep. 2021, 11, 9979. [Google Scholar] [CrossRef]
- Qi, Y.; Zhang, Y.; Jiang, H.; Hou, H.; Li, J. Life cycle assessment in urban territories: A case study of Dalian city, China. Int. J. Life Cycle Assess. 2018, 24, 1194–1208. [Google Scholar] [CrossRef]
- Chen, L.; Nuo, W. Dynamic Simulation of Land Use Changes in Port City: A Case Study of Dalian, China. Procedia—Soc. Behav. Sci. 2013, 96, 981–992. [Google Scholar] [CrossRef]
- Guo, F.; Zhang, H.C.; Fan, Y.; Zhu, P.S.; Wang, S.Y.; Lu, X.D.; Jin, Y. Detection and evaluation of a ventilation path in a mountainous city for a sea breeze: The case of Dalian. Build. Environ. 2018, 145, 177–195. [Google Scholar] [CrossRef]
- Yang, J.; Sun, J.; Ge, Q.; Li, X. Assessing the impacts of urbanization-associated green space on urban land surface temperature: A case study of Dalian, China. Urban For. Urban Green. 2017, 22, 1–10. [Google Scholar] [CrossRef]
- Stephens, T.A.; Bledsoe, B.P. Probabilistic mapping of flood hazards: Depicting uncertainty in streamflow, land use, and geomorphic adjustment. Anthropocene 2020, 29, 100231. [Google Scholar] [CrossRef]
- Dey, J.; Sakhre, S.; Vijay, R.; Bherwani, H.; Kumar, R. Geospatial assessment of urban sprawl and landslide susceptibility around the Nainital lake, Uttarakhand, India. Environ. Dev. Sustain. 2021, 23, 3543–3561. [Google Scholar] [CrossRef]
- Ahmad, M.N.; Shao, Z.F.; Javed, A.; Islam, F.; Ahmad, H.H.; Aslam, R.W. The Cellular Automata Approach in Dynamic Modelling of Land Use Change Detection and Future Simulations Based on Remote Sensing Data in Lahore Pakistan. Photogramm. Eng. Remote Sens. 2023, 89, 47–55. [Google Scholar] [CrossRef]
- Iabchoon, S.; Wongsai, S.; Chankon, K. Mapping urban impervious surface using object-based image analysis with WorldView-3 satellite imagery. J. Appl. Remote Sens. 2017, 11, 046015. [Google Scholar] [CrossRef]
- Zhang, K.Q.; Gann, D.; Ross, M.; Biswas, H.; Li, Y.P.; Rhome, J. Comparison of TanDEM-X DEM with LiDAR Data for Accuracy Assessment in a Coastal Urban Area. Remote Sens. 2019, 11, 876. [Google Scholar] [CrossRef]
- Huang, H.; Chen, P.; Xu, X.; Liu, C.; Wang, J.; Liu, C.; Clinton, N.; Gong, P. Estimating building height in China from ALOS AW3D30. ISPRS J. Photogramm. Remote Sens. 2022, 185, 146–157. [Google Scholar] [CrossRef]
- Tian, S.Q.; Zhong, Y.F.; Ma, A.L.; Zhang, L.P. Three-Dimensional Change Detection in Urban Areas Based on Complementary Evidence Fusion. IEEE Trans. Geosci. Remote Sens. 2022, 60, 13. [Google Scholar] [CrossRef]
- Zhang, Y.W.; Zhang, J.L.; Zhang, X.Q.; Zhou, D.; Gu, Z.L. Analyzing the Characteristics of UHI (Urban Heat Island) in Summer Daytime Based on Observations on 50 Sites in 11 LCZ (Local Climate Zone) Types in Xi’an, China. Sustainability 2021, 13, 83. [Google Scholar] [CrossRef]
- Stewart, I.D.; Oke, T.R. Local climate zones for urban temperature studies. Bull. Am. Meteorol. Soc. 2012, 93, 1879–1900. [Google Scholar] [CrossRef]
- Bechtel, B.; Alexander, P.J.; Bohner, J.; Ching, J.; Conrad, O.; Feddema, J.; Mills, G.; See, L.; Stewart, I. Mapping Local Climate Zones for a Worldwide Database of the Form and Function of Cities. ISPRS Int. J. Geo-Inf. 2015, 4, 199–219. [Google Scholar] [CrossRef]
- Johnson, B.A.; Jozdani, S.E. Local Climate Zone (LCZ) Map Accuracy Assessments Should Account for Land Cover Physical Characteristics that Affect the Local Thermal Environment. Remote Sens. 2019, 11, 2420. [Google Scholar] [CrossRef]
- Zhao, J.; Chen, G.; Yu, L.; Ren, C.; Xie, J.; Chung, L.; Ni, H.; Gong, P. Mapping urban morphology changes in the last two decades based on local climate zone scheme: A case study of three major urban agglomerations in China. Urban Clim. 2023, 47, 101391. [Google Scholar] [CrossRef]
- Gong, P.; Liu, H.; Zhang, M.; Li, C.; Wang, J.; Huang, H.; Clinton, N.; Ji, L.; Li, W.; Bai, Y.; et al. Stable classification with limited sample: Transferring a 30-m resolution sample set collected in 2015 to mapping 10-m resolution global land cover in 2017. Sci. Bull. 2019, 64, 370–373. [Google Scholar] [CrossRef] [PubMed]
- Li, X.; Gong, P.; Zhou, Y.; Wang, J.; Bai, Y.; Chen, B.; Hu, T.; Xiao, Y.; Xu, B.; Yang, J.; et al. Mapping global urban boundaries from the global artificial impervious area (GAIA) data. Environ. Res. Lett. 2020, 15, 094044. [Google Scholar] [CrossRef]
- Ou, J.; Liu, X.; Liu, P.; Liu, X. Evaluation of Luojia 1-01 nighttime light imagery for impervious surface detection: A comparison with NPP-VIIRS nighttime light data. Int. J. Appl. Earth Obs. Geoinf. 2019, 81, 1–12. [Google Scholar] [CrossRef]
- Wang, L.; Fan, H.; Wang, Y. Improving population mapping using Luojia 1-01 nighttime light image and location-based social media data. Sci. Total Environ. 2020, 730, 139148. [Google Scholar] [CrossRef]
- Xing, X.Y.; Huang, Z.; Cheng, X.M.; Zhu, D.; Kang, C.G.; Zhang, F.; Liu, Y. Mapping Human Activity Volumes Through Remote Sensing Imagery. IEEE J. Sel. Top. Appl. Earth Obs. Remote Sens. 2020, 13, 5652–5668. [Google Scholar] [CrossRef]
- Sutton, P.C.; Goetz, A.R.; Fildes, S.; Forster, C.; Ghosh, T. Darkness on the Edge of Town: Mapping Urban and Peri-Urban Australia Using Nighttime Satellite Imagery. Prof. Geogr. 2010, 62, 119–133. [Google Scholar] [CrossRef]
- Zhang, X.; Liu, L.Y.; Wu, C.S.; Chen, X.D.; Gao, Y.; Xie, S.; Zhang, B. Development of a global 30m impervious surface map using multisource and multitemporal remote sensing datasets with the Google Earth Engine platform. Earth Syst. Sci. Data 2020, 12, 1625–1648. [Google Scholar] [CrossRef]
- Yu, L.; Du, Z.; Dong, R.; Zheng, J.; Tu, Y.; Chen, X.; Hao, P.; Zhong, B.; Peng, D.; Zhao, J.; et al. FROM-GLC Plus: Toward near real-time and multi-resolution land cover mapping. GISci. Remote Sens. 2022, 59, 1026–1047. [Google Scholar] [CrossRef]
- Yu, L.; Wang, J.; Gong, P. Improving 30 m global land-cover map FROM-GLC with time series MODIS and auxiliary data sets: A segmentation-based approach. Int. J. Remote Sens. 2013, 34, 5851–5867. [Google Scholar] [CrossRef]
- Achanta, R.; Susstrunk, S. Superpixels and Polygons Using Simple Non-iterative Clustering. In Proceedings of the 2017 IEEE Conference on Computer Vision and Pattern Recognition (CVPR), Honolulu, HI, USA, 21–26 July 2017; pp. 4895–4904. [Google Scholar]
- Tu, Y.; Chen, B.; Lang, W.; Chen, T.; Li, M.; Zhang, T.; Xu, B. Uncovering the Nature of Urban Land Use Composition Using Multi-Source Open Big Data with Ensemble Learning. Remote Sens. 2021, 13, 4241. [Google Scholar] [CrossRef]
- Liang, H.D.; Guo, Z.Y.; Wu, J.P.; Chen, Z.Q. GDP spatialization in Ningbo City based on NPP/VIIRS night-time light and auxiliary data using random forest regression. Adv. Space Res. 2020, 65, 481–493. [Google Scholar] [CrossRef]
- Li, X.C.; Zhou, Y.Y. Urban mapping using DMSP/OLS stable night-time light: A review. Int. J. Remote Sens. 2017, 38, 6030–6046. [Google Scholar] [CrossRef]
- Wu, B.; Yang, C.S.; Chen, Z.Q.; Wu, Q.S.; Yu, S.Y.; Wang, C.X.; Li, Q.X.; Wu, J.P.; Yu, B.L. The Relationship between Urban 2-D/3-D Landscape Pattern and Nighttime Light Intensity. IEEE J. Sel. Top. Appl. Earth Obs. Remote Sens. 2022, 15, 478–489. [Google Scholar] [CrossRef]
- Huang, X.M.; Schneider, A.; Friedl, M.A. Mapping sub-pixel urban expansion in China using MODIS and DMSP/OLS nighttime lights. Remote Sens. Environ. 2016, 175, 92–108. [Google Scholar] [CrossRef]
- Xia, N.; Cheng, L.; Li, M.C. Mapping Urban Areas Using a Combination of Remote Sensing and Geolocation Data. Remote Sens. 2019, 11, 1470. [Google Scholar] [CrossRef]
- Huang, L.Y.; Xiang, S.S.; Zheng, J.Z. Fine-Scale Monitoring of Industrial Land and Its Intra-Structure Using Remote Sensing Images and POIs in the Hangzhou Bay Urban Agglomeration, China. Int. J. Environ. Res. Public Health 2023, 20, 226. [Google Scholar] [CrossRef]
Disclaimer/Publisher’s Note: The statements, opinions and data contained in all publications are solely those of the individual author(s) and contributor(s) and not of MDPI and/or the editor(s). MDPI and/or the editor(s) disclaim responsibility for any injury to people or property resulting from any ideas, methods, instructions or products referred to in the content. |
© 2024 by the authors. Licensee MDPI, Basel, Switzerland. This article is an open access article distributed under the terms and conditions of the Creative Commons Attribution (CC BY) license (https://creativecommons.org/licenses/by/4.0/).