Technical Note

Accelerated Atmospheric to Hydrological Spread of Drought in the Yangtze River Basin under Climate

by
Chengyuan Zhang
1,2,
Zhiming Han
3,
Shuo Wang
1,2,
Jiankun Wang
1,2,
Chenfeng Cui
1,2,* and
Junrong Liu
4
1
College of Water Resources and Architectural Engineering, Northwest A&F University, Xianyang 712100, China
2
Key Laboratory for Agricultural Soil and Water Engineering in Arid Area of Ministry of Education, Northwest A&F University, Xianyang 712100, China
3
College of Natural Resources and Environment, Northwest A&F University, Xianyang 712100, China
4
China Coal Aerial Survey and Remote Sensing Group Co., Ltd., Xi’an 710100, China
*
Author to whom correspondence should be addressed.
Remote Sens. 2024, 16(16), 3033; https://doi.org/10.3390/rs16163033
Submission received: 4 July 2024 / Revised: 14 August 2024 / Accepted: 16 August 2024 / Published: 18 August 2024

Abstract

Persistent droughts pose a threat to agricultural production, and the changing environment worsens the risk of drought exposure. Understanding the propagation of drought in changing environments and assessing possible impact factors can help in the early detection of drought, guiding agricultural production practices. The current study cannot reflect the propagation status of drought to the total terrestrial hydrological drought, so this work creatively investigated the atmospheric to hydrological drought propagation time in the Yangtze River Basin under the dynamic and static perspectives based on the Standardized Precipitation Evapotranspiration Index and the Terrestrial Water Storage Anomalous Drought Index, fine-tuned the time scale to the seasonal scale, and explored the contributing capacity of the variable interactions. The results show that: (1) under the dynamic perspective, while the propagation time is decreasing in the annual scale, the spring season shows the opposite trend; and (2) large variability exists in the timing of drought propagation at spatial scales, with elevation playing the most important influential role, and bivariate interactions contributing stronger explanations compared to single variables. This study highlights the importance of considering the impact of variable interactions and contributes to our understanding of the response of secondary droughts to upper-level droughts, providing valuable insights into the propagation of droughts to total terrestrial hydrologic drought.

1. Introduction

Drought is an extreme weather process that is widespread, destructive, long-lasting, and easily overlooked because it is not easily detected, posing a serious hazard to agricultural production and economic growth [1]. Commonly, droughts can be summarized as meteorological, agricultural, hydrological, and socio-economic droughts [2]. Influenced by water and energy cycles, various types of droughts are connected through feedback [3]; based on this, upper-level droughts often cause secondary droughts, a phenomenon known as drought propagation [4]. Against the backdrop of global warming, the Earth’s system is experiencing significant changes, such as the frequency of extreme climatic phenomena, and meteorological and hydrological systems are experiencing vulnerability, which directly alters the state of development of the hydrological cycle [5]. Studying drought propagation in a dynamic context and on smaller time scales and analyzing the properties that influence drought propagation will help reduce losses due to drought and guide drought risk management in watersheds.
Signs of meteorological drought often start with a lack of precipitation and intense evaporation, triggering a cascade of other types of droughts. As the energy cycle triggers a lack of soil moisture, triggering agricultural droughts, it further reduces the hydrological recharge of rivers, resulting in a shortage of available water resources and bringing hydrological droughts [6]. Studies show that about 454 million km2 of cultivated area globally experience the threat of drought, with an accumulated loss of approximately USD 166 billion [7]. Threats posed by drought relate to ecosystem security and human security in all aspects of production, and in the context of drought conditions and the potential for further intensification of drought in the face of surges in demand for water as a result of socio-economic growth, an in-depth understanding of drought propagation would facilitate the orderly management and rational allocation of agricultural, industrial, and water supplies.
Lag, prolongation, and attenuation characterize the propagation of drought [8]. Recent studies have been concerned with drought propagation time and propagation threshold as a way to characterize the propagation of droughts. For example, based on order analysis and Copula theory, Wang et al. [9] derived drought propagation time and drought propagation threshold in central Yunnan, China. Han et al. [10] determined the risk probabilities and trigger thresholds for long-chain drought propagation in China by establishing a dynamic threshold framework and found that the drought risk probabilities and trigger thresholds had significant spatial heterogeneity. However, the analysis of drought propagation in changing environments and on smaller time scales is not clear from current studies, so it is key to explore drought propagation in altered contexts [5], particularly in the context of rapid warming humidification and accelerated hydrological cycles. Therefore, this paper studies drought propagation in changing environments, i.e., dynamic propagation, and explores it under a seasonal scale.
Various indices exist to detect and measure drought conditions and to explore drought propagation characteristics. The Standardized Precipitation Evapotranspiration Index (SPEI) [11] is a widely recognized meteorological drought index that explores multiple time scales, combining precipitation and evapotranspiration in its calculations, and that has demonstrated greater applicability in monitoring drought in changing environments than other meteorological drought indices [12]. For hydrological drought indices, rapidly evolving remote sensing technologies, such as the Gravity Recovery and Climate Experiment Satellite (GRACE) and its successor (GRACE-FO), perform well in measuring large-scale watershed storage [13,14]. Accordingly, the terrestrial water storage (TWS) settled by the satellite can reflect the changes in terrestrial water storage anomalies (TWSA), and the resulting drought index, TWSA-DSI, has been extensively utilized to explore hydrologic drought [15,16,17].
Previous studies have shown that meteorological and hydrological factors and teleconnection factors exert a direct consequence on drought propagation [4]. For example, a previous study [5] summarized that precipitation and the Pacific Interdecadal Oscillation have the most important roles for factors accelerating drought propagation in the Pearl River region, with precipitation having a negative correlation effect. Globally, Van Loon and Laaha [18] argued that this case is more linked to climatic scenarios and not more focused on the geographic characteristics of watersheds. However, it has been shown that the effect of the geographical status of the watershed cannot be ignored [19,20], and anthropogenic impacts such as water supply irrigation, reservoir construction, etc. have also been shown to be strong factors influencing the propagation time of droughts [21,22]. Moreover, most studies only assess the contribution of a singular variable, but the joint feedback effect of bivariate factors is not yet known, so it is crucial to explore the meteorological factors and catchment characteristics in the watershed as well as the joint effect of bivariate factors.
As China’s superpower river, the Yangtze River Basin (YRB) is an important economic, cultural, and food production base, and the rational distribution of water is a guarantee of agricultural security and human life safety. Current research has concluded that the YRB is facing more severe drought pressure since 2000 [23]; therefore, the YRB is chosen as the research object of this paper, and the main objectives included in the article are to: (1) identify meteorological and terrestrial hydrological droughts in the YRB; (2) determine the timing of static propagation and dynamic propagation on annual and seasonal scales, respectively; and (3) explore the meteorological factors and the geographic characteristics of catchments that may influence the propagation time of droughts. In this paper, drought propagation time is analyzed in depth from different perspectives, and the findings will enhance the knowledge of drought propagation, which will facilitate water management and allocation in the YRB.

2. Study Area and Data

2.1. Study Area

The YRB (90°E–122˚E, 24°N–35°N) (Figure 1) covers a territory of nearly 1.8 million km2, about 18.8% of the country’s total land area, with an average multi-year water resource volume of 996 billion m3, which is close to 36% of the national total. The YRB spans three regions, and the basin is characterized by high population density and a high level of economic development, with a GDP exceeding 40%. The terrain of the basin is a three-stage ladder distribution, west high (7143 m) and east low (−142 m) (Figure 1a), the average precipitation from west to east for many years is 300 mm ~ 2400 mm, the average temperature for many years is about −4~18 °C [24], and the time and space distribution of the region’s climate and hydrological characteristics is extremely uneven. The land-use types in the watershed are mainly categorized as grassland, forest, and cropland, as shown in Figure 1b; the main soil types present include Leptosol, Cambisol, Regosol, and Acrisol, as shown in Figure 1c. Under rapid global warming and accelerated urbanization, the climate and hydrology of the watersheds have been severely affected, and the region faces the threat of increasing droughts and floods [25].

2.2. Data

2.2.1. GRACE Data

We used GRACE RL06 mascon data from the University of Texas Space Research Center from between April 2002 and December 2022 to derive TWSA data. This data can be obtained from https://www2.csr.utexas.edu/grace/RL06_mascons.html (accessed on 19 September 2023) with a resolution of 0.25° in space and 1 month in time. The mascon-based technique not only improves the resolution and reduces the error, but also preserves the spatial and temporal details better than classical spherical harmonic processing [26]. For technical reasons, there were 11 months of data gaps during the period from 04/2002–06/2017 (GRACE) and 06/2018–present (GRACE-FO), but the vacant data could be supplemented by a linear interpolation approach [27].

2.2.2. GLDAS Data

The Global Land Data Assimilation System (GLDAS) consists of four high-resolution land surface models: Noah, Mosaic, Community Land model, and Variable Infiltration Capacity [28], which contain precipitation, soil moisture, runoff, vaporization, temperature, and other land surface data. In this study, the GLDAS-2.1 Noah model data was utilized to analyze the meteorological and geographic factors influencing drought propagation, consistent with the GRACE satellite resolution (0.25°). This analysis included runoff, temperature, and soil moisture at various depths (0–10 cm, 10–40 cm, 40–100 cm, and 100–200 cm) for the period from April 2002 to December 2022. This data can be downloaded from https://disc.gsfc.nasa.gov/information?page=1&project=GRACE-DA-DM,FLDAS,GLDAS,NEWS,NLDAS,NCA-LDAS&keywords=hydrology (accessed on 25 September 2023).

2.2.3. Precipitation and Potential Evapotranspiration Data

This study uses climate data from the Climate Research Unit (CRU) at the University of East Anglia (UEA), which provides monthly climate data from 1901 to the present day [29]. To calculate the Meteorological Drought Index, SPEI, this study used precipitation and potential evapotranspiration data from 1971–2022, and the resolution was 0.25° in space and 1 month in time, which can be downloaded from https://crudata.uea.ac.uk/cru/data/hrg/cru_ts_4.05/cruts.2103051243.v4.05 (accessed on 6 October 2023).

2.2.4. Auxiliary Datasets
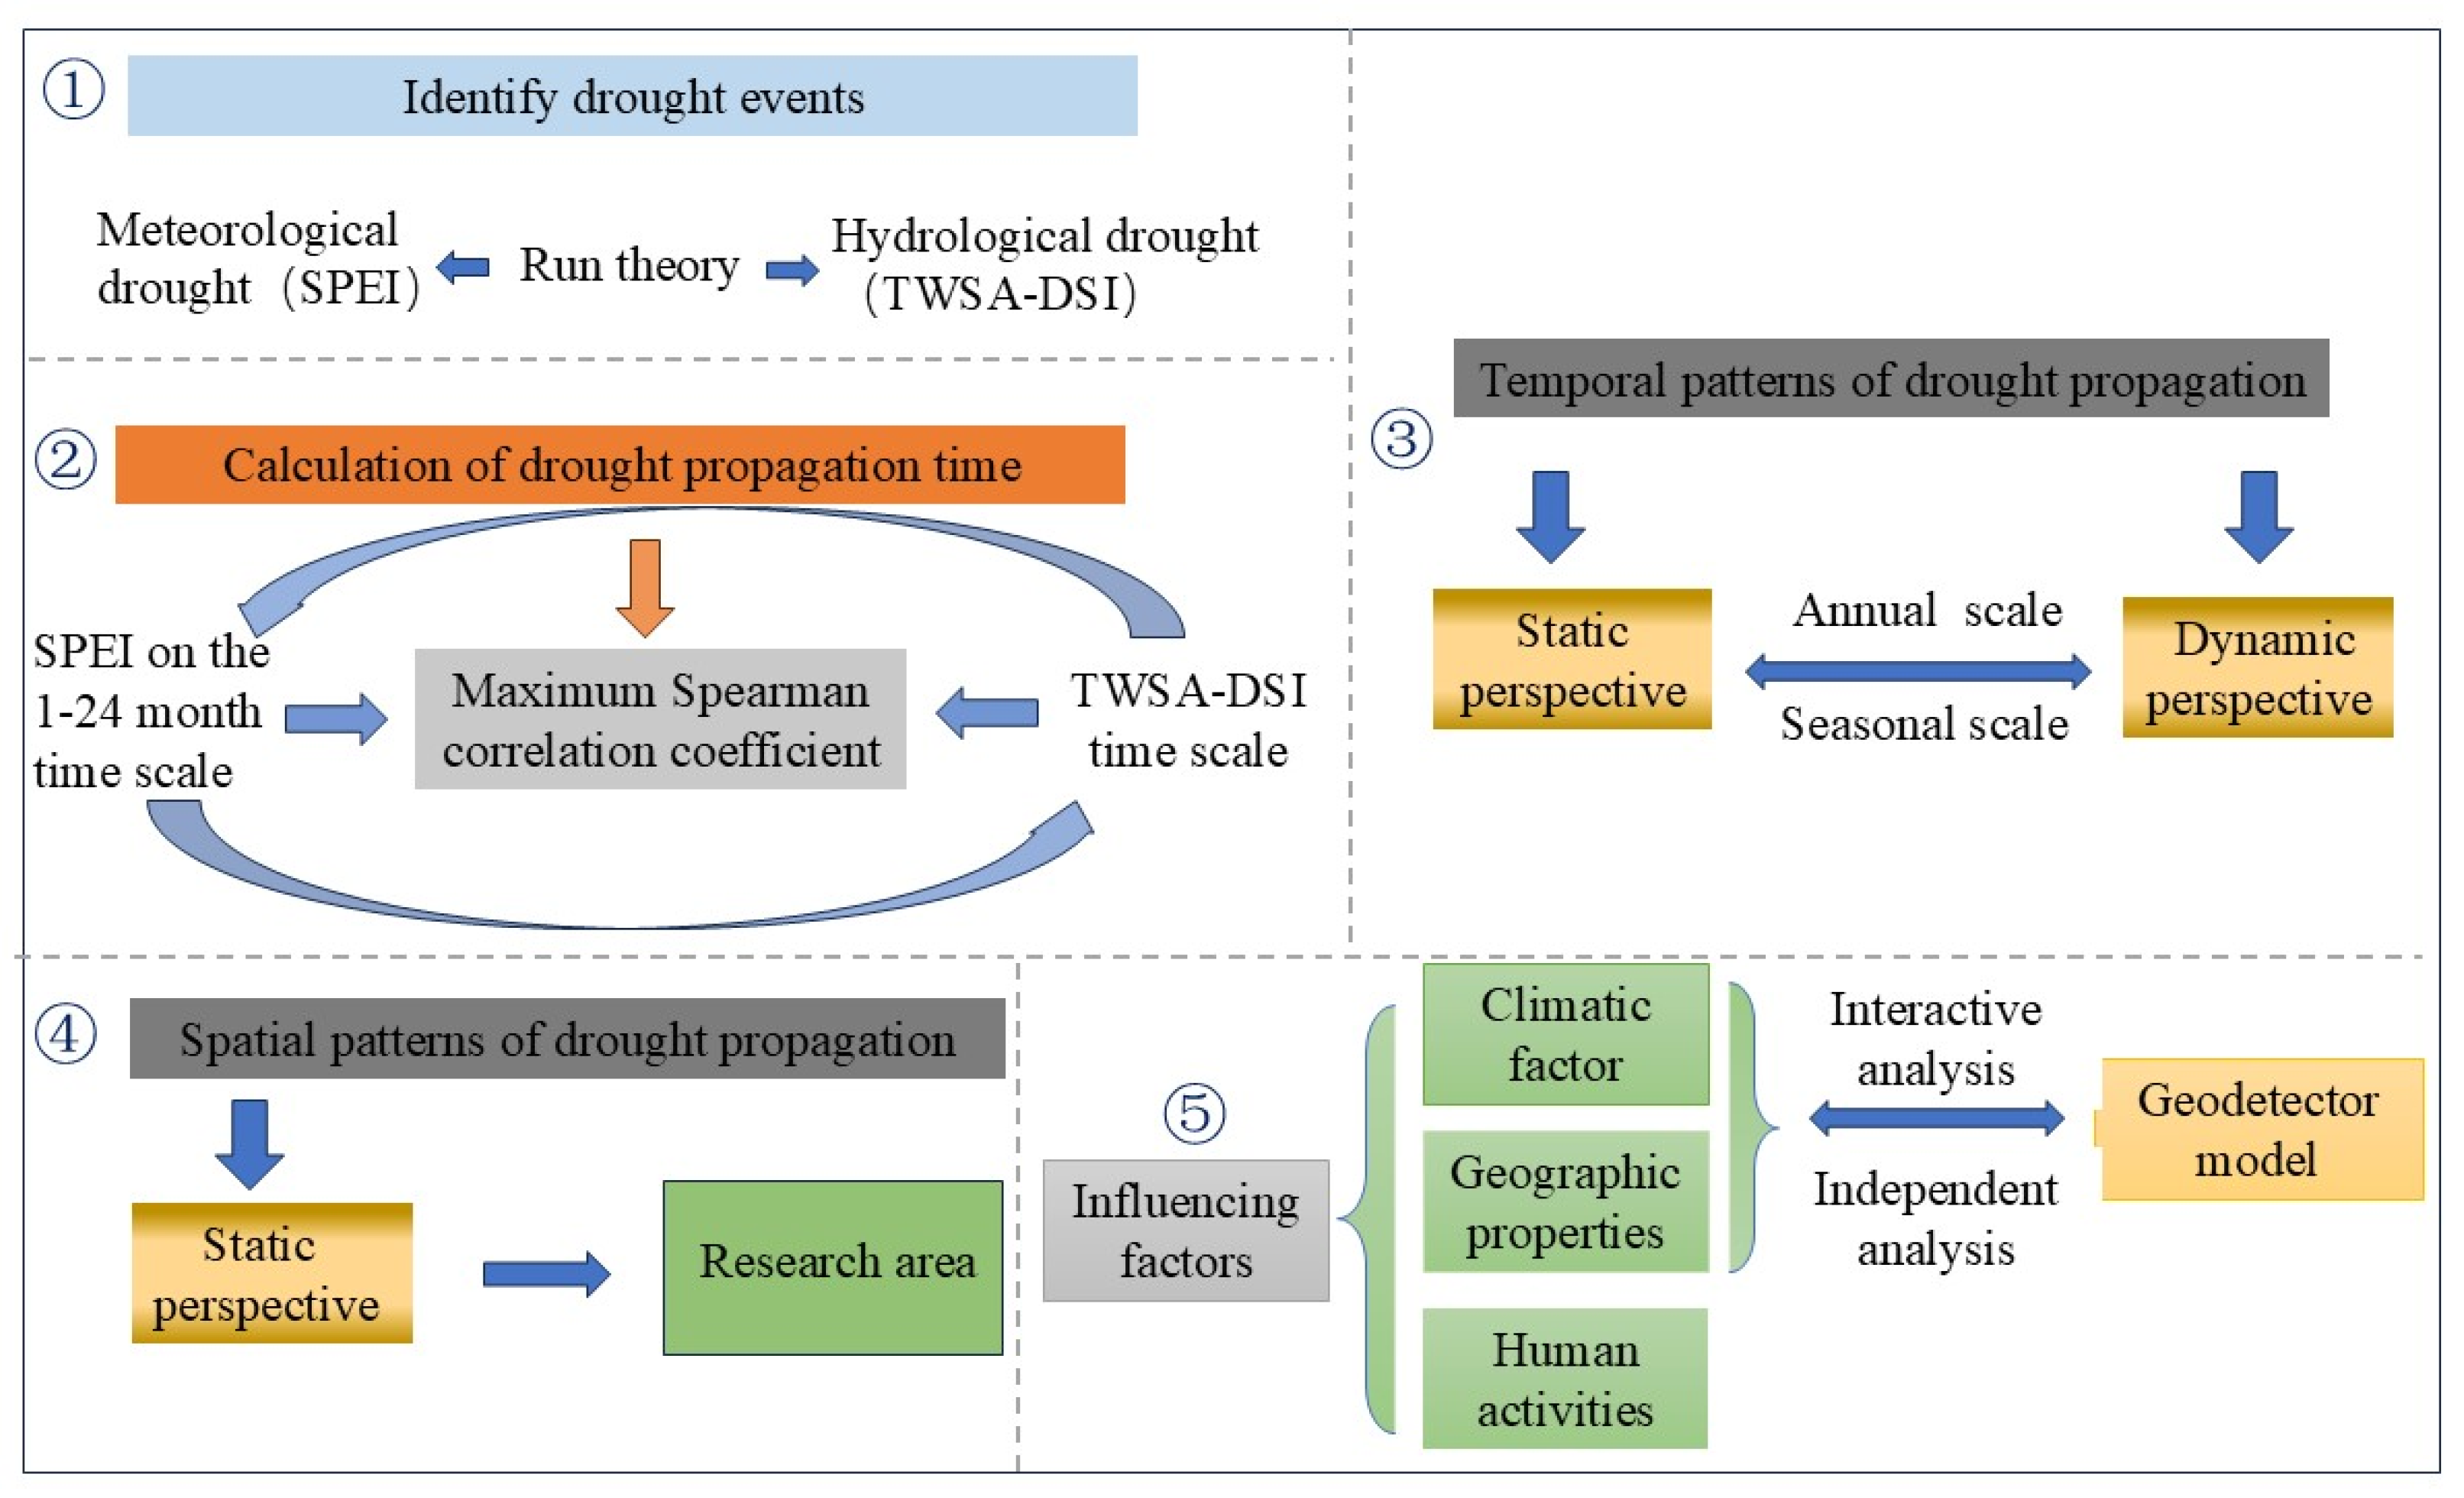
The 250-meter spatial resolution digital elevation maps used in this paper were obtained from Global Multi-resolution Terrain Elevation Data 2010 (GMTED2010) (GMTED2010|U.S. Geological Survey (usgs.gov) (accessed on 8 September 2023)), the land-use type data are from the China Land Cover Dataset (CLCD) produced by Wuhan University [30], and the soil type data from the Harmonized World Soil Database (HWSD) are from the International Organization for Food and Agriculture (IOFA) (https://www.fao.org/soils-portal (accessed on 6 August 2024)).

3. Methodology

The specific research steps in this paper are illustrated in Figure 2.

3.1. SPEI

Considering the role of temperature under global warming, SPEI [11] is computed using precipitation and potential evapotranspiration, which can capture drought characteristics on multiple time scales (1–24 months) and has been heavily applied to characterize meteorological drought [31,32]. The calculation of SPEI consists of the following three main steps: (i) calculating the cumulative difference in the water balance over the study period; (ii) standardizing the series and estimating the cumulative probability; and (iii) calculating the SPEI by converting the cumulative probability density function into a standard normally distributed sequence, which calculation process is described in more detail in [11,33].

3.2. TWSA-DSI

The TWS obtained from the GRACE satellite includes surface water, canopy, snow, soil, and groundwater, which is the land’s vertical aquifer storage and is a key signal of hydrological drought [34]. The TWSA from GRACE is the raw data product processed for 2004–2009 distance leveling, and the resulting drought index, TWSA-DSI, is a standardized anomaly of TWS [17] and is considered a hydrological drought index [16,35].TWSA-DSI is given in in Equation (1):
T W S A - D S I i , j = T W S A i , j T W S A ¯ j σ j
where i is the year from 2002 to 2022; j   is the month from Jan to Dec; T W S A ¯ j denotes the TWSA in the j th month, and TWSA can be obtained directly from the GRACE satellite; and σ j is the standard deviation. The threshold is −0.5 [35,36], where under −0.5 drought is indicated. The classification of droughts is shown in Table 1.

3.3. Correlation Analysis

Correlation analysis can be used to indicate the degree of correlation between two serial variables. Since drought propagation does not satisfy nonlinear propagation, the Spearman correlation coefficient, as a nonparametric rank correlation measure that satisfies the correlation measure between nonlinear sequences, has been widely used in drought propagation calculations [37,38]. The Spearman rank order is calculated as follows:
R = 1 6 i = 1 n y i x i 2 n n 2 1
where x i   ,   y i   denotes the time series of the two types of drought indices, x i   represents TWSA-DSI and y i denotes SPEI for the 1–24 months series, and n denotes different time scales of the SPEI index, n = 1 24 .

3.4. Geodetector Model

The geodetector model, proposed by the Chinese Institute of Geographic Sciences and Resources, is a spatial analytical model for detecting dissimilarities and drivers, which is used in factor-driver analysis. Geodetector contains factor detectors, ecological detectors, interaction detectors, and risk detectors. Factor detectors can detect the explanatory power of the spatial variability of a single variable, and interaction detectors can reveal the explanatory power of a two-factor independent variable on the dependent variable [39].
(1)
Factor detector
Factor detectors are calculated as follows:
Q = 1 h = 1 L N h σ h 2 N σ 2  
where Q is the ability of the factor (X) to explain the spatial heterogeneity of the variable drought propagation time (Y), with higher values of Q indicating stronger explanatory power, ranging from 0–1. Y or X can be stratified into h   different categories; N h and N are the numbers of cells in the h strata and the whole region, respectively; σ h 2 and σ 2 are the variances of Y in the h   strata and the whole region, respectively.
(2)
Interaction detector
To identify the explanatory power of the joint action of the different factors X1 and X2 on the dependent variable Y, the explanatory power of the two factors X1 and X2 is firstly calculated separately; then the Q-value is calculated for the interaction of X1 and X2; and then Q (X1) and Q (X2) are compared with Q (X1 ∩ X2).
Geoprobe models have been widely used for their ability to explore the contribution of two factors to the spatial variability of a variable; e.g., Lu et al. [40] explored the effect of multifactor interactions on the spatial equilibrium of water resources. This study quantifies the meteorological factors and geographic characteristics that may impact the spatial pattern of drought propagation, quantifies the extent to which each factor contributes to the propagation time of the spatial state using a factor detector, and reveals the interactions between factors on drought propagation using the interactive detector. The model can be made from http://www.geodetector.org.

4. Results

4.1. Static Drought Propagation Time

4.1.1. Annual Drought Propagation Times

To find the propagation time of meteorological drought to hydrological drought propagation, we calculated multiple time scales of SPEI for the YRB at different scales for the years 1971–2022. Based on earlier studies, the propagation between them has a long time, usually ranging between 6–12 months, considering region and season [4,6]. For the convenience of subsequent calculations, the SPEI and TWSA-DSI for 2003–2022 were selected for Spearman correlation calculations. It was found that the SPEI on the 11-month cumulative time scale had the largest correlation with TWSA-DSI (r = 0.63, p < 0.01), which indicated that the static propagation of the two droughts in the watershed was 11 months.
This article uses the run theory to identify different types of drought events (a drought index of less than −0.5 for three consecutive months is considered a drought event), and Figure 3 illustrates the time series of SPEI11 versus TWSA-DSI. SPEI11 showed that severe meteorological droughts were mainly concentrated between 2006–2015 and that no significant severe meteorological droughts occurred after 2015 (Figure 3a); hydrological droughts were mainly concentrated between 2002–2009 as obtained from Figure 3b, TWSA and TWSA-DSI showed an upward trend, and drought durations decreased year by year, so that the hydrological drought in the YRB showed a decreasing trend, and the degree of drought was gradually alleviated. From Figure 3, it was found that severe and long-lasting meteorological droughts were also more likely to induce severe hydrological droughts, indicating that severe upper-level droughts would be transmitted to lower-level droughts.
In addition, it was found from Figure 3b that abnormal severe and long-duration hydrological droughts occurred around 2003 and 2004, but SPEI11 showed that no meteorological drought occurred at this time; whereas SPEI11 showed that abnormal meteorological droughts occurred around 2014, but TWSA-DSI showed that no dramatic hydrological droughts occurred. This anomaly may be due to the different accumulation of droughts at different cumulative times of the SPEI, and therefore there was a desynchronization in the interpretation of the severity of the respective droughts by SPEI11 and TWSA-DSI. Moreover, Han et al. [41] concluded that precipitation does not influence hydrological drought only, which seems to explain this anomaly.

4.1.2. Seasonal Drought Propagation Times

Drought propagation not only exists on an annual scale but is also distinctly seasonal, making it necessary to conduct studies on smaller seasonal scales [41]. We analyzed the Spearman correlation between TWSA-DSI and SPEI on a 24-month time scale, and the correlation is shown in Figure 4. The SPEI cumulative scale with the largest monthly correlation is the corresponding propagation time, which is found to have a very strong seasonal cumulative effect in the basin. Table 2 shows the seasonal spreading time of the watershed, and in general, spread times were more rapid in the summer and fall than in the remaining two seasons, a result similar to the previous conclusions for other basins (e.g., [5,42]). Fall took the shortest amount of time with an average of 5 months and had the highest correlation of 0.89, while spring took the longest amount of time with an average of 8.7 months, and all passed the 99% confidence level. It can be assumed that precipitation increases rapidly in the summer, and as the TWSA contains the entire vertical portion of the aquifer, it takes some time for the precipitation to infiltrate into the soil layer and ultimately recharge the deeper groundwater; thus the correlation between TWSA-DSI and SPEI shows high values in summer and fall, while the opposite is true in winter and spring (Figure 4) [5].
Additionally, Figure 4 reflects that TWSA-DSI in months 6 and 9–11 have the most drastic correlation with SPEI at different time scales, which suggests that severe drought events are more inclined to occur within these two time periods (summer and fall). Drought in the basin will immediately become apparent if there is insufficient precipitation in the summer and fall, and the propagation of drought will result in drought occurring more often in the fall. Therefore, when drought occurs in the summer and fall due to insufficient precipitation, this often leads to the onset of more severe next-level droughts, which require adequate attention from drought preparedness authorities.

4.2. Drought Dynamic Propagation Time

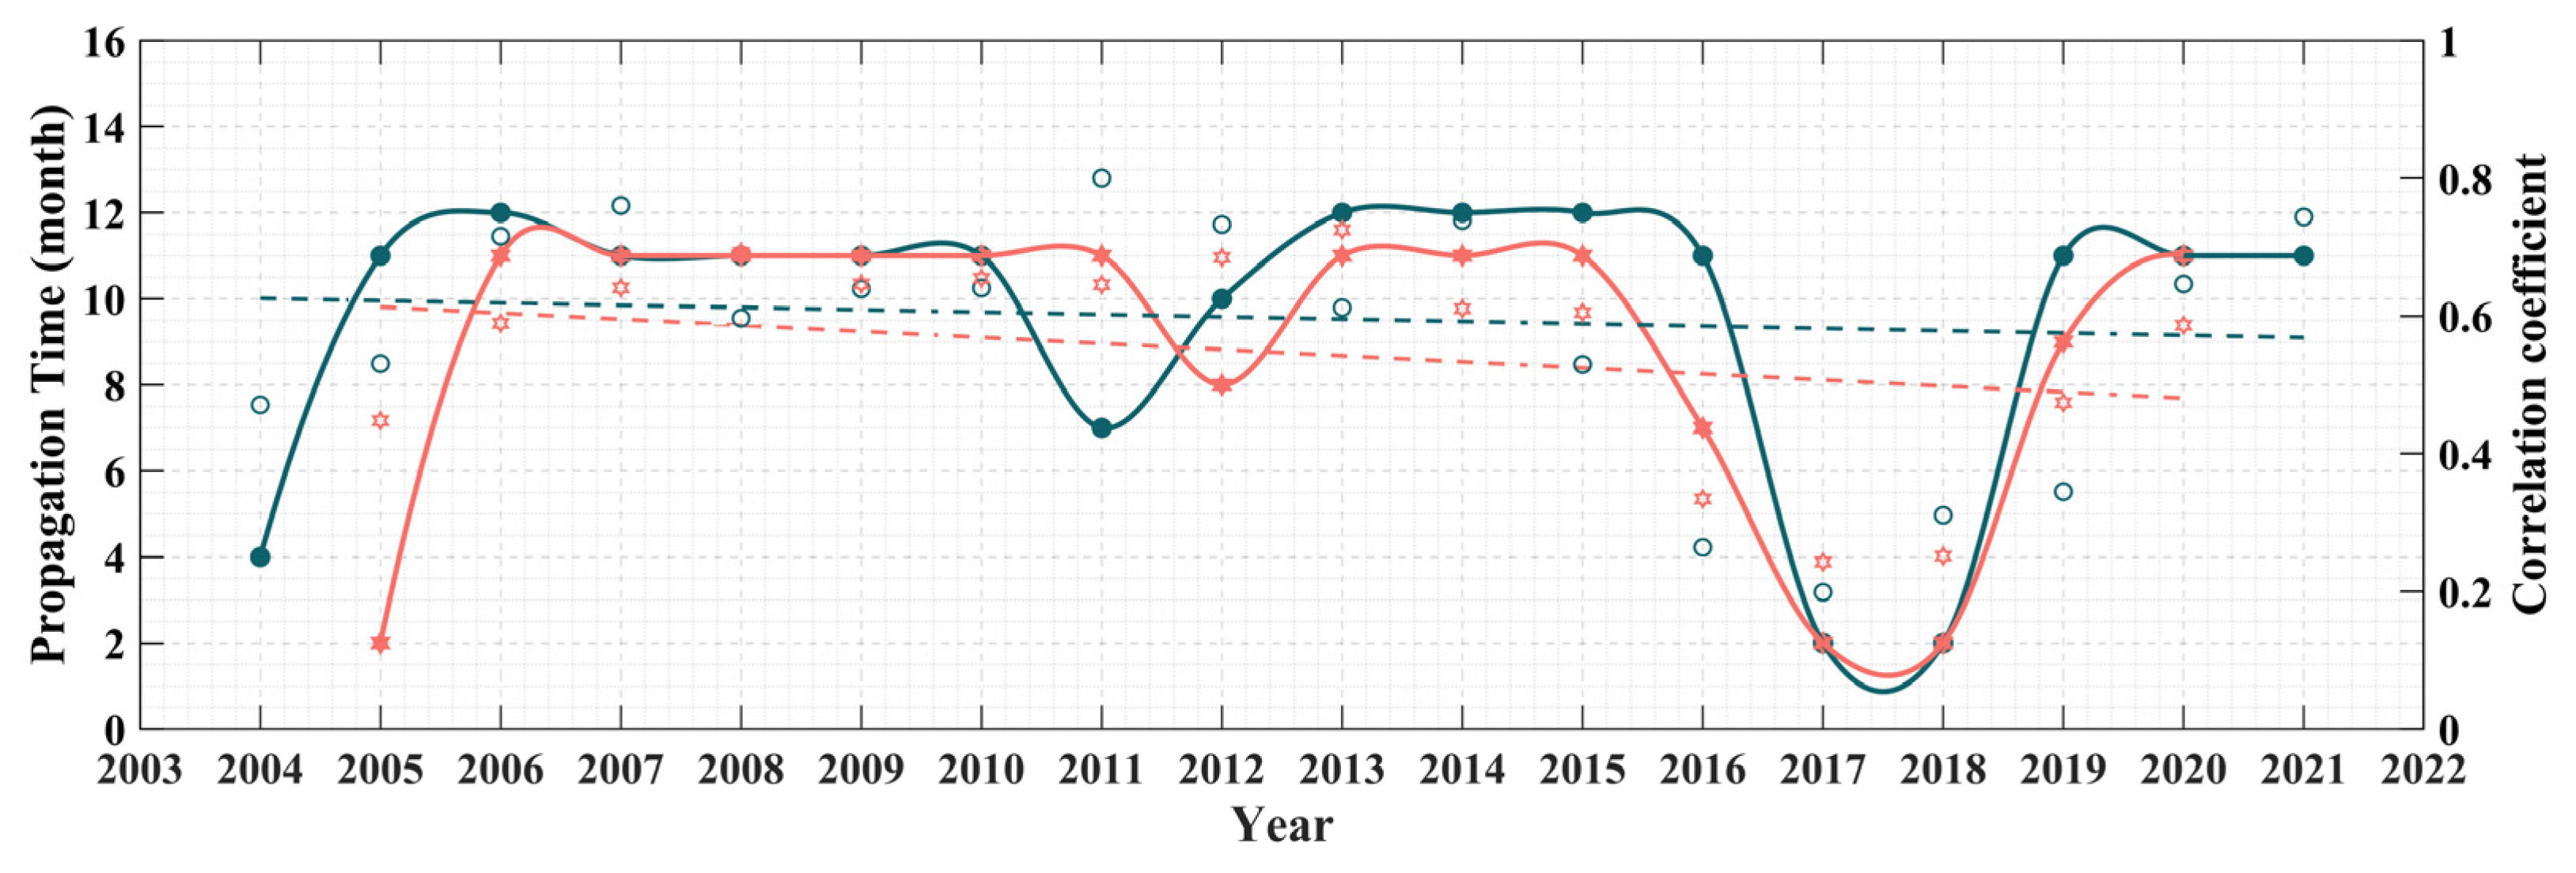
4.2.1. Annual Dynamic Propagation Time

As the Earth’s water cycle intensifies and the hydrological environment is exposed to a dynamic context, the timing of drought propagation may also change [41]. For further analysis of the propagation time of drought under changing environments, we slid the time scales of the TWSA-DSI and the SPEI to 3 years and 5 years (to ensure that the data are mathematically statistical), respectively; carried out a correlation analysis by using Spearman; and the results are shown in Figure 5. The 3-year dynamic spreads ranged from 2–12 years with correlation coefficients clustered between 0.2 and 0.8, the 5-year dynamic spreads ranged from 2–12 years with correlation coefficients between 0.24 and 0.73, and the 3- and 5-year dynamic scales passed the test of significance except for the 17th and 18th subsequence, which failed the p < 0.01 test. From 2006–2015, both the 3-year sliding window and the 5-year sliding window showed that drought propagation time was concentrated in the 7–12 month period; that, except for a slight fluctuation in propagation time in 2010–2012, drought propagation time remained stable over a long period on an 11-month timescale; and that there was a significant variability in propagation time in 2004–2005 and 2016–2018, with the fastest propagation time shown to be 2 months in these two time periods. In addition, both the 3-year and 5-year sliding windows indicated that the propagation time tended to decrease and that the drought propagation time was accelerating, but this trend did not pass the MK test. However, they also suggest that anomalies are occurring in the timing of drought propagation, making it necessary to study its dynamics, as well as suggesting that the time left for drought detection and drought preparedness is decreasing.

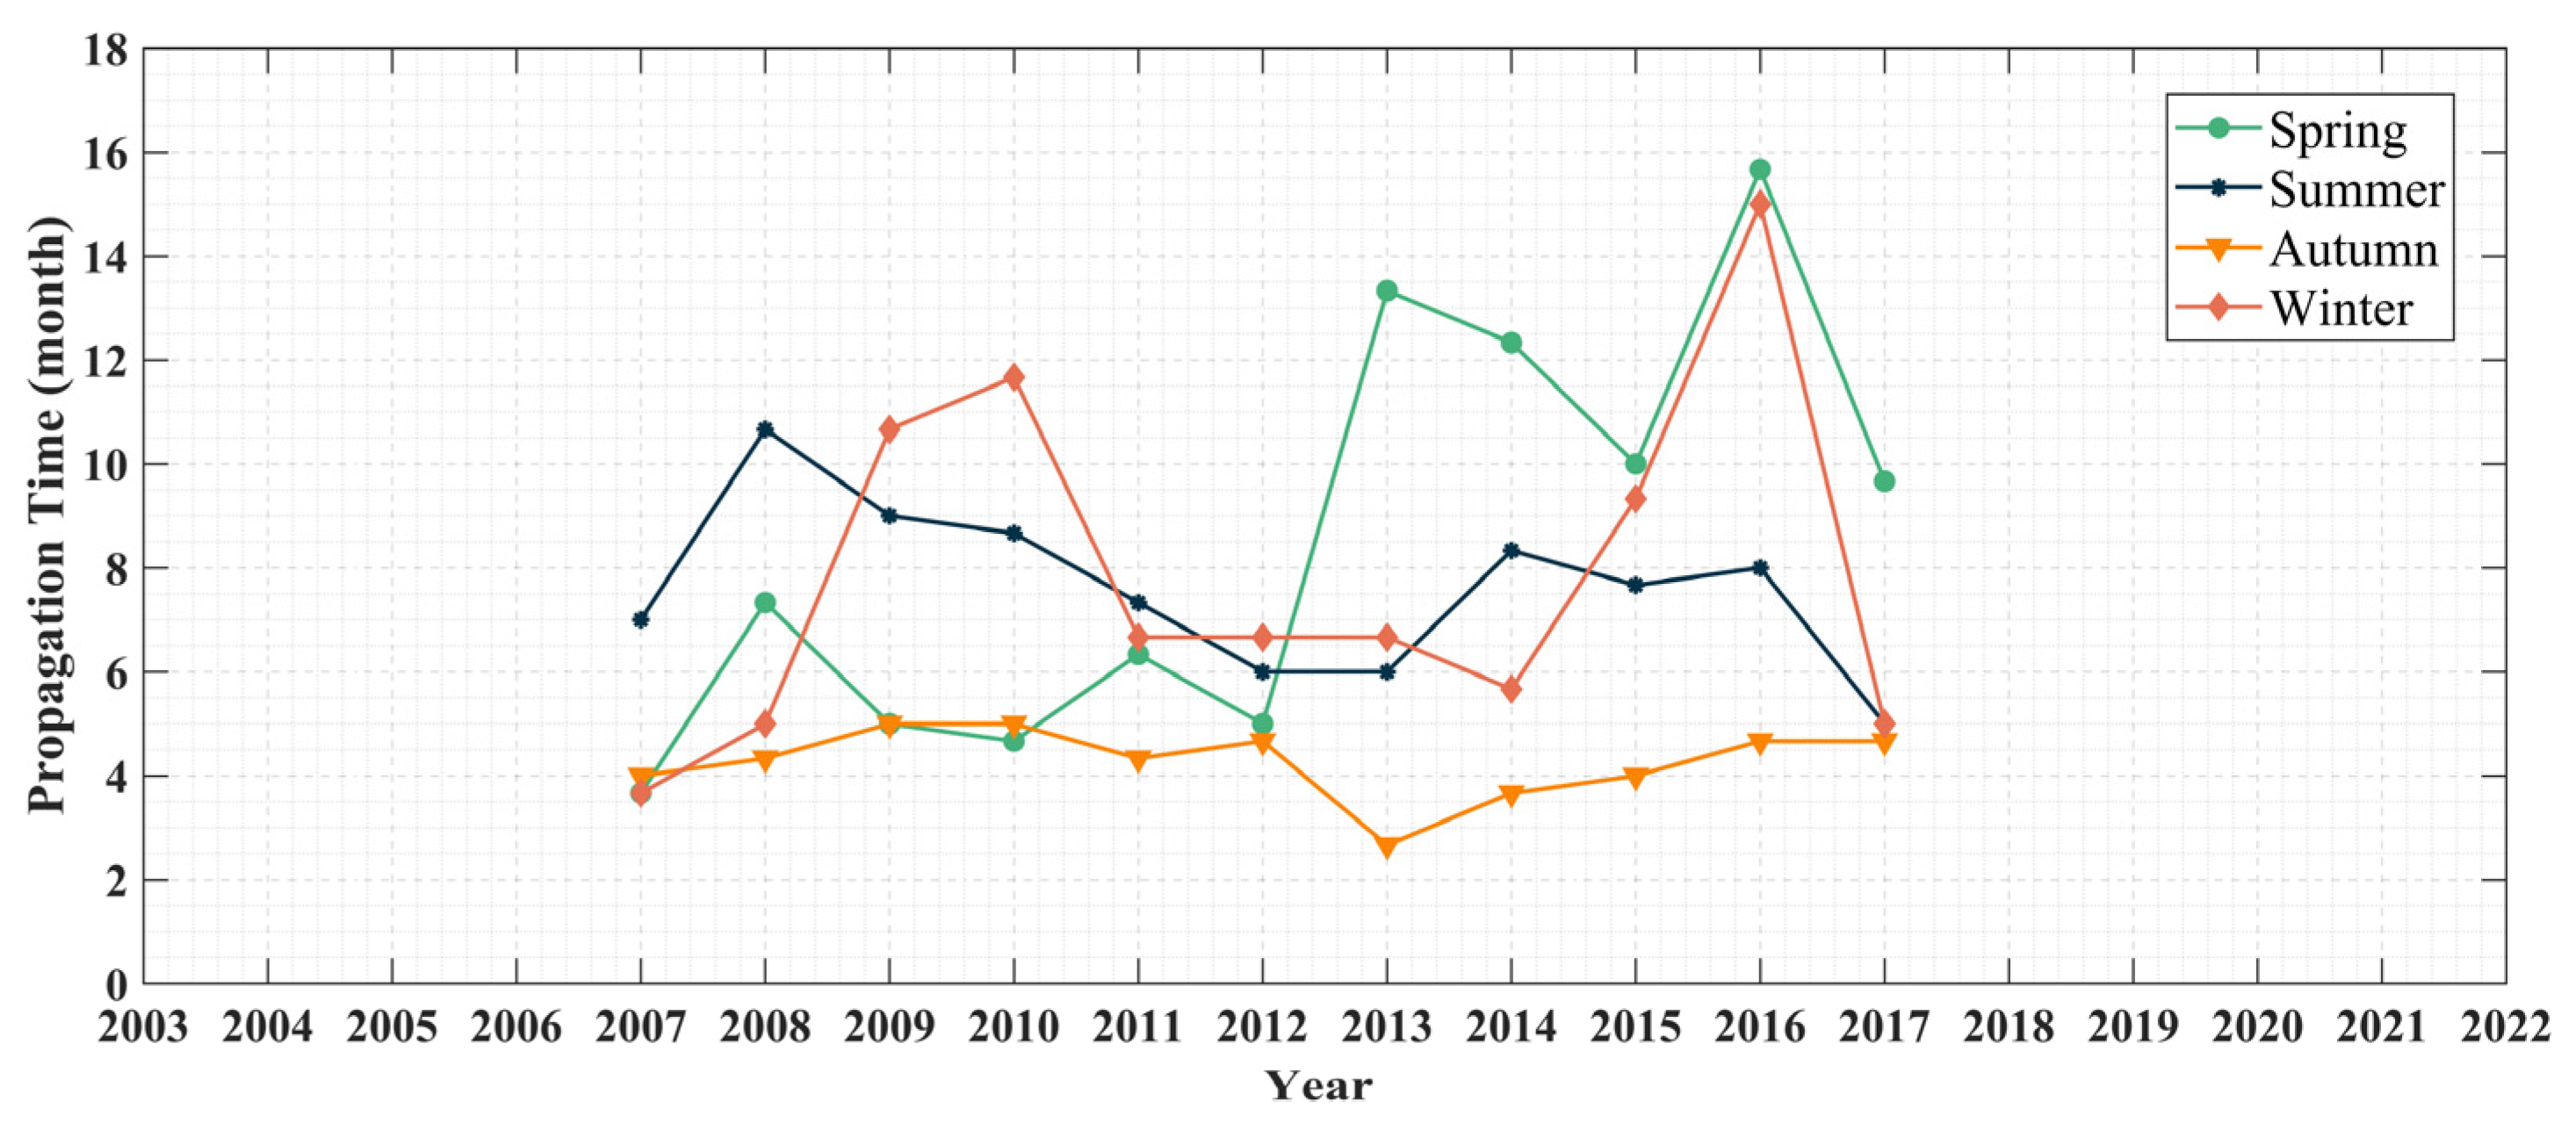
4.2.2. Seasonal Dynamic Propagation

Since the time of this study is 2003–2022, which is a short time series, and the sample of sliding windows should not be too small in seasonal propagation, we chose a sliding window of 10 years to obtain the propagation time of 11 subseries. The same dynamic propagation method was used to compute the seasonal propagation time based on a 10-year sliding window, and the outputs are presented in Figure 6. For the dynamic propagation, the results were subjected to the MK test as presented in Table 3. From Figure 6, it can be concluded that the seasonal propagation time of drought was also dynamic under changing environments. In this case, spring propagation time had been maintained for around 5 months propagation time until the 7th subsequence but suddenly rose to 14 months in the 7th subsequence (2009–2019), and since then it has been fluctuating between 10–16 months, with an upward trend in the spring propagation time passing the 95% confidence test that the drought propagation time is becoming slower, which is the opposite trend to the conclusion that propagation times are accelerating on an annual scale; summer propagation times show a fluctuating downward trend, although failing the 95% significance test, and drought propagation times appear to be getting shorter; fall propagation times remain stable and show no trend; and winter propagation times are more fluctuating, but also show no clear trend. In addition, Figure 6 also shows that the drought propagation time is more stable and has fewer outliers in summer and fall, with the summer drought propagation time ranging from 4–11 months; the fall propagation time remaining between 2–4 months; and the winter and spring propagation times fluctuating more and having more abnormal values, with the spring propagation time ranging between 3–16 months, and the winter propagation time ranging between 3–15 months, which are similar in both seasons. This is consistent with the findings of the static propagation scenario.

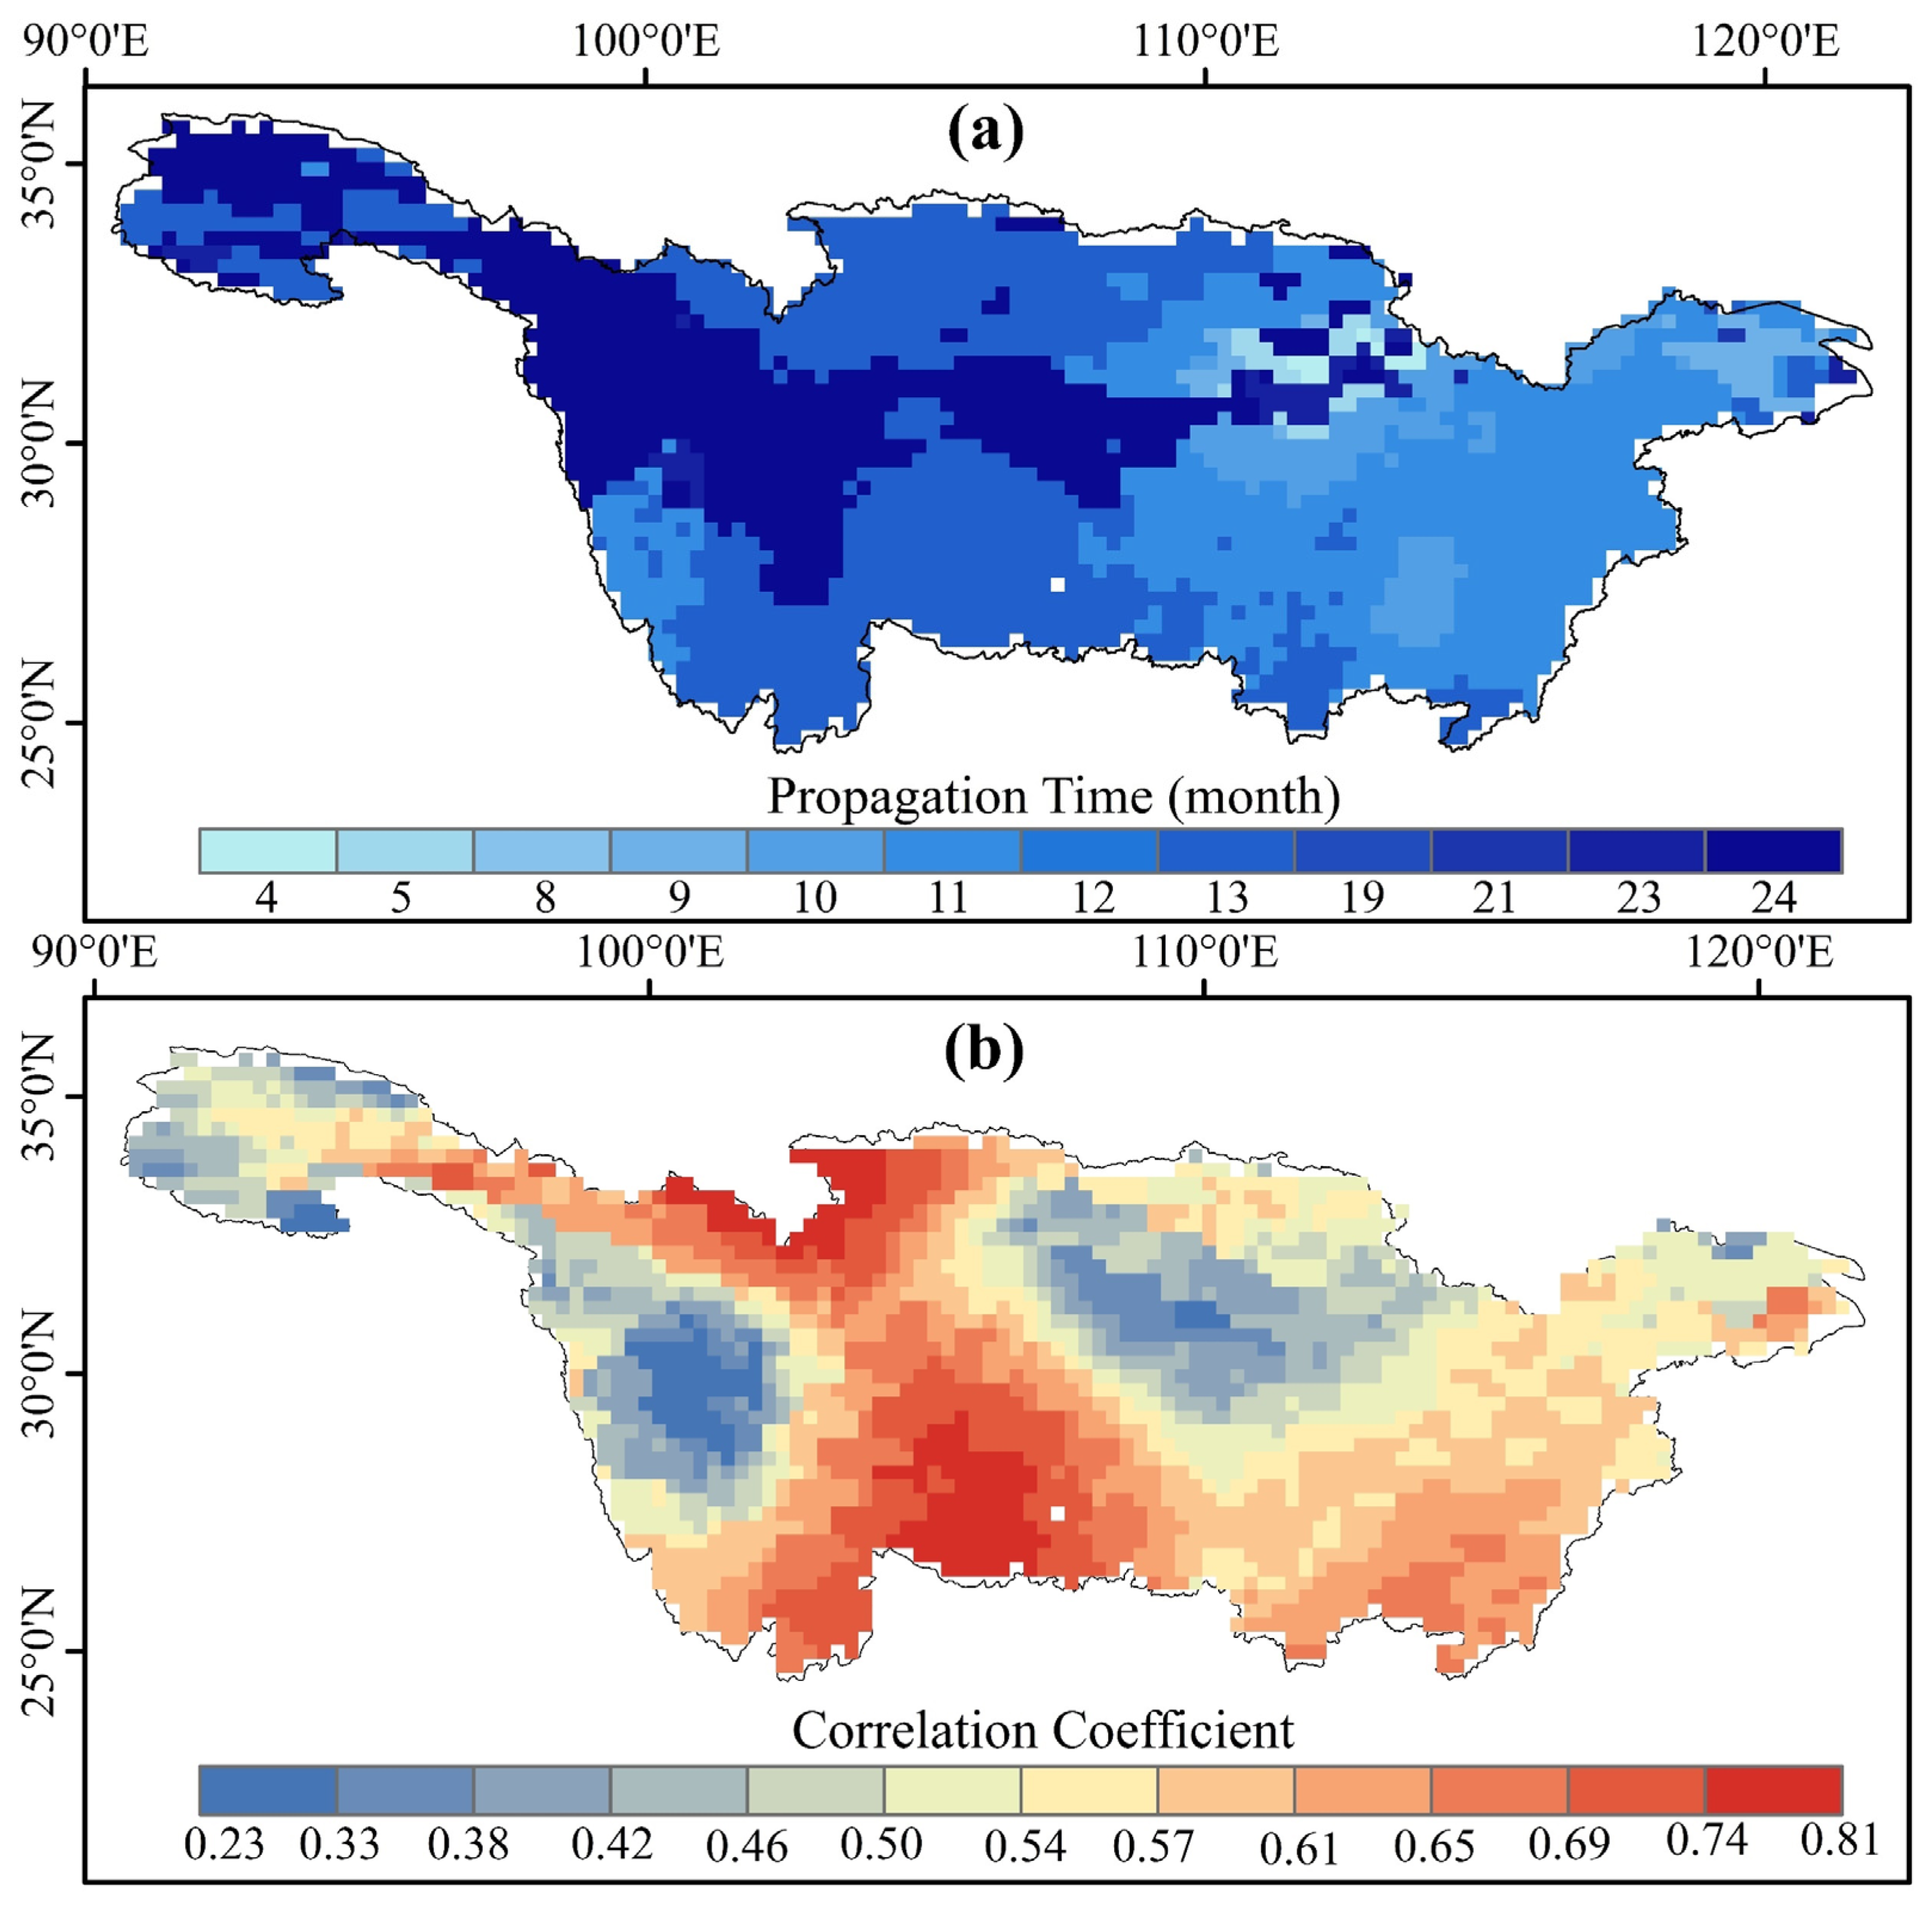
4.3. Spatial Propagation Time

Most previous studies only focused on drought propagation from the time perspective and seldom analyzed drought propagation from the spatial perspective; to fill this gap, we explored from a spatial perspective in the YRB (Figure 7). By studying the correlation between TWSA-DSI and SPEI, it was found that the spatial spreading time in the YRB mainly varied in a period between 4–24 months (Figure 7a), with large spatial heterogeneity, corresponding to correlation coefficients ranging from 0.23–0.81, and all the pixels passed the test of significance at 99% (Figure 7b). From Figure 7a, we found that the longest drought propagation time of 24 months mainly occurred in the headwaters of the YRB in the Jinsha River Basin (24–36°N, 90–105°E), the shortest of 4 months occurred in the Jianghan Basin (29°26′–31°37′N, 111°14′E–114°36′E), and the rest of the region was concentrated around 10–12 months.
It is noteworthy that the Spearman correlation coefficient for drought propagation in the YRB (Figure 7b) was found to be characterized by a lower level at two locations, namely, the Jinsha River region in the upper reaches as well as the Three Gorges area (31°03′ N, 109°57′E). Considering the higher elevation of the upper Jinsha River, which is highly correlated with groundwater storage, it can be interpreted that elevation is a key variable influencing the propagation of droughts; whereas the lower correlation coefficient in the middle reaches of the Three Gorges region may be linked to the storage of water in the dam [21]. Dey et al. [43] suggested that dam operation alters the seasonal timing and intensity of extreme events and spatial patterns, which will weaken the response of other types of drought to meteorological drought. Marchant and Bloomfield [44] found that the influence of watershed climate and watershed characteristics, in addition to the cumulative effect of precipitation, is critical to the timing of propagation.

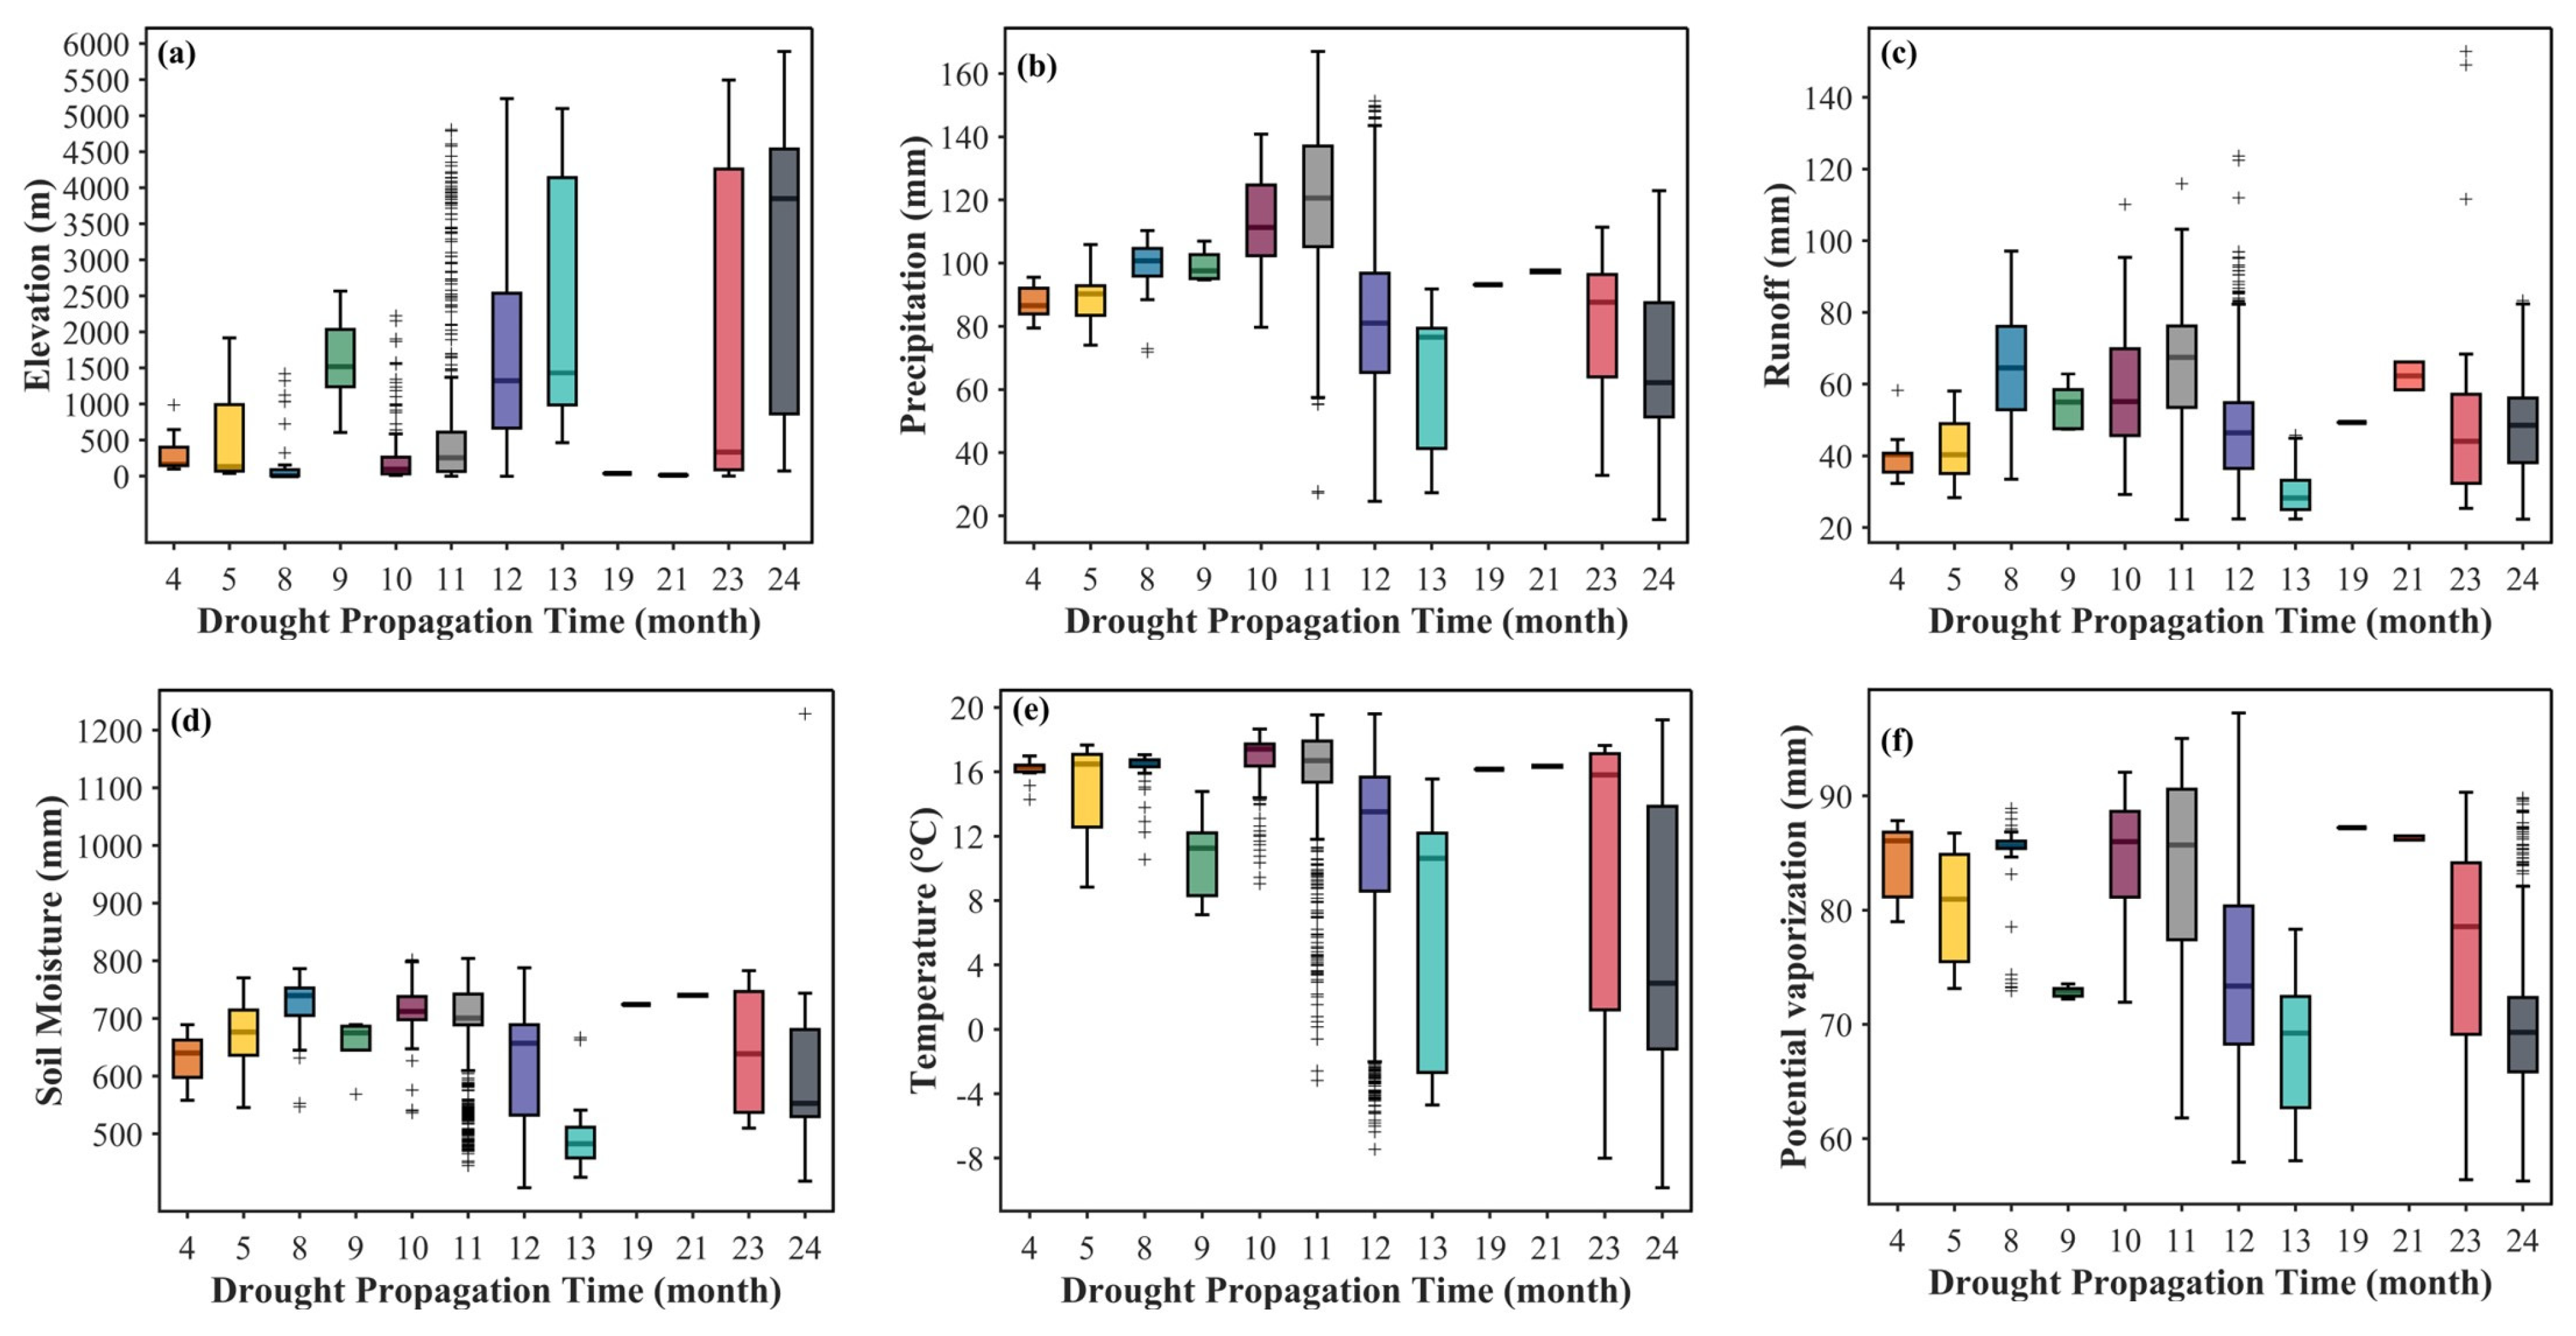
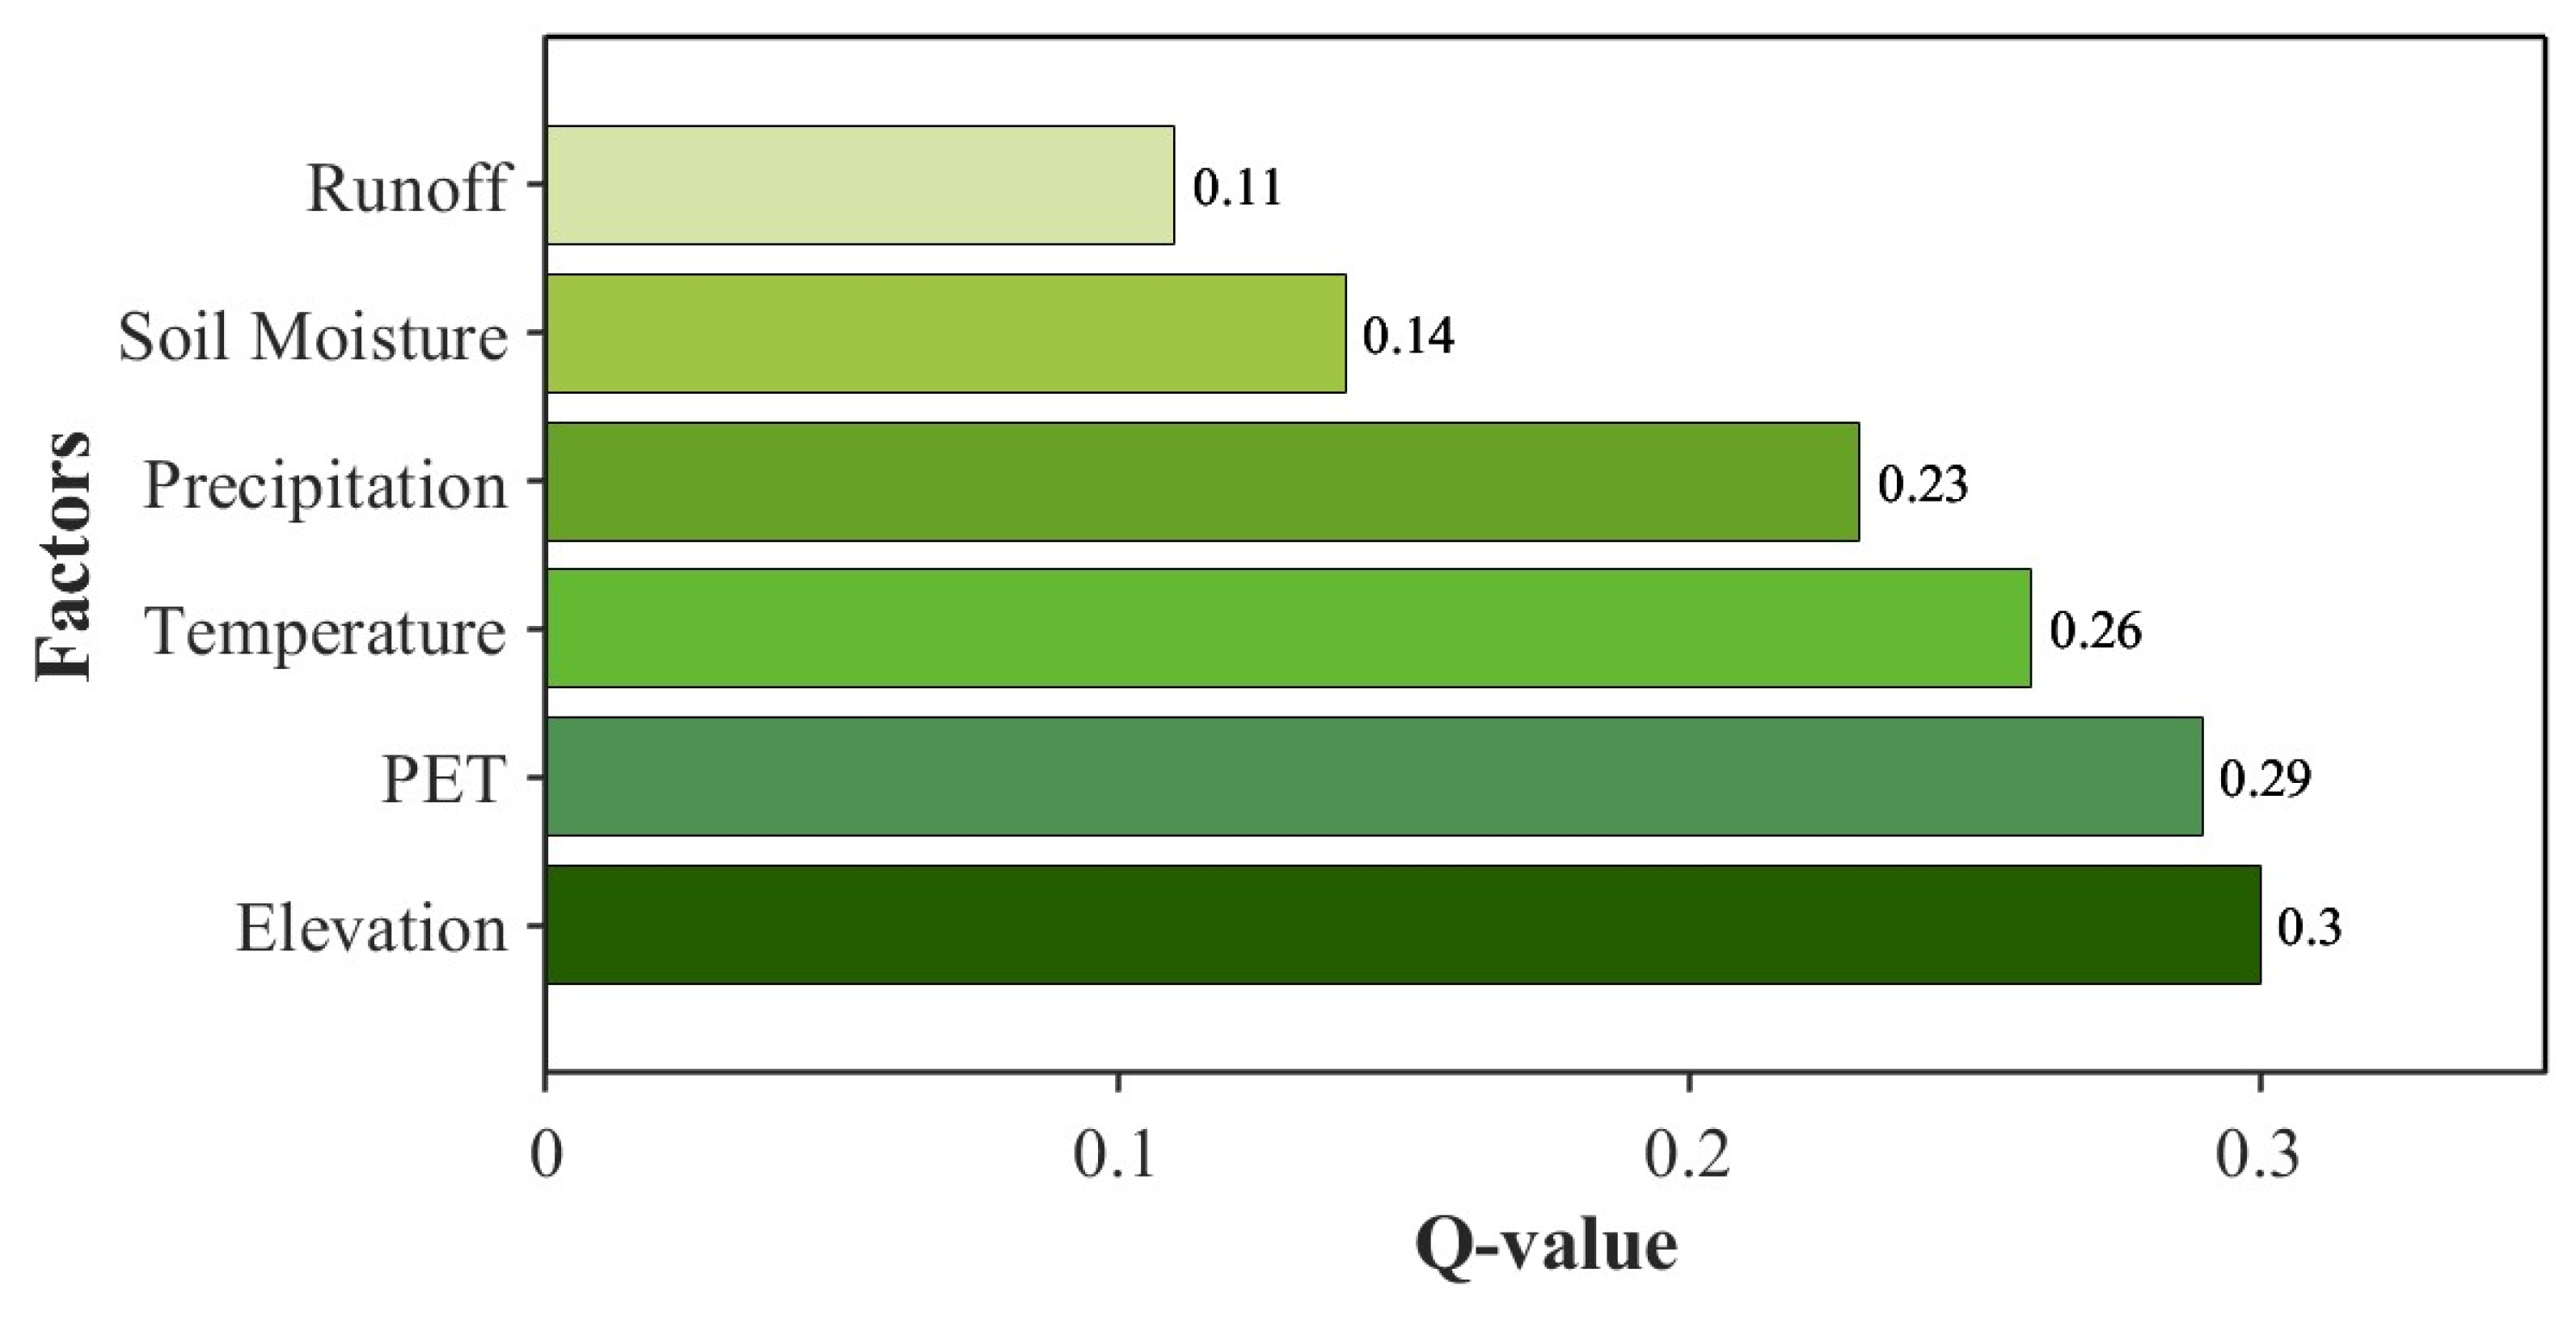
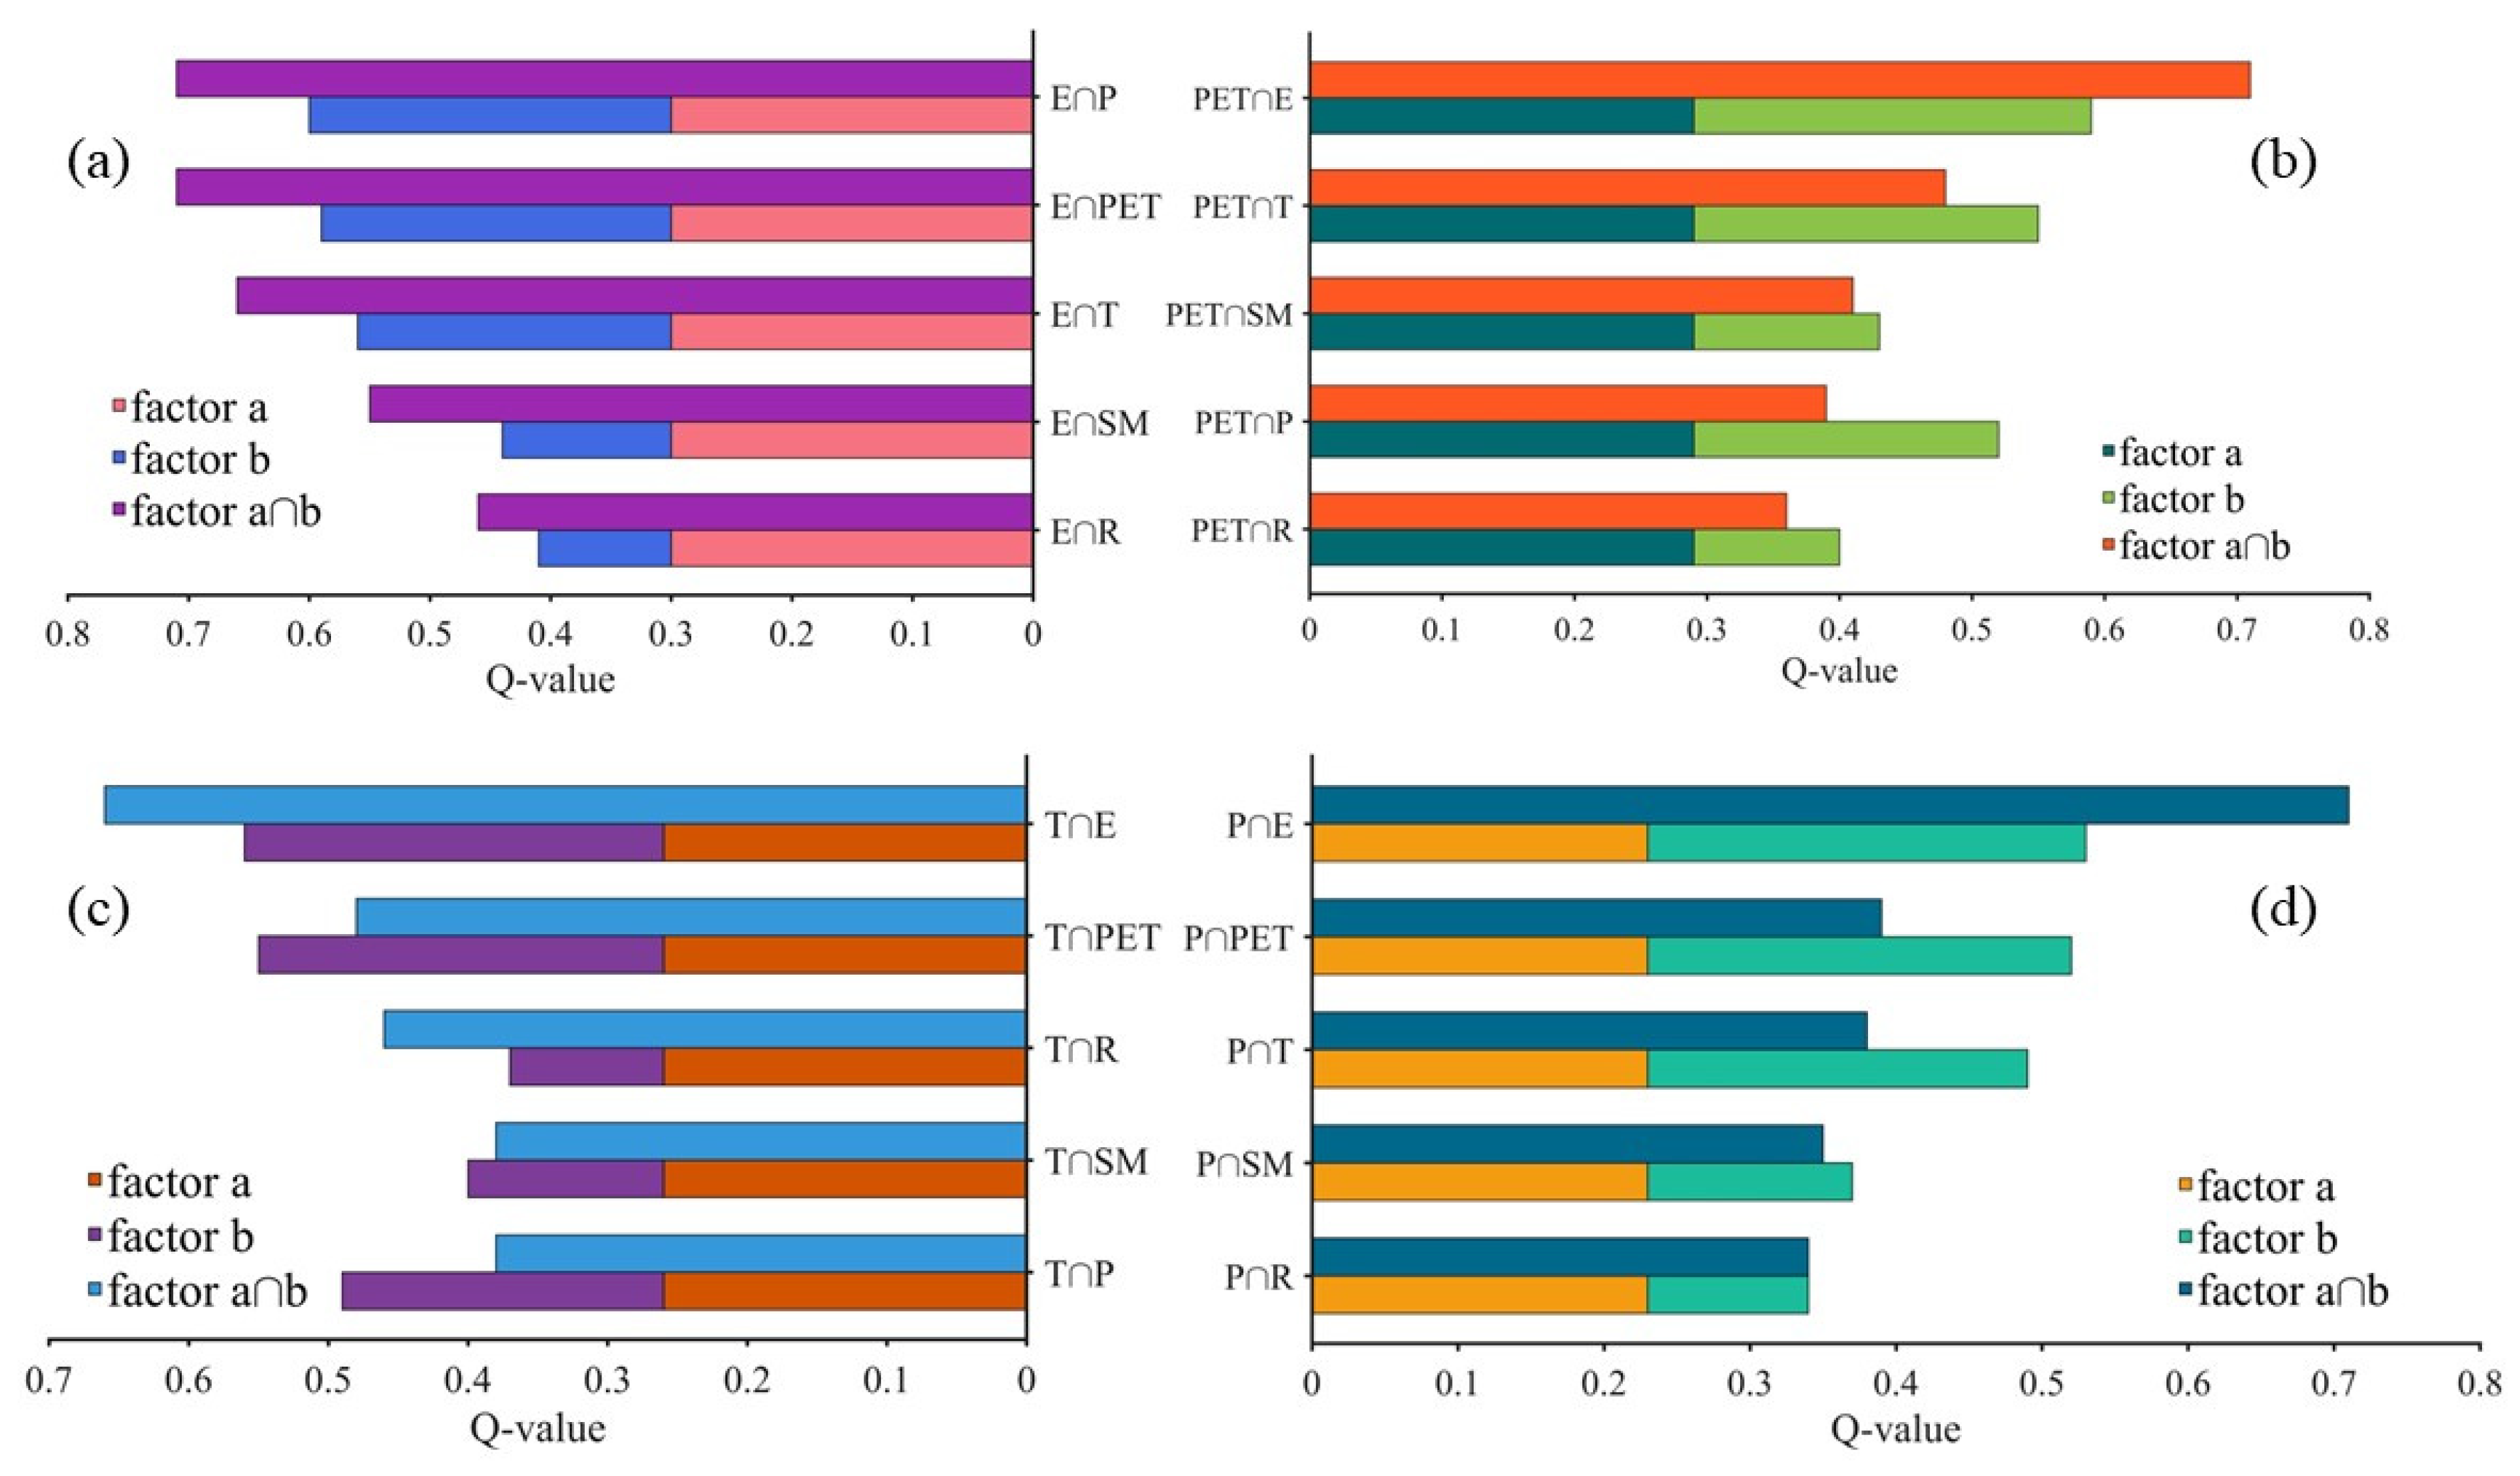
4.4. Influence of Climatic and Geographic Characteristics on the Spatial Propagation of Drought

To investigate the impacts of spatial drought propagation, this study explored the relationship between spatial geographic characteristics (elevation and soil moisture content) and meteorological factors (precipitation, runoff, temperature, and potential evapotranspiration), and the results are shown in Figure 8. Concerning elevation, the higher the elevation, the longer the drought spread (Figure 8a), and because of the direct correlation with land use status, Yang et al. [45] found that elevation plays a key role in drought propagation. Soil moisture content had a very small effect on drought propagation time (Figure 8d). In terms of meteorological factors, higher precipitation (Figure 8b), temperature (Figure 8e), and potential evapotranspiration (Figure 8f) showed an inverse relationship with drought propagation time, while runoff did not have such a relationship, with a very small effect of runoff. Due to the strong spatial heterogeneity of the YRB, the effects of the factors need to be further analyzed.
To find out the important factors, we further analyzed the above factors based on geodetector, and the results based on single factor detection are shown in Figure 9, which shows that the influence of elevation scored the highest among the six factors and was the most important influencing factor. However, as a whole the score of single factors was not high, and the effect of each factor was not isolated but interacted with each other; further we analyzed the results based on the effect of interacting factors as shown in Figure 10. It was found that the contributions between elevation and other factors were all above 0.45, which were larger than the contributions of the remaining factor interactions, further indicating that elevation is the strongest factor influencing the spatial pattern of drought propagation in the YRB. In addition, the interactions of elevation and evapotranspiration, elevation and precipitation, and elevation and temperature were 0.71, 0.71, and 0.66, respectively (Figure 10a), which were much larger than the sum of the single drivers (e.g., E + PET = 0.59), and the effect of the interactive influences was stronger than that of the single factors.
The interaction test, on the other hand, contributed a greater effect compared to the results of the single-factor test. Moreover, when the contribution of a single factor was low (soil water content and runoff), the interaction of that factor with other factors also scored lower, which is not represented in Figure 10 because the interaction between soil water content and runoff was 0.30. When the contribution of a single factor was high, the interaction of that factor with other factors also had a high contribution (e.g., elevation). Therefore, it is important to consider the interaction between factors.

5. Discussion

5.1. Impact of Climatic and Geographic Characteristics on the Spread of Drought

It was observed that drought propagation time was longer in alpine zones than in hot and humid regions. In Section 4.4, we analyzed the contribution of climatic and geographic characteristics on spatial drought propagation in the YRB, although the use of a geodetector model detected generally low scores on the single factors, which may be owed to the high spatial heterogeneity of the YRB [46]. The results show that potential evapotranspiration and elevation were the most critical variables in the two characteristics, respectively, but studies by previous scholars have shown that temperature and precipitation variables also play a crucial role [47,48]. In terms of climatic characteristics, on the one hand, precipitation is the source of water in the basin, and its reduction leads to a decrease in the amount of water stored in the basin, which results in a shorter drought response time in regions with less precipitation [49]; on the other hand, water vapor feedbacks are stronger in regions with higher potential evapotranspiration and temperatures, and drought propagation responds with shorter response times [50,51]. From a geographical characterization, elevation is a crucial determinant of drought propagation due to its direct correlation with snow power and groundwater [45,47]. This is similar to the conclusion of Muthuvel and Sivakumar [52] in their investigation of drought propagation in peninsular India where they found that elevation plays a crucial role in drought propagation. Additionally, Luo et al. [47] and Mao et al. [53] also found that elevation has a non-negligible role in drought propagation. Drought propagation time was relatively long at high elevations, while interactions between elevation and potential evapotranspiration, precipitation, and temperature were found to have a large contribution using interactive factor analysis. Overall, drought propagation in the YRB is strongly dependent on climatic and geographic characteristics, so it is essential to consider the interaction between factors.
Against the backdrop of global warming, the frequency of climate extremes in the YRB has risen markedly [54]. According to the conclusion of [55], the urban drought area has displayed a significant growth trend since 1981 in the region. Along with the increased risk of heat waves accompanied by an enhanced hydrological cycle, leading to changes in precipitation, temperature and potential evapotranspiration, etc. that further exacerbate the occurrence of extreme climate events [5], this will lead to a rapid spread of drought propagation, exacerbating the rate at which it spreads, as found in this study in Section 4.2.1 (Figure 3). According to Guan et al. [56], the temperature changes in the YRB are anomalously associated with climate warming, with the temperature index showing a significant rate of warming. Due to the anomalous changes in the atmospheric circulation pattern, the strength and incidence of extreme precipitation in the YRB have risen dramatically, with a more severe degree in the central and downstream areas [54]. Since the 21st century, PET in China has been growing by 3.4 mm per year, with a broadly significant increasing trend [57], and the Yarlung Tsangpo River area is expected to have a significant increase in high values of PET in the future [58]. All of these climatic factors can lead to rapid drought development and propagation [50], and in general, climate warming and humidification will further exacerbate the rate of drought propagation.

5.2. Limitation and Prospect

Previous studies have shown that there is a link between human activities and drought propagation [59,60]. Analyzing land-use types, grassland and cropland have longer drought propagation times; areas with higher forest cover have shorter propagation times, which may be due to high transpiration and reduced soil moisture due to forests [47], while grassland and cropland lead to reduced runoff, which slows down the drought propagation time [22]. Anthropogenically induced rapid urbanization, water abstraction, and reservoir construction activities also contribute significantly to drought propagation. Anthropogenic water abstraction leads to severe surface water loss, which prolongs the drought response time [22]. Urbanization contributes about 46.6% to meteorological drought anomalies in the YRB, and drought conditions are more pronounced in more urbanized areas [55], which will lead to a rapid response to drought and exacerbate the rate of drought propagation. Reservoir operation also alters the drought response time [61], and by altering runoff patterns [62] the Three Gorges Dam replenishes dry season water scarcity conditions thereby weakening the drought propagation processes [21]. However, this paper does not consider the impact of anthropogenic factors due to the short temporal coverage of data utilized in the present study and the difficulty in obtaining reservoir data; therefore, different datasets need to be considered to take a more holistic view of drought propagation influences in the future.

6. Conclusions

Based on GRACE satellite data, this paper investigates the drought propagation mechanism from the atmosphere (SPEI) to the hydrology (TWSA-DSI) in the YRB. The static propagation time from 2003 to 2022 was 11 months, and the seasonal spread times indicated that drought spread over a shorter time in summer and fall, with the shortest time in fall (on average 5 months) and the longest time in spring (on average 8.7 months). Sliding tests revealed a tendency towards shorter propagation on annual scales and significantly longer in spring on seasonal time scales. The detection of spatial drought propagation time revealed significant spatial heterogeneity in drought propagation, ranging from 4–24 months, with most areas concentrated between 11 and 12 months, and all pixels passed the 99% significance test.
The effects of climate and geography on drought were analyzed using geodetector. This study found that elevation and potential evapotranspiration played key roles in the spread of drought at the basin scale. When considering spatial propagation, the influence of a single variable should not be taken into account alone; multifactor interactions have a more important role, and therefore it is necessary to consider multifactor interactions in future research. These findings contribute to the comprehension of the static and dynamic properties of drought propagation as well as the influencing factors, which can be valuable for drought mitigation work.

Author Contributions

C.Z.: writing—review and editing, data curation. Z.H.: methodology, conceptualization. S.W.: software. J.W.: visualization. C.C.: methodology, conceptualization, supervision. J.L.: writing—review and editing. All authors have read and agreed to the published version of the manuscript.

Funding

This research was funded by Shaanxi Provincial Science and Technology Department grant number [2024QCY-KXJ-093].

Data Availability Statement

The GRACE satellite data can be obtained from https://www2.csr.utexas.edu/grace/RL06_mascons.html (accessed on 19 September 2023). The GLDAS satellite data can be downloaded from https://disc.gsfc.nasa.gov/information?page=1&project=GRACE-DA-DM,FLDAS,GLDAS,NEWS,NLDAS,NCA-LDAS&keywords=hydrology (accessed on 25 September 2023). Monthly precipitation and potential evapotranspiration data from CRU data can be downloaded from https://crudata.uea.ac.uk/cru/data/hrg/cru_ts_4.05/cruts.2103051243.v4.05 (accessed on 6 October 2023). The soil type data are from the International Organization for Food and Agriculture (IOFA) (https://www.fao.org/soils-portal (accessed on 6 August 2024)).

Conflicts of Interest

Author Junrong Liu was employed by the company China Coal Aerial Survey and Remote Sensing Group Co. The remaining authors declare that this research was conducted in the absence of any commercial or financial relationships that could be construed as potential conflicts of interest.

References

  1. Mishra, A.K.; Singh, V.P. A review of drought concepts. J. Hydrol. 2010, 391, 202–216. [Google Scholar] [CrossRef]
  2. Guo, Y.; Huang, S.; Huang, Q.; Wang, H.; Wang, L.; Fang, W. Copulas-based bivariate socioeconomic drought dynamic risk assessment in a changing environment. J. Hydrol. 2019, 575, 1052–1064. [Google Scholar] [CrossRef]
  3. Van Loon, A.F.; Van Lanen, H.A.J. A process-based typology of hydrological drought. Hydrol. Earth Syst. Sci. 2012, 16, 1915–1946. [Google Scholar] [CrossRef]
  4. Huang, S.; Li, P.; Huang, Q.; Leng, G.; Hou, B.; Ma, L. The propagation from meteorological to hydrological drought and its potential influence factors. J. Hydrol. 2017, 547, 184–195. [Google Scholar] [CrossRef]
  5. Han, Z.; Huang, S.; Huang, Q.; Leng, G.; Wang, H.; Bai, Q.; Zhao, J.; Ma, L.; Wang, L.; Du, M. Propagation dynamics from meteorological to groundwater drought and their possible influence factors. J. Hydrol. 2019, 578, 124102. [Google Scholar] [CrossRef]
  6. Zhang, X.; Hao, Z.; Singh, V.P.; Zhang, Y.; Feng, S.; Xu, Y.; Hao, F. Drought propagation under global warming: Characteristics, approaches, processes, and controlling factors. Sci. Total Environ. 2022, 838, 156021. [Google Scholar] [CrossRef] [PubMed]
  7. Kim, W.; Iizumi, T.; Nishimori, M. Global Patterns of Crop Production Losses Associated with Droughts from 1983 to 2009. J. Appl. Meteorol. Climatol. 2019, 58, 1233–1244. [Google Scholar] [CrossRef]
  8. Van Loon, A.F. Hydrological drought explained. Wiley Interdiscip. Rev.-Water 2015, 2, 359–392. [Google Scholar] [CrossRef]
  9. Wang, Z.; Chang, J.; Wang, Y.; Yang, Y.; Guo, Y.; Yang, G.; He, B. Temporal and spatial propagation characteristics of meteorological drought to hydrological drought and influencing factors. Atmos. Res. 2024, 299, 107212. [Google Scholar] [CrossRef]
  10. Han, Z.; Huang, S.; Zhao, J.; Leng, G.; Huang, Q.; Zhang, H.; Li, Z. Long-chain propagation pathways from meteorological to hydrological, agricultural and groundwater drought and their dynamics in China. J. Hydrol. 2023, 625, 130131. [Google Scholar] [CrossRef]
  11. Vicente-Serrano, S.M.; Begueria, S.; Lopez-Moreno, J.I. A Multiscalar Drought Index Sensitive to Global Warming: The Standardized Precipitation Evapotranspiration Index. J. Clim. 2010, 23, 1696–1718. [Google Scholar] [CrossRef]
  12. Li, L.; She, D.; Zheng, H.; Lin, P.; Yang, Z.-L. Elucidating Diverse Drought Characteristics from Two Meteorological Drought Indices (SPI and SPEI) in China. J. Hydrometeorol. 2020, 21, 1513–1530. [Google Scholar] [CrossRef]
  13. Chao, N.; Luo, Z.; Wang, Z.; Jin, T. Retrieving Groundwater Depletion and Drought in the Tigris-Euphrates Basin Between 2003 and 2015. Groundwater 2018, 56, 770–782. [Google Scholar] [CrossRef] [PubMed]
  14. Jiang, Q.; Ferreira, V.G.; Chen, J. Monitoring groundwater changes in the Yangtze River basin using satellite and model data. Arab. J. Geosci. 2016, 9, 500. [Google Scholar] [CrossRef]
  15. Jiang, Z.; Hsu, Y.-J.; Yuan, L.; Cheng, S.; Feng, W.; Tang, M.; Yang, X. Insights into hydrological drought characteristics using GNSS-inferred large-scale terrestrial water storage deficits. Earth Planet. Sci. Lett. 2022, 578, 117294. [Google Scholar] [CrossRef]
  16. Liu, X.; Feng, X.; Ciais, P.; Fu, B.; Hu, B.; Sun, Z. GRACE satellite-based drought index indicating increased impact of drought over major basins in China during 2002–2017. Agric. For. Meteorol. 2020, 291, 108057. [Google Scholar] [CrossRef]
  17. Zhao, M.; Geruo, A.; Velicogna, I.; Kimball, J.S. Satellite Observations of Regional Drought Severity in the Continental United States Using GRACE-Based Terrestrial Water Storage Changes. J. Clim. 2017, 30, 6297–6308. [Google Scholar] [CrossRef]
  18. Van Loon, A.F.; Laaha, G. Hydrological drought severity explained by climate and catchment characteristics. J. Hydrol. 2015, 526, 3–14. [Google Scholar] [CrossRef]
  19. Konapala, G.; Mishra, A. Quantifying Climate and Catchment Control on Hydrological Drought in the Continental United States. Water Resour. Res. 2020, 56, e2018WR024620. [Google Scholar] [CrossRef]
  20. Wu, J.; Chen, X.; Yao, H.; Zhang, D. Multi-timescale assessment of propagation thresholds from meteorological to hydrological drought. Sci. Total Environ. 2021, 765, 144232. [Google Scholar] [CrossRef]
  21. Liu, X.; Peng, J.; Liu, Y.; Yu, S.; Wang, Y. The Three Gorges Dam has weakened the drought propagation process in the Yangtze River Basin. J. Hydrol. 2024, 632, 130875. [Google Scholar] [CrossRef]
  22. Wang, M.; Jiang, S.; Ren, L.; Xu, C.-Y.; Menzel, L.; Yuan, F.; Xu, Q.; Liu, Y.; Yang, X. Separating the effects of climate change and human activities on drought propagation via a natural and human-impacted catchment comparison method. J. Hydrol. 2021, 603, 126913. [Google Scholar] [CrossRef]
  23. Zheng, S.; Zhang, Z.; Yan, H.; Zhao, Y.; Li, Z. Characterizing drought events occurred in the Yangtze River Basin from 1979 to 2017 by reconstructing water storage anomalies based on GRACE and meteorological data. Sci. Total Environ. 2023, 868, 161755. [Google Scholar] [CrossRef]
  24. Sun, Z.; Zhu, X.; Pan, Y.; Zhang, J.; Liu, X. Drought evaluation using the GRACE terrestrial water storage deficit over the Yangtze River Basin, China. Sci. Total Environ. 2018, 634, 727–738. [Google Scholar] [CrossRef]
  25. Zhai, J.Q.; Liu, B.; Hartmann, H.; Su, B.D.; Jiang, T.; Fraedrich, K. Dryness/wetness variations in ten large river basins of China during the first 50 years of the 21st century. Quat. Int. 2010, 226, 101–111. [Google Scholar] [CrossRef]
  26. Scanlon, B.R.; Zhang, Z.; Save, H.; Wiese, D.N.; Landerer, F.W.; Long, D.; Longuevergne, L.; Chen, J. Global evaluation of new GRACE mascon products for hydrologic applications. Water Resour. Res. 2016, 52, 9412–9429. [Google Scholar] [CrossRef]
  27. Lin, M.; Biswas, A.; Bennett, E.M. Socio-ecological determinants on spatio-temporal changes of groundwater in the Yellow River Basin, China. Sci. Total Environ. 2020, 731, 138725. [Google Scholar] [CrossRef] [PubMed]
  28. Rodell, M.; Houser, P.R.; Jambor, U.; Gottschalck, J.; Mitchell, K.; Meng, C.J.; Arsenault, K.; Cosgrove, B.; Radakovich, J.; Bosilovich, M.; et al. The global land data assimilation system. Bull. Am. Meteorol. Soc. 2004, 85, 381–394. [Google Scholar] [CrossRef]
  29. Elagib, N.A.; Ali, M.M.A.; Schneider, K. Evaluation and bias correction of CRU TS4.05 potential evapotranspiration across vast environments with limited data. Atmos. Res. 2024, 299, 107194. [Google Scholar] [CrossRef]
  30. Yang, J.; Huang, X. The 30&thinsp;m annual land cover dataset and its dynamics in China from 1990 to 2019. Earth Syst. Sci. Data 2021, 13, 3907–3925. [Google Scholar] [CrossRef]
  31. Su, B.; Huang, J.; Mondal, S.K.; Zhai, J.; Wang, Y.; Wen, S.; Gao, M.; Lv, Y.; Jiang, S.; Jiang, T.; et al. Insight from CMIP6 SSP-RCP scenarios for future drought characteristics in China. Atmos. Res. 2021, 250, 105375. [Google Scholar] [CrossRef]
  32. Wang, Q.; Zeng, J.; Qi, J.; Zhang, X.; Zeng, Y.; Shui, W.; Xu, Z.; Zhang, R.; Wu, X.; Cong, J. A multi-scale daily SPEI dataset for drought characterization at observation stations over mainland China from 1961 to 2018. Earth Syst. Sci. Data 2021, 13, 331–341. [Google Scholar] [CrossRef]
  33. Xu, K.; Yang, D.; Yang, H.; Li, Z.; Qin, Y.; Shen, Y. Spatio-temporal variation of drought in China during 1961–2012: A climatic perspective. J. Hydrol. 2015, 526, 253–264. [Google Scholar] [CrossRef]
  34. Zhu, E.; Wang, Y.; Yuan, X. Changes of terrestrial water storage during 1981–2020 over China based on dynamic-machine learning model. J. Hydrol. 2023, 621, 129576. [Google Scholar] [CrossRef]
  35. Zhao, M.; Geruo, A.; Velicogna, I.; Kimball, J.S. A Global Gridded Dataset of GRACE Drought Severity Index for 2002-14: Comparison with PDSI and SPEI and a Case Study of the Australia Millennium Drought. J. Hydrometeorol. 2017, 18, 2117–2129. [Google Scholar] [CrossRef]
  36. Xu, G.; Wu, Y.; Liu, S.; Cheng, S.; Zhang, Y.; Pan, Y.; Wang, L.; Dokuchits, E.Y.; Nkwazema, O.C. How 2022 extreme drought influences the spatiotemporal variations of terrestrial water storage in the Yangtze River Catchment: Insights from GRACE-based drought severity index and in-situ measurements. J. Hydrol. 2023, 626, 130245. [Google Scholar] [CrossRef]
  37. Li, L.; Peng, Q.; Wang, M.; Cao, Y.; Gu, X.; Cai, H. Quantitative analysis of vegetation drought propagation process and uncertainty in the Yellow River Basin. Agric. Water Manag. 2024, 295, 108775. [Google Scholar] [CrossRef]
  38. Geng, G.; Zhang, B.; Gu, Q.; He, Z.; Zheng, R. Drought propagation characteristics across China: Time, probability, and threshold. J. Hydrol. 2024, 631, 130805. [Google Scholar] [CrossRef]
  39. Gu, J.; Ye, Y.; Jiang, Y.; Dong, J.; Cao, Y.; Huang, J.; Guan, H. A downscaling-calibrating framework for generating gridded daily precipitation estimates with a high spatial resolution. J. Hydrol. 2023, 626, 130371. [Google Scholar] [CrossRef]
  40. Lu, Y.; Yang, X.; Bian, D.; Chen, Y.; Li, Y.; Yuan, Z.; Wang, K. A novel approach for quantifying water resource spatial equilibrium based on the regional evaluation, spatiotemporal heterogeneity and geodetector analysis integrated model. J. Clean. Prod. 2023, 424, 138791. [Google Scholar] [CrossRef]
  41. Dai, M.; Huang, S.; Huang, Q.; Zheng, X.; Su, X.; Leng, G.; Li, Z.; Guo, Y.; Fang, W.; Liu, Y. Propagation characteristics and mechanism from meteorological to agricultural drought in various seasons. J. Hydrol. 2022, 610, 127897. [Google Scholar] [CrossRef]
  42. Zhang, H.; Ding, J.; Wang, Y.; Zhou, D.; Zhu, Q. Investigation about the correlation and propagation among meteorological, agricultural and groundwater droughts over humid and arid/semi-arid basins in China. J. Hydrol. 2021, 603, 127007. [Google Scholar] [CrossRef]
  43. Dey, P.; Swarnkar, S.; Mujumdar, P. Dam operation affects the evolution and propagation of hydrological extremes. Hydrol. Sci. J. 2024, 69, 294–308. [Google Scholar] [CrossRef]
  44. Marchant, B.P.; Bloomfield, J.P. Spatio-temporal modelling of the status of groundwater droughts. J. Hydrol. 2018, 564, 397–413. [Google Scholar] [CrossRef]
  45. Yang, F.; Duan, X.; Guo, Q.; Lu, S.; Hsu, K. The spatiotemporal variations and propagation of droughts in Plateau Mountains of China. Sci. Total Environ. 2022, 805, 150257. [Google Scholar] [CrossRef] [PubMed]
  46. Yang, Y.; Wang, Y.; Cong, N.; Wang, N.; Yao, W. Impacts of the Three Gorges Dam on riparian vegetation in the Yangtze River Basin under climate change. Sci. Total Environ. 2024, 912, 169415. [Google Scholar] [CrossRef] [PubMed]
  47. Luo, X.; Luo, X.; Ji, X.; Ming, W.; Wang, L.; Xiao, X.; Xu, J.; Liu, Y.; Li, Y. Meteorological and hydrological droughts in the Lancang-Mekong River Basin: Spatiotemporal patterns and propagation. Atmos. Res. 2023, 293, 106913. [Google Scholar] [CrossRef]
  48. Valiya Veettil, A.; Mishra, A.k. Multiscale hydrological drought analysis: Role of climate, catchment and morphological variables and associated thresholds. J. Hydrol. 2020, 582, 124533. [Google Scholar] [CrossRef]
  49. Zhao, W.; Wu, J.; Du, E.; Deng, X.; Sun, G.; Wang, G. Deciphering the influence of climate change and human activities on the drought propagation. J. Hydrol. Reg. Stud. 2024, 51, 101654. [Google Scholar] [CrossRef]
  50. Ding, Y.; Xu, J.; Wang, X.; Cai, H.; Zhou, Z.; Sun, Y.; Shi, H. Propagation of meteorological to hydrological drought for different climate regions in China. J. Environ. Manag. 2021, 283, 111980. [Google Scholar] [CrossRef]
  51. Jiang, W.; Niu, Z.; Wang, L.; Yao, R.; Gui, X.; Xiang, F.; Ji, Y. Impacts of Drought and Climatic Factors on Vegetation Dynamics in the Yellow River Basin and Yangtze River Basin, China. Remote Sens. 2022, 14, 930. [Google Scholar] [CrossRef]
  52. Muthuvel, D.; Sivakumar, B. Spatial propagation of different drought types and their concurrent societal risks: A complex networks-based analysis. J. Hydrol. 2024, 636, 131247. [Google Scholar] [CrossRef]
  53. Mao, R.; Li, B.; Song, J.; Li, Q.; Li, N.; Long, Y.; Feng, J. Evaluating multifaceted effects of watershed properties and human activities on drought propagation in the Wei River Basin with an integrated framework. Sci. Total Environ. 2024, 926, 171712. [Google Scholar] [CrossRef] [PubMed]
  54. Li, X.; Zhang, K.; Gu, P.; Feng, H.; Yin, Y.; Chen, W.; Cheng, B. Changes in precipitation extremes in the Yangtze River Basin during 1960–2019 and the association with global warming, ENSO, and local effects. Sci. Total Environ. 2021, 760, 144244. [Google Scholar] [CrossRef] [PubMed]
  55. Huang, S.; Zhang, X.; Yang, L.; Chen, N.; Nam, W.-H.; Niyogi, D. Urbanization-induced drought modification: Example over the Yangtze River Basin, China. Urban Clim. 2022, 44, 101231. [Google Scholar] [CrossRef]
  56. Guan, Y.; Zhang, X.; Zheng, F.; Wang, B. Trends and variability of daily temperature extremes during 1960–2012 in the Yangtze River Basin, China. Glob. Planet. Chang. 2015, 124, 79–94. [Google Scholar] [CrossRef]
  57. Yao, Y.; Zhao, S.; Zhang, Y.; Jia, K.; Liu, M. Spatial and Decadal Variations in Potential Evapotranspiration of China Based on Reanalysis Datasets during 1982-2010. Atmosphere 2014, 5, 737–754. [Google Scholar] [CrossRef]
  58. Ma, D.; Wang, T.; Gao, C.; Pan, S.; Sun, Z.; Xu, Y.-P. Potential evapotranspiration changes in Lancang River Basin and Yarlung Zangbo River Basin, southwest China. Hydrol. Sci. J. 2018, 63, 1653–1668. [Google Scholar] [CrossRef]
  59. Li, Z.; Huang, S.; Zhou, S.; Leng, G.; Liu, D.; Huang, Q.; Wang, H.; Han, Z.; Liang, H. Clarifying the Propagation Dynamics from Meteorological to Hydrological Drought Induced by Climate Change and Direct Human Activities. J. Hydrometeorol. 2021, 22, 2359–2378. [Google Scholar] [CrossRef]
  60. Wang, Y.; Wang, S.; Chen, Y.; Wang, F.; Liu, Y.; Zhao, W. Anthropogenic drought in the Yellow River basin: Multifaceted and weakening connections between meteorological and hydrological droughts. J. Hydrol. 2023, 619, 129273. [Google Scholar] [CrossRef]
  61. Xu, Y.; Zhang, X.; Wang, X.; Hao, Z.; Singh, V.P.; Hao, F. Propagation from meteorological drought to hydrological drought under the impact of human activities: A case study in northern China. J. Hydrol. 2019, 579, 124147. [Google Scholar] [CrossRef]
  62. Yun, X.; Tang, Q.; Wang, J.; Liu, X.; Zhang, Y.; Lu, H.; Wang, Y.; Zhang, L.; Chen, D. Impacts of climate change and reservoir operation on streamflow and flood characteristics in the Lancang-Mekong River Basin. J. Hydrol. 2020, 590, 125472. [Google Scholar] [CrossRef]
Figure 1. Location (a), land-use map (b), and soil map (c).
Remotesensing 16 03033 g001
Figure 2. Diagram of the research process of the study.
Remotesensing 16 03033 g002
Figure 3. Comparison of SPEI11 (a) and TWSA-DSI (b) (red bars indicate identified drought events with durations greater than three months, and solid red lines indicate drought thresholds).
Remotesensing 16 03033 g003
Figure 4. Seasonal spreading time of drought (black dots indicate 99% confidence level).
Remotesensing 16 03033 g004
Figure 5. Annual dynamic propagation time (green for 3-year sliding time scales, red for 5-year sliding time scales, the dotted curve represents the drought propagation time, the dotted line represents the drought propagation time trend, and the hollow point represents the correlation coefficient of the drought propagation time (all passed the correlation test of 0.05).
Remotesensing 16 03033 g005
Figure 6. Seasonal dynamic propagation time.
Remotesensing 16 03033 g006
Figure 7. Spatial patterns of drought propagation time (a) and correlation (b).
Remotesensing 16 03033 g007
Figure 8. Relationship between drought propagation time and elevation (a), precipitation (b), runoff (c), soil moisture content (d), temperature (e), and potential evapotranspiration (f).
Remotesensing 16 03033 g008
Figure 9. Geodetector analysis of single-factor scores affecting spatial patterns of drought propagation.
Remotesensing 16 03033 g009
Figure 10. Geodetector analysis of interactive factor scores affecting the spatial distribution of drought propagation (Interactive scores of elevation (a), potential evapotranspiration (b), temperature (c), precipitation (d) with other factors).
Remotesensing 16 03033 g010
Table 1. The drought index classification.
CategoryDescriptionSPEITWSA-DSI
D0No Drought(−0.5, +∞)(−0.5, +∞)
D1Mild Drought(−1.0, −0.5](−0.8, −0.5]
D2Moderate Drought(−1.5, −1.0](−1.3, −0.8]
D3Severe Drought(−2.0, −1.5](−1.6, −1.3]
D4Extreme Drought(−∞, −2.0](−2.0, −1.6]
D5Exceptional Drought (−∞, −2.0]
Table 2. Drought seasonal static propagation time.
SpringSummerAutumnWinter
Propagation time8.76.757.7
Corresponding correlation0.670.720.890.69
Corresponding significancep < 0.01p < 0.01p < 0.01p < 0.01
Table 3. Trend analysis of seasonal dynamic propagation time in the YRB.
SpringSummerAutumnWinter
Z value2.10 **−1.4800.62
trendupwarddownwardno trendupward
Note: ** denotes passing the test of significance; absolute values of Z greater than 1.96 indicate that a 95% confidence test was passed.
Disclaimer/Publisher’s Note: The statements, opinions and data contained in all publications are solely those of the individual author(s) and contributor(s) and not of MDPI and/or the editor(s). MDPI and/or the editor(s) disclaim responsibility for any injury to people or property resulting from any ideas, methods, instructions or products referred to in the content.

