Article

DualNet-PoiD: A Hybrid Neural Network for Highly Accurate Recognition of POIs on Road Networks in Complex Areas with Urban Terrain

1
School of Smart City, Chongqing Jiaotong University, Chongqing 400074, China
2
Chongqing Key Laboratory of Spatial-Temporal Information for Mountain Cities, Chongqing 400074, China
3
China Academy of Surveying and Mapping, Beijing 100081, China
4
School of Management Science and Real Estate, Chongqing University, Chongqing 400074, China
*
Author to whom correspondence should be addressed.
Remote Sens. 2024, 16(16), 3003; https://doi.org/10.3390/rs16163003
Submission received: 11 June 2024 / Revised: 30 July 2024 / Accepted: 9 August 2024 / Published: 16 August 2024

Abstract

For high-precision navigation, obtaining and maintaining high-precision point-of-interest (POI) data on the road network is crucial. In urban areas with complex terrains, the accuracy of traditional road network POI acquisition methods often falls short. To address this issue, we introduce DualNet-PoiD, a hybrid neural network designed for the efficient recognition of road network POIs in intricate urban environments. This method leverages multimodal sensory data, incorporating both vehicle trajectories and remote sensing imagery. Through an enhanced dual-attention dilated link network (DAD-LinkNet) based on ResNet18, the system extracts static geometric features of roads from remote sensing images. Concurrently, an improved gated recirculation unit (GRU) captures dynamic traffic characteristics implied by vehicle trajectories. The integration of a fully connected layer (FC) enables the high-precision identification of various POIs, including traffic light intersections, gas stations, parking lots, and tunnels. To validate the efficacy of DualNet-PoiD, we collected 500 remote sensing images and 50,000 taxi trajectory data samples covering road POIs in the central urban area of the mountainous city of Chongqing. Through comprehensive area comparison experiments, DualNet-PoiD demonstrated a high recognition accuracy of 91.30%, performing robustly even under conditions of complex occlusion. This confirms the network’s capability to significantly improve POI detection in challenging urban settings.

1. Introduction

With the rapid global increase in positioning and navigation demands, high-precision, real-time positioning services are becoming increasingly critical in sectors such as intelligent transportation, urban planning, and autonomous driving. A pivotal element in the construction and updating of high-precision maps involves the accurate collection and updating of POIs such as traffic light intersections, gas stations, parking lots, and tunnels within the road network. Urbanization intensifies the complexity of traffic, making the efficient modernization of urban road networks one of the current focal topics in transportation research [1,2]. Traditional methods of manual data collection and annotation, hindered by their lack of timeliness and precision, struggle to meet the demands for swift updates of modern maps. The need to identify urban road network POIs accurately and swiftly has become increasingly urgent. Recent years have seen a significant expansion in the application of remote sensing technology and vehicle-mounted global navigation satellite systems (GNSSs), facilitating the large-scale collection and processing of vehicle trajectory data and remote sensing information, which introduces innovative approaches for updating road data.
In the realm of remote sensing applications for urban geographic information extraction, researchers have deployed various strategies to manage the complex characteristics of roads and buildings. Initially, Xiao et al. utilized an edge detection-based approach, which, by recognizing image edge information, facilitated the extraction of road contours, thus laying the foundation for basic road feature extraction [3]. Advancing this field, Singh et al. developed a two-stage framework that leverages the distinctive features of impervious surfaces to enhance the precision and efficiency of road extraction from high-resolution satellite imagery [4]. Concurrently, Hou et al. explored the use of shadows in images to deduce building heights, a method that underscores the importance of spatial coordinates in the process of inferring building dimensions. This approach offers a novel perspective for urban planning and building monitoring [5]. Furthermore, Kaur et al. enhanced the classification capabilities of satellite images by improving the Marr–Hildreth method and integrating it with fuzzy clustering, demonstrating its superiority in areas such as rock cover planning, shadow detection, and building identification [6]. With the growing demand for greater accuracy and more complex scene analysis, Cai et al. proposed a multi-attention residual integration network that improves hyperspectral image recognition by reducing redundant features and enhancing feature fusion, thus addressing the high complexity in remotely sensed images [7]. Qi et al. improved the method for recognizing remote sensing images by implementing an optimization strategy and machine learning algorithms specifically for extracting landslide features, significantly enhancing the capability for monitoring natural disasters [8]. To mine both global and local feature information simultaneously and improve the detail processing capabilities of image recognition, Cui et al. introduced a dual-channel deep learning network for remote sensing image recognition [9]. Supported by modern computing technologies, He et al. presented a cloud-edge collaborative feature extraction framework for satellite multi-access edge computing. This framework, by training a feature extractor on a terrestrial cloud server, optimizes the process of extracting useful features from satellite data, showcasing the efficacy and potential of cloud and edge computing in processing remote sensing data [10].
To improve the understanding and management of urban traffic flows, scholars have employed various advanced methods and algorithms to process and analyze GPS-based floating car data. In terms of updating and enhancing the accuracy of digital road maps: Li et al. utilized data from the National Commercial Vehicle Monitoring Platform to propose an incremental road network extraction method, suited for low sampling frequencies and extensive GPS data coverage [11]. Zheng et al. developed a novel incremental clustering algorithm specifically designed to extract the road network topology from floating car data [12]. Additionally, Zhang et al. employed mathematical morphology and gravity models to incrementally extract urban road networks from spatio-temporal trajectory data, thereby increasing the precision and complexity of data processing methods [13]. In terms of traffic flow monitoring and analysis, Chen et al. analyzed traffic conditions on urban highways using floating car data, identifying traffic congestion patterns [14]. Concurrently, Guo et al. enhanced traffic flow analysis accuracy by applying a weighted least squares method to mine road networks from floating vehicle data [15]. In terms of the identification of urban functions, Sun et al. analyzed vehicle trajectory data to explore the importance of human mobility and ultimately determine the functional types of key locations [16]. Hu et al. introduced a graph convolutional neural network framework to model the relationship between traffic interactions and urban functions at the road segment level, aiming to categorize social functions along streets [17]. In terms of travel behavior analysis, Huang et al. focused on the personal travel patterns of private vehicle drivers using a large-scale dataset and clustering with the DBSCAN method [18]. Furthermore, Xiao et al. introduced an improved edit distance with real penalty (IERP) to measure the spatio-temporal distance between trajectories, assisting in the analysis and extraction of regular travel behaviors from private car trajectory data [19].
The existing research on urban traffic data extraction predominantly relies on a single data source, which often results in issues such as inadequate accuracy. In response to these challenges, numerous scholars have advocated for the integration of diverse data sources in recent years. In terms of basic road and area feature extraction, Yali Li et al. crafted a multivariate integration method that effectively extracts road intersections by combining vehicle trajectory data with remote sensing images, significantly improving the extraction accuracy [20]. Similarly, Fang et al. capitalized on the unique advantages of GNSS trajectory points and high-resolution remote sensing images to develop a road area detection method in remote sensing imagery, which focuses on the continuity of trajectory data and the similarity of image features [21]. Furthermore, Qian et al. implemented an integrated model that uses satellite imagery and taxi GPS trajectories to perform a four-step process for urban functional area (UFA) recognition [22]. In terms of enhancing the creation and updating of digital maps for traffic information systems, Qin et al. established a composite updating framework that merges trajectory data with UAV remote sensing images, based on a hidden Markov model (HMM) map-matching approach to discern new road sections [23]. Additionally, Wang et al. introduced the DelvMap framework, utilizing courier trajectories and satellite imagery to fill in missing road data on maps, thus addressing gaps in digital road mapping [24]. Deep learning and automated methods have been increasingly applied in traffic feature extraction. Yang et al. proposed an automated road extraction solution named DuARE, which aims to extract basic road features from aerial imagery and trajectory data in a fully automated manner [25]. Wu et al. developed a deep convolutional neural network called DeepDualMapper, which seamlessly integrates aerial imagery and trajectory data for digital map extraction [26]. Furthermore, Li et al. introduced an approach integrating GPS trajectories and RS images using a U-Net variant to construct road maps consisting of intersections and road segments [27].
In recent years, a considerable number of researchers have focused on employing various deep learning network architectures for road network extraction, achieving significant advancements in the accuracy and efficiency of road object detection. The integration of dynamic convolution techniques and density-aware mechanisms has notably enhanced the recognition performance of various road objects in complex and congested traffic environments. In terms of the development of foundational deep learning models and frameworks, Badrinarayanan introduced a practical and novel deep fully convolutional neural network architecture, SegNet. This architecture efficiently achieves semantic pixel-level segmentation by utilizing pooling indices for nonlinear upsampling during the maximum pooling steps [28]. Zhou and colleagues developed a semantic segmentation neural network, D-LinkNet, which utilizes an encoder–decoder structure, dilated convolutions, and a pretrained encoder specifically for road extraction tasks [29]. In the application of multi-task and multi-scale learning frameworks, Shao et al. devised a dual-task end-to-end convolutional neural network, the multi-task road related extraction network (MRENet), which serves for both pavement extraction and road centerline extraction [30]. Lu and colleagues proposed a novel multi-scale, multi-task automated deep learning framework (MSMT-RE) for road extraction, which effectively carries out road detection and centerline extraction tasks concurrently [31]. In terms of solutions for specific problems and advanced network architectures, Zhou et al. offered the boundary and topology aware road extraction network (BT-RoadNet), which enhances road network extraction capabilities, addressing disruptions caused by shadows and occlusions, and is capable of extracting roads of varying scales and materials, including those with incomplete spectral and geometric properties [32]. Xiong et al. proposed an improved semantic segmentation model, DP-LinkNet, which uses the D-LinkNet architecture as a backbone and incorporates hybrid dilation convolution (HDC) and spatial pyramid pooling (SPP) modules [33].
In the application and optimization of multimodal data fusion techniques, Gao et al. used floating vehicle trajectories for trajectory correction, subsequently extracting road features from both the channel and spatial domains of target images using a convolutional network model based on a dual-attention mechanism [34]. Li et al. developed a decoder fusion model based on dilated Res-U-Net (DF-DRUNet) that efficiently merges GPS trajectories with remote sensing images to extract road networks [35]. Shimabukuro and colleagues introduced an early fusion network that uses RGB and surface model images to provide complementary geometric data for improved pavement extraction [36]. Roy et al. proposed a new multimodal fusion transformer network (MFT), featuring multi-head cross-patch attention (mCrossPA) for classifying HSI land cover [37]. Ma et al. presented the FTransUNet, a multi-level multimodal fusion scheme that integrates CNN and Vit into a unified fusion framework, providing a robust and effective multimodal fusion backbone for semantic segmentation [38]. In summary, despite numerous studies on utilizing multi-source spatiotemporal data for identifying POIs in road networks, current approaches still encounter specific challenges:
(1)
Remote sensing methods have primarily depended on the physical characteristics (e.g., geometric shape, texture, color) of POIs for identification. However, in complex terrains such as mountains, vegetation, or buildings, occlusion often leads to the failure of these physical features to accurately reflect the POIs of frequent human activity in typical road sections.
(2)
Although trajectory data-based methods use spatial location and dynamic connection features for POI identification, the identification accuracy of these methods is not ideal in some areas due to the uneven spatial distribution of trajectory data and signal noise problems in occluded or semi-occluded areas.
(3)
Although the multi-source data fusion method combines the geometric characteristics of remote sensing data with the dynamic traffic characteristics of trajectory data, the existing models are complex and there have been relatively few studies on road POI identification.
(4)
Segmentation methods such as U-Net rely heavily on extensive, high-quality annotated data; however, in specific scenarios, suitable annotated data are often scarce. The manual acquisition of such data is not only cumbersome but also time consuming, significantly constraining the training and refined development of models.
To address these issues, this paper introduces DualNet-PoiD, a hybrid neural network approach for effectively identifying POIs in road networks within intricate urban terrains. This method aims to detect and classify common POIs such as petrol stations, traffic light intersections, parking lots, tunnels, and straight roads. The primary contributions of this paper are as follows:
(1)
We create a publicly available dataset comprising remote sensing data and vehicle trajectory datasets for POIs in areas with complex topography. Previous research has lacked publicly available datasets providing continuous stopping time and location information necessary for identifying typical road network POIs in complex terrain areas. This dataset now serves as a valuable resource for future scholars conducting research in this field.
(2)
This paper introduces an innovative hybrid neural network designed to integrate remote sensing data with vehicle trajectory data for the identification of POIs in road networks. The principal advantage of this approach is its capability to simultaneously process the static geometric features derived from remote sensing data and the dynamic traffic features provided by trajectory data. By leveraging this data fusion, the model effectively addresses the recognition limitations encountered in scenarios with occlusions, significantly enhancing the precision and coverage of POI identification without depending on traditional data annotation processes.
(3)
The experiments demonstrate the effectiveness of multimodal data and DualNet-PoiD in identifying POIs across various topographic environments. A comprehensive series of experiments were conducted, including comparisons between DualNet-PoiD and single DAD-LinkNet, single GRU, and single LSTM models. These experiments covered various complex terrain conditions, such as the presence of tall buildings, trees, and tunnels. The accuracy of the experiments was illustrated using precision, recall, F1-score, and IoU indicators. The results fully demonstrate the superior performance of DualNet-PoiD in handling diverse complex terrains and multiple POI types.

2. Research Methodology

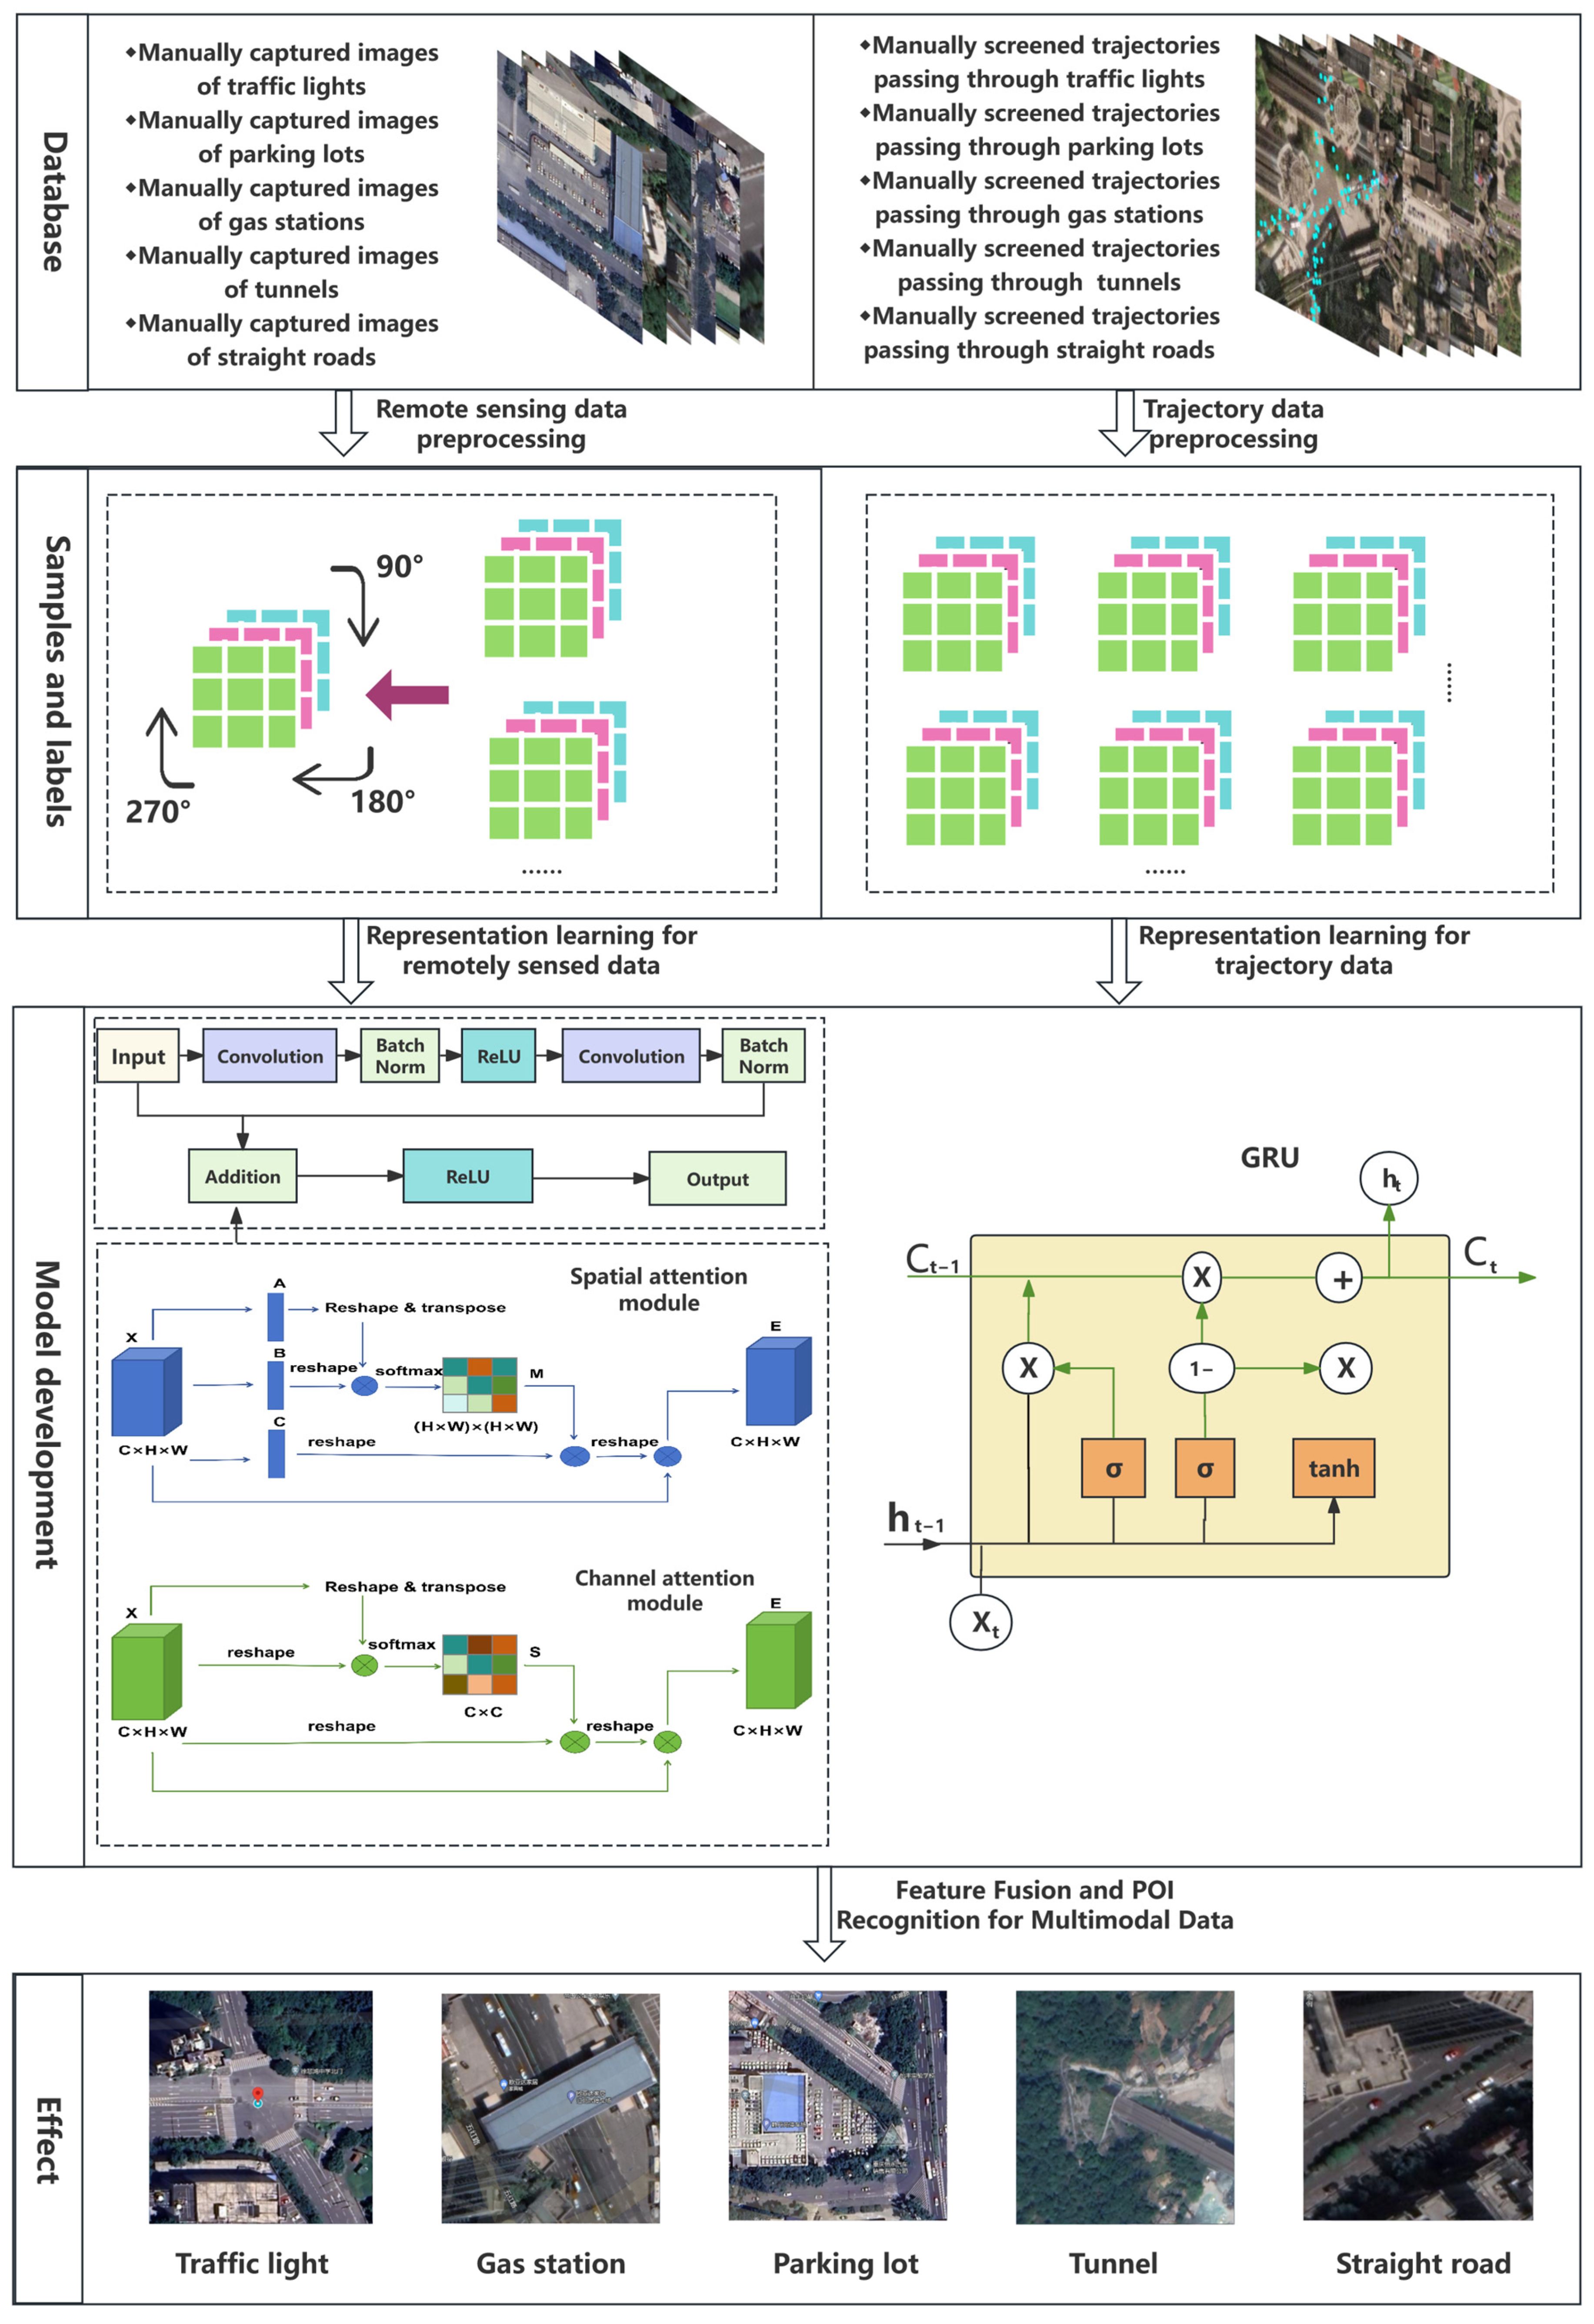
This study introduces an innovative neural network structure designed to automatically identify and extract POIs related to roads in urban areas with rugged terrain. We achieve effective POI identification in complex urban areas by combining static geometric features of roads with dynamic traffic features, utilizing DAD-LinkNet and GRU. This fusion process can be accomplished through either simple splicing or weighted averaging methods.
Initially, we generate remote sensing data and vehicle trajectory data that meet the specified criteria. Figure 1 illustrates the sequence of preprocessing steps these data undergo before entering the architecture, which consists of three primary components.
Part I: Representation Learning from Remote Sensing Data. This phase involves the acquisition of remote sensing imagery for POIs such as gas stations, traffic light intersections, parking lots, tunnels, and straight roads. The images undergo preprocessing operations including scaling, cropping, and normalization to prepare them for further analysis. The preprocessed images are then fed into a DAD-LinkNet equipped with a dual-attention mechanism, designed to extract the geometric features of the roads.
Part II: Representation Learning from Trajectory Data. Trajectory data, encompassing timestamps, vehicle IDs, longitude, and latitude information, are processed to simulate the paths vehicles take through specific POIs, with constraints set on time and space. These data are input into GRU to capture the underlying traffic dynamics associated with the roads.
Part III: Multimodal Data Fusion and POIs Identification. In this stage, features from trajectory and image data are merged using methods such as simple concatenation or weighted averaging. After the feature fusion, a hybrid neural network is constructed to identify critical traffic POIs. Weighted hyperparameters are used as the loss function to optimize the network parameters, enhancing the model’s performance in recognizing and classifying POIs.

2.1. Geometric Feature Extraction Based on Remote Sensing Data

Remote sensing data representation learning is a critical means for analyzing conditions of the Earth’s surface and atmosphere. This paper employs a convolutional neural network based on an improved ResNet18 architecture, named DAD-LinkNet. This network structure, through the Dual-Attention Module (DAM), effectively enhances the capability to extract key features from remote sensing images. Such improvements allow the network to more accurately identify surface characteristics, change detection, and other environmental monitoring elements when processing a large volume of remote sensing image data.
DAD-LinkNet combines the deep feature extraction capabilities of ResNet18 with the significant advantages of attention mechanisms. ResNet18 addresses the issue of vanishing gradients in deep networks by introducing residual connections, which are formulated as follows in its residual blocks:
y = F ( x , { W i } ) + x
Within this formulate, F ( x , { W i } ) represents a combination operation of a convolution layer, batch normalization layer, and activation function, where x denotes the input and y the output.
Building on this, DAD-LinkNet further enhances its feature extraction capability by incorporating the DAM. The DAM consists of two main components: the Channel Attention Mechanism [39] (CA) and the Spatial Attention Mechanism [40] (SA). The Channel Attention Mechanism utilizes both max pooling and average pooling to capture global information, which is then processed by fully connected layers. The specific computation formula is as follows:
C A ( x ) = σ ( C o n v ( Re L U ( C o n v ( A v g P o o l ( x ) ) ) ) ) × x
The spatial attention mechanism extracts spatial information through a convolution operation, calculated as follows:
S A ( x ) = σ ( C o n v ( C o n c a t ( M a x P o o l ( x ) , A v g P o o l ( x ) ) ) ) × x
The Spatial Attention Mechanism extracts spatial information via convolution operations, with the computation formula expressed as follows: σ is the Sigmoid activation function, and c o n v symbolizes the convolution operation, with MaxPool and AvgPool indicating maximum pooling and average pooling, respectively. The DAM ensures that the model focuses on the most informative regions within remote sensing images.
By integrating these two attention mechanisms, DAD-LinkNet enhances its focus on the most informative areas within remote sensing images during the feature extraction process, thereby improving the overall performance of the model. The specific network layers are described as follows:
(1)
Input Layer: Receives remote sensing images that have been normalized and resized to prepare for subsequent feature extraction.
(2)
Initial Convolutional and Pooling Layers: The first layer is a 7 × 7 convolutional layer with a stride of 2, followed by batch normalization and a ReLU activation function, performing preliminary feature extraction. This is followed by a 3 × 3 maximum pooling layer with a stride of 2, which reduces the spatial dimensions of the feature map, enhancing the model’s capacity for abstraction.
(3)
Residual Blocks: Contains four sets of residual blocks, each comprising two 3 × 3 convolutional layers, with each convolutional operation followed by batch normalization and ReLU activation. These blocks use residual connections to help the network learn deeper features without losing important information.
(4)
DAM: Positioned after the intermediate residual blocks. This module consists of two parts: CA and SA. CA is achieved through global average pooling and maximum pooling, followed by processing the pooled results with two 1 × 1 convolutional layers and merging them through a Sigmoid function, enhancing the model’s focus on specific channels. SA utilizes the outputs from the channel attention, bolstering spatial features through a 7 × 7 convolutional layer and a Sigmoid function, thus strengthening the model’s recognition capabilities in key image areas.
(5)
Output Layer: A global average pooling layer converts the feature map into a one-dimensional feature vector, followed by a fully connected layer that outputs the final feature representation, used for subsequent feature fusion tasks.

2.2. Extracting Traffic Semantics Based on Trajectory Data

Trajectory data representation learning is crucial for understanding the movement patterns of objects in space and time. This paper utilizes a model based on GRU [41], named the RNN Model, which captures the temporal dependencies and dynamic characteristics of trajectories to extract valuable information for traffic flow analysis, urban planning, and mobility patterns.
The design of the RNN Model leverages the advantages of GRU to effectively handle long-term dependencies in time series data. The model structure is as follows:
(1)
Input Data Preprocessing: Trajectory data are processed with temporal and spatial constraints to simulate the paths of vehicles passing through specific POIs.
(2)
GRU Layer: The input data are fed into the GRU layer, which captures the temporal dependencies. The computation formula for the GRU layer is as follows:
z t = σ ( W z [ h t 1 , x t ] )
r t = σ ( W r [ h t 1 , x t ] )
h ˜ t = tanh ( W r t × h t 1 , x t ] )
h t = ( 1 z t ) × h t 1 + z t × h ˜ t
z t is the update gate. r t is the reset gate. h t is the updated hidden state. h t ˜ is the candidate hidden state. x t is the input at time t. h t - 1 is the previous hidden state at time t − 1. σ denotes the sigmoid activation function, which limits values between 0 and 1, crucial for gates in GRU as it regulates the amount of information that should be passed through. tanh represents the hyperbolic tangent function, which helps in regulating the information flow within the network by providing outputs between −1 and 1, suitable for maintaining the scale of the hidden state. W z , W r , and W are the respective weight matrices for the update gate, reset gate, and the candidate hidden state. indicates element-wise multiplication, which is essential in applying the reset gate to the previous hidden state before combining it with the current input for candidate activation.
(3)
Fully FC: The output from the GRU layer is passed through a fully connected layer to generate the final feature representation.
(4)
Output Layer: The final output features are used for subsequent fusion tasks, supporting complex decision-making processes.

2.3. Multimodal Data Feature Fusion and POI Recognition

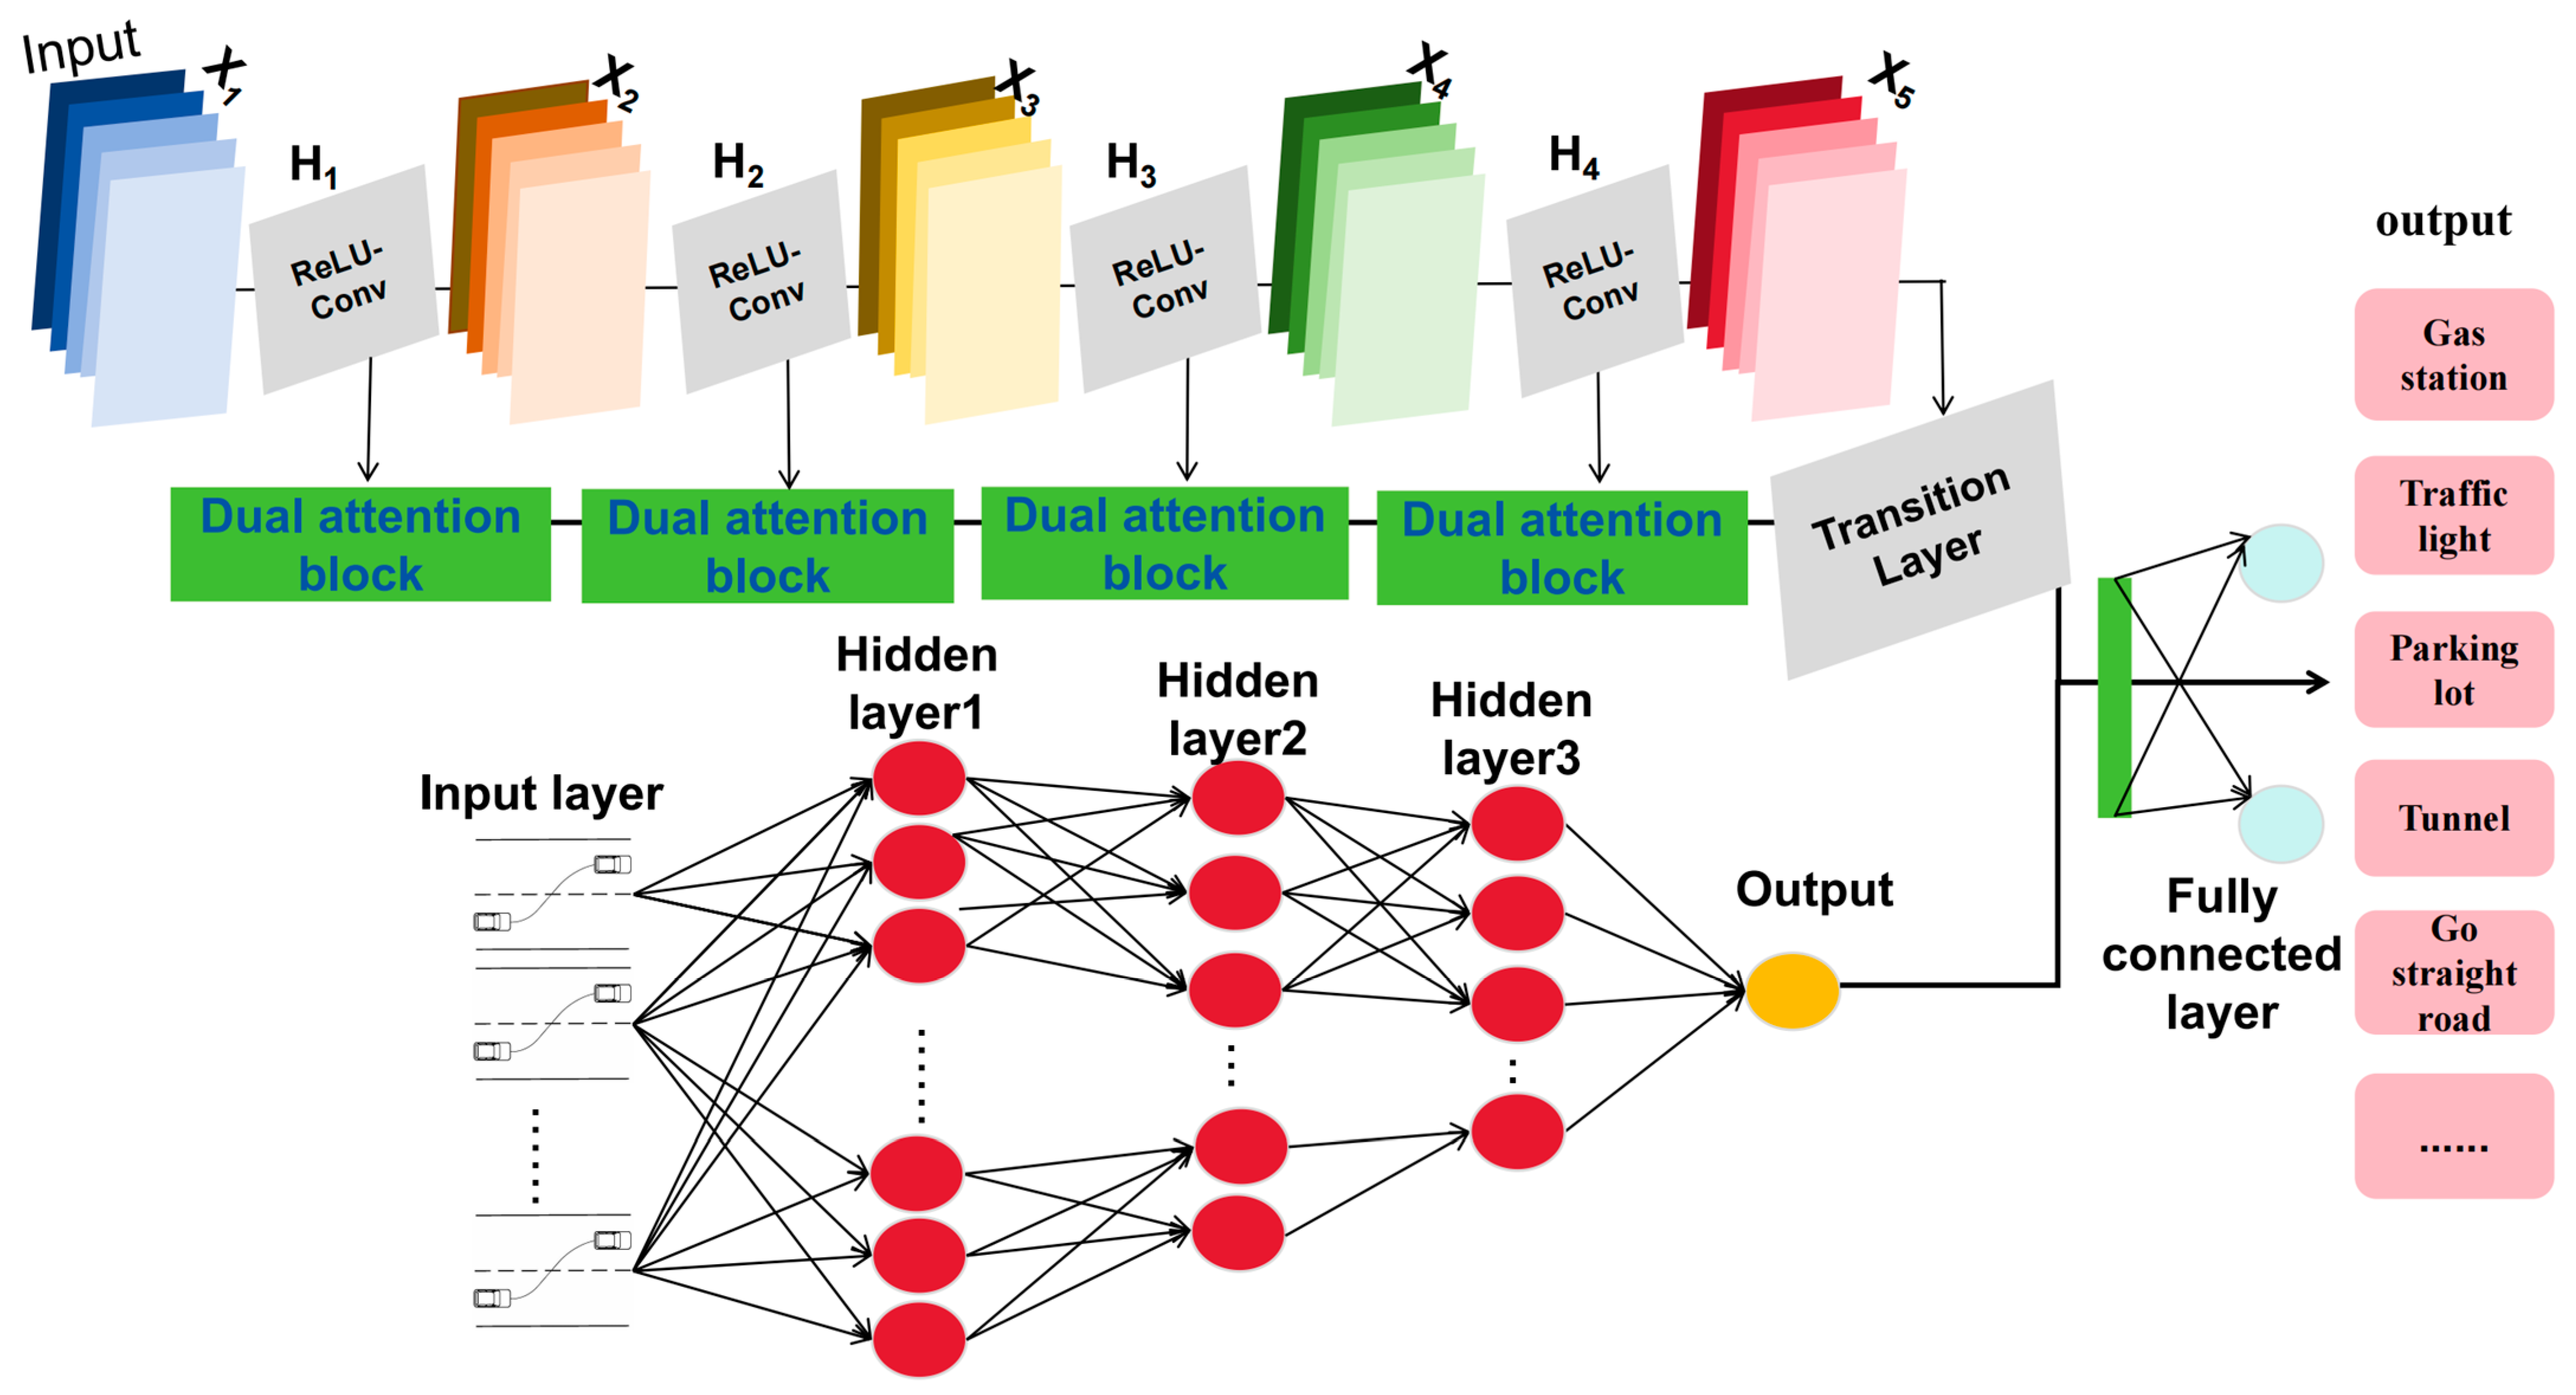
Multimodal data feature fusion is crucial for enhancing the accuracy and efficiency of location-based services. We implement the HybridModel, a framework that integrates the outputs of DAD-LinkNet and RNN Model through a fully connected layer, enabling simultaneous processing of image and time series data within a unified framework, thereby enabling more precise POI recognition. Multimodal data feature fusion is essential to improve the accuracy and efficiency of location-related services. We do this by implementing the HybridModel, a model that combines the outputs of DAD-LinkNet and RNN Model with a fully connected layer for final classification, allowing for a more accurate identification of POIs by processing both image data and time-series data within a unified framework.
The model fusion process is structured as follows:
(1)
Image and Trajectory Data Preprocessing: Image and trajectory data are preprocessed separately.
(2)
Feature Extraction: Image data are input into DAD-LinkNet to extract geometric features, while trajectory data are fed into RNN Model to extract temporal features.
(3)
Feature Fusion: The output features from DAD-LinkNet and RNN Model are fused either by concatenation or weighted averaging.
The formula for this process is as follows:
f c n n = F C ( G A P ( D A M ( C N N ( x i m g ) ) ) )
f r n n = F C ( G R U ( x t s ) )
y = F C ( C o n c a t [ f c n n , f r n n ] )
where f cnn denotes the feature vector obtained from the features extracted from the CNN model after global average pooling (GAP) and DAM processing through a FC. f rnn denotes the feature vector obtained by passing the features extracted from the RNN Model (here, GRU) through a fully connected layer. x img and x ts represent image data and time series data, respectively. Concat   denotes feature concatenation.
Moreover, a weighted loss function was used to balance the acquisition of diverse tasks:
L = α L C E ( y , t r u e ) + β L M S E ( y , t r u e )
where α and β are weight parameters, L CE and L MSE are the cross-entropy loss and mean square error loss, respectively. This structure enables the model to handle not only single-modal data but also to efficiently integrate information from multiple sources, providing robust support for complex classification tasks. This integration method significantly enhances the model’s adaptability and usefulness in real-world scenarios, particularly when processing various data types concurrently.
Figure 2 displays the comprehensive configuration of the hybrid model.

3. Experimentation and Analysis

3.1. Experimental Environment and the Data

The experiments were conducted on a machine equipped with an Intel Core i7 processor, 128 GB of RAM, and an NVIDIA GeForce RTX 3090 graphics card. The method employs the PyTorch 2.3.0 deep learning framework and utilizes Intel (R) Xeon (R) Gold 5218R CPU acceleration to expedite model training and inference. Due to the absence of public datasets that met the conditions in this area, the data utilized included 500 remote sensing image data and 50,000 taxi track data from the road interest area in the central city of Chongqing. Eighty percent of the marked track samples were randomly selected as the training dataset, and the remaining twenty percent as the test data. Gradient descent was used for learning, and the input features of the neural network needed to be standardized. Specifically, the input data were normalized before feeding the learning data into the neural network. The standardization of input features proved beneficial in improving the running efficiency and learning performance of the algorithm.

3.1.1. Remote Sensing Image Sample Production

The preprocessing of the remote sensing data, depicted in Figure 3, encompasses the following procedures [42]:
(1)
Obtain images: Remote sensing images of POIs are manually captured from Google Maps, selecting specific POIs (such as gas stations, traffic light intersections, and parking lots) and ensuring that the images include POIs and the surrounding roads.
(2)
Unified image size: All the intercepted remote sensing images are adjusted to a consistent size for subsequent processing.
(3)
Filtering processing: The images are filtered to remove noise, enhance specific characteristics in the image, and improve the effect of model training.
(4)
Normalization: The filtered images are normalized so that the pixel values of the images are distributed within a certain range (usually between 0 and 1) in order to improve the robustness of the model.
(5)
Feature extraction: A convolutional neural network is used to extract features from the pre-processed images to prepare for subsequent image recognition or classification tasks.
Figure 4 shows the pre-processed images of gas stations, traffic light intersections, parking lots, and tunnels.

3.1.2. Vehicle Track Data Sampling

Vehicles driving in different areas of the road exhibit various characteristics, which can be described by three variables: the speed, acceleration, and direction change in the vehicle. A specific range of vehicle driving tracks around the road network POIs provides rich information for identifying these POIs. In this study, the vehicle trajectory data from gas stations, traffic light intersections, parking lots, and areas 100 m around straight roads are selected for experimentation. The conditions for screening vehicle trajectories are shown in Table 1.

3.2. Road POI Recognition Experiment

Precision, recall, F1-score, and IoU (intersection over union) were fundamental measures used to evaluate the performance of a model. These metrics were frequently employed in classification and segmentation tasks to assess the model’s precision and effectiveness in recognizing POIs.
Pr e c i s i o n = T P T P + F P
TP represented a true positive case, indicating an accurate prediction of a positive class. FP represented a false positive example, indicating an incorrect prediction of a positive class.
R ecall = T P T P + F P
FN represented a false negative instance, indicating a positive class that is inaccurately classified as a negative class.
F 1 s c o r e = 2 × Pr e c i s i o n × Re c a l l Pr e c i s i o n + Re c a l l
I o U = Area   of   Overlap Area   of   Union
The area of overlap referred to the region where the predicted and real objects intersect, whereas the area of union represented the combined region formed by the predicted and real objects.

3.2.1. Road Network POI Recognition Experiment

The model was constructed using the PyTorch framework, which enabled the training and prediction of intricate data by tailoring the dataset, model architecture, loss function, and evaluation criteria. Specifically, in this experiment, the following applied:
(1)
Two custom dataset classes were defined: ImageCustomDataset and TimeSeriesCustomDataset. The ImageCustomDataset class was used to load and transform image data, assigning a corresponding category label to each image. The TimeSeriesCustomDataset class handled time series data by parsing the CSV file, calculating the time interval, and categorizing the data depending on the average value of the time interval.
(2)
Two main models were designed: DAM and DADLinkNet. The DAM enhanced the ability to identify key features through two attention mechanisms—channel attention and spatial attention. The DADLinkNet combined the pre-trained ResNet18 with the DAM to extract image features. In addition, an RNN Model based on LSTM/GRU was specifically designed for processing time series data.
(3)
The loss function was designed using a weighted loss method, which allowed for an adjustment of the loss proportions of the classification task and the regression task based on the different weights assigned to each task. This adjustment was made using the weighted loss class.
(4)
During the training phase, we utilized DataLoader to load the hybrid dataset in batches. We then employed the modified my_collate_fn function to handle the data within each batch, ensuring its consistency and validity. The model training process involved forward propagation, loss calculation, gradient backpropagation, and parameter updating. The model’s performance was evaluated using precision, recall, F1-score, and IoU metrics. After each training cycle, the model was assessed on a test set to gauge its performance on data that it had yet to be exposed to before.
This study observed significant improvements in performance by employing multiple models, specifically by combining the DAD-LinkNet model for image processing with LSTM and GRU for processing time series data. We present the empirical comparative findings in Table 2, where the highlighted part indicates the optimal result for each indicator comparison.
The individual LSTM and GRU models demonstrate effective handling of time series data. The LSTM model, with its more intricate gating mechanism, exhibits slightly superior performance in managing long-term dependencies. The single DAD-LinkNet model improves image recognition by incorporating channel and spatial attention mechanisms. Although it does not enhance performance as much as hoped when used alone, the IoU scores for the model combination show that it significantly improves prediction accuracy and image segmentation.
Specifically, integrating DAD-LinkNet with LSTM and GRU dramatically enhances its performance. The DAD-LinkNet + LSTM model achieves accuracy, recall, F1 score, and IoU values of 0.893, 0.888, 0.889, and 0.812, respectively. On the other hand, the DAD-LinkNet + GRU model performs even better, with precision, recall, F1 score, and IoU values of 0.913, 0.912, 0.911, and 0.856, respectively. This notable performance improvement indicates that a model combining image and time series data processing can significantly enhance prediction accuracy and image segmentation. This model is particularly well suited for application scenarios that require the simultaneous handling of image and temporal dynamics.
In addition, the model demonstrates excellent adaptability and flexibility in a complex data environment by processing multimodal data. In scenarios of simultaneously processing image and time series data, the model can not only provide more accurate diagnostic information but also enhance the reliability of predictions through efficient feature fusion. This multi-task learning capability is crucial to driving deep learning technology progress, especially in exploring how to effectively integrate information from different data sources to improve model performance.

3.2.2. POI Recognition in Complex Terrain

Chongqing, situated in southwestern China, was renowned for its intricate geography and distinctive mountainous characteristics. The city’s unique terrain presented a greater challenge for recognizing road network POIs compared to other cities. Therefore, experiments were conducted for both obscured and unobscured regions.
Gas stations, traffic light intersections, parking lots and tunnels blocked by trees or buildings were selected as experimental datasets and compared with those without occlusion. The experimental comparison results are shown in Table 3 and Table 4. Figure 5 exhibits pictorial representations of hidden gas stations, traffic light intersections, parking lots, and tunnels in that order.
The road network POI recognition studies conducted in Chongqing Municipality’s challenging terrain and mountainous features vividly demonstrate the models’ varying performance in contexts with and without obstructions. A comparative analysis of the data presented in the two tables provides a deeper understanding of the efficacy of various models in handling intricate visual information. The DAD-LinkNet model, when combined with LSTM or GRU, shows exceptional accuracy and IoU values in occluded environments, indicating the model’s robustness in handling visual impediments such as crossroads and parking lots obscured by trees and buildings.
When faced with occlusion situations, the DAD-LinkNet + LSTM and DAD-LinkNet + GRU models outperform the individual LSTM or GRU models. For instance, the DAD-LinkNet + LSTM model attains an accuracy of 0.858, significantly surpassing the accuracy of 0.559 achieved by LSTM alone. This suggests that the dual-attention mechanism significantly enhances the model’s capacity to identify crucial characteristics within the obscured area. In an environment without obstructions, the model demonstrates an exceptional accuracy of 0.913, indicating optimal performance in ideal conditions. The IoU statistic also demonstrates performance improvement, with an IoU of 0.855 in the absence of obstructions compared to 0.787 in occluded environments.
In addition, the comparison of GRU and LSTM in shaded and no occlusion environments demonstrates that, despite the improved performance of these base models in no occlusion scenarios, the improvement is not as significant as that observed with the DAD-LinkNet combined version. For example, the accuracy of GRU model is 0.576 in the no-occlusion environment, which represents only a minor improvement over 0.552 in the occlusion environment. This emphasizes that the adoption of advanced model structures is necessary to enhance the accuracy of POIs identification in complex urban environments, especially in mountainous cities such as Chongqing.

3.3. Comparative Validation of Ablation Experiments

3.3.1. Comparison of Different Parameters

A series of experiments were designed to evaluate the impact of different network architectures and their parameter adjustments on model performance. Multiple network configurations including LSTM, GRU, DAD-LinkNe, DAD-LinkNet + LSTM, and DAD-LinkNet + GRU were used, and the parameters including learning rate, batch size, and data enhancement techniques were adjusted. The training time is subject to images of learning rate, batch size, training period, etc., and the current length of a complete training session is about 2 h under the optimal parameter settings.
(1)
Optimizing the learning rate
The learning rate is a critical hyperparameter in training. In the experimental setting, the convergence behavior of the model is controlled by applying the stepped learning rate decay (StepLR) to automatically halve the learning rate every five cycles. The effect of comparing different learning rates is significant: for example, by adjusting the learning rate from 0.01 to 0.001, the average accuracy of the model increases from 0.4715 to 0.913, the F1 score increases from 0.4430 to 0.911, and the intersection ratio (IoU) increases from 0.3330 to 0.856. This suggests that the lower learning rate helps the model to adjust the weights more precisely, avoids premature falling into local optima, and thus significantly improves overall performance. This learning rate adjustment strategy helps the model to quickly approach the potential optimal solution in the early stage of training and later refine the parameter adjustment by gradually reducing the learning rate, thus improving the generalization ability and accuracy of the model on complex tasks.
(2)
Batch size tuning
The batch size directly influences model training stability and memory consumption efficiency. Increasing the batch size to 40 significantly improves the model compared to a batch size of 30, suggesting that larger batch sizes provide more reliable error gradient estimations. However, the smaller batch size, while increasing the exploratory nature of the model and possibly helping to avoid local optima, also affects the overall stability and performance of the model. Optimizing the batch size is crucial for balancing training efficiency and model performance. By specifying the batch size in the DataLoader, one can examine the impact of varying batch sizes on the learning process and the model’s ultimate performance.
(3)
Adaptation of data enhancement
Data augmentation techniques, such as scaling and normalization, enhance the model’s capacity to generalize, particularly in image recognition tasks. Additional data augmentation methods like random rotation, cropping, and color modification are also employed to further enhance model performance.
(4)
Adjustment of Loss Function
The model uses the weighted loss class, a specialized loss function for handling both classification and regression tasks. This class employs cross-entropy loss for classification tasks and mean square error loss for regression tasks. By adjusting the weighting parameters alpha and beta, we balance the significance of different tasks in multi-task learning scenarios, optimizing overall model performance.

3.3.2. Comparison of Different Data Sources

The selection of various data sources in neural network architectures using multimodal data significantly impacts the model’s performance. We conducted a set of experiments to focus exclusively on single data sources for model training and evaluation. This approach enhances our understanding of the distinct impact of different types of POI data on model training and recognition accuracy. Specifically, we trained and tested the model using data from individual gas stations, traffic light intersections, parking lots, tunnels, and straight roadways. With this approach, the utility of each type of data in model training and their impact on the final model performance can be clearly observed.
Table 5, Table 6, Table 7, Table 8 and Table 9 present the accuracy results for training the test model on individual gas stations, traffic light intersections, parking lots, tunnels, and straight roads, respectively.
Using data exclusively from gas stations subjects the model to more stationary and easily identifiable geographical features, leading to more uniform and reliable visual information. The DAD-LinkNet + GRU model demonstrates outstanding performance, with a precision of 0.880, recall of 0.919, F1-score of 0.899, and IoU of 0.836. This indicates that the composite deep learning model effectively extracts key features when dealing with static and clearly characteristic POIs. Despite the subpar performance of the LSTM and GRU models alone, the integration of LinkNet significantly improves recognition accuracy, emphasizing the need to combine visual characteristics with sequential information.
When analyzing data from traffic light intersections, which include both dynamic attributes (such as uninterrupted right turns) and static attributes (such as the requirement to halt for straight ahead or left turns), the DAD-LinkNet + GRU model also demonstrates excellent performance. The model achieves a precision of 0.915, recall of 0.909, F1-score of 0.911, and IoU of 0.855. This highlights the importance of processing both image and trajectory data for POIs with static and dynamic properties to enhance generalization and adaptability.
The DAD-LinkNet + GRU model shows superior performance with parking lot data. The model achieves a precision of 0.918, recall of 0.870, F1-score of 0.898, and IoU of 0.823. The complex patterns of vehicle movements in parking lots make it difficult for a single image-processing model to capture all relevant information with precision. Hence, advanced hybrid models offer significant benefits for managing such data.
In experiments using only tunnel data, which predominantly feature mountains and roads, the distinctive visual characteristics of tunnels pose recognition challenges. Advanced visual processing capabilities are essential. The DAD-LinkNet model and its variations exhibit outstanding performance. For example, the DAD-LinkNet model achieves an accuracy of 0.938 and an IoU of 0.880. The DAD-LinkNet + GRU model attains an F1-score of 0.942 and an IoU of 0.903. These results demonstrate that these models effectively distinguish important road features from surrounding parts when analyzing images with complex backgrounds and similar textures, enhancing overall accuracy in spatial aspect recognition.
For straight roads, advanced image processing models like DAD-LinkNet + LSTM effectively extract features and identify patterns due to the clear and consistent road scene. The model demonstrates outstanding accuracy, evidenced by its precision (0.982), recall (0.970), F1-score (0.975), and IoU (0.954). Although these scenarios may seem simple, accurately understanding and predicting the features of a straight road is essential for autonomous driving technology, ensuring both safety and efficiency. The consistency and dependability of these data provide a solid foundation for training models and help reduce model overfitting in more complex scenarios.

3.4. Evaluation of the Analysis of the Overall Results in the Experimental Area

This study focused on the intricate topographic characteristics of Chongqing Municipality, an area renowned for its rugged, hilly terrain and varied visual scenery. Through a comprehensive analysis of different network architectures and data sources, this section evaluated in depth the effectiveness and applicability of various models in practical scenarios.
The experimental results demonstrated that while a single model could achieve high recognition accuracy with a single data type (such as image-only or trajectory-only data), hybrid models exhibited more notable performance in complex situations. For instance, when paired with LSTM or GRU, the DAD-LinkNet model excelled in extracting image features and effectively handling time-series data, leading to a more comprehensive understanding of the context. This capacity was particularly crucial for handling the intricate topography and interconnected visual data in Chongqing Municipality.
The influence of geographical characteristics on model performance was particularly noticeable, as significant variations in performance were observed between regions with and without trees or buildings obstructing the view. In occluded complex terrain, the model faced greater challenges because these regions were not only visually more complex but may also have potentially provided more trajectory data, increasing the complexity of the analysis. Hybrid models generally outperformed masked regions in unoccluded regions. This was because when handling occluded scenes, the model needed to rely on richer context information for accurate identification. The hybrid model successfully met this challenge by effectively using images and trajectory data, demonstrating its superior adaptability and high recognition accuracy.
Moreover, the experimental multimodal method was well suited for recognizing POIs in mountainous cities like Chongqing. This combination of visual and dynamic information significantly improved the overall performance of the model, even under challenging conditions. The results helped us understand and enhance methods for POI recognition in applications like autonomous driving and geographic information systems (GISs), particularly in complex or unpredictable visual environments. This not only helped to improve the reliability of these systems, but it also was important for promoting the development and optimization of related technologies.

4. Conclusions and Outlook

This study introduces a hybrid neural network approach for efficiently recognizing POIs in the road networks of urban areas with complex terrain, with experiments conducted in the central urban district of Chongqing, leveraging complex topography and multi-source data. By integrating the geometric features from remote sensing imagery and the dynamic traffic characteristics from vehicle trajectory data, the effectiveness of the hybrid model in POI recognition is validated. The experimental results demonstrate that the hybrid model exhibits superior performance under both obstructed and unobstructed terrain conditions, underscoring its adaptability and robustness in complex terrain settings. Additionally, comparisons between single models and multimodal models under various terrain and obstruction scenarios further confirm the high efficiency of the proposed DualNet-PoiD model in integrating multi-source information. These findings not only showcase significant performance improvements in the model under optimal parameter settings but also highlight its potential in practical applications for recognizing typical network POIs such as gas stations and parking lots. Although visual analysis is not extensively utilized, the current methodology provides a solid empirical foundation for the validation of the model.
The foremost advantage of the model lies in its ability to significantly enhance the accuracy and coverage of POI recognition, particularly in urban environments where physical obstructions are prevalent. By autonomously analyzing remote sensing data and vehicle trajectory data, the DualNet-PoiD model reduces the costs associated with model training and application without the need for manual data labeling. Furthermore, the model demonstrates exceptional adaptability, capable of adjusting to and responding to diverse urban terrains and complex environmental conditions, thereby maintaining high recognition precision.
Despite the multiple strengths exhibited by DualNet-PoiD, it does face some limitations. Firstly, the model’s reliance on substantial computational resources may hinder its deployment in scenarios with limited resources. Secondly, due to the complexity of the model’s structure, which involves advanced deep learning functionalities, tuning and maintenance pose significant challenges.
Future research could be directed towards enhancing the accuracy and application scope of the hybrid model introduced in this article for POI recognition using remote sensing imagery and vehicle trajectory data within road networks. Considering the challenges posed by mountainous terrains and other unique geographical features on POI recognition, forthcoming efforts could concentrate on refining the model and its processing capabilities. The integration of advanced methods such as the U-Net [43] model or mamba [44] may facilitate better handling of these environmental variables. Additionally, the exploration of further visual analysis techniques could significantly improve the model’s interpretability and user trust.

Author Contributions

Conceptualization and design framework, Y.Z. and J.L.; Designing research methods, C.L.; validation, Y.W.; Formal analysis, W.Y.; Writing-original draft preparation, C.L.; writing-review and editing, Y.Z.; visualization, C.L.; Supervision, Y.Z. All authors have read and agreed to the published version of the manuscript.

Funding

Funded by State Key Laboratory of Geo-Information Engineering and Key Laboratory of Surveying and Mapping Science and Geospatial Information Technology, MNR, NO. 2022-05-1.

Data Availability Statement

The original data presented in the study are openly available in Github at https://github.com/longlongcx/remote-sensing.git.

Conflicts of Interest

The authors declare no conflict of interest.

References

  1. Bastani, F.; Madden, S. Beyond road extraction: A dataset for map update using aerial images. In Proceedings of the IEEE/CVF International Conference on Computer Vision, Montreal, BC, Canada, 11–17 October 2021; pp. 11905–11914. [Google Scholar]
  2. Stanojevic, R.; Abbar, S.; Thirumuruganathan, S.; De Francisci Morales, G.; Chawla, S.; Filali, F.; Aleimat, A. Road network fusion for incrementaal map updates. In Proceedings of the Progress in Location Based Services; Springer: Cham, Switzerland, 2018; Volume 14, pp. 91–109. [Google Scholar]
  3. Xiao, Y.; Tan, T.-S.; Tay, S.-C. Utilizing edge to extract roads in high-resolution satellite imagery. In Proceedings of the IEEE International Conference on Image Processing, Genoa, Italy, 11–14 September 2005; p. I-637. [Google Scholar]
  4. Singh, P.P.; Garg, R.D. A two-stage framework for road extraction from high-resolution satellite images by using prominent features of impervious surfaces. Int. J. Remote Sens. 2014, 35, 8074–8107. [Google Scholar] [CrossRef]
  5. Xiaoqin, H.; Min, Q.; Dajian, L.; Guoyun, L.; Yi, W. The model of extracting the height of buildings by shadow in image. In Proceedings of the 2011 International Conference on Computer Science and Network Technology, Harbin, China, 24–26 December 2011; pp. 2150–2153. [Google Scholar]
  6. Kaur, R.; Sharma, D.; Verma, A. Enhance satellite image classification based on fuzzy clustering and Marr-Hildreth algorithm. In Proceedings of the 2017 4th International Conference on Signal Processing, Computing and Control (ISPCC), Solan, India, 21–23 September 2017; pp. 130–137. [Google Scholar]
  7. Cai, W.; Wei, Z.; Liu, R.; Zhuang, Y.; Wang, Y.; Ning, X. Remote sensing image recognition based on multi-attention residual fusion networks. ASP Trans. Pattern Recognit. Intell. Syst. 2021, 1, 1–8. [Google Scholar] [CrossRef]
  8. Qi, J.; Chen, H.; Chen, F. Extraction of landslide features in UAV remote sensing images based on machine vision and image enhancement technology. Neural Comput. Appl. 2022, 34, 12283–12297. [Google Scholar] [CrossRef]
  9. Cui, X.; Zou, C.; Wang, Z. Remote sensing image recognition based on dual-channel deep learning network. Multimed. Tools Appl. 2021, 80, 27683–27699. [Google Scholar] [CrossRef]
  10. He, C.; Zheng, M. Cloud-edge collaboration feature extraction framework in satellite multi-access edge computing. In Proceedings of the 2021 IEEE 11th International Conference on Electronics Information and Emergency Communication (ICEIEC), Beijing, China, 18–20 June 2021; pp. 61–64. [Google Scholar]
  11. Li, J.; Qin, Q.; Xie, C.; Zhao, Y. Integrated use of spatial and semantic relationships for extracting road networks from floating car data. Int. J. Appl. Earth Obs. Geoinf. 2012, 19, 238–247. [Google Scholar] [CrossRef]
  12. Zheng, K.; Zhu, D. A novel clustering algorithm of extracting road network from low-frequency floating car data. Clust. Comput. 2019, 22, 12659–12668. [Google Scholar] [CrossRef]
  13. Zhang, Y.; Zhang, Z.; Huang, J.; She, T.; Deng, M.; Fan, H.; Xu, P.; Deng, X. A hybrid method to incrementally extract road networks using spatio-temporal trajectory data. ISPRS Int. J. Geo-Inf. 2020, 9, 186. [Google Scholar] [CrossRef]
  14. Chen, Y.; Chen, C.; Wu, Q.; Ma, J.; Zhang, G.; Milton, J. Spatial-temporal traffic congestion identification and correlation extraction using floating car data. J. Intell. Transp. Syst. 2021, 25, 263–280. [Google Scholar] [CrossRef]
  15. Guo, Y.; Li, B.; Lu, Z.; Zhou, J. A novel method for road network mining from floating car data. Geo-Spat. Inf. Sci. 2022, 25, 197–211. [Google Scholar] [CrossRef]
  16. Sun, D.; Leurent, F.; Xie, X. Mining vehicle trajectories to discover individual significant places: Case study using floating car data in the Paris region. Transp. Res. Rec. 2021, 2675, 1–9. [Google Scholar] [CrossRef]
  17. Hu, S.; Gao, S.; Wu, L.; Xu, Y.; Zhang, Z.; Cui, H.; Gong, X. Urban function classification at road segment level using taxi trajectory data: A graph convolutional neural network approach. Comput. Environ. Urban Syst. 2021, 87, 101619. [Google Scholar] [CrossRef]
  18. Huang, Y.; Xiao, Z.; Wang, D.; Jiang, H.; Wu, D. Exploring individual travel patterns across private car trajectory data. IEEE Trans. Intell. Transp. Syst. 2019, 21, 5036–5050. [Google Scholar] [CrossRef]
  19. Xiao, Z.; Xu, S.; Li, T.; Jiang, H.; Zhang, R.; Regan, A.C.; Chen, H. On extracting regular travel behavior of private cars based on trajectory data analysis. IEEE Trans. Veh. Technol. 2020, 69, 14537–14549. [Google Scholar] [CrossRef]
  20. Li, Y.; Xiang, L.; Zhang, C.; Wu, H.; Gong, J. Multi-level fusion of vehicle trajectories and remote sensing images for road intersection recognition. J. Surv. Mapp. 2021, 50, 1546–1557. [Google Scholar]
  21. Fang, Z.; Zhong, H.; Zou, X. Urban Road Extraction by Combining Trajectory Continuity and Image Feature Similarity. Acta Geod. Cartogr. Sin. 2020, 49, 1554–1563. [Google Scholar]
  22. Qian, Z.; Liu, X.; Tao, F.; Zhou, T. Identification of urban functional areas by coupling satellite images and taxi GPS trajectories. Remote Sens. 2020, 12, 2449. [Google Scholar] [CrossRef]
  23. Qin, J.; Yang, W.; Wu, T.; He, B.; Xiang, L. Incremental road network update method with trajectory data and UAV remote sensing imagery. ISPRS Int. J. Geo-Inf. 2022, 11, 502. [Google Scholar] [CrossRef]
  24. Wang, S.; Wang, Z.; Ruan, S.; Han, H.; Xiong, K.; Yuan, H.; Yuan, Z.; Li, G.; Bao, J.; Zheng, Y. DelvMap: Completing Residential Roads in Maps Based on Couriers’ Trajectories and Satellite Imagery. IEEE Trans. Geosci. Remote Sens. 2024, 62, 5800514. [Google Scholar] [CrossRef]
  25. Yang, J.; Ye, X.; Wu, B.; Gu, Y.; Wang, Z.; Xia, D.; Huang, J. DuARE: Automatic road extraction with aerial images and trajectory data at Baidu maps. In Proceedings of the 28th ACM SIGKDD Conference on Knowledge Discovery and Data Mining, Washington, DC, USA, 14–18 August 2022; pp. 4321–4331. [Google Scholar]
  26. Wu, H.; Zhang, H.; Zhang, X.; Sun, W.; Zheng, B.; Jiang, Y. DeepDualMapper: A gated fusion network for automatic map extraction using aerial images and trajectories. In Proceedings of the AAAI Conference on Artificial Intelligence, New York, NY, USA, 7–12 February 2020; pp. 1037–1045. [Google Scholar]
  27. Li, Y.; Xiang, L.; Zhang, C.; Wu, H. Fusing taxi trajectories and RS images to build road map via DCNN. IEEE Access 2019, 7, 161487–161498. [Google Scholar] [CrossRef]
  28. Badrinarayanan, V.; Kendall, A.; Cipolla, R. Segnet: A deep convolutional encoder-decoder architecture for image segmentation. IEEE Trans. Pattern Anal. Mach. Intell. 2017, 39, 2481–2495. [Google Scholar] [CrossRef]
  29. Zhou, L.; Zhang, C.; Wu, M. D-LinkNet: LinkNet with pretrained encoder and dilated convolution for high resolution satellite imagery road extraction. In Proceedings of the IEEE Conference on Computer Vision and Pattern Recognition Workshops, Salt Lake City, UT, USA, 18–23 June 2018; pp. 182–186. [Google Scholar]
  30. Shao, Z.; Zhou, Z.; Huang, X.; Zhang, Y. MRENet: Simultaneous extraction of road surface and road centerline in complex urban scenes from very high-resolution images. Remote Sens. 2021, 13, 239. [Google Scholar] [CrossRef]
  31. Lu, X.; Zhong, Y.; Zheng, Z.; Liu, Y.; Zhao, J.; Ma, A.; Yang, J. Multi-scale and multi-task deep learning framework for automatic road extraction. IEEE Trans. Geosci. Remote Sens. 2019, 57, 9362–9377. [Google Scholar] [CrossRef]
  32. Zhou, M.; Sui, H.; Chen, S.; Wang, J.; Chen, X. BT-RoadNet: A boundary and topologically-aware neural network for road extraction from high-resolution remote sensing imagery. ISPRS J. Photogramm. Remote Sens. 2020, 168, 288–306. [Google Scholar] [CrossRef]
  33. Xiong, W.; Jia, X.; Yang, D.; Ai, M.; Li, L.; Wang, S. DP-LinkNet: A convolutional network for historical document image binarization. KSII Trans. Internet Inf. Syst. (TIIS) 2021, 15, 1778–1797. [Google Scholar]
  34. Gao, L.; Wang, J.; Wang, Q.; Shi, W.; Zheng, J.; Gan, H.; Lv, Z.; Qiao, H. Road extraction using a dual attention dilated-linknet based on satellite images and floating vehicle trajectory data. IEEE J. Sel. Top. Appl. Earth Obs. Remote Sens. 2021, 14, 10428–10438. [Google Scholar] [CrossRef]
  35. Li, B.; Gao, J.; Chen, S.; Lim, S.; Jiang, H. DF-DRUNet: A decoder fusion model for automatic road extraction leveraging remote sensing images and GPS trajectory data. Int. J. Appl. Earth Obs. Geoinf. 2024, 127, 103632. [Google Scholar] [CrossRef]
  36. Shimabukuro, M.; Dal Poz, A. Deep Learning Multimodal Fusion for Road Network Extraction: Context and Contour improvement. IEEE Geosci. Remote Sens. Lett. 2023, 20, 5001705. [Google Scholar]
  37. Roy, S.K.; Deria, A.; Hong, D.; Rasti, B.; Plaza, A.; Chanussot, J. Multimodal fusion transformer for remote sensing image classification. IEEE Trans. Geosci. Remote Sens. 2023, 61, 5515620. [Google Scholar] [CrossRef]
  38. Ma, X.; Zhang, X.; Pun, M.-O.; Liu, M. A multilevel multimodal fusion transformer for remote sensing semantic segmentation. IEEE Trans. Geosci. Remote Sens. 2024, 62, 5403215. [Google Scholar] [CrossRef]
  39. Qin, Z.; Zhang, P.; Wu, F.; Li, X. Fcanet: Frequency channel attention networks. In Proceedings of the IEEE/CVF International Conference on Computer Vision, Montreal, QC, Canada, 10–17 October 2024; pp. 783–792. [Google Scholar]
  40. Zhao, H.; Zhang, Y.; Liu, S.; Shi, J.; Loy, C.C.; Lin, D.; Jia, J. Psanet: Point-wise spatial attention network for scene parsing. In Proceedings of the European Conference on Computer Vision (ECCV), Munich, Germany, 8–14 September 2018; pp. 267–283. [Google Scholar]
  41. Dey, R.; Salem, F.M. Gate-variants of gated recurrent unit (GRU) neural networks. In Proceedings of the 2017 IEEE 60th International Midwest Symposium on Circuits and Systems (MWSCAS), Boston, MA, USA, 6–9 August 2017; pp. 1597–1600. [Google Scholar]
  42. Jiping, L.; Yong, W.; Caixia, L.; Wanzeng, L.; Yuchuan, Z.; Yandong, W. Automatic Identification of POIs in Typical Road Networks Based on Multimodal Data Fusion. Surv. Mapp. Geogr. Inf. 2024, 49, 1–7. [Google Scholar] [CrossRef]
  43. Wang, L.; Li, R.; Zhang, C.; Fang, S.; Duan, C.; Meng, X.; Atkinson, P.M. UNetFormer: A UNet-like transformer for efficient semantic segmentation of remote sensing urban scene imagery. ISPRS J. Photogramm. Remote Sens. 2022, 190, 196–214. [Google Scholar] [CrossRef]
  44. Chen, K.; Chen, B.; Liu, C.; Li, W.; Zou, Z.; Shi, Z. Rsmamba: Remote sensing image classification with state space model. IEEE Geosci. Remote Sens. Lett. 2024, 21, 8002605. [Google Scholar] [CrossRef]
Figure 1. Typical road network POI automatic identification framework based on multi-modal data fusion.
Remotesensing 16 03003 g001
Figure 2. The overall structure of the typical road network POI automatic recognition neural network.
Remotesensing 16 03003 g002
Figure 3. Remote sensing image filtering and normalization process.
Remotesensing 16 03003 g003
Figure 4. Preprocessed images of gas stations, traffic light intersections, parking lots and tunnels: (a) preprocessed images of gas stations; (b) preprocessed images of traffic light intersections; (c) preprocessed images of parking lots; (d) preprocessed images of tunnels.
Remotesensing 16 03003 g004
Figure 5. Images of gas stations, traffic light intersections, parking lots and tunnels obscured by trees or buildings: (a) images of gas stations obscured by trees or buildings; (b) images of traffic light intersections obscured by trees or buildings; (c) images of parking lots obscured by trees or buildings; (d) images of tunnels obscured by trees or buildings.
Remotesensing 16 03003 g005aRemotesensing 16 03003 g005b
Table 1. Vehicle trajectory data filter criteria.
POIsTrajectory Selection Conditions
Gas stations
  • The trajectory passes through the gas station area;
  • The trajectory stays in the gas station area for more than 300 s less than 1200 s;
  • The trajectory contains at least five localization points.
Traffic light intersections
  • The trajectory passes through the area of a traffic light intersection area;
  • The trajectory stays in the area of the stoplight station for more than 45 s;
  • The trajectory contains at least five localization points.
Parking lots
  • The trajectory passes through the parking lot area;
  • The trajectory stays in the parking lot area for more than 1800 s;
  • The trajectory contains at least five localization points.
Tunnels
  • The trajectory passes through the tunnel area;
  • The trajectory does not remain in the parking lot area for more than 24 s;
  • The trajectory contains at least five localization points.
Straight roads
  • The trajectory contains at least five localization points;
  • The trajectory is uniformly continuous;
  • Does not meet the gas station training sample requirements;
  • Does not meet the parking lot training sample requirement;
  • Does not meet the tunnel training sample requirement;
  • Does not meet the traffic light intersection training sample requirements.
Table 2. Schematic results of different model runs.
ModelPrecisionRecallF1-ScoreIoU
LSTM0.8270.7970.7800.730
GRU0.7490.7350.7180.661
DAD—LinkNet0.6710.6680.6650.519
DAD—LinkNet + LSTM0.8930.8880.8890.812
DAD—LinkNet + GRU0.9130.9120.9110.856
Table 3. Schematic results of different model runs in the shaded area.
ModelPrecisionRecallF1-ScoreIoU
LSTM0.5590.6120.5800.548
GRU0.5520.6070.5650.530
DAD—LinkNet0.6780.6210.6000.474
DAD—LinkNet + LSTM0.8580.8410.8400.787
DAD—LinkNet + GRU0.8880.8830.8750.853
Table 4. Schematic results of different model runs in the unshaded area.
ModelPrecisionRecallF1-ScoreIoU
LSTM0.5990.6370.6080.580
GRU0.5760.6180.5940.557
DAD—LinkNet0.6570.6520.6310.529
DAD—LinkNet + LSTM0.9130.8920.8890.855
DAD—LinkNet + GRU0.8540.8440.8350.785
Table 5. Schematic results of different model runs with a single use of gas station data.
ModelPrecisionRecallF1-ScoreIoU
LSTM0.4790.3120.3660.234
GRU0.5070.3800.4280.282
DAD—LinkNet0.8690.8860.8770.796
DAD—LinkNet + LSTM0.8590.9150.8860.810
DAD—LinkNet + GRU0.8800.9190.8990.836
Table 6. Schematic results of different model runs with a single use of traffic light intersection data.
ModelPrecisionRecallF1-ScoreIoU
LSTM0.5660.6330.5940.435
GRU0.6540.6680.6560.502
DAD—LinkNet0.8240.8340.8280.732
DAD—LinkNet + LSTM0.9000.8780.8870.811
DAD—LinkNet + GRU0.9150.9090.9110.855
Table 7. Schematic results of different model runs with a single use of parking lot data.
ModelPrecisionRecallF1-ScoreIoU
LSTM0.3560.2630.3020.178
GRU0.8040.7400.7680.643
DAD—LinkNet0.8210.7830.8010.702
DAD—LinkNet + LSTM0.8950.8550.8730.788
DAD—LinkNet + GRU0.9180.8700.8980.823
Table 8. Schematic results of different model runs with a single use of tunnel data.
ModelPrecisionRecallF1-ScoreIoU
LSTM0.6010.2950.3610.233
GRU0.6180.3810.4400.292
DAD—LinkNet0.9380.9310.9340.880
DAD—LinkNet + LSTM0.9330.8400.9360.887
DAD—LinkNet + GRU0.9350.9510.9420.903
Table 9. Schematic results of different model runs with a single use of straight road data.
ModelPrecisionRecallF1-ScoreIoU
LSTM0.5050.8930.6340.473
GRU0.5530.8860.6740.518
DAD—LinkNet0.9550.9700.9620.933
DAD—LinkNet + LSTM0.9820.9700.9750.954
DAD—LinkNet + GRU0.9800.9650.9710.949
Disclaimer/Publisher’s Note: The statements, opinions and data contained in all publications are solely those of the individual author(s) and contributor(s) and not of MDPI and/or the editor(s). MDPI and/or the editor(s) disclaim responsibility for any injury to people or property resulting from any ideas, methods, instructions or products referred to in the content.

