Communication

Optical-to-SAR Translation Based on CDA-GAN for High-Quality Training Sample Generation for Ship Detection in SAR Amplitude Images

1
School of Electronics and Information, Northwestern Polytechnical University, Xi’an 710072, China
2
School of Automation, Central South University, Changsha 410083, China
*
Author to whom correspondence should be addressed.
These authors contributed equally to this work.
Remote Sens. 2024, 16(16), 3001; https://doi.org/10.3390/rs16163001
Submission received: 26 July 2024 / Revised: 13 August 2024 / Accepted: 14 August 2024 / Published: 15 August 2024

Abstract

:
Abundant datasets are critical to train models based on deep learning technologies for ship detection applications. Compared with optical images, ship detection based on synthetic aperture radar (SAR) (especially the high-Earth-orbit spaceborne SAR launched recently) lacks enough training samples. A novel cross-domain attention GAN (CDA-GAN) model is proposed for optical-to-SAR translation, which can generate high-quality SAR amplitude training samples of a target by optical image conversion. This high quality includes high geometry structure similarity of the target compared with the corresponding optical image and low background noise around the target. In the proposed model, the cross-domain attention mechanism and cross-domain multi-scale feature fusion are designed to improve the quality of samples for detection based on the generative adversarial network (GAN). Specifically, a cross-domain attention mechanism is designed to simultaneously emphasize discriminative features from optical images and SAR images at the same time. Moreover, a designed cross-domain multi-scale feature fusion module further emphasizes the geometric information and semantic information of the target in a feature graph from the perspective of global features. Finally, a reference loss is introduced in CDA-GAN to completely retain the extra features generated by the cross-domain attention mechanism and cross-domain multi-scale feature fusion module. Experimental results demonstrate that the training samples generated by the proposed CDA-GAN can obtain higher ship detection accuracy using real SAR data than the other state-of-the-art methods. The proposed method is generally available for different orbit SARs and can be extended to the high-Earth-orbit spaceborne SAR case.

Graphical Abstract

1. Introduction

The synthetic aperture radar (SAR) technique has already been widely used in remote sensing applications due to its all-weather property [1,2,3]. In 2023, the world’s first geosynchronous Earth-orbit synthetic aperture radar (SAR) was launched successfully in China. Currently, these high-Earth-orbit spaceborne SAR data have not been released publicly. Compared with conventional low-orbit spaceborne SARs, the high-Earth-orbit spaceborne SAR has the advantages of large coverage and short revisit time. Consequently, the high-Earth-orbit spaceborne SAR has the stronger potential ability to monitor targets. In object detection applications, enough training samples are very important for the robustness of the training model for machine learning methods. However, object detection based on the high-Earth-orbit spaceborne SAR currently lacks enough training samples. Considering the convenience of obtaining optical images, if optical images can be converted into corresponding high-Earth-orbit spaceborne SAR training images, which have features (such as texture, gray, etc.) of a similar statistical distribution as the real SAR image, the ability to detect objects based on high-Earth-orbit spaceborne SAR images will be greatly improved due to the large amount of training samples. Considering that the data acquisitions of the high-Earth-orbit spaceborne SAR are sorely lacking, this paper will focus on the general method of optical-to-SAR translation for ship detection, which can be easily transferred to the high-Earth-orbit spaceborne SAR case.
Image-to-image (I2I) translation techniques have already been widely used in some applications, such as image colorization, image super-resolution [4], and domain adaptation [5]. In the field of transfer learning, many works start with the related issues of transferring knowledge where the target domain information is incomplete [6,7]. The emergence of the generative adversarial network (GAN) exploits image generative methods [8], which can generate the corresponding image in I2I translation. The structure of GANs are based on a current popular deep network, called Convolutional Neural Network (CNN) [9,10]. The current I2I translation methods include supervised and unsupervised learning approaches [5,11,12,13]. For the supervised approach, corresponding image pairs in different domains are critical [14], which severely limits their applications. In the unsupervised approach, source and target image sets can be unpaired and completely independent from each other, which addresses the lack of paired images [15,16]. Currently, there are some typical unsupervised I2I techniques based on GANs [14,17,18,19,20,21,22,23,24,25], such as Multi-modal Unsupervised Image-to-Image Translation (MUNIT), CycleGAN, Geometry-consistent Generative Adversarial Network (GcGAN), Self-Attention Generative Adversarial Network (SaGAN), and so on. In addition, the Denoising Diffusion Probabilistic Model (DDPM) methods can also be used for image generation [26,27].
In optical-to-SAR translation applied to training sample generation for ship detection, the statistical image style of the converted SAR amplitude images from optical images should have a high similarity with that of the real SAR datasets. Furthermore, the feature of the ship’s statistical geometry structure in the converted SAR amplitude images from optical images should have high similarity with that in the real optical datasets [28,29]. Simultaneously, the background noise around the ship in the converted SAR amplitude images should be suppressed effectively. Due to the large difference of the imaging mechanisms between the SAR image and optical image, the images translated by the previous methods still face some problems. Firstly, sometimes, the feature of gray level of the background is converted into the feature of gray level of the target, or the feature of the gray level of the target will be converted into the feature of the gray level of background. Consequently, the boundary performance in the converted image is extremely poor. Then, the background and the target cannot be distinguished. In addition, there is a lot of noise information in the converted background. Furthermore, the specific feature of the converted target is not obvious enough. These disadvantages will interfere with the detection performance of the target.
To solve the above problems, a novel optical-to-SAR translation method based on CDA-GAN is proposed for high-quality training sample generation, which can obviously improve the target detection performance in the real SAR image. First, the feasibility of cross-domain attention for image generation tasks was investigated and a cross-domain attention network was designed for multi-domain feature fusion. Specifically, by setting essential elements of Transformer from different domains simultaneously, the multi-domain image feature fusion was achieved. Next, considering the discrimination influence between image size and the object size, a multi-scale feature fusion module [30,31,32] was combined from different domains to realize the joint alignment of multiple receptive fields. Finally, a loss function that balances the generated image and the multi-domain fused reference image is proposed to supplement the information of the generated image to achieve a more realistic cross-domain image. The feature fusion methods have already been used in some SAR applications [33,34,35,36,37]. However, they are different from the cross-domain image generation discussed in this paper. In addition, unlike the attention modules used in previous GAN-based methods, this paper focuses on how to combine the semantic information in two different domains (cross-domain), which is helpful for higher detection accuracy.
The main contributions are summarized as follows:
  • An unsupervised optical-to-SAR translation framework named CDA-GAN is proposed to accomplish the high-quality training sample generation, by which the performance of target detection in the SAR domain can be improved;
  • A cross-domain attention mechanism was designed to simultaneously emphasize discriminative information between the source and target domains, thus strengthening the consistency of information between these two domains and enhancing the performance of cross-domain image fusion;
  • A cross-domain multi-scale feature fusion module (CDMSFFM) was designed to consider the consistency of low-level features and high-level features at a global level, by which the perception performance of objects at multiple scales in the source domain can be enhanced;
  • An optical and SAR dataset with similar semantic and morphological features was refined from several existing benchmark datasets for the ship detection task based on the proposed CDA-GAN, including the DIOR, LEVIR, and Airbus Ship Detection datasets.
Figure 1 is the overall procedure of the experiment. Firstly, we need to train the proposed CDA-GAN using some initial real optical and SAR images. Then, we can input the real optical images (not limited to the above initial optical images) into CDA-GAN to generate some new SAR images as training samples for final object detection applications. The typical object detectors, such as YOLO or Faster-RCNN, can be used for detection experiments. The remaining sections of this paper are organized as follows. Section 2 introduces the proposed method. Section 3 presents the experimental results and analysis. Section 4 is the conclusion.

2. Proposed Method

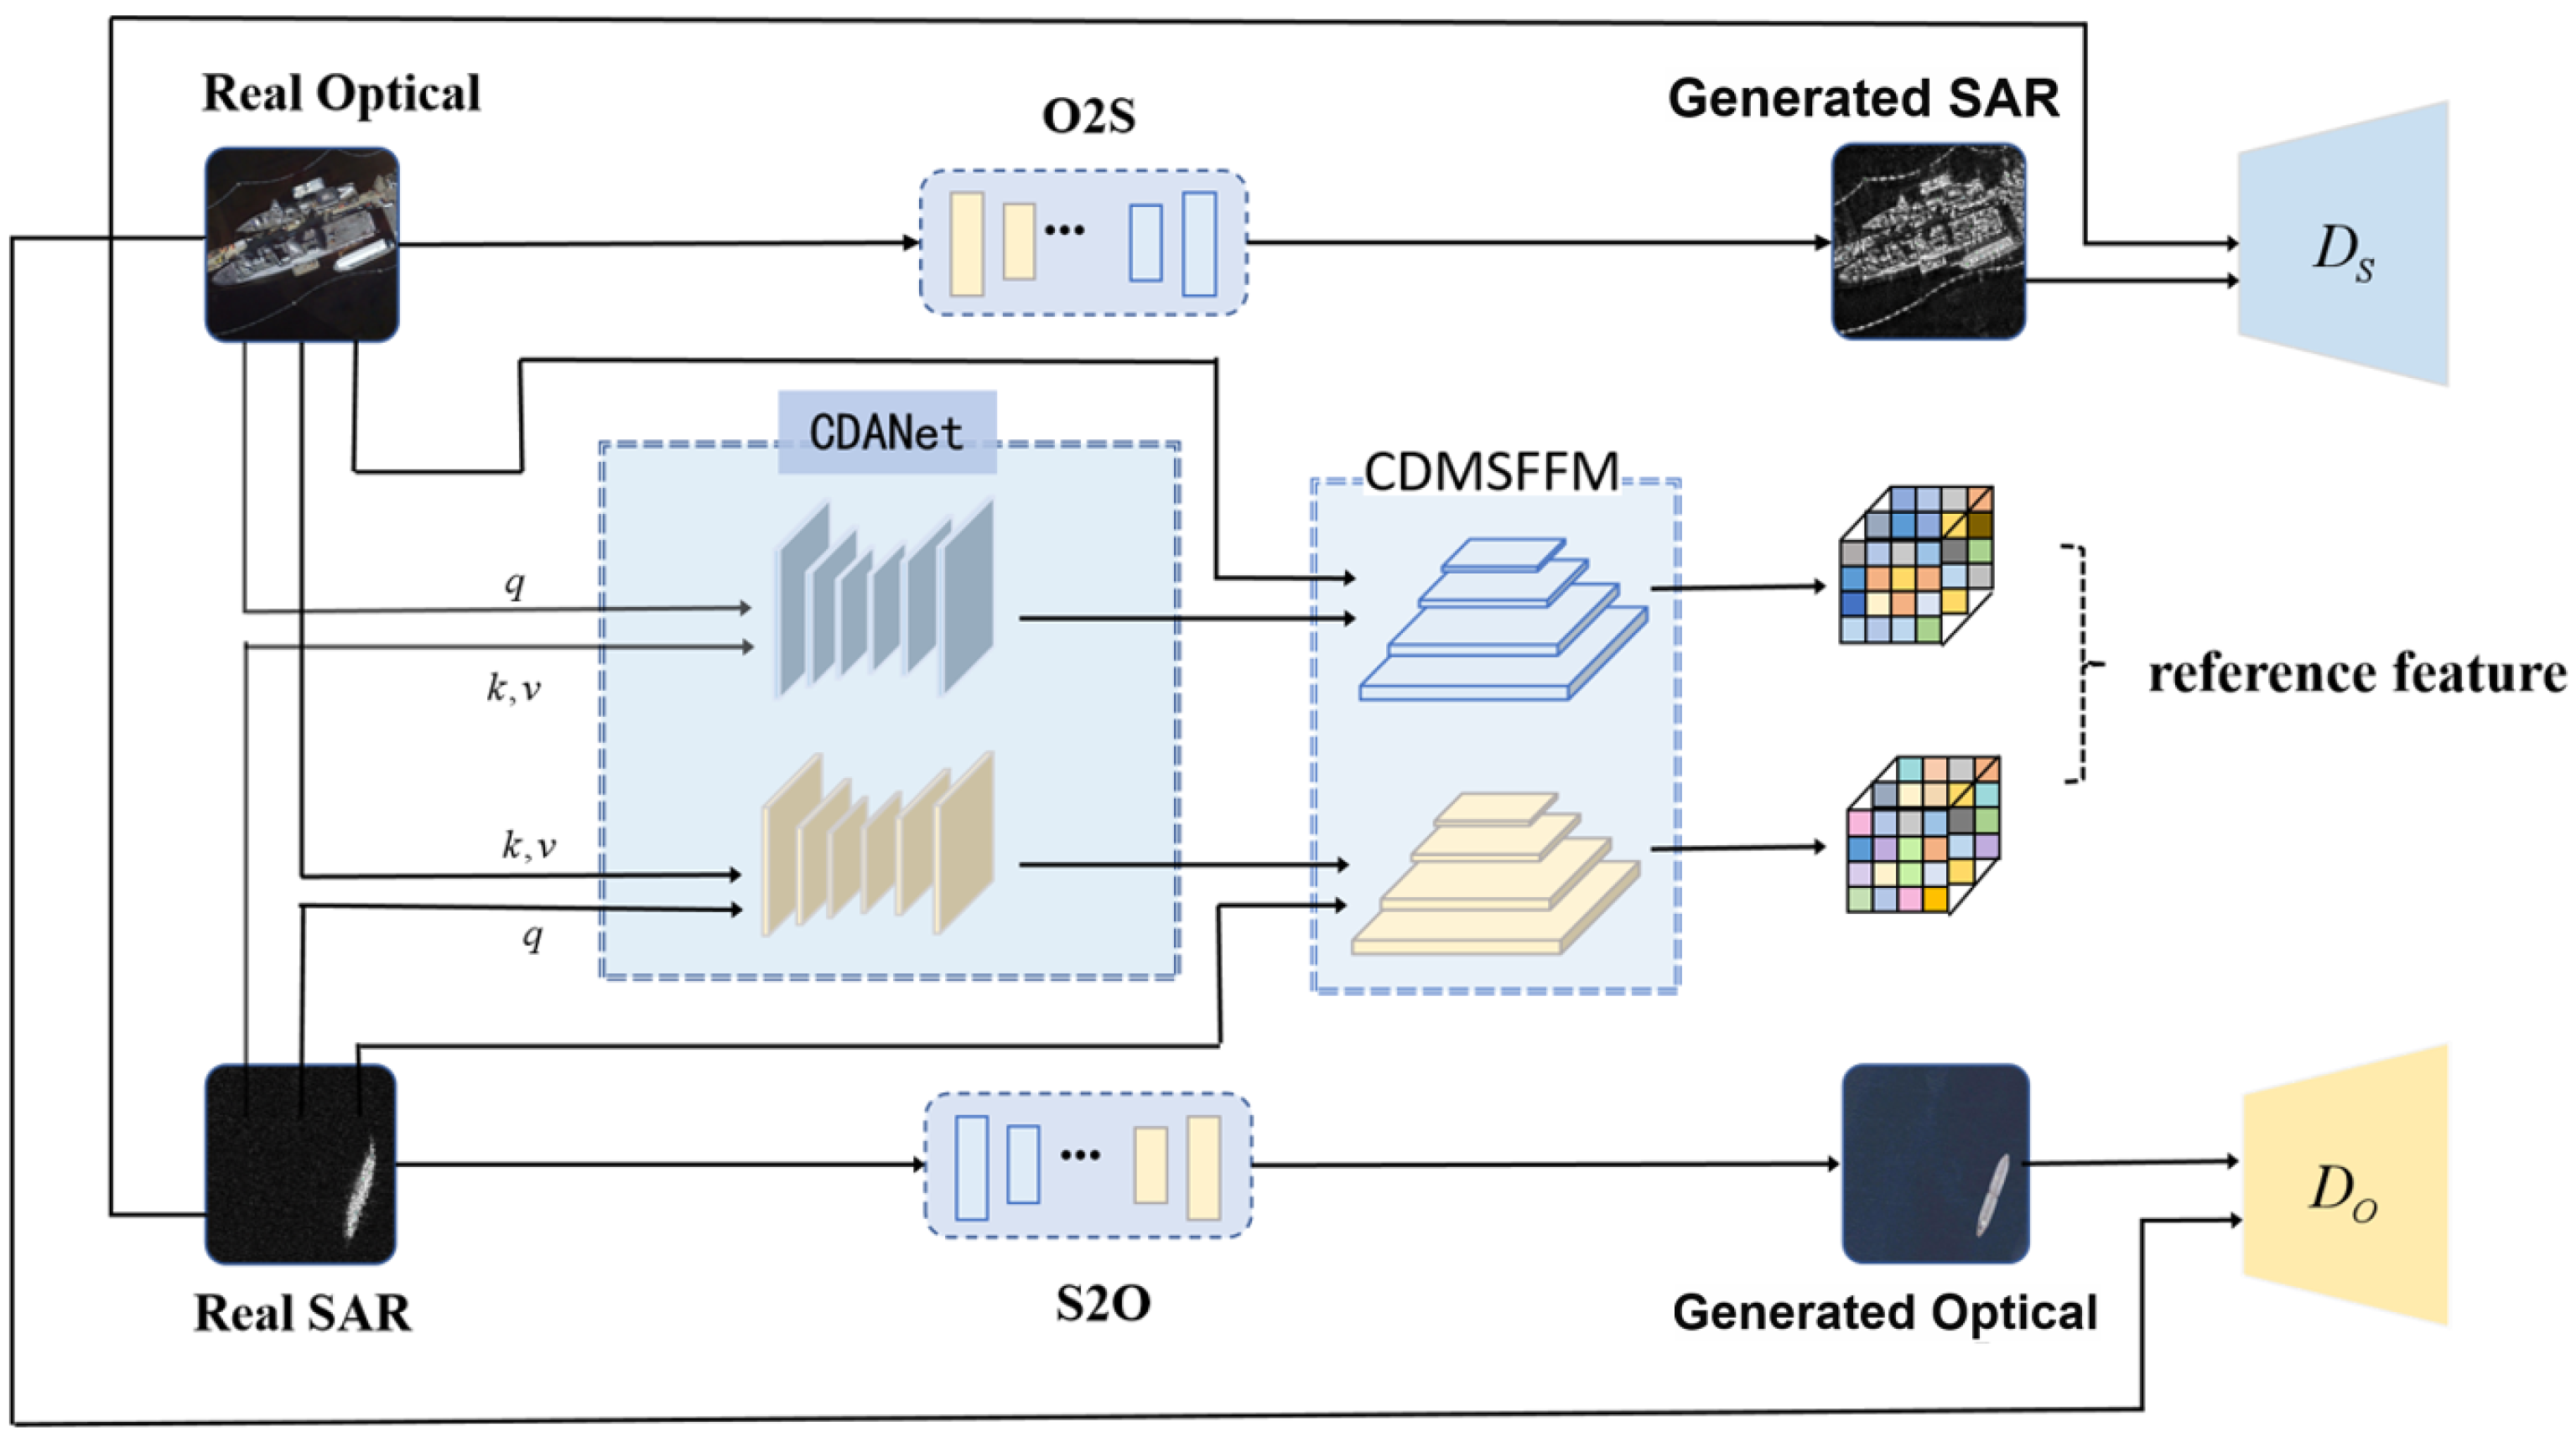
2.1. Overall Framework of CDA-GAN

The proposed CDA-GAN for optical–SAR image translation is shown in Figure 2, where O2S (S2O) and D S ( D O ) represent the generator and discriminator of the SAR (optical) domain in GAN, respectively.
First, the features from the optical and SAR domains are fused in the form of attention to obtain the main feature distribution of one domain and the content display of the other domain, which are named reference images after CDMSFFM. Second, the L1 norm is used to calculate the difference between reference image of the corresponding domain and image generated by the generator to obtain the reference loss. Third, discriminators are used to judge whether the image is a real image, performing confrontational learning with the generator. In the training process, cross-domain attention is combined with cycle consistency loss to generate deeper features of the corresponding domain, and the reference loss is added to the loss function to train the whole network. The differences of features (such as scattering mechanism, etc.) between SAR and optical images are learned automatically by CDA-GAN. The details of the proposed CDA-GAN, including CDANet, CDMSFFM, and the loss function, are presented in what follows.

2.2. Cross-Domain Attention Net (CDANet)

First, features are extracted from images in the optical domain and SAR domain through the CNNs to obtain features of different sizes, called main feature layers, which are the following: f 1 , measuring 32 × 32; f 2 , measuring 64 × 64; f 3 , measuring 128 × 128; and f 4 , measuring 256 × 256. Among all main feature layers, f 1 is used as one of the inputs to obtain a cross-domain attention feature map. Then, a cross-domain attention feature map goes through a cross-domain pyramid structure for feature fusion to obtain a reference image. I o R H × W × C and I s R H × W × C , with height H, width W, and channels C, represent the intermediate feature space in the optical and SAR domain, respectively. As shown in Figure 3, the first map I o is set to query Q R H × W × C . By using 1 × 1 convolutions, I s is set to the key K R H × W × C and value V R H × W × C . Afterwards, the initial correspondence A R H W × H W is learned following the traditional attention mechanism:
A ( m , n ) = Q ˜ ( m ) K ˜ ( n ) T Q ˜ ( m ) · K ˜ ( n )
where Q ˜ ( m ) = Q ( m ) Q ¯ ( m ) , K ˜ ( n ) = K ( n ) K ¯ ( n ) , and u , v s . [ 1 , , H W ] are position indices; Q ¯ ( m ) and K ¯ ( n ) are the average values of Q ( m ) and K ( n ) , respectively. A ( m , n ) is the matching score between Q ( m ) and K ( n ) .
An initial correspondence map A ( m , n ) of previous methods is used typically to rearrange an exemplar to control local patterns in image synthesis. A ( m , n ) involves unreliable matching scores due to the difficulty of cross-domain correspondence learning. Therefore, the restructured image will have incredible artifacts during training process. In order to overcome this disadvantage, masks were designed to fine-tune the matching scores, leading to more realistic feature map fusion.
f mask is designed by multiplying K and V through two different 1 × 1 convolutions. The results of cross-domain attention features are divided into two parts, reliable features and extra features. Then, f mask is used to warp the value features to get reliable features.
A ˜ m a s k = A ( m , n ) f m a s k
X r e l i a b l e = A ˜ mask V
In order to make full use of information from the optical domain, 1 A ˜ m a s k is used to warp Q A to get extra features, further obtaining supplementary information from Q. First, Q is normalized to obtain Q A , and normalization operation is performed on the second dimension. β and γ come from f A . Then, we can formulate the modulation as follows:
Q A = γ f A Q μ ( Q ) σ ( Q ) + β f A
X e x t r a = 1 A ˜ mask Q A
Thus, Q A and derived supplementary features preserve semantic information from images in optical domain. In this way, cross-domain attention can connect the two domains and fully explore the available information in the two domains. The reliable features and extra features complement each other, so that the style of the cross-attention feature map moves towards the target domain, while preserving the semantic features of source domain as much as possible:
X = X reliable + X e x t r a
Finally, reliable features and extra features are designed through a convolutional layer to obtain a cross-domain attention feature map.

2.3. Cross-Domain Multi-Scale Feature Fusion Module (CDMSFFM)

CNNs cannot extract the features of target fully at global level due to the limited size of the input image and convolution kernel. In order to strengthen the connection between local and global levels when extracting the features of target, pixel-level multi-scale feature fusion is designed to fuse feature maps at different levels in this paper. The object of fusion is fusing the reference feature map obtained by CDANet and the main features extracted by CNN. Taking optical-to-SAR mapping as an example, the main feature map of the optical domain f O 1 and the main feature map of the SAR domain f S 1 are input into CDANet to obtain the reference feature map. Then, with the other main special pattern diagrams of the optical domain f O 2 , f O 3 , and f O 4 , the feature fusion can be performed.
The feature map f CDA ( O S ) output by cross-domain attention module combines the semantic information of the optical domain and the style information of the SAR domain. After upsampling f CDA ( O S ) twice, splicing it with f O 2 in the second dimension, and then changing the channel dimension through channel convolution, it is obtained. Each stitching operation is on the main feature layer extracted from the optical domain. The principle of each stitching selection is that the size of the feature map increases from small to large until the size of the stitched image is 256 × 256. Finally, the channel number reduces to 3 through channel convolution again and then the final reference image is obtained. The structure of the proposed feature fusion method is shown in Figure 4. The features at each layer of different sizes can be fused by the pixel-level multi-scale feature fusion module.

2.4. Loss Function

The network structure of the algorithm proposed in this paper is mainly divided into four parts, namely generators, discriminators, CDANet, and CDMSFFM. According to the reverse mapping relationship from optical to SAR and from SAR to optical, each part has two networks with exactly the same structure and completely opposite mapping relationship. Based on the principle of the proposed CDA-GAN, an additional loss (named reference loss in this paper) was added on the basis of losses of the previous GAN-based methods. In short, in the proposed CDA-GAN, we have identity loss, adversarial loss, cycle consistency loss, and the proposed reference loss. The specific formulations of these losses are elaborated as follows.
Identity loss: In order to ensure that generators are able to generate domain-specific images, it is essential to constrain them with real images of the specific domain. It is defined as
L i d t S ( G ) = G S I S I S 1
L i d t O ( G ) = G O I O I O 1
L i d t ( G ) = L i d t S ( G ) + L i d t O ( G )
where G O and G S are the generators that generate fake optical and SAR images, respectively. I O and I S are the real optical and SAR images, respectively.
Adversarial loss: The confrontation of GAN is mainly reflected in the discriminators of the optical and SAR domain. The discriminator is used to discriminate the image of real optical (SAR) domain and the image generated by G O ( G S ). For the mapping G:O → S, adversarial loss is formulated as
L G A N O G S , D S , I = E I P e d a t a ( I S ) log D S ( I ) + E I P d a t a ( I O ) log 1 D S ( G S ( I ) )
Similarly, the inverse mapping G:S → O adversarial loss is as follows:
L G A N S G O , D O , I = E I P e d a t a ( I O ) log D O ( I ) + E I P d a t a ( I S ) log 1 D O ( G O ( I ) )
Finally, the overall loss in both optical and SAR domain is
L G A N = L G A N O G S , D S , I + L G A N S G O , D O , I
Cycle consistency loss: Only the constraints of identity loss and adversarial loss hardly guarantee the exact mapping from the input domain to the target domain, because a network of sufficient capacity can contain arbitrary random permutations, which cannot guarantee the desired output. To solve this problem, a cycle consistency loss proposed in CycleGAN is used to measure the difference between the input image I and the image G O ( G S ( I ) ) [14]. The cycle consistency loss is set as
L c y c ( G S , G O ) = E I P data ( I O ) G O G S I I 1 + E I P data ( I S ) G S G O I I 1
where, G O ( G S ( I O ) ) means that the image in the optical domain is first mapped to the SAR domain by the generator G S , and then mapped to the optical domain by the generator G O . The contrary mapping is G S ( G O ( I S ) ) .
Reference loss (the additional proposed loss in CDA-GAN): By introducing an additional feature map loss term, the generator is encouraged to acquire domain-specific features while participating well in cross-domain unpaired image fusion to assist images in two-way image translation. Specifically, for the optical domain, as CDA-GAN participating samples I O and I S , the loss between the reference image obtained by CDA-GAN and the SAR image generated by the generator is calculated as follows:
L r O S ( C , G ) = G S I O C S I O , I S 1
where C S is the CDA-GAN that generates the mapping reference SAR image, where Q is from optical domain, and K and V are from SAR domain. Similarly, the loss between the inverse mapping reference image and the generated image in optical domain is calculated as
L r S O ( C , G ) = G o I S C o I S , I O 1
where G O is the generator that generates fake optical images. C O is the CDA-GAN that generates the mapping reference optical image, where Q is from SAR domain, and K and V are from optical domain. · 1 is the L1 norm. In image-to-image translation tasks, the L1 norm is widely used to measure the absolute distance of two targets, so as to minimize the loss in optimization. For example, L1 is used to calculate the feature map loss per unit channel in [38]. Moreover, compared to the L2 norm, the L1 norm retains edge information to a greater extent, so L1 norm is chosen to calculate feature map loss between reference images and generated images.
In the experimental results shown in Section 3, the reference loss can make use of transformer as the framework to combine information of different domains in a hierarchical form, forcing the image to generate the style of the target domain in the mapping direction. Simultaneously, the semantic information of the source domain is retained to the greatest extent.
Consequently, the overall loss of CDA-GAN will be
L G S , G O , D X , D Y = L G A N + λ c y c L c y c ( G S , G O ) + λ r L r ( G S , G O ) + λ i d t L i d t ( G )
where λ c y c , λ r , and λ i d t are the weighted coefficients between different losses. Our optimization goal is to solve the following min–max problem:
G S * , G O * , D X * , D Y * = arg min G S , G O max D X , D Y L G S , G O , D X , D Y

3. Experimental Results and Discussions

In this section, in order to verify the effectiveness of the proposed method in this paper, experiments based on multiple different translation methods for optical-to-SAR image generation were performed. The object detection accuracy in the testing SAR image could be used to evaluate the quality of trained images generated by different optical-to-SAR translation methods. Specifically, the SAR images generated from the optical domain were used as training samples with label information from optical images. Real SAR images were used as the testing samples. The higher the object detection accuracy in the real SAR images, the higher the quality of the generated training samples by optical-to-SAR translation. The experimental details are introduced comprehensively in what follows.

3.1. Datasets

The datasets required for optical-to-SAR image translation were divided into two categories, one was optical ship images and the other was SAR ship images. Since there was currently an insufficient number of paired images for optical-to-SAR ship translation, a combined unpaired dataset was constructed, the samples of which were selected from different current popular datasets. First, datasets were collected containing optical images or SAR images of ships, such as DIOR, LEVIR, and the datasets used in Airbus Ship Detection. The DIOR dataset was extracted from Google Earth and contains 20 types of remote sensing surface objects, including 23,463 pictures, 190,288 targets, and 2702 pictures of ship targets. The LEVIR dataset covers most types of ground features of human habitats, such as oceans, forests, and cities, which include three types of targets in total, namely 4724 aircraft, 3025 ships, and 3279 oil tanks. Airbus Ship Detection is a Kaggle competition dataset. Participants need to locate the position of the ship in the dataset. The dataset contains ship targets with assorted scene information and the number of ship target forms in each picture is rich and varied. The above three datasets were combined into a ship dataset in the optical domain. As for the dataset in the SAR domain, the SSDD dataset and SAR-Ship-Dataset were chosen. The SSDD dataset has 1160 images and 2456 ships in total. The images in the SSDD dataset contain various ship target scenes and can match the similar scenes of the optical dataset, although the image number of this dataset is small. The corresponding ship scene is suitable as the SAR dataset in the experiment. The SAR-Ship-Dataset consists of 43,819 256 × 256 ship images, including 59,535 ship instances.
Current mainstream image conversion tasks, such as the conversion between white horses and zebras, and apples and oranges, were not very difficult to conduct the experiment on. Firstly, the original images and the converted images are both in the same imaging domain, such as the optical domain. The conversion from optical images to optical images does not need to consider different imaging mechanisms. Secondly, in these conversion tasks, the shape and size of the target scene types after conversion are basically the same as those of the original targets. Most importantly, for these transformation tasks, the matching datasets are not very difficult to find. These factors greatly reduce the difficulty of image conversion.
Therefore, for the task presented in this paper, refining the current datasets for cross-domain optical–SAR translation task was necessary. Specifically, constructing the datasets that have similar ship sizes and image scenes in different domains (optical and SAR domains) as much as possible was the basis for relevant research.
Finally, 2636, 518, and 129 images were selected containing ship targets from the above three optical datasets and 660 and 2200 images from the SSDD and SAR-Ship-Dataset were selected as the SAR ship dataset. In the SSDD dataset, 660 images were selected to form the SAR dataset for training in image translation, and the remaining images were used as the testing set. Table 1 and Table 2, show in detail the optical domain and SAR domain datasets used in the experiment, respectively.

3.2. Experimental Settings

The parameters settings of different optical-to-SAR translation methods used in this paper are shown in Table 3, where λ g c , λ r e c o n , and λ d i f f are the weighted coefficients of the geometry-consistency loss, reconstruction loss, and diffusion loss, respectively. The methods including CycleGAN, SAGAN, GCGAN, MUNIT, and DDPM were all set to the default parameters of their original networks. The weighted coefficients ( λ c y c and λ i d t ) of loss functions in CDA-GAN used the same settings as CycleGAN. For the weighted coefficient λ r setting, it was set to 5 based on the empirical value.
The specific steps of optical-to-SAR translation using CDA-GAN are as follows:
(1) Input the optical image and SAR image into GS and GO, respectively, to obtain the generated image.
(2) Extract the main features of optical images and SAR images, and input the most expressive features into CDA-GAN according to different settings of q, k, and v to obtain cross-domain feature maps.
(3) In a bottom–up fusion method, the cross-domain feature map is fused with the main features extracted in step 2.
(4) Input the converted image and the corresponding real image into the discriminator to judge whether it is a real image or not.
(5) Calculate the loss function according to Equation (16).
(6) Use the final trained generator to complete the image generation task.

3.3. Performance Comparison and Discussions

Different image translation methods generated the corresponding converted images, which were used as training samples in the testing experiment. Figure 5 and Figure 6 show the generated SAR images of some optical data by CDA-GAN and other image translation algorithms. The corresponding optical images in Figure 5 are from the datasets in Section 3.1, which do not have the real paired SAR datasets. The corresponding optical image in Figure 6 is cropped from Google Earth at Lat 21°22′33.99″N and Lon 157°58′59.98″W (acquired on 16 February 2024). It has the paired SAR images with Sentinel-1 (IW mode, VH polarizations) on two dates 14 February 2024 and 17 February 2024.
From Figure 5, we can see that the generated images of the proposed CDA-GAN have a high similarity of ship geometry structure compared with optical images, and simultaneously suppress the background noise around the ship effectively. This is because the proposed CDA-GAN includes a cycle loss and adds a cross-domain attention mechanism; it pays more attention to the semantic information of the target object on the basis of CycleGAN. The constraints of GcGAN’s geometric information cannot break through the excessive inter-domain differences. Thus, GcGAN is unable to perform the conversion task effectively when the target and background are complex. Sometimes, as shown in the second image of Figure 5b, a completely black picture appears. MUNIT divides the latent feature space, and the quality of the generated image depends heavily on the accuracy of the space division. The inability of MUNIT to guarantee the accuracy of the space division limits the quality of the generated image. SaGAN adds attention to the generator on the basis of GAN, but the lack of constraints on the geometric information of objects causes the position and boundary in the translated images to be seriously damaged. From Figure 5e, we can see that the ships in the second and third images generated by DDPM have the correct locations compared with the corresponding real optical images. However, the similarities of ship geometry structure in these two generated images by DDPM are low (namely, low quality generation). Moreover, there is a missing ship generation in the first image of Figure 5e by DDPM. The reason that caused these differences is that the DDPM does not have identity loss. Identity loss can be used to constrain the geometry structure similarity of the ship in the generated image. Consequently, the proposed CDA-GAN performs best comprehensively.
From Figure 6, we still can see that the generated SAR image by CDA-GAN has lower background noise around the ships than CycleGAN. The resolution of the paired IW mode Sentinel-1 SAR images is relatively low. The generated SAR images by CDA-GAN or CycleGAN can obtain high resolution because the resolution of the corresponding converted optical image is very high. However, the profiles, sizes, and outer geometry structures of the ships among the generated SAR images by CDA-GAN and the paired Sentinel-1 SAR images are similar. In order to evaluate the quality of the training samples generated by different translation methods, detection results using the datasets in Section 3.1 are shown in Table 4 and Table 5, and Figure 7. In the experiment, YOLO-v7 and Faster-RCNN were adopted as the detectors.
In Table 4 and Table 5, the indicator AP, which is the comprehensive metrics between Recall and Precision, is generally used to evaluate the accuracy of target detection [39]. The higher value represents the higher detection accuracy. Considering that the geometry structures of the ships in the generated SAR images by SaGAN and DDPM are much different from the corresponding optical images shown in Figure 5, the training SAR samples generated by SaGAN and DDPM cannot effectively represent the statistical geometry structure of ships in the real SAR datasets. Consequently, only CycleGAN, GcGAN, and MUNIT were used to compare with the proposed CDA-GAN quantitatively in the detecting experiment. We can see that the training samples generated by the proposed CDA-GAN obtain the highest detection accuracy. In Figure 7, the detector trained using the fake SAR samples generated by Cycle-GAN has lots of missed detections, and is not robust enough to the size and background noise of the target object. In contrast, the detector trained using the fake SAR samples generated by CDA-GAN can largely avoid the above-mentioned fatal flaws, thanks to the addition of the cross-domain attention mechanism and the cross-domain multi-scale feature map fusion module. In summary, the training samples generated by the proposed CDA-GAN achieve the best detection performance among all the methods, which verifies the superiority of CDA-GAN.
In order to further evaluate the effectiveness of the training samples generated by CDA-GAN, as shown in Table 6, detection experiments using different training samples combinations were conducted. YOLO-v7 was adopted as the detector. In the experiment, 300 samples in the SSDD datasets were selected and then extended to be 900 samples after data augmentation. In addition, 600 samples were generated by CDA-GAN. We can see that the part of the SSDD datasets combined with the generated samples by CDA-GAN obtain higher detection accuracy than the part of SSDD datasets only. This verifies that the extended samples generated CDA-GAN increase the diversity of samples and improve the accuracy of the detection model.

3.4. Ablation Analysis

In order to investigate the effectiveness of the proposed CDA-GAN comprehensively, ablation studies were conducted by evaluating variants of the proposed method. The results are shown in Table 7 and Figure 8. YOLO-v7 was adopted as the detector. In them, CDANet removal or CDMSFFM removal represent whether to use the corresponding module in the ablation experiment. We can see that all the components designed by the proposed method are necessary to improve the performance in the overall case.
Results in Table 4 and Table 7 show that CDA-GAN with CDANet removal leads to slightly better results than CycleGAN, but worse than the complete CDA-GAN. This is because CDANet mainly focuses on the feature of the ship in the image translation task, which can reduce the effect of background noise around the ship. The cross-domain attention mechanism can start from the perspective of global information, find the region of interest in many interrelated regions, and simultaneously fuse the information of optical and SAR images. However, it does not necessarily bring more attention modules to the significant improvements.
Then, considering the impact of the CDMSFFM module on the image conversion task alone, as shown in Figure 8b, removing the CDMSFFM module will seriously damage the geometry structure of the ship in the image conversion. In Table 7, we can also see that the detecting precision of CDA-GAN with CDMSFFM removal decreases compared with the complete CDA-GAN. In the complete CDA-GAN, as a bridge connecting global information and local information, the CDMSFFM module can integrate the information of the source domain on multiple scales. Furthermore, the consistency at the semantic level of the complete CDA-GAN can help us achieve a more accurate and realistic output. Actually, after removing the reference loss proposed in this paper, the CDANet and the CDMSFFM module lose the connection with the generated image. At this time, the proposed model is simplified to CycleGAN.
Ablation experiments show that all modules proposed in this paper have a positive impact on the final experimental results.

4. Conclusions

In this article, a novel optical-to-SAR translation method based on CDA-GAN was proposed for high-quality training sample generation for ship detection in SAR amplitude images. In the proposed method, a CDA mechanism was considered and fused into the CDANet. Furthermore, the CDMSFFM was combined to improve the quality of image translation. At the global level, the CDANet realizes the fusion of multi-domain information, and precisely focuses on the cross-domain transformation of the target object, minimizing the interference of background and noise around the target. For local information, the CDMSFFM can effectively combine global information and local information, and fully guarantee the semantic consistency from low-level to high-level consistency. Consequently, the feature of ship statistical geometry structure in the generated SAR amplitude images has high similarity with that in optical images. Furthermore, the background noise around the ship in the generated SAR amplitude images was suppressed effectively. The experimental results demonstrate the SAR training samples generated by the proposed method can obtain higher accuracy of ship detection in real testing SAR images than the other state-of-the-art methods. The proposed method is the generally available for different orbit SARs and can be extended to the high-Earth-orbit spaceborne SAR case.

Author Contributions

Conceptualization, B.W.; methodology, B.W. and H.W.; software, H.W. and C.Z.; validation, H.W. and B.W.; formal analysis, B.W. and H.W.; investigation, B.W. and H.W.; resources, B.W.; data curation, B.W.; writing—original draft preparation, H.W.; writing—review and editing, J.C.; visualization, J.C.; supervision, J.C.; project administration, B.W. and J.C.; funding acquisition, B.W. All authors have read and agreed to the published version of the manuscript.

Funding

This research was funded by Shanghai Aerospace Science and Technology Innovation Foundation (No. SAST2022-042).

Data Availability Statement

The data presented in this study are available upon request.

Conflicts of Interest

The authors declare no conflicts of interest.

References

  1. Chen, J.; Li, M.; Yu, H.; Xing, M. Full-Aperture Processing of Airborne Microwave Photonic SAR Raw Data. IEEE Trans. Geosci. Remote Sens. 2023, 61, 1–12. [Google Scholar] [CrossRef]
  2. Li, Y.; Wang, Y.; Zhang, Y.; Liu, B.; Chen, H. A Method for Calculating the Optimal Velocity Search Step Size for Airborne Three-Channel SAR Adaptive Clutter Suppression. IEEE J. Sel. Top. Appl. Earth Obs. Remote Sens. 2024, 17, 5712–5720. [Google Scholar] [CrossRef]
  3. Li, Y.; Zhang, Y.; Liang, J.; Wang, Y. An Improved Omega-K Algorithm for Squinted SAR With Curved Trajectory. IEEE Geosci. Remote Sens. Lett. 2024, 21, 4000905. [Google Scholar] [CrossRef]
  4. Chen, L.; Wu, L.; Hu, Z.; Wang, M. Quality-Aware Unpaired Image-to-Image Translation. IEEE Trans. Multimed. 2019, 21, 2664–2674. [Google Scholar] [CrossRef]
  5. Lin, J.; Chen, Z.; Xia, Y.; Liu, S.; Qin, T.; Luo, J. Exploring Explicit Domain Supervision for Latent Space Disentanglement in Unpaired Image-to-Image Translation. IEEE Trans. Pattern Anal. Mach. Intell. 2021, 43, 1254–1266. [Google Scholar] [CrossRef] [PubMed]
  6. Huang, Z.; Pan, Z.; Lei, B. What, Where, and How to Transfer in SAR Target Recognition Based on Deep CNNs. IEEE Trans. Geosci. Remote Sens. 2020, 58, 2324–2336. [Google Scholar] [CrossRef]
  7. Cai, Z.; Vasconcelos, N. Cascade R-CNN: Delving into High Quality Object Detection. In Proceedings of the IEEE Conference on Computer Vision and Pattern Recognition (CVPR), Salt Lake City, UT, USA, 18–23 June 2018; pp. 6154–6162. [Google Scholar]
  8. Marmanis, D.; Yao, W.; Adam, F.; Datcu, M.; Reinartz, P.; Schindler, K.; Wegner, J.D.; Stilla, U. Artificial Generation of Big Data for Improving Image Classification: A Generative Adversarial Network Approach on SAR Data. In Proceedings of the 2017 Computer Vision and Pattern Recognition (CVPR), Honolulu, HI, USA, 21–26 July 2017. [Google Scholar] [CrossRef]
  9. Wang, R.; Wang, L.; Wei, X.; Chen, J.W.; Jiao, L. Dynamic Graph-Level Neural Network for SAR Image Change Detection. IEEE Geosci. Remote Sens. Lett. 2022, 19, 4501005. [Google Scholar] [CrossRef]
  10. Li, W.; Yang, C.; Peng, Y.; Zhang, X. A Multi-Cooperative Deep Convolutional Neural Network for Spatiotemporal Satellite Image Fusion. IEEE J. Sel. Top. Appl. Earth Obs. Remote Sens. 2021, 14, 10174–10188. [Google Scholar] [CrossRef]
  11. Du, W.L.; Zhou, Y.; Zhu, H.; Zhao, J.; Shao, Z.; Tian, X. A Semi-Supervised Image-to-Image Translation Framework for SAR–Optical Image Matching. IEEE Geosci. Remote Sens. Lett. 2022, 19, 4516305. [Google Scholar] [CrossRef]
  12. Tang, H.; Liu, H.; Sebe, N. Unified Generative Adversarial Networks for Controllable Image-to-Image Translation. IEEE Trans. Image Process. 2020, 29, 8916–8929. [Google Scholar] [CrossRef]
  13. Wang, H.; Zhang, Z.; Hu, Z.; Dong, Q. SAR-to-Optical Image Translation with Hierarchical Latent Features. IEEE Trans. Geosci. Remote Sens. 2022, 60, 5233812. [Google Scholar] [CrossRef]
  14. Zhu, J.Y.; Park, T.; Isola, P.; Efros, A.A. Unpaired Image-to-Image Translation Using Cycle-Consistent Adversarial Networks. In Proceedings of the 2017 IEEE International Conference on Computer Vision (ICCV), Venice, Italy, 22–29 October 2017; pp. 2242–2251. [Google Scholar] [CrossRef]
  15. Cai, G.; Wang, Y.; He, L.; Zhou, M. Unsupervised Domain Adaptation With Adversarial Residual Transform Networks. IEEE Trans. Neural Netw. Learn. Syst. 2020, 31, 3073–3086. [Google Scholar] [CrossRef]
  16. Tao, R.; Li, Z.; Tao, R.; Li, B. ResAttr-GAN: Unpaired Deep Residual Attributes Learning for Multi-Domain Face Image Translation. IEEE Access 2019, 7, 132594–132608. [Google Scholar] [CrossRef]
  17. Huang, X.; Ming-Yu, L.; Belongie, S.; Kautz, J. Multimodal Unsupervised Image-to-Image Translation. In Proceedings of the European Conference on Computer Vision (ECCV), Munich, Germany, 8–14 September 2018; pp. 172–189. [Google Scholar] [CrossRef]
  18. Chaabane, F.; Réjichi, S.; Tupin, F. Self-Attention Generative Adversarial Networks for Times Series VHR Multispectral Image Generation. In Proceedings of the 2021 IEEE International Geoscience and Remote Sensing Symposium IGARSS, Brussels, Belgium, 11–16 July 2021; pp. 4644–4647. [Google Scholar] [CrossRef]
  19. Fu, H.; Gong, M.; Wang, C.; Batmanghelich, K.; Zhang, K.; Tao, D. Geometry-Consistent Generative Adversarial Networks for One-Sided Unsupervised Domain Mapping. In Proceedings of the 2019 IEEE/CVF Conference on Computer Vision and Pattern Recognition (CVPR), Long Beach, CA, USA, 15–20 June 2019; pp. 2422–2431. [Google Scholar] [CrossRef]
  20. Hsin-Ying, L.; Hung-Yu, T.; Jia-Bin, H.; Singh, M.K.; Yang, M.H. Diverse Image-to-Image Translation via Disentangled Representations. In Proceedings of the European Conference on Computer Vision (ECCV), Munich, Germany, 8–14 September 2018. [Google Scholar]
  21. Ming-Yu, L.; Tuzel, O. Coupled Generative Adversarial Networks. In Proceedings of the 29th Conference on Neural Information Processing Systems (NIPS), Barcelona, Spain, 5–10 December 2016. [Google Scholar]
  22. Shan, Y.; Wen, F.L.; Chee, M.C. Pixel and Feature Level Based Domain Adaption for Object Detection in Autonomous Driving. Neurocomputing 2019, 367, 31–38. [Google Scholar] [CrossRef]
  23. Zhang, R.; Pfister, T.; Li, J. Harmonic Unpaired Image-to-image Translation. arXiv 2019, arXiv:1902.09727. [Google Scholar]
  24. Mi, Z.; Jiang, X.; Sun, T.; Xu, K. GAN-Generated Image Detection with Self-Attention Mechanism Against GAN Generator Defect. IEEE J. Sel. Top. Signal Process. 2020, 14, 969–981. [Google Scholar] [CrossRef]
  25. Ma, L.; Huang, K.; Wei, D.; Ming, Z.; Shen, H. FDA-GAN: Flow-Based Dual Attention GAN for Human Pose Transfer. IEEE Trans. Multimed. 2023, 25, 930–941. [Google Scholar] [CrossRef]
  26. Ho, J.; Jain, A.; Abbeel, P. Denoising Diffusion Probabilistic Models. arXiv 2020, arXiv:2006.11239v2. [Google Scholar]
  27. Sasaki, H.; Willcocks, C.; Breckon, T. UNIT-DDPM: UNpaired Image Translation with Denoising Diffusion Probabilistic Models. arXiv 2021, arXiv:2104.05358. [Google Scholar]
  28. Ye, Y.; Shan, J.; Bruzzone, L.; Shen, L. Robust Registration of Multimodal Remote Sensing Images Based on Structural Similarity. IEEE Trans. Geosci. Remote Sens. 2017, 55, 2941–2958. [Google Scholar] [CrossRef]
  29. Ye, Y.; Shen, L.; Hao, M.; Wang, J.; Xu, Z. Robust Optical-to-SAR Image Matching Based on Shape Properties. IEEE Geosci. Remote Sens. Lett. 2017, 14, 564–568. [Google Scholar] [CrossRef]
  30. Raza, A.; Huo, H.; Fang, T. PFAF-Net: Pyramid Feature Network for Multimodal Fusion. IEEE Sens. Lett. 2020, 4, 5501704. [Google Scholar] [CrossRef]
  31. Cao, Y.; Wu, Y.; Li, M.; Liang, W.; Hu, X. DFAF-Net: A Dual-Frequency PolSAR Image Classification Network Based on Frequency-Aware Attention and Adaptive Feature Fusion. IEEE Trans. Geosci. Remote Sens. 2022, 60, 5224318. [Google Scholar] [CrossRef]
  32. Zhang, Y.; Wu, C.; Zhang, T.; Liu, Y.; Zheng, Y. Self-Attention Guidance and Multiscale Feature Fusion-Based UAV Image Object Detection. IEEE Geosci. Remote Sens. Lett. 2023, 20, 6004305. [Google Scholar] [CrossRef]
  33. Zhou, X.; Luo, C.; Ren, P.; Zhang, B. Multiscale Complex-Valued Feature Attention Convolutional Neural Network for SAR Automatic Target Recognition. IEEE J. Sel. Top. Appl. Earth Obs. Remote Sens. 2024, 17, 2052–2066. [Google Scholar] [CrossRef]
  34. Shi, J.; He, T.; Ji, S.; Nie, M.; Jin, H. CNN-Improved Superpixel-to-Pixel Fuzzy Graph Convolution Network for PolSAR Image Classification. IEEE Trans. Geosci. Remote Sens. 2023, 61, 4410118. [Google Scholar] [CrossRef]
  35. Zhou, K.; Zhang, M.; Wang, H.; Tan, J. Ship Detection in SAR Images Based on Multi-Scale Feature Extraction and Adaptive Feature Fusion. Remote Sens. 2022, 14, 755. [Google Scholar] [CrossRef]
  36. Anandakrishnan, J.; Sundaram, V.; Paneer, P. CERMF-Net: A SAR-Optical Feature Fusion for Cloud Elimination From Sentinel-2 Imagery Using Residual Multiscale Dilated Network. IEEE J. Sel. Top. Appl. Earth Obs. Remote Sens. 2024, 17, 11741–11749. [Google Scholar] [CrossRef]
  37. Shi, J.; Nie, M.; Ji, S.; Shi, C.; Liu, H.; Jin, H. Polarimetric Synthetic Aperture Radar Image Classification Based on Double-Channel Convolution Network and Edge-Preserving Markov Random Field. Remote Sens. 2023, 15, 5458. [Google Scholar] [CrossRef]
  38. Emami, H.; Aliabadi, M.M.; Dong, M.; Chinnam, R.B. SPA-GAN: Spatial Attention GAN for Image-to-Image Translation. IEEE Trans. Multimed. 2021, 23, 391–401. [Google Scholar] [CrossRef]
  39. Zhang, Y.; Cao, Y.; Feng, X.; Xie, M.; Li, X.; Xue, Y.; Qian, X. SAR Object Detection Encounters Deformed Complex Scenes and Aliased Scattered Power Distribution. IEEE J. Sel. Top. Appl. Earth Obs. Remote Sens. 2022, 15, 4482–4495. [Google Scholar] [CrossRef]
Figure 1. The overall procedure of the experiment.
Remotesensing 16 03001 g001
Figure 2. The overall framework of the CDA-GAN.
Remotesensing 16 03001 g002
Figure 3. The structure of CDANet.
Remotesensing 16 03001 g003
Figure 4. The structure of CDMSFFM.
Remotesensing 16 03001 g004
Figure 5. Some samples from different image translation algorithms. (a) Translated images using CycleGAN; (b) translated images using GcGAN; (c) translated images using MUNIT; (d) translated images using SaGAN; (e) translated images using DDPM; (f) translated images using the proposed CDA-GAN (ours); (g) optical images from datasets.
Remotesensing 16 03001 g005
Figure 6. The comparison between the generated images and paired real images. (a) The Sentinel-1 SAR image acquired on 14 February 2024; (b) the Sentinel-1 SAR image acquired on 17 February 2024; (c) the paired real optical image; (d) translated image using CycleGAN; (e) translated image using the proposed CDA-GAN.
Remotesensing 16 03001 g006
Figure 7. Part of detection results of CDA-GAN and CycleGAN in the real SAR datasets using the YOLOv7 technique.
Remotesensing 16 03001 g007
Figure 8. Ablation experiment results. (a) Translated images using CDA-GAN with CDANet removal; (b) translated images using CDA-GAN with CDMSFFM removal; (c) translated images using the completed CDA-GAN proposed in this paper; (d) corresponding optical images from datasets.
Remotesensing 16 03001 g008
Table 1. Optical samples in datasets.
No.NameTotal SamplesSelected Samples
1DIOR23,463450
2LEVIR22,000300
3Airbus Ship Detection104,0701231
Total149,5331981
Table 2. SAR samples in datasets.
No.NameTotal SamplesSelected Samples
1SSDD1160660
2SAR-Ship-Dataset43,8192200
Total44,9792860
Table 3. The parameter settings of different optical-to-SAR translation methods used in this paper.
ParametersCDA-GANCycleGANSaGANGcGANMUNITDDPM
λ G A N 11111No
λ c y c 1010NoNo1010
λ i d t 5555NoNo
λ o t h e r 5 ( λ r )NoNo5 ( λ i d t g c ), 2 ( λ g c )10 ( λ r e c o n ) 10 ( λ d i f f )
OptimizerAdamAdamAdamAdamAdamAdam
Learning Rate0.00020.00020.00020.00020.00010.00001
Batch size4888164
Table 4. Detection results of different translation methods in the real SAR datasets using the YOLOv7 technique.
MethodRecallPrecisionAP
CDA-GAN47.94%90.97%70.30%
CycleGAN43.33%83.54%62.84%
GcGAN15.47%68.72%44.23%
MUNIT37.65%76.84%50.16%
Table 5. Detection results of different translation methods in the real SAR datasets using the Faster-RCNN technique.
MethodRecallPrecisionAP
CDA-GAN51.40%50.83%43.61%
CycleGAN45.28%47.01%40.32%
GcGAN25.77%31.83%24.57%
MUNIT37.4%35.76%30.11%
Table 6. Detection results in the real SAR datasets using different training sample combinations.
Training Sample CombinationRecallPrecisionAP
Part of SSDD+CDA-GAN samples86.92%91.82%94.16%
Part of SSDD82.37%87.96%90.05%
Table 7. Detection results in the ablation experiment of CDA-GAN.
MethodCDANetCDMSFFMRecallPrecisionAP
CDA-GAN🗸   39.54%85.96%63.52%
CDA-GAN   🗸47.60%88.57%68.81%
CDA-GAN🗸🗸47.94%90.97%70.30%
Disclaimer/Publisher’s Note: The statements, opinions and data contained in all publications are solely those of the individual author(s) and contributor(s) and not of MDPI and/or the editor(s). MDPI and/or the editor(s) disclaim responsibility for any injury to people or property resulting from any ideas, methods, instructions or products referred to in the content.

