Article

Downscaling TRMM Monthly Precipitation in Cloudy and Rainy Regions and Analyzing Spatiotemporal Variations: A Case Study in the Dongting Lake Basin

1
School of Earth Sciences and Spatial Information Engineering, Hunan University of Science and Technology, Xiangtan 411201, China
2
Satellite Application Center for Ecology and Environment, Ministry of Ecology and Environment of the People’s Republic of China, Beijing 100094, China
3
Institute for Local Sustainable Development Goals, Hunan University of Science and Technology, Xiangtan 411201, China
4
Chinese Research Academy of Environmental Sciences, Beijing 100012, China
*
Author to whom correspondence should be addressed.
Remote Sens. 2024, 16(16), 2959; https://doi.org/10.3390/rs16162959
Submission received: 2 July 2024 / Revised: 5 August 2024 / Accepted: 8 August 2024 / Published: 12 August 2024
(This article belongs to the Section Ecological Remote Sensing)

Abstract

:
High-resolution and accurate precipitation data are essential for hydrological, meteorological, and ecological research at the watershed scale. However, in regions with complex terrain and significant rainfall variability, the limited number of rain gauge stations (RGS) is insufficient, and the spatial resolution of existing satellite precipitation data is too low to capture detailed precipitation patterns at the watershed scale. To address this issue, the downscaling of satellite precipitation products has become an effective method to obtain high-resolution precipitation data. This study proposes a monthly downscaling method based on a random forest model, aiming to improve the resolution of precipitation data in cloudy and rainy regions at mid-to-low latitudes. We combined the Google Earth Engine (GEE) platform with a local Python environment, introducing cloud cover characteristics into traditional downscaling variables (latitude, longitude, topography, and vegetation index). The TRMM data were downscaled from 25 km to 1 km, generating high-resolution monthly precipitation data for the Dongting Lake Basin from 2001 to 2019. Furthermore, we analyzed the spatiotemporal variation characteristics of precipitation in the study area. The results show the following: (1) In cloudy and rainy regions, our method improves resolution and detail while maintaining the accuracy of precipitation data; (2) The response of monthly precipitation to environmental variables varies, with cloud cover characteristics contributing more to the downscaling model than vegetation characteristics, helping to overcome the lag effect of vegetation characteristics; and (3) Over the past 20 years, there have been significant seasonal trends in precipitation changes in the study area, with a decreasing trend in winter and spring (January–May) and an increasing trend in summer and autumn (June–December). These results indicate that the proposed method is suitable for downscaling monthly precipitation data in cloudy and rainy regions of the Dongting Lake Basin.

1. Introduction

Precipitation is a key component of the terrestrial water vapor cycle, significantly impacting global material and energy exchanges, ecological succession, and the hydrological cycle [1,2,3]. Rapid and accurate monitoring and prediction of the spatiotemporal distribution of precipitation are crucial for drought monitoring, flood warnings, and agricultural production [4,5]. Obtaining high-precision precipitation data has always been a central issue in hydrological research.
Traditional rain gauge monitoring methods can provide long-term, high-precision precipitation data. However, due to limitations in site distribution and inconsistencies in data time ranges, these data struggle to reflect long-term precipitation distribution over large areas. Although methods such as Inverse Distance Weighting (IDW) and Kriging interpolation can generate spatially continuous precipitation data [6,7], the quality of these data largely depends on the spatial distribution density of regional stations. In high-altitude mountainous areas and densely populated plains, significant differences in data accuracy exist due to varying station distribution densities [8,9,10]. In regions with strong spatial heterogeneity of precipitation, such as mid-to-low latitude rainy areas, spatial interpolation methods may lead to erroneous estimations of details like extreme precipitation [11,12].
Compared to ground-based observations, satellite observations have become the main means of obtaining large-scale precipitation data due to their wide coverage, high spatiotemporal continuity, and insensitivity to topography [13]. Satellite precipitation observations mainly utilize remote sensing microwave or infrared sensors for direct measurement or estimation of precipitation [14]. Widely used satellite precipitation datasets include the GPM (Global Precipitation Measurement) [15], the GPCP (Global Precipitation Climatology Project) [16], the TRMM (Tropical Rainfall Measuring Mission) [17], and the Global Satellite Mapping of Precipitation (GSMaP) project [18]. Among them, the TRMM satellite, equipped with a precipitation radar, has become one of the most widely used datasets in downscaling research due to its long observation period and rich precipitation data products. Although TRMM data exhibit high accuracy in various regions [19,20,21], the precipitation data provided by the TRMM have a low spatial resolution (0.25° × 0.25°) due to the limitations of the satellite sensor design, making it difficult to meet the needs of high-precision hydrological cycle observation, simulation, and change analysis [22]. Therefore, downscaling satellite precipitation data has been a hot topic in precipitation research [23].
Researchers have extensively studied precipitation downscaling methods, broadly classified into dynamic and statistical downscaling [24]. Among them, statistical downscaling has rapidly developed due to its simplicity and efficiency. The core idea of statistical downscaling is to establish a relationship between precipitation and high-resolution environmental variables on a large scale [25], building linear models [26] or nonlinear models (such as CART, SVM, GWR, and RF) [27,28] to achieve precipitation data downscaling. In these models, vegetation indices (such as NDVI, EVI, and LAI) are commonly used key parameters due to their ability to reflect vegetation’s response to the spatial distribution of precipitation [29,30,31]. However, studies have shown a lag effect between precipitation and vegetation. Establishing a functional relationship between vegetation indices and TRMM data on a monthly scale may lead to poor downscaling results [32]. Compared to arid and semi-arid regions, tropical and subtropical areas with abundant clouds and rainfall have lush vegetation, and precipitation is not the main influencing factor of vegetation change. The response of vegetation growth to precipitation is insensitive [33]. Although some studies have adopted methods such as the proportional factor decomposition approach and the dynamic adjustment of characteristic vegetation time to overcome the lag effect [27,32], research on vegetation insensitivity is still insufficient. Additionally, in cloud-prone and rainy areas, extensive cloud cover leads to a severe shortage of remote sensing images required for vegetation index calculation, posing significant challenges to vegetation index-based downscaling schemes.
While cloud contamination in cloudy and rainy areas limits the application of optical remote sensing for ground observations, cloud-covered images provide rich information for studying spatiotemporal changes in precipitation. Studies have shown a spatial distribution relationship between cloud cover and precipitation, depending on environmental variables such as cloud type, geographic location, and temperature [34,35,36,37]. Compared to vegetation characteristics, cloud cover data are synchronous with precipitation, making it important to explore the possibility of using cloud cover information for precipitation downscaling and of comparing the contributions of different characteristics, particularly cloud cover and vegetation characteristics, to the downscaling model. This is significant for studying monthly precipitation downscaling in cloudy and rainy areas.
The Dongting Lake Basin, the second largest sub-basin in the middle and lower reaches of the Yangtze River, experiences abundant regional precipitation and strong spatial heterogeneity. More than 40% of the images are affected by cloud contamination throughout the year, making it a typical cloudy and rainy area. Obtaining high-resolution precipitation data is crucial for studying regional flood storage, water conservation, and basin water resource development. Based on prior studies and the climatic characteristics of the Dongting Lake Basin, we incorporated cloud cover features (cloud frequency) into the existing geographical (longitude/latitude), topographic (DEM), and vegetation (NDVI/EVI) features. Utilizing the GEE platform combined with a local Python environment, we proposed a monthly downscaling method based on a random forest model to obtain high-resolution monthly precipitation data for the Dongting Lake Basin from 2001 to 2019. The specific objectives of this study are as follows: (1) to explore the response of the spatial heterogeneity of precipitation in different months to environmental variables; (2) to compare the downscaling effects of different strategies in the study area; (3) to evaluate the effectiveness of precipitation downscaling methods in complex precipitation regions of the subtropical zone on a monthly scale; and (4) to analyze the spatiotemporal variation trends of precipitation in the Dongting Lake Basin at different time scales.

2. Materials and Methods

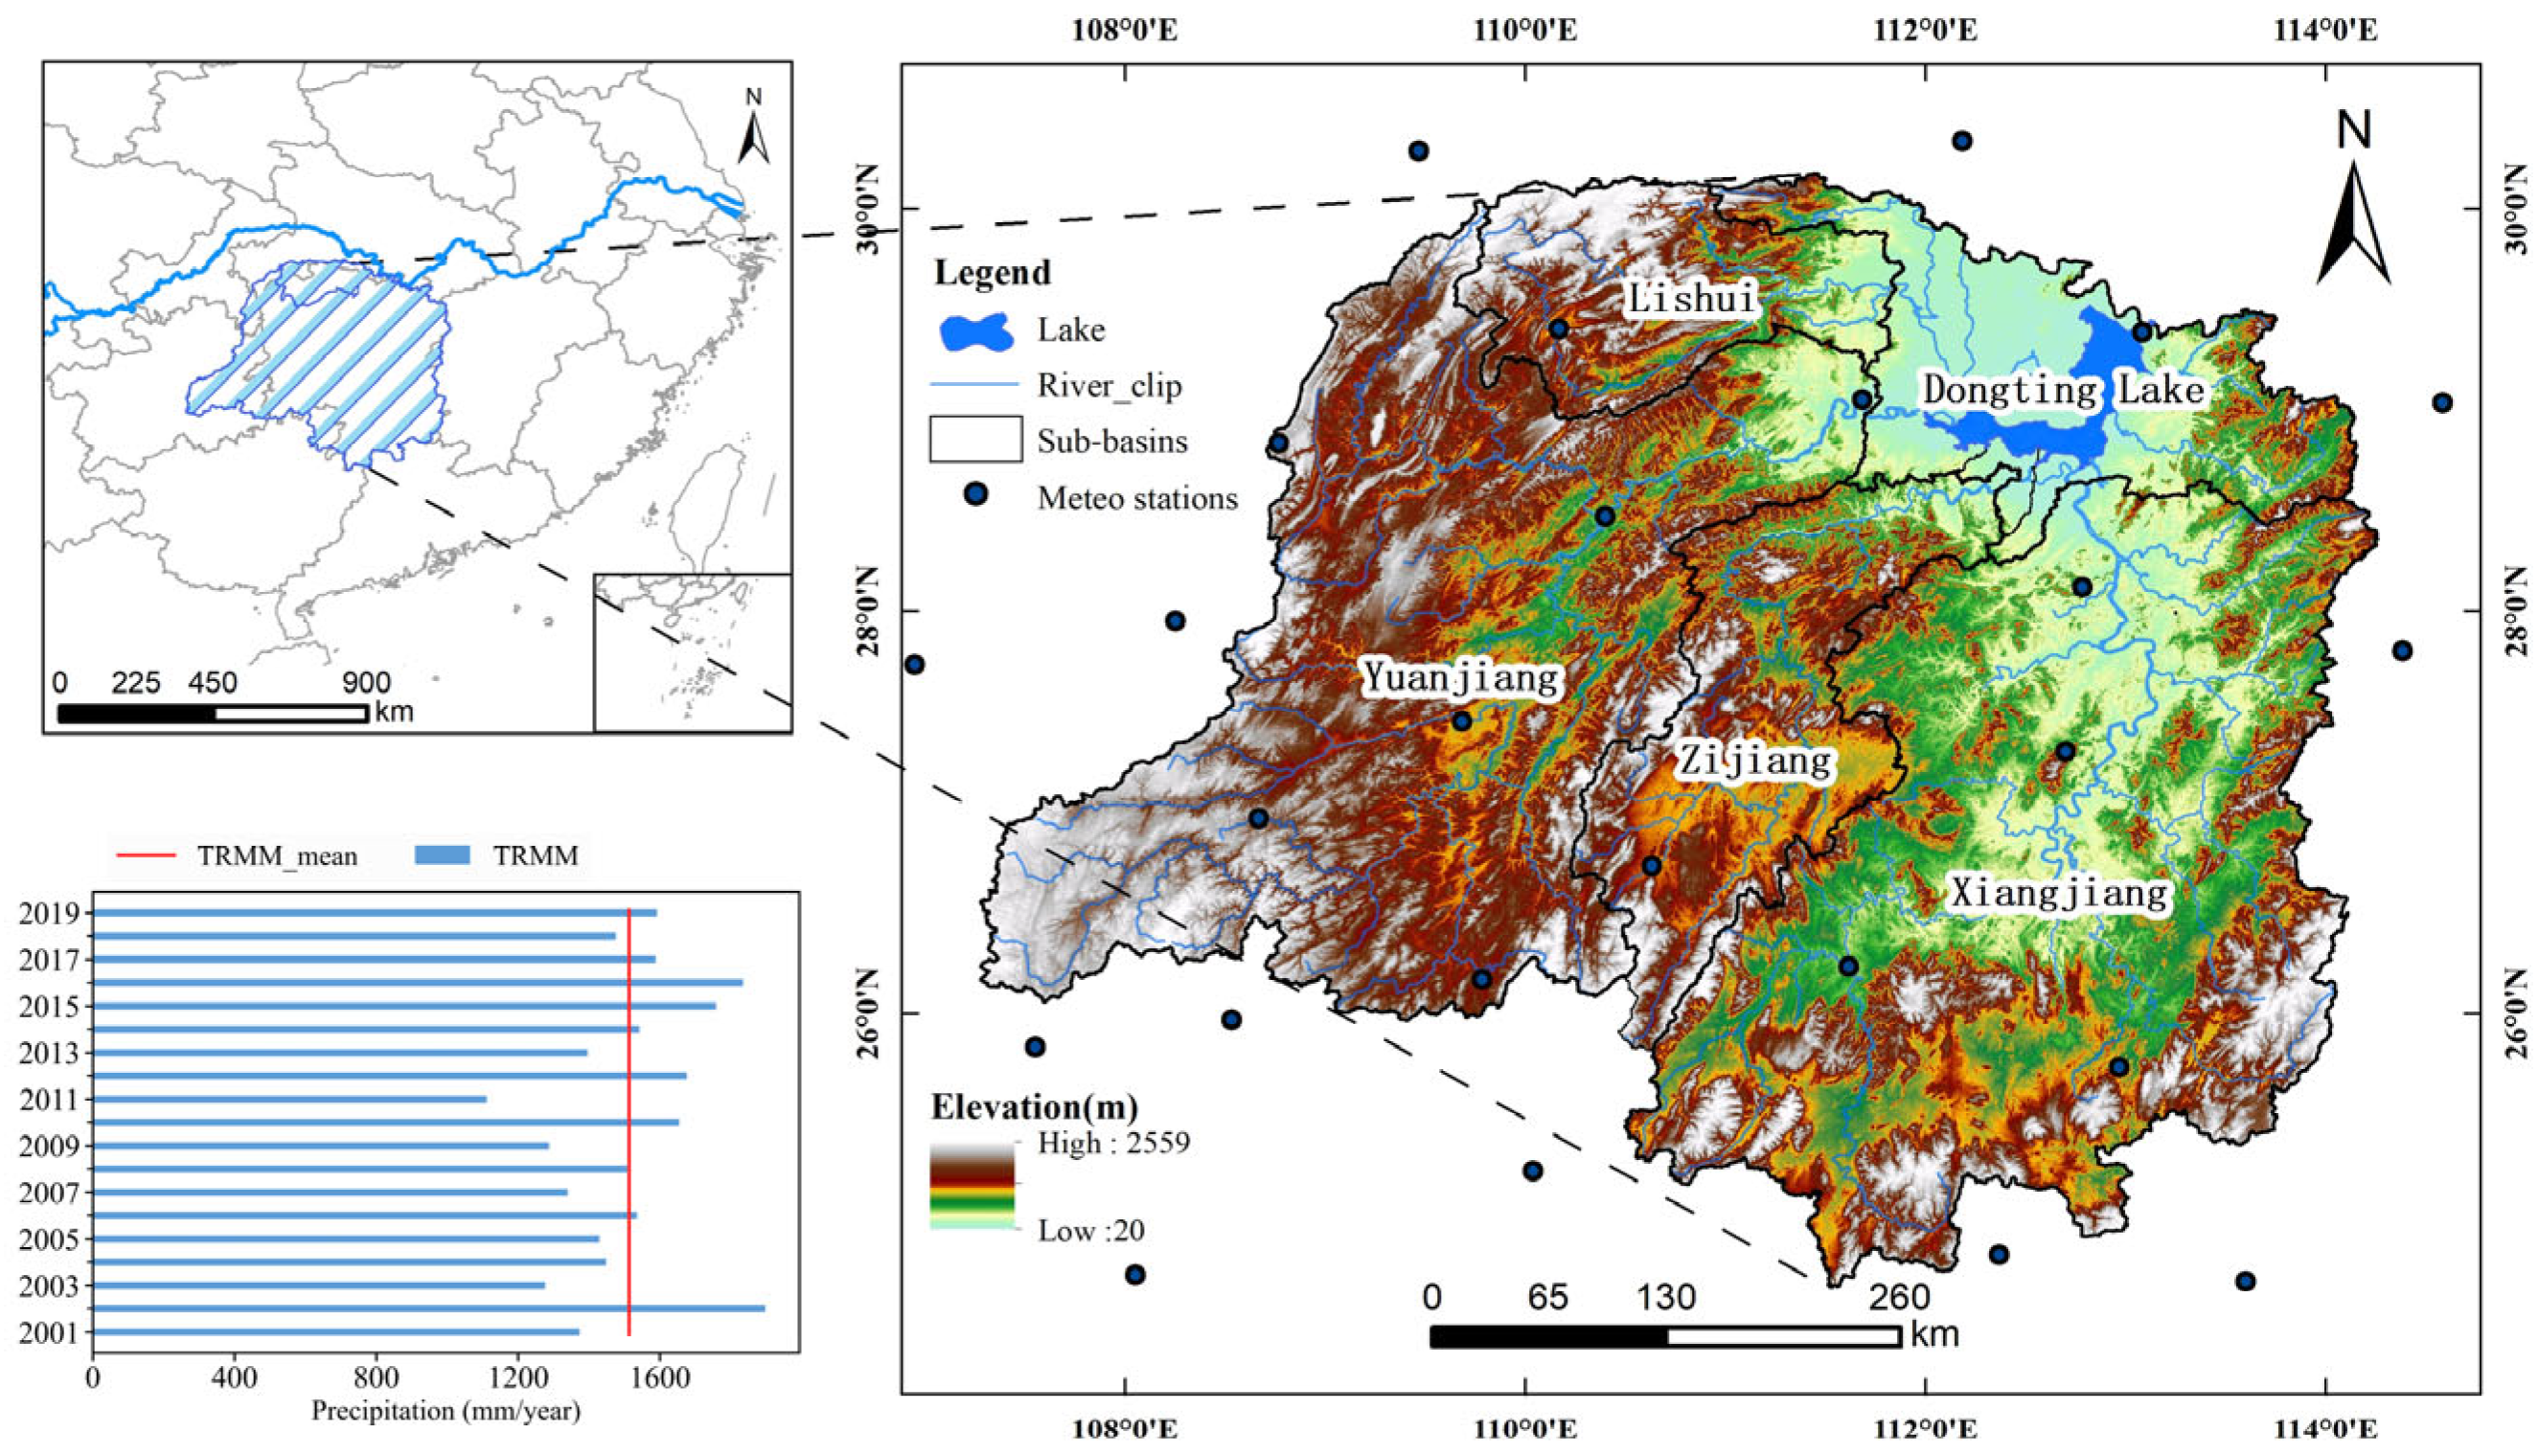
2.1. Overview of the Study Area

The Dongting Lake Basin is located on the south bank of the middle reaches of the Yangtze River, with geographical coordinates between 24°37′–30°12′N and 107°15′–114°16′E (Figure 1). It is mainly situated in Hunan Province, with peripheral areas covering parts of Hubei Province, the Guangxi Zhuang Autonomous Region, Guizhou Province, and Chongqing Municipality. The basin covers an area of 262,800 km2, primarily including the Dongting Lake region and the connected river systems of the Xiang River, Zi River, Yuan River, and Li River, along with other small and medium-sized waterways directly flowing into the lake. The topography of the entire basin is complex, with elevations decreasing from 2559 m in the southwestern mountainous area to 20 m in the northeastern lake region, forming a southwest to northeast valley orientation.
The basin is characterized by a typical subtropical monsoon humid climate. The long-term average temperature ranges from 10 to 18.5 °C, with an average relative humidity of 78–84% over the years. The annual average rainfall is between 1200 and 2000 mm. The Xiang River and Zi River Basins experience most of their rainfall from March to June, while the upper and middle reaches of the Li River and Yuan River Basins see their rainy season predominantly from May to August. Influenced by the basin’s topographical features and variations in the intensity of the summer monsoon, precipitation shows significant interannual variability and uneven spatiotemporal distribution. The northwestern mountainous areas receive an average annual rainfall of 1600–2000 mm, while the central Xiangzhong area and the northern Dongting Lake area receive 1200–1300 mm. Extreme annual precipitation has reached as high as 3697.4 mm and as low as 529.0 mm. The long-term average annual runoff volume of the basin is 207.4 billion m3, accounting for about 21% of the surface water resources in the Yangtze River Basin, with the runoff volume from April to August comprising approximately 75% of the annual total. The long-term average runoff depth ranges from 500 to 1200 mm.
The basin frequently experiences summer storms, with the most intense downpours occurring in July. These major storms are primarily concentrated in the northwestern part of the basin, affecting the upper reaches of the Li River and its tributaries, the Lou River and Xie River, the lower reaches of the Zi River, the upper reaches of the Wei River in the Xiang River system, and the northeastern regions of the Jiuling and Mufu Mountains.

2.2. Data Sources

This study primarily used the following data: Global Precipitation Measurement mission data (TRMM), MODIS satellite vegetation data (NDVI, EVI), cloud cover data, DEM elevation data, and precipitation measurements from 30 ground meteorological stations in the basin.

2.2.1. Satellite Precipitation Data

The TRMM satellite is the first satellite equipped with a precipitation radar with a spatial resolution of 0.25° × 0.25° and temporal resolutions of 3 h, 1 day, and 1 month. The TRMM 3B43V7 data product, released by NASA as part of the Tropical Rainfall Measuring Mission—Multi-satellite Precipitation Analysis (TRMM-MPA), provides quasi-global monthly precipitation data at a 0.25° × 0.25° resolution from January 1998 to December 2019. This data covers areas between 50°N and 50°S latitudes, encompassing most of mainland China. It is considered one of the best-performing and most widely used satellite data products, having been extensively evaluated and validated in mainland China. For this study, we collected the 3B43V7 product data from January 2001 to December 2019 through the Google Earth Engine (GEE) platform and extracted monthly scale satellite precipitation data within the Dongting Lake Basin.

2.2.2. Vegetation Data

The NDVI (Normalized Difference Vegetation Index) and the EVI (Enhanced Vegetation Index) are commonly used to accurately reflect vegetation growth status, which is influenced by changes in precipitation. The NDVI and EVI remote sensing data used in this study are derived from NASA’s MODIS Terra satellite V6 version MOD13A2 Global Vegetation Index 16-day composite product. Both indices have a spatial resolution of 1 km and a temporal resolution of 16 days. We extracted the NDVI and EVI time series data for 2001–2019 through the GEE platform and performed clipping and monthly synthesis based on the Dongting Lake Basin area.

2.2.3. Cloud Cover Data

As the source of precipitation processes, clouds play an important role in the entire precipitation activity. The spatial distribution of and temporal variation in clouds and precipitation have received widespread attention. Studies have shown that there is a certain spatial distribution relationship between cloud cover and precipitation. In this study, we extracted cloud cover information from the MOD09GA surface reflectance daily data set of the MODIS Terra satellite. The MOD09GA data set provides daily surface reflectance estimates, including 500-m surface reflectance values for bands 1–7 and 1-km observation and geolocation statistics, as well as 1-km quality band information. The 1-km resolution quality band represents the state of reflectance data and can provide cloud cover information widely used for data de-clouding processing. Based on the cloud cover information from the quality band, we generated monthly cloud cover time series data for 2001–2019 through monthly accumulation of cloud cover frequency on the GEE platform, and we performed clipping and extraction based on the Dongting Lake Basin area.

2.2.4. Topographic Data

Changes in topographic features directly influence airflow, cloud formation, and precipitation distribution, particularly in mountainous and hilly regions, where orographic lift and rain shadow effects are especially prominent [38]. This study utilized the 30-m resolution DEM dataset provided by NASA (NASA DEM_HGT/001). This dataset is a reprocessed version of SRTM data, featuring improved geolocation accuracy through the integration of auxiliary data from other satellites, such as the ICESat-2 and the GLAS. The dataset was resampled to a 1 km resolution using the cubic convolution method on the GEE platform.

2.2.5. Meteorological Station Precipitation Observation Data

Meteorological station observation data were provided by the National Meteorological Information Center of the China Meteorological Administration (http://data.cma.cn/, accessed on 1 August 2021), including daily precipitation data from 30 meteorological stations in and around the Dongting Lake Basin (Figure 1) for 2001–2019. In this study, daily data were aggregated into monthly data to evaluate the original TRMM data and validate the downscaling results.

2.3. Research Methods

2.3.1. Downscaling Algorithm

This study employs the Random Forest (RF) algorithm for precipitation downscaling. The RF algorithm, proposed by Breiman in 2001, is a non-parametric, enhanced decision tree machine learning method known for its flexibility, robustness, practicality, and efficiency. It is suitable for regression, clustering, classification, and predictive analysis [23]. As an extension of decision trees, the RF algorithm incorporates Bagging ensemble learning to improve model accuracy and stability. It randomly selects training datasets with replacement from the original data and introduces a random selection of features. Consequently, each independent sample subset generates an independent model. For regression problems, the RF aggregates the results predicted by all independent models using arithmetic mean, taking the average as the final output:
f = 1 N i = 1 N   f i ( x ) ,
where N is the number of decision trees in the model, x is the sample subset, and f i ( x ) is the regression prediction value of a single independent decision tree.
Compared to other algorithms, the Random Forest (RF) algorithm can effectively handle multi-feature data and detect interactions among features. We can easily calculate the variable importance of all input features and determine the most influential feature parameters for the model through feature importance ranking. The feature importance value is calculated using the following formula:
V k j = 1 N i = 1 t   e i j e i ,
In the equation, V k j is the importance value of feature, j, N is the number of decision trees, and e i and e i j are the out-of-bag errors of the number i decision tree and after randomly changing the feature j, respectively. For the feature importance value, if the interference noise of feature j increases, the out-of-bag error of feature j will rise considerably, indicating that this feature has a greater impact on the model prediction results.
Compared to other algorithms, the RF algorithm effectively handles multi-feature data and detects interactions between features. It allows for the convenient calculation of the variable importance of all input features, enabling the determination of the most influential features on the model through feature importance ranking. The advantages of the RF algorithm for precipitation downscaling include the following: (1) Precipitation is influenced by numerous factors. The RF algorithm can analyze the importance of various features, facilitating the extraction of key features affecting precipitation. (2) For large-scale, long-term remote sensing data, the RF algorithm can achieve highly parallel computations, ensuring fast training and computation speeds. (3) Due to random sampling, the RF algorithm has strong generalization capabilities and is insensitive to missing values. (4) The model is less prone to overfitting, maintaining high accuracy even in areas with significant variations in precipitation.

2.3.2. Downscaling Framework

The core of the precipitation downscaling framework is to establish a Random Forest (RF) model between precipitation and various environmental features. The downscaling algorithm in this study is based on two key assumptions: (1) there is a spatial relationship between precipitation and environmental variables [39,40]; and (2) the downscaling model established between environmental variables and precipitation at low resolution is also applicable to high-resolution data [25,41]. The detailed process is illustrated in Figure 2.
First, resample the feature variables at different scales, including latitude and longitude, the DEM, the vegetation indices (NDVI, EVI), and cloud cover, to the same 0.25° low resolution as the TRMM precipitation data. Second, establish an RF regression model between the 0.25° low-resolution feature variables and the TRMM precipitation data, and analyze the importance of different feature variables. Third, apply the constructed model to both low-resolution (0.25°) and high-resolution (1 km) precipitation predictions. Fourth, calculate the residuals between the low-resolution (0.25°) model predictions and the actual TRMM values, and resample the low-resolution residuals (0.25°) to 1 km using the cubic convolution method. Finally, overlay the resampled 1 km residuals with the high-resolution precipitation prediction results to obtain the final 1 km downscaled precipitation results.
Additionally, to explore the impact of sample time scales on the accuracy of the downscaling model, during the statistical downscaling process, the model was trained not only with monthly samples but also with multi-year monthly merged precipitation data. These two strategies were examined separately to investigate their accuracy and applicability to the precipitation downscaling model.

2.3.3. Downscaling Evaluation Method

The accuracy of the downscaling results was evaluated using the precipitation observation data from meteorological stations in and around the Dongting Lake Basin. The evaluation comprehensively assessed the accuracy of different downscaling schemes by calculating the correlation coefficient (CC), root mean square error (RMSE), and bias between the downscaled precipitation and the observed values at the stations. The formulas for these evaluation metrics are as follows:
C C = i = 1 n   P R G S P ¯ R G S P i P ¯ i i = 1 n   P R G S P ¯ R G S 2 P i P ¯ i 2 ,
R M S E = i = 1 n   P i P R G S 2 n ,
Bias   = i = 1 n   P i i = 1 n   P R G S 1 ,
where P i is the downscaled precipitation, P R G S is the observed value from the station, P ¯ i and P ¯ R G S are their respective means, and n is the number of meteorological stations.

2.3.4. Precipitation Trend Analysis Method

The Theil-Sen Median (Sen) slope method was used to calculate the precipitation trend in the Dongting Lake area from 2001 to 2019 [42]. The significance of the trend was tested using the Mann-Kendall (MK) method [43,44].
The Sen method is a robust non-parametric statistical method for trend calculation. It is highly efficient and insensitive to measurement errors and outliers, making it ideal for analyzing trends in long-term time series data. The MK method, also a non-parametric test, does not require the sample data to follow a specific distribution and is highly resistant to data errors. It provides a solid statistical foundation for significance testing, ensuring that the results are scientific and reliable.
S p = median X j X i j i , j > i ,
Z M K = S 1 s ( S ) , S > 0 0 , S = 0 S + 1 s ( S ) , S < 0 ,
S = j = 1 n 1   i = j + 1 n   f X j X i ,
s ( S ) = n ( n 1 ) ( 2 n + 5 ) 18 ,
f X j X i = 1 X j X i < 0 0 X j X i = 0 1 X j X i > 0 ,
In Equations (6)–(10), i and j represent the years in the time series; Xi and Xj represent the precipitation amount for pixels i and j over the time period; and the variable n denotes the length of the time series, which is 18 years in this study. When S p is greater than 0, it indicates an increasing trend in precipitation over the time series; conversely, a negative S p indicates a decreasing trend.
The Z M K value follows a standard normal distribution. Typically, α = 0.05 is used. If ∣ Z M K ∣ > 1.96, it indicates a significant change in the time series at the 0.05 confidence level; if ∣ Z M K ∣ ≤ 1.96, it indicates a non-significant change. By overlaying the classification results of the Sen trend analysis and the Mann-Kendall test, different significance levels of the precipitation trend can be obtained.

3. Results and Analysis

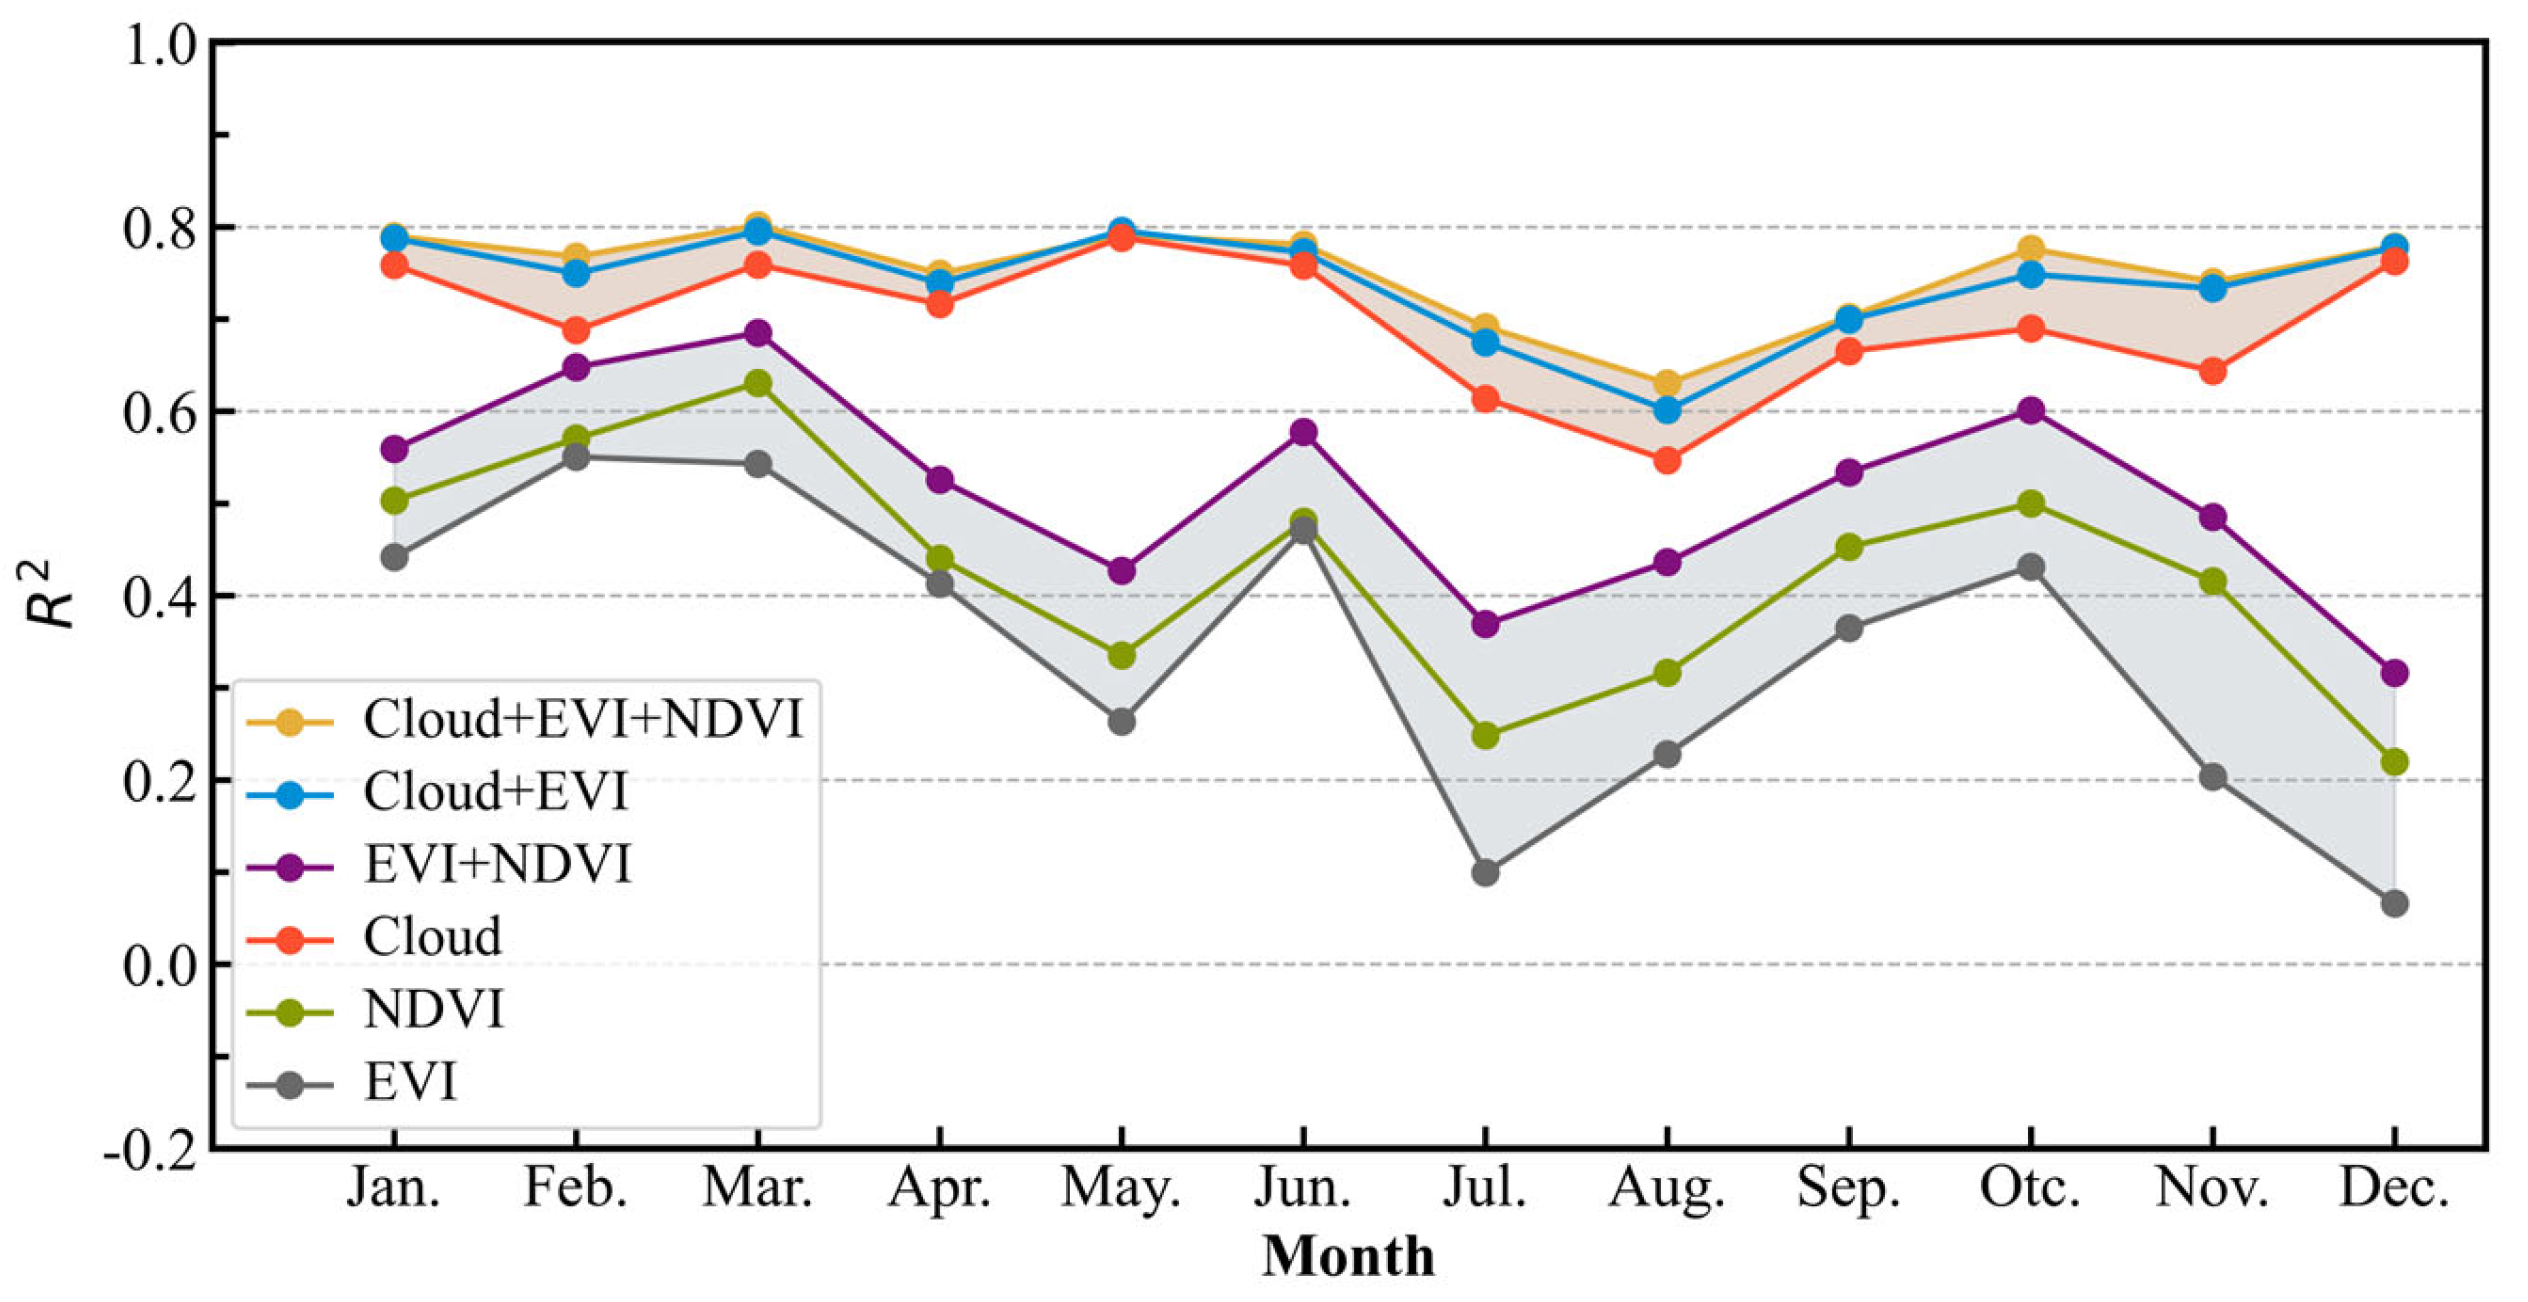
3.1. Feature Importance

By analyzing the variation in the feature importance of various environmental factors in the downscaling models for different months from 2001 to 2019 (Table 1), it became evident that latitude and longitude dominate all monthly models. They can explain 26.81% to 60.25% of the precipitation variation, having a significant impact on the spatial heterogeneity of precipitation. The importance of other factors is as follows: cloud cover (3.08% to 15.26%), elevation (3.02% to 8.82%), and vegetation characteristics (NDVI, EVI) (1.92% to 6.64%).
As fundamental geographic variables, longitude and latitude play a crucial role in the downscaling of precipitation in the study area [28,45]. They also exhibit relatively stable importance across different months. Therefore, this study focused on analyzing the impact of other characteristics on precipitation downscaling. Figure 3 shows the average importance proportions of features other than latitude and longitude for each month (left). It can be seen that the contributions of vegetation, cloud cover, and other characteristics to the downscaling model vary by month. Multi-year statistical data show that throughout the year, the importance of cloud cover characteristics to the downscaling model range from 26.22% to 59.72%, with an annual average of 36.71%. Among the two vegetation characteristics used, the importance of the NDVI ranges from 14.46% to 29.78%, with an annual average of 19.34%, while the importance of the EVI ranges from 8.35% to 19.76%, with an annual average of 15.53%. Elevation contributes between 13.28% and 40.87% of the total distribution. It is evident that the contributions of all features to the downscaling model vary by month, with cloud cover features contributing the most in most months.
Additionally, to further explore the relationship between downscaling variables and the model, we tested the performance of the downscaling model with different variable combinations. Due to the limited number of samples in a single year, which cannot reliably reflect model performance, we combined samples from multiple years. We randomly selected 30% of the samples as validation samples to assess the model’s performance with various feature combinations on a monthly basis.
Figure 4 shows the accuracy results of downscaling models with different feature combinations. Overall, there are significant differences in the accuracy of downscaling models with different feature combinations, with cloud cover playing a crucial role. For single-variable inputs, cloud cover features perform similarly to vegetation features from February to April, with model accuracy ranging from 0.47 (February) to 0.73 (April), and with an average accuracy of 0.63, which is close to that of the NDVI (0.61) and the EVI (0.56). However, in the remaining months (May–December and January), cloud cover features significantly outperform vegetation features, with an average model accuracy of 0.72, much higher than that of vegetation features (NDVI: 0.26, EVI: 0.21). For multi-variable models, the accuracy of the models improve to varying degrees across different months of the year compared to single-variable models. Especially from May to January, the model accuracy for vegetation combination features (EVI + NDVI) fluctuate between 0.19 and 0.61, with an average accuracy of 0.39, significantly higher than that of single-feature models. Furthermore, as shown in the figure, combining cloud cover and vegetation features yield better model accuracy than individual features. The combination of cloud cover with the EVI and NDVI features perform best, with an annual average accuracy of 0.75, approximately 47% higher than the vegetation feature combination (NDVI + EVI).

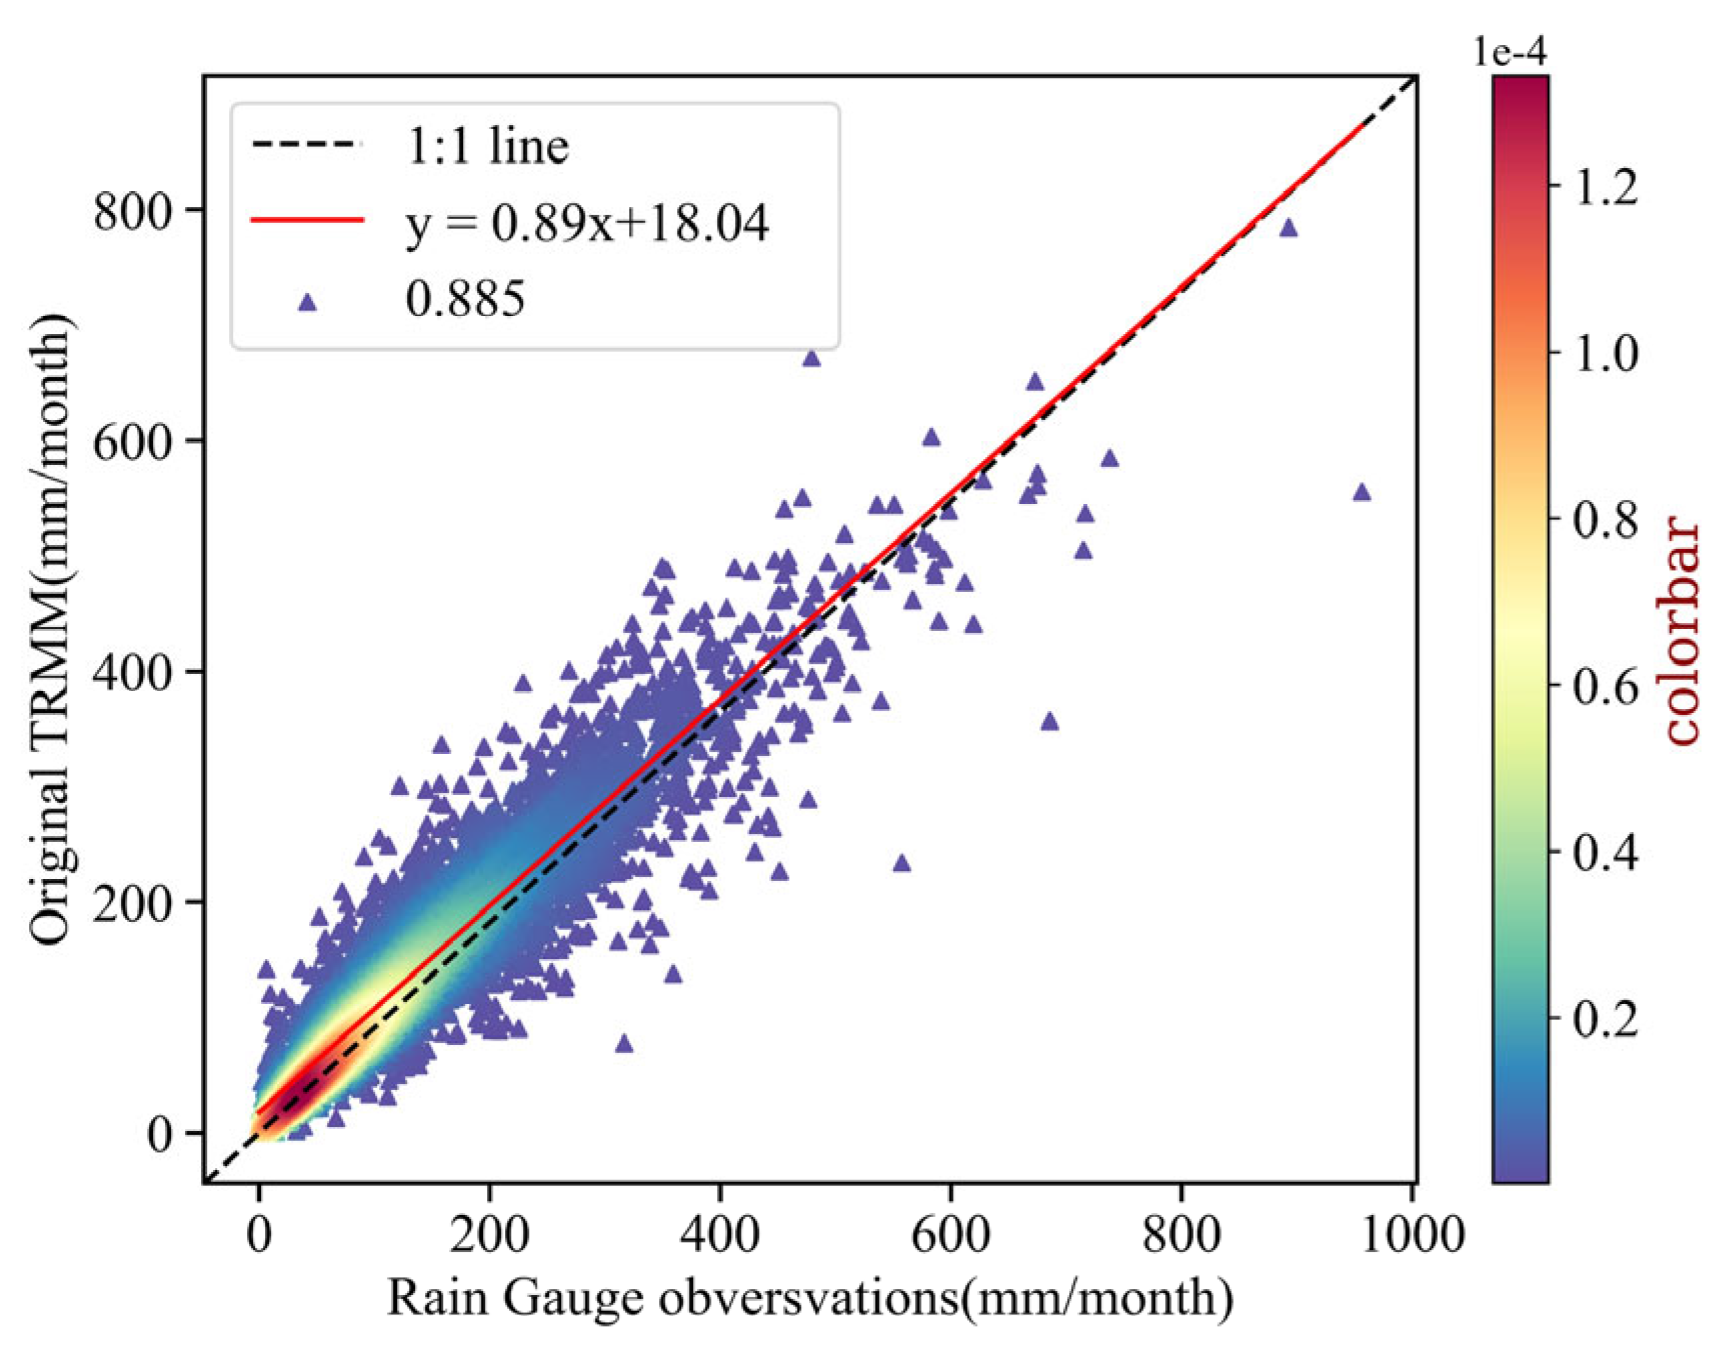
3.2. Suitability Analysis of Original TRMM Data

This study used continuous observation data from 30 ground meteorological stations in the Dongting Lake Basin and surrounding areas from 2001 to 2019 as benchmark data to evaluate the accuracy of the original TRMM data and downscaled products generated using two different strategies.
Table 2 presents the monthly average accuracy evaluation results of the original TRMM data from 2001 to 2019. The data show that the correlation coefficients (ccoef) between the original precipitation data (Origin) and the precipitation station observations for all months are higher than 0.8. Combined with the validation results of the TRMM data and the ground-observed monthly precipitation shown in Figure 5, it can be seen that the overall correlation between the basin TRMM data and the RGS is 0.885. The validation results are concentrated near the 1:1 line, indicating that the original TRMM precipitation data reliably reflect the temporal and spatial distribution of precipitation in the Dongting Lake Basin.

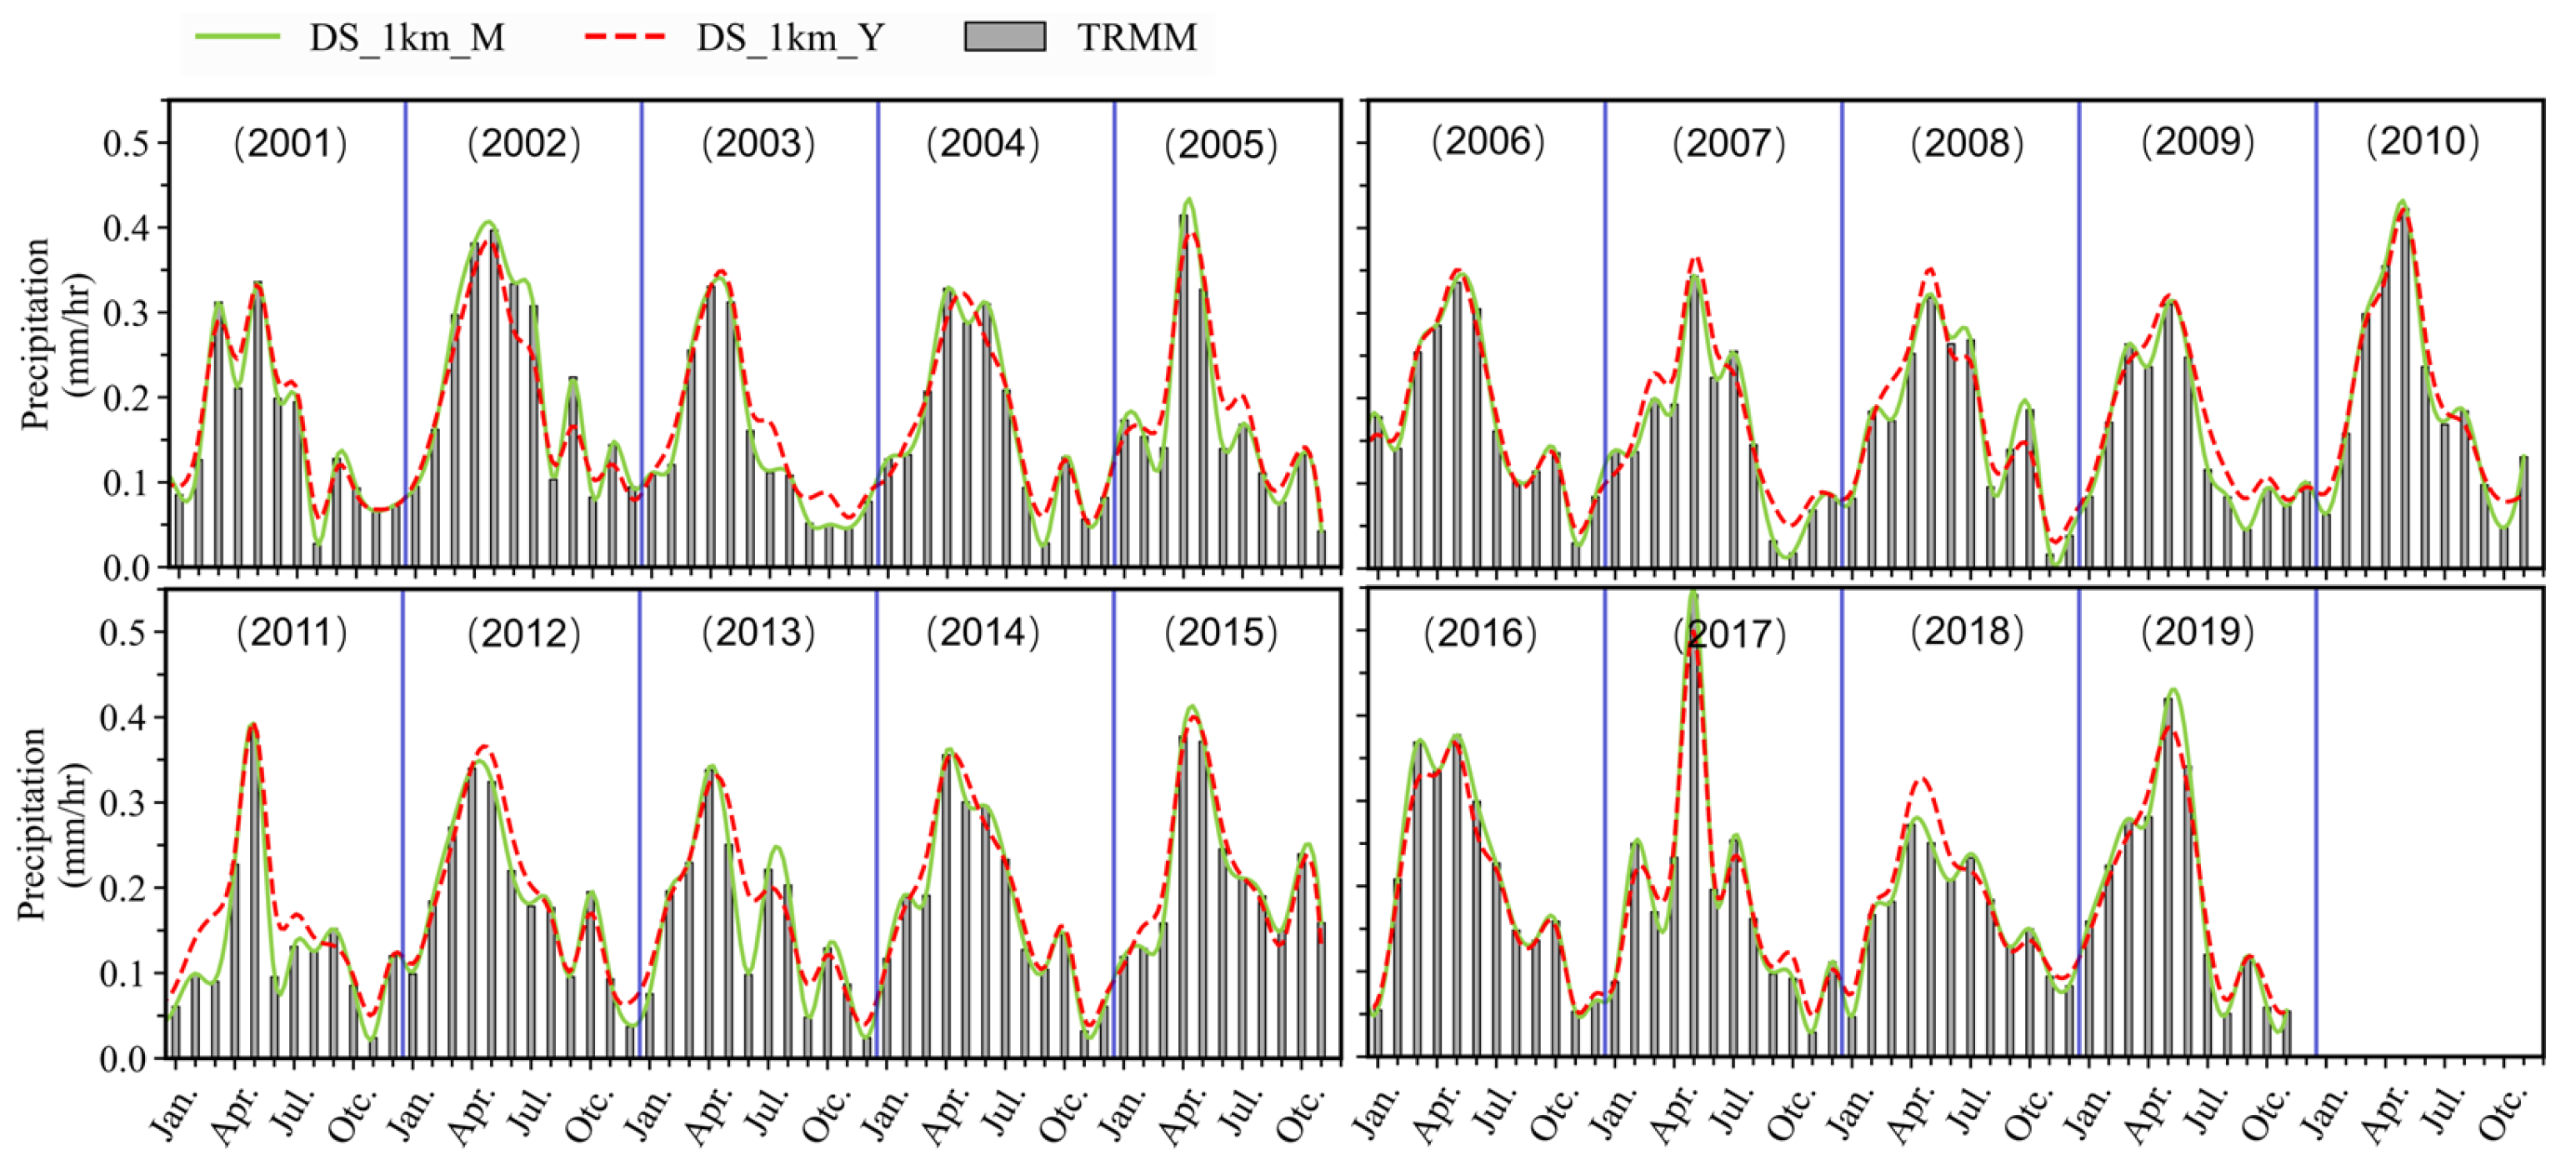
3.3. Accuracy Evaluation Analysis of Different Downscaling Strategies

The 0.25° × 0.25° resolution of the TRMM limits the number of samples in the study area and restricts the predictive ability of the downscaling model for various precipitation conditions. To explore the contribution of sample quantity and sample accuracy to the downscaling model, we attempted to merge the monthly precipitation samples from 2001 to 2019 for model training, based on the original monthly sample downscaling model training strategy. We investigated the performance of the downscaling model under two strategies (Table 3).
Overall, the accuracy validation results of the two downscaling methods show significant differences. Figure 6 presents the validation results of the observed values from 30 precipitation stations and the two downscaling data sets at a 1 km resolution from 2001 to 2019, with a total of 570 validation results. The test results show that the monthly downscaling method has a correlation coefficient (ccoef) of 0.855 and K = 0.87 (p < 0.01), which is significantly better than the multi-year monthly method (ccoef = 0.578, K = 0.68, p < 0.01). Additionally, the validation points of the monthly downscaling results are also significantly closer to the original 1:1 diagonal.
Figure 7 shows the comparison of three types of monthly precipitation data (the original TRMM precipitation, the monthly downscaled precipitation, and the multi-year monthly downscaled precipitation) from 2001 to 2019. The figure illustrates that the monthly precipitation time series trends of these three datasets are very similar. However, there are differences in absolute precipitation values. Overall, the multi-year averages of the three precipitation datasets are 0.172 mm/hr, 0.173 mm/hr, and 0.178 mm/hr, respectively. Compared to the original data, the multi-year monthly downscaled results significantly overestimate precipitation, especially in months with high precipitation (April, May, and June) or sudden changes, where the errors are more pronounced. The monthly downscaled data, on the other hand, shows results more consistent with the original TRMM data, both overall and on a monthly basis.

3.4. Downscaling Results and Their Spatiotemporal Distribution Characteristics

To evaluate the accuracy of the final downscaled data, we validated it using the RGS station observations and three statistical metrics: correlation coefficient (CC), root mean square error (RMSE), and bias. Additionally, we introduced an independent 1 km resolution data product for the study area [46], derived from downscaling 0.5° reanalysis data, for comparison. Figure 8 presents the accuracy validation results of the original TRMM data (OD), the downscaled precipitation data (DPD), and the comparison data (CD). The validation results indicate that our downscaled data (DPD) maintains a consistent accuracy evaluation with the original data (OD). The overall correlation coefficient (CC) fluctuates between 0.78 and 0.87, with an average of 0.82 and a standard deviation of 0.03, remaining stable and high throughout the year (Figure 8a). The RMSE and bias of the downscaled results show a consistent variation trend with the annual precipitation in the study area, ranging from 24.82 to 94.12, with an average RMSE of 53.28. Similar to the original TRMM data, our results generally overestimate precipitation compared to station observations in most months (annual average bias = 4.43). Additionally, for the spatial distribution of precipitation in the study area characterized by cloudy and rainy climates, our method’s data show significantly better accuracy compared to the national-scale independent dataset (CD).
Figure 9 shows the spatial distribution of average precipitation at a 1 km resolution generated by the monthly downscaling method from 2001 to 2019. The average monthly precipitation in the Dongting Lake Basin peaks in June and is at its lowest in December. In terms of spatial distribution, from November to April of the following year, precipitation is concentrated in the southeastern low-altitude areas, with the overall precipitation gradually decreasing from the southeast to the northwest. May and June are the months of heavy precipitation, with high rainfall across the entire study area, particularly in the central and southern edge regions. From July to October, precipitation is mainly concentrated in the northwestern high-altitude areas. The results indicate that the downscaled data have a spatial distribution consistent with the original TRMM data, while the downscaling results, in addition to ensuring accuracy, also reveal more local details.

3.5. Precipitation Variation Trends in the Dongting Lake Basin

We analyzed the spatiotemporal variation in monthly precipitation in the Dongting Lake Basin from 2001 to 2019. Using Theil-Sen median trend analysis and the Mann-Kendall test, we classified the spatial changes in precipitation into five types: significant decrease, slight decrease, stable, slight increase, and significant increase (Table 4). Figure 10 and Figure 11 show the area proportion and the spatial distribution of the average precipitation trend for different months, respectively.
From the perspective of precipitation change trends (Figure 10), the overall annual precipitation changes transition from a decrease to an increase. From January to May, the Dongting Lake Basin shows a decreasing trend in precipitation, primarily with slight decreases, averaging 80.73% of the area. The most significant change occurs in February, with 95.88% of the area showing a decreasing trend. In March, most areas see an increase in precipitation, accounting for 95.95%, with slight increases comprising 78.96% and significant increases comprising 16.99%. The increases are primarily concentrated in the northwest and eastern regions. From June to December, the trend primarily shows an increase, averaging 67.77% of the area. The largest area of significant increase occurs in September, covering 33.78% of the basin area. Spatially (Figure 11), the precipitation trend distribution results based on downscaled data exhibit detailed and smooth characteristics, capturing the influence of subtle topographic features on precipitation trends. This provides a better depiction of precipitation trend distribution differences in valleys, slopes, and small watersheds—details that are usually smoothed out in low-resolution data.
Additionally, we conducted a statistical analysis of the distribution of significant changes in precipitation based on the topography of the study area. Elevation data in the Dongting Lake Basin were divided equally by area into high (EL ≥ 525 m), medium (210 m ≤ EL < 525 m), and low (EL ≤ 210 m) zones. Monthly distributions of significant changes in average precipitation were recorded for each elevation zone (Figure 12). From 2001 to 2019, significant precipitation changes were mostly concentrated in the first half of the year, with the largest areas of change in January, March, and April, primarily in low elevation regions. The distribution area decreased with increasing elevation. In the second half of the year, significant changes in precipitation mainly showed an increase. In September, 90.78% of the significantly increased precipitation occurred in the medium to high elevation zones (above 210 m), increasing with elevation, while in November, the pattern was reversed.

4. Discussion

In regions characterized by cloudy and rainy climates, introducing cloud cover characteristics can significantly enhance the performance of monthly downscaling models. Precipitation, as a complex natural phenomenon, is influenced by a combination of macro-geographical factors, surface characteristics, climate, and more. Numerous studies have shown that precipitation is significantly affected by factors such as location, elevation, temperature, and vegetation conditions [27,47]. Among these, vegetation growth conditions serve as an important indicator of precipitation variations, and vegetation indices such as the Normalized Difference Vegetation Index (NDVI) and the Enhanced Vegetation Index (EVI) have been widely used in previous downscaling studies [47,48]. However, the response of precipitation to vegetation characteristics varies under different climatic and hydrothermal conditions. Compared to arid and semi-humid regions, the sensitivity of vegetation growth conditions to precipitation decreases in humid regions (annual precipitation >1200 mm) [29]. Vegetation typically responds to precipitation with a lag of 1–3 months, depending on latitude and type [49], leading most downscaling studies to establish relationships between precipitation and vegetation on annual or seasonal scales [24,50]. Additionally, in cloudy and rainy regions of mid to low latitudes, the heavy cloud cover hinders the acquisition of monthly vegetation data, thus limiting the performance of downscaling models.
Despite the challenges clouds pose for obtaining vegetation parameters, there exists a relationship between cloud cover and precipitation based on cloud type and geographical location. In remote sensing images, cloud cover characteristics are largely unaffected by other factors and exhibit stable information, showing good temporal consistency with precipitation. Therefore, incorporating cloud cover information into downscaling models provides a feasible method for achieving high-resolution monthly precipitation downscaling in the study area. The Dongting Lake Basin, a typical cloudy and rainy region in south-central China, has an annual average precipitation ranging from 1200 mm to 2000 mm, with significant spatiotemporal heterogeneity in precipitation across different months. In this study, we introduced cloud cover information into the downscaling model and explored the response relationship between environmental variables and precipitation across different months. The experiments demonstrated that cloud cover characteristics were the most important in most months (Figure 3), and including cloud cover variables significantly improved the performance of the downscaling model (Figure 4).
Due to the different climatic and vegetation growth conditions in various months, the response relationship between environmental characteristics and precipitation varies. Previous studies, limited by data acquisition difficulties and the lag effect of vegetation characteristics, often focused on annual scales, failing to reveal the response relationship between different characteristics and precipitation across different months. This study attempted to establish a downscaling model on a monthly scale and explore the monthly response relationship between environmental variables and precipitation. The results indicated that latitude and longitude played a dominant role in the downscaling model for all months, with an average annual contribution of over 80%. This conclusion aligns with previous research [28], indicating that latitude and longitude significantly affect the spatial heterogeneity of precipitation. Among vegetation characteristics, the NDVI and the EVI showed clear alternating contributions to the model in different months. The NDVI contributed more than the EVI in most months, especially during the dry season from October to January of the following year, while the EVI performed better from July to September. This phenomenon may be attributed to the saturation effect of vegetation indices. Studies have shown that the NDVI is more prone to saturation than the EVI when precipitation exceeds a certain threshold [29,51,52,53]. Due to the lag effect of precipitation on vegetation, as precipitation in the study area increases (peaking in June), vegetation conditions peak from July to August, causing the NDVI to saturate. During this period, the EVI can reflect more detailed characteristics of vegetation growth, thus contributing more to the downscaling model. The Xiangjiang River Basin, with a subtropical monsoon climate, has an annual average cloud frequency of over 70%. Besides latitude and longitude characteristics, cloud cover characteristics have the highest contribution in most months, especially from May to November, where cloud cover changes are strongly consistent with precipitation. Therefore, incorporating cloud cover characteristics into the downscaling model can somewhat compensate for the lag effect of vegetation characteristics, a result validated in tests of different variable combinations in the model (Figure 4).
This study proposes a monthly downscaling framework for TRMM precipitation products in cloudy and rainy regions of mid to low latitudes, leveraging the data and computational advantages of the GEE platform and considering the climatic characteristics of the study area. By integrating the GEE platform with a local Python environment and employing the Random Forest (RF) model, which includes cloud cover and other environmental features, we successfully downscaled monthly precipitation in these regions. Validation with the RGS observations showed that the downscaled product maintained high accuracy while improving resolution. However, this study has some limitations that could be addressed in future work. First, more environmental variables (such as temperature, wind speed, surface evaporation, atmospheric circulation, etc.) should be included and more suitable variable combinations explored. Second, considering the numerous factors influencing precipitation, particularly the significant impact of topography, this study included limited topographic analysis. Although the topographic variation in the Dongting Lake Basin is smaller than in regions like the Tibetan Plateau, achieving more refined precipitation estimates requires considering the impact of topography. Third, more machine learning algorithms, especially deep learning models like Convolutional Neural Networks (CNNs) and hybrid models, should be integrated into the precipitation downscaling framework. Fourth, further exploration of the downscaling of other satellite precipitation products is necessary. In addition to the TRMM, higher temporal and spatial resolution products like the GPM should be integrated, aiming for multi-source data fusion to improve precipitation downscaling accuracy.

5. Conclusions

This study integrates the the Google Earth Engine (GEE) platform with a local Python machine learning environment, using six environmental variables (longitude, latitude, elevation, cloud frequency, the EVI, and the NDVI) to establish the relationship between precipitation and environmental variables through a random forest model. The 25 km monthly TRMM 3B43 precipitation data was downscaled to 1 km, and the effectiveness of two downscaling strategies as well as the monthly precipitation downscaling in cloudy and rainy areas were evaluated. The main conclusions are as follows: (1) In the cloudy and rainy study area, the monthly downscaling results significantly improved the resolution while ensuring the accuracy of the precipitation data and added more detailed features. (2) There are differences in the response of precipitation to environmental variables across different months, with longitude and latitude characteristics playing a dominant role in the downscaling model. Among vegetation characteristics, the EVI performed better than the NDVI in the downscaling model. (3) The contribution of cloud characteristics to precipitation surpasses that of vegetation characteristics. The inclusion of cloud frequency partially overcomes the lag effect of vegetation characteristics on monthly precipitation downscaling, providing more information. The downscaling model that combines cloud and vegetation characteristics performs best. (4) In the precipitation downscaling model, the monthly strategy’s downscaling results are significantly better than the multi-year monthly strategy, making it more suitable for long-term precipitation downscaling studies. (5) From 2001 to 2019, the monthly precipitation trends in the Dongting Lake Basin exhibited seasonal variations. Precipitation decreased mainly during winter and spring (January to May) and increased during summer and autumn (June to December). Significant changes in precipitation trends were primarily concentrated in the months of January to May, with spatial distribution influenced by topographical variations.

Author Contributions

H.X. was responsible for the experimental designing, manuscript preparation, and data processing. H.P. contributed to conceptual designing, editing, and reviewing of the manuscript. J.Z. contributed to the final reviewing of the manuscript, funding acquisition, and project administration. H.G. contributed the structure designing, editing, and reviewing. D.J. and S.X. gave useful comments, which improved the paper. All authors have read and agreed to the published version of the manuscript.

Funding

This work was supported by the Research on the time series variations of River and Lake Ecosystem Status (K2022-B08-03), the National Key R&D Program of China (2021YFF0703903), the Regular Remote Sensing Survey and Assessment of National Ecological Status of China (22110499001001), the Natural Science Foundation of Hunan Province (2023JJ30236), and the Scientific Research Foundation of the Hunan Provincial Education Department (22B0475).

Data Availability Statement

The data presented in this study are available on request from the corresponding author. The data are not publicly available due to privacy.

Acknowledgments

We are very grateful to the editors and anonymous reviewers for their valuable comments, which greatly improved the quality of the paper.

Conflicts of Interest

The authors declare no conflicts of interest and no conflicts of interest with the China Three Gorges Corporation Company.

References

  1. Langella, G.; Basile, A.; Bonfante, A.; Terribile, F. High-Resolution Space–Time Rainfall Analysis Using Integrated ANN Inference Systems. J. Hydrol. 2010, 387, 328–342. [Google Scholar] [CrossRef]
  2. Li, M.; Shao, Q. An Improved Statistical Approach to Merge Satellite Rainfall Estimates and Raingauge Data. J. Hydrol. 2010, 385, 51–64. [Google Scholar] [CrossRef]
  3. Wu, C.; Chen, J.M. The Use of Precipitation Intensity in Estimating Gross Primary Production in Four Northern Grasslands. J. Arid Environ. 2012, 82, 11–18. [Google Scholar] [CrossRef]
  4. Li, Q.; Cao, Y.; Miao, S.; Huang, X. Spatiotemporal Characteristics of Drought and Wet Events and Their Impacts on Agriculture in the Yellow River Basin. Land 2022, 11, 556. [Google Scholar] [CrossRef]
  5. Brunner, M.I.; Swain, D.L.; Wood, R.R.; Willkofer, F.; Done, J.M.; Gilleland, E.; Ludwig, R. An Extremeness Threshold Determines the Regional Response of Floods to Changes in Rainfall Extremes. Commun. Earth Environ. 2021, 2, 173. [Google Scholar] [CrossRef]
  6. Goovaerts, P. Geostatistical Approaches for Incorporating Elevation into the Spatial Interpolation of Rainfall. J. Hydrol. 2000, 228, 113–129. [Google Scholar] [CrossRef]
  7. Ly, S.; Charles, C.; Degré, A. Different Methods for Spatial Interpolation of Rainfall Data for Operational Hydrology and Hydrological Modeling at Watershed Scale: A Review. Biotechnol. Agron. Société Environ. 2013, 17, 392–406. [Google Scholar]
  8. Jiang, S.; Ren, L.; Hong, Y.; Yong, B.; Yang, X.; Yuan, F.; Ma, M. Comprehensive Evaluation of Multi-Satellite Precipitation Products with a Dense Rain Gauge Network and Optimally Merging Their Simulated Hydrological Flows Using the Bayesian Model Averaging Method. J. Hydrol. 2012, 452–453, 213–225. [Google Scholar] [CrossRef]
  9. Henn, B.; Newman, A.J.; Livneh, B.; Daly, C.; Lundquist, J.D. An Assessment of Differences in Gridded Precipitation Datasets in Complex Terrain. J. Hydrol. 2018, 556, 1205–1219. [Google Scholar] [CrossRef]
  10. Gao, Z.; Long, D.; Tang, G.; Zeng, C.; Huang, J.; Hong, Y. Assessing the Potential of Satellite-Based Precipitation Estimates for Flood Frequency Analysis in Ungauged or Poorly Gauged Tributaries of China’s Yangtze River Basin. J. Hydrol. 2017, 550, 478–496. [Google Scholar] [CrossRef]
  11. Hu, Q.; Li, Z.; Wang, L.; Huang, Y.; Wang, Y.; Li, L. Rainfall Spatial Estimations: A Review from Spatial Interpolation to Multi-Source Data Merging. Water 2019, 11, 579. [Google Scholar] [CrossRef]
  12. Skaugen, T.; Andersen, J. Simulated Precipitation Fields with Variance-Consistent Interpolation. Hydrol. Sci. J. 2010, 55, 676–686. [Google Scholar] [CrossRef]
  13. Xu, S.; Wu, C.; Wang, L.; Gonsamo, A.; Shen, Y.; Niu, Z. A New Satellite-Based Monthly Precipitation Downscaling Algorithm with Non-Stationary Relationship between Precipitation and Land Surface Characteristics. Remote Sens. Environ. 2015, 162, 119–140. [Google Scholar] [CrossRef]
  14. Zhang, T.; Li, B.; Yuan, Y.; Gao, X.; Sun, Q.; Xu, L.; Jiang, Y. Spatial Downscaling of TRMM Precipitation Data Considering the Impacts of Macro-Geographical Factors and Local Elevation in the Three-River Headwaters Region. Remote Sens. Environ. 2018, 215, 109–127. [Google Scholar] [CrossRef]
  15. Skofronick-Jackson, G.; Petersen, W.A.; Berg, W.; Kidd, C.; Stocker, E.F.; Kirschbaum, D.B.; Kakar, R.; Braun, S.A.; Huffman, G.J.; Iguchi, T.; et al. The Global Precipitation Measurement (GPM) Mission for Science and Society. Bull. Am. Meteorol. Soc. 2017, 98, 1679–1695. [Google Scholar] [CrossRef]
  16. Huffman, G.J.; Adler, R.F.; Arkin, P.; Chang, A.; Ferraro, R.; Gruber, A.; Janowiak, J.; McNab, A.; Rudolf, B.; Schneider, U. The Global Precipitation Climatology Project (GPCP) Combined Precipitation Dataset. Bull. Am. Meteorol. Soc. 1997, 78, 5–20. [Google Scholar] [CrossRef]
  17. Huffman, G.J.; Bolvin, D.T.; Nelkin, E.J.; Wolff, D.B.; Adler, R.F.; Gu, G.; Hong, Y.; Bowman, K.P.; Stocker, E.F. The TRMM Multisatellite Precipitation Analysis (TMPA): Quasi-Global, Multiyear, Combined-Sensor Precipitation Estimates at Fine Scales. J. Hydrometeorol. 2007, 8, 38–55. [Google Scholar] [CrossRef]
  18. Kubota, T.; Shige, S.; Hashizume, H.; Aonashi, K.; Takahashi, N.; Seto, S.; Hirose, M.; Takayabu, Y.N.; Ushio, T.; Nakagawa, K.; et al. Global Precipitation Map Using Satellite-Borne Microwave Radiometers by the GSMaP Project: Production and Validation. IEEE Trans. Geosci. Remote Sens. 2007, 45, 2259–2275. [Google Scholar] [CrossRef]
  19. Sanchez-Moreno, J.F.; Mannaerts, C.M.; Jetten, V. Applicability of Satellite Rainfall Estimates for Erosion Studies in Small Offshore Areas: A Case Study in Cape Verde Islands. CATENA 2014, 121, 365–374. [Google Scholar] [CrossRef]
  20. Liu, X.C.; Zhao, J.J.; Zhang, H.Y.; Guo, X.Y.; Zhang, Z.X.; Fu, Y.Y. Accuracy Verification and Application of TRMM Precipitation Data in Northeast China. J. Nat. Resour. 2015, 30, 1047–1056. [Google Scholar] [CrossRef]
  21. Fang, J.; Yang, W.; Luan, Y.; Du, J.; Lin, A.; Zhao, L. Evaluation of the TRMM 3B42 and GPM IMERG Products for Extreme Precipitation Analysis over China. Atmos. Res. 2019, 223, 24–38. [Google Scholar] [CrossRef]
  22. Gebremichael, M.; Krajewski, W.F.; Over, T.M.; Takayabu, Y.N.; Arkin, P.; Katayama, M. Scaling of Tropical Rainfall as Observed by TRMM Precipitation Radar. Atmos. Res. 2008, 88, 337–354. [Google Scholar] [CrossRef]
  23. Sorooshian, S.; AghaKouchak, A.; Arkin, P.; Eylander, J.; Foufoula-Georgiou, E.; Harmon, R.; Hendrickx, J.M.H.; Imam, B.; Kuligowski, R.; Skahill, B.; et al. Advanced Concepts on Remote Sensing of Precipitation at Multiple Scales. Bull. Am. Meteorol. Soc. 2011, 92, 1353–1357. [Google Scholar] [CrossRef]
  24. Yan, X.; Chen, H.; Tian, B.; Sheng, S.; Wang, J.; Kim, J.-S. A Downscaling–Merging Scheme for Improving Daily Spatial Precipitation Estimates Based on Random Forest and Cokriging. Remote Sens. 2021, 13, 2040. [Google Scholar] [CrossRef]
  25. Immerzeel, W.W.; Rutten, M.M.; Droogers, P. Spatial Downscaling of TRMM Precipitation Using Vegetative Response on the Iberian Peninsula. Remote Sens. Environ. 2009, 113, 362–370. [Google Scholar] [CrossRef]
  26. Ghorbanpour, A.K.; Hessels, T.; Moghim, S.; Afshar, A. Comparison and Assessment of Spatial Downscaling Methods for Enhancing the Accuracy of Satellite-Based Precipitation over Lake Urmia Basin. J. Hydrol. 2021, 596, 126055. [Google Scholar] [CrossRef]
  27. Wang, H.; Zang, F.; Zhao, C.; Liu, C. A GWR Downscaling Method to Reconstruct High-Resolution Precipitation Dataset Based on GSMaP-Gauge Data: A Case Study in the Qilian Mountains, Northwest China. Sci. Total Environ. 2022, 810, 152066. [Google Scholar] [CrossRef]
  28. Elnashar, A.; Zeng, H.; Wu, B.; Zhang, N.; Tian, F.; Zhang, M.; Zhu, W.; Yan, N.; Chen, Z.; Sun, Z.; et al. Downscaling TRMM Monthly Precipitation Using Google Earth Engine and Google Cloud Computing. Remote Sens. 2020, 12, 3860. [Google Scholar] [CrossRef]
  29. Arshad, A.; Zhang, W.; Zhang, Z.; Wang, S.; Zhang, B.; Cheema, M.J.M.; Shalamzari, M.J. Reconstructing High-Resolution Gridded Precipitation Data Using an Improved Downscaling Approach over the High Altitude Mountain Regions of Upper Indus Basin (UIB). Sci. Total Environ. 2021, 784, 147140. [Google Scholar] [CrossRef] [PubMed]
  30. Foody, G.M. Geographical Weighting as a Further Refinement to Regression Modelling: An Example Focused on the NDVI–Rainfall Relationship. Remote Sens. Environ. 2003, 88, 283–293. [Google Scholar] [CrossRef]
  31. Li, B.; Tao, S.; Dawson, R.W. Relations between AVHRR NDVI and Ecoclimatic Parameters in China. Int. J. Remote Sens. 2002, 23, 989–999. [Google Scholar] [CrossRef]
  32. Quiroz, R.; Yarlequé, C.; Posadas, A.; Mares, V.; Immerzeel, W.W. Improving Daily Rainfall Estimation from NDVI Using a Wavelet Transform. Environ. Model. Softw. 2011, 26, 201–209. [Google Scholar] [CrossRef]
  33. Xu, K.J.; Zeng, H.D.; Zhang, Z.D.; Xie, J.S.; Yang, Y.S. Remote Sensing Analysis of the Correlation Between Forest Growing Season and Temperature and Precipitation in Subtropical Fujian Province. J. Geoinf. Sci. 2015, 17, 1249–1259. [Google Scholar]
  34. Zhang, Q.; Li, Y.Q.; Yang, Y.Y. Review of Research Progress on Cloud Cover and Its Relationship with Precipitation in China. Plateau Mt. Meteorol. Res. 2011, 31, 79–83. [Google Scholar] [CrossRef]
  35. Braga, R.C.; Rosenfeld, D.; Krüger, O.O.; Ervens, B.; Holanda, B.A.; Wendisch, M.; Krisna, T.; Pöschl, U.; Andreae, M.O.; Voigt, C.; et al. Linear Relationship between Effective Radius and Precipitation Water Content near the Top of Convective Clouds: Measurement Results from ACRIDICON–CHUVA Campaign. Atmos. Chem. Phys. 2021, 21, 14079–14088. [Google Scholar] [CrossRef]
  36. Yamaguchi, T.; Feingold, G. On the Relationship between Open Cellular Convective Cloud Patterns and the Spatial Distribution of Precipitation. Atmos. Chem. Phys. 2015, 15, 1237–1251. [Google Scholar] [CrossRef]
  37. Liu, Y.; Xi, D.-G.; Li, Z.-L.; Shi, C.-X. Analysis and Application of the Relationship between Cumulonimbus (Cb) Cloud Features and Precipitation Based on FY-2C Image. Atmosphere 2014, 5, 211–229. [Google Scholar] [CrossRef]
  38. Mahmoud, M.T.; Mohammed, S.A.; Hamouda, M.A.; Mohamed, M.M. Impact of Topography and Rainfall Intensity on the Accuracy of IMERG Precipitation Estimates in an Arid Region. Remote Sens. 2020, 13, 13. [Google Scholar] [CrossRef]
  39. Badas, M.G.; Deidda, R.; Piga, E. Orographic Influences in Rainfall Downscaling. Adv. Geosci. 2005, 2, 285–292. [Google Scholar] [CrossRef]
  40. Kileshye Onema, J.-M.; Taigbenu, A. NDVI–Rainfall Relationship in the Semliki Watershed of the Equatorial Nile. Phys. Chem. Earth Parts A/B/C 2009, 34, 711–721. [Google Scholar] [CrossRef]
  41. Jia, S.; Zhu, W.; Lű, A.; Yan, T. A Statistical Spatial Downscaling Algorithm of TRMM Precipitation Based on NDVI and DEM in the Qaidam Basin of China. Remote Sens. Environ. 2011, 115, 3069–3079. [Google Scholar] [CrossRef]
  42. Sen, P.K. Estimates of the Regression Coefficient Based on Kendall’s Tau. J. Am. Stat. Assoc. 1968, 63, 1379–1389. [Google Scholar] [CrossRef]
  43. Hamed, K.H.; Rao, A.R. A Modified Mann-Kendall Trend Test for Autocorrelated Data. J. Hydrol. 1998, 204, 182–196. [Google Scholar] [CrossRef]
  44. Hamed, K.H. Trend Detection in Hydrologic Data: The Mann–Kendall Trend Test under the Scaling Hypothesis. J. Hydrol. 2008, 349, 350–363. [Google Scholar] [CrossRef]
  45. Zhang, Y.; Li, Y.; Ji, X.; Luo, X.; Li, X. Fine-Resolution Precipitation Mapping in a Mountainous Watershed: Geostatistical Downscaling of TRMM Products Based on Environmental Variables. Remote Sens. 2018, 10, 119. [Google Scholar] [CrossRef]
  46. Peng, S.; Ding, Y.; Liu, W.; Li, Z. 1 Km Monthly Temperature and Precipitation Dataset for China from 1901 to 2017. Earth Syst. Sci. Data 2019, 11, 1931–1946. [Google Scholar] [CrossRef]
  47. Jing, W.; Yang, Y.; Yue, X.; Zhao, X. A Spatial Downscaling Algorithm for Satellite-Based Precipitation over the Tibetan Plateau Based on NDVI, DEM, and Land Surface Temperature. Remote Sens. 2016, 8, 655. [Google Scholar] [CrossRef]
  48. Duan, Z.; Bastiaanssen, W.G.M. First Results from Version 7 TRMM 3B43 Precipitation Product in Combination with a New Downscaling–Calibration Procedure. Remote Sens. Environ. 2013, 131, 1–13. [Google Scholar] [CrossRef]
  49. Ji, L.; Peters, A.J. Lag and Seasonality Considerations in Evaluating AVHRR NDVI Response to Precipitation. Photogramm. Eng. Remote Sens. 2005, 71, 1053–1061. [Google Scholar] [CrossRef]
  50. Shen, Z.; Yong, B. Downscaling the GPM-Based Satellite Precipitation Retrievals Using Gradient Boosting Decision Tree Approach over Mainland China. J. Hydrol. 2021, 602, 126803. [Google Scholar] [CrossRef]
  51. Mutanga, O.; Masenyama, A.; Sibanda, M. Spectral Saturation in the Remote Sensing of High-Density Vegetation Traits: A Systematic Review of Progress, Challenges, and Prospects. ISPRS J. Photogramm. Remote Sens. 2023, 198, 297–309. [Google Scholar] [CrossRef]
  52. Garroutte, E.L.; Hansen, A.J.; Lawrence, R.L. Using NDVI and EVI to Map Spatiotemporal Variation in the Biomass and Quality of Forage for Migratory Elk in the Greater Yellowstone Ecosystem. Remote Sens. 2016, 8, 404. [Google Scholar] [CrossRef]
  53. Shi, Y.; Song, L.; Xia, Z.; Lin, Y.; Myneni, R.B.; Choi, S.; Wang, L.; Ni, X.; Lao, C.; Yang, F. Mapping Annual Precipitation across Mainland China in the Period 2001–2010 from TRMM3B43 Product Using Spatial Downscaling Approach. Remote Sens. 2015, 7, 5849–5878. [Google Scholar] [CrossRef]
Figure 1. Location of the Dongting Lake Basin and the distribution of meteorological stations.
Remotesensing 16 02959 g001
Figure 2. Flowchart of the TRMM downscaling framework integrating Google Earth Engine and Python-based native machine learning methods.
Remotesensing 16 02959 g002
Figure 3. Monthly average importance in distribution of features (a) and annual variation in precipitation and environmental features (b).
Remotesensing 16 02959 g003
Figure 4. Model accuracy validation results of five features and their combinations.
Remotesensing 16 02959 g004
Figure 5. Validation results of original TRMM precipitation dataset with the RGS.
Remotesensing 16 02959 g005
Figure 6. Validation results of two precipitation datasets with 30 rain gauge stations from 2001 to 2019: (a) Annual monthly strategy downscaled data (b) Multi-year monthly strategy downscaled data.
Remotesensing 16 02959 g006
Figure 7. Monthly precipitation variations of three datasets from 2001 to 2019.
Remotesensing 16 02959 g007
Figure 8. Monthly accuracy validation results of downscaled precipitation data: Correlation Coefficient (CC) (a), Root Mean Square Error (RMSE) (b), and Bias (c).
Remotesensing 16 02959 g008
Figure 9. Monthly spatial distribution of downscaled precipitation from TRMM data from 2001 to 2019.
Remotesensing 16 02959 g009
Figure 10. Area proportion of average precipitation change trends in different months from 2001 to 2019.
Remotesensing 16 02959 g010
Figure 11. Spatial distribution of monthly average precipitation change trends in the Dongting Lake Basin.
Remotesensing 16 02959 g011
Figure 12. Proportion of precipitation area with significant variation trends at different altitudes.
Remotesensing 16 02959 g012
Table 1. Monthly importance of downscaling environmental variables.
MonthLonLatCloud_freqEVINDVIElev
136.76%40.87%7.79%2.92%6.64%5.03%
226.81%60.52%3.38%2.22%2.95%4.12%
333.34%55.97%3.08%2.11%2.48%3.02%
436.75%48.67%4.14%2.55%2.82%5.08%
542.31%34.88%9.83%3.57%3.72%5.68%
649.17%31.49%7.38%2.55%3.25%6.17%
743.83%39.24%6.70%3.02%2.45%4.76%
839.84%38.99%5.56%3.62%3.34%8.65%
935.03%41.26%6.22%4.57%4.11%8.82%
1036.56%37.89%15.26%2.13%4.77%3.39%
1139.14%41.24%10.00%1.92%3.35%4.35%
1235.62%44.43%7.55%3.48%4.04%4.87%
Table 2. Validation results of original TRMM data from 2001 to 2019.
MonthccoefRMSE
10.82277817.4107
20.86616318.9472
30.87900126.51058
40.84975436.51156
50.82679547.1467
60.89429348.53282
70.88636244.43203
80.80399444.53409
90.80877632.59009
100.86614719.80569
110.8622621.33393
120.83847414.87215
Table 3. Two downscaling strategies.
StrategyMonthlyMulti-Year Monthly
DescriptionThe downscaling model is trained using the sample data from each month of the current year. Twelve models are trained annually, one for each month, to downscale precipitation for the corresponding periods.All samples from 2001 to 2019 are aggregated. The model for each month is trained using the long-term sample set of that month, resulting in twelve models in total, each applied to the corresponding month’s precipitation downscaling for each year.
Table 4. Statistical rules for change trends.
S p Z M K HVariation Types
<−0.0005≥1.96>0.5Significantly reduced
<−0.0005−1.96~1.96>0.5Slightly reduced
−0.0005–0.0005−1.96~1.96>0.5Stable and unchanged
≥0.0005−1.96~1.96>0.5Slight increase
≥0.0005<−1.96>0.5Significant increase
Disclaimer/Publisher’s Note: The statements, opinions and data contained in all publications are solely those of the individual author(s) and contributor(s) and not of MDPI and/or the editor(s). MDPI and/or the editor(s) disclaim responsibility for any injury to people or property resulting from any ideas, methods, instructions or products referred to in the content.

