This section describes extensive experiments to evaluate the model’s effectiveness and performance in remote sensing small object detection. Firstly, the datasets used in the experiments are introduced, followed by explanations of the experimental settings and evaluation metrics. Finally, the results of the ablation studies and comparative experiments are presented, and the observed phenomena and trends are discussed.
4.1. Datasets
DOTA-v2.0. DOTA-v2.0 is a benchmark dataset released by Wuhan University that is widely used for object detection in remote sensing images. The dataset contains 11,268 high-resolution aerial and satellite images and 1,793,658 annotated instances covering 18 object classes, such as aircraft, harbors, etc. The high-resolution images and different object classes of the DOTA-v2.0 dataset provide rich test samples for the evaluation of the performance of different detection algorithms. As a publicly available benchmark dataset, DOTA-v2.0 provides a unified evaluation tool that facilitates direct comparisons with existing methods and ensures reproducible and comparable research results. The details of each category in DOTA-v2.0 are shown in
Table 2.
SODA-A. The SODA-A dataset is designed for small object detection and was released by the Northwestern Polytechnical University. The dataset contains 2513 high-resolution aerial images, in which 872,069 objects are labeled with orientation frames, covering nine categories, such as airplanes, helicopters, and ships, etc. The high-density and multi-directional small object annotations in the SODA-A dataset provide ideal test samples for the evaluation of small object detection algorithms for remote sensing. The details of each category in SODA-A are shown in
Table 3.
VisDrone. The VisDrone dataset is a benchmark for UAV vision tasks and is published by the University of Science and Technology of China. The dataset consists of 10,209 high-resolution images and video frames covering 79,658 labeled instances distributed across 10 object classes, including pedestrians, vehicles, traffic lights, etc. The scene diversity and rich object classes of the VisDrone dataset allow for the analysis of model performance in complex urban environments and dynamic scenes. In addition, the multi-angle and multi-scale features of the objects in the VisDrone dataset can also be exploited to verify the robustness and generalization abilities of the model in practical applications.
Table 4 presents the detailed information of each category in the VisDrone dataset.
4.2. Implementation Details
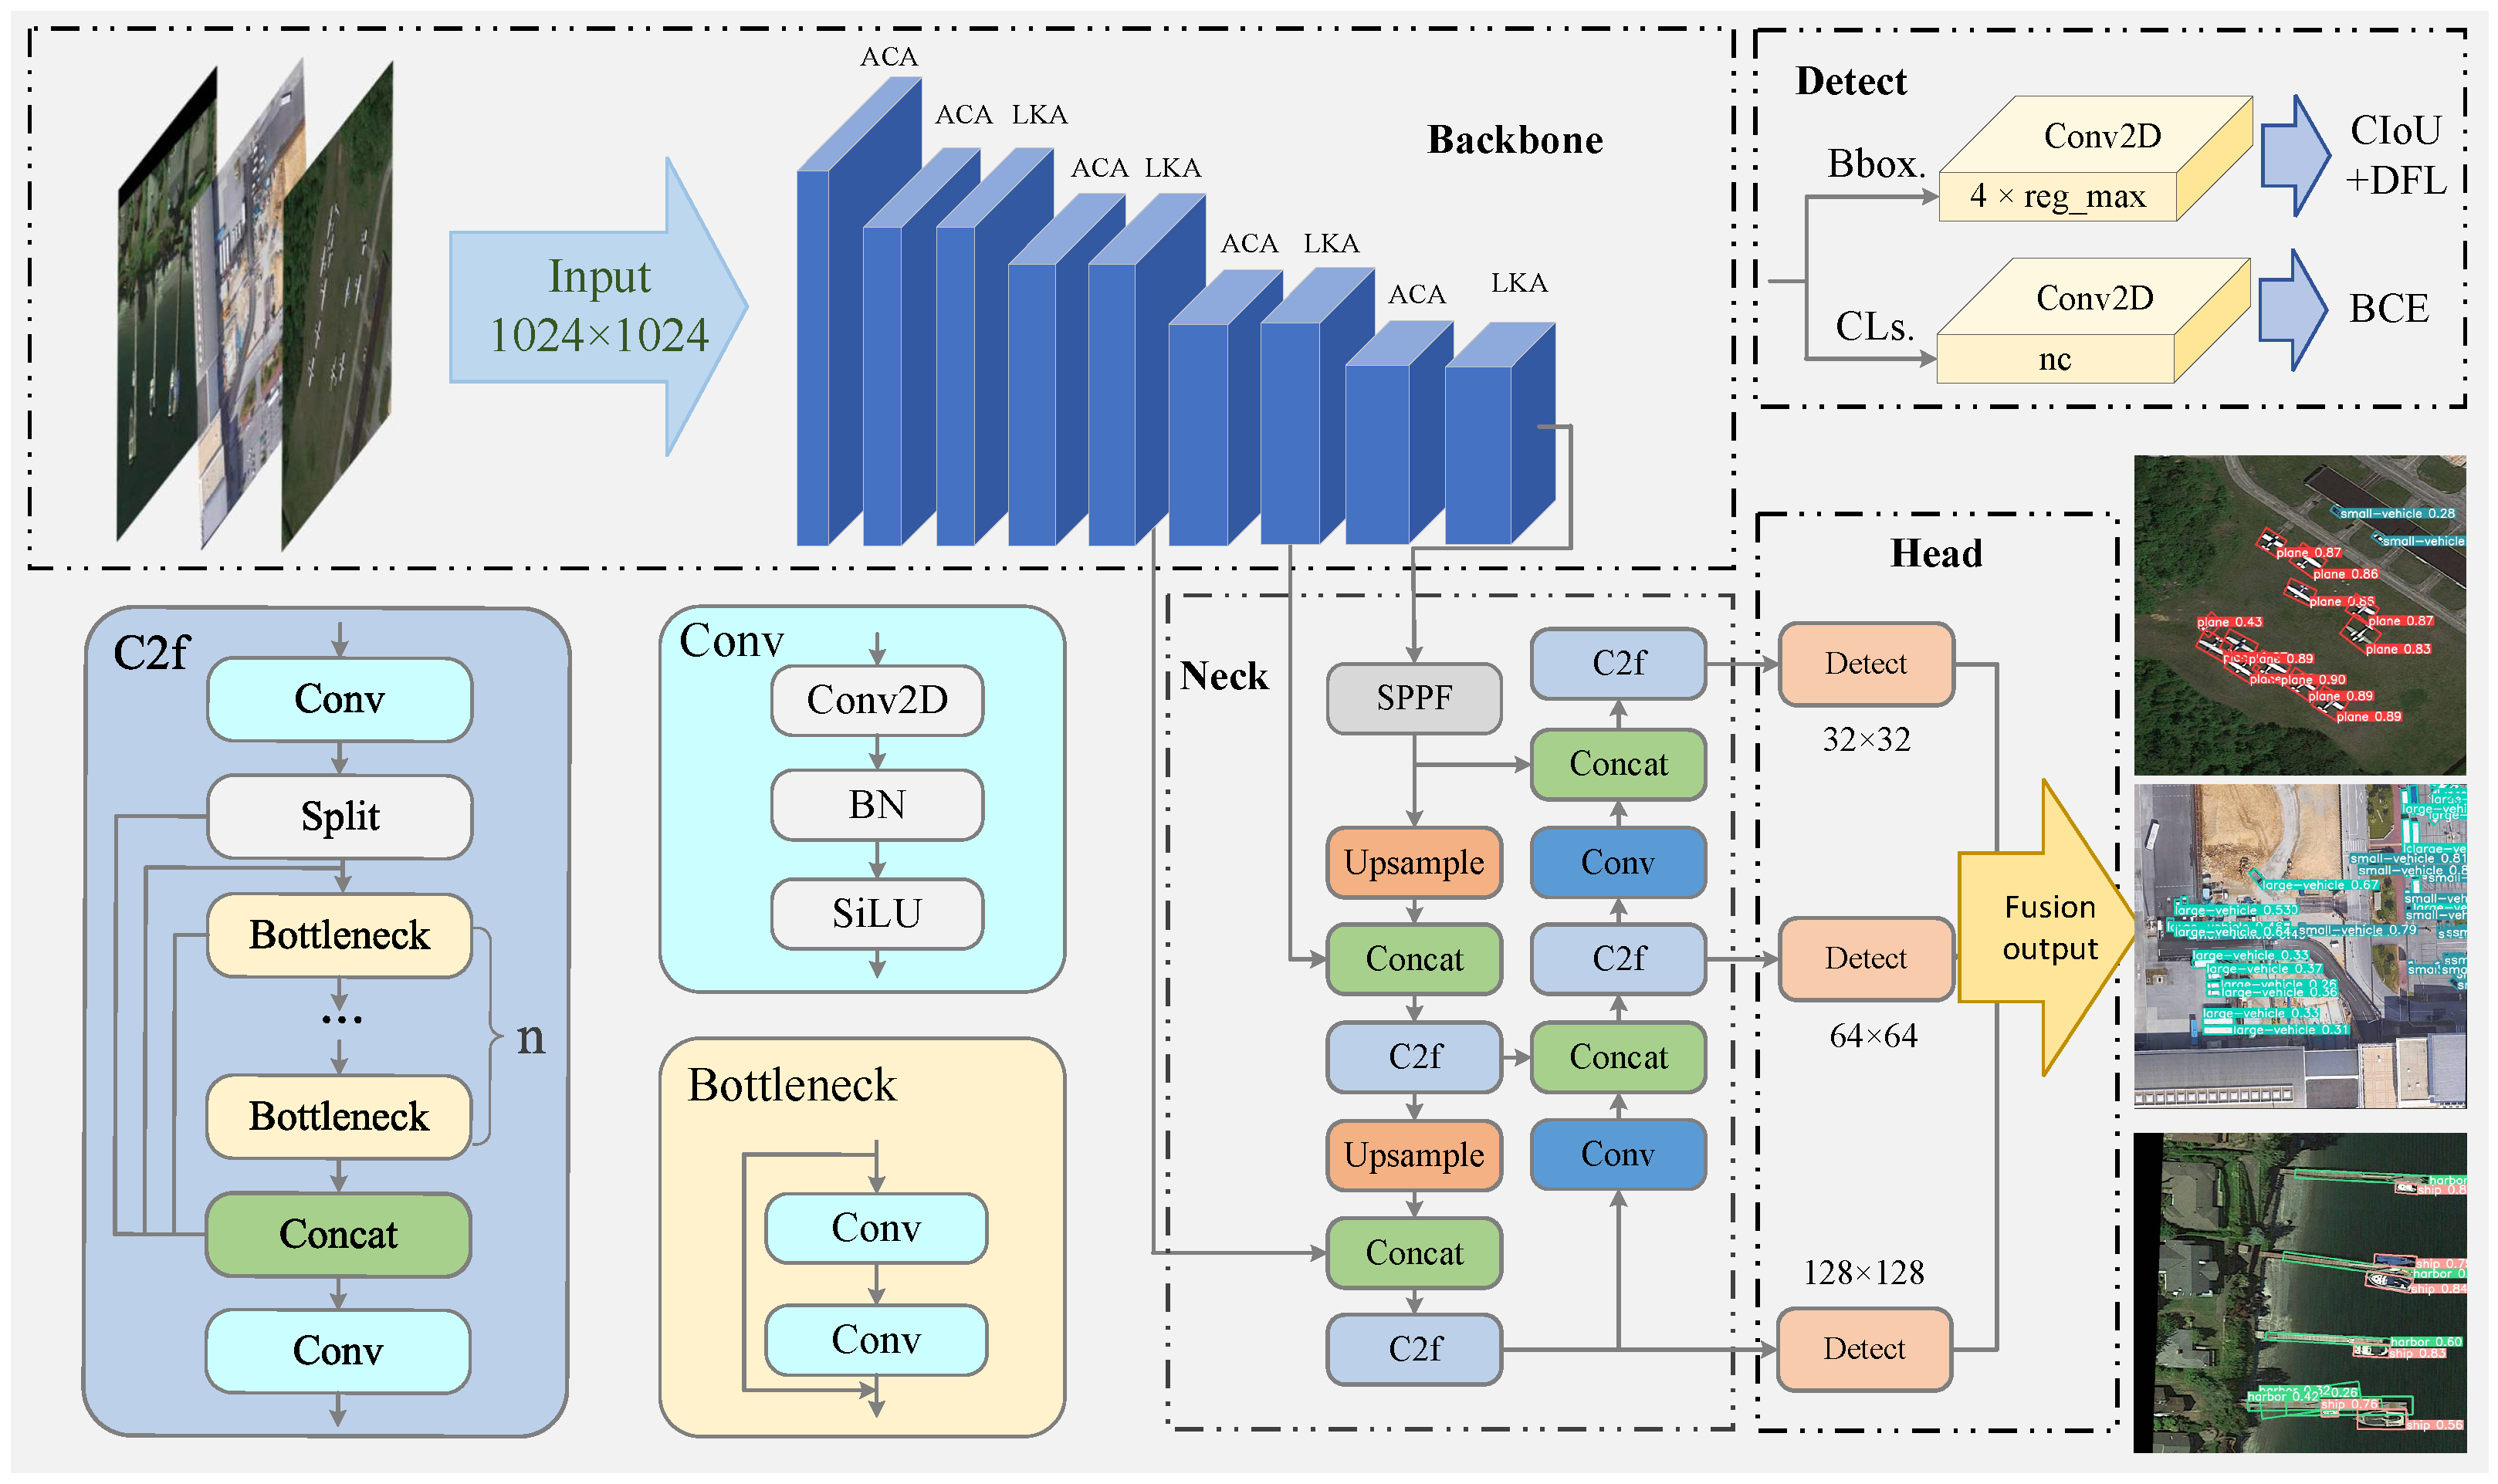
This paper reports experimental results obtained on the DOTA-v2.0 and VisDrone datasets to evaluate the model’s performance. To ensure fairness, a unified data processing method was employed: the original images were cropped into 1024 × 1024 patches with a pixel overlap of 150 between adjacent patches. All experiments were conducted using a single NVIDIA 4090 GPU with a batch size of 6 for model training and testing.
A stochastic gradient descent (SGD) optimizer was used for training, with a learning rate of 0.01, momentum of 0.9, and weight decay of 0.0005. The classification loss was computed using BCE, and the bounding box regression loss was computed using the CIoU and DFL.
Pre-training was conducted on the ImageNet dataset for 400 epochs. For the ablation studies, the model was trained for 20 epochs to ensure that the proposed methods could achieve good results within a limited number of iterations. For the comparative experiments on the DOTA-v2.0 and VisDrone datasets, the model was trained for 50 epochs and the performance on the two datasets was evaluated using the mAP50 of each class and the mAP50 of the total class, as well as the mAP50 and the mAP95 as the evaluation metrics, respectively.
4.3. Comparative Experiments
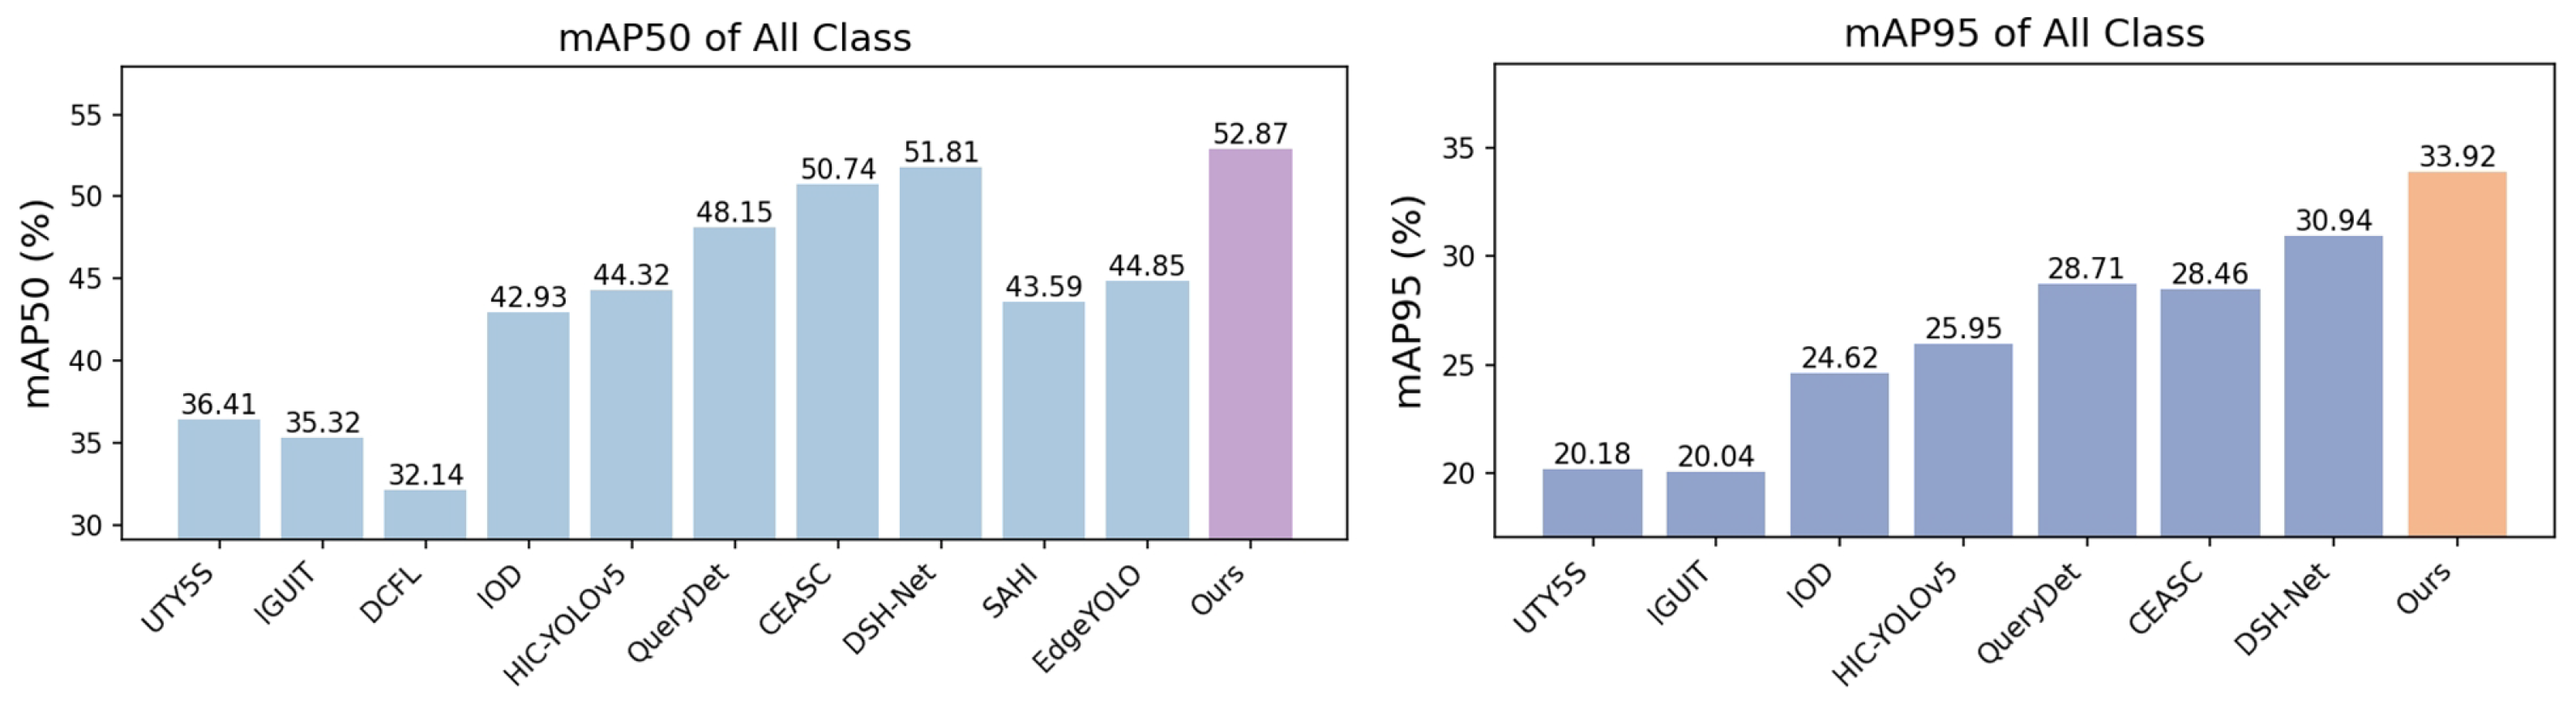
Results on the DOTA dataset. The proposed method achieved state-of-the-art performance, with a 63.01% mAP50 on the DOTA-v2.0 OBB benchmark.
From
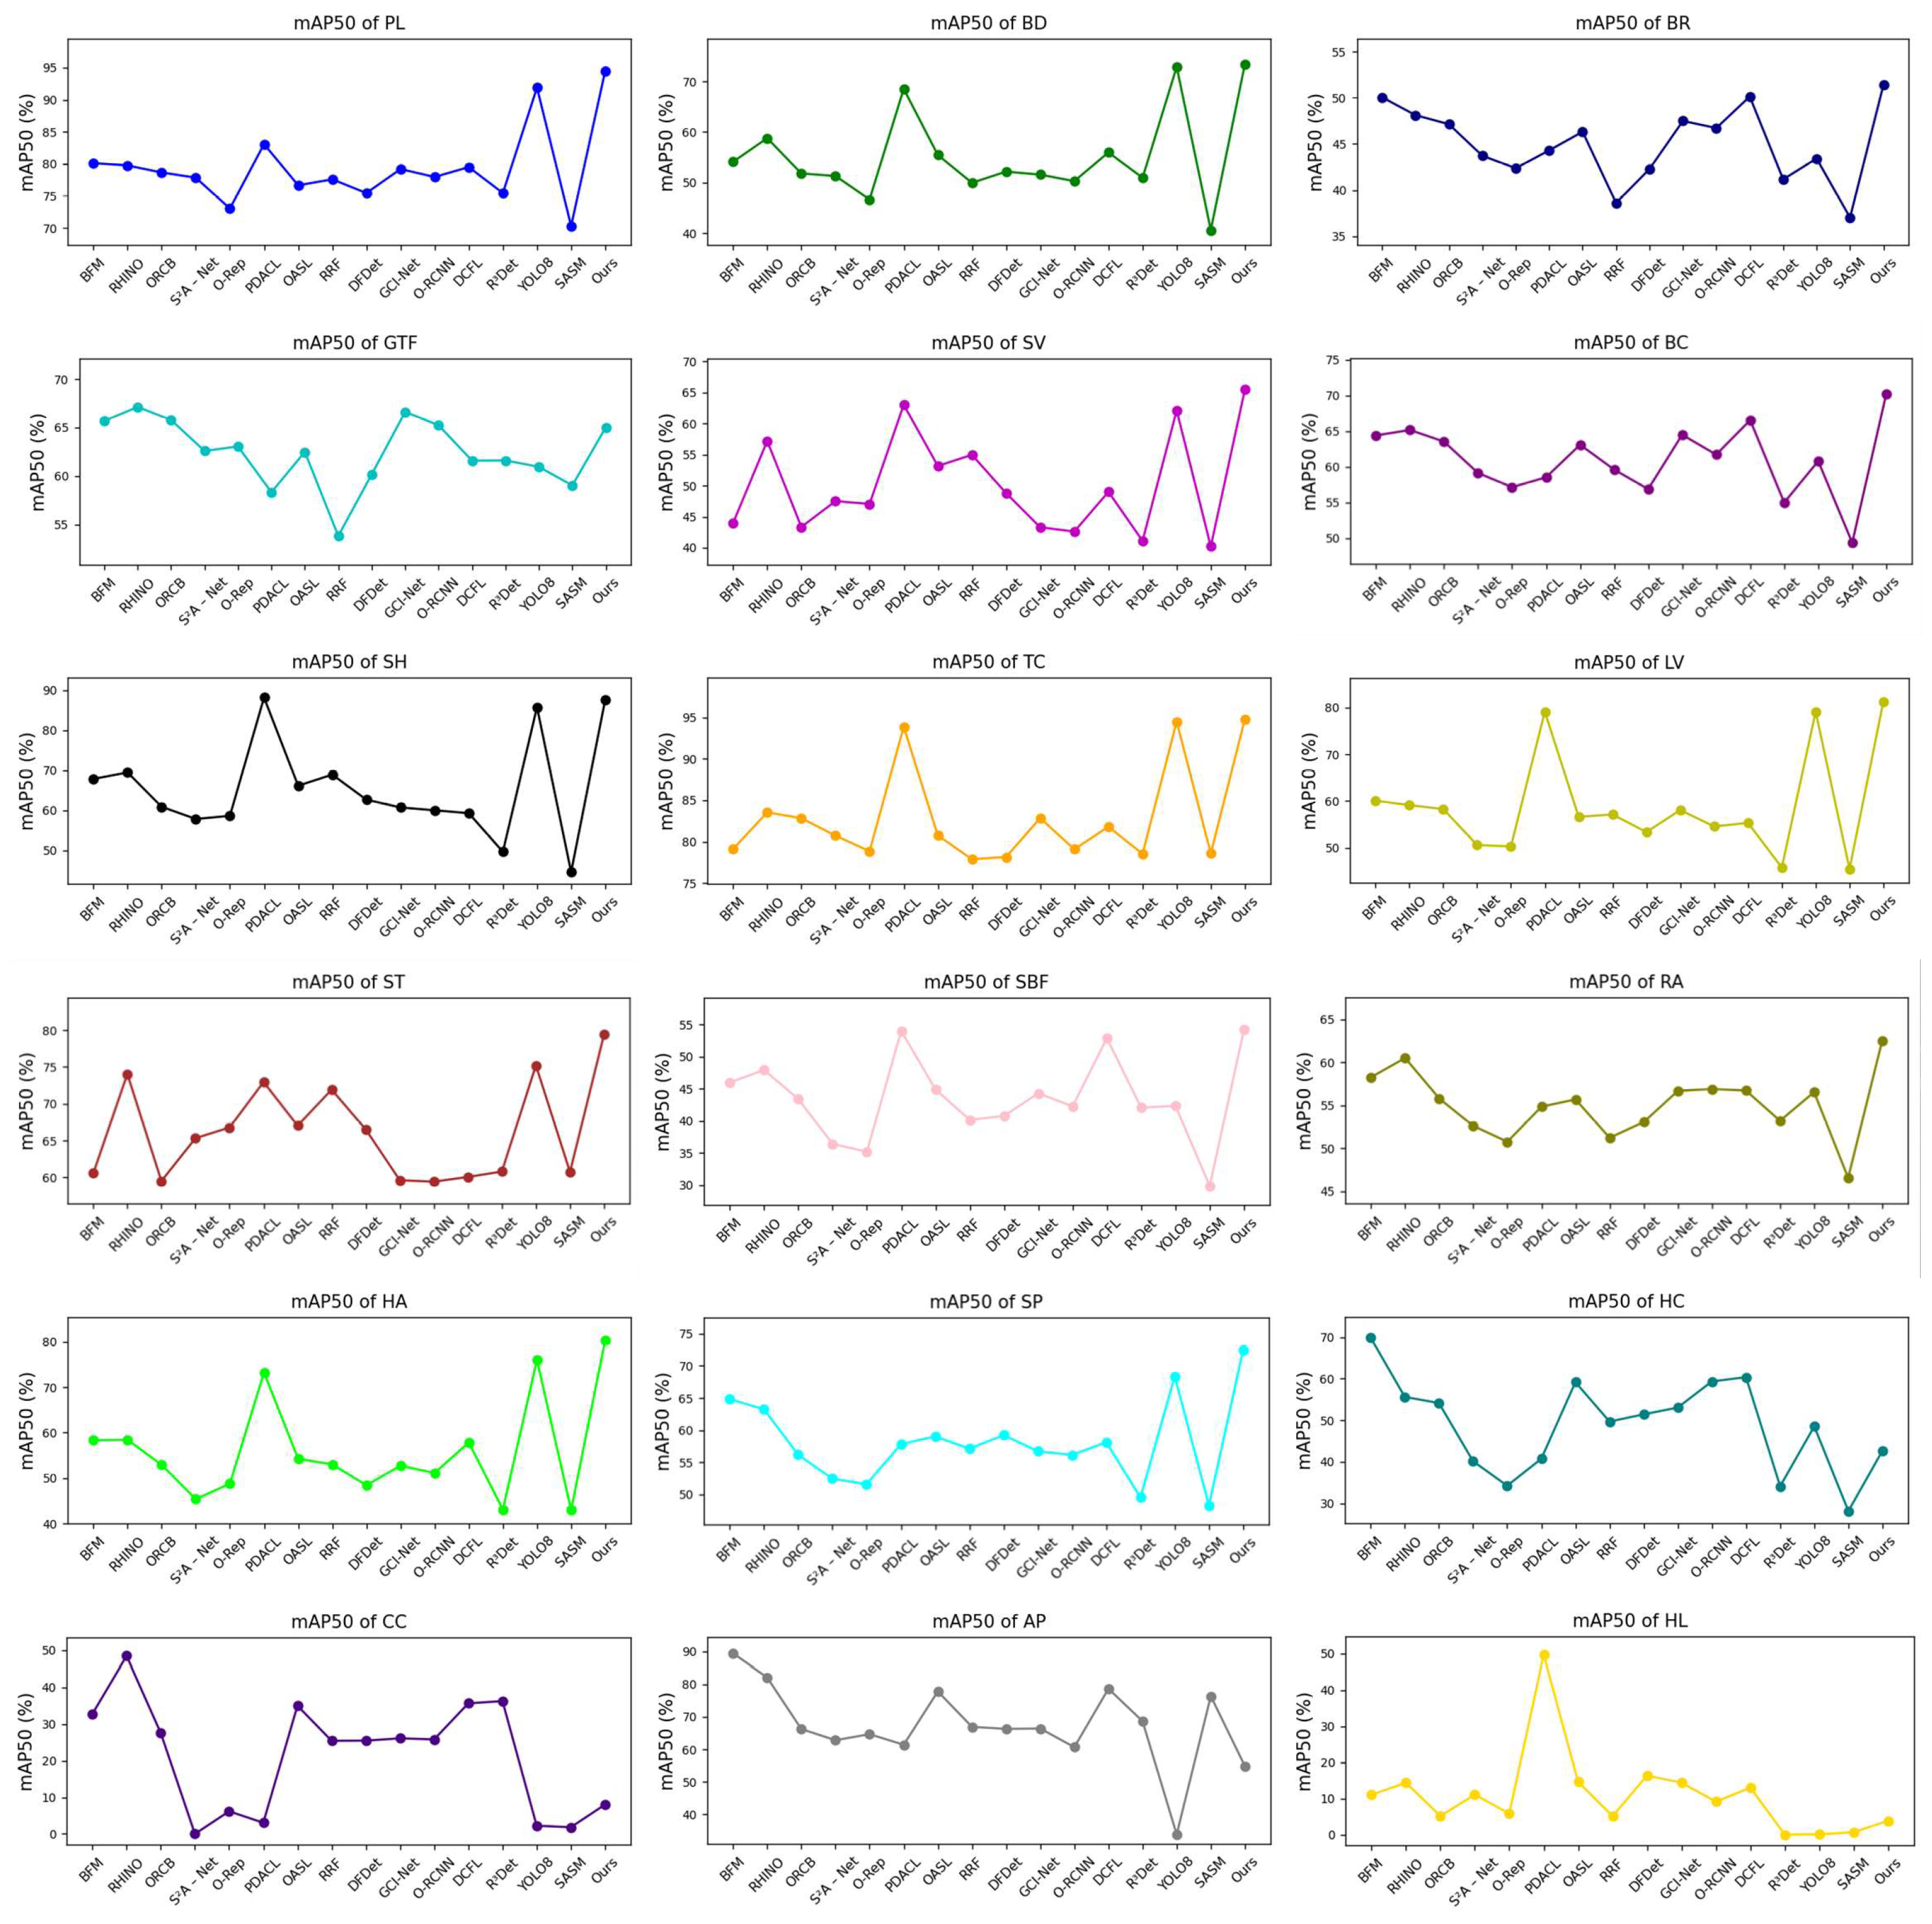
Table 5, it can be observed that, compared to previous methods, LARS achieved significant improvements in detection, achieving higher average precision and more accurate localization. The detection results for each category, as well as the overall detection accuracy, are visually presented in
Figure 4 and
Figure 5 using line and bar charts.
Results on the SODA-A dataset. This paper further highlights the performance of LARS on the SODA-A dataset. The experimental results demonstrate the performance of our method compared with other multi-stage and single-stage detection methods on the SODA-A dataset.
As shown in
Table 6, our method achieves significant performance improvements in all metrics, especially in small object detection. AP
eS, AP
rS, AP
gS, and AP
N each represent the detection accuracy for extremely small, relatively small, generally small, and normal objects [
3]. Our model outperforms all other comparative methods in all four metrics, which indicates that our method has higher accuracy in detecting small objects. In addition, our method also performs well in terms of the overall average precision (AP) and high-confidence detection (AP
75), reaching 49.4 and 59.3, respectively, proving our method’s accuracy in detecting small objects in complex aerial photography scenes.
Results on the VisDrone dataset. This paper further examines the performance of LARS on the VisDrone dataset. The VisDrone dataset has richer scenarios and more challenges, which enables us to evaluate the performance and generalization ability of the model more comprehensively. Next, this paper will analyze the experimental results on the VisDrone dataset to further validate the validity and generalization of the proposed approach, and the experimental results are shown in
Table 7.
Figure 6 lists the results of the comparison tests on the VisDrone dataset, showing that LARS performs well in dealing with various challenging scenarios. Compared with other methods, LARS achieves higher values in the mAP evaluation metric, which indicates that the model not only covers real objects more effectively but also identifies the object boundaries more accurately.
Overall, the experimental results show that the method proposed in this paper not only achieves significant performance improvements on the DOTA-v2.0 dataset but also achieves excellent detection performance on the VisDrone dataset, which proves the versatility and effectiveness of the method. In addition, the results prove that the proposed method has good generalization.
4.4. Ablation Experiments
This section reports the results of the ablation experiments on the DOTA-v2.0 dataset to investigate the method’s effectiveness.
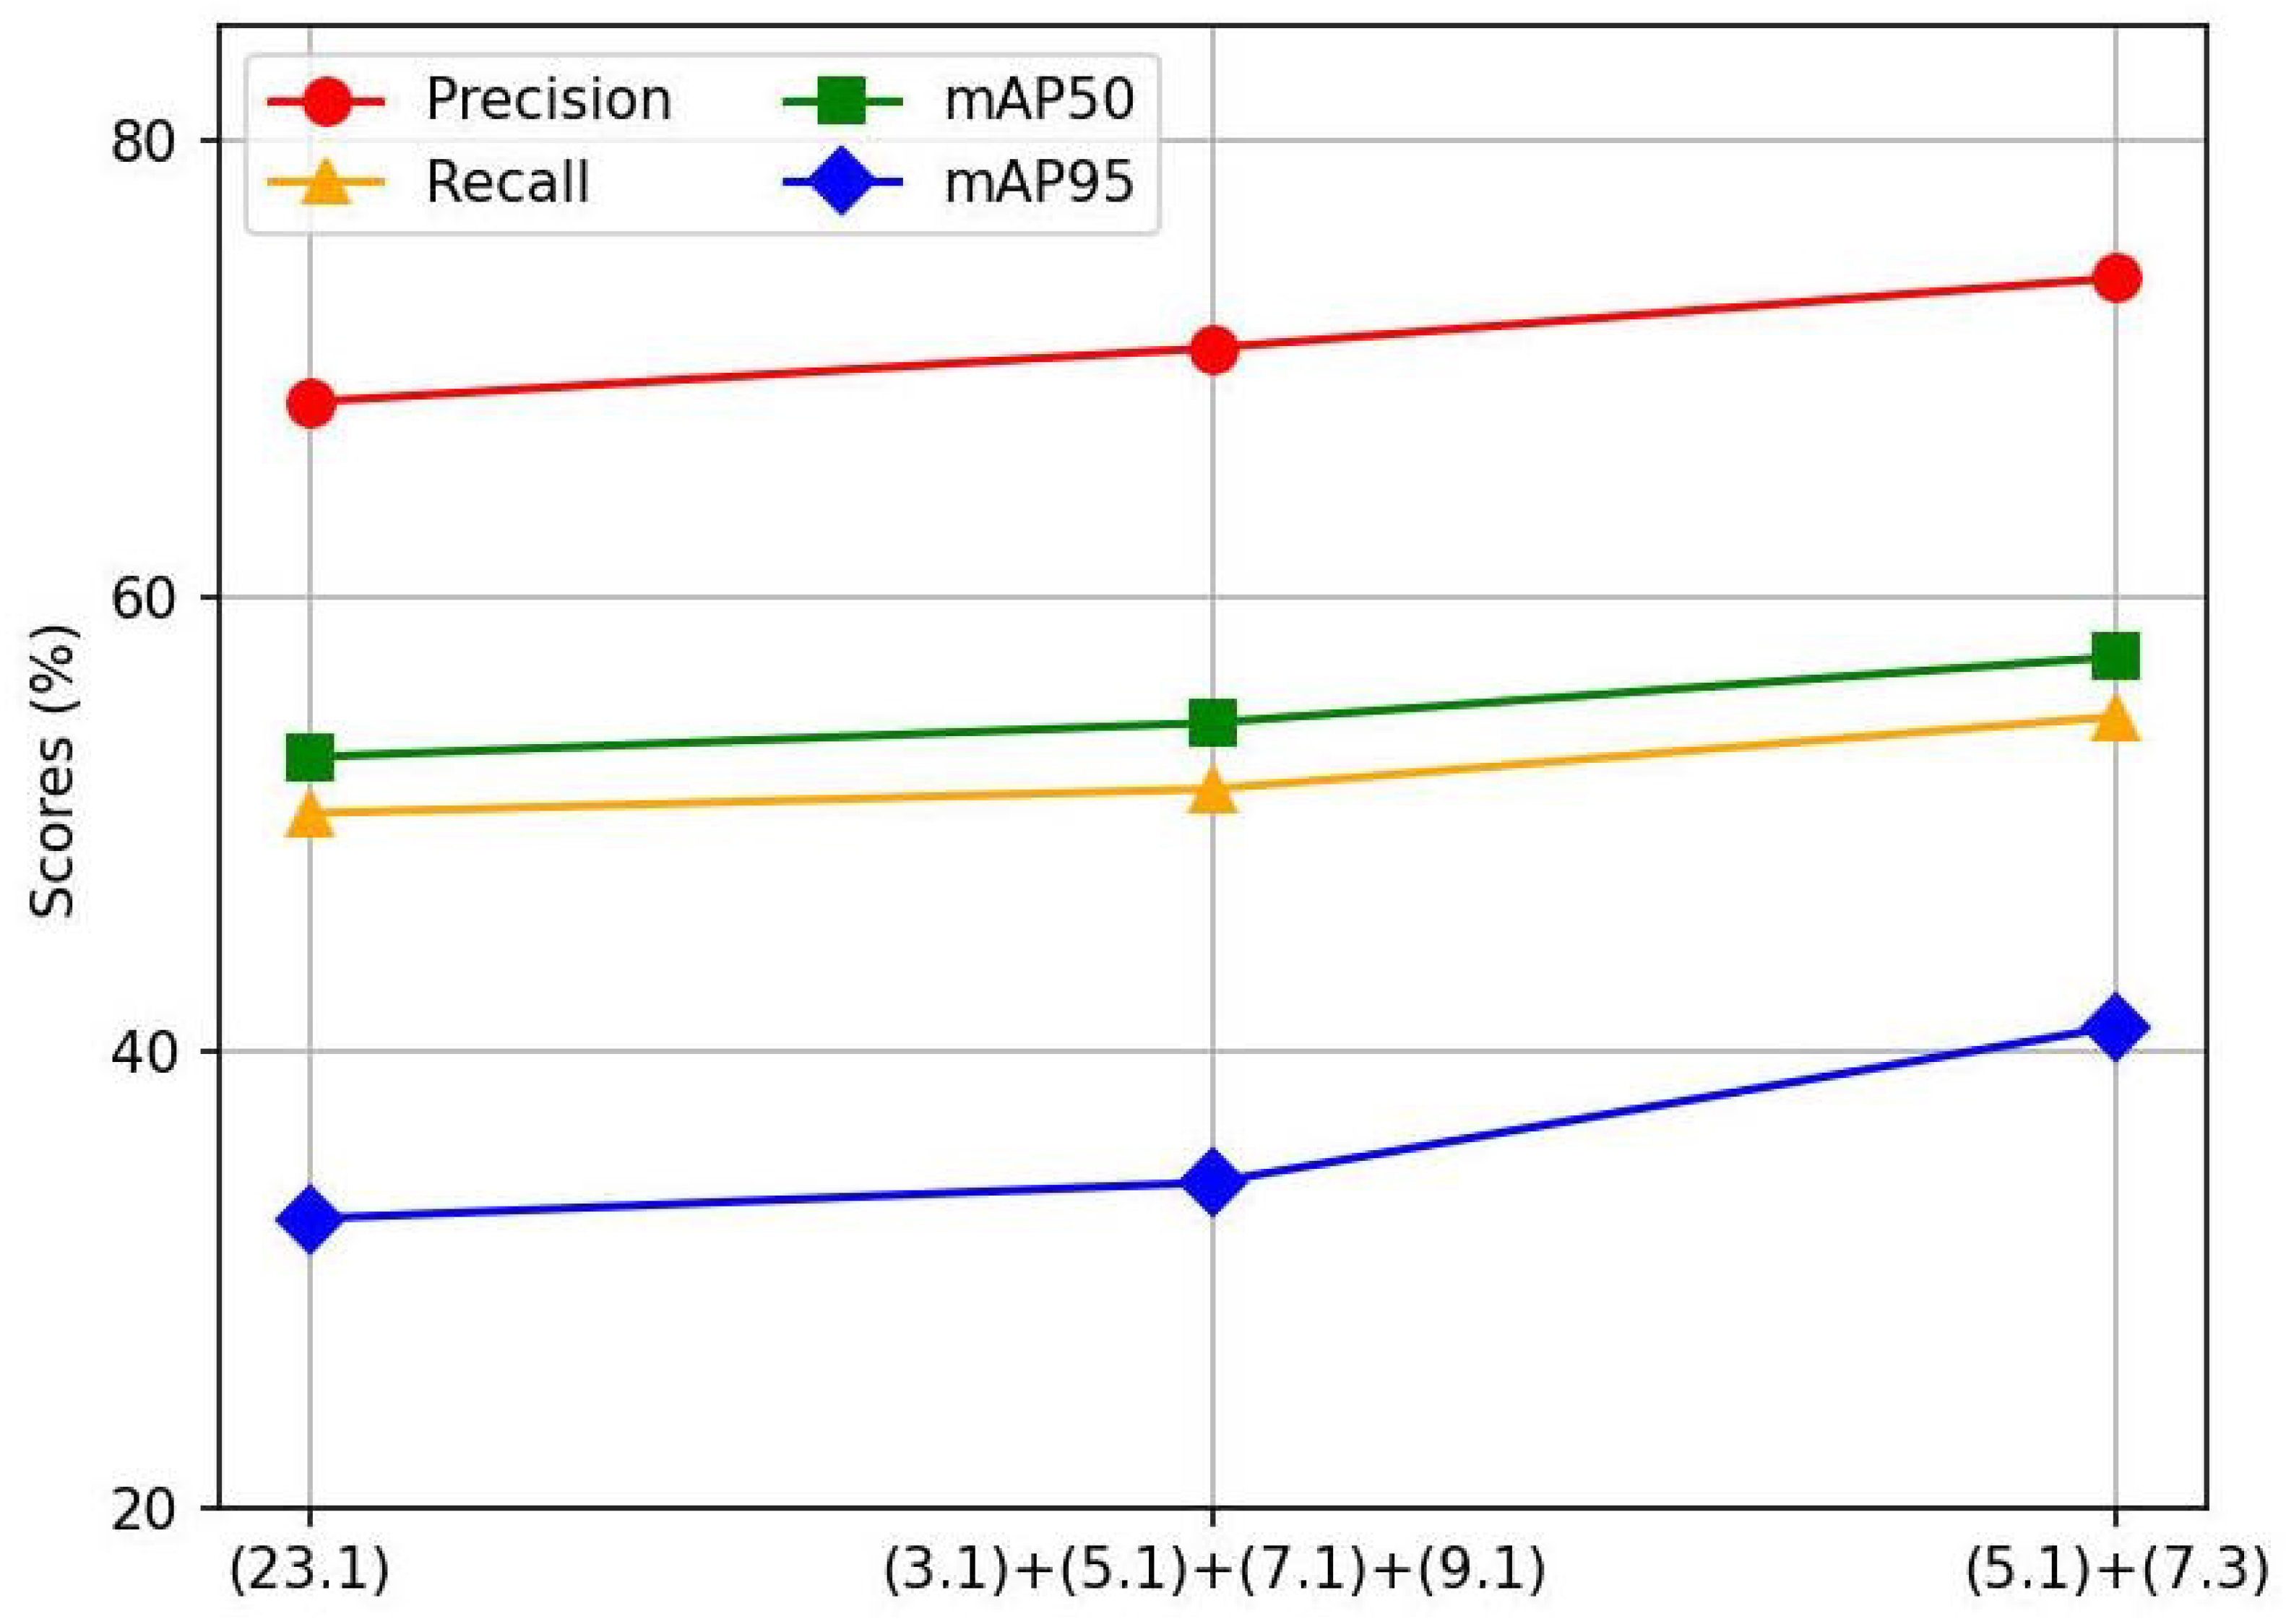
Different decomposition strategies. Setting the theoretical receptive field as 23, the results of the ablation study on the number of large kernel decompositions are shown in
Table 8, and the visualization results are illustrated in
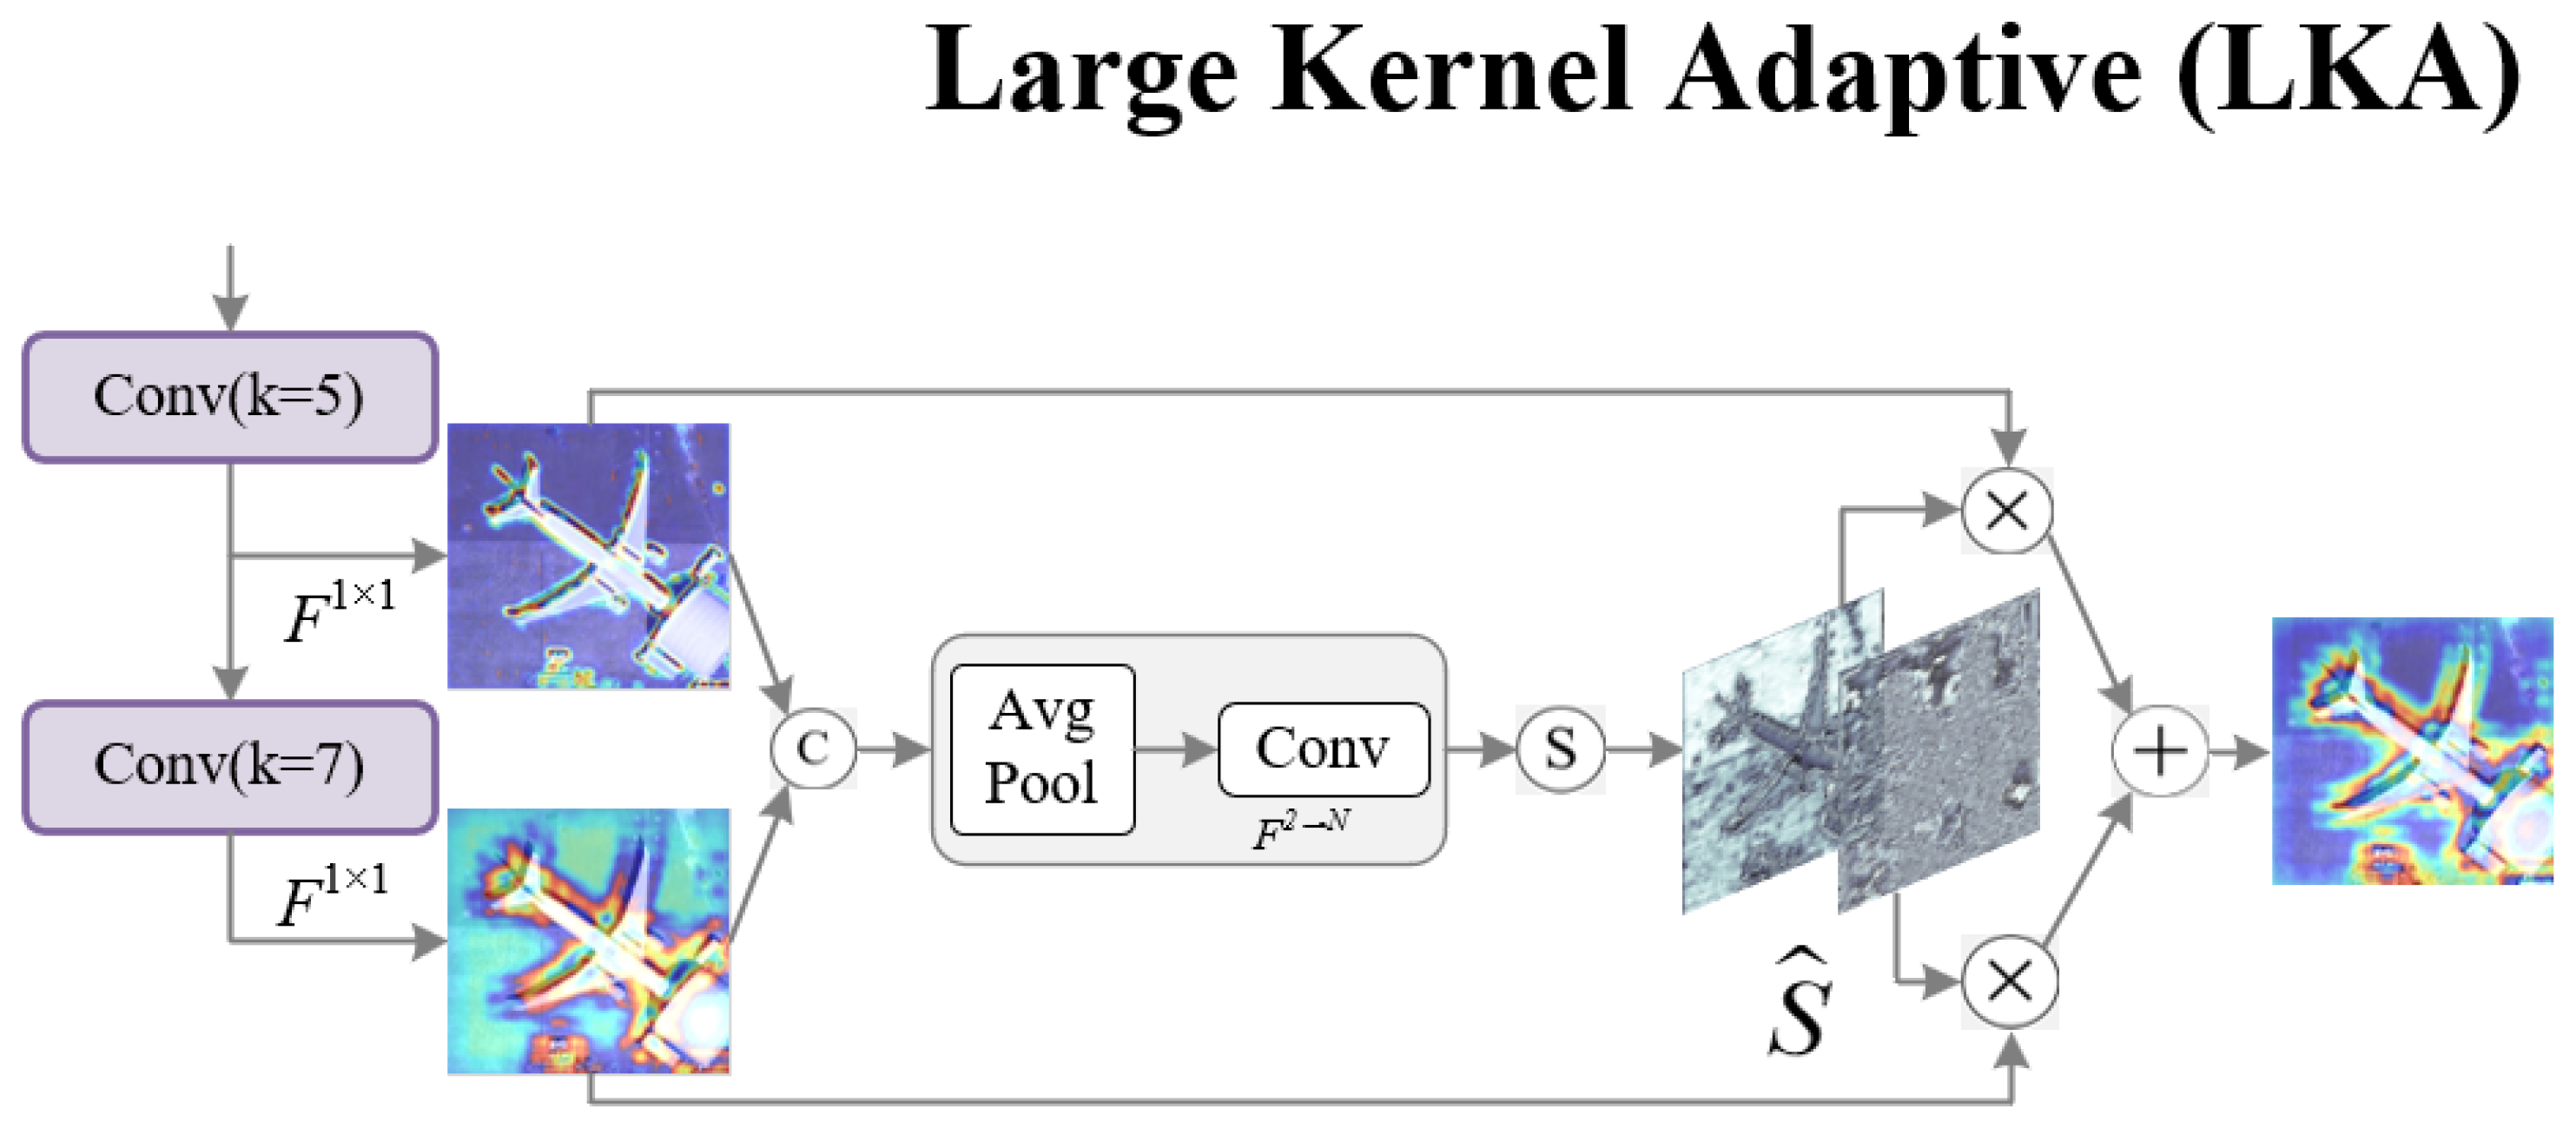
Figure 7. From the experimental findings, decomposing the large kernel into a convolution with a kernel size of 5 and a dilation rate of 1, along with another convolution with a kernel size of 7 and a dilation rate of 3, achieves the optimal performance.
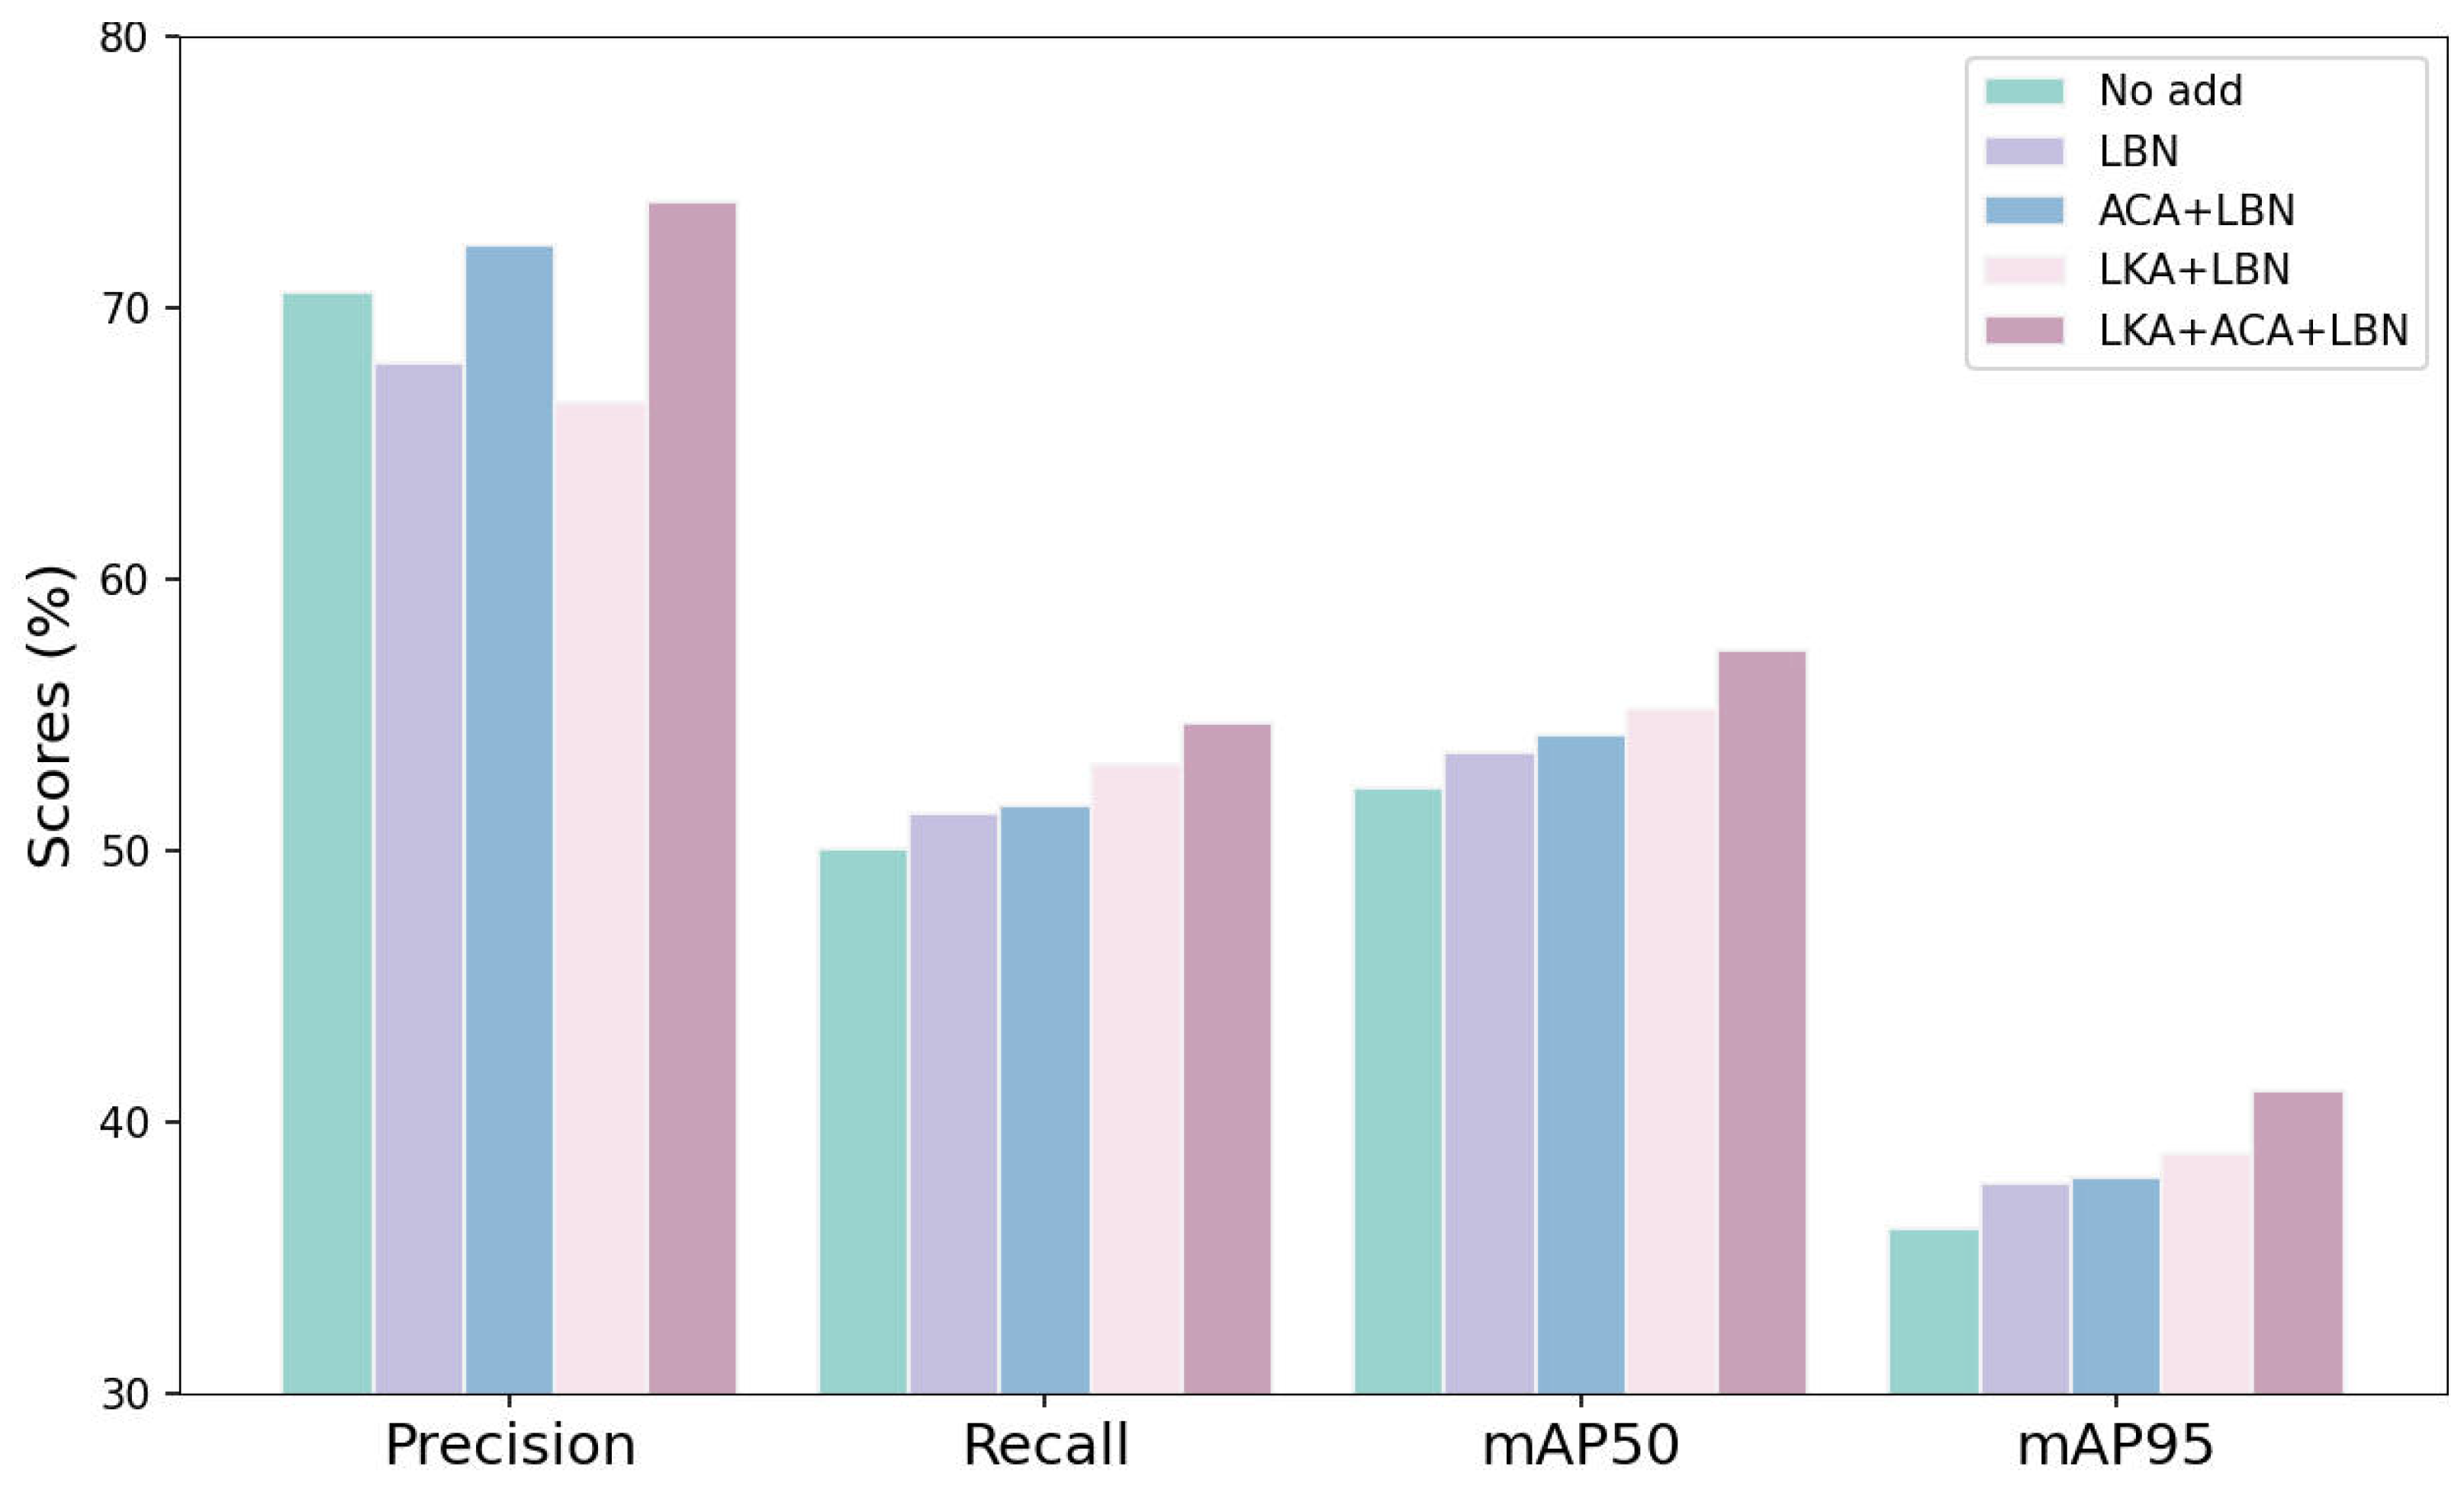
Different insertion blocks. In this experiment, the ACA block, the LKA block, and the LBN were gradually added to the model, after which the three blocks were used in combination. The same dataset and training configurations were used, and the performance was evaluated on the validation set. As shown in
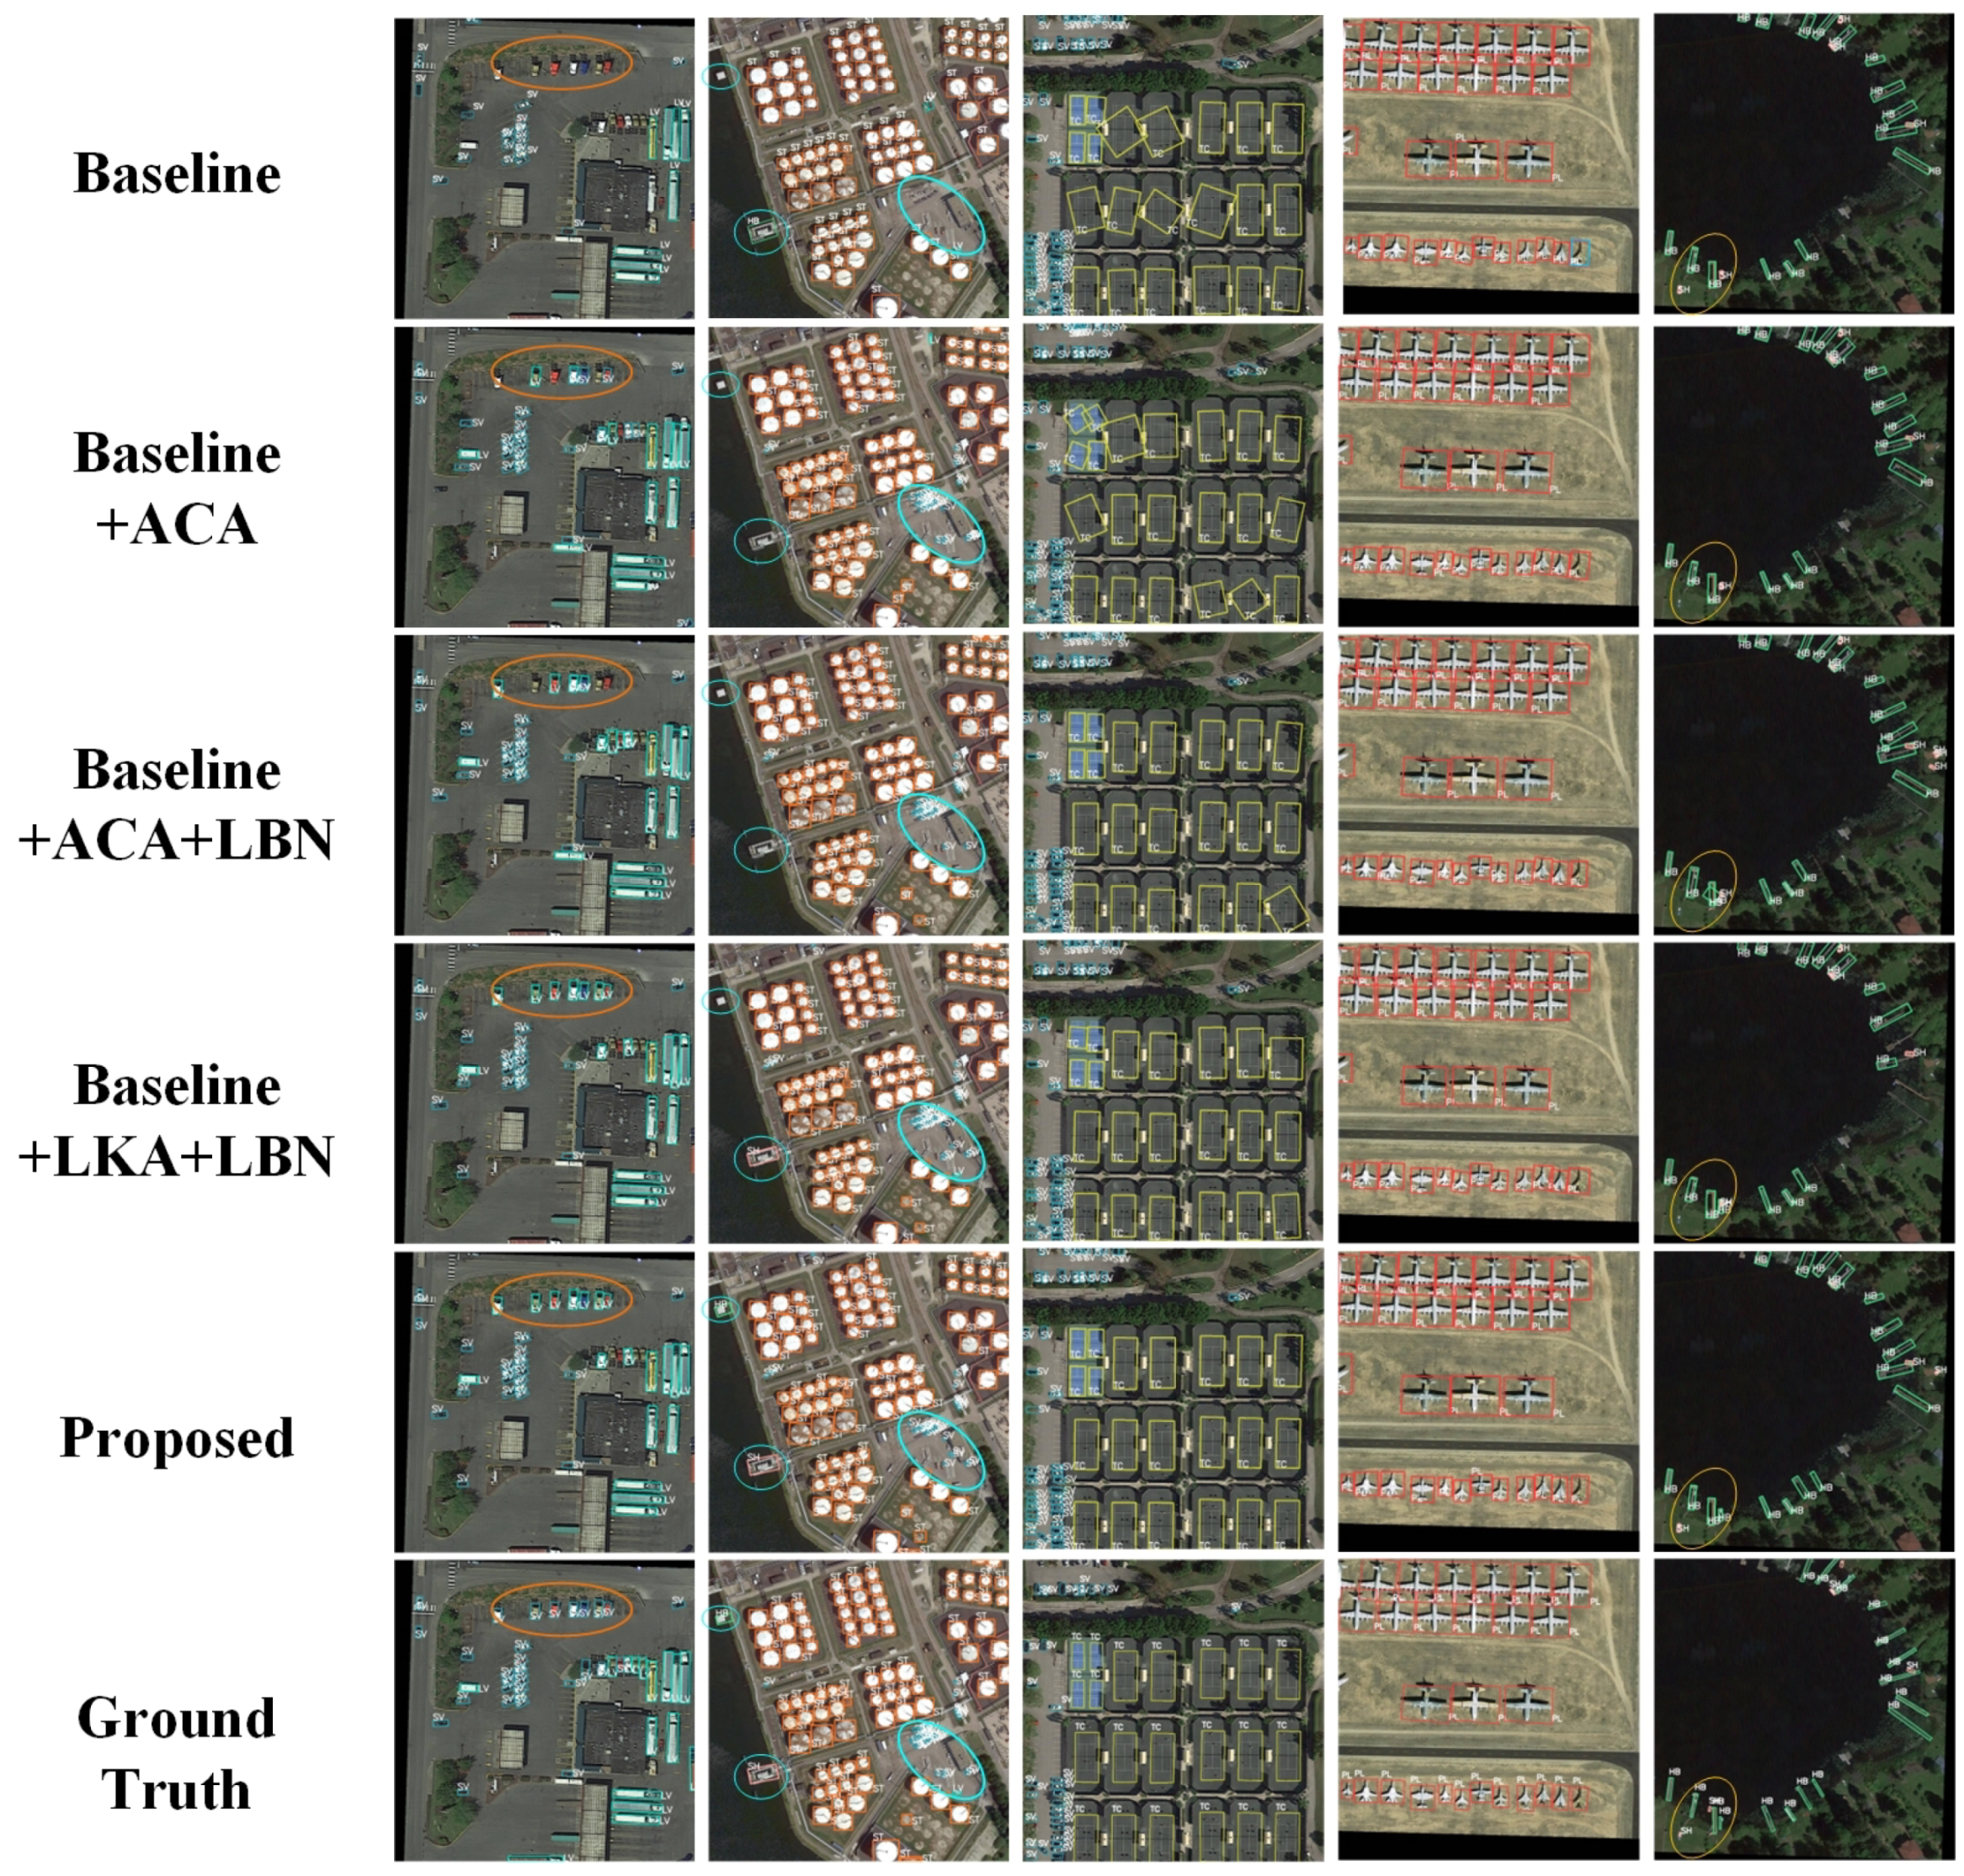
Table 9, the experimental results reveal that the accuracy is further improved after adding ACA, LKA, and LBN at the same time. The visual comparison of the detection results is depicted in
Figure 8. Incorporating all blocks enables the more accurate localization of the objects, reducing both missed detection instances and false positives. Additionally, in areas with densely distributed objects, the use of all blocks, compared to using partial blocks, can reduce the overlap between the detection boxes, thereby more accurately distinguishing individual objects (
Figure 9). This indicates that the two blocks complement each other and can jointly enhance the model’s performance.
4.5. Results Analysis
The experimental results on the DOTA-v2.0 dataset are analyzed in this section.
In
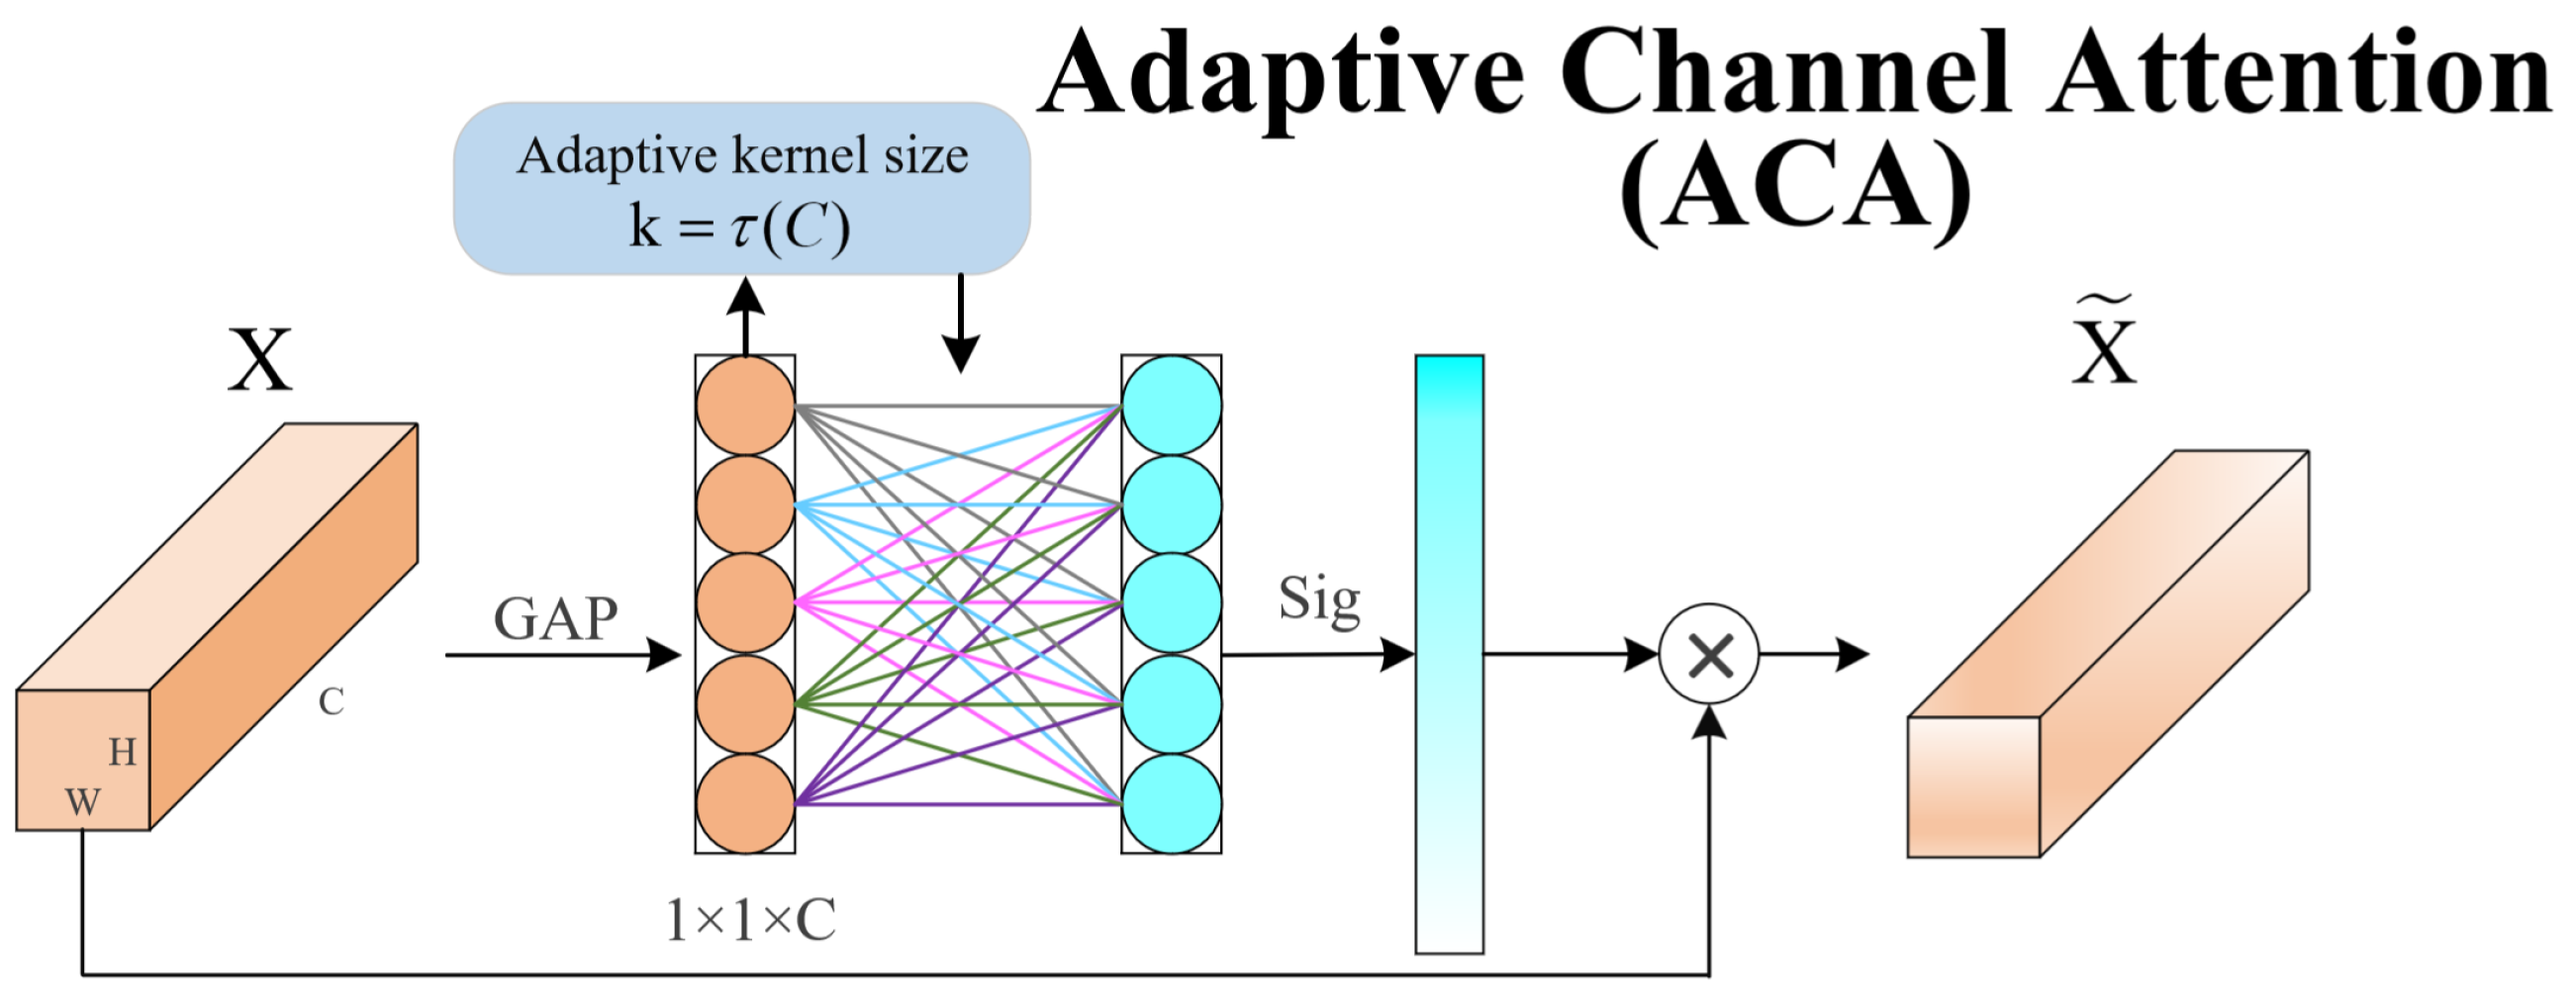
Figure 10, various evaluation metrics are illustrated, including the loss function, mAP, recall, and precision. The overall pattern of the loss metric in the experiments shows a continuous decrease, indicating the gradual optimization of the model’s bounding box prediction accuracy during training, enabling the accurate localization of the objects. The sustained increase in the mAP50 and mAP95 indicates the model’s good performance in focusing on key features and expanding the receptive field, leading to significant performance improvements at different IoU thresholds and demonstrating strong generalization abilities. During the early stages of training, the precision metric exhibits significant fluctuations due to the model’s lack of learned parameters and features. However, in the later stages of training, through adjustments made by the ACA block, critical information can be extracted, and the LKA block can assign corresponding receptive fields to objects of different sizes, leading to the gradual stabilization of the precision, converging to an optimal state and consistently achieving good performance across different samples. The continuous increase in the recall metric reflects the enhanced ability of the model to recognize positive samples, resulting in a decrease in missed detection instances. Through the proposed ACA and LKA blocks, the model can more accurately focus on critical features and better understand and capture the contextual information of objects, thereby further improving the recognition accuracy and completeness.
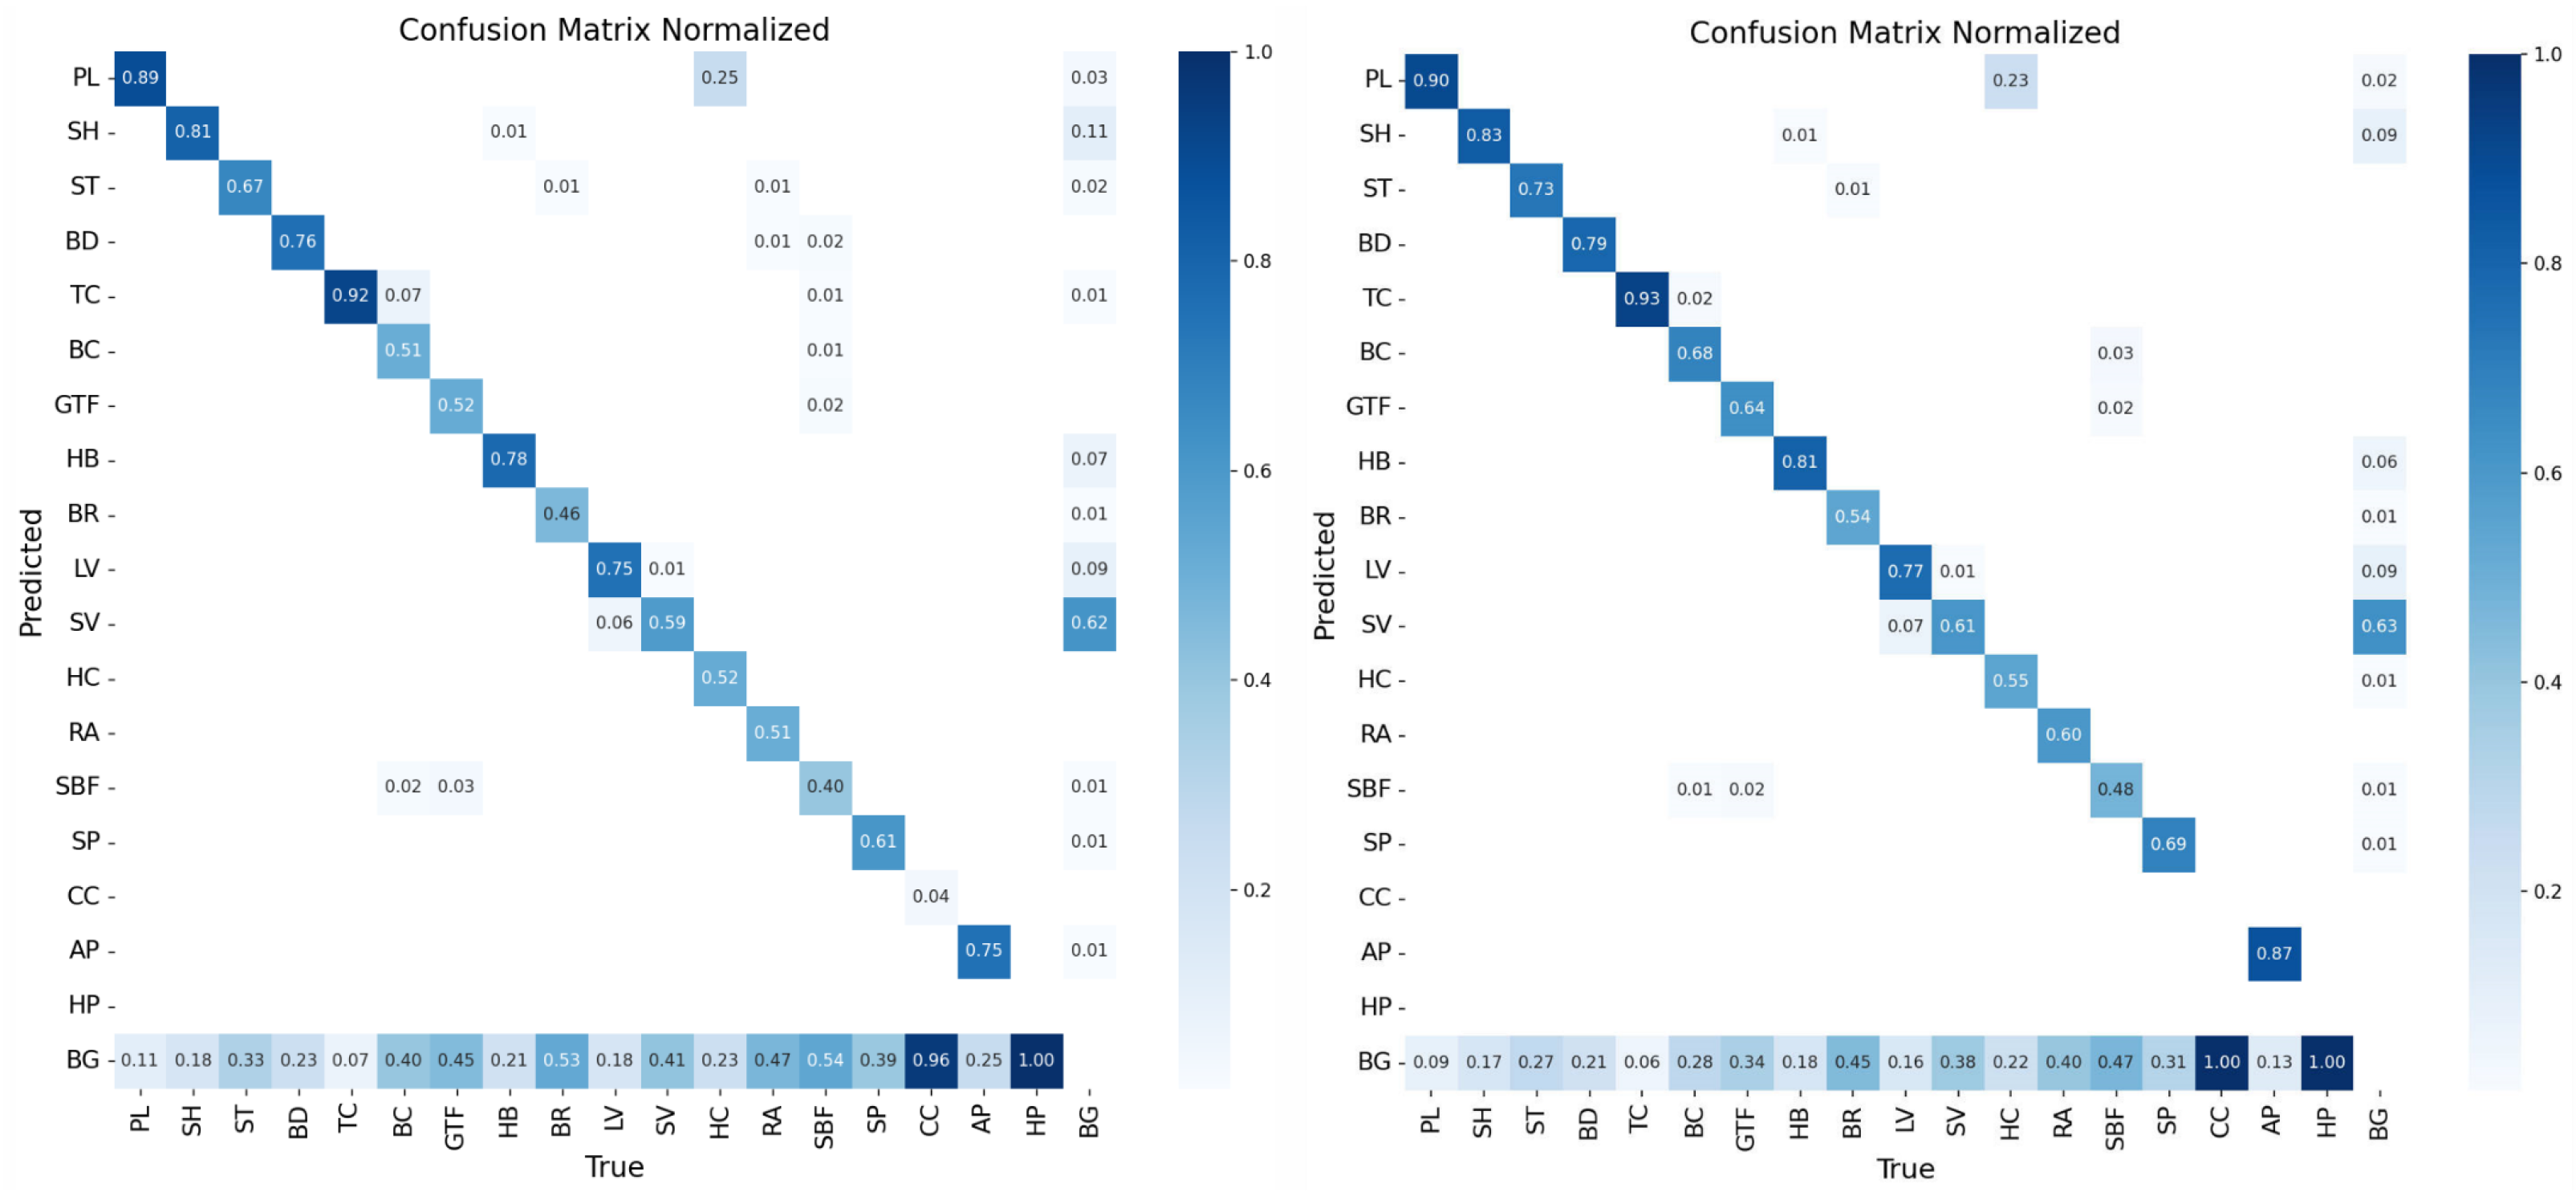
Figure 11 illustrates the normalized confusion matrix without the LBN block (left panel) and with the LBN block (right panel), where the rows represent the true categories and the columns represent the categories predicted by the model. The diagonal elements from the top left to the bottom right represent the probability that the model correctly categorizes each category. It can be seen that after adding the LBN block, the model’s classification performance in each category is improved, especially in the categories BC, GTF, BR, and AP, where the number of misclassification instances is significantly reduced, indicating that the LBN block effectively reduces the classification confusion and improves the overall detection accuracy. The ablation experiments illustrated in
Table 9 also demonstrate the improvement effect after adding the LBN block. Specifically, the experimental results in the table show that the mAP50 and mAP95 were improved by 1.3% and 1.66%, respectively, after adding the LBN block. This indicates that the LBN block reduces misclassification and improves the overall detection performance.
In addition, the model shows a strong discrimination ability in the categories of PL and TC, with accuracy of more than 90%. This indicates that the model can accurately recognize these categories and distinguish objects from the background. However, some of the PL samples were misclassified as HCs, which may have been due to the similarity in the features of PL and HC, making it challenging for the model to differentiate between them. Similarly, the low accuracy for categories such as CC and AP could be due to insufficient training samples, which prevented the model from learning enough features for accurate classification.
The PR curve and F1–confidence curve are important metrics in evaluating the performance of object detection models.
The PR curve illustrates the relationship between the precision and recall at different thresholds. Typically, the area under the curve (AUC) is used to quantify the model’s performance, where a larger area indicates better performance. In the PR curve (
Figure 12, left), most class curves protrude towards the upper right corner, indicating that the model maintains high precision while also improving the recall. This is attributed to the discriminative feature representations provided by the LKA block and the enhanced focus on objects by the ACA block, resulting in more accurate localization and recognition by the combined model.
In the F1–confidence curve (
Figure 12, right), the horizontal axis represents the confidence threshold, while the vertical axis represents the F1 score, which is the harmonic mean of the precision and recall. The calculation formula is as follows:
At low confidence levels, the F1 score of the model is relatively low. However, with an increasing confidence threshold, the features extracted by the LKA block are fully utilized, and the ACA block effectively adjusts the importance of the feature channels. As a result, the F1 score gradually increases and reaches its highest value of 0.62 at a confidence level of 0.405. This improvement enhances the precision and recall, reducing instances of false positives and false negatives, thereby achieving more accurate object localization.
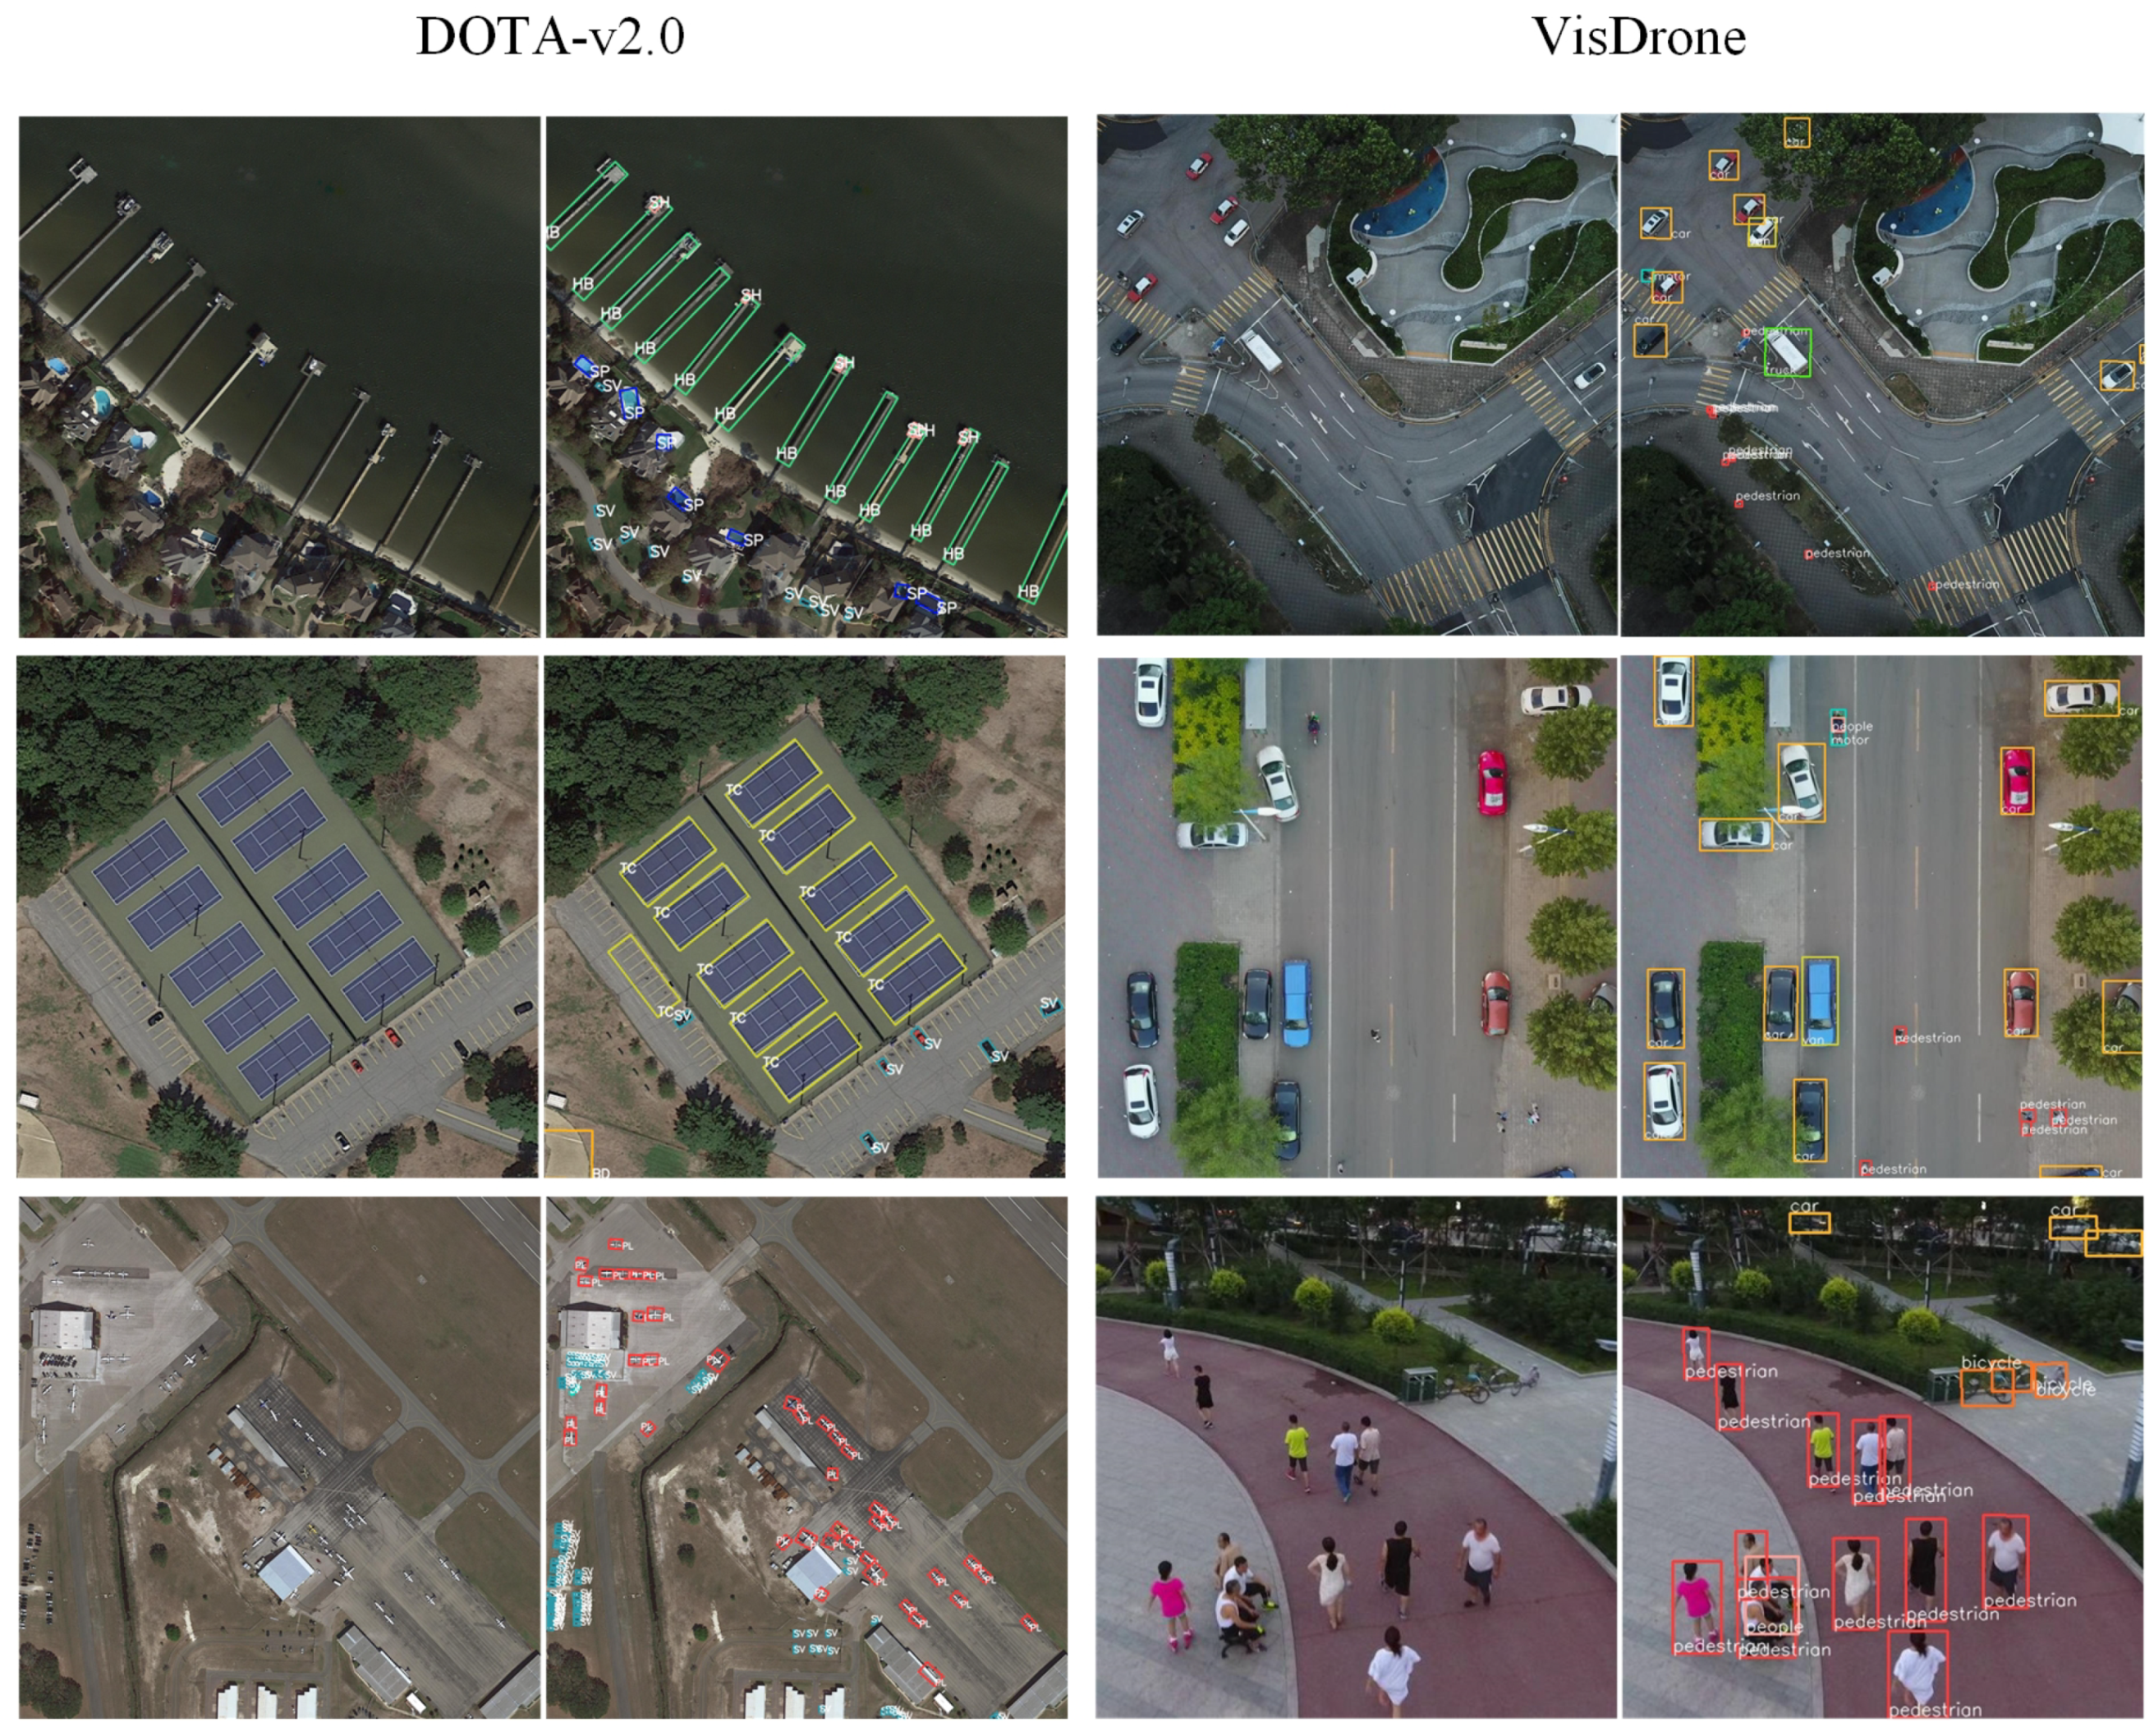
Figure 13 illustrates the performance of the proposed model on the two datasets. It can be observed that the model achieves high detection accuracy for small objects in remote sensing images and performs well in precise multi-scale object localization. On the DOTA-v2.0 dataset, the model accurately identifies objects of different scales, such as PL and HB, indicating that LARS can not only recognize normal-sized objects but also accurately identify small-sized objects. The test results on the VisDrone dataset also demonstrate the accurate identification of objects of different scales, such as cars, bicycles, and pedestrians. These experimental results fully demonstrate the effectiveness and feasibility of the proposed method in the task of detecting small objects in remote sensing images.


