Article

Water Resources Monitoring in a Remote Region: Earth Observation-Based Study of Endorheic Lakes

1
Graduate Program in Geology and in Applied Geosciences and Geodynamics, Geoscience Institute, University of Brasilia, Asa Norte, Brasilia 70910-900, DF, Brazil
2
Joint International Laboratory LMI OCE “Observatory of Environmental Change”, UnB/IRD, Brasilia 71750-000, DF, Brazil
3
Department of de Cartography Roberto Simonsen, 305, São Paulo State University (Unesp), Centro Educacional, Presidente Prudente 19060-900, SP, Brazil
4
French National Research Institute for Sustainable Development (IRD)—UMR Espace-DEV, University of Montpellier, 34393 Montpellier Cedex 05, France
5
Center of Sustainable Development (CDS), University of Brasilia, Asa Norte, Brasilia 70910-900, DF, Brazil
*
Author to whom correspondence should be addressed.
Remote Sens. 2024, 16(15), 2790; https://doi.org/10.3390/rs16152790
Submission received: 9 May 2024 / Revised: 28 June 2024 / Accepted: 29 June 2024 / Published: 30 July 2024

Abstract

:
In the western Andes, climate changes have led to drastic ecological changes during the Pleistocene and Holocene. Given the debate surrounding precipitation pattern changes and the lack of research on lakes in the Chilean Altiplano, this study aims to assess recent climate changes. The paper presents an innovative methodology based on Google Earth Engine (GEE), utilizing fluctuations in water levels in endorheic lakes as natural precipitation indicators. Three lakes (Chungará, Miscanti, and Miniques) in isolated drainage systems were studied, where changes in water levels directly reflect rainfall variations. Data from Landsat-OLI 8, Landsat-ETM+, Landsat-TM 5, and MODIS spanning 31 years were processed using the Google Earth Engine platform. The shapes of the water bodies were extracted using hue saturation value (HSV) composites. The surface areas of the lakes were compared with precipitation data from national meteorological stations and the Tropical Rainfall Measuring Mission (TRMM) using linear regression analyses. Both lake area and rainfall volume showed a decrease over time, with varying trends depending on environmental conditions. However, the analysis consistently indicates a reduction in the area and volume of Chilean lakes corresponding to observed rainfall patterns over the past three decades.

1. Introduction

Groundwater serves as a vital global resource, providing one-third of the Earth’s fresh water for various needs, including domestic, agricultural, and industrial purposes [1]. However, projected climate change poses a significant threat to groundwater reservoirs, the majority of which are non-renewable over significant timeframes for both human use and ecosystem sustenance. Numerous paleoenvironmental studies have highlighted that the climate conditions in the Atacama Desert and western Andes during the late Pleistocene and early to middle Holocene were more humid compared to the present [2,3,4,5,6,7,8,9,10,11,12,13]. These studies have indicated that the average annual rainfall in the region was higher than current levels, with a decrease of approximately 200% (between 400 and 500 mm) during this period. Consequently, large paleolakes formed, covering areas up to six times larger than present [14,15]. During the mid-Holocene, the water levels of high-altitude lakes decreased due to reduced precipitation and elevated temperatures [16,17,18,19,20,21,22]. This event had widespread effects on the entire Central and Southern Central Andes.
During the wetter and warmer conditions of the Pleistocene–Holocene transition, Miscanti Lake experienced water levels approximately 29 m higher than its current surface level. However, with the onset of the mid-Holocene, a shift towards arid environmental conditions led Miscanti Lake to become a brackish pool or even a bog [16,19,21]. Studies based on lake sediment analysis suggest that Miscanti Lake only regained perennial status after experiencing an annual mean rainfall of 150–200 mm [19,21].
More recently, Chile has experienced a drying trend since the mid-20th century, which is expected to continue, potentially resulting in a reduction of up to 40% in average annual precipitation compared to current levels [23]. This trend has led to a noticeable decrease in rainfall since the late 1970s, contributing to the occurrence of more frequent droughts [24]. In contrast, upward trends have been observed in average annual precipitation in the Bolivian Altiplano [25], as well as in annual precipitation in northern Chile [26,27]. While there is consensus regarding the likelihood of increasing temperatures in the region [26], there remains significant uncertainty regarding future precipitation changes across the Andes [28]. Given these projections, the debate surrounding precipitation pattern changes in the Andean Altiplano becomes an urgent issue.
Prior studies have demonstrated a strong relationship between the water levels of high-altitude lakes and local climatic conditions in the Andean Altiplano. A recent study has underscored significant changes in modern altiplano lakes in Bolivia and the Peru Altiplano [29]. Beyond climatic factors, anthropogenic influences may directly impact the water balance in these areas. External factors such as increased agricultural activities and irrigation have been suggested as potential causes for changes in Lake Poopó levels in the Bolivian Altiplano [29]. In Chile, escalating water demand associated with expanding mining operations, fruit production, and human consumption has continued to rise in recent decades. The unregulated use of water, combined with dry seasons, can lead to a significant decrease in lake levels or even complete desiccation. Water scarcity in endorheic basins presents substantial challenges in terms of water resource management [30], emerging as a critical environmental concern. Managing water resources in these regions proves to be difficult, firstly due to the limited availability of comprehensive datasets. Indeed, in such remote areas, the number of operational meteorological stations with long-term data records is constrained. This underscores the imperative need for efficient and consistent surface water monitoring tools and the provision of support for promoting more sustainable utilization of water resources in vulnerable regions like the Chilean Altiplano.
Remote sensing data have proven to be effective in monitoring water body dynamics using the Google Earth Engine (GEE) platform [31,32,33]. The ability to conduct rapid, on-the-fly analysis of satellite data in near-real time is one of the advantages offered by cloud computing platforms like GEE [34]. Devries et al. [35] utilized historical Landsat and other supplementary data sources available on GEE to map surface inundation during flood events. Xia et al. [35] investigated changes in the water surface, revealing positive correlations between water area and precipitation. These findings serve as important references for informing water management policies in remote regions, mainly due to the periodic acquisition of images, the synoptic view of the environment, and the potential for extracting products related to the physical, chemical, and biological characteristics of terrestrial targets.
This study aims to evaluate the debate surrounding changes in rainfall patterns in the Chilean Altiplano over recent decades, utilizing fluctuations in the water levels of endorheic lakes as natural indicators of precipitation. Our methodology relies on remote sensing data to construct a time series depicting the variations in the extent of three Chilean Altiplano lakes: Chungará, Miscanti, and Miniques. We analyzed Landsat-OLI 8, Landsat-ETM+, Landsat-TM 5, and MODIS time series data spanning from 1975 to 2019 using the GEE platform to quantify the lakes’ extent and subsequently compare this information with precipitation data collected from national stations and the Tropical Rainfall Measuring Mission (TRMM). The study presents an initial analysis of the hydrological patterns of the Chilean Altiplano over the past three decades. Our methodology could serve as a blueprint for establishing natural climate observatories in remote and underserved areas, such as the South American Altiplano. This innovative approach provides a cost-effective hydrological tool for efficient water resource management, lake preservation, and safeguarding surface aquatic ecosystems, especially in areas with logistical constraints (i.e., remote and difficult to access).

2. Materials and Methods

The lakes investigated in this study were chosen according to the following criteria: (a) their proximity to national meteorological stations and the availability of precipitation data; (b) the endorheic nature of the watershed to which each lake belongs; and (c) The presence of flat topography devoid of steep slopes.

2.1. Research Area

2.1.1. Chungará Lake

Chungará Lake, situated in the Lauca National Park, Arica y Parinacota region of northern Chile, lies between coordinates 18°14′S and 69°09′W, near the border with Bolivia (Figure 1) [36]. Positioned at an elevation of around 4556 m, it ranks among the highest lakes in the world, and it is situated within the northern Chilean Altiplano [37]. Chungará Lake forms part of the endorheic watershed of the same name, encompassing an area of approximately 260 km2 [6]. The Chungará Lake basin is situated on the border between Chile and Bolivia. This basin is crossed by Carretera 010, which has a high truck traffic flow. However, images from the past 20 years were analyzed, and it was concluded that land use and cover have not undergone significant modifications, demonstrating stability.
Chungará Lake is characterized as a polymictic lake, with the water exhibiting slight alkalinity and salinity, a feature influenced by dolomite rocks [38]. Its irregular surface spans approximately 21.5 km2, with depths ranging from 26 to 40 m, the deepest area being located in the northwestern sector [6]. The lake’s water balance is regulated by several factors, including inflows from tributary rivers, precipitation, evaporation, and minimal seepage to the groundwater table and Cotacotani Lake at the northern outflow [36]. The primary tributary, the Chungará River, originates from the Guallatiri Volcano [39], contributing to four-fifths of the water inflow to the lake [36]. The region experiences an arid climate, with precipitation occurring mainly during the “Invierno Boliviano” (Bolivian winter) period from December to March, influenced by the El Niño Southern Oscillation (ENSO) phenomenon [40].
The morphometric characteristics of the watershed are presented in Table 1. The Chungará Lake basin, with its elongated shape and lower drainage density, tends to have a longer concentration time. This means that its hydrological responses to precipitation are likely to be more attenuated and less immediate.

2.1.2. Miscanti and Miniques Lakes

Miscanti and Miniques Lakes are located in the Antofagasta Region, nestled in the central Andes of Chile, southeast of the Atacama Salar, approximately 20 km from the city of Socaire (Figure 1) [19,21]. They are situated within the endorheic watershed known as “Endoreica entre Fronteirizas y Salar de Atacama”. Miscanti Lake occupies a position at latitude 22°44′S and longitude 67°46′W, resting at an altitude of 4140 m. Miniques Lake, located 1.5 km south of Miscanti Lake, shares a similar geographic context [19]. The basin of the Miniques and Miscanti lakes has 40% of its area located within the Los Flamencos National Park, a protected area with environmental regulations. High-resolution images from December 2021, available in the ARCGISPRO database, were analyzed, and no anthropogenic pressure or any type of change in land use or cover was identified in this region.
Miscanti Lake is characterized as a brackish water body spanning approximately 13.5 km2 with a depth of around 10 m. Its catchment area extends over about 320 km2, primarily composed of Miocene to Holocene volcanic rocks along with Quaternary alluvial and glacial deposits [19]. Positioned along the Quebrada Nascimiento fault, the lake’s drainage is constrained, preventing complete desiccation due to limited water outflow from the endorheic watershed [17,41]. The lake’s water balance is chiefly governed by groundwater inflow and evaporation outflow, with evaporation rates notably exceeding precipitation rates [19]. With no surface outflow and restricted water seepage to Miniques Lake, Miscanti Lake maintains its water levels [19]. The climate in the vicinity is extremely arid, with annual precipitation ranging between 200 and 250 mm during the austral summer months from December to February [17].
The morphometric characteristics of the watershed are presented in Table 1. The Miscanti Lake basin, with its more compact shape and higher drainage density, responds more quickly to precipitation. The well-developed drainage network facilitates the rapid concentration of water flow, resulting in more immediate variations in the lake’s level. The Miniques Lake basin, being the smallest of the three, has an intermediate shape.

2.2. Data and Research Methods

In essence, our methodology revolves around the following key steps: (i) Creating a GEE script to estimate the annual maximum variation of water surface for Chungará, Miscanti, and Miniques lakes spanning a 31-year period, utilizing Landsat’s products and MODIS; (ii) determining the extension of the lakes; (iii) gathering precipitation data from national ground stations and the Tropical Rainfall Measuring Mission (TRMM) in the same period of image acquisition; (iv) analyzing the correlation between rainfall and the extension of the lakes to facilitate climate monitoring objectives.
Precipitation data were sourced from two national stations accessed from the climate explorer tool of the Centro del Clima y la Resiliencia (CR): the Socaire station, located 20 km from Miscanti and Minique lakes, and the Chungará Ajata station, positioned northeast of the Chungará Lake border (Figure 1).
The Chungará Ajata Station records data from 1984 to 2019, while the Socaire station covers the period from 1975 to 2017. The annual rainfall values and the rainfall values between the image acquisitions were summed for each station to conduct statistical analyses. The objective was to ensure the precise selection of satellite images and validate the areas obtained through image processing techniques.
To address the scarcity of rainfall data, especially for Miscanti and Miniques lakes, located beyond the watershed of the Socaire Station, rainfall data from the Tropical Rainfall Measuring Mission (TRMM) satellite, accessed through the Giovanni Platform, was utilized. However, it is worth noting that the TRMM precipitation data only covers the period from 1998 to 2019 for all three lakes. The annual rainfall in lakes was shown considering all available data. We assumed that the volume of each lake correlates directly with its water surface extension. The areas were calculated using surface reflectance datasets from Landsat 5 and 7, generated by the Landsat Ecosystem Disturbance Adaptive Processing System (LEDAPS) algorithm [42], while the Landsat 8 surface reflectance products were generated by the Landsat Surface Reflectance Code (LaSRC) algorithm [43]. Despite limitations in water quality assessment, these data are routinely used for surface water mapping [44,45,46]. In cases where Landsat data were unavailable for 2012 and 2013, MODIS (MOD09A1) data were utilized, despite the difference in resolution. Within the GEE platform, users can develop processing routines using JavaScript and access a variety of satellite images and sensors, facilitating a semi-automatic and rapid processing technique that is advantageous for time series studies.
Image selection for each year, ranging from 1986 to 2019 for Chungará Lake and 1986 to 2017 for Miscanti and Miniques Lakes, was based on criteria emphasizing good data quality and minimal cloud cover. The decision to consider Miscanti and Miniques lakes together was based on correlation analysis and their geographic proximity. Following the precipitation dataset, one image was chosen before the onset of the rainy season, and another was selected immediately after or as closely as feasible. The image obtained before the start of the rain ensured the observation of the variation in lake surfaces before and after the rainy season.

2.2.1. Data Processing

A script was developed within the GEE platform to process the selected images for both study areas (the script link is available in the data availability statement section). The lake surface area was estimated from the number of pixels considered to contain water and the surface area information following the procedure proposed by Xavier et al. [47]. The near infrared (NIR), red, and green spectral bands generated a color composite RGB image. To mitigate the effects of spectral response variations in water over time, the RGB composition was converted to the HSV space (hue saturation value) [34,46,48]. According to Pekel et al. [48], changes in brightness (V) and color intensity (S) can be linked to alterations in water constituents, whereas changes in the primary color (H) may indicate land cover change. Polygon masks delineating lakes and water bodies were constructed from pixels falling within the HSV color range identified to contain only water, while excluding edge pixels between land and water. The areas of Chungará, Miscanti, and Minique lakes were computed using ArcMap tools.

2.2.2. Statistical Analysis

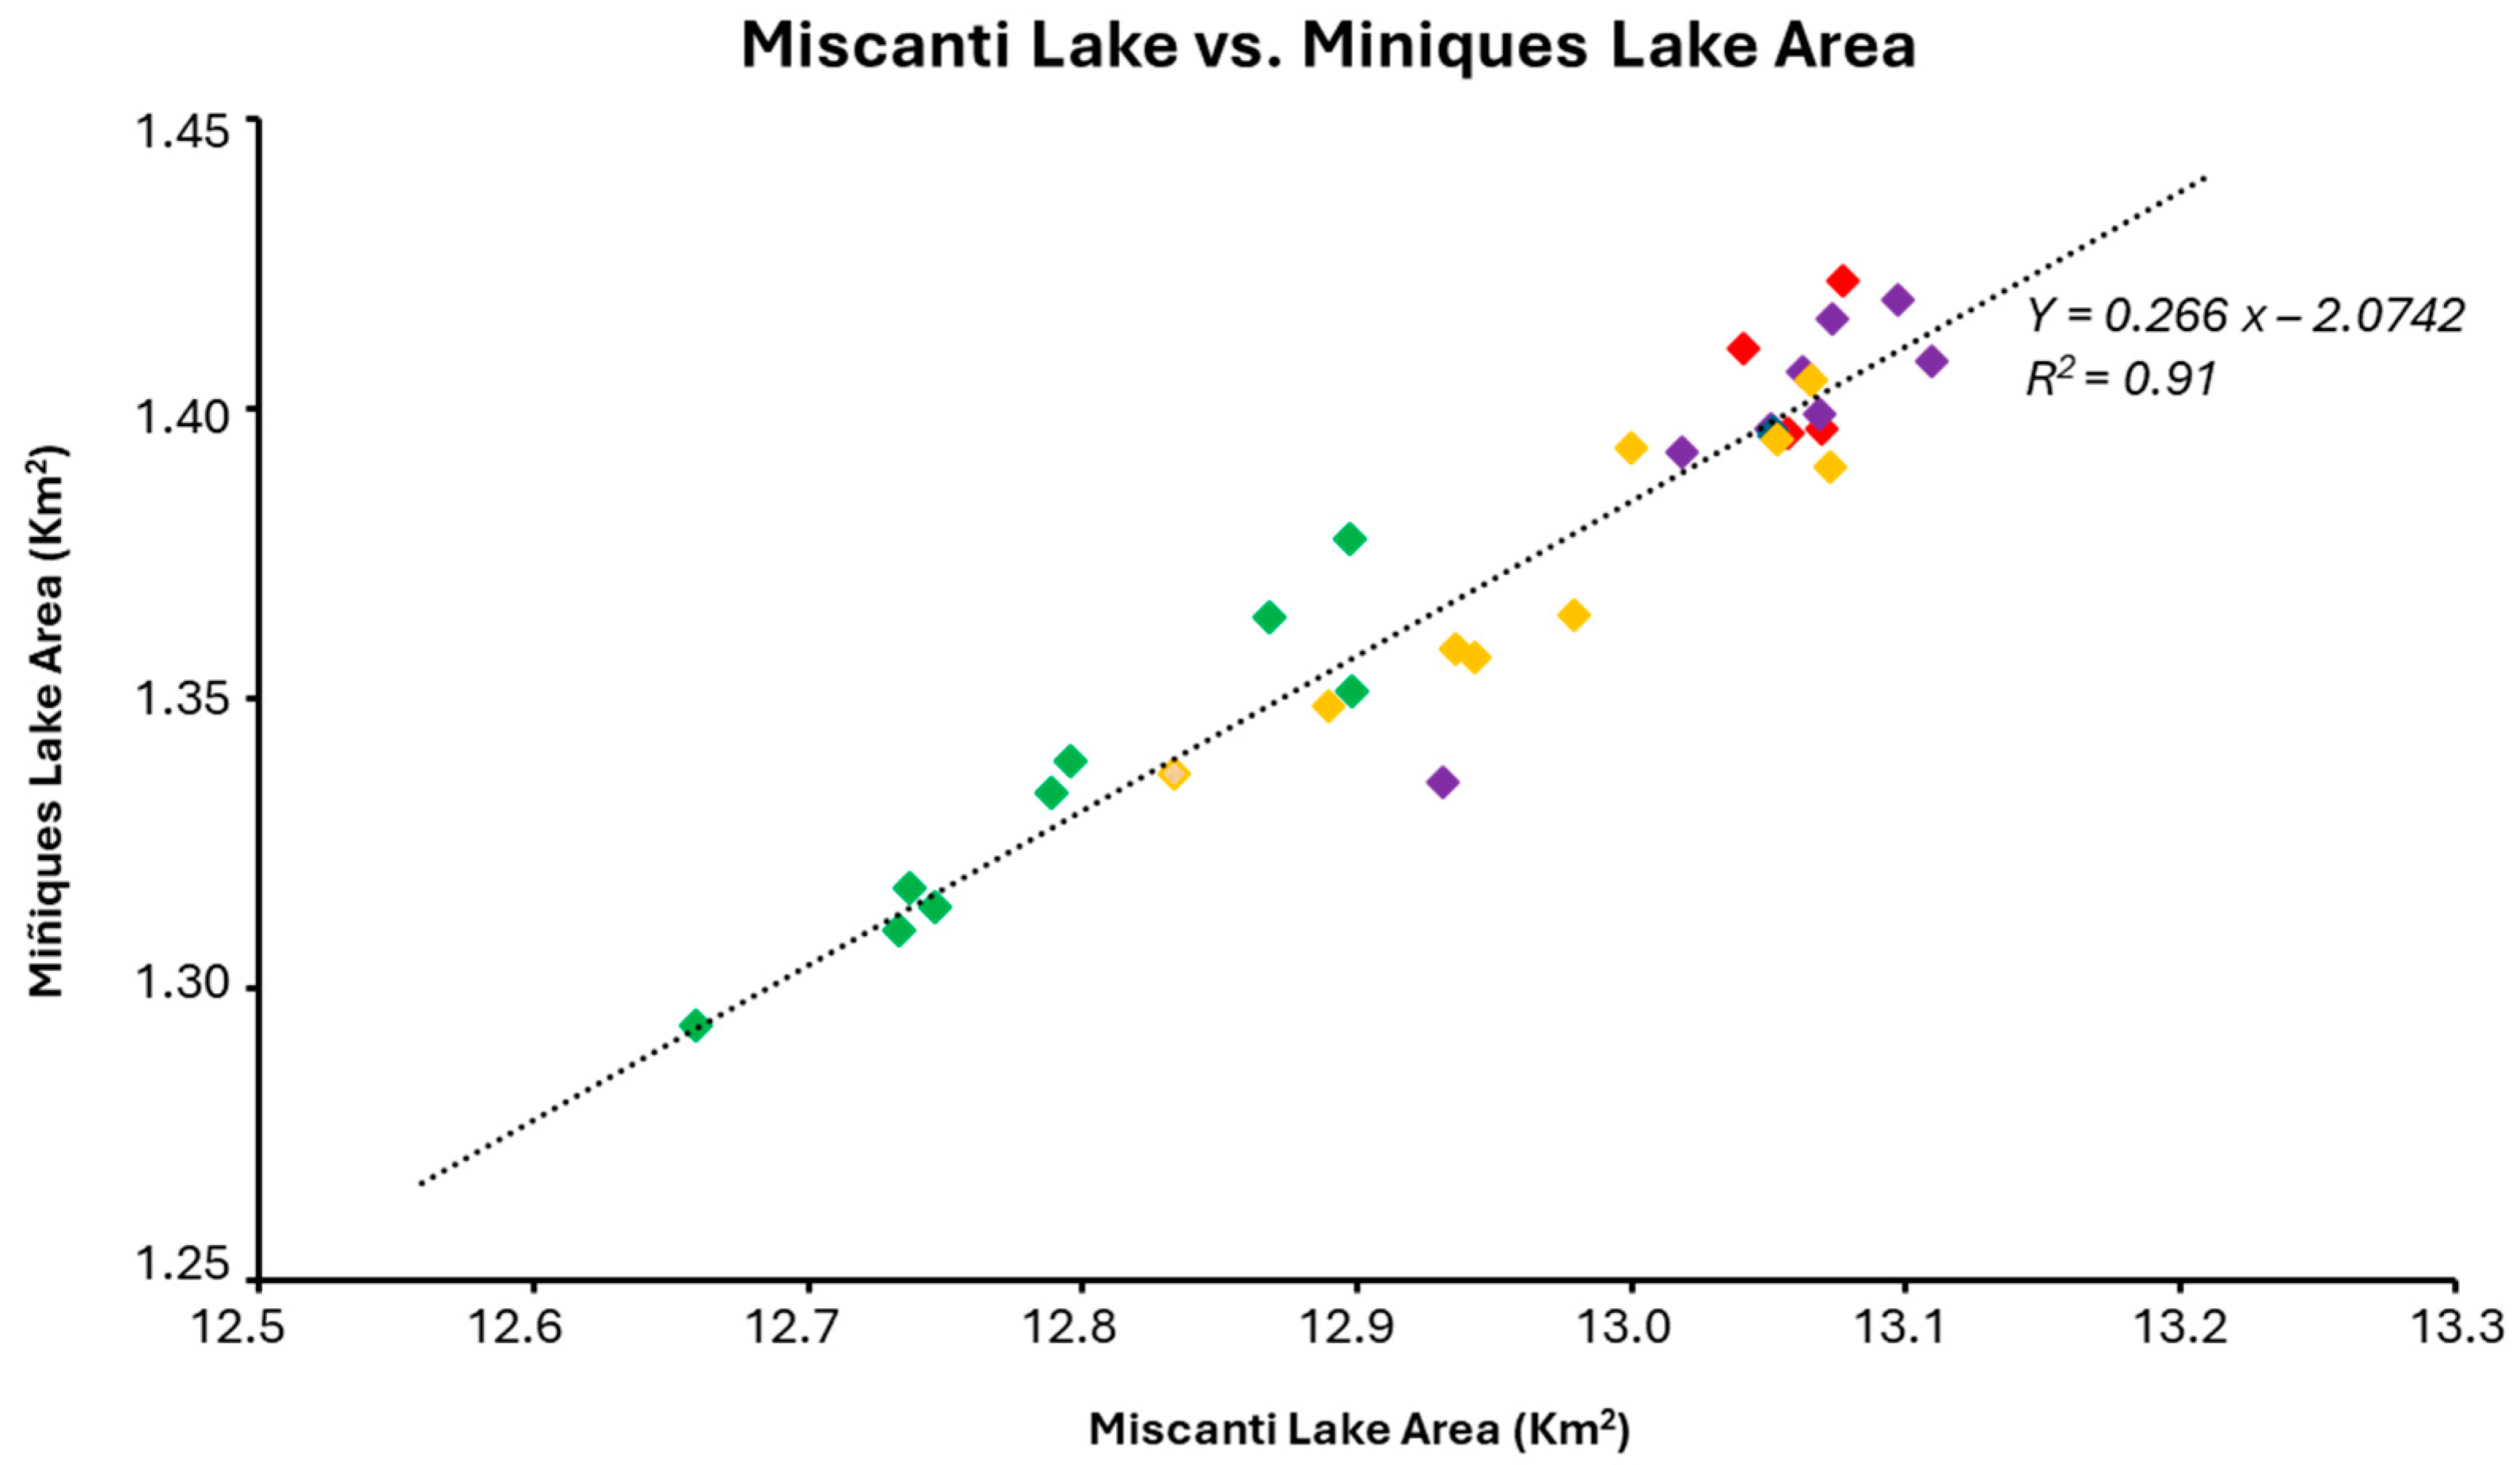
The first analysis was conducted to compare the area of Miscanti and Miñiques Lakes to show the similarities between the lakes and conduct the experiment using these lakes. To demonstrate the lake surface area’s capacity for change, an analysis of the response to rainfall was conducted over 325 days following the rain event.
A statistical analysis was undertaken to investigate the correlation between rainfall and the extent of the lakes. Linear regression analysis was employed, with rainfall serving as the independent variable (Y-axis) and the area of the lakes acting as the dependent variable (X-axis). The coefficient of determination (R2) and the coefficient of correlation (r) were calculated.
Hypothesis testing was carried out using the ANOVA table and p-value generated by the regression in Excel, with a significance level of 0.05. Additionally, regression analysis was conducted on the difference in area between after and before the rain versus rainfall for Miscanti and Miniques lakes. In this analysis, the area difference served as the dependent variable (Y-axis), while the amount of rainfall between images acted as the independent variable (X-axis). Some analyses were also conducted over more significant temporal intervals. Figure 2 shows the scheme for the realized proceedings.

3. Results

3.1. The Union of Miscanti and Miniques Lakes Areas

The regression analysis of Miscanti Lake area (X-axis) versus Miniques Lake area (Y-axis) (Figure 3) reveals high R2 (0.92) and r (0.95) values, indicating a strong correlation between the lakes. Approximately 92% of the variance in Miniques Lake’s area can be explained by the variance in Miscanti Lake’s area. The obtained p-value (<0.01) is below the significance level, indicating that it is significant to represent the variance in Miniques Lake’s area based on Miscanti Lake’s area, and it explains the seepage from Miscanti Lake to Miniques Lake. These results suggest that the water budget in Miniques can be influenced by seepage from Miscanti Lake or that the water budget in both Miniques and Miscanti Lakes is affected by similar rates of precipitation, seepage inflow, and evaporation outflow. Consequently, the extents of the lakes were analyzed together.

3.2. Annual Rainfall in the Study Areas

The average annual rainfall, calculated using data from the Ajata Meteorological Station and TRMM to supplement the lack of rainfall data from 1984 to 2019, is 351.6 mm, with a standard deviation of 145.2 mm. Rainfall in the region is typically concentrated between December and March, with a range of 101.3 mm to 568.5 mm. There is a dry period extending from April to October. Notably, there is a slight decrease in rainfall over time (β1 = −4.38). The average rainfall and standard deviation (σ) calculated for the periods of 1984–1994, 1995–2005, and 2006–2019 are as follows: 412.7 mm (σ = 147.4), 369.4 mm (σ = 131.6), and 315.2 mm (σ = 148.5), respectively.
For the analysis of Miscanti and Miniques lakes, the average annual rainfall, utilizing data from the Socaire station and TRMM to compensate for the lack of rainfall data from 1975 to 2017, is 40.98 mm. Rainfall typically occurs between January and February. In certain years, there is a notable concentration of rainfall, reaching approximately 100 mm within a short period of fewer than 15 days. However, in some years, the annual rainfall did not surpass 10 mm, or it was not recorded. There is a slight variation in rainfall over the time series (β1 = −0.423) in annual rainfall. The entire time span was divided into five periods based on rainfall variation. The average rainfall and standard deviation calculated for the periods of 1975–1985 (X = 59.8 mm; σ = 43.6), 1985–1995 (X = 29.13 mm; σ = 28.46), 1995–2005 (X = 32.1 mm; σ = 20.2), 2005–2015 (X = 42.58 mm; σ = 49.69), and 2007–2017 (X = 43.83 mm; σ = 52.45) reveal that the average rainfall was higher in the 80s and 90s, while the greatest rainfall and drought anomalies occurred in the 2000s.
Rivera et al. [24] present future temperature scenarios based on CMIP6 models of precipitation, projecting an upward trend in maximum, mean, and median temperatures across all three-time windows compared to the baseline period. The region has witnessed a notable decline in rainfall since the late 1970s, resulting in heightened occurrences of drought events [24]. Additionally, the scenario suggests an escalation in the magnitude of extreme events [49], posing challenges in their identification and quantification due to alterations in intensity, spatial distribution, and seasonal availability of water.

3.3. Variation of the Lake’s Extension

3.3.1. Superficial Extent of Chungará Lake vs. Ajata Station Precipitation Data

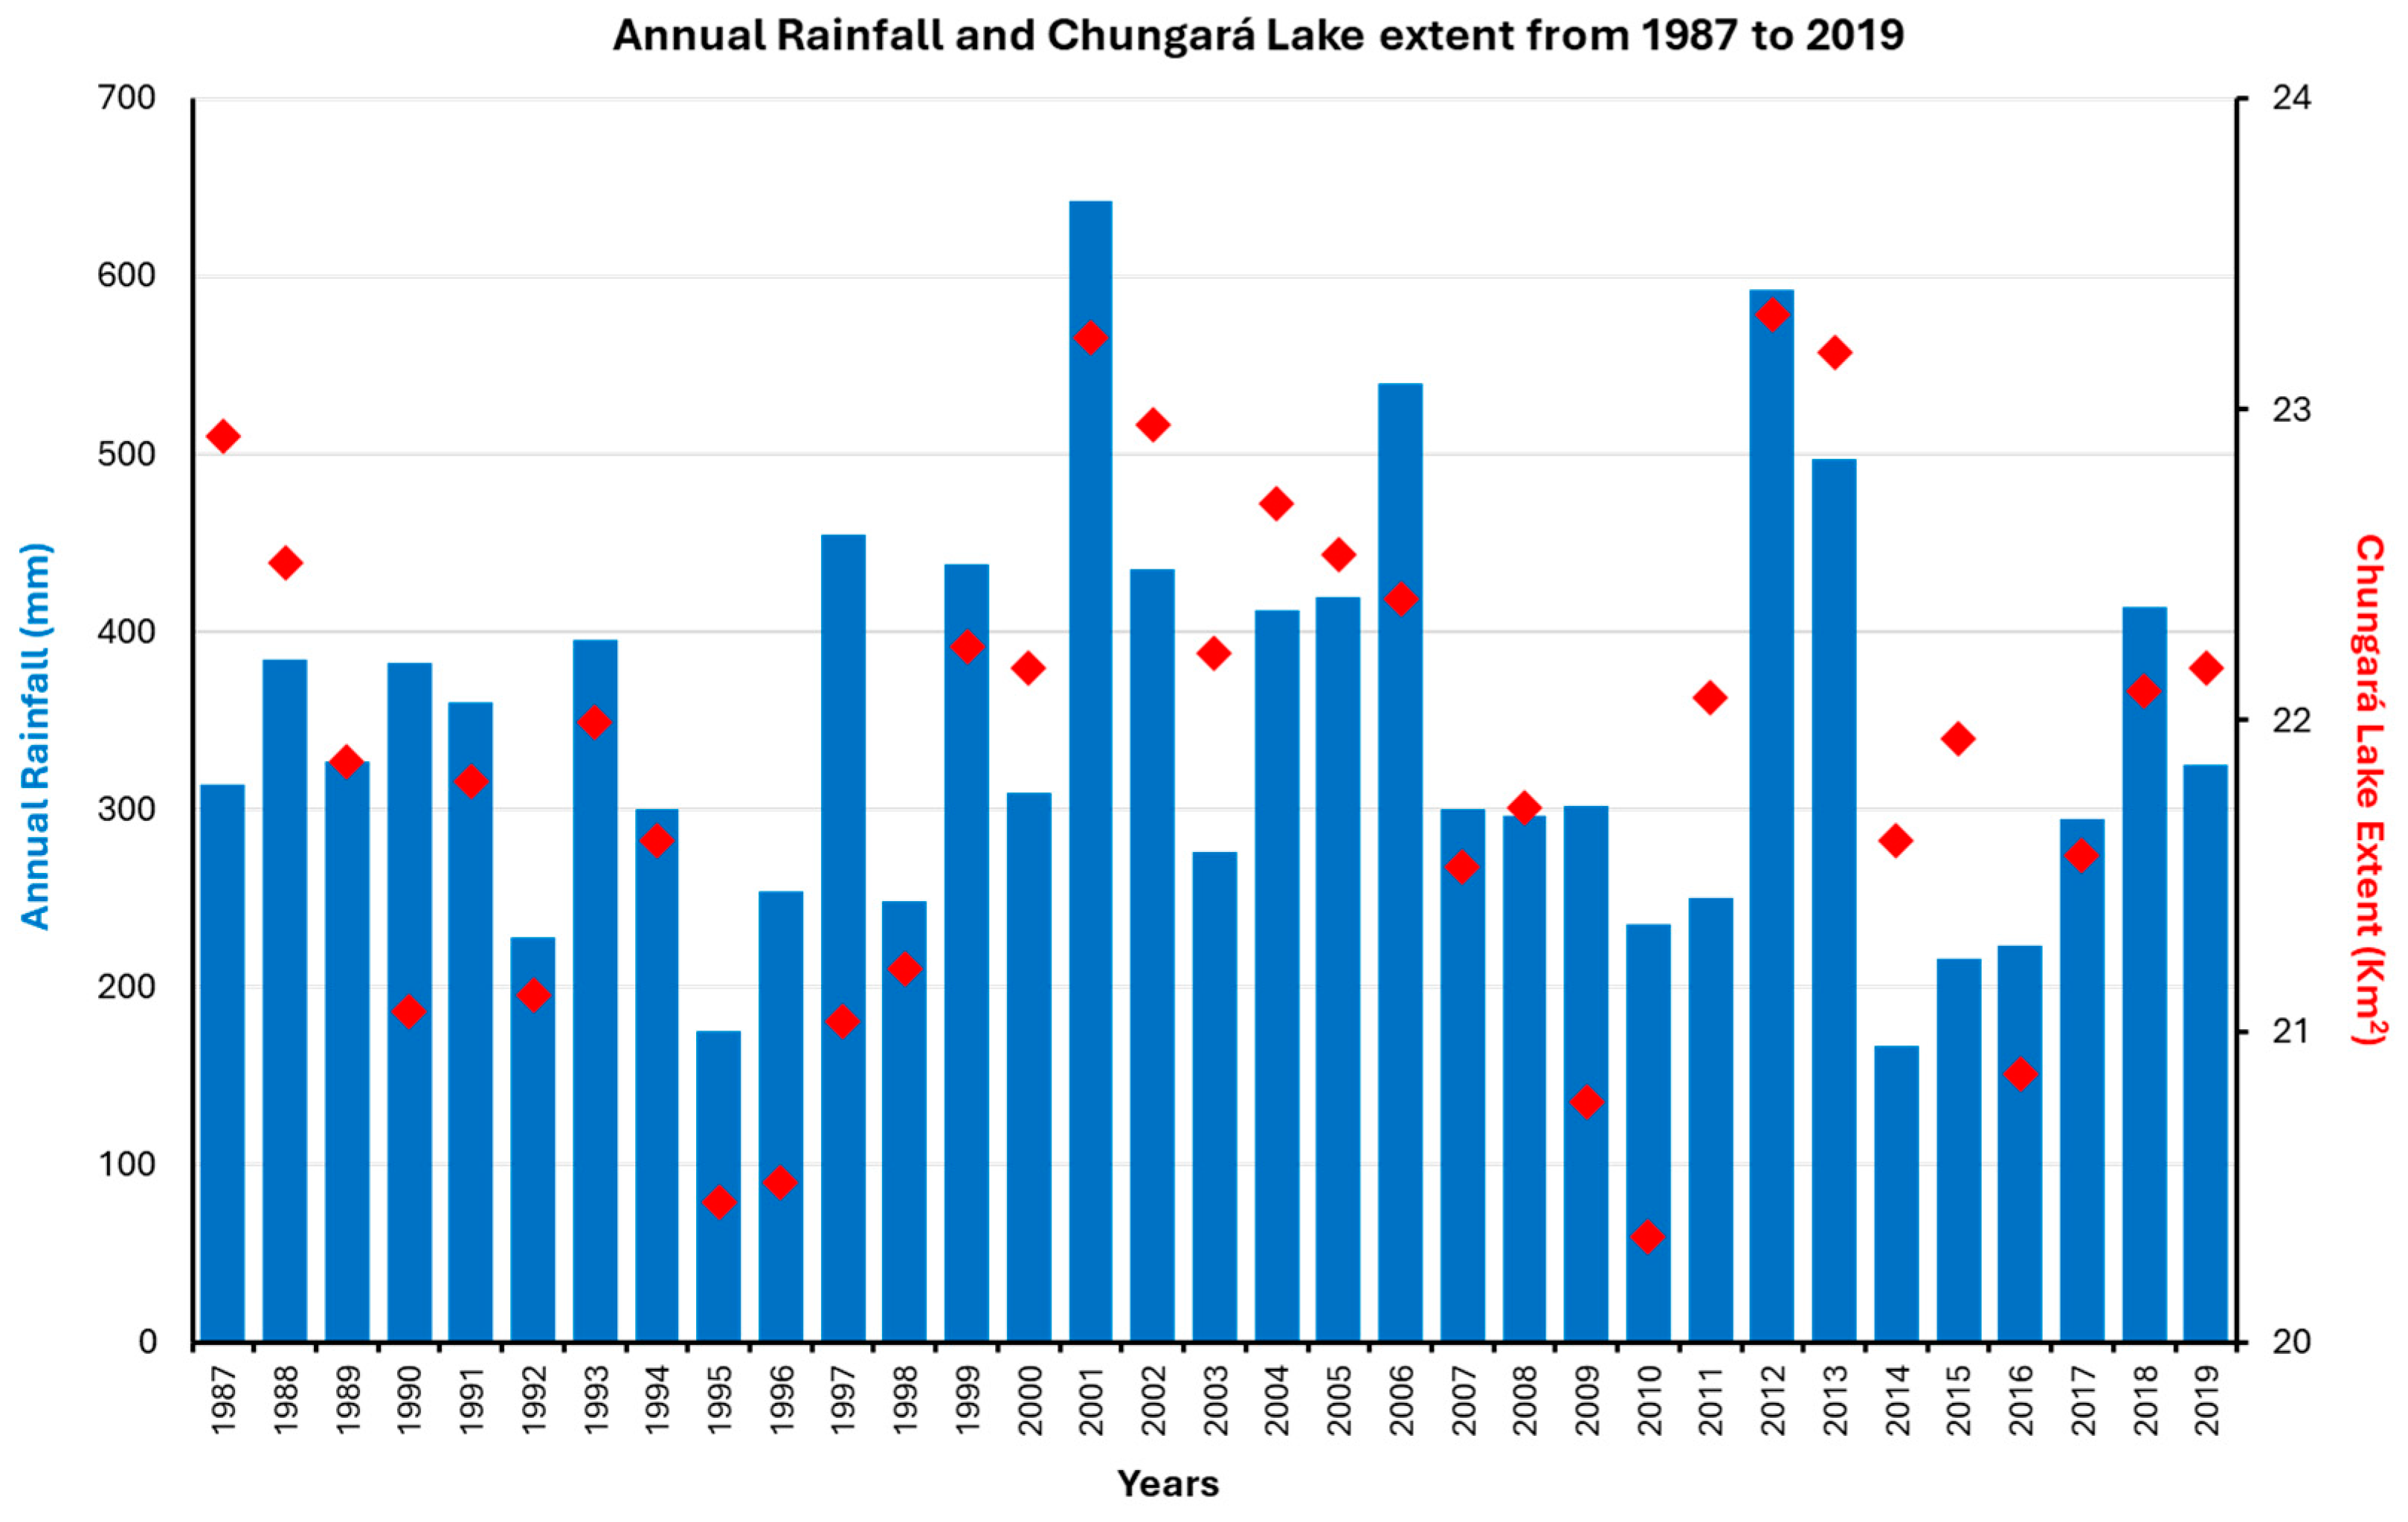
The average area of Chungará Lake, calculated post-rainy season, for the years spanning from 1987 to 2019, stands at 21.9 km2. The lake attains its maximum extent in April 2001 (23.2 km2) and April 2012 (23.3 km2), marking the culmination of the wet season (Figure 4), aligning with the most significant annual rainfall anomalies recorded between 1986 and 2019 (642.3 mm and 592 mm, respectively). Conversely, the minimum extent after the rains is observed in March 2010 (20.3 km2) and April 1995 (20.4 km2), correlating with annual rainfall levels of 235.5 mm and 175.1 mm, respectively (Figure 3). Notably, the lake’s area demonstrates a slight decline over time, mirroring the trend observed in rainfall data from the Chungará Ajata meteorological station. During the period from 1995 to 2001, the area progressively expanded alongside a positive trend in rainfall. Conversely, from 2001 to 2010, both the area of Chungará Lake and rainfall exhibited a declining trend. The observations suggest a continuous expansion of the liquid surface of the lake, spurred by rainfall events.

3.3.2. Superficial Extent of Miscanti and Miniques Lakes vs. Socaire Station Precipitation Data

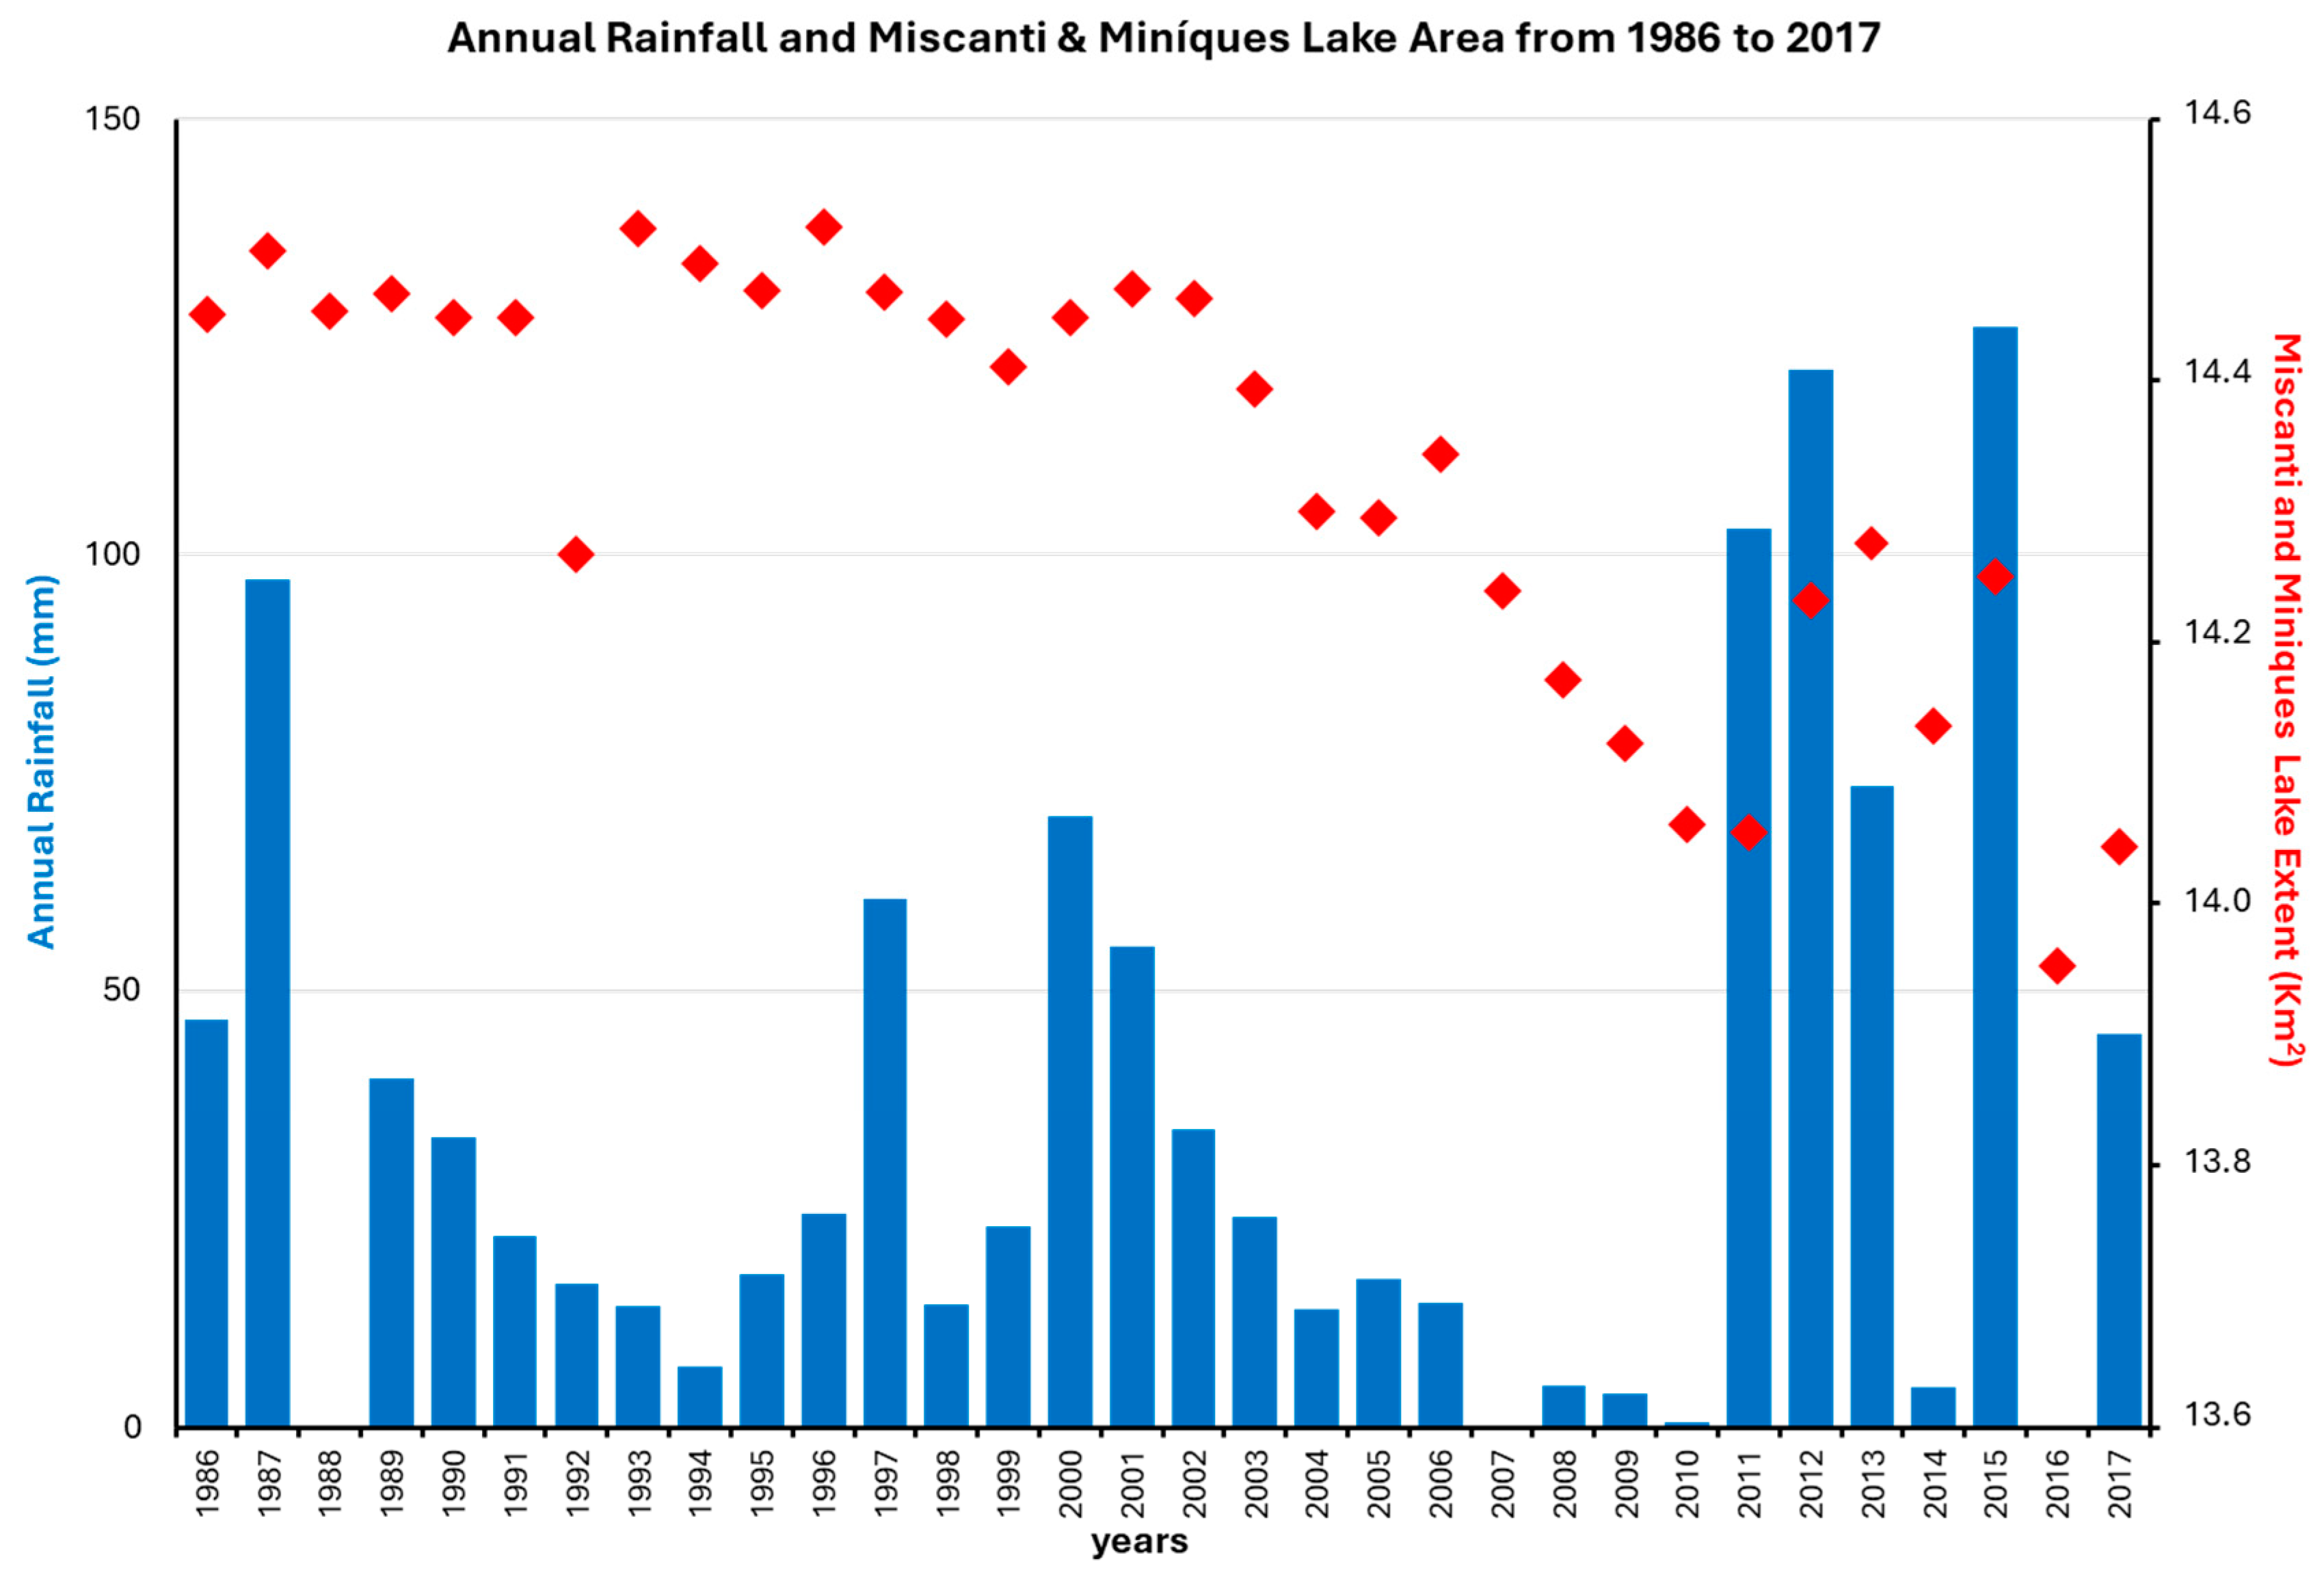
During the wet season, Miscanti and Miniques Lakes maintain an average area of 14.3 km2. Their maximum extent of 14.5 km2 was recorded in September 1996 following 20 mm of rainfall, while their minimum extent of 14 km2 occurred in April 2016, amid a period devoid of recorded rainfall since March 2015. Over the past 31 years, the area of Miscanti Lake has shown a declining trend, mirroring the rainfall pattern observed at the Socaire Station since 1975. Particularly in the 2000s, characterized by reduced average rainfall, increased rainfall, and drought anomalies, the lake’s extent progressively decreased.
In the analysis of Miniques Lake’s area, satellite images were processed akin to those of Miscanti Lake, given their proximity of 1.5 km. Similarly, Miniques Lake exhibits a decreasing trend in area over time, paralleling the behavior of Miscanti Lake. Following rainy periods, Miniques Lake maintains an average area of 1.37 km2, with its maximum extent of 1.42 km2 observed in March 1987 after receiving 43.7 mm of rainfall. Conversely, its minimum extent of 1.28 km2 was recorded in January 2011, before the onset of rains, after a 7-month period devoid of recorded rainfall at the Socaire station. Over the studied 31 years (Figure 4), the area of Miniques Lake has also experienced a decrease, consistent with the observed rainfall trend since 1975. Notably, the lake’s extent has progressively diminished in the 2000s, coinciding with lower average rainfall and increased rainfall and drought anomalies (Figure 5).

3.3.3. Miscanti and Miniques Lakes’ Extent after an Anomalous Rainy Period

Figure 6 depicts the fluctuations in the areas of Miscanti and Miniques lakes following the rainy season in 2015, characterized by a recorded rainfall of 126.1 mm. Initially, both lakes cover an area of 14 km2. Subsequently, after 7 days from the last rainy day, the area expands to 14.2 km2. However, after 42 days, the lakes’ extent slightly reduces to 14.1 km2, progressively declining over time post the wet season, reaching 14 km2 after one year in January 2016. Occasional sudden increases in the areas after 120 days may be attributed to precipitation undetected by the pluviometry station or snow precipitation, along with melting water input, as evidenced by satellite images capturing snow from day 42 to day 106.
Given the lakes’ swift response to evaporation, leading to a gradual reduction in their extent post-rainy season, conducting an analysis of the area derived from satellite images shortly after the rainy season, particularly following the last recorded rainfall event, is advisable for accurate assessments.

3.4. Regression Analysis

3.4.1. Chungará Lake

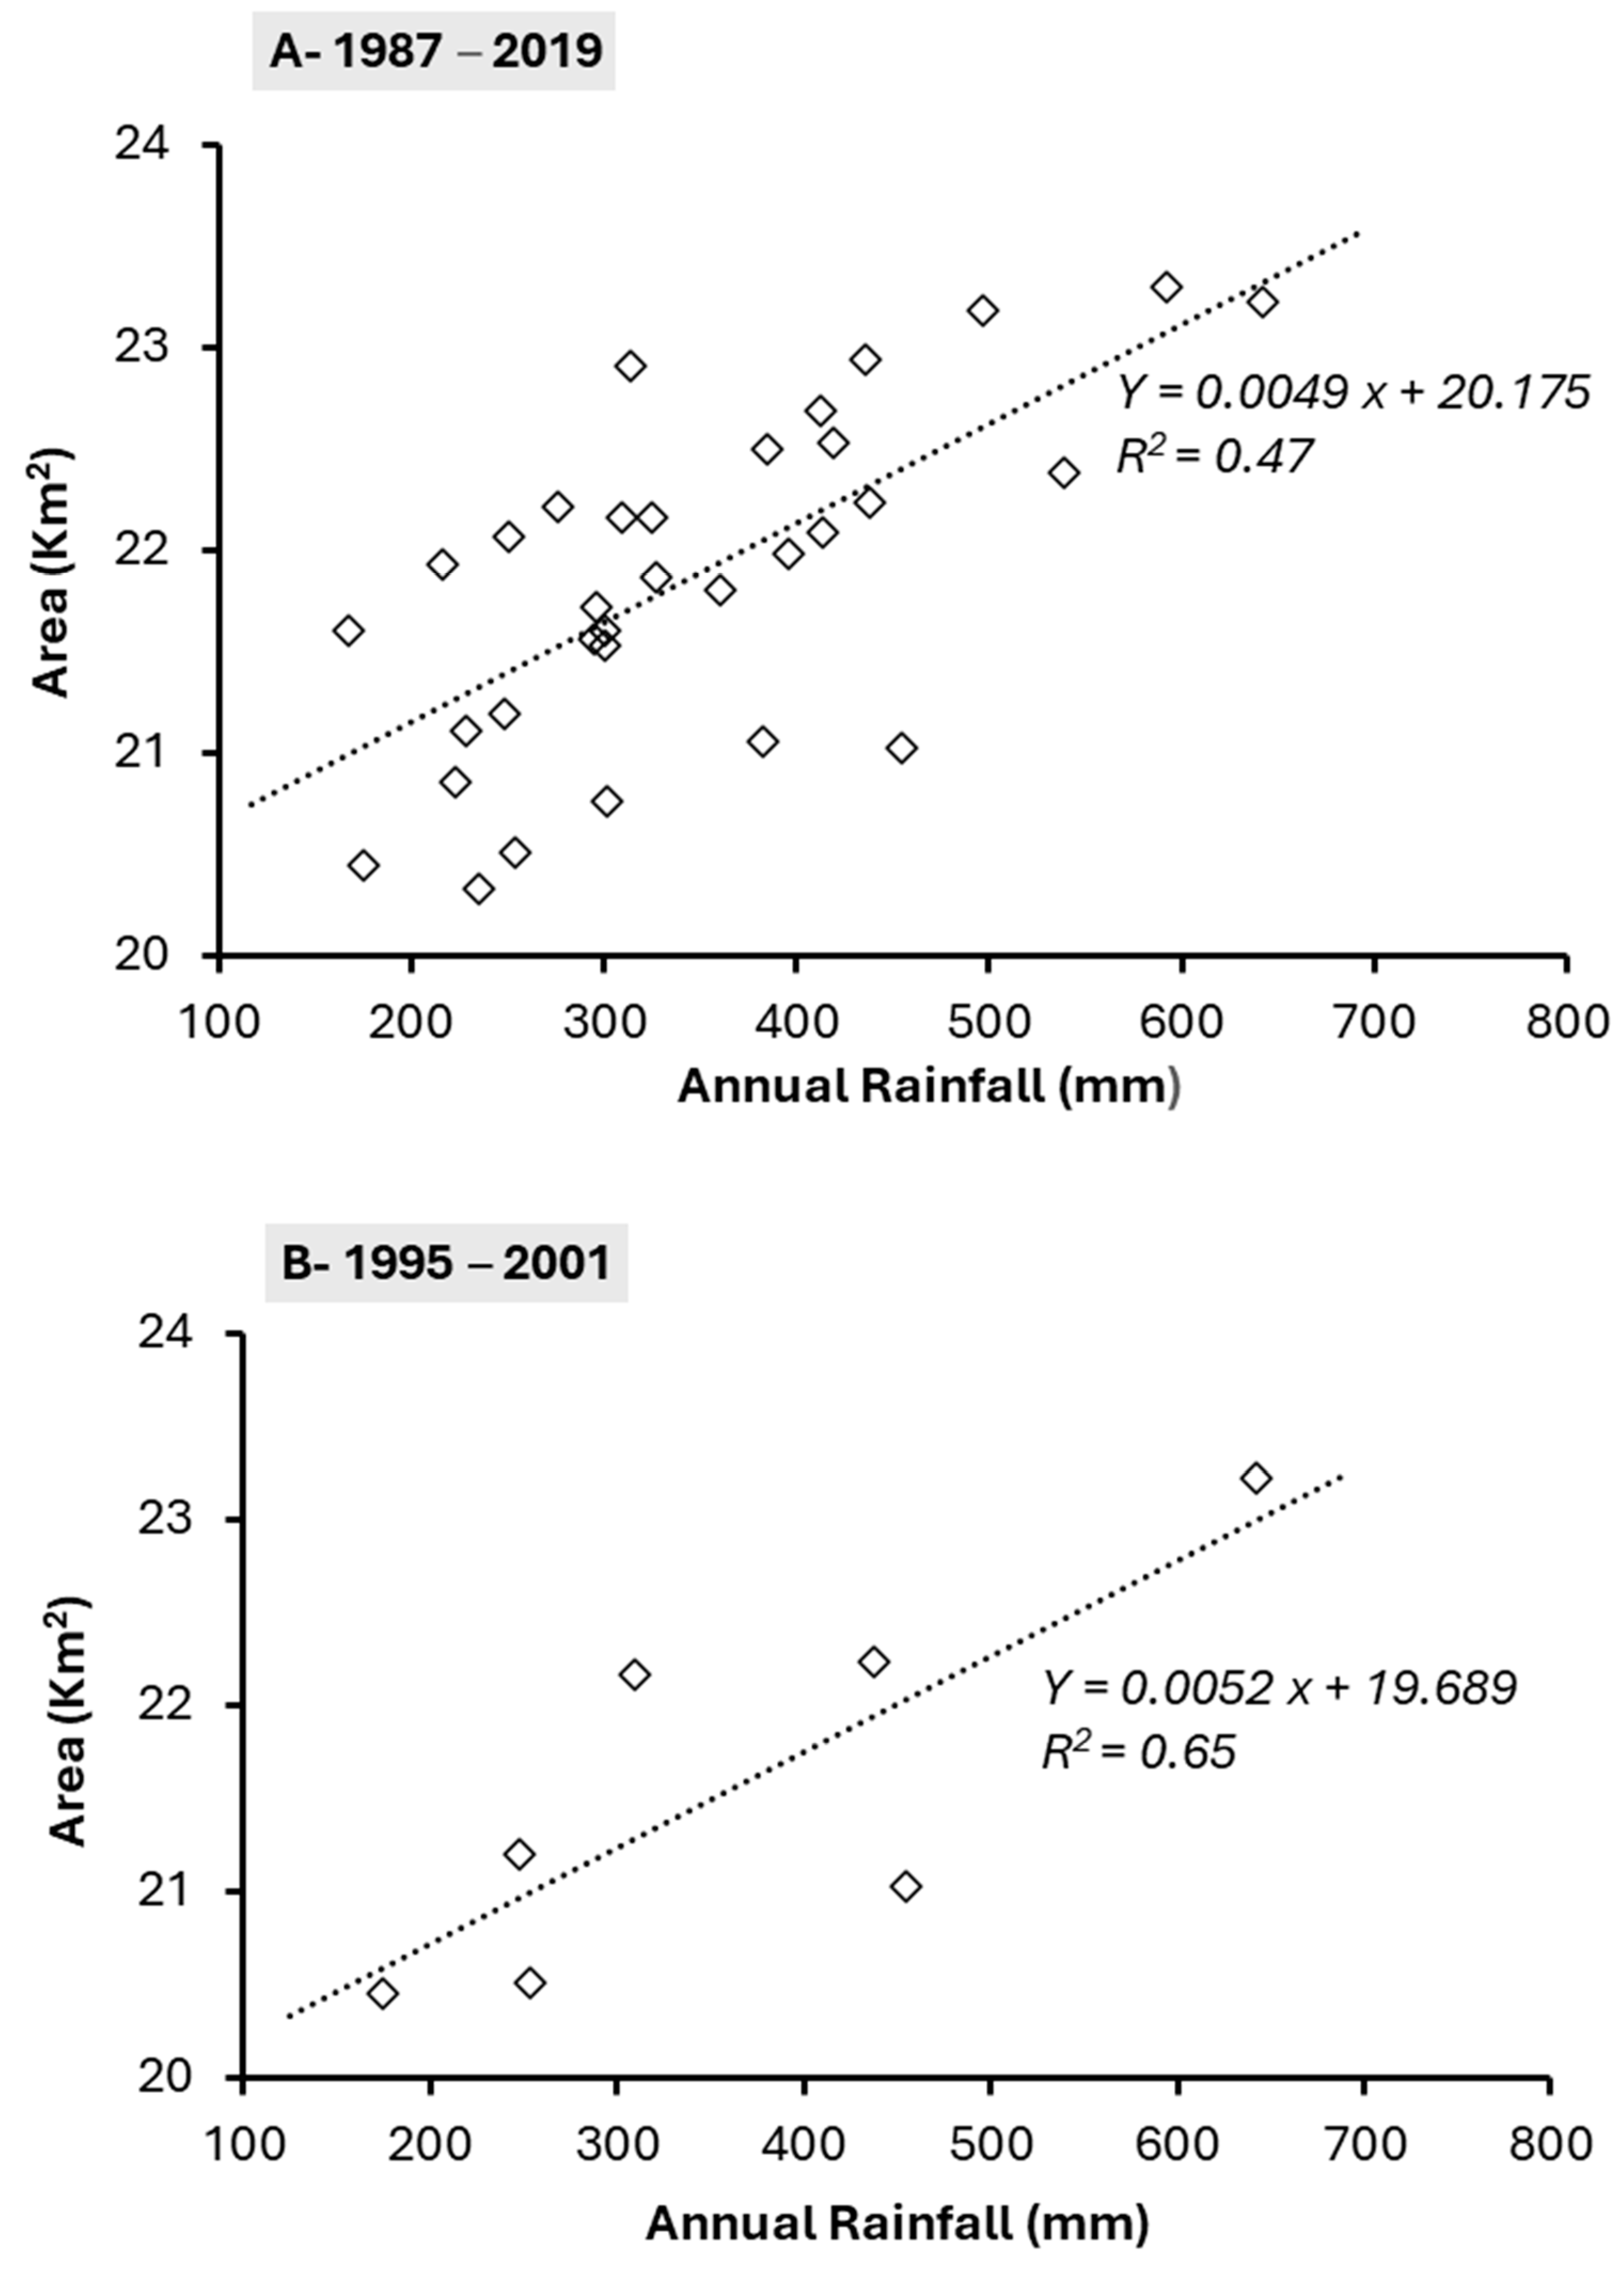
The regression analysis and dispersion graph were carried out using annual rainfall as the independent variable (X-axis) and the lake extent after the rainy season as the dependent variable (Y-axis). The analysis spans from 1987 to 2019 (Figure 7A), along with specific periods featuring increasing and decreasing rainfall trends: 1995 to 2001 (Figure 7B) and 2001 to 2010 (Figure 7C). Within these intervals, the rainfall demonstrates both ascending and descending patterns, with Chungará Lake extent reaching its minimum in 1995 and 2010, and its maximum in 2001 and 2012, coinciding with anomalies in rainfall and drought.
Between 1987 and 2019, the coefficient of determination (R2) stood at 0.47, and the p-value is 9.47 × 10⁻⁶ (Figure 7A). This indicates that 47% of the variance in Chungará Lake extent can be elucidated by rainfall, rendering the representation of rainfall (independent variable) versus the lake’s area (dependent variable) statistically significant.
For the timeframe spanning 1995 to 2001, the coefficient of determination and p-value are 0.65 and 0.03, respectively (Figure 7B). Throughout the period characterized by declining area and rainfall trends (2001 to 2010), the coefficient of determination and p-value are 0.61 and 0.008, respectively. These findings underscore a robust correlation between rainfall amount and Chungará Lake’s extent, with statistical significance in representing rainfall based on the lake’s area.
It can be inferred that precipitation significantly influences the extent of Chungará, aligning with the overall rainfall pattern across the years, notably mirroring the extremes in rainfall anomalies, as seen in 1995 and 2001. As discussed earlier, the linear regression analysis indicates a moderate correlation between rainfall and Chungará Lake’s extent. Hence, it becomes imperative to account for additional external factors, including groundwater recharge estimations and modeling the interplay between surface and groundwater [49], inflow from glacier melt, the intricate impacts of vegetation on the hydrological cycle [29], as well as seepage inflow and evaporation outflow. Indeed, disentangling the dual influences of climate change and human activity poses a formidable challenge.

3.4.2. Miscanti and Miniques Lakes

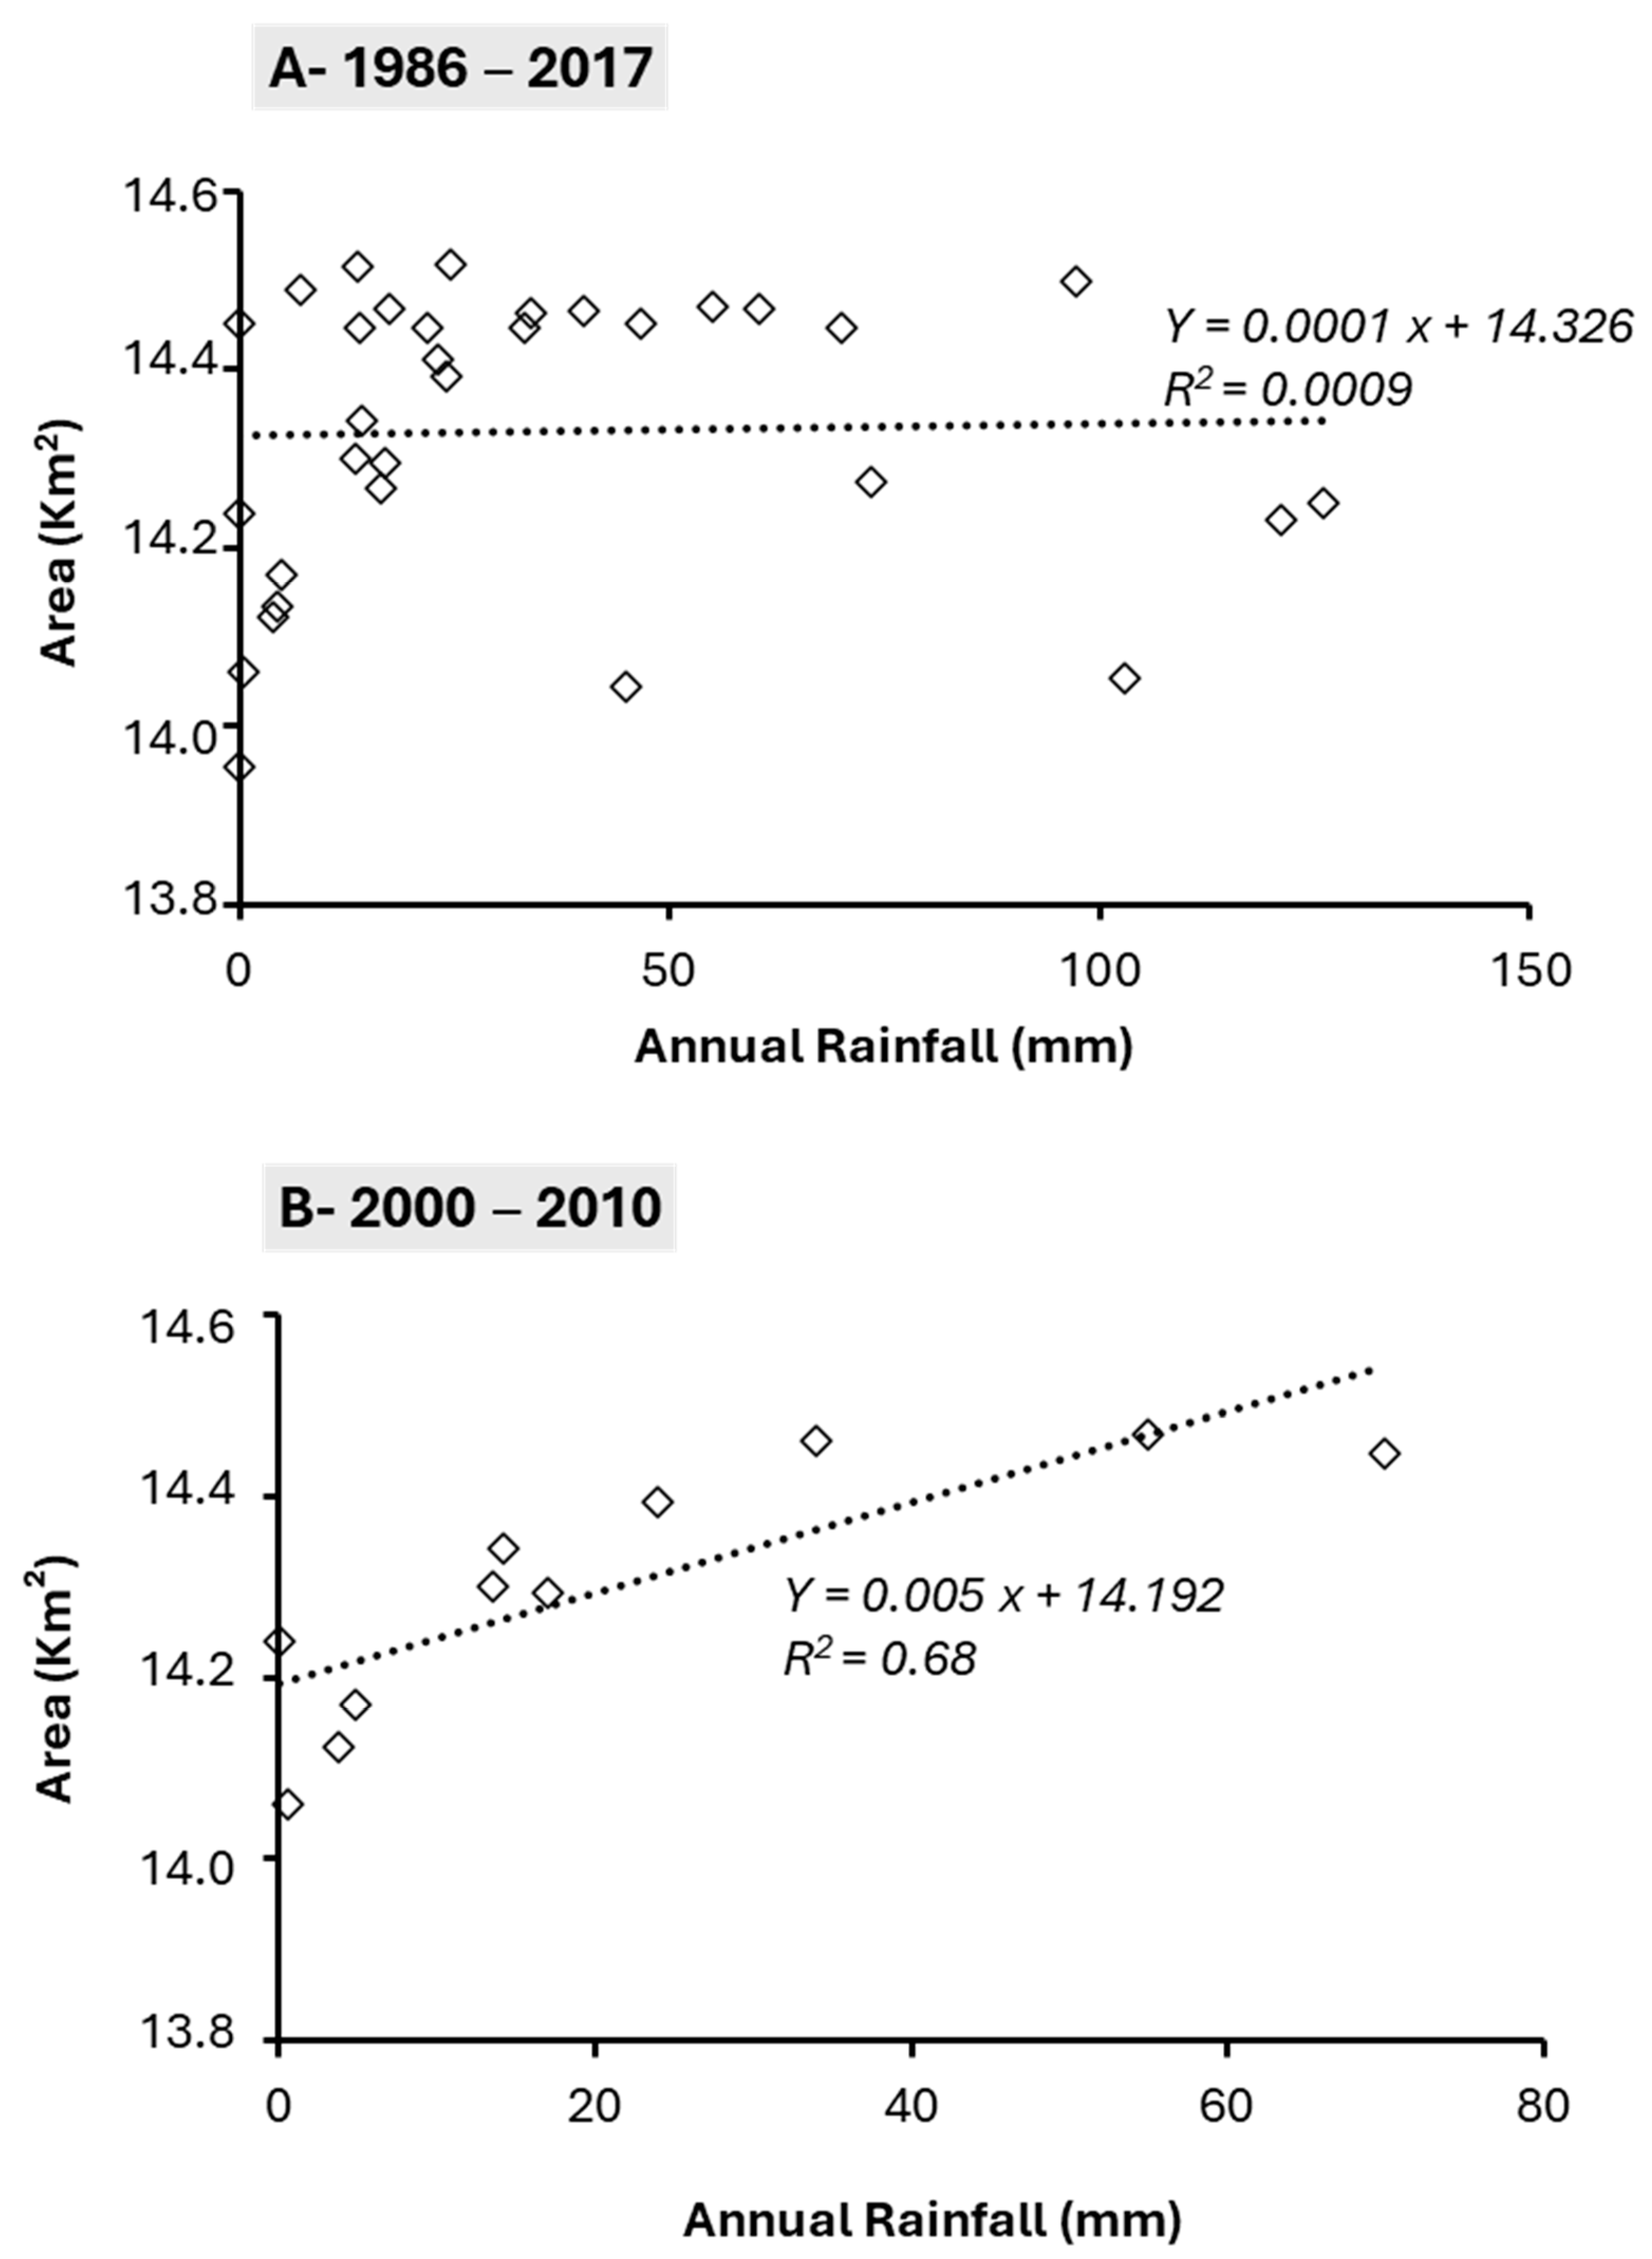
The regression analysis and dispersion graphs were conducted for the years spanning from 1986 to 2017 (Figure 8A), as well as for the specific period from 2000 to 2010. Within the latter timeframe, both the annual rainfall and the area of Miscanti and Miniques Lakes exhibited a gradual decrease (Figure 8B).
According to the analysis, the R2 value is low, and the p-value exceeds the significance level (0.05), suggesting that the variance in rainfall is not significant in elucidating the variability of lakes’ extent. This outcome implies that Miscanti and Miniques Lakes are influenced differently in terms of their water surface variability. However, for the period from 2000 to 2010, the R2 and p-value values are 0.68 and 0.001, respectively, indicating a good correlation between rainfall and the extent of Miscanti and Miniques lakes.
The data and images of Miscanti and Miniques Lakes clearly indicate that both lakes experience surface runoff overflow when their total area approaches 14.5 km2. Consequently, the regression equation tends to yield more accurate results during dry periods.
Several limitations in this study could impact the findings, including the following:
(a) The distance between meteorological stations and the lakes, potentially leading to insufficient precipitation data.
(b) Availability of satellite data for the most suitable date, potentially resulting in model estimation errors.
(c) Influence of snow periods on satellite precipitation estimates [50].
(d) Losses of water through underground percolation and evapotranspiration in endorheic basins and lakes [51,52].
(e) Human activities such as groundwater extraction and agriculture, which can impact the lakes’ water resources [49,53].
(f) Geomorphological characteristics of each reservoir, which can affect the accuracy of rainfall prediction based on area calculation. Geomorphology in closed basins in arid and desert regions is linked to erosion processes, lithology, the morphology of drainage networks, sediment transport, and channel evolution in ephemeral streams [54].
Understanding these limitations is crucial for interpreting the results accurately. Obtaining satellite image data immediately after the last day of rain increases the likelihood of obtaining more reliable results. However, this study indicates that evaporation remains a constant factor and significantly influences the lakes’ area as an outflow of water.
Considering these limitations, it is advisable to establish comprehensive, long-term monitoring of water storage variations in global endorheic systems. Such systems hold promise for yielding valuable insights into global climate changes and contributing to the collection of meteorological data.
These aspects are particularly relevant in inhospitable areas and hard-to-reach locations, as a well-adjusted regression model can indirectly calculate rainfall quantities, thereby facilitating the understanding of the hydrological cycle. It is suggested that additional studies be conducted to better adjust the regression lines. Furthermore, it is important to note that, according to the results, understanding the morphometric characteristics of the lakes is crucial for evaluating their response capacity to rainfall events, as well as understanding the watershed’s topography. Such characteristics can aid in understanding the uncertainties obtained from the estimates.
In conclusion, our study examines fluctuations in the water area of the lakes and indicates a decreasing trend in the rainfall patterns, signaling an escalation in drought occurrences in both studied regions. This observation is consistent with the findings of Barría et al. [55,56], which employed a hydrological model approach (WEAP) to identify annual precipitation deficits of approximately 38% as the primary triggering factor for lake retreat. Additionally, the latter study underscored a severe megadrought in the Acuelao watershed, resulting in pronounced reductions in river flows (44%) and groundwater recharge (24%). Both studies underscore the substantial impact of climatic factors, surpassing anthropogenic changes such as land use and land cover (LULC) alterations, on the lakes’ balance.

4. Conclusions

This research advocates for the utilization of endorheic system lake dynamics as natural indicators of rainfall, aiming to scrutinize climate variations. By applying this approach to orbital data spanning the past 31 years in the regions encompassing Chungará Lake, Miscanti, and Miniques Lake (Chilean Altiplano), the study showcases its efficacy in establishing correlations between climate conditions and lake expanses. Leveraging the Google Earth Engine platform proves to be a streamlined method for monitoring water dynamics over time, offering comprehensive reflectance data, streamlining processing tasks, and yielding precise and robust outcomes. The method outlined in this study is highly recommended for natural resource management and water body assessment and can be seamlessly integrated into various geographic information system programs.
Temporal examination of Chungará Lake unveils a moderate correlation (R2) between lake area and rainfall; however, additional factors may also influence the lake’s water dynamics. Miscanti and Miniques Lakes demonstrate distinct behaviors during substantial rainfall events, possibly linked to lake overflow and surface runoff. Overall, the lakes have exhibited a decline over the 31-year observation period, aligning with the diminishing rainfall trend noted since 1975 and displaying a good correlation with rainfall.
However, it is important to acknowledge the limitations of this study, such as the distance of meteorological stations from the lakes, potential gaps in precipitation data, satellite data, the influence of snow periods on precipitation estimates, and human activities affecting water resources. A thorough understanding of these limitations is imperative for accurately interpreting the findings.
Both Chungará Lake and Miscanti and Miniques Lakes are highly responsive to changes in precipitation. In general, we have observed that endorheic lakes can function as natural qualitative pluviometers for monitoring rainfall. This serves as a valuable tool for assessing water resources through short-term monitoring and indirectly detecting potential climate shifts through long-term monitoring using remote sensing time series.

Author Contributions

J.G.: conceptualization, formal analysis, data curation, visualization, writing—original draft. R.E.C.: conceptualization, methodology, formal analysis, data curation, visualization, writing—original draft. T.d.A.: conceptualization, methodology, writing—review and editing, supervision. J.C.R.B.: conceptualization, methodology. J.C.: methodology, writing—review and editing. A.P.M.R.: methodology, writing—review and editing. L.V.V.: methodology, writing—review and editing. F.S.: methodology, writing—review and editing. M.-P.B.: methodology, writing—review and editing. All authors have read and agreed to the published version of the manuscript.

Funding

INCT Odisseia: CNPq grant 302722/2018-1, CNPq 408035/2021-8, and FAP-DF 00193-00000308/2023-01.

Data Availability Statement

The links to the databases used in this paper are listed below: precipitation: https://giovanni.gsfc.nasa.gov/giovanni/#service=TmAvMp&starttime=&endtime=&dataKeyword=gpm (accessed on 1 September 2023); script for area calculation of water reservoirs in the Google Earth Engine platform: git clone: https://earthengine.googlesource.com/users/valadaolarissa/tocantinsReservoirsAreas (accessed on 1 July 2024); LULC data produced by the MapBiomas Project: https://mapbiomas.org/ (accessed on 1 March 2024); precipitation data: https://explorador.cr2.cl/ (accessed on 9 May 2024).

Acknowledgments

The authors acknowledge the infrastructure offered by the Applied Geosciences and Geodynamics Post Graduation Program and the Geoprocessing Specialization Course from the Geosciences Institute of Brasília University.

Conflicts of Interest

The authors declare no conflicts of interest.

References

  1. Bloomfield, J.P.; Marchant, B.P.; Mckenzie, A.A. Changes in groundwater drought associated with anthropogenic warming. Hydrol. Earth Syst. Sci. 2019, 23, 1393–1408. [Google Scholar] [CrossRef]
  2. Betancourt, J.L.; Latorre, C.; Rech, J.A.; Quade, J.; Rylander, K.A. A 22,000-year record of monsoonal precipitation from northern Chile’s Atacama Desert. Science 2000, 289, 1542–1546. [Google Scholar] [CrossRef]
  3. Grosjean, M.; Núñez, L.; Cartajena, I.; Messerli, B. Mid-Holocene climate and culture change in the Atacama Desert, northern Chile. Quat. Res. 1997, 48, 239–246. [Google Scholar] [CrossRef]
  4. Latorre, C.; Betancourt, J.L.; Rylander, K.A.; Quade, J. Vegetation invasions into absolute desert: A 45 000 yr rodent midden record from the Calama-Salar de Atacama basins, northern Chile (lat 22°–24°S). Bull. Geol. Soc. Am. 2002, 114, 349–366. [Google Scholar] [CrossRef]
  5. Latorre, C.; Betancourt, J.; Arroyo, M. Late Quaternary vegetation and climate history of a perennial river canyon in the Río Salado basin (22°S) of Northern Chile. Quat. Res. 2006, 65, 450–466. [Google Scholar] [CrossRef]
  6. Moreno, A.; Giralt, S.; Valero-Garcés, B.; Sáez, A.; Bao, R.; Prego, R.; Pueyo, J.J.; González-Sampériz, P.; Taberner, C. A 14kyr record of the tropical Andes: The Lago Chungará sequence (18°S, northern Chilean Altiplano). Quat. Int. 2007, 161, 4–21. [Google Scholar] [CrossRef]
  7. Nester, P.; Gayó, E.; Latorre, C.; Jordan, T.; Blanco, N. Perennial stream discharge in the hyperarid Atacama Desert of Northern Chile during the latest Pleistocene. Proc. Natl. Acad. Sci. USA 2008, 104, 19724–19729. [Google Scholar] [CrossRef]
  8. Núñez, L.; Loyola, R.; Cartajena, I.; López Mendoza, P.; Santander, B.; Maldonado, A.; De Souza, P.; Carrasco, C. Miscanti-1: Human occupation during the arid Mid-Holocene event in the high-altitude lakes of the Atacama Desert, South America. Quat. Sci. Rev. 2018, 181, 109–122. [Google Scholar] [CrossRef]
  9. Placzek, C.; Quade, J.; Betancourt, J.; Patchett, P.; Rech, J.; Latorre, C.; Matmon, A.; Holmgren, C.; English, N. Climate in the dry Central Andes over geologic, millennial, and interannual timescales. Ann. Mo. Bot. Gard. 2009, 96, 386–397. [Google Scholar] [CrossRef]
  10. Quade, J.; Rech, J.; Betancourt, J.; Latorre, C.; Quade, B.; Rylander, K.; Fisher, T. Paleowetlands and regional climate change in the central Atacama Desert, northern Chile. Quat. Res. 2008, 69, 343–360. [Google Scholar] [CrossRef]
  11. Rech, J.; Quade, J.; Betancourt, J. Late Quaternary paleohydrology of the central Atacama Desert (lat 22°–24°S), Chile. Geol. Soc. Am. Bull. 2002, 114, 334–348. [Google Scholar] [CrossRef]
  12. Sáez, A.; Godfrey, L.; Herrera, C.; Chong, G.; Pueyo, J.J. Timing of wet episodes in Atacama Desert over the last 15 ka. The Groundwater Discharge Deposits (GWD) from Domeyko Range at 25°S. Quat. Sci. Rev. 2016, 145, 82–93. [Google Scholar] [CrossRef]
  13. Theissen, K.; Dumbar, R.; Rowe, H.; Mucciarone, D. Multidecadal- to century-scale arid episodes on the Northern Alti-plano during the middle Holocene. Palaeogeogr. Palaeoclimatol. Palaeoecol. 2008, 257, 361–376. [Google Scholar] [CrossRef]
  14. Grosjean, M. Paleohydrology of the Laguna Lejía (north Chilean Altiplano) and climatic implications for late-glacial times. Palaeogeogr. Palaeoclimatol. Palaeoecol. 1994, 109, 89–100. [Google Scholar] [CrossRef]
  15. Kull, C.; Grosjean, M. Albedo changes, Milankovitch forcing, and late Quaternary climate changes in the central Andes. Clim. Dyn. 1998, 14, 871–881. [Google Scholar] [CrossRef]
  16. Geyh, M.A.; Grosjean, M.; Núñez, L.; Schotterer, U. Radiocarbon reservoir effect and the timing of the late-Glacial/Early Holocene humid phase in the Atacama Desert (northern Chile). Quat. Res. 1999, 52, 143–153. [Google Scholar] [CrossRef]
  17. Grosjean, M.; Núñez, A.L. Lateglacial, early and middle Holocene environments, human occupation, and resource use in the Atacama (northern Chile). Geoarchaeology 1994, 9, 271–286. [Google Scholar] [CrossRef]
  18. Grosjean, M.; Messerli, B.; Ammann, C.; Geyh, M.; Graf, K.; Jenny, B.; Kammer, K.; Núñez, L.; Schreier, H.; Schotterer, U.; et al. Holocene environmental changes in the Atacama Altiplano and paleoclimatic implications. Bull. L’institut Français D’etudes Andin. 1995, 24, 585–594. [Google Scholar] [CrossRef]
  19. Grosjean, M.; Van Leeuwen, J.F.N.; van der Knaap, W.O.; Geyh, M.A.; Ammann, B.; Tanner, W.; Veit, H. A 22,000 14C year BP sediment and pollen record of climate change from Laguna Miscanti (23 S), northern Chile. Glob. Planet. Chang. 2001, 28, 35–51. [Google Scholar] [CrossRef]
  20. Grosjean, M.; Cartajena, I.; Geyh, M.A.; Núñez, L. From proxy data to paleoclimate interpretation: The mid-Holocene paradox of the Atacama Desert, northern Chile. Palaeogeogr. Palaeoclimatol. Palaeoecol. 2003, 194, 247–258. [Google Scholar] [CrossRef]
  21. Valero-Garcés, B.; Grosjean, M.; Schwalb, A.; Geyh, M.; Messerli, B.; Kelts, K. Limnogeology of Laguna Miscanti: Evidence for mid to late Holocene moisture changes in the Atacama Altiplano (Northern Chile). J. Paleolimnol. 1996, 16, 1–21. [Google Scholar] [CrossRef]
  22. Wirrmann, D.; Almeida, L. Low Holocene level (7700 to 3650 years ago) of Lake Titicaca (Bolivia). Palaeogeogr. Palaeoclimatol. Palaeoecol. 1987, 59, 315–323. [Google Scholar] [CrossRef]
  23. Garreaud, R.D.; Boisier, J.P.; Rondanelli, R.; Montecinos, A.; Sepúlveda, H.H.; Veloso-Aguila, D. The Central Chile Mega Drought (2010–2018): A climate dynamics perspective. Int. J. Climatol. 2020, 40, 421–439. [Google Scholar] [CrossRef]
  24. Rivera, J.A.; Arnould, G.; Leal, R. Evaluation of the ability of CMIP6 models to simulate precipitation over South-western South America: Climatic features and long-term trends (1901–2014). Atmos. Res. 2020, 241, 104953. [Google Scholar] [CrossRef]
  25. Torres-Batllo, J.; Martí-Cardona, B. Precipitation trends over the southern Andean Altiplano from 1981 to 2018. J. Hydrol. 2020, 590, 125485. [Google Scholar] [CrossRef]
  26. DGA: Dirección General de Aguas. Actualizacion del Balance Hídrico Nacional, SIT No 417; DGA: Santiago, Chile, 2017. [Google Scholar]
  27. Souvignet, M.; Oyarzún, R.; Verbist, K.M.J.; Gaese, H.; Heinrich, J. Hydro-meteorological trends in semi-arid north-central Chile (29–32°S): Water resources implications for a fragile Andean region. Hydrol. Sci. J. 2012, 57, 479–495. [Google Scholar] [CrossRef]
  28. Urrutia, R.; Vuille, M. Climate change projections for the tropical Andes using a regional climate model: Temperature and precipitation simulations for the end of the 21st century. J. Geophys. Res. Atmos. 2009, 114, D02108. [Google Scholar] [CrossRef]
  29. Stage, F.; Villar, R.; Zolá, R.; Roig, H.; Timouk, F.; Molina Carpio, J.; Garnier, J.; Calmant, S.; Seyler, F.; Bonnet, M.-P. Role of Climate Variability and Human Activity on Poopó Lake Droughts between 1990 and 2015 Assessed Using Remote Sensing Data. Remote Sens. 2017, 9, 218. [Google Scholar] [CrossRef]
  30. Li, X.; Zhang, Z.; Hu, W.; Ma, M.; Wang, J.; Wang, Z.; Shang, S.; Wang, Z.; Che, T.; He, Q.; et al. Hydrological cycle in the Heihe River Basin and its implication for water resource management in endorheic basins. J. Geophys. Res. Atmos. 2018, 123, 890–914. [Google Scholar] [CrossRef]
  31. Gorelick, N.; Hancher, M.; Dixon, M.; Ilyushchenko, S.; Thau, D.; Moore, R. Google Earth Engine: Planetary-scale geospatial analysis for everyone. Remote Sens. Environ. 2017, 202, 18–27. [Google Scholar] [CrossRef]
  32. Yang, X.; Chen, Y.; Wang, J. Combined use of Sentinel-2 and Landsat 8 to monitor water surface area dynamics using Google Earth Engine. Remote Sens. Lett. 2020, 11, 687–696. [Google Scholar] [CrossRef]
  33. Valadão, L.V.; Cicerelli, R.E.; Almeida, T.; Curto Ma, J.B.; Garnier, J. Reservoir metrics estimated by remote sensors based on the Google Earth Engine platform. Remote Sens. Appl. Soc. Environ. 2021, 24, 100652. [Google Scholar] [CrossRef]
  34. Xia, H.; Zhao, J.; Qin, Y.; Yang, J.; Cui, Y.; Song, H.; Ma, L.; Jin, N.; Meng, Q. Changes in water surface area during 1989–2017 in the Huai River Basin using Landsat data and Google Earth Engine. Remote Sens. 2019, 11, 1824. [Google Scholar] [CrossRef]
  35. Devries, B.; Verdin, A.; Braak, K.; Barbieri, V.; Herold, M. Rapid and robust monitoring of flood events using Sentinel-1 and Landsat data on the Google Earth Engine. Remote Sens. Environ. 2020, 240, 111664. [Google Scholar] [CrossRef]
  36. Mühlhauser, H.; Hrepic, N.; Mladinic, P.; Montecino, V.; Silva, S. Water quality and limnological features of a high altitude Andean lake, Chungará, in northern Chile. Rev. Chil. Hist. Nat. 1995, 68, 341–349. [Google Scholar]
  37. Herrera, C.; Pueyo, J.J.; Sáez, A.; Valero-Garcés, B.L. Relación de aguas superficiales y subterráneas en el área del lago Chungará y lagunas de Cotacotani, norte de Chile: Un estudio isotópico. Rev. Geol. Chile 2006, 33, 299–325. [Google Scholar] [CrossRef]
  38. Pueyo, J.J.; Sáez, A.; Valero-Garcés, B.L.; Moreno, A.; Bao, R.; Schwalb, A.; Schwalb, A.; Herrera, C.; Klosowska, B.; Taberner, C. Carbonate and organic matter sedimentation and isotopic signatures in Lake Chungará, Chilean Altiplano, during the last 12.3 kyr. Palaeogeogr. Palaeoclimatol. Palaeoecol. 2011, 307, 339–355. [Google Scholar] [CrossRef]
  39. Sáez, A.; Valero-Garcés, B.; Moreno, A.; Bao, R.; Pueyo, J.J.; Gonzalez Samperiz, P.; Giralt, S.; Taberner, C.; Herrera, C.; Gibert, R. Lacustrine sedimentation in active volcanic settings: The Late Quaternary depositional evolution of Lake Chungará (northern Chile). Sedimentology 2007, 54, 1191–1222. [Google Scholar] [CrossRef]
  40. Garreaud, R.; Aceituno, P. Interannual rainfall variability over the South American Altiplano. J. Clim. 2001, 14, 2779–2789. [Google Scholar] [CrossRef]
  41. Díaz, G.C. The cenozoic saline deposits of the chilean andes between 18°00′ and 27°00′ south latitude. In The Southern Central Andes; Bahlburg, H., Breitkreuz, C., Giese, P., Eds.; Springer: Berlin, Heidelberg, 1988; Volume 17. [Google Scholar] [CrossRef]
  42. Claverie, M.; Ju, J.; Masek, J.G.; Dungan, J.L.; Vermote, E.F.; Roger, J.C.; Skakun, S.V.; Justice, C. The Harmonized Landsat and Sentinel-2 surface reflectance data set. Remote Sens. Environ. 2015, 162, 331–340. [Google Scholar] [CrossRef]
  43. Vermote, E.; Justice, C.; Claverie, M.; Franch, B. Preliminary analysis of the performance of the Landsat 8/OLI land surface reflectance product. Remote Sens. Environ. 2016, 185, 46–56. [Google Scholar] [CrossRef] [PubMed]
  44. Cao, Y.; Xue, Y.; Liu, Y. Monitoring surface water dynamics in the Yellow River Basin using Landsat time-series data and Google Earth Engine. Remote Sens. 2022, 14, 1432. [Google Scholar] [CrossRef]
  45. Pickens, A.H.; Hansen, M.C.; Hancher, M.; Stehman, S.V.; Tyukavina, A.; Potapov, P.; Marroquin, B.; Sherani, Z. Mapping and sampling to characterize global inland water dynamics from 1999 to 2018 with full Landsat time-series. Remote Sens. Environ. 2020, 243, 111792. [Google Scholar] [CrossRef]
  46. Pekel, J.F.; Cottam, A.; Gorelick, N.; Belward, A.S. High-resolution mapping of global surface water and its long-term changes. Nature 2016, 540, 418–422. [Google Scholar] [CrossRef] [PubMed]
  47. Xavier, G.O.; Almeida, T.; Oliveira, C.M.M.; Oliveira, P.D.S.; Costa, V.H.B.; Granado, L.M.A. Estimate and evaluation of reservoir metrics in Serra da Mesa dam (GO) using the Google Earth Engine platform. Rev. Ambiente Água 2020, 15, e2584. [Google Scholar] [CrossRef]
  48. Pekel, J.F.; Vancutsem, C.; Bastin, L.; Clerici, M.; Vanbogaert, E.; Bartholomé, E.; Defourny, P. A near real-time water surface detection method based on HSV transformation of MODIS multi-spectral time series data. Remote Sens. Environ. 2014, 140, 704–716. [Google Scholar] [CrossRef]
  49. Blin, N.; Hausner, M.; Leray, S.; Lowry, C.; Suárez, F. Potential impacts of climate change on an aquifer in the arid Altiplano, northern Chile: The case of the protected wetlands of the Salar del Huasco basin. J. Hydrol. Reg. Stud. 2022, 39, 100996. [Google Scholar] [CrossRef]
  50. Li, D.; Zhang, Y.; Xie, H.; Qiu, J. Adequacy of TRMM satellite rainfall data in driving the SWAT modeling of Tiaoxi catchment (Taihu lake basin, China). J. Hydrol. 2018, 556, 1139–1152. [Google Scholar] [CrossRef]
  51. Zhang, G.; Yao, T.; Shum, C.K.; Yi, S.; Yang, K.; Xie, H.; Feng, W.; Bolch, T.; Wang, L.; Behrangi, A.; et al. Lake volume and groundwater storage variations in Tibetan Plateau’s endorheic basin. Geophys. Res. Lett. 2017, 44, 5550–5560. [Google Scholar] [CrossRef]
  52. Wang, J.; Chen, J.; van der Velde, R.; Wang, J.; Famiglietti, J.S. Recent global decline in endorheic basin water storages. Nat. Geosci. 2018, 11, 926–932. [Google Scholar] [CrossRef]
  53. Yapiyev, V.; Sagintayev, Z.; Jumassultanova, S.; Sagintayev, Z.; Kalugin, A.; Kostyuchenko, Y.; Karabulatov, S.; Verhoef, A. Essentials of endorheic basins and lakes: A review in the context of current and future water resource management and mitigation activities in Central Asia. Water 2017, 9, 798. [Google Scholar] [CrossRef]
  54. Sant’Anna Commar, L.F.; Barros Vitorino, F.; Castro, M.; Pousa, R.; Heil Costa, M. A Hydroclimatic Forecast System to Support Decision-Making and Improve Water Security in an Agricultural Frontier of the Brazilian Cerrado. J. Water Resour. Plann. Manag. 2024, 150, 05023023. [Google Scholar] [CrossRef]
  55. Dorsaz, J.-M.; Jaboyedoff, M.; Carrea, D.; Derron, M.-H.; Loye, A.; Nicolet, P.; Vaucher, S. The geomorphometry of endorheic drainage basins: Implications for interpreting and modelling their evolution. Earth Surf. Process. Landf. 2013, 38, 1881–1896. [Google Scholar] [CrossRef]
  56. Barría, P.; Chadwick, C.; Ocampo-Melgar, A.; Galleguillos, M.; Garreaud, R.; Díaz-Vasconcellos, R.; Poblete, D.; Rubio-Álvarez, E.; Poblete-Caballero, D. Water management or megadrought: What caused the Chilean Aculeo Lake drying? Reg. Environ. Chang. 2021, 21, 19. [Google Scholar] [CrossRef]
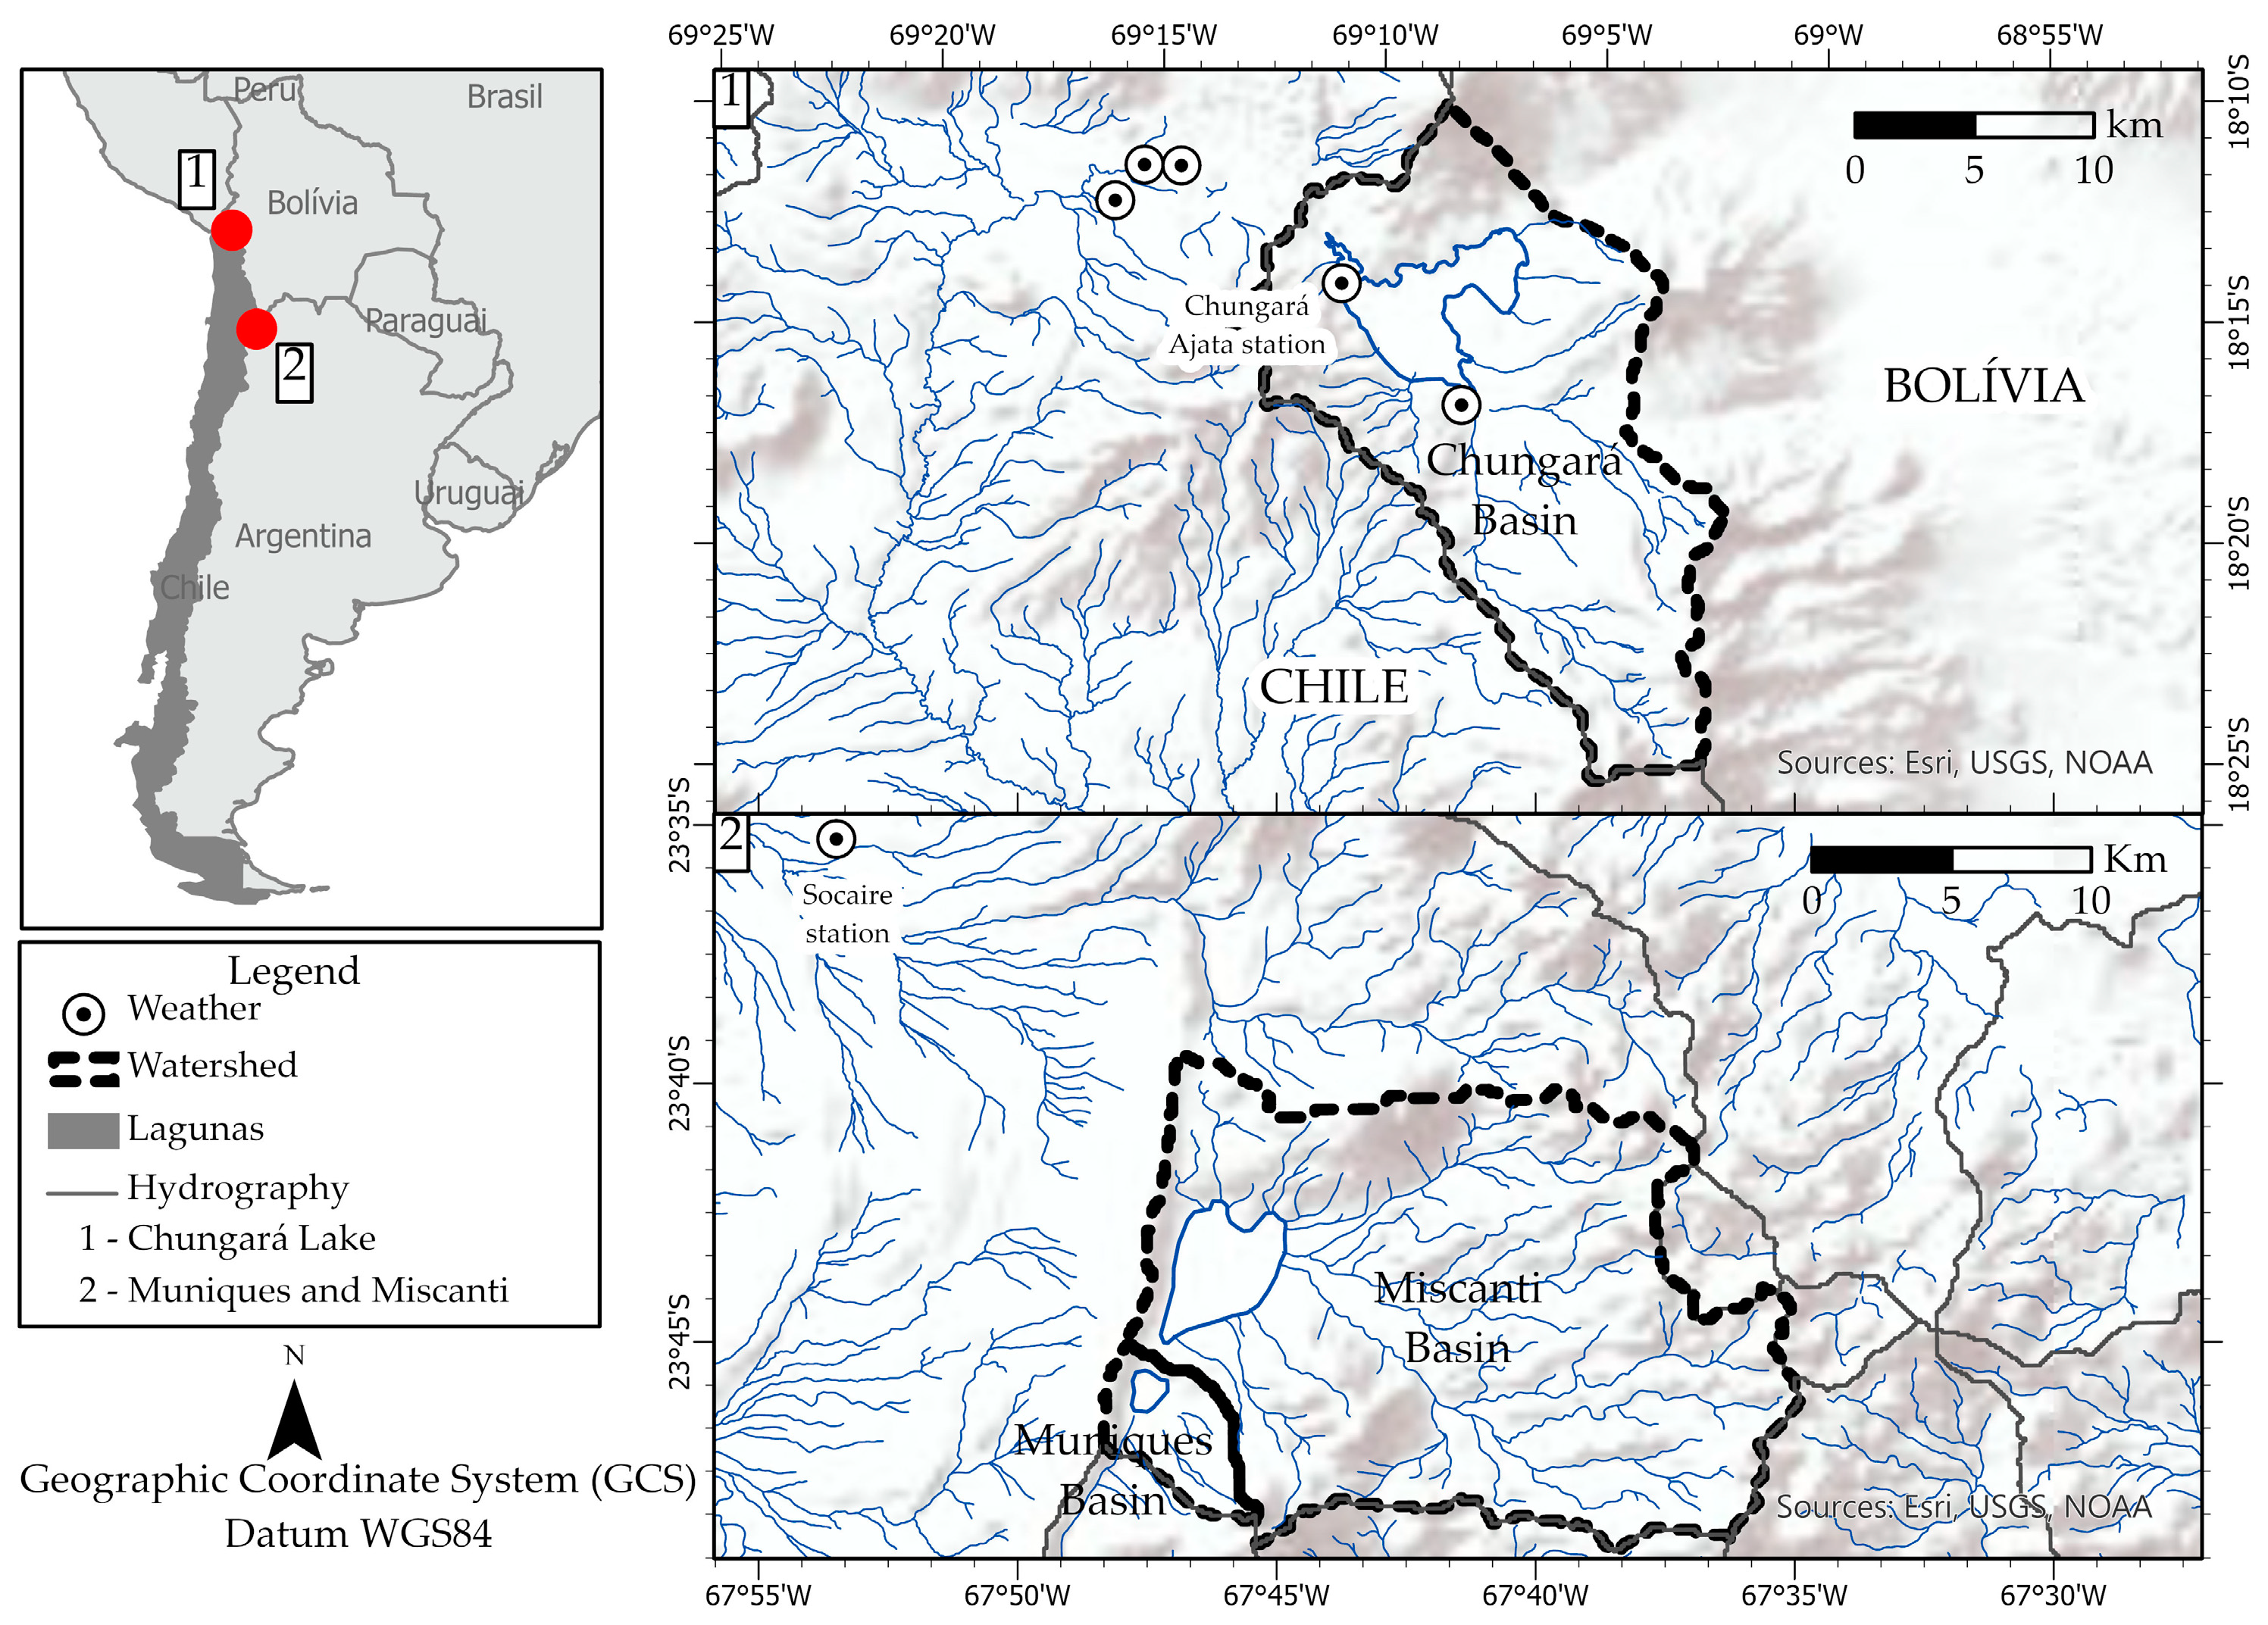
Figure 1. Localization of the study areas and metereological stations near the lakes; data source: Biblioteca del Congresso Nacional del Chile (BCN); Infraestructura de Datos Geoespaciales Chile (IDE Chile); Dirección General de Aguas (DGA).
Remotesensing 16 02790 g001
Figure 2. Methodological flowchart of the procedures.
Remotesensing 16 02790 g002
Figure 3. Dispersion graph between Miscanti Lake area and Miniques Lake area: green—2010–2017; orange—2000–2009; purple—1990–1999; red—1980.
Remotesensing 16 02790 g003
Figure 4. Chungará extent (red diamond) compared to the annual rainfall from 1987 to 2019.
Remotesensing 16 02790 g004
Figure 5. Miscanti and Miniques lakes area (red diamond) after the rainy period calculated from 1986 to 2017 compared to their annual rainfall.
Remotesensing 16 02790 g005
Figure 6. Miscanti and Miniques Lakes extend over time after the last day of the rainy season in 2015.
Remotesensing 16 02790 g006
Figure 7. Dispersion graphs of annual rainfall vs. Chungará Lake area at the end of the wet season for the years.
Remotesensing 16 02790 g007aRemotesensing 16 02790 g007b
Figure 8. Linear regression analysis and dispersion graphs of annual rainfall (X axis) versus Miscanti and Miniques Lakes’ area (Y axis) at the end of the wet season for the years.
Remotesensing 16 02790 g008
Table 1. Metrics were obtained from SRTM data, collected between February 11 and 22 in 2000.
Chungará LakeMiscanti LakeMiniques Lake
Basin Area (Km2)267.06 267.7217.68
Basin Perimeter (Km)96109.299.0222.92
Maximum Elevation (m)629957745763
Minimum Elevation (m)455641414131
Total Channel Length (Km)141.88233.0510.50
Drainage Density0.530.870.59
Maximum Axis (Km)13.691.093.27
Minimum Axis (Km)6.207.681.72
Compactness Coefficient (Kc)1.641.691.52
Form Factor (Kf)0.450.690.52
Disclaimer/Publisher’s Note: The statements, opinions and data contained in all publications are solely those of the individual author(s) and contributor(s) and not of MDPI and/or the editor(s). MDPI and/or the editor(s) disclaim responsibility for any injury to people or property resulting from any ideas, methods, instructions or products referred to in the content.