Article

Study the Global Earthquake Patterns That Follow the St. Patrick’s Day Geomagnetic Storms of 2013 and 2015

by
Dimitar Ouzounov
1,* and
Galina Khachikyan
2
1
Institute for Earth, Computing, Human and Observing (Institute for ECHO), Chapman University, Orange, CA 92866, USA
2
National Scientific Center for Seismological Observations and Research, Almaty 050060, Kazakhstan
*
Author to whom correspondence should be addressed.
Remote Sens. 2024, 16(14), 2544; https://doi.org/10.3390/rs16142544
Submission received: 7 April 2024 / Revised: 1 July 2024 / Accepted: 8 July 2024 / Published: 11 July 2024

Abstract

:
A response of global seismic activity to the geomagnetic storms of St. Patrick’s Day (March 17) in 2013 and 2015 is investigated. These two storms occurred during nearly identical storm sudden commencement times and similar solar flux levels. We have revealed a rather similar pattern of the most substantial earthquakes that have occurred since these storms. Two major crust continental earthquakes, in Iran (M = 7.7), 16 April 2013, and in Nepal (M = 7.8), 25 April 2015, have occurred with a time delay of ~30 and ~39 days after geomagnetic storm onsets in 2013 and 2015, respectively. After that, the great and major deep-focused earthquakes occurred beneath the Sea of Okhotsk (M = 8.3, 24 May 2013, Russia) and the Pacific Ocean (M = 7.8, 30 May 2015, Japan) with a time delay of ~68 and ~74 days, respectively. Geomagnetic storm onsets occurred at 06:04 UT in 2013 and 04:48 UT in 2015. At this time, the high latitudinal areas of the longitudinal regions, in which the mentioned earthquakes occurred in the future, were located under the polar cusp, where the solar wind plasma has direct access to the Earth’s environment. An analysis of the remaining ten earthquakes with M ≥ 7.5, which occurred around the globe in 2013 and 2015, proved the above findings that seismic activity may respond to geomagnetic storm onset with a time delay from some days to some months.

Graphical Abstract

1. Introduction

A Swiss astronomer and mathematician, Johann Rudolf Wolf, almost 170 years ago suggested that solar activity could influence the occurrence of earthquakes [1]. After the discovery of solar wind in 1959 [2], which has been an outstanding achievement in heliophysics and space physics, it has been recognized that solar wind plays a crucial role in the processes taking place in the Solar System and that it is the main factor that controls the terrestrial effects of space weather. For more than 60 years, much work has been done to reveal a lithosphere response to solar activity. As a result, it is assumed that, during substantial increases in solar wind activity, the Sun may be considered a significant agent provoking earthquakes [3]. More than five decades ago, it was revealed [4] that the maximum earthquake frequency occurs at times of moderately high and fluctuating solar activity. It was suggested that the coupling mechanisms that could trigger earthquakes could be abrupt accelerations in the Earth’s angular velocity or surges of telluric currents in the Earth’s crust [4]. The results in [5] showed that the perturbations in the atmospheric mass, which could be caused by solar activity, may affect the Earth’s rotation and then influence earthquakes. Recently, a mathematical model [6] has been developed that considers a hypothesis of electromagnetic earthquakes triggered by a sharp rise of telluric currents in the lithosphere, including crust faults, due to the interaction of solar flare X-ray radiation with the ionosphere–atmosphere–lithosphere system. The model [6] suggested that the absorption of solar flare radiation in the ionosphere produces additional ionization in it, which results in the appearance of the additional electric current and electric field in the ionosphere, which will ultimately lead to an increase in the telluric current in the Earth’s crust. The authors of [6] concluded that, after the solar flare of X-class, the telluric current density in the conductive layer of the lithosphere might reach 10−8–10−6 A/m2, which is two to three orders more than the average telluric current density of 2·10−10 A/m2 in the lithosphere. Also, they noticed that, calculated in [6], the parameters of telluric currents are comparable with the artificial electrical pulses injected into the Earth’s crust in seismic-prone areas in Pamir and Northern Tien Shan [7] that resulted in the electromagnetic triggering of weak earthquakes and the spatiotemporal redistribution of the regional seismicity in these regions.
What is a statistical result from the connection between solar and seismic activity, the more territories were analyzed, the more contradictory results appeared. Therefore, it was found in [8,9,10] that earthquakes occur frequently in the minima of solar activity, while, in [11,12,13], it was found that they occur frequently in solar maxima. For example, in [9], the data on earthquakes at different magnitude scales that occurred around the globe in 20–23 solar cycles (1963–2010) were compared with monthly sunspot numbers for the same time interval. They have found an out-of-phase relationship between earthquake counts and sunspot numbers. Also, they showed that the released seismic energy around the globe was picked up in years of solar minima. The same conclusion was made by [10], who investigated the relationship between secular variations in solar activity and seismic energy released on the planet in 1690–2002. However, an analysis of secular variations in solar activity and seismicity in the Mediterranean region revealed [11] that the highest seismic activity occurred around secular solar maximum. The authors of [12] studied worldwide earthquakes from 1600 to 2010 and revealed that earthquake counts mainly increase in the maxima of the solar cycle, but it depends on the tectonic plate location. They noted that tectonics is essential because there is heterogeneity in the crust, and the tectonic stress depends on each region. This idea was supported by [13], who studied the relationship between solar activity and the big earthquakes (Ms ≥ 8) that occurred in China and Western Mongolia. They discovered that, in the years of the solar maxima, only those earthquakes occurred in which epicenters were in and near the tectonic faults with west–east strikes. However, those big earthquakes, in which epicenters were located not in such faults, did not occur in the solar maxima. The statistical findings in [13] were rather in agreement with the predictions of the mathematical model [6], which predicts that the tectonic fault’s electrical conductivity and geographic orientation play an essential role in the electromagnetic triggering of earthquakes. The stronger telluric currents will be generated when the telluric current density vector is directed parallel to the direction of the tectonic fault. According to a mathematical model [6], at the Northern Hemisphere’s middle and low latitudes, the telluric currents’ density vectors are oriented predominantly in the west–east direction, which coincides with the orientation of the faults in or near which the epicenters of significant earthquakes in China occurred in solar maxima [13]. The triggering of seismic activity by strong solar flares was discussed in more detail in [14], and the problems related to understanding the physical reasons for the Sun’s influence on the Earth’s seismicity were discussed in more detail in [15].
The most evident manifestations of solar wind activity on the Earth are geomagnetic storms. There have been many papers in which a possible response of seismic activity to geomagnetic storms was investigated, e.g., [16] (and references herein). Therefore, it was found in [17] that 17 strong earthquakes (M ≥ 6.5) for 1994–2017 occurred within two days after geomagnetic storms when the values of the geomagnetic Kp-indices were above seven and that all these events occurred in the Eastern longitudinal Hemisphere but were absent in the Western one. An analysis of the seismic activity in the Northern Tien-Shan from 1975 to 1996, which was carried out in [18], has revealed that, there, the seismic activity increases, on average, 2–6 days after the onset of a magnetic storm, but this takes place only in those regions, where the rocks have a low electrical resistivity. The authors of [19] investigated data from 4666 strong earthquakes (Mw ≥ 6) in the Pacific Rim region (120°–160°E, 70°–130°W) during 1932–2016. They concluded that the forces accompanying the magnetic storm might be responsible for earthquakes triggering with a time delay of ~12–14 days. In [20], the correlation between geomagnetic storms and strong (Mw ≥ 7.0) earthquakes that occurred around the globe in 1957–2020 was investigated; statistically significant evidence was found that the probability of geomagnetic storms increased around 26–27 days before earthquakes. The authors of [21] analyzed Mw5.5+ shallow earthquakes that occurred around the globe from November 2013 to November 2021 in connection with the magnetic field data measured in this period by the three Swarm identical satellites constellation. For major earthquakes (Mw7.5+), it was found that the time delay between geomagnetic storm onset and earthquake occurrence may be up to several years.
It is assumed, at present, that, during the 11-year solar cycle, two maxima in geomagnetic storm numbers appear—one in the sunspot maximum, when coronal mass ejection (CME) is mainly responsible for the geomagnetic activity, and another one in the descending phase of the 11-year solar cycle, when the high-speed solar wind (HSSW) from the polar coronal holes is mainly responsible for geomagnetic activity [22]. The authors of [23] studied the day-to-day variations in the number of earthquakes relative to the days when the Earth was exposed to the CMEs and when the Earth was exposed to the HSSW in 1973–2000. They revealed that, in the 11-year solar cycle, two maxima in the number of earthquakes appear—one in the sunspot maximum and another one in the descending phase of the solar cycle. As for the association of strong (M ≥ 7.0) earthquakes with the descending phase of solar activity in the 11-year solar cycle, Reference [24] (p. 18–19, Figures 10 and 11 and Table 1) systematized the results, showing that this effect was most pronounced for those earthquakes that occurred at the footprint of geomagnetic lines L = 2.0–2.2 in the Earth’s crust (Figure 1).
The region 2 ≤ L ≤ 3 is known as the electron slot. Let us remember that L is the geocentric distance in the Earth’s radii at which a dipole magnetic field line crosses the magnetic equatorial plane. As summarized in [25], the slot is a transition region between the outer and the inner radiation zones, often relatively devoid of energetic electrons. However, during strong geomagnetic storms, this gap can be filled to a large degree by moderate (and even high)-energy electrons. For example, in the intense “Halloween” storm of late October–early November 2003, the slot region was filled with multi-MeV electrons for several weeks. Thus, the slot region can present several space weather concerns, including low- and medium-energy electron enhancements, multi-MeV electrons, and intense solar energetic particle events [25].
In this regard, the result in Figure 1 gives us a hint that the mediator in the occurrence of shown earthquakes could be geomagnetic lines populated by charged particles and, therefore, highly conductive. Such an assumption is supported by the mathematical model in [6], in which the conductivity of the medium plays a vital role in the electromagnetic generation of earthquakes. Also, it is supported by the results of [26], where the seismic activity was analyzed after four geomagnetic storms accompanied by the precipitation of relativistic electrons from the outer radiation belt into the lower magnetosphere, where they formed additional radiation belts (storage rings) around particular geomagnetic lines. It was revealed, for example, that, after a giant “Halloween” storm (Dst = −383 nT), which was followed by filling a slot region with relativistic electrons for about 50 days [27] (their Figure 1), a strong M = 7.8 earthquake occurred at the Aleutian Islands on 17 November 2003, near a footprint L~2.1 with a time delay ~19 days. These results suggest that some earthquakes may be looked at as addressed (targeted), since they may occur near the footprint of particular (addressed) geomagnetic lines that were filled by charged particles and became conductive.
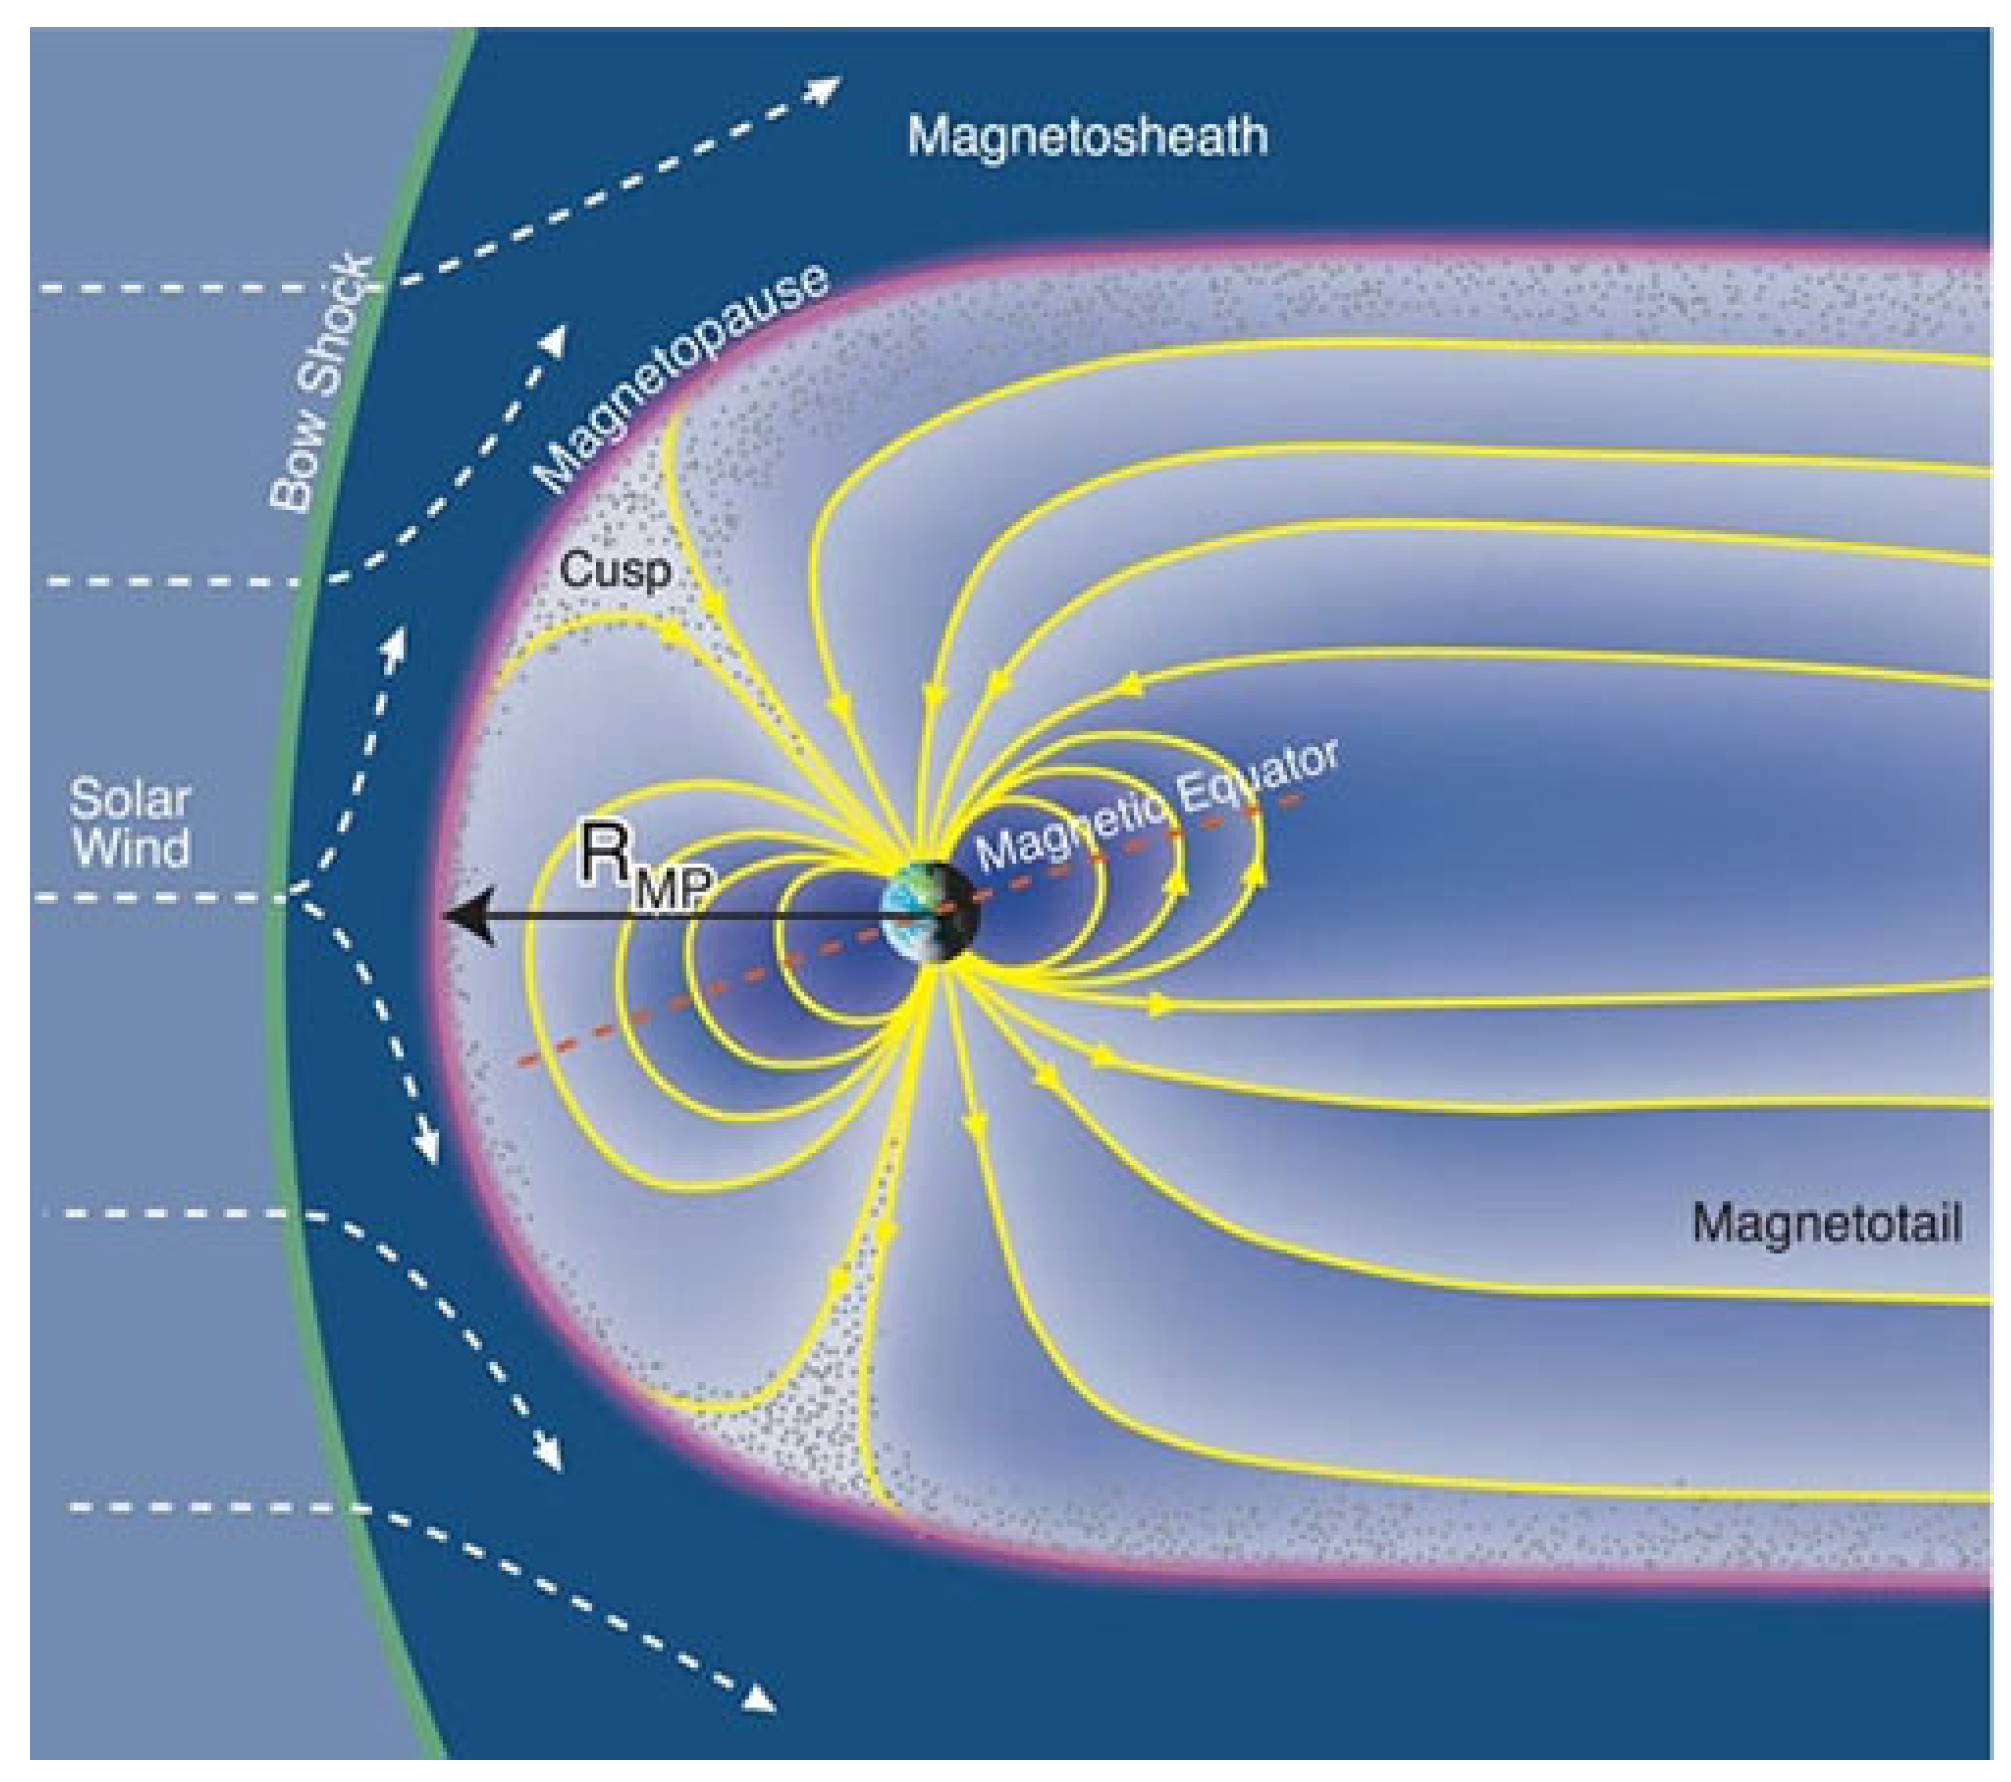
In the magnetosphere, there are two places where the solar wind-charged particles can fill the geomagnetic lines; these are the areas of the northern and southern polar cusps. In Figure 2, the Earth’s magnetosphere with two polar cusps is schematically presented. The boundary that separates the solar wind area, known as a magnetosheath, from the magnetosphere is called the magnetopause (outer boundary of the Earth’s magnetic field). Solar wind energy enters from the magnetosheath to the magnetosphere due to a process of magnetic reconnection [28]. When magnetic reconnection occurs at the magnetopause, the solar wind particles from the magnetosheath move continuously along the opened geomagnetic lines into the cusp and magnetotail [29]. The cusps (yellow dots in Figure 2), first observed by [30,31], are the magnetosphere regions filled with the denser plasma. The cusp is a funnel-shaped region in which, from a magnetic field point of view, the compressed high-latitude dayside geomagnetic field lines and the elongated nightside geomagnetic field lines converge toward the geomagnetic poles [32]. It was noted in [33] that the cusp is a versatile and very compact area for study, because all geomagnetic lines reaching the magnetopause converge into the cusp region. Consequently, all processes on the magnetopause, including magnetic reconnection, leave their signatures in the precipitating charged particle profile.
The Cluster mission, composed of four identical spacecraft flying around the Earth [34], has one of the primary science objectives—to investigate the penetration through the polar cusps of the shocked solar wind. The Cluster data revealed [35] that the polar cusps are very dynamic regions. Their locations are ruled by the orientation of the interplanetary magnetic field, the dynamic pressure of the solar wind at the magnetopause, and the length of the reconnection line (X-line) at the magnetopause.
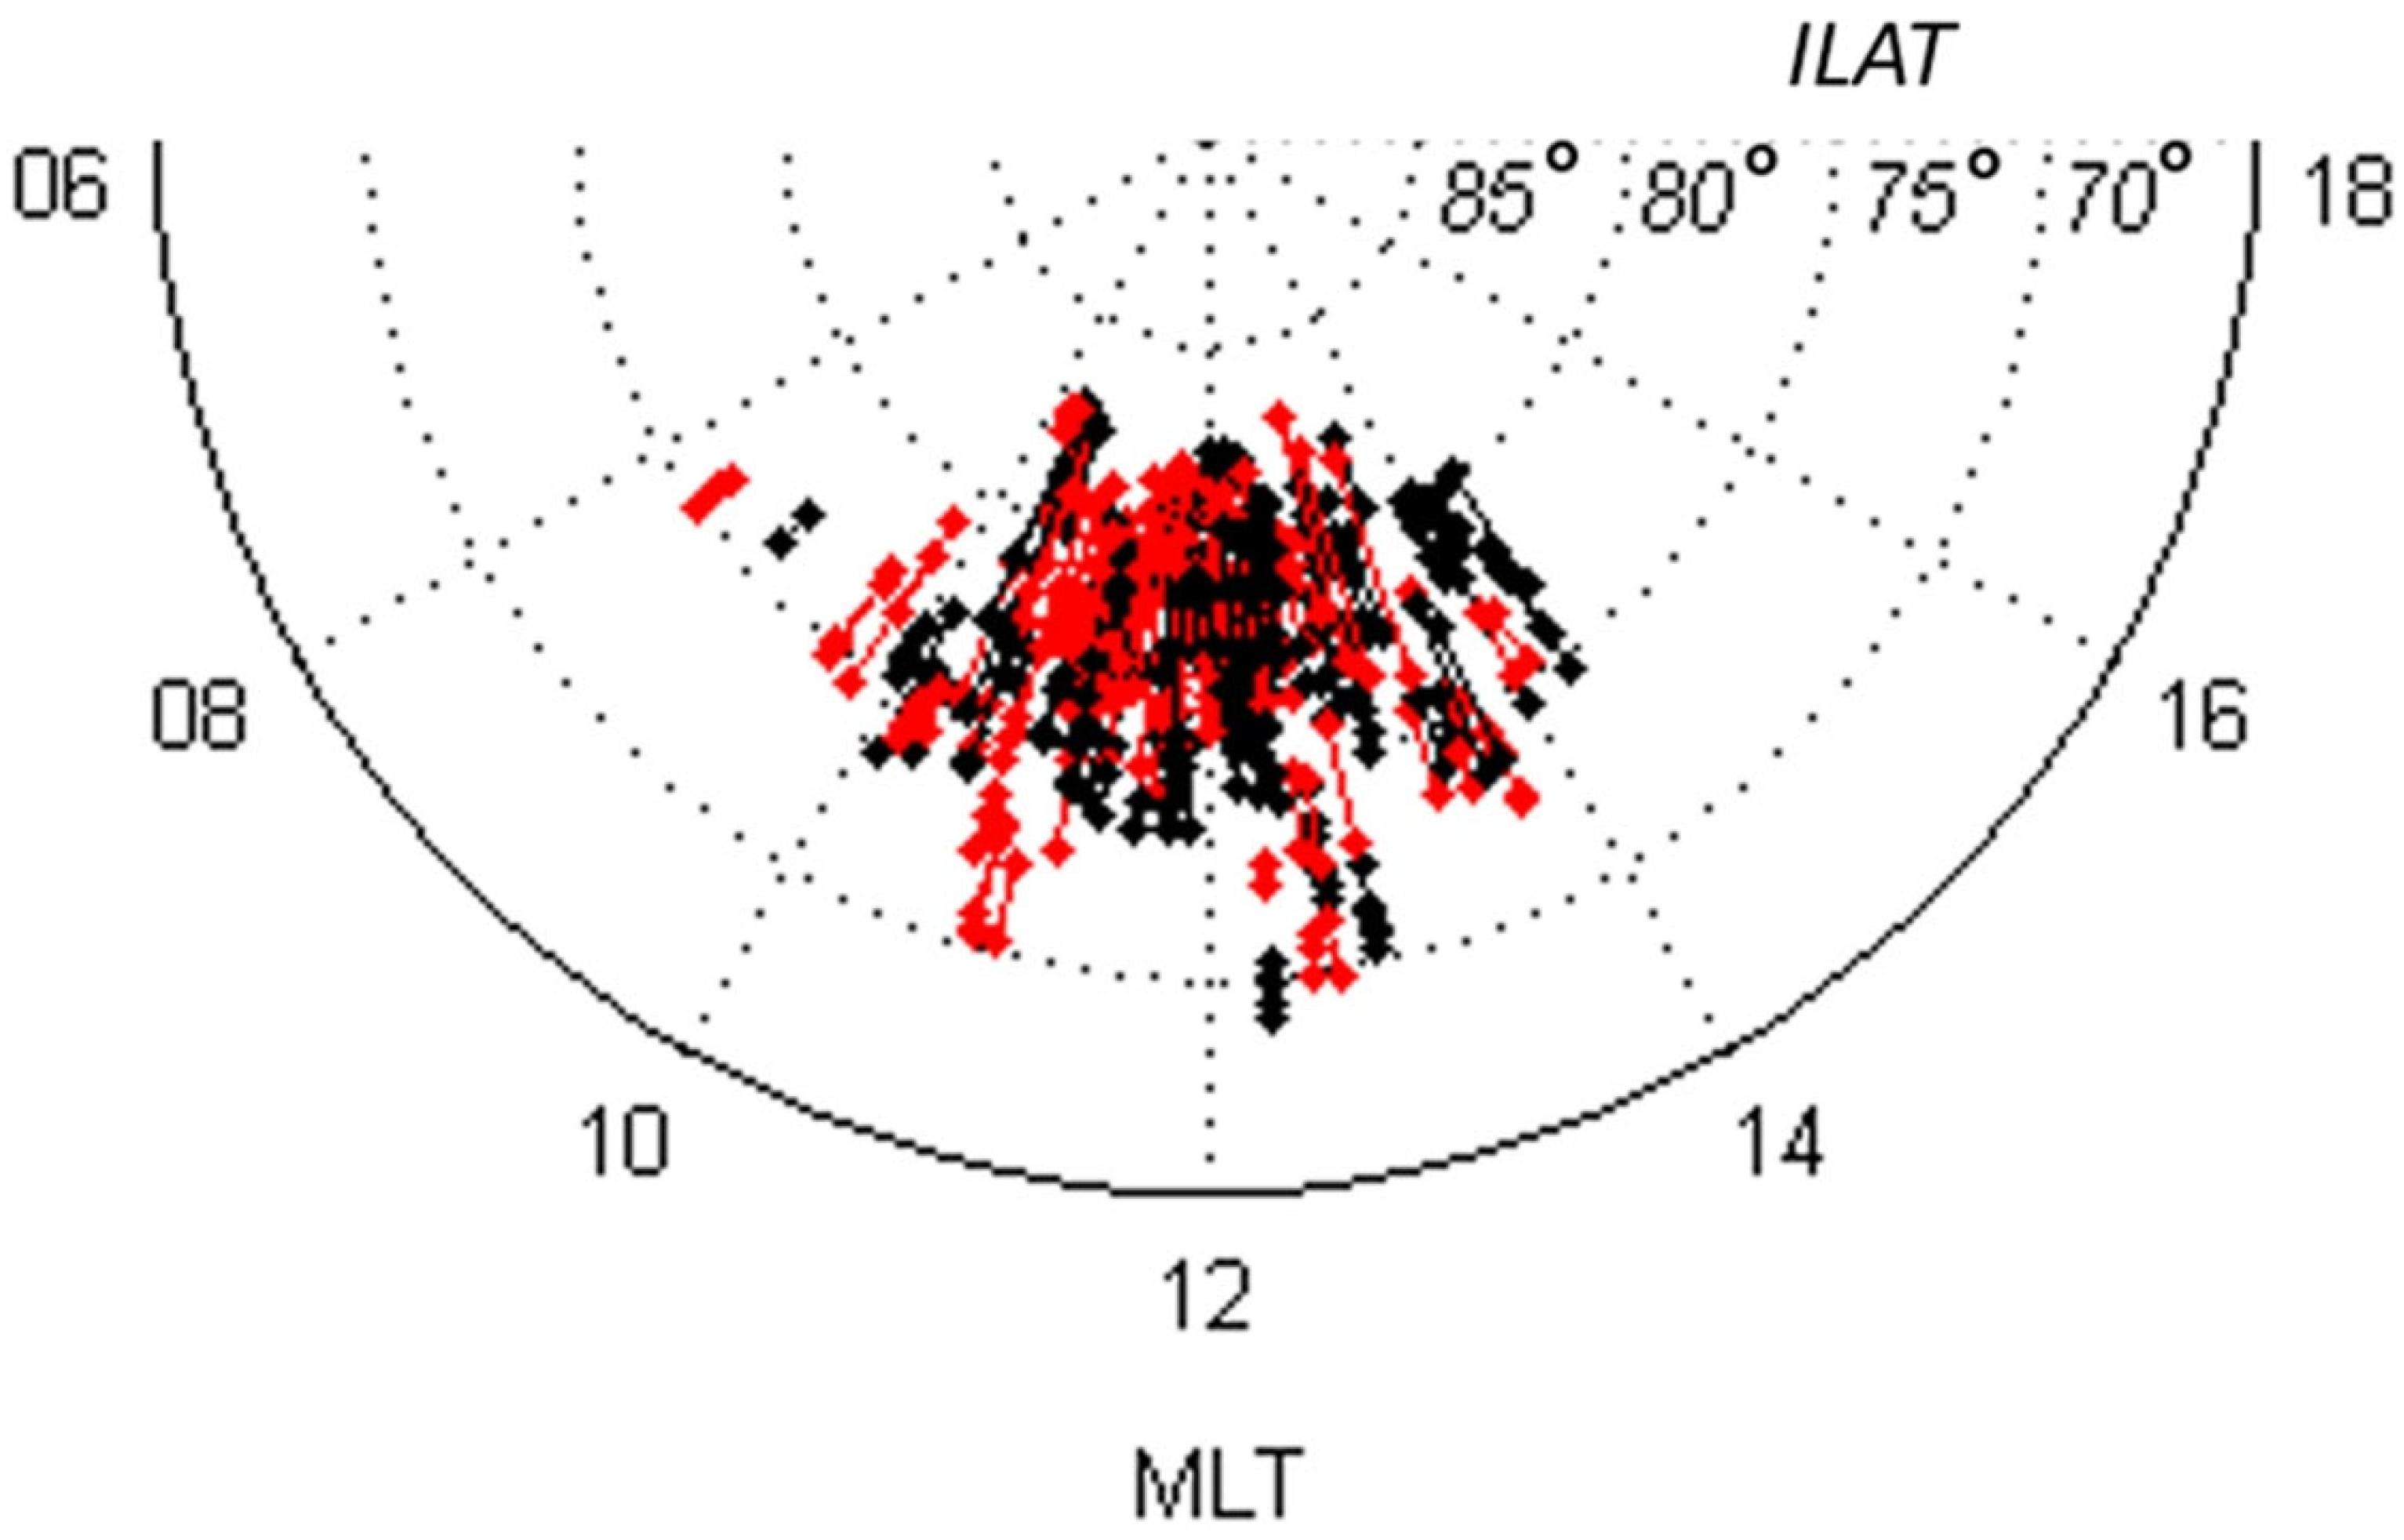
Figure 3, reprinted from [35], shows that, most of the time, the cusp is located at invariant magnetic latitudes 75°–80° and in a longitudinal region of 10 h–14 h magnetic local time (MLT). However, sometimes, its longitudinal extension may be more comprehensive, depending, for example, on the reconnection X-line length [36]. Also, it was noticed in [32] that the Cluster satellites, which data are presented in Figure 3, due to the geometry of their orbits, do not allow to determine the entire longitudinal extent of the cusp correctly, and to do so, the spacecrafts should have been placed in more or less parallel orbits, so that they fly at the same latitude, though at different longitudes or local times, which could be realized in subsequent magnetosphere missions. As shown in [37], using data from the satellite Polar, the polar cusp may be between 08 h and 16 h MLT.
After extreme solar events penetrated the polar cusp, solar wind plasma became denser. Therefore, the geomagnetic field lines under the cusps became more conductive during these times. Suppose a high conductivity along geomagnetic lines helps generate earthquakes in their footprints in the crust. In that case, one may suggest that seismic activity could be increased in those longitudinal regions in which their high latitudinal areas were located under the polar cusp when the shocked solar wind arrived and the geomagnetic storms started. In the present paper, we are checking up on this suggestion.
According to [38], adequate solar wind magnetosphere coupling time should constantly change with time and season due to Earth’s rotation and its motion along the orbit (Russell–McPherron mechanism). Therefore, to obtain a more reliable result, it was advisable to analyze the response of seismic activity to geomagnetic storms with reasonably similar characteristics. For this purpose, we chose two geomagnetic storms that occurred on the same day, 17 March 2013 and 2015 (St. Patrick’s Day geomagnetic storms). These magnetic storm onset times were also relatively identical: 06:04 UTC for the storm on 17 March 2013 and 04:48 UTC on 17 March 2015. This means that, at the time of the shocked solar wind’s arrival at the magnetopause, under the cusp were located the high-latitudinal areas, which were almost the same longitudinal region (there was no difference in tectonics).
These two geomagnetic storms have been analyzed in many papers [39,40,41,42] (and references herein) and discussed at many conference sessions. In a unique collection of Journal Geophysical Research (June 2017, Issue 6), there are more than 30 papers by researchers worldwide investigating the storm–time geospace behavior during the St. Patrick’s Day geomagnetic storms of 2013 and 2015. Since these events, especially the storm of 2015, were the strongest in the 24th solar cycle, they are considered a good event for checking the current theories and concepts [39].
According to the data of the Large Angle and Spectrometric Coronagraph Experiment (LASCO) on the board of the Solar and Heliospheric Observatory (SOHO), the geomagnetic storms on 17 March 2013 and 17 March 2015 originated from coronal mass ejections (CMEs) associated, respectively, with solar flare type C1.6 on 15 March 2013 at 07:12 UT and solar flare type C9 on 15 March 2015 at 02:36 UT (web page: https://izw1.caltech.edu/ACE/ASC/DATA/level3/icmetable2.htm, accessed on 1 April 2024). Both CMEs were followed by the magnetic cloud [40,41]. It was shown in [42] that the St. Patrick’s Day geomagnetic storms in 2013 and 2015 occurred at rather close solar flux levels (F10.7 = 118, F10.7 = 126, respectively) and were responsible for somewhat similar peak values of the auroral electrojet index (AE) equal to 2700 nT and 2200 nT, respectively. According to the database OMNI, the geomagnetic storm on 17 March 2013 started from a sudden storm commencement (SSC) at 06:04 UT with a positive SYM/H index = +33 nT, the most significant negative SYM/H index = −132 nT occurred on 17 March 2013 at 20:28 UT, and the duration of the main storm phase was equal to ~14 h. The storm on 17 March 2015 started from SSC at 04:48 UT with a positive SYM/H index = 67 nT, the most significant negative SYM/H index = −234 nT occurred at 22:47 UT on 17 March 2015, and the main storm phase lasted ~18 h.
Figure 4 presents the 1-min data of the SYM/H index from March 14 to March 26 in 2013 (black) and 2015 (red) from the OMNI database. It is seen that the storm of March 2015 was more substantial in comparison with the storm of 2013, which resulted evidently from different types of solar flares that generated these storms (C1.6 and C9, respectively). It is seen in Figure 4 that the shape and the duration of the main storm phase and the recovery phase were somewhat similar.
Observed similarities in the background conditions during the geomagnetic storms on the 17 March 2013 and 17 March 2015 occurrences, as well as a similarity in parameters of both storms (Figure 4), allows one to consider them as appropriate events to test an idea: “Is there a similar pattern in a response of global seismic activity to similar geomagnetic storms?” The results are presented below.

2. Materials and Methods

This study investigates earthquakes using data from the global seismological catalog of the United States Geological Survey (USGS): https://earthquake.usgs.gov/earthquakes/, accessed on 1 April 2024. The USGS currently reports earthquake magnitudes using the moment magnitude scale. Earthquakes with magnitudes 3.0–3.9 are classified as minor, 4.0–4.9—light, 5.0–5.9—moderate, 6.0–6.9—strong, 7.0–7.9—major, and those with magnitudes 8.0 or larger—great: https://www.earthquakeauthority.com/blog/2020/earthquake-measurements-magnitude-vs-intensity, accessed on 1 April 2024. This work deals with earthquakes beginning from a magnitude of 4.5, representing a modern USGS catalog, as shown in the Gutenberg–Richter analyses. The solar wind parameters are taken from NASA’s web page: http://cdaweb.gsfc.nasa.gov, accessed on 1 April 2024 (OMNI database) and obtained from current and past space missions and projects. Data on geomagnetic storms included in the OMNI database were taken from the World Data Center for Geomagnetism, Kyoto: https://wdc.kugi.kyoto-u.ac.jp/, accessed on 1 April 2024. We use the 1-h Dst (disturbance storm time) index before 1981 and the 1-min SYM-H index after 1981, since the last one was absent before 1981; the geomagnetic index SYM-H is, in fact, a high-resolution Dst index [43]. According to [44], geomagnetic storms may be classified as weak (Dst from −30nT to −50 nT), moderate (Dst from −50nT to −100 nT), strong (Dst from −100nT to −200 nT), powerful (Dst from −200nT to −350 nT), and extreme (Dst below −350 nT). Data on sudden storm commencement (SSC) are taken from thFTP link: ftp://ftp.ngdc.noaa.gov/STP/SOLAR_DATA/sudden_commencements/storm2.SSC, accessed on 1 April 2024, which the Observatorio del Ebro, Roquetes, Spain, obtained. Considering the results [16,26], which show that earthquake occurrence may be delayed according to the magnetic storm onset for some first months, we calculated and compared variations of the daily amount of the released at the globe seismic energy for three months, 17 March–17 June, in 2013 and 2015. For each earthquake with M ≥ 4.5, a released seismic energy was estimated using the Gutenberg and Richter relation [45] Es = 10 (11.8 + 1.5M), with the Es value in Ergs. Then, the sum of Es in each day was estimated. Since the primary input for seismic energy is the major and great earthquakes, we determined an earthquake that mainly input to the peaks in the daily released seismic energy around the globe. If we know the coordinates of an epicenter, we may estimate the magnetic local time (MLT) in this epicenter at the time of geomagnetic storm onset. To do this, we used the online program on the website: https://omniweb.gsfc.nasa.gov/vitmo/cgm.html, accessed on 1 April 2024. The magnetic local time MLT is often used, instead of longitude, to organize data and models concerning the position of the Sun, because the longitude, which rotates with the Earth, is not a helpful parameter for this [46]. The MLT value is 0 (midnight) in the anti-Sunward direction, noon in the Sunward direction, and 6 (dawn) and 18 (dusk) perpendicular to the Sunward/anti-Sunward line. Also, we use in works the coordinates of geomagnetic poles, the antipodal points where the axis of a best-fitting dipole intersects the Earth’s surface; the magnetic dipoles are points on the Earth’s surface in the Northern and Southern Hemispheres where the magnetic inclination of the Earth’s magnetic field is 90 degrees, and the corrected geomagnetic poles, which are not a physical location but provide a reference frame that aligns with the Earth’s magnetic field lines, is essential for modeling the dynamics of near-Earth plasma and electromagnetic field disturbances [46].

3. Results

3.1. A Pattern of Seismic Activity at the Globe after the Magnetic Storms on 17 March 2013 and 2015

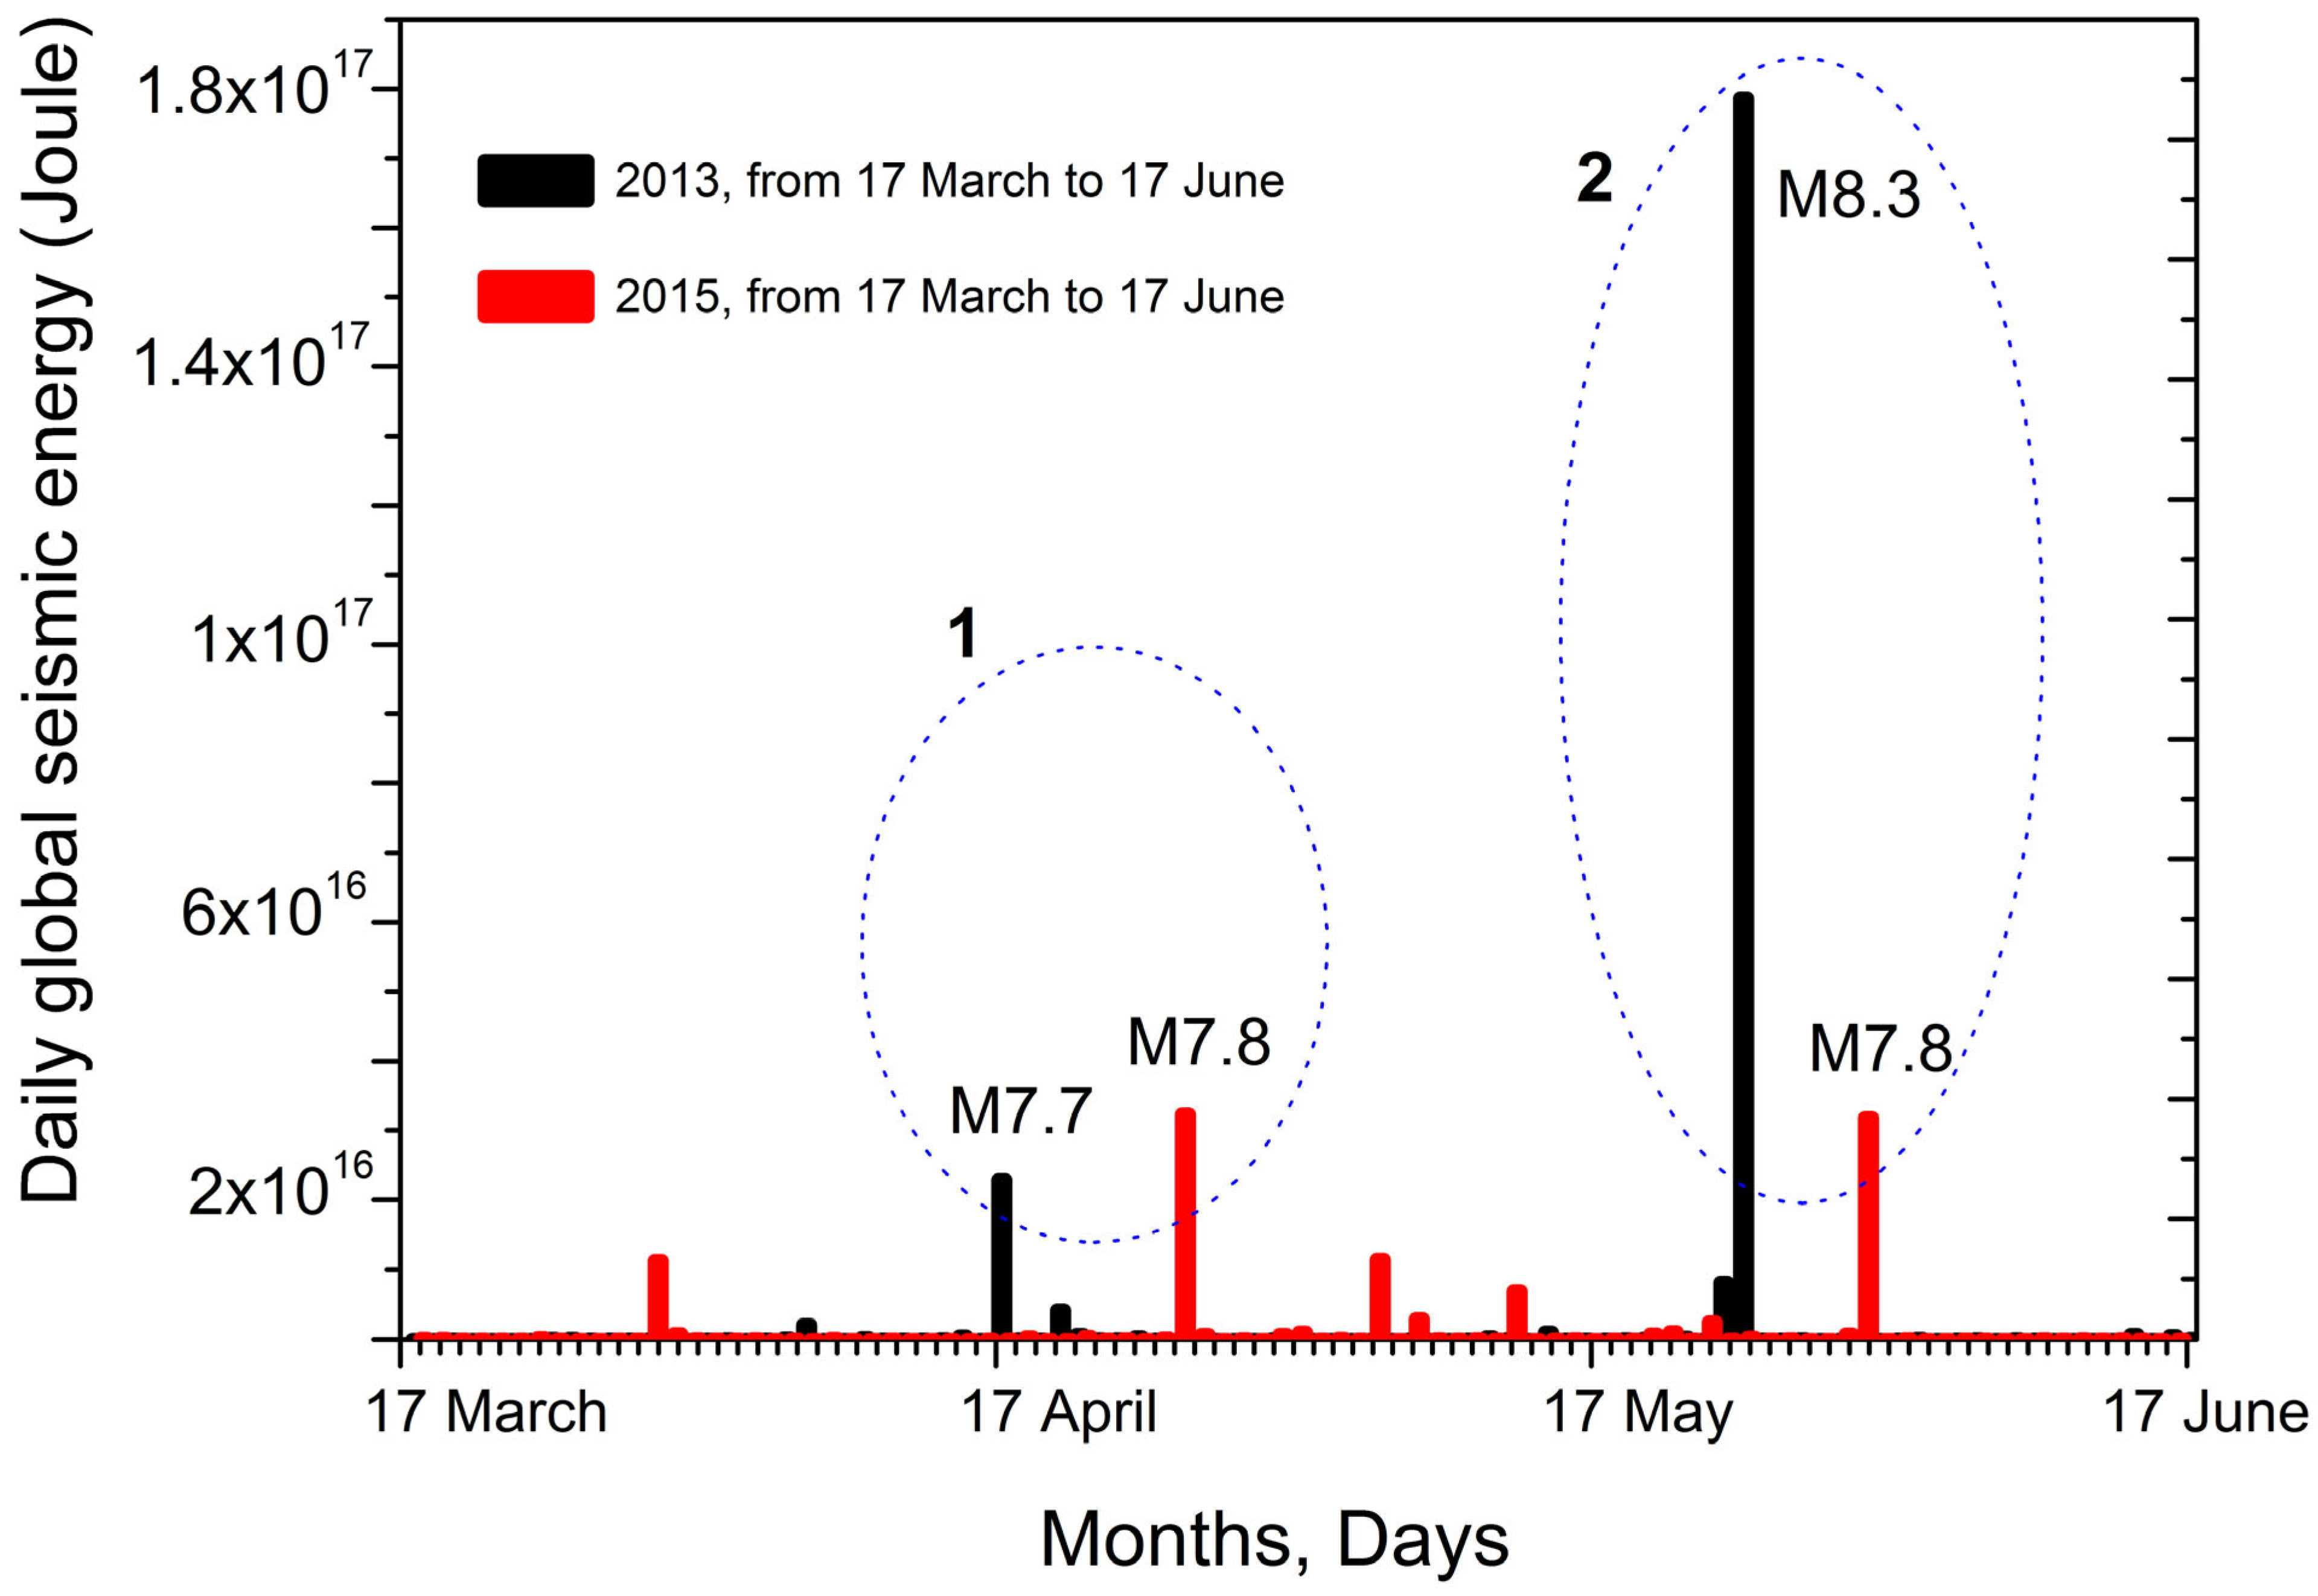
Figure 5 shows the histogram of released seismic energy globally per day (Es, in Joules) from March 17 to June 17 in 2013 and 2015 (black and red columns, respectively). The considered time intervals are restricted by June, because the next strong geomagnetic storm occurred in June 2013 (Dst = −137) and June 2015 (Dst= −208).
In Figure 5, the dashed circles (1 and 2) mark the most significant peaks in the globally released seismic energy after 17 March 2013, and 17 March 2015. For both years, the first peak occurred in April and the second in May. Table 1 presents earthquake data, which are mainly responsible for forming the Es peaks marked as 1 and 2.
For the Es peak in April 2013, the M = 7.7 earthquake was mainly responsible on 16 April 2013. According to [47], it occurred on the Arabian lithosphere plate at a depth of ~80 km in Southeastern Iran. Here, regional tectonics are responsible for the collisions of the Arabian and Indian lithosphere plates with the Eurasia plate. The Arabian lithosphere plate is subducted beneath the Eurasia lithosphere plate at the Makran Coast of Pakistan and Iran [47]. For this event, the delay time between the day of magnetic storm onset (17 March 2013) and earthquake occurrence (16 April 2013) equaled 30 days.
For the Es peak in April 2015, the M = 7.8 earthquake, which occurred on 25 April 2015 in Nepal, was mainly responsible. According to [47], this earthquake occurred due to thrust faulting on or near the main thrust interface between the subducting India plate and the overriding Eurasia plate to the north. For this event, the delay time between the day of magnetic storm onset (17 March 2015) and the day of earthquake occurrence (25 April 2015) equaled 39 days.
For the Es peak in May 2013, the deep-focus M = 8.3 earthquake was mainly responsible, which occurred on 24 May 2013 in Russia at a depth of ~600 km beneath the Okhotsk Sea. According to [47], the Pacific and North American plates converge at the location of this earthquake, resulting in the subduction of the Pacific plate beneath Eurasia at the Kuril-Kamchatka Trench. The delay time between the day of magnetic storm onset (17 March 2013) and earthquake occurrence (24 May 2013) equaled 68 days.
For the Es peak in May 2015, the deep-focus M = 7.8 earthquake was mainly responsible, which occurred on 30 May 2015 in Japan at a depth of 664 km beneath the Pacific Ocean. According to [47], this earthquake was located within the interior of the Pacific plate that subducts beneath Japan, starting at the Izu Trench, several hundred kilometers to the east of the event. The delay time between the day of magnetic storm onset (17 March 2015) and earthquake occurrence (30 May 2015) equaled 74 days.
Thus, the results in Figure 5 support our suggestion that similar geomagnetic storms could provoke similar patterns in global seismic activity.
To check on another suggestion, that, in the time of geomagnetic storm onset on 17 March of 2013 and 2015, the high-latitudinal areas of the longitudinal regions where the earthquakes occurred were located under the polar cusp, we calculated the magnetic local time in each of the four epicenters at the time of geomagnetic storm onset with the help of an online program: https://omniweb.gsfc.nasa.gov/vitmo/cgm.html, accessed on 1 April 2024.
The geomagnetic storm on 17 March 2013 started at 06:04 UT. At this time, at a point with coordinates 28.033°N, 61.996°E (M = 7.7 event in Iran on 16 April 2013), the magnetic local time was equal to MLT = 10.48 h. At a point with coordinates 54.892°N, 153.221°E (M = 8.3 event in Okhotsk Sea on 24 May 2013), the magnetic local time was equal to MLT = 15.66 h.
This means that the high-latitudinal areas of the longitudes at which a major crust earthquake in Iran and a deep-focused great earthquake in the Okhotsk Sea occurred, were located under the polar cusps, which longitudinal extension may be 08 h–16 h MLT [37].
The geomagnetic storm on 17 March 2015 started at 04:48 UT. At this time, at a point with coordinates 28.231°N, 84.731°E (M = 7.8 event in Nepal on 25 April 2015), the magnetic local time was equal to MLT = 10.54 h. At a point with coordinates 27.839°N, 140.493°E (M = 7.8 event in Japan on 30 May 2015), the magnetic local time was equal to MLT = 13.82 h. This means again that the high-latitudinal areas of the longitudes at which the major earthquakes in Nepal and Japan occurred were located under the polar cusps.
Thus, these results suggest that, after a magnetic storm, major and great earthquakes may occur in those longitudinal regions where high-latitudinal areas are located under the polar cusp at the time of the magnetic storm onset.

3.2. Cases Study for Ten Other Earthquakes with M ≥ 7.5, Which Occurred around the Globe in 2013 and 2015

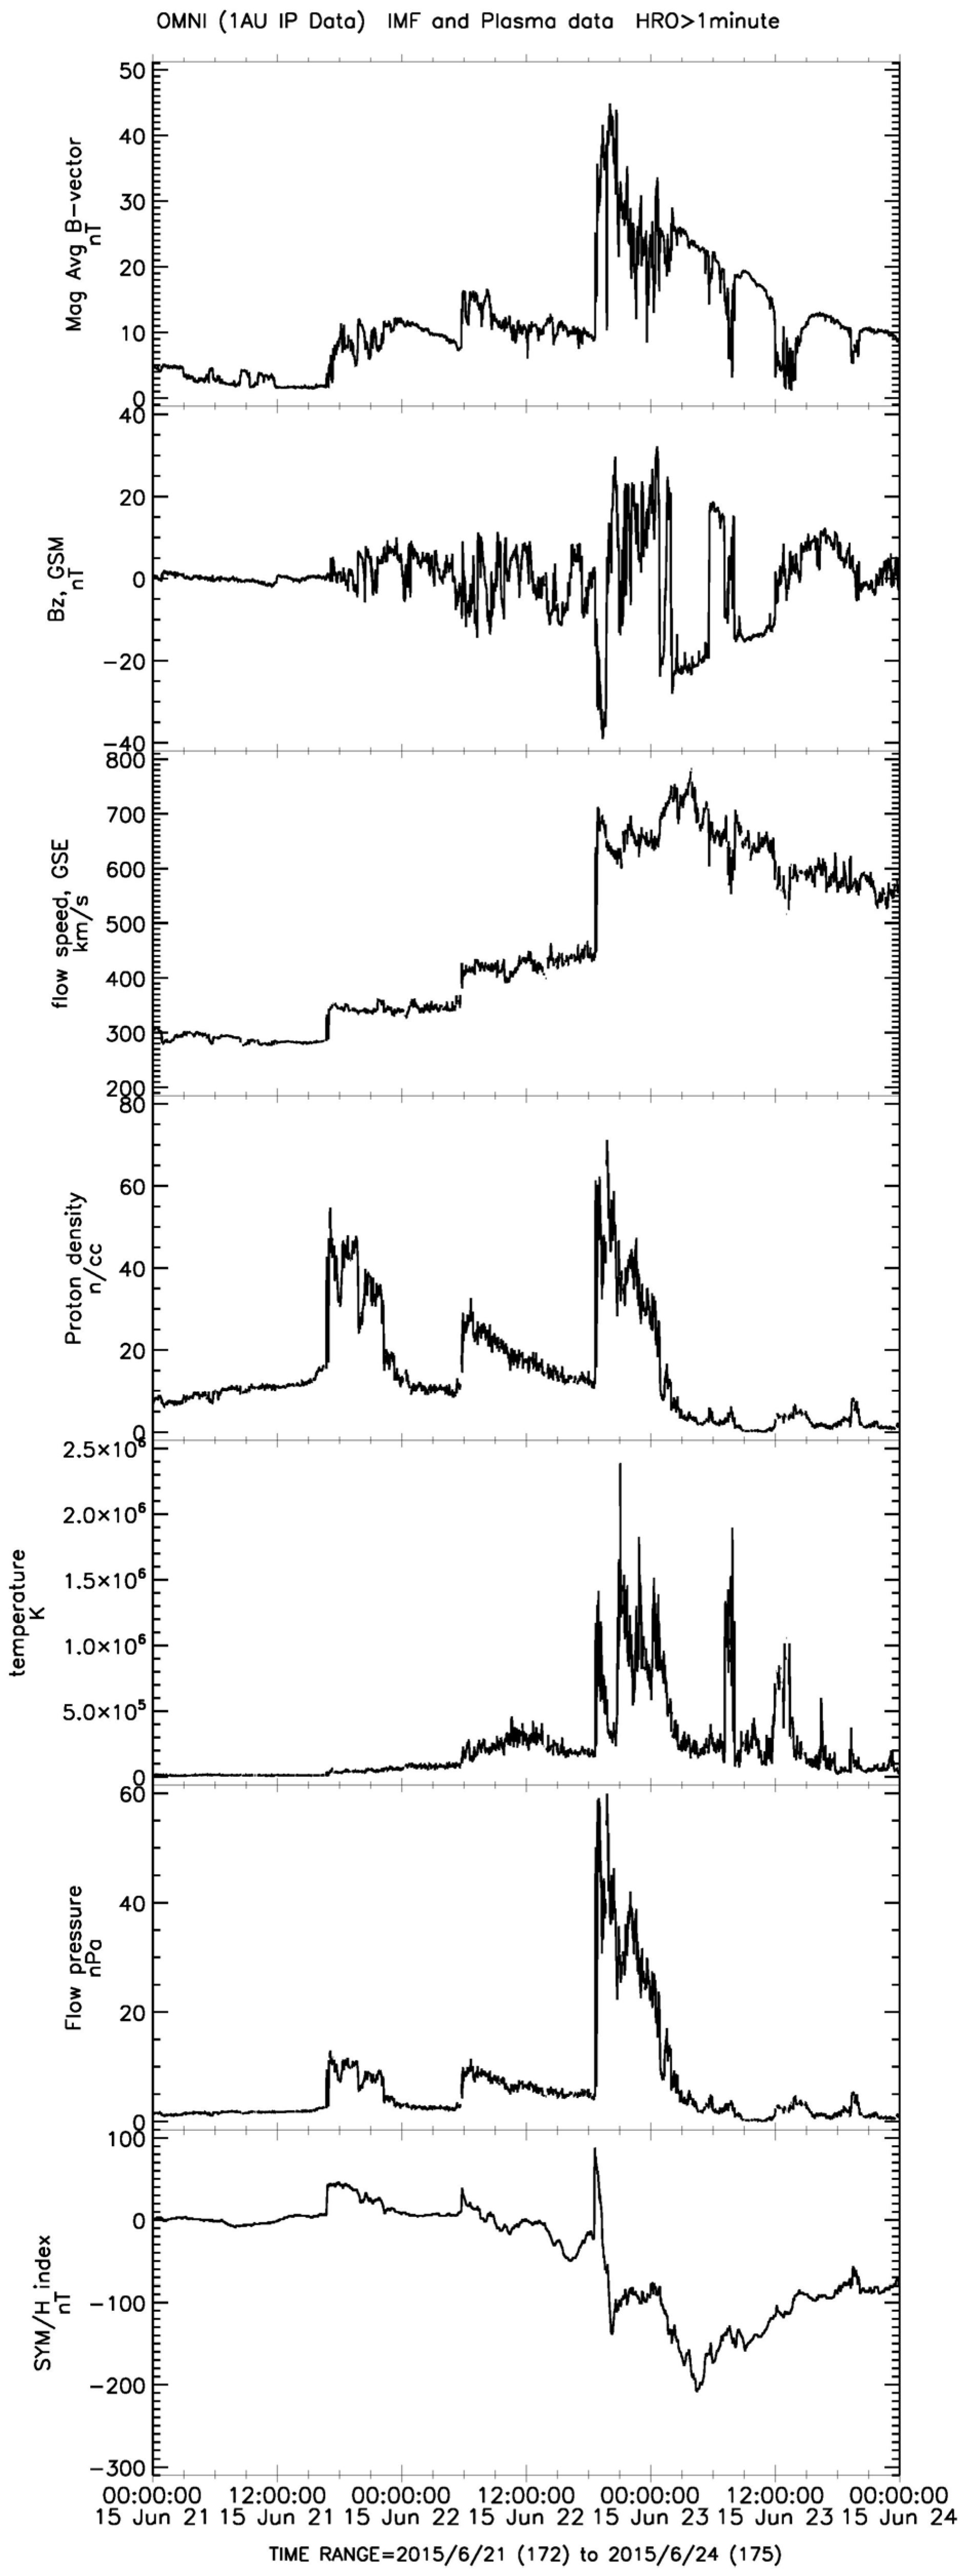
To check that the above results are not accidental, we conducted similar analyses for ten other seismic events with M ≥ 7.5, which occurred around the globe in 2013 and 2015. For example, on 21 June 2015, a powerful geomagnetic storm (SYM/H = −208 nT) started (Figure 6). At the main phase of this storm, on 22 June 2015 at 18:37 UTC, a jump-like solid growth in the solar wind and geomagnetic parameters occurred with a positive value of SYM/H = +88 nT. It is not difficult to estimate that, at this time (18:37 UTC), the American longitudinal region was located on the dayside. Compared to the above-considered cases, one may expect that, some weeks or months later, a strong earthquake may have occurred in this longitudinal region, and that was the case. On 16 September 2015, the great M = 8.3 earthquake occurred in Chile with coordinates at the epicenter of 31.573°S, 71.674°W. At the time of jump-like solid growth in the solar wind parameters on 22 June 2015 at 18:37 UT, the magnetic local time in the area of the M = 8.3 Chile earthquake epicenter was equal to MLT = 14.12 h. Thus, the high latitudinal area of the Chile longitudinal region was located under the polar cusp. A time delay between the shocked solar wind arrival on June 22, 2015 and the M = 8.3 earthquake in Chile on 16 September 2015 was equal to 86 days.
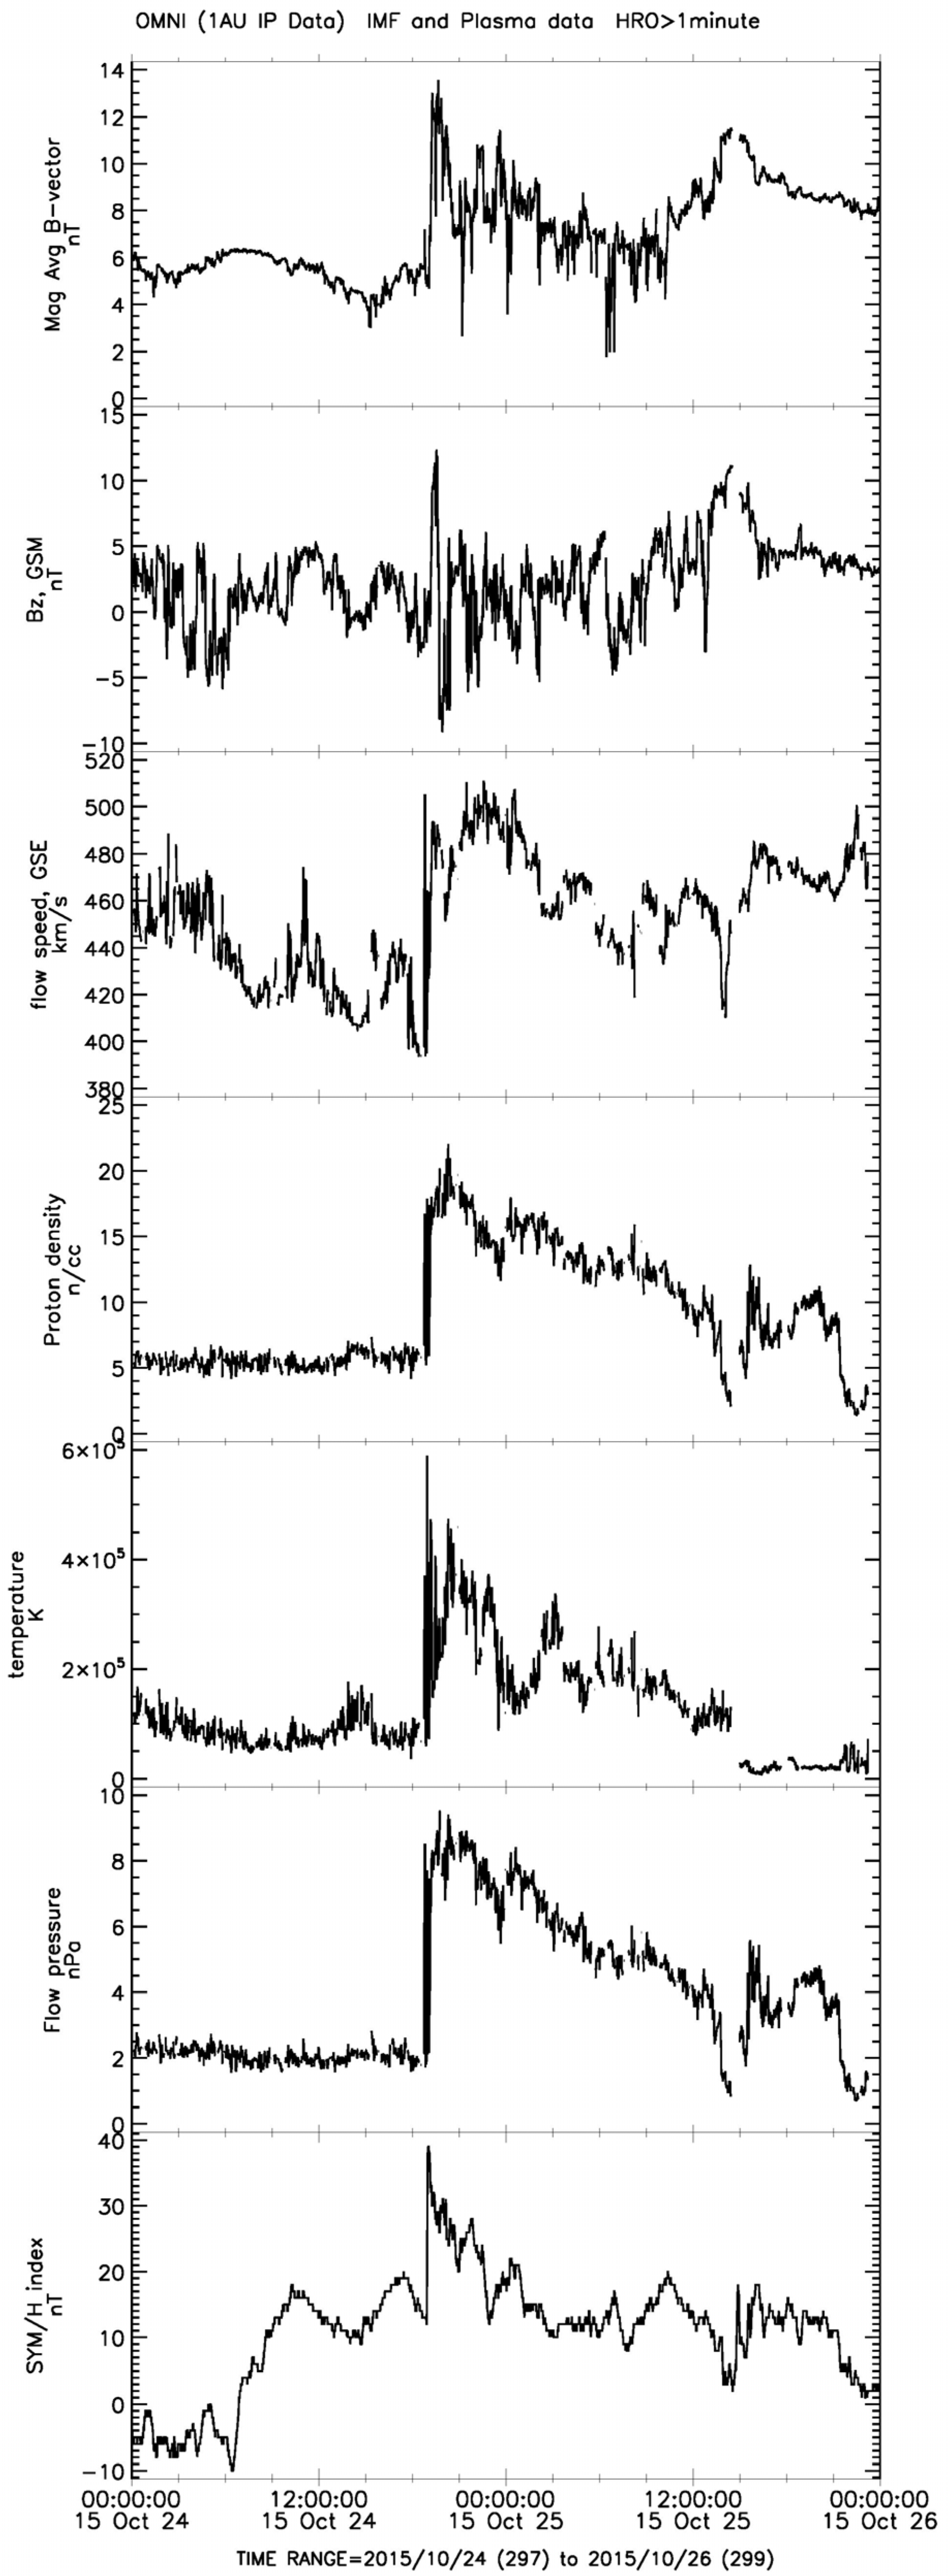
Another example is on 24 October 2015 at 19:00 UTC, as a jump-like growth in the solar wind and geomagnetic field parameters occurred when the SYM/H index reached up to +39 nT (Figure 7). Again, at this time (19:00 UTC), the American longitudinal region was located on the dayside. One month later, on 24 November 2015, a “doublet” of major (M = 7.6) deep-focused (h ≥ 600 km) earthquakes occurred in this longitudinal region in Peru with coordinates at the epicenter of 10.537°S, 70.944°W and 10.060°S, 71.018°W. At 19:00 UTC, the magnetic local time in the area of the two major earthquakes in Peru was equal to MLT = 14.5 h. The delay between the shocked solar wind arrival on October 24 and a “doublet” of significant earthquakes on November 24 was equal to ~31 days.
For the remaining five M ≥ 7.5 events in 2013 and 2015, we could also identify the preceded geomagnetic storms when, at the times of storm onset, the high-latitudinal areas of the longitudinal regions of the future epicenters were located under the polar cusp (Table 2).
Therefore, the M = 7.5 earthquake in Alaska on 5 January 2013 was preceded 66 days by a geomagnetic storm on 31 October 2012, the M = 8.0 earthquake in the Solomon Islands on 6 February 2013 was preceded 20 days by a geomagnetic storm on 17 January 2013, the M = 7.7 earthquake in Pakistan on 24 September 2013 was preceded 51 days by a geomagnetic storm on 4 August 2013, the M = 7.7 earthquake at Scotia Sea on 17 November 2013 was preceded 82 days by a geomagnetic storm on 27 August 2013, and the M = 7.5 earthquake in Afghanistan on 26 October 2015 was preceded 36 days by a geomagnetic storm on 20 September 2015.
Table 2 shows (column 5) that, as a rule, at the time of geomagnetic storm onset (time of sharp compression of the magnetosphere by the shocked solar wind), the high-latitudinal areas of longitudinal regions of the future epicenters were located under the polar cusp 08 h–16 h MLT. The most significant disagreement occurred regarding the M = 7.5 earthquake in Alaska on 5 January 2013 when the MLT = 7.15 h. At the same time, it was reported in [36] that the longitudinal cusp location may be more comprehensive due to, for example, the much-extended length of the reconnection X-line at the magnetopause.
It is seen in Table 2 that 14 earthquakes with a magnitude M ≥ 7.5 that occurred around the globe in 2013 and 2015 could have been provoked by only eight geomagnetic storms.

3.3. Longitudinal Regions of Strong Earthquake Occurrences and Geomagnetic Pole Locations

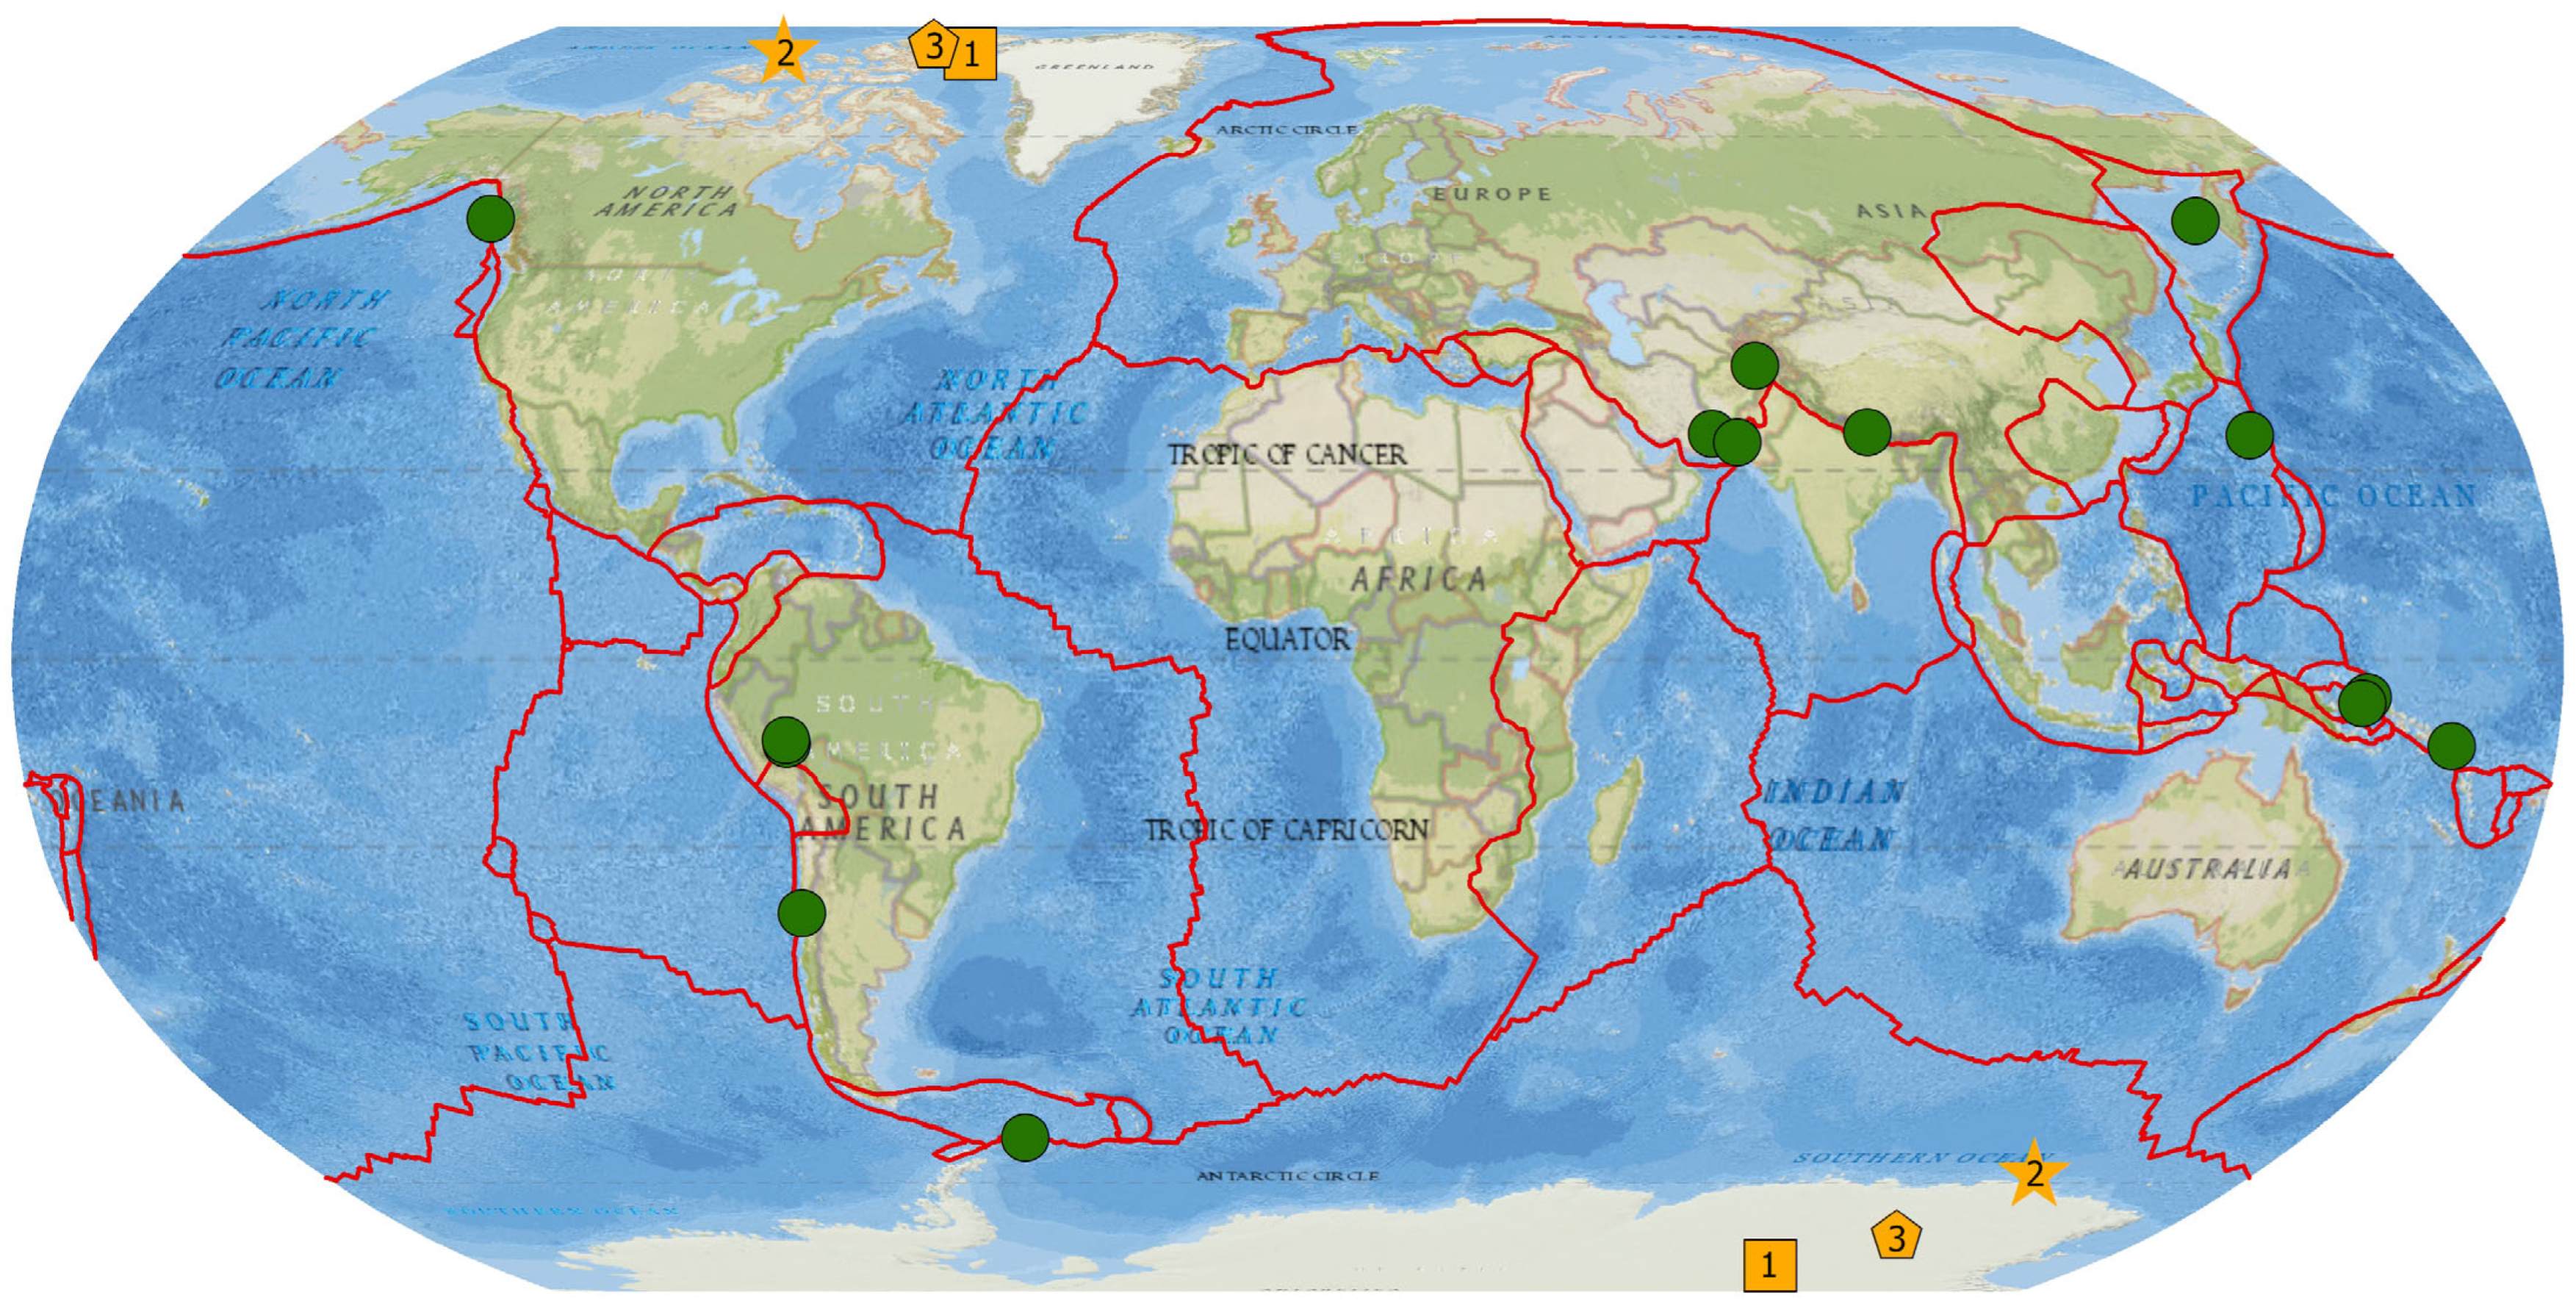
In Figure 8, we show the aspatial distributions of 14 epicenters of (M ≥ 7.5) earthquakes (from Table 2) that occurred around the globe in 2013 and 2015 (circles); color symbols with digits in the Northern and Southern Hemispheres show the locations of the magnetic poles for the epochs of 1975–2015 for three options: 1—geomagnetic poles, 79.5°N, 71.4°W and 79.5°S, 108.6°E; 2—magnetic dipoles 80.3°N, 114.9°W and 64.9°S, 138.4°E; 3—corrected geomagnetic poles 81.46°N, 82.33°W and 74.18°S, 126.19°E.
It can be seen from Figure 8 that the longitudinal regions where M ≥ 7.5 earthquakes occurred in 2013 and 2015 (America and East Asia) are closely confined to the longitudes of the locations of the magnetic poles. Earthquake epicenters on the American continent are centered around the longitudes of the locations of the magnetic poles in the Northern Hemisphere. In contrast, earthquake epicenters in East Asia are centered around longitudes of the locations of the magnetic poles in the Southern Hemisphere (color quadrants, circles, and triangles).
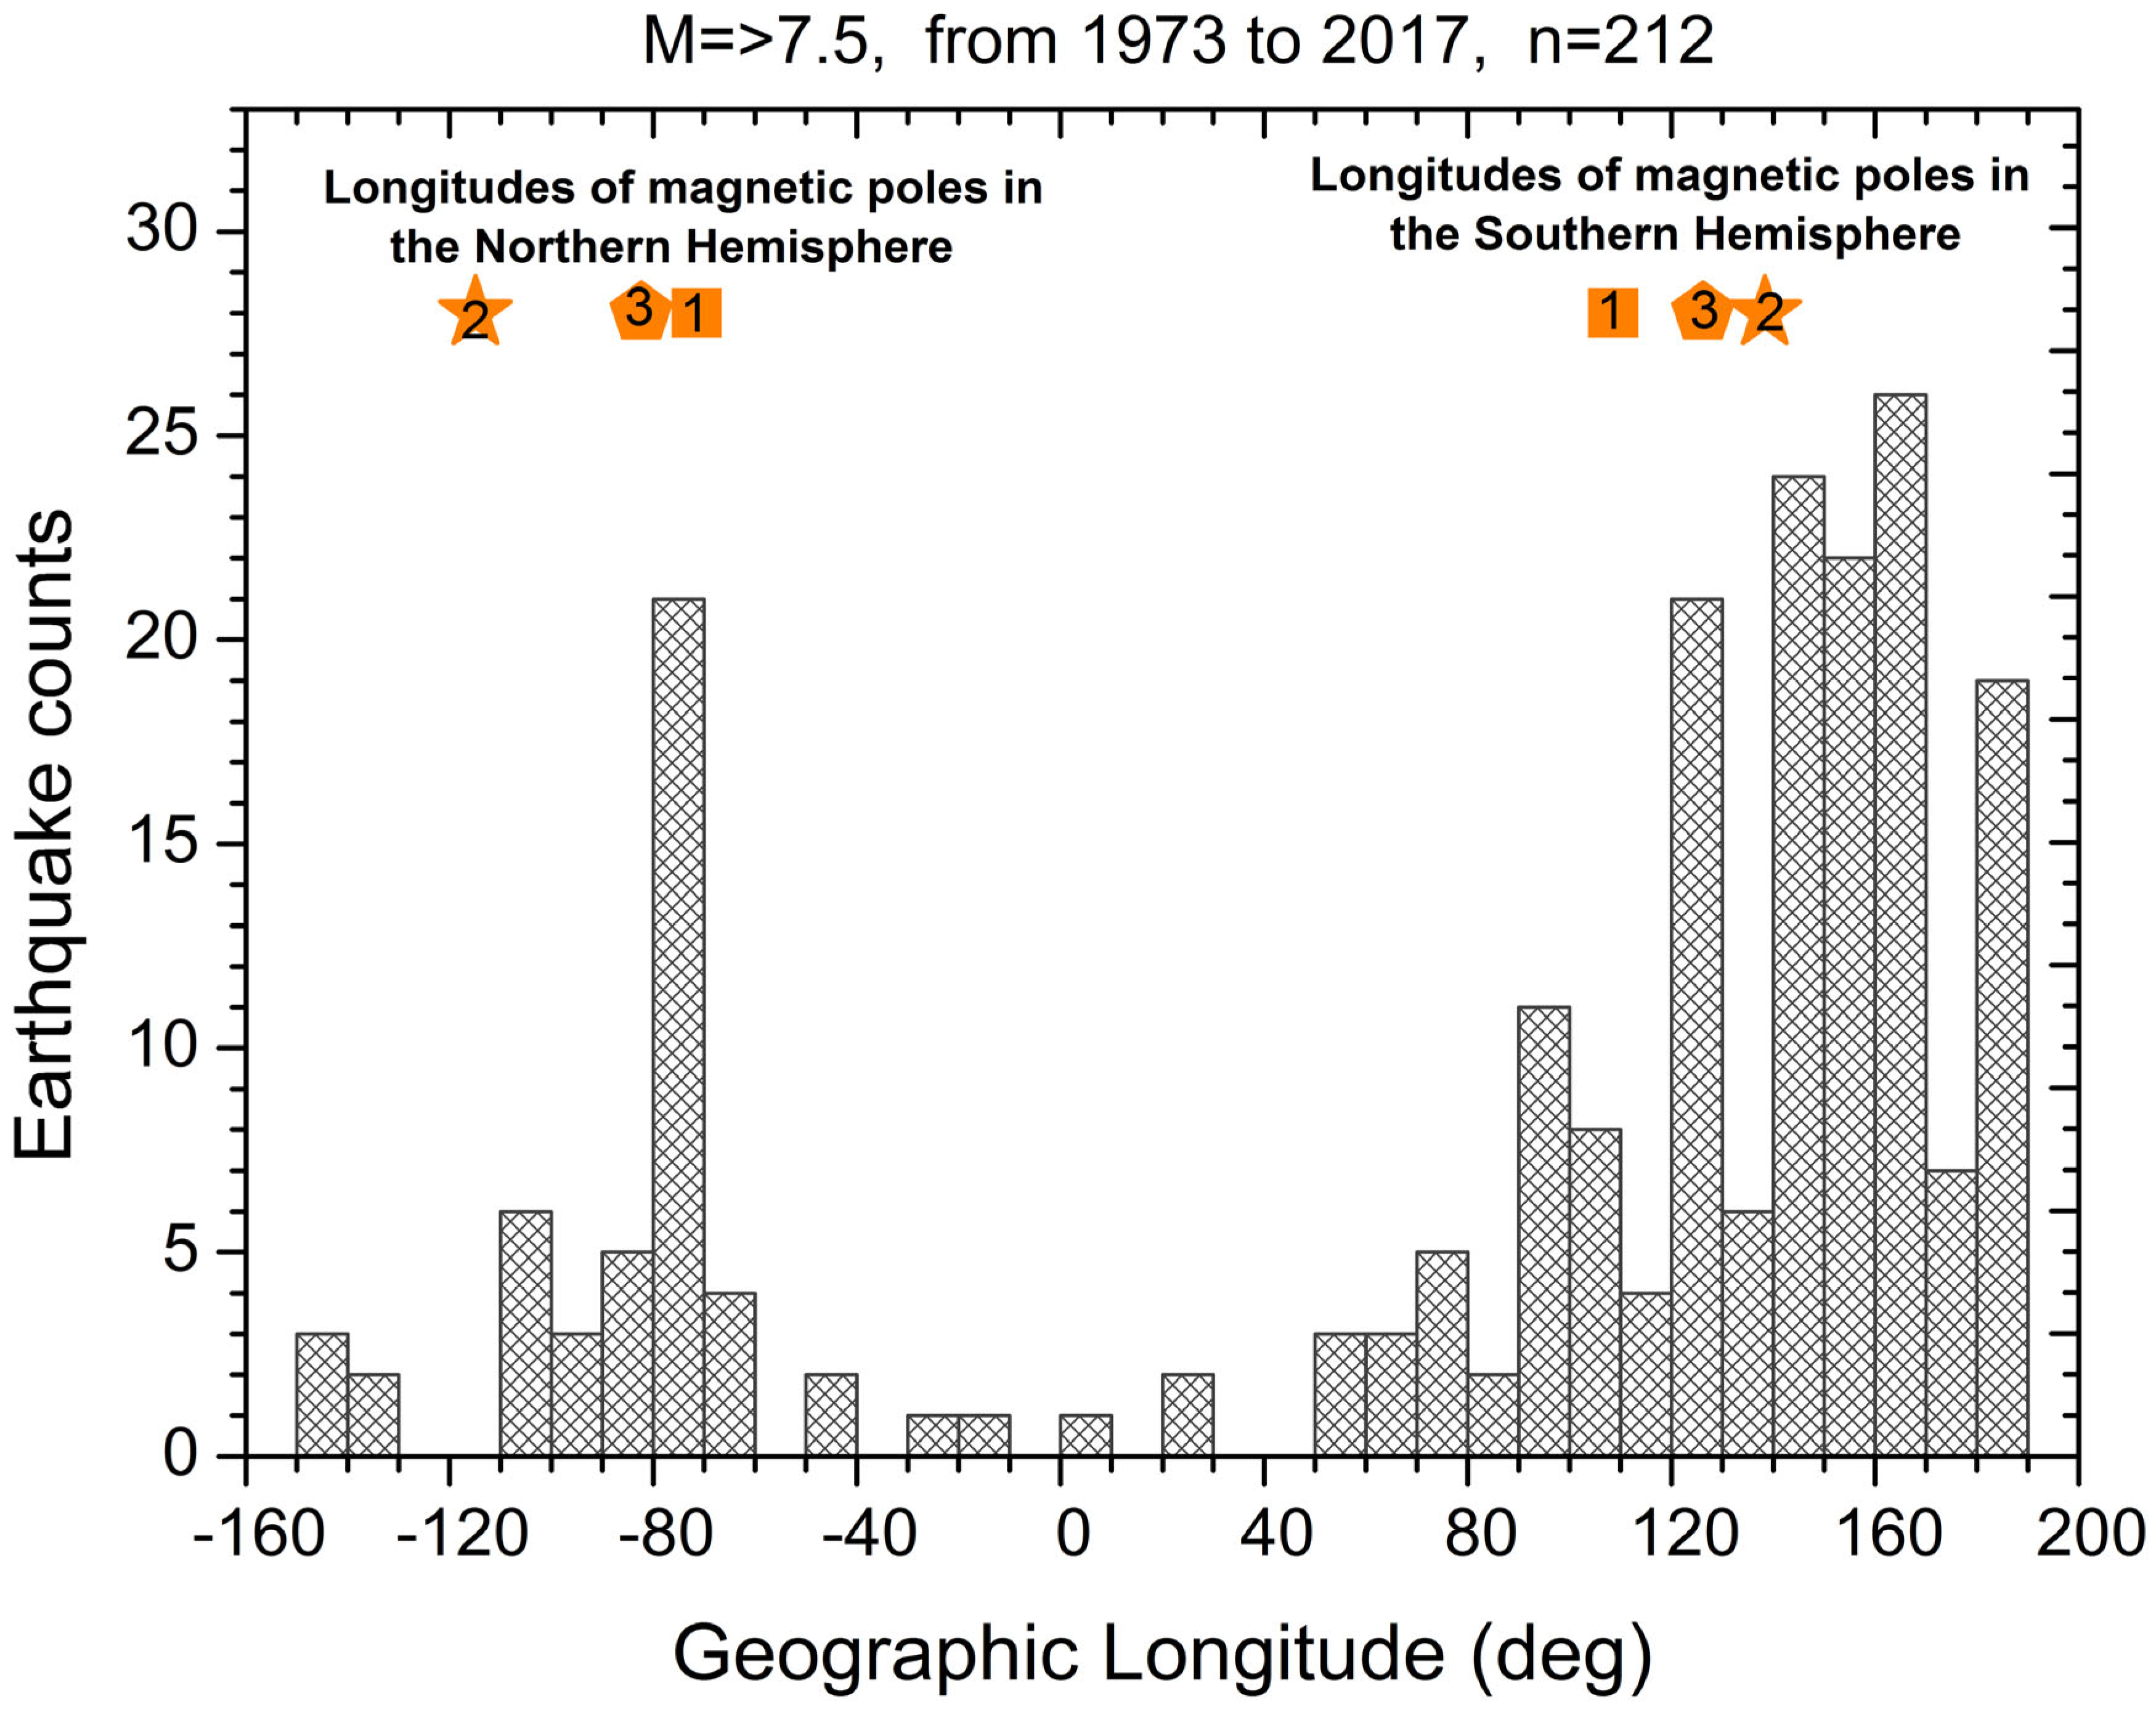
To confirm once more the reality that the longitudinal regions of the occurrence of strong earthquakes are confined to the longitudes of the magnetic pole locations, we present in Figure 9 the histogram of the distribution of the number of (M ≥ 7.5) earthquakes that occurred around the globe in 1973–2017 (212 events) dependent on the longitude. Here, blue quadrants, red circles, and purple triangles mark the longitudes of the magnetic poles’ locations in the Northern and Southern Hemispheres, respectively, as discussed above. It can be seen in Figure 9 that, around the globe, the longitudinal regions of the strongest earthquake occurrences are centered around the longitudes of the magnetic poles’ locations.

4. Discussion

It is suggested that the Sun may provoke earthquakes during substantial increases in solar wind activity. Statistical studies show that geomagnetic storms may precede strong earthquakes and that the time delay between a storm’s onset and an earthquake’s occurrence may vary from some days to some months. Since the efficiency of penetration of solar wind energy into near-Earth space changes with season and time (Russell–McPherron mechanism), it seemed appropriate to compare the response of the Earth’s seismic activity to somewhat similar geomagnetic storms. For this purpose, we chose the two strongest geomagnetic storms in the 24th solar cycle, which occurred on the same day on 17 March 2013 (SYM/H index = −132 nT) and 17 March 2015 (SYM/H index = −234 nT). The storms occurred at relatively close solar flux levels (F10.7 = 118, F10.7 = 126, respectively) and were responsible for somewhat similar peak values of the auroral electrojet index (AE) equal to 2700 nT and 2200 nT, respectively. The times of these magnetic storm onsets were also similar: 06:04 UTC for the storm on 17 March 2013 and 04:48 UTC for the storm on 17 March 2015. The shapes of the main and the recovery phases for these storms were identical (Figure 4). The variations of daily released seismic energy around the globe from 17 March to 17 June in 2013 and 2015 showed that two peaks in seismic energy took place for both years—one in April and another in May (Figure 5).
The major and great earthquakes mainly responsible for these peaks occurred in almost the same territories in 2013 and 2015. Namely, on 16 April 2013, the crust M = 7.7 earthquake occurred in Iran with a time delay of 30 days, and on 25 April 2015, the crust M = 7.8 earthquake occurred in Nepal with a time delay of 39 days. Then, on 24 May 2013, the deep-focus M = 8.3 earthquake occurred beneath the Okhotsk Sea (Russia) with a time delay of 68 days, and on 30 May 2015, the deep-focus M = 7.8 earthquake occurred beneath the Pacific Ocean (Japan) with a time delay of 74 days. It has been known for more than 30 years that the process of earthquake preparation modifies the state of the atmosphere and ionosphere, e.g., [48] (and references herein). The time delay between the appearance of an anomaly in the atmosphere–ionosphere parameters and earthquake occurrence may differ. For example, the multiparameter satellite data analysis revealed anomalous atmospheric and ionospheric effects over the earthquake preparation zone of the Nepal M7.8 earthquake 21 days before 25 April 2015, the main shock [49].
It was found in [26] that strong earthquakes may occur near the footprints of geomagnetic lines that were intensely populated with high-energy particles. In the areas of the polar cusps, where the solar wind plasma has direct access to the Earth’s environment, the geomagnetic lines can be filled by solar wind plasma, especially in the time of a shocked solar wind arrival. Since the longitudinal extension of the polar cusp is restricted by 08 h–16 h MLT [37], one may expect that shocked solar wind will provoke earthquakes mainly in those longitudinal regions in which high-latitudinal areas are located under the polar cusp at the time of a shocked solar wind arrival. Table 2 shows that this was right for all M ≥ 7.5 earthquakes that occurred in 2013 and 2015. It was shown in [16] that this was also right for all (nine) strong M ≥ 7.0 earthquakes that occurred in 1967–2023 inside and around the Anatolian plate, including the catastrophic M = 7.8 and M = 7.5 Kahramanmaras earthquake sequence in Turkey on 6 February 2023.
Since there is a delay between a shocked solar wind arrival and earthquake occurrence up to some months, this may suggest that solar wind energy does not trigger earthquakes immediately (when the media is ready for destruction, as it is believed at present). Instead, as suggested in [16], it may be put into the lithosphere dynamics, such as fluid upwelling, which are active participants in tectonic earthquakes [50]. The emanation of lithospheric gases before strong earthquakes has been well documented [48]. Moreover, such emanation may result in acoustic gravity wave (AGW) excitation [51], penetrating the ionosphere. Within the framework of such reasoning, first, the solar wind’s energy provokes a rise in lithospheric gases (fluids), and the emanation of these gases excites AGWs, which spread into the ionosphere and foreshadow an upcoming earthquake.
It is well known that the strongest earthquakes occur mainly in two longitudinal regions: on the American and Asian branches of the Pacific Ring of Fire. However, the literature does not discuss why these two branches of seismicity and, more broadly, why these two branches of the Pacific Ring of Fire are centered relative to the longitudes of the Earth’s magnetic poles. Of course, the question can be put the other way around: “How did it happen that the longitudes of the magnetic poles in the Northern and Southern Hemispheres are confined to the longitudes of the American and Asian branches of the Pacific Ring of Fire, which is formed by the subduction of various tectonic plates around the Pacific Ocean at convergent boundaries?” If this is not an accident, then this fact may indicate a close connection between the tectonic activity of the Earth and its magnetic field. Based on our research, we can assume that the influence of disturbed solar wind flows on lithospheric processes will be most effective when the longitudes of the magnetic poles are located under the polar cusp.

5. Conclusions

After a rather similar geomagnetic storm on St. Patrick’s Day (March 17) in 2013 and 2015, strong earthquakes (M ≥ 7.5) occurred in rather similar regions of the Earth, with rather similar delay times between geomagnetic storm onset and earthquake occurrence. During these magnetic storm onsets, the high-latitude areas of longitudinal regions where strong earthquakes occurred were located under the polar cusp, where the solar wind plasma directly accessed the Earth’s environment. The same situation occurred for the other ten earthquakes with M ≥ 7.5 around the globe in 2013 and 2015. The longitudinal regions of the considered earthquakes were centered according to the longitudes of the magnetic pole locations in the Northern and Southern Hemispheres. This suggests that the effectiveness of the shocked solar wind influence on lithosphere processes is extreme when the longitudes of the magnetic poles are located strictly under the polar cusp. An issue on how the shocked solar wind energy can reach the lithosphere and what it does there for some months before it is realized in an earthquake should become a key aspect of solving the problems of solar–terrestrial physics.

Author Contributions

D.O. and G.K. provided the concepts of the manuscript. G.K. organized and wrote the manuscript. All authors provided critical feedback and helped shape the research, analysis, and manuscript. All authors have read and agreed to the published version of the manuscript.

Funding

This research was partly funded by the Science Committee of the Ministry of Science and Higher Education of the Republic of Kazakhstan under grant #IRN-AP19677977.

Data Availability Statement

The original contributions presented in the study are included in the article; further inquiries can be directed to the corresponding author.

Acknowledgments

We thank the U.S. Geological Survey and European–Mediterranean Seismological Centre for providing earthquake information services and data. We acknowledge the use of NASA/GSFC’s Space Physics Data Facility’s CDA Web service and OMNI data. We are very grateful to the three anonymous reviewers and the editor for their in-depth analysis of the presented results, valuable comments, and recommendations, which made it possible to improve the original version of the article.

Conflicts of Interest

The authors declare that the research was conducted without any commercial or financial relationships that could be construed as potential conflicts of interest.

References

  1. Wolf, R. On the periodic return of the minimum of sunspots: The agreement between those periods and the variations of magnetic declination. Philos. Mag. 1853, 5, 67. [Google Scholar] [CrossRef]
  2. Parker, E.N. Extension of the solar corona into interplanetary space. J. Geophys. Res. 1959, 64, 1675–1681. [Google Scholar] [CrossRef]
  3. Anagnostopoulos, G.; Spyroglou, I.; Rigas, A.; Preka-Papadema, P.; Mavromichalaki, H.; Kiosses, I. The Sun as a Significant Agent Provoking Earthquakes. Eur. Phys. J. Spec. Top. 2021, 230, 287–333. [Google Scholar] [CrossRef]
  4. Simpson, J.F. Solar activity as a triggering mechanism for earthquakes. Earth Planet. Sci. Lett. 1967, 3, 417–425. [Google Scholar] [CrossRef]
  5. Sytinskij, A.D. Connection of the Earth Seismicity with Solar Activity and Atmospheric Processes; Gidrometeoizdat: Leningrad, Russia, 1987. [Google Scholar]
  6. Sorokin, V.; Yaschenko, A.; Mushkarev, G.; Novikov, V. Telluric Currents Generated by Solar Flare Radiation: Physical Model and Numerical Estimations. Atmosphere 2023, 14, 458. [Google Scholar] [CrossRef]
  7. Zeigarnik, V.A.; Bogomolov, L.M.; Novikov, V.A. Electromagnetic Earthquake Triggering: Field Observations, Laboratory Experiments, and Physical Mechanisms—A Review. Izv. Phys. Solid Earth 2022, 58, 30–58. [Google Scholar] [CrossRef]
  8. Zhang, G.Q. Relationship between global seismicity and solar activities. Acta Seismol. Sin. 1998, 11, 495–500. [Google Scholar] [CrossRef]
  9. Huzaimy, J.M.; Yumoto, K. Possible correlation between solar activity and global seismicity. In Proceedings of the 2011 IEEE International Conference on Space Science and Communication (IconSpace), Penang, Malaysia, 12–13 July 2011; pp. 138–141. [Google Scholar]
  10. Shestopalov, I.P.; Kharin, E.P. Secular variations of solar activity and seismicity of the Earth. Geophys. J. 2006, 28, 59–70. [Google Scholar]
  11. Georgieva, K.; Kirov, B.; Atanasov, D. On the relation between solar activity and seismicity on different time-scales. J. Atmos. Electr. 2002, 22, 291–300. [Google Scholar] [CrossRef]
  12. Tavares, M.; Azevedo, A. Influence of solar cycles on earthquakes. Nat. Sci. 2011, 3, 436–443. [Google Scholar] [CrossRef]
  13. Han, Y.B.; Guo, Z.J.; Wu, J.; Ma, L.H. Possible triggering of solar activity to big earthquakes (Ms ≥ 8) in faults with near west-east strike in China. Sci. China Ser. G Phys. Mech. Astron. 2004, 47, 173–181. [Google Scholar] [CrossRef]
  14. Novikov, V.; Ruzhin, Y.; Sorokin, V.; Yaschenko, A. Space weather and earthquakes: Possible triggering of seismic activity by strong solar flares. Ann. Geophys. 2020, 63, PA554. [Google Scholar] [CrossRef]
  15. Guglielmi, A.V.; Klain, B.I. On the influence of the Sun on the seismicity of the Earth. Sol. Terr. Phys. 2020, 6, 111–115. [Google Scholar]
  16. Ouzounov, D.; Khachikyan, G. On the Impact of Geospace Weather on the Occurrence of M7.8/M7.5 Earthquakes on 6 February 2023 (Turkey), Possibly Associated with the Geomagnetic Storm of 7 November 2022. Geosciences 2024, 14, 159. [Google Scholar] [CrossRef]
  17. Sobolev, G.A. The effect of strong magnetic storms on the occurrence of large earthquakes. Izv. Phys. Solid Earth 2021, 57, 20–36. [Google Scholar] [CrossRef]
  18. Sobolev, G.A.; Zakrzhevskaya, N.A.; Kharin, E.P. On the relation between seismicity and magnetic storms. Phys. Solid Earth 2001, 37, 917–927. [Google Scholar]
  19. Urata, N.; Duma, G.; Freund, F. Geomagnetic Kp Index and Earthquakes. Open J. Earthq. Res. 2018, 7, 39–52. [Google Scholar] [CrossRef]
  20. Chen, H.; Wang, R.; Miao, M.; Liu, X.; Ma, Y.; Hattori, K.; Han, P. A Statistical Study of the Correlation between Geomagnetic Storms and M ≥ 7.0 Global Earthquakes during 1957–2020. Entropy 2020, 22, 1270. [Google Scholar] [CrossRef] [PubMed]
  21. Marchetti, D.; De Santis, A.; Campuzano, S.A.; Zhu, K.; Soldani, M.; D’arcangelo, S.; Orlando, M.; Wang, T.; Cianchini, G.; Di Mauro, D.; et al. Worldwide Statistical Correlation of Eight Years of Swarm Satellite Data with M5.5+ Earthquakes: New Hints about the Preseismic Phenomena from Space. Remote Sens. 2022, 14, 2649. [Google Scholar] [CrossRef]
  22. Gonzalez, W.D.; Tsurutani, B.T.; Clua de Gonzalea, A.L. Interplanetary origin of geomagnetic storms. Space Sci. Rev. 1999, 88, 529–562. [Google Scholar] [CrossRef]
  23. Odintsov, S.; Boyarchuk, K.; Georgieva, K.; Kirov, B.; Atanasov, D. Long-period trends in global seismic and geomagnetic activity and their relation to solar activity. Phys. Chem. Earth 2006, 31, 88–93. [Google Scholar] [CrossRef]
  24. Khachikyan, G.Y.; Zhumabayev, B.T.; Streltsov, A.V. Modification of the Ionosphere by Precursors of Strong Earthquakes. Radio Sci. Bull. 2016, 357, 12–22. Available online: http://www.ursi.org/files/RSBissues/RSB_357_2016_06.pdf (accessed on 1 April 2024).
  25. Baker, D.N.; Erickson, P.J.; Fennell, J.F.; Foster, J.C.; Jaynes, A.N.; Verronen, P.T. SpaceWeather Effects in the Earth’s Radiation Belts. Space Sci. Rev. 2018, 214, 17. [Google Scholar] [CrossRef]
  26. Ouzounov, D.; Khachikyan, G. Studying the Impact of the Geospace Environment on Solar Lithosphere Coupling and Earthquake Activity. Remote Sens. 2024, 16, 24. Available online: https://www.researchgate.net/publication/376695174 (accessed on 1 April 2024). [CrossRef]
  27. Baker, D.N.; Kanekal, S.G.; Horne, R.B.; Meredith, N.P.; Glauert, S.A. Low-altitude measurements of 2–6 MeV electron trapping lifetimes at 1.5 ≤ L ≤ 2.5. Geophys. Res. Lett. 2007, 34, L20110. [Google Scholar] [CrossRef]
  28. Dungey, J.W. Interplanetary magnetic field and the auroral zones. Phys. Rev. Lett. 1961, 6, 47–48. [Google Scholar] [CrossRef]
  29. Lockwood, M.; Smith, M.F. Low- and mid-altitude cusp particle signatures for general magnetopause reconnection rate variations: I. Theory. J. Geophys. Res. 1994, 99, 8531–8555. [Google Scholar] [CrossRef]
  30. Heikkila, W.J.; Winningham, J.D. Penetration of magnetosheath plasma to low altitudes through the dayside magnetospheric cusps. J. Geophys. Res. 1971, 76, 883. [Google Scholar] [CrossRef]
  31. Frank, L.A. Plasma in the Earth’s polar magnetosphere. J. Geophys. Res. 1971, 76, 5202–5219. [Google Scholar] [CrossRef]
  32. Pitout, F.; Bogdanova, Y.V. The polar cusp seen by Cluster. J. Geophys. Res. Space Phys. 2021, 126, e2021JA029582. [Google Scholar] [CrossRef]
  33. Trattner, K.J.; Petrinec, S.M.; Fuselier, S.A. The Location of Magnetic Reconnection at Earth’s Magnetopause. Space Sci. Rev. 2021, 217, 41. [Google Scholar] [CrossRef] [PubMed]
  34. Escoubet, C.P.; Fehringer, M.; Goldstein, M. The Cluster mission. Ann. Geophys. 2001, 19, 1197–1200. [Google Scholar] [CrossRef]
  35. Pitout, F.; Escoubet, C.P.; Klecker, B.; Rème, H. Cluster survey of the middle altitude cusp: 1. size, location, and dynamics. Ann. Geophys. 2006, 24, 3011–3026. [Google Scholar] [CrossRef]
  36. Crooker, N.U. Dayside merging and cusp geometry. J. Geophys. Res. 1979, 84, 951–959. [Google Scholar] [CrossRef]
  37. Russell, C.T. Polar Eyes the Cusp Cluster-II Workshop: Multiscale/Multipoint Plasma Measurements. In Proceedings of the Workshop Held at Imperial College, London, UK, 22–24 September 1999; European Space Agency (ESA), ESA-SP: Paris, France, 2000; Volume 449, p. 47, ISBN 9290927968. Available online: https://articles.adsabs.harvard.edu//full/2000ESASP.449...47R/0000050.000.html (accessed on 1 April 2024).
  38. Russell, C.T.; McPherron, R.L. Semi-Annual Variation of Geomagnetic Activity. J. Geophys. Res. 1973, 78, 92–108. [Google Scholar] [CrossRef]
  39. Zhang, S.-R.; Zhang, Y.; Wang, W.; Verkhoglyadova, O.P. Geospace system responses to the St. Patrick’s Day storms in 2013 and 2015. J. Geophys.Res. Space Phys. 2017, 122, 6901–6906. [Google Scholar] [CrossRef]
  40. Wu, C.-C.; Liou, K.; Lepping, R.P.; Hutting, L.; Plunkett, S.; Howard, R.A.; Socker, D. The first super geomagnetic storm of solar cycle 24: “The St. Patrick’s Day event March 17ch 2015)”. Earth Planets Space 2016, 68, 1. [Google Scholar] [CrossRef]
  41. Clilverd, M.A.; Rodger, C.J.; van de Kamp, M.; Verronen, P.T. Electron precipitation from the outer radiation belt during the St. Patrick’s day storm 2015: Observations, modeling, and validation. J. Geophys. Res. Space Phys. 2020, 125, e2019JA027725. [Google Scholar] [CrossRef]
  42. Shreedevi, P.R.; Choudhary, R.K.; Thampi, S.V.; Yadav, S.; Pant, T.K.; Yu, Y.; McGranaghan, R.; Thomas, E.G.; Bhardwaj, A.; Sinha, A.K. Geomagnetic storm-induced plasma density enhancements in the southern polar ionospheric region: A comparative study using St. Patrick’s Day storms of 2013 and 2015. Space Weather 2020, 18, e2019SW002383. [Google Scholar] [CrossRef]
  43. Wanliss, J.A.; Showalter, K.M. High-resolution global storm index: Dst versus SYM-H. J. Geophys. Res. 2006, 111, A02202. [Google Scholar] [CrossRef]
  44. Loewe, C.A.; Prolss, G.W. Classification and Mean Behavior of Magnetic Storms. J. Geophys. Res. 1997, 102, 14209. [Google Scholar] [CrossRef]
  45. Gutenberg, B.; Richter, C. Magnitude and energy of earthquakes. Nature 1955, 176, 795. [Google Scholar] [CrossRef]
  46. Laundal, K.M.; Richmond, A.D. Magnetic Coordinate Systems. Space Sci. Rev. 2017, 206, 27–59. [Google Scholar] [CrossRef]
  47. Hayes, G.P.; Myers, E.K.; Dewey, J.W.; Briggs, R.W.; Earle, P.S.; Benz, H.M.; Smoczyk, G.M.; Flamme, H.E.; Barnhart, W.D.; Gold, R.D.; et al. Tectonic Summaries of Magnitude 7 and Greater Earthquakes from 2000 to 2015; Open-File Report 2016-1192; U.S. Geological Survey: Reston, VA, USA, 2017; 148p. [Google Scholar] [CrossRef]
  48. Ouzounov, D.; Pulinets, S.; Hattori, K.; Taylor, P. (Eds.) Pre-Earthquake Processes: A Multi-Disciplinary Approach to Earthquake Prediction Studies, American Geophysical Union; John Wiley & Sons: Hoboken, NJ, USA, 2018; 385p. [Google Scholar]
  49. Ouzounov, D.; Pulinets, S.; Davidenko, D.; Rozhnoi, A.; Solovieva, M.; Fedun, V.; Dwivedi, B.N.; Rybin, A.; Kafatos, M.; Taylor, P. Transient Effects in Atmosphere and Ionosphere Preceding the 2015 M7.8 and M7.3 Gorkha–Nepal Earthquakes. Front. Earth Sci. 2021, 9, 757358. [Google Scholar] [CrossRef]
  50. Miller, S.A. The Role of Fluids in Tectonic and Earthquake Processes. Adv. Geophys. 2013, 54, 1–46. [Google Scholar] [CrossRef]
  51. Gotynyan, O.E.; Ivchenko, V.M.; Rapoport, Y.G. Model of the internal gravity waves excited by lithospheric greenhouse effect gases. Space Sci. Technol. (“Kosmichna Nauka Tehnologiya”) 2001, 7, 26–33. [Google Scholar] [CrossRef]
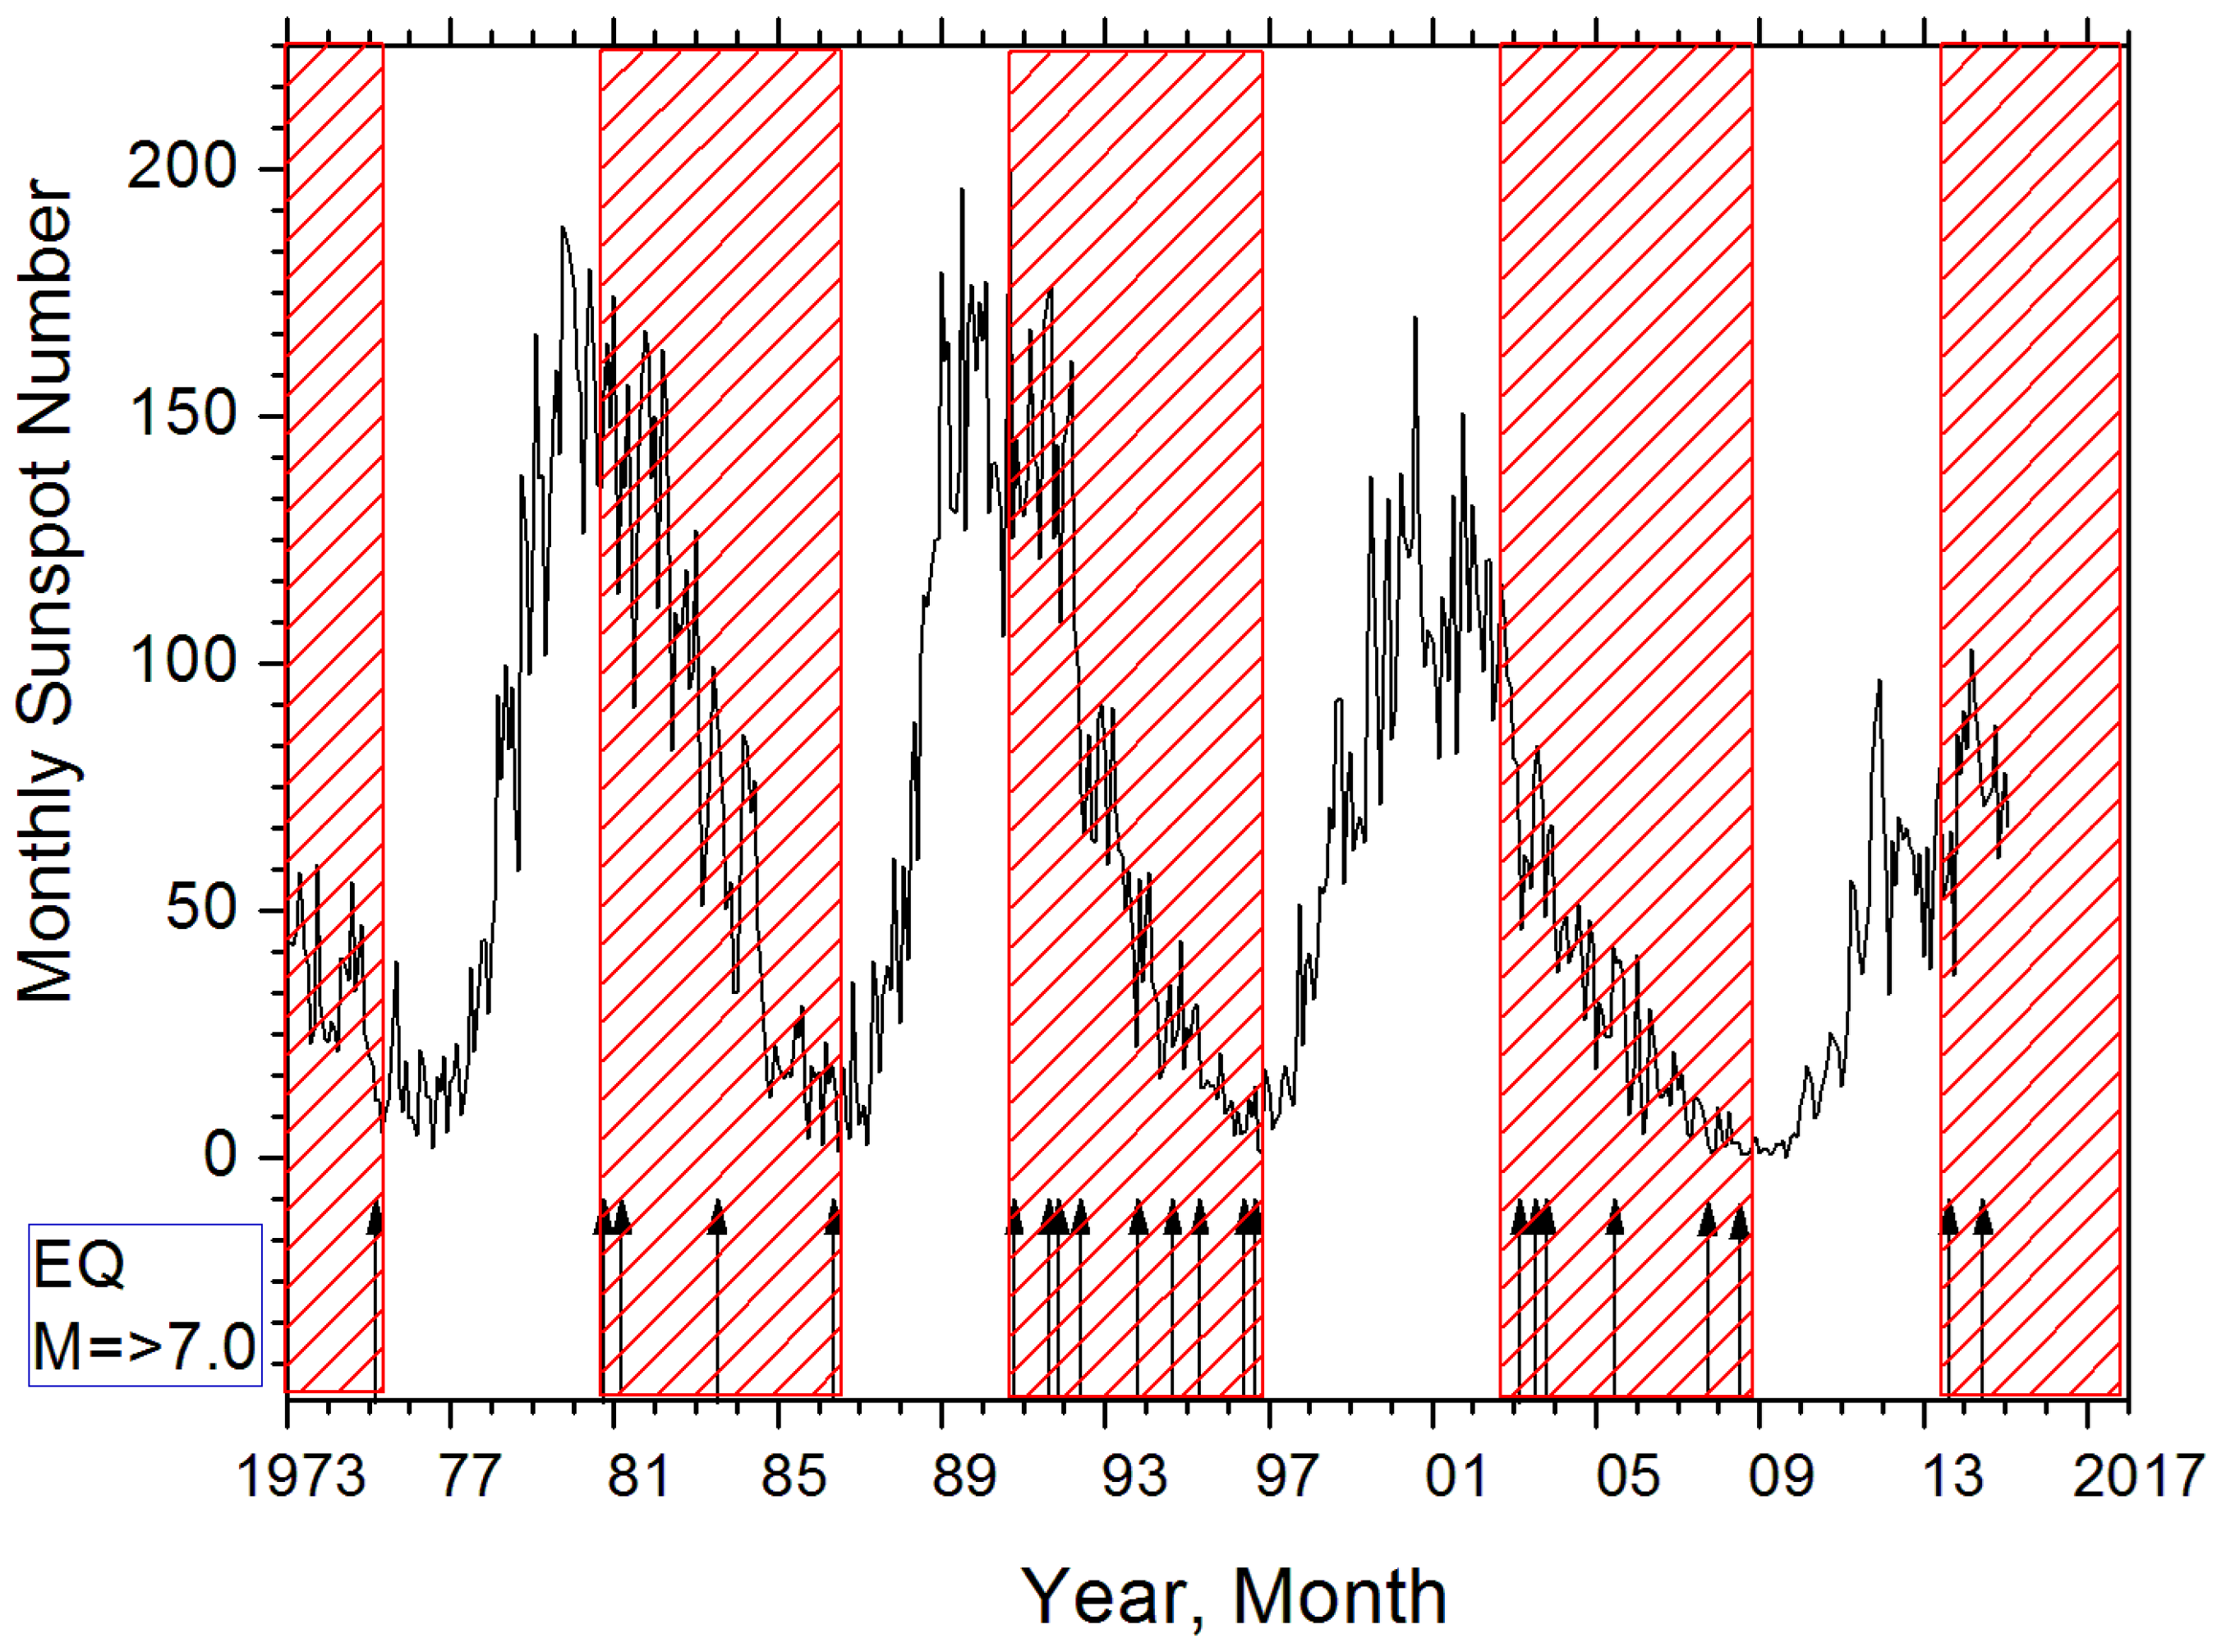
Figure 1. The monthly sunspot numbers (curve) and dates of strong (M ≥ 7.0) earthquakes (arrows) that occurred in 1973–2014 at the footprint of L = 2.0 to 2.2 geomagnetic lines from [24] (their Figure 11).
Remotesensing 16 02544 g001
Figure 2. A picture of the Earth’s magnetosphere reprinted from http://english.igg.cas.cn/NC/RN/201504/t20150413_146311.html, accessed on 1 April 2024.
Remotesensing 16 02544 g002
Figure 3. Magnetic local time (MLT) and invariant latitude (ILAT) for cusp crossings by the Clusters. Black and red symbols mark the crossings in the Northern and Southern Hemispheres, respectively (reprinted from [35]).
Remotesensing 16 02544 g003
Figure 4. The 1-min geomagnetic SYM/H index for March 14–26 in 2013 (black) and 2015 (red) from the database OMNI.
Remotesensing 16 02544 g004
Figure 5. The histogram of released seismic energy at the globe per day from March 17 to June 17 in 2013 and 2015 (black and red columns, respectively) was estimated using data on M ≥ 4.5 from the USGS seismological catalog.
Remotesensing 16 02544 g005
Figure 6. (from top to bottom): One-minute data on the magnitude of the averaged magnetic field vector on Earth’s orbit, the vertical component of the interplanetary magnetic field in the GSM coordinate system, the speed and density of the solar wind flux, the pressure of the solar wind at the magnetopause, and the SYM/H index for 21–23 June 2015 from the OMNI database.
Remotesensing 16 02544 g006
Figure 7. (from top to bottom): One-minute data on the magnitude averaged magnetic field vector on Earth’s orbit, the azimuthal and vertical components of the interplanetary magnetic field (By and Bz) in the GSM coordinate system, density and temperature of the solar wind flux, pressure of the solar wind at the magnetopause, and geomagnetic SYM/H index for 24–25 October from the OMNI database.
Remotesensing 16 02544 g007
Figure 8. Spatial distribution of 14 epicenters for M ≥ 7.5 earthquakes that occurred around the globe in 2013 and 2015 (circles); color symbols with digits indicate the location of magnetic poles in the Northern and Southern Hemispheres for three options: 1—geomagnetic poles, 2—magnetic dipoles, and 3—corrected geomagnetic poles.
Remotesensing 16 02544 g008
Figure 9. A histogram of the distribution of the number of (M ≥ 7.5) earthquakes that occurred around the globe in 1973–2017 (212 events) dependent on the longitude locations of the magnetic poles in the Northern and Southern Hemispheres for three options: 1—geomagnetic poles (quadrants), 2—magnetic dip-poles (stars), and 3—corrected geomagnetic poles (pentagon), respectively.
Remotesensing 16 02544 g009
Table 1. The data on the earthquakes, which are mainly responsible for the Es peaks, are marked in Figure 4 as 1 and 2.
Earthquake Date
(y–mon–day, Place)
Time
UTC
Geographic LatitudeGeographic LongitudeDepth
(km)
MagnitudeThe Delay between Storm Onset and Earthquake Occurrence (Days)
The strongest earthquakes responsible for Es peaks in April of 2013 and 2015
2013-04-16
Iran
10:44:2028.033°N61.996°E807.730
2015-04-25
Nepal
06:11:2528.231°N84.731°E8.27.839
The strongest earthquakes responsible for Es peaks in May of 2013 and 2015
2013-05-24
Okhotsk sea
05:44:4854.892°N153.221°E598.18.368
2015-05-30
Japan
11:23:0227.839°N140.493°E664.07.874
Table 2. Data on geomagnetic storms, strong (M ≥ 7.5) earthquakes following the storms, the time delay between storm onset and earthquake occurrence, and magnetic local time (MLT) at the areas of future epicenters in times of geomagnetic storm onset.
#Data on
Geomagnetic Storm
(Date, Time of Onset (UT); Maximal Positive and Negative Values of the SYM/H Index (nT)
Data on Strong (M ≥ 7.5) Earthquakes Following the Geomagnetic Storm.
(Region, Date, Coordinates, Depth-h km;
Magnitude)
The Time Delay between Geomagnetic Storm Onset and Earthquake Occurrence
(Days)
Magnetic Local Time (MLT) in the Area of the Future Epicenter in a Moment of Geomagnetic Storm Onset
12345
1.17 March 2013; 06:04;
SYM/H: +33; −132
Iran, 2013-04-16; 10:44:20;
28.033°N, 61.996°E; h = 80; M7.7
3010.48
Okhotsk Sea, Russia, 2013-05-24; 05:44:48;
54.892°N, 153.221°E; h = 598; M8.3
6815.66
2.17 March 2015, 04:48;
SYM/H: +67; −234
Nepal, 2015-04-25; 06:11:25;
28.231°N, 84.731°E; h = 8.2; M7.8
39 10.54
Japan, 2015-05-30; 11:23:02;
27.839°N, 140.493°E; h = 664; M7.8
74 13.82
Papua New Guinea, 2015-03-29; 23:48:31;
4.729°S, 152.562°E; h = 41; M7.5
1215.63
Papua New Guinea, 2015-05-05; 01:44:06;
5.462°S, 151.875°E; h = 55; M7.5
4915.57
3.22 June 2015, 18:37;
SYM/H: + 88; −208
Chile, 2015-09-16; 22:54:32;
31.573°S, 71.674°W; h = 22.4; M8.3
86 14.12
24 October 2015, 19:00;
SYM/H: + 39
(no geomagnetic storm)
Peru, 2015-11-24; 22:45:38;
10.537°S, 70.944°W; h = 606.2; M7.6
3114.52
Peru, 2015-11-24; 22:50:54;
10.060°S, 71.018°W; h = 620.6; M7.6
3114.51
4.31 October 2012; 16:52;
SYM/H: +35; −68
Alaska, 2013-01-05; 08:58:14;
55.228°N, 134.859°W; h = 8.7; M7.5
66 7.15
5.17 January 2013, 03:00;
SYM/H: + 55; −57
Solomon Islands, 2013-02-06; 01:12:25;
10.799°S, 165.114°E; h = 24; M8.0
20 14.88
6.4 August 2013, 06:11;
SYM/H: + 24; −56
Pakistan, 2013-09-24; 11:29:47;
26.951°N, 65.501°E; h = 15; M7.7
51 10.79
7.27 August 2013, 16:00;
SYM/H: +13; −68
Scotia Sea, 2013-11-17; 09:04:55;
60.274°S, 46.401°W; h = 10; M7.7
82 12.72
8.20 September 2015, 06:18;
SYM/H: +3; −84
Afghanistan, 2015-10-26; 09:09:42;
36.524°N, 70.368°E; h = 231; M7.5
36 11.21
Disclaimer/Publisher’s Note: The statements, opinions and data contained in all publications are solely those of the individual author(s) and contributor(s) and not of MDPI and/or the editor(s). MDPI and/or the editor(s) disclaim responsibility for any injury to people or property resulting from any ideas, methods, instructions or products referred to in the content.