Polar Sea Ice Monitoring Using HY-2B Satellite Scatterometer and Scanning Microwave Radiometer Measurements
Abstract
1. Introduction
2. Data
2.1. HY-2B Sensor Information
2.2. HY-2B Data
2.3. Sea Ice Concentration (SIC) Data
2.4. Sea Ice Edge and Sea Ice Type Data
2.5. Moderate Resolution Imaging Spectroradiometer (MODIS) Imagery
2.6. SAR Mosaic Image
3. Method
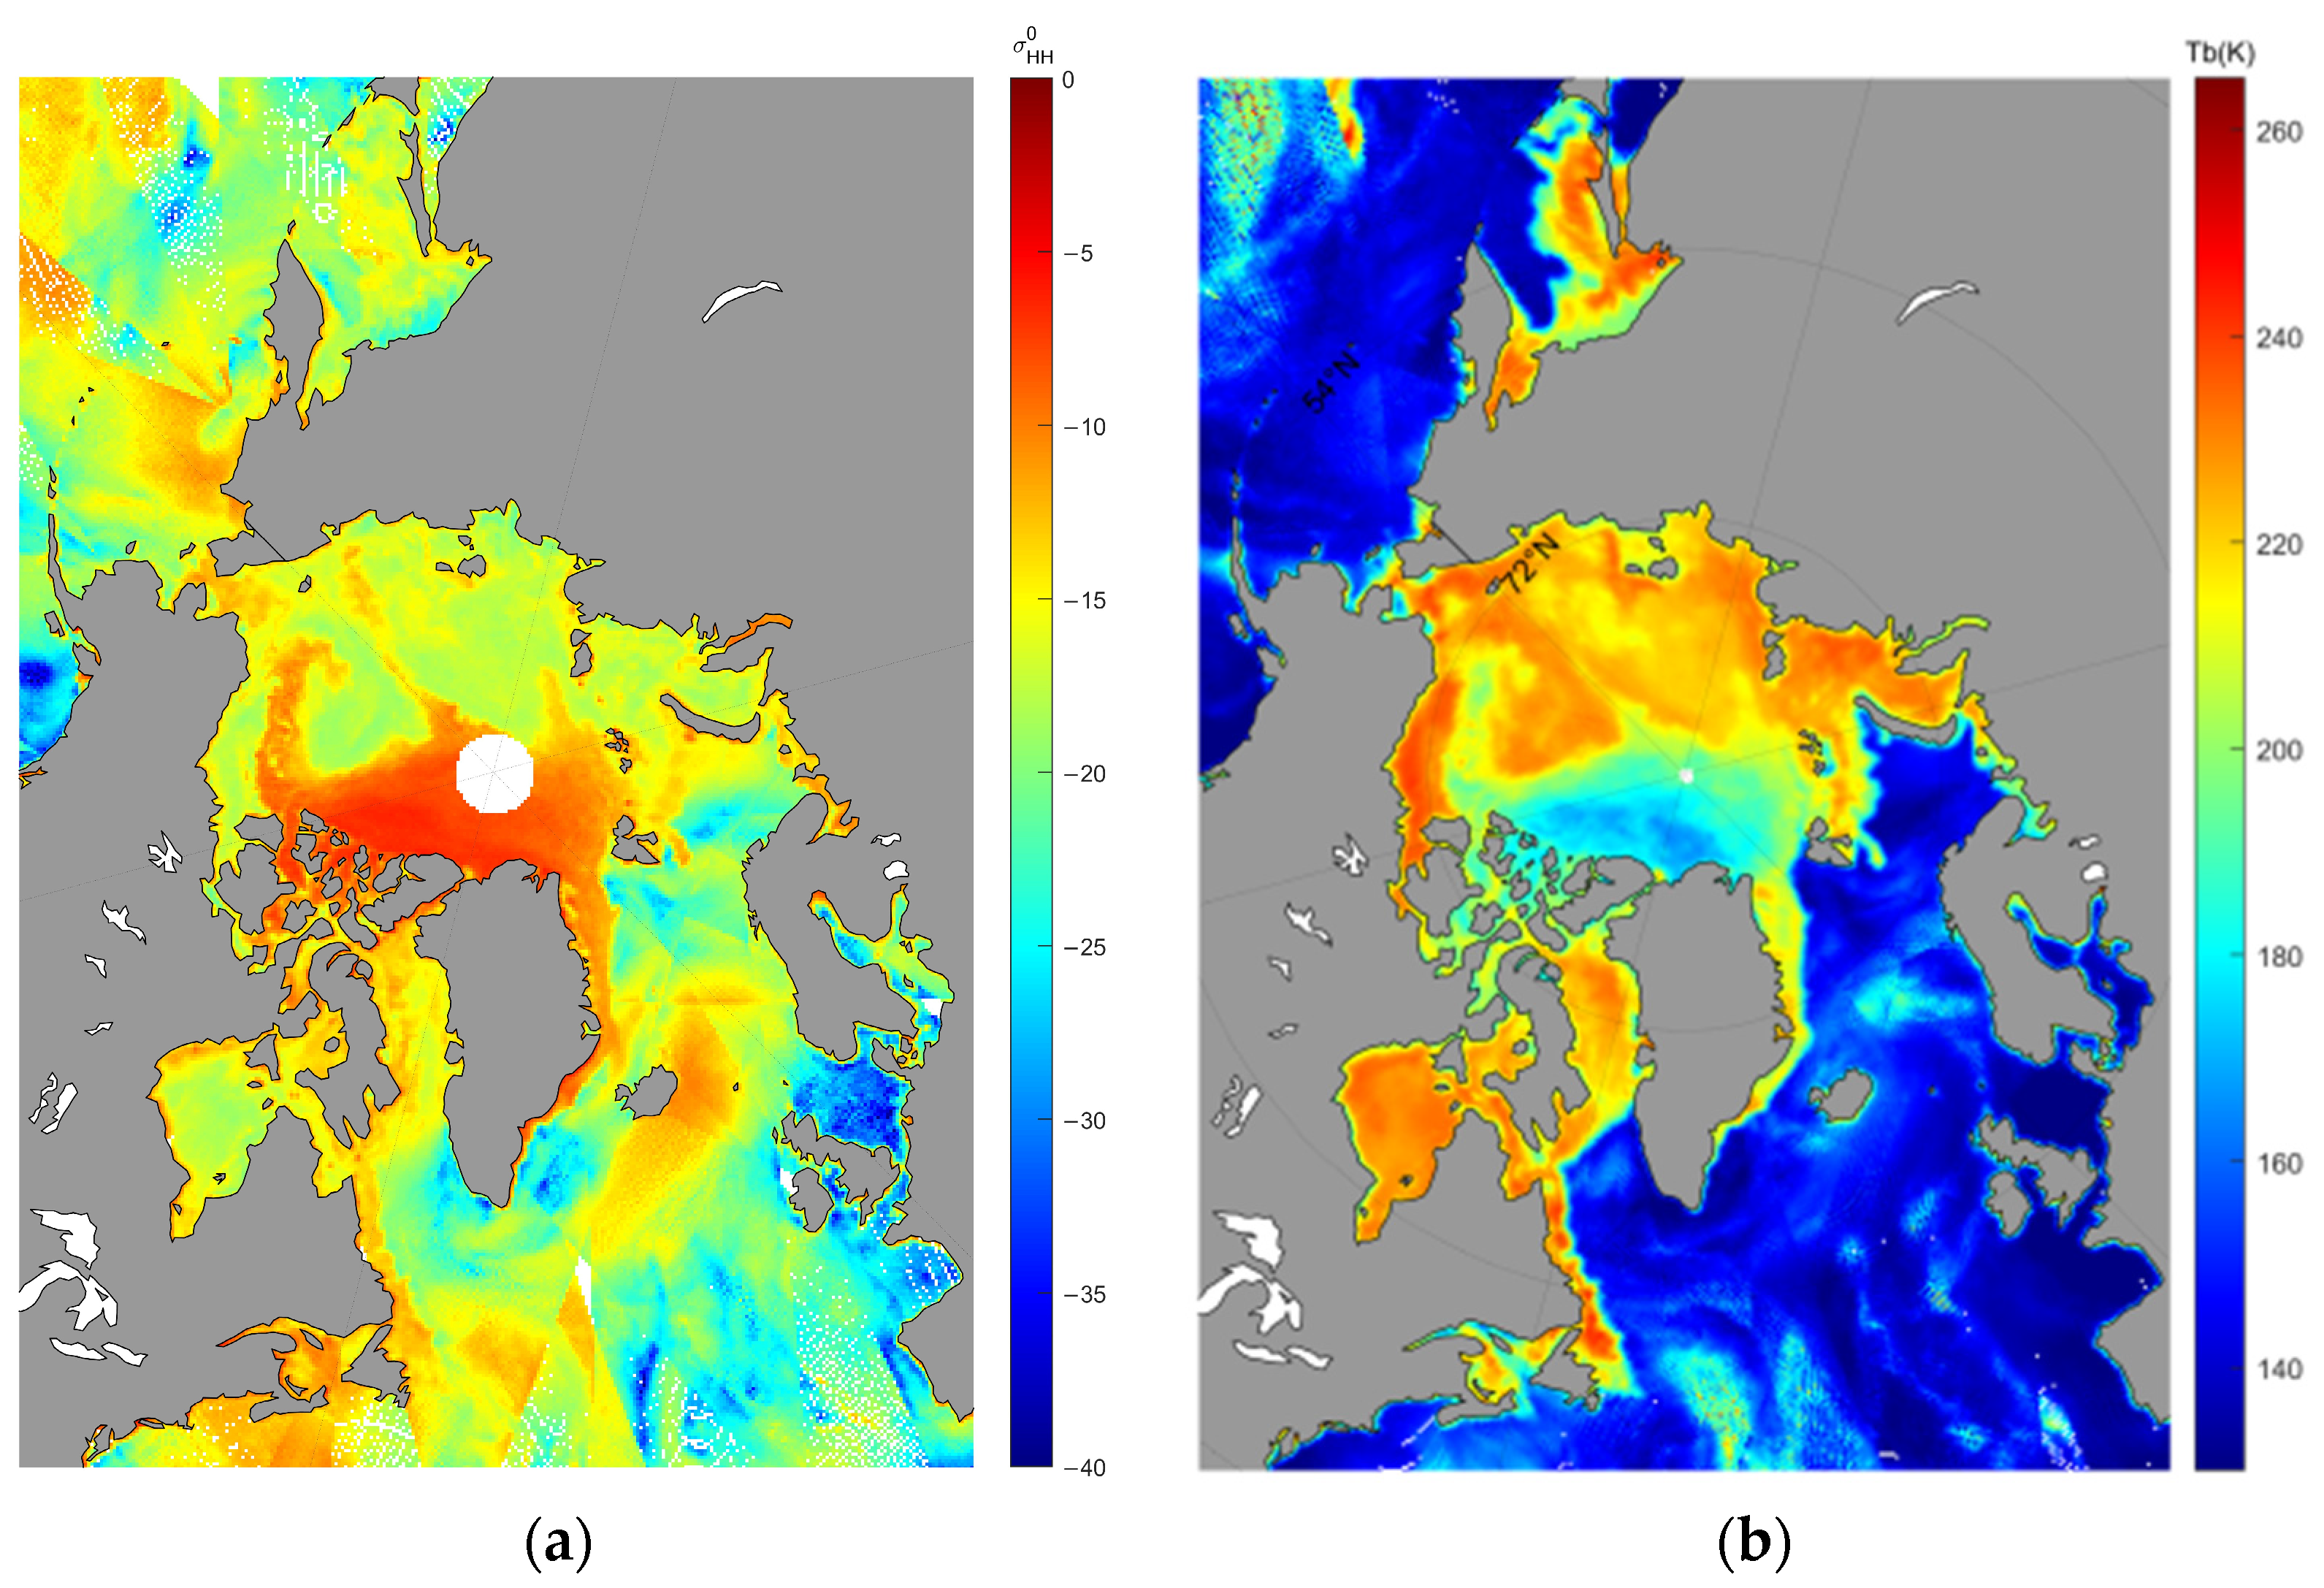
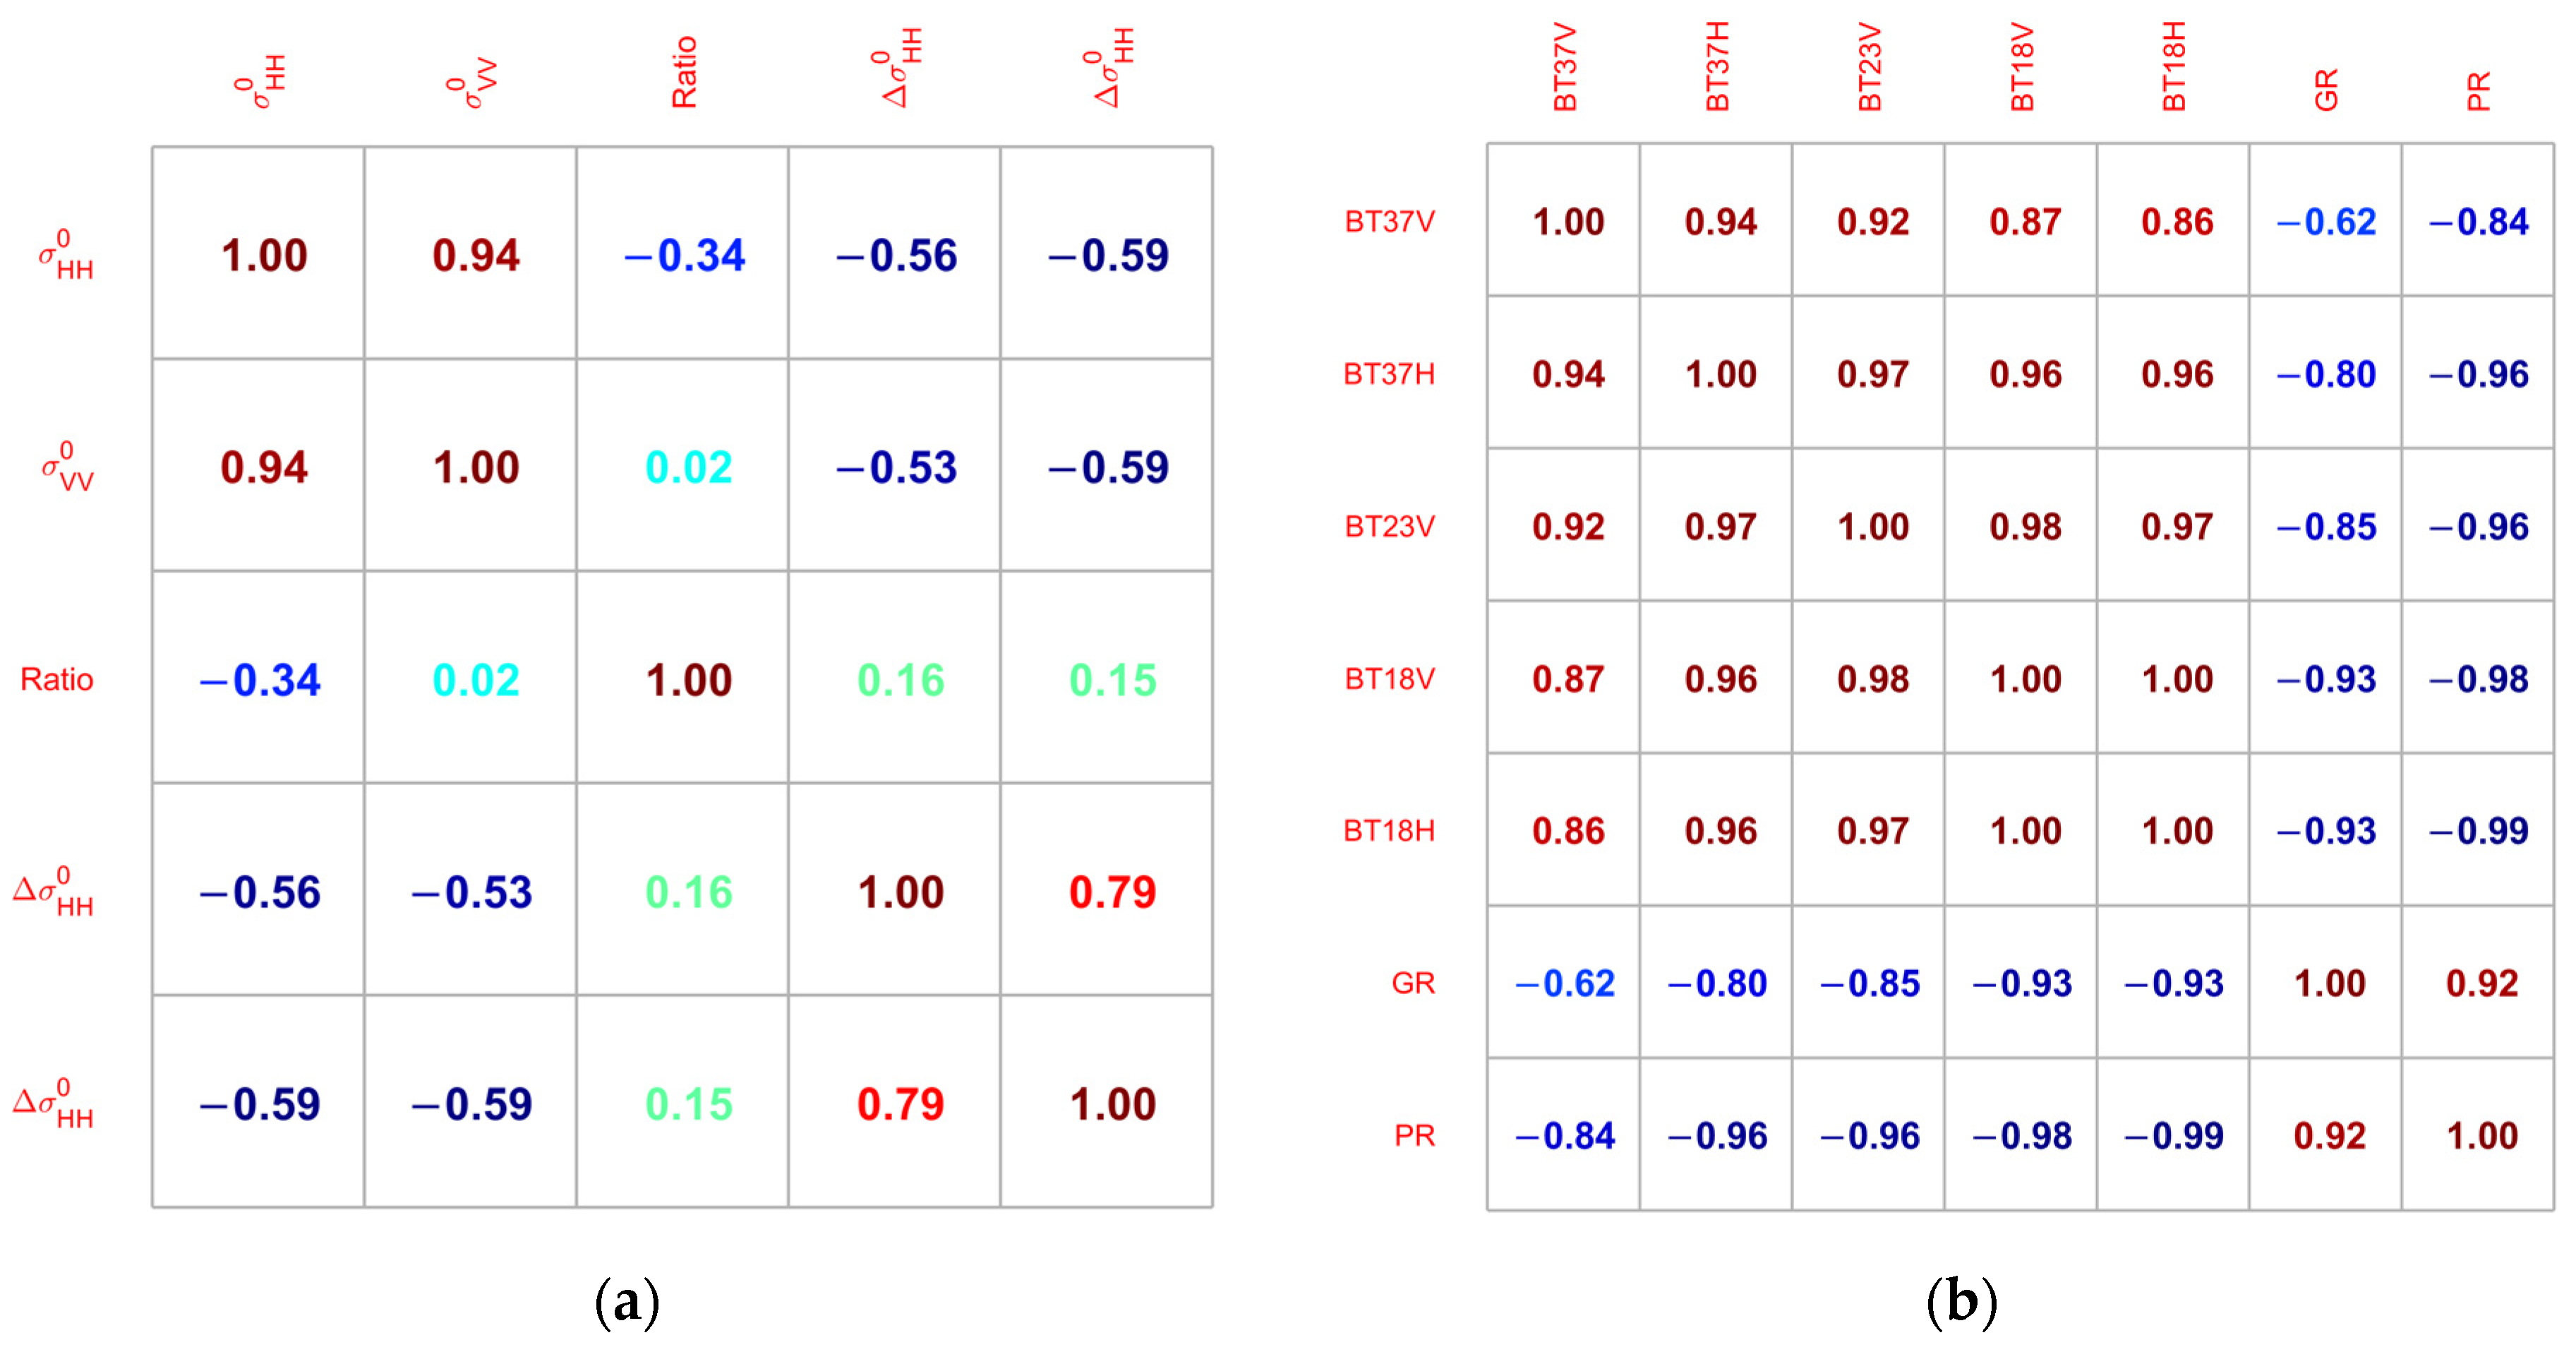
3.1. Microwave Radiation and Scattering Parameters and Selection Method
- 1.
- Polarization ratio, defined as the ratio of the horizontal polarization backscattering coefficient to the vertical backscattering coefficient:
- 2.
- Horizontal polarization standard deviation , defined as the standard deviation of multiple horizontal polarization observations in a single grid point.
- 3.
- Vertical polarization standard deviation , defined as the standard deviation of multiple vertical polarization observations in a single grid point.
3.2. Support Vector Machine (SVM) Method
4. Results
4.1. Parameters Selection
4.2. Comparison of Sea Ice Extent and IIEE over the Arctic and Antarctic
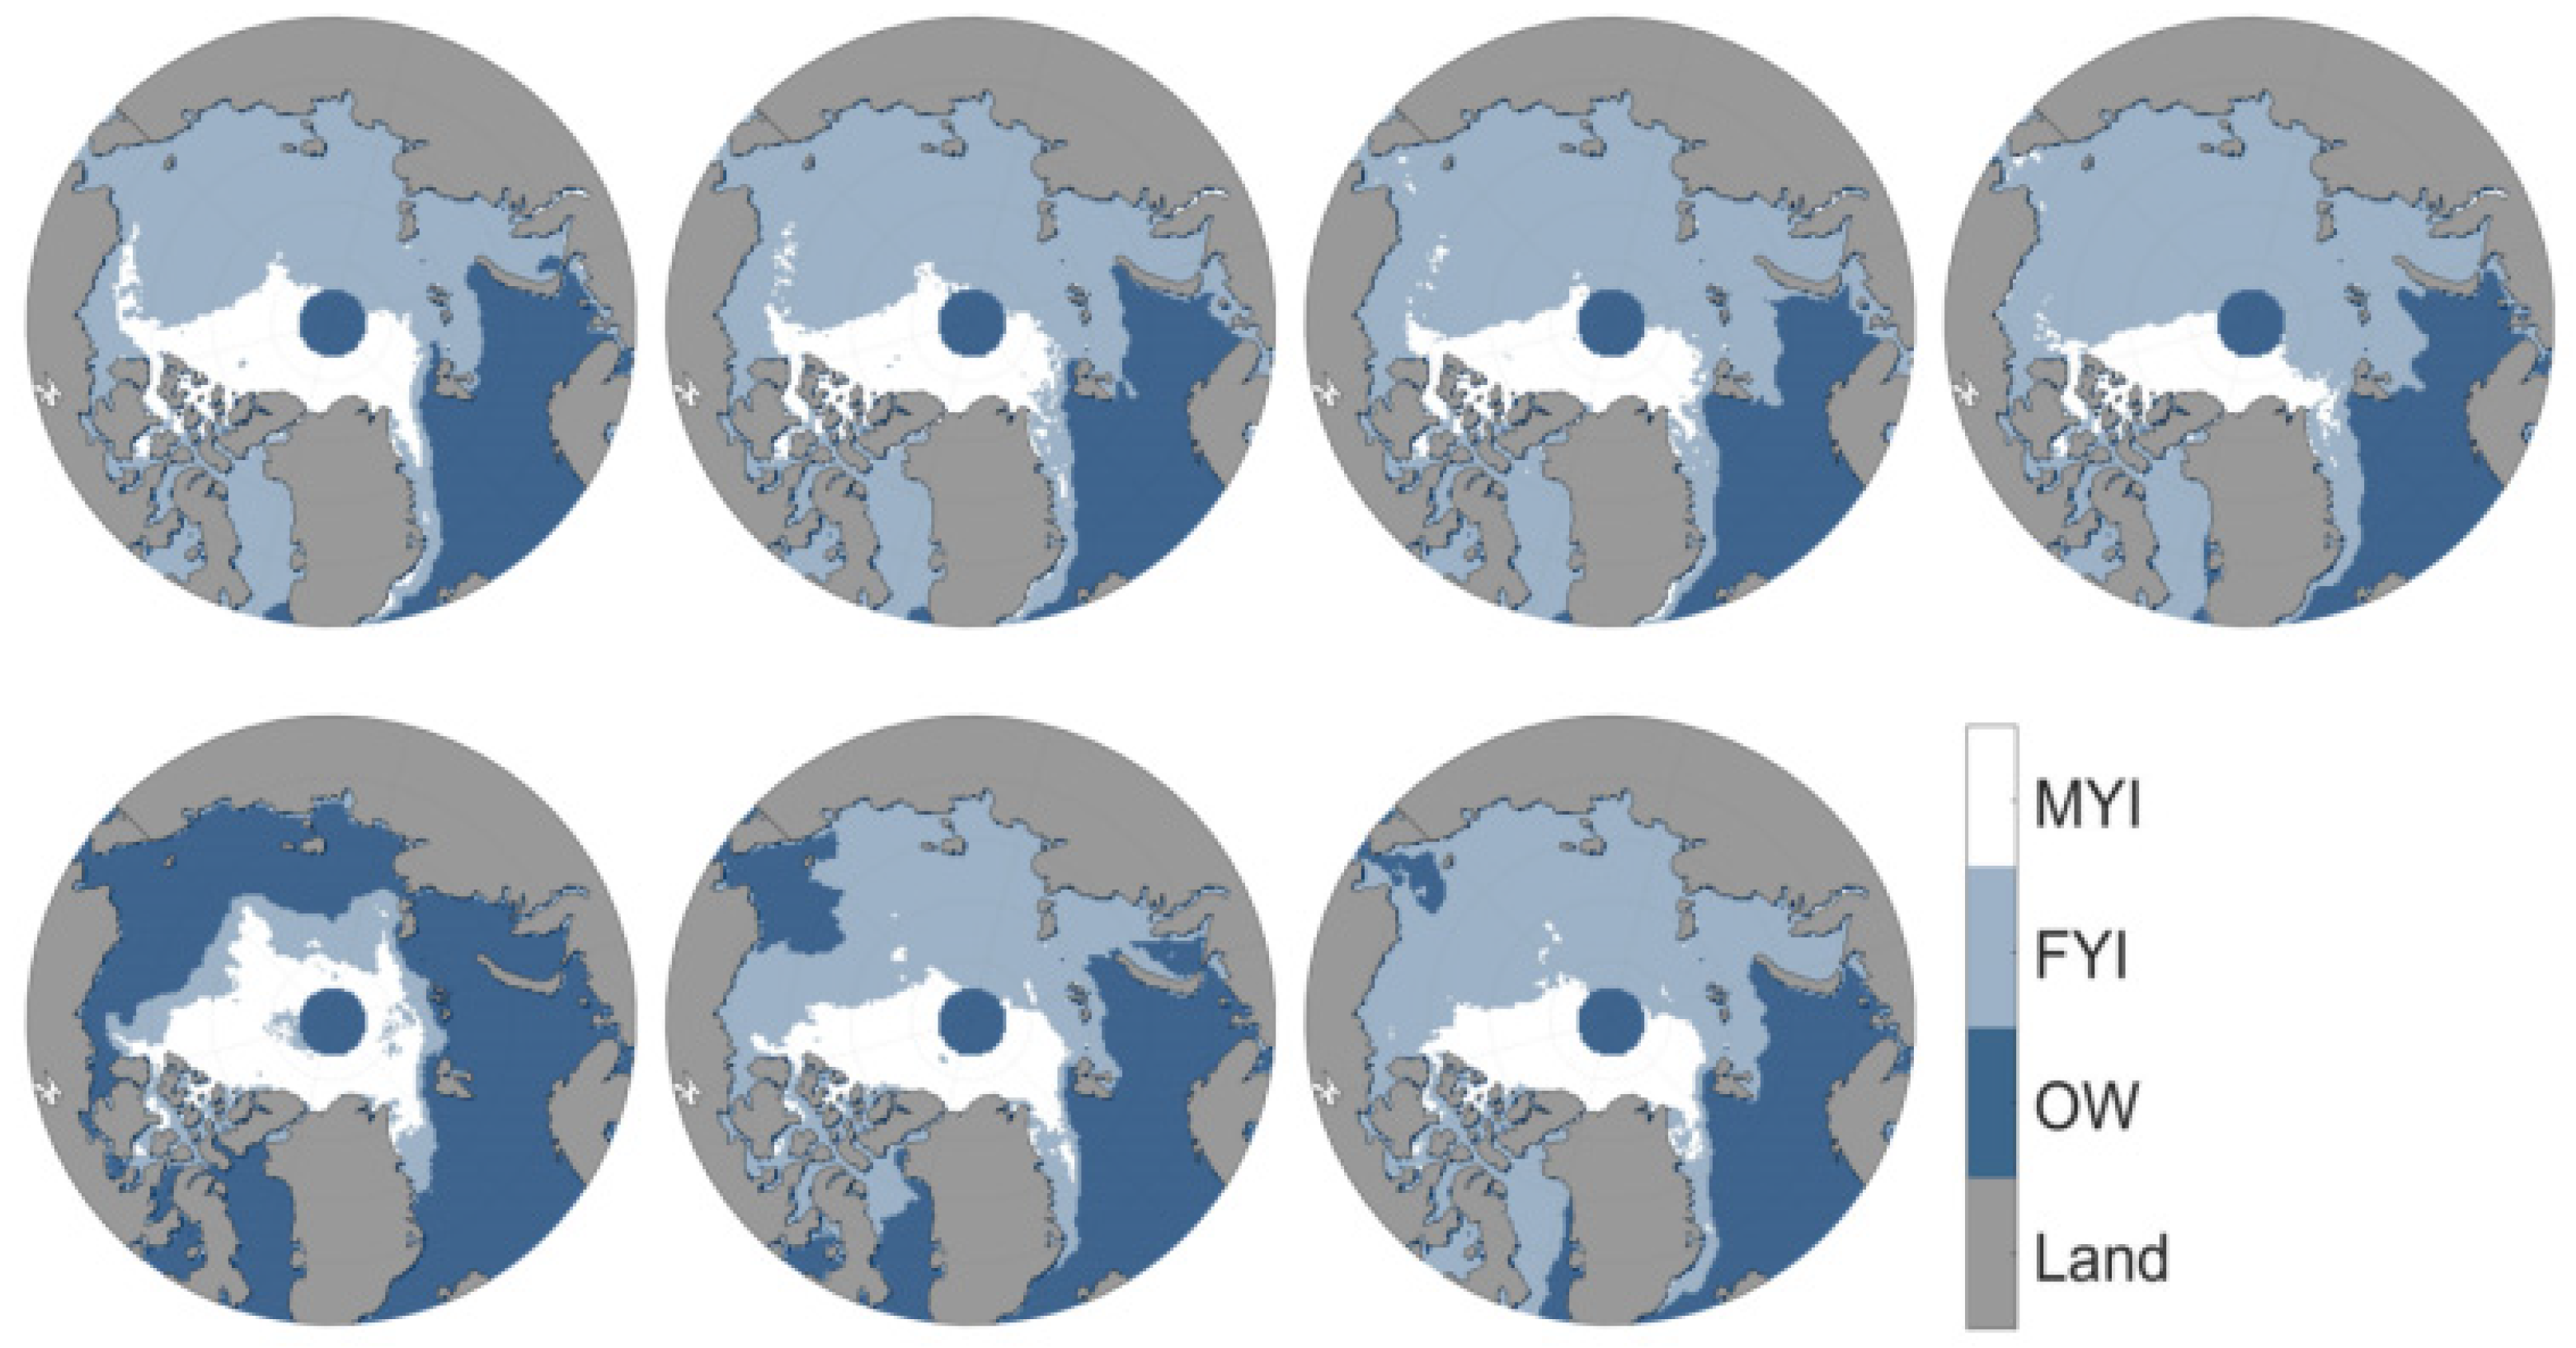
4.3. Arctic Sea Ice Type Results
5. Assessment
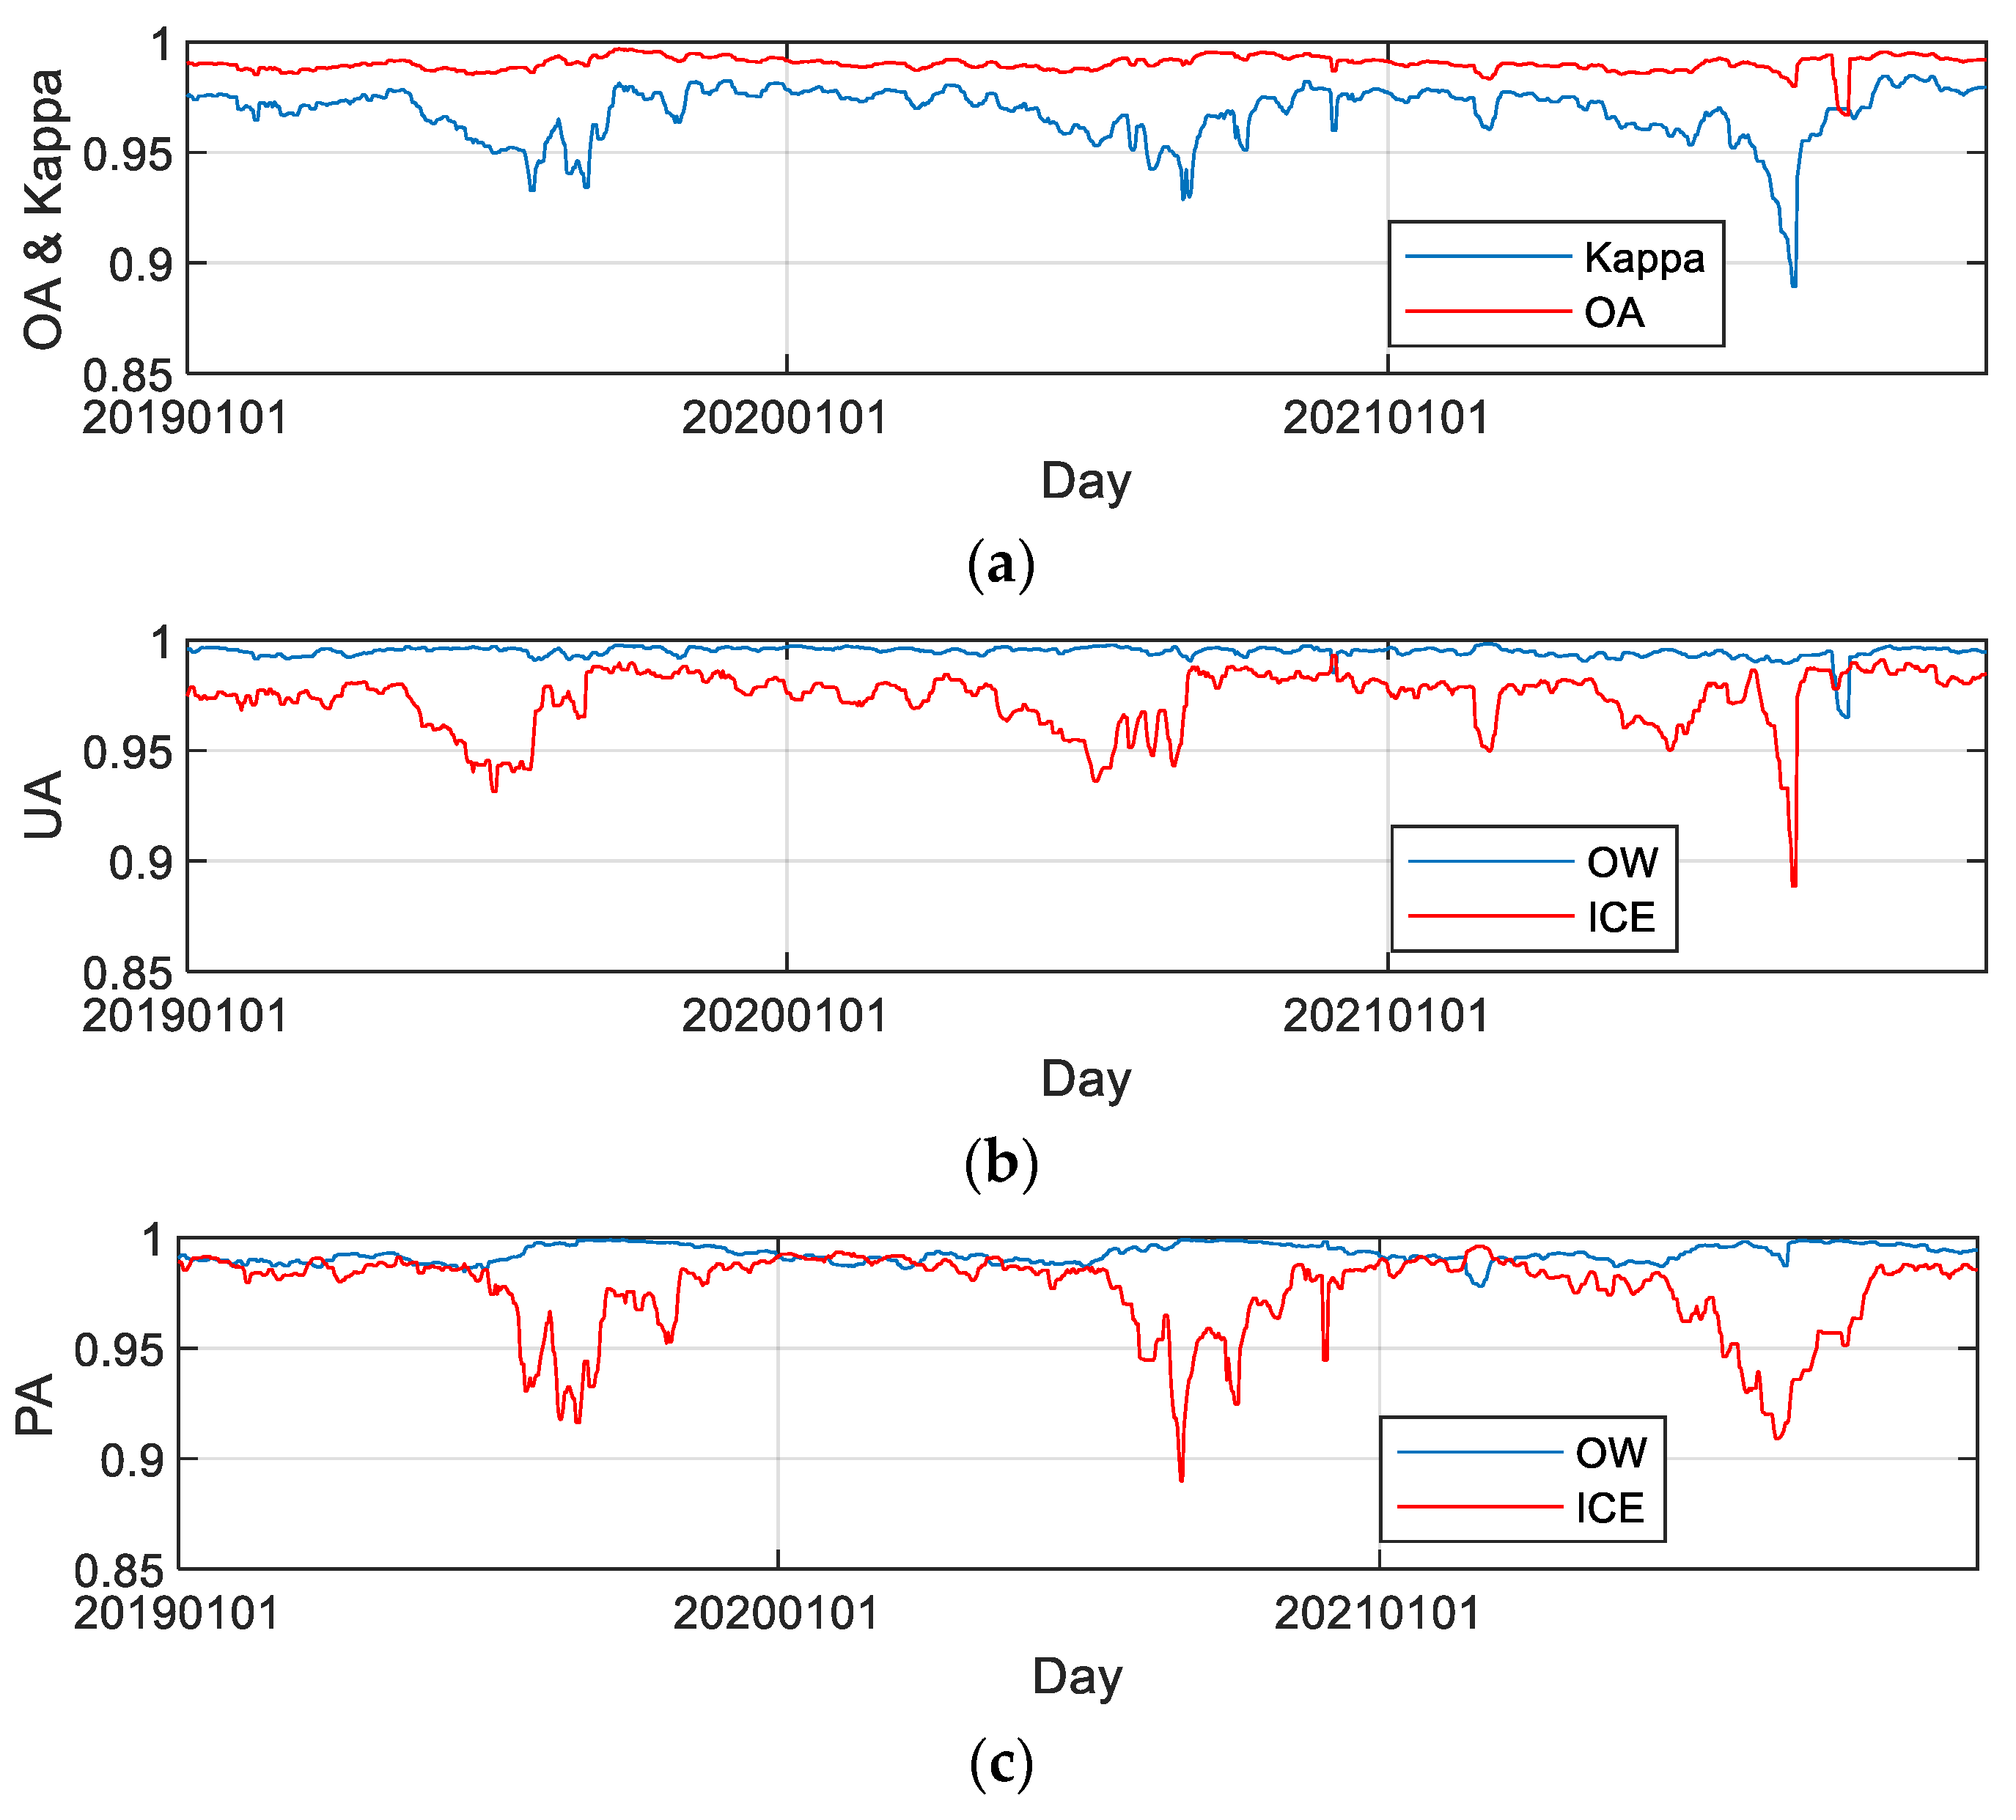
5.1. Assessment of Ice Water Discrimination Results with OSISAF Ice Edge Product
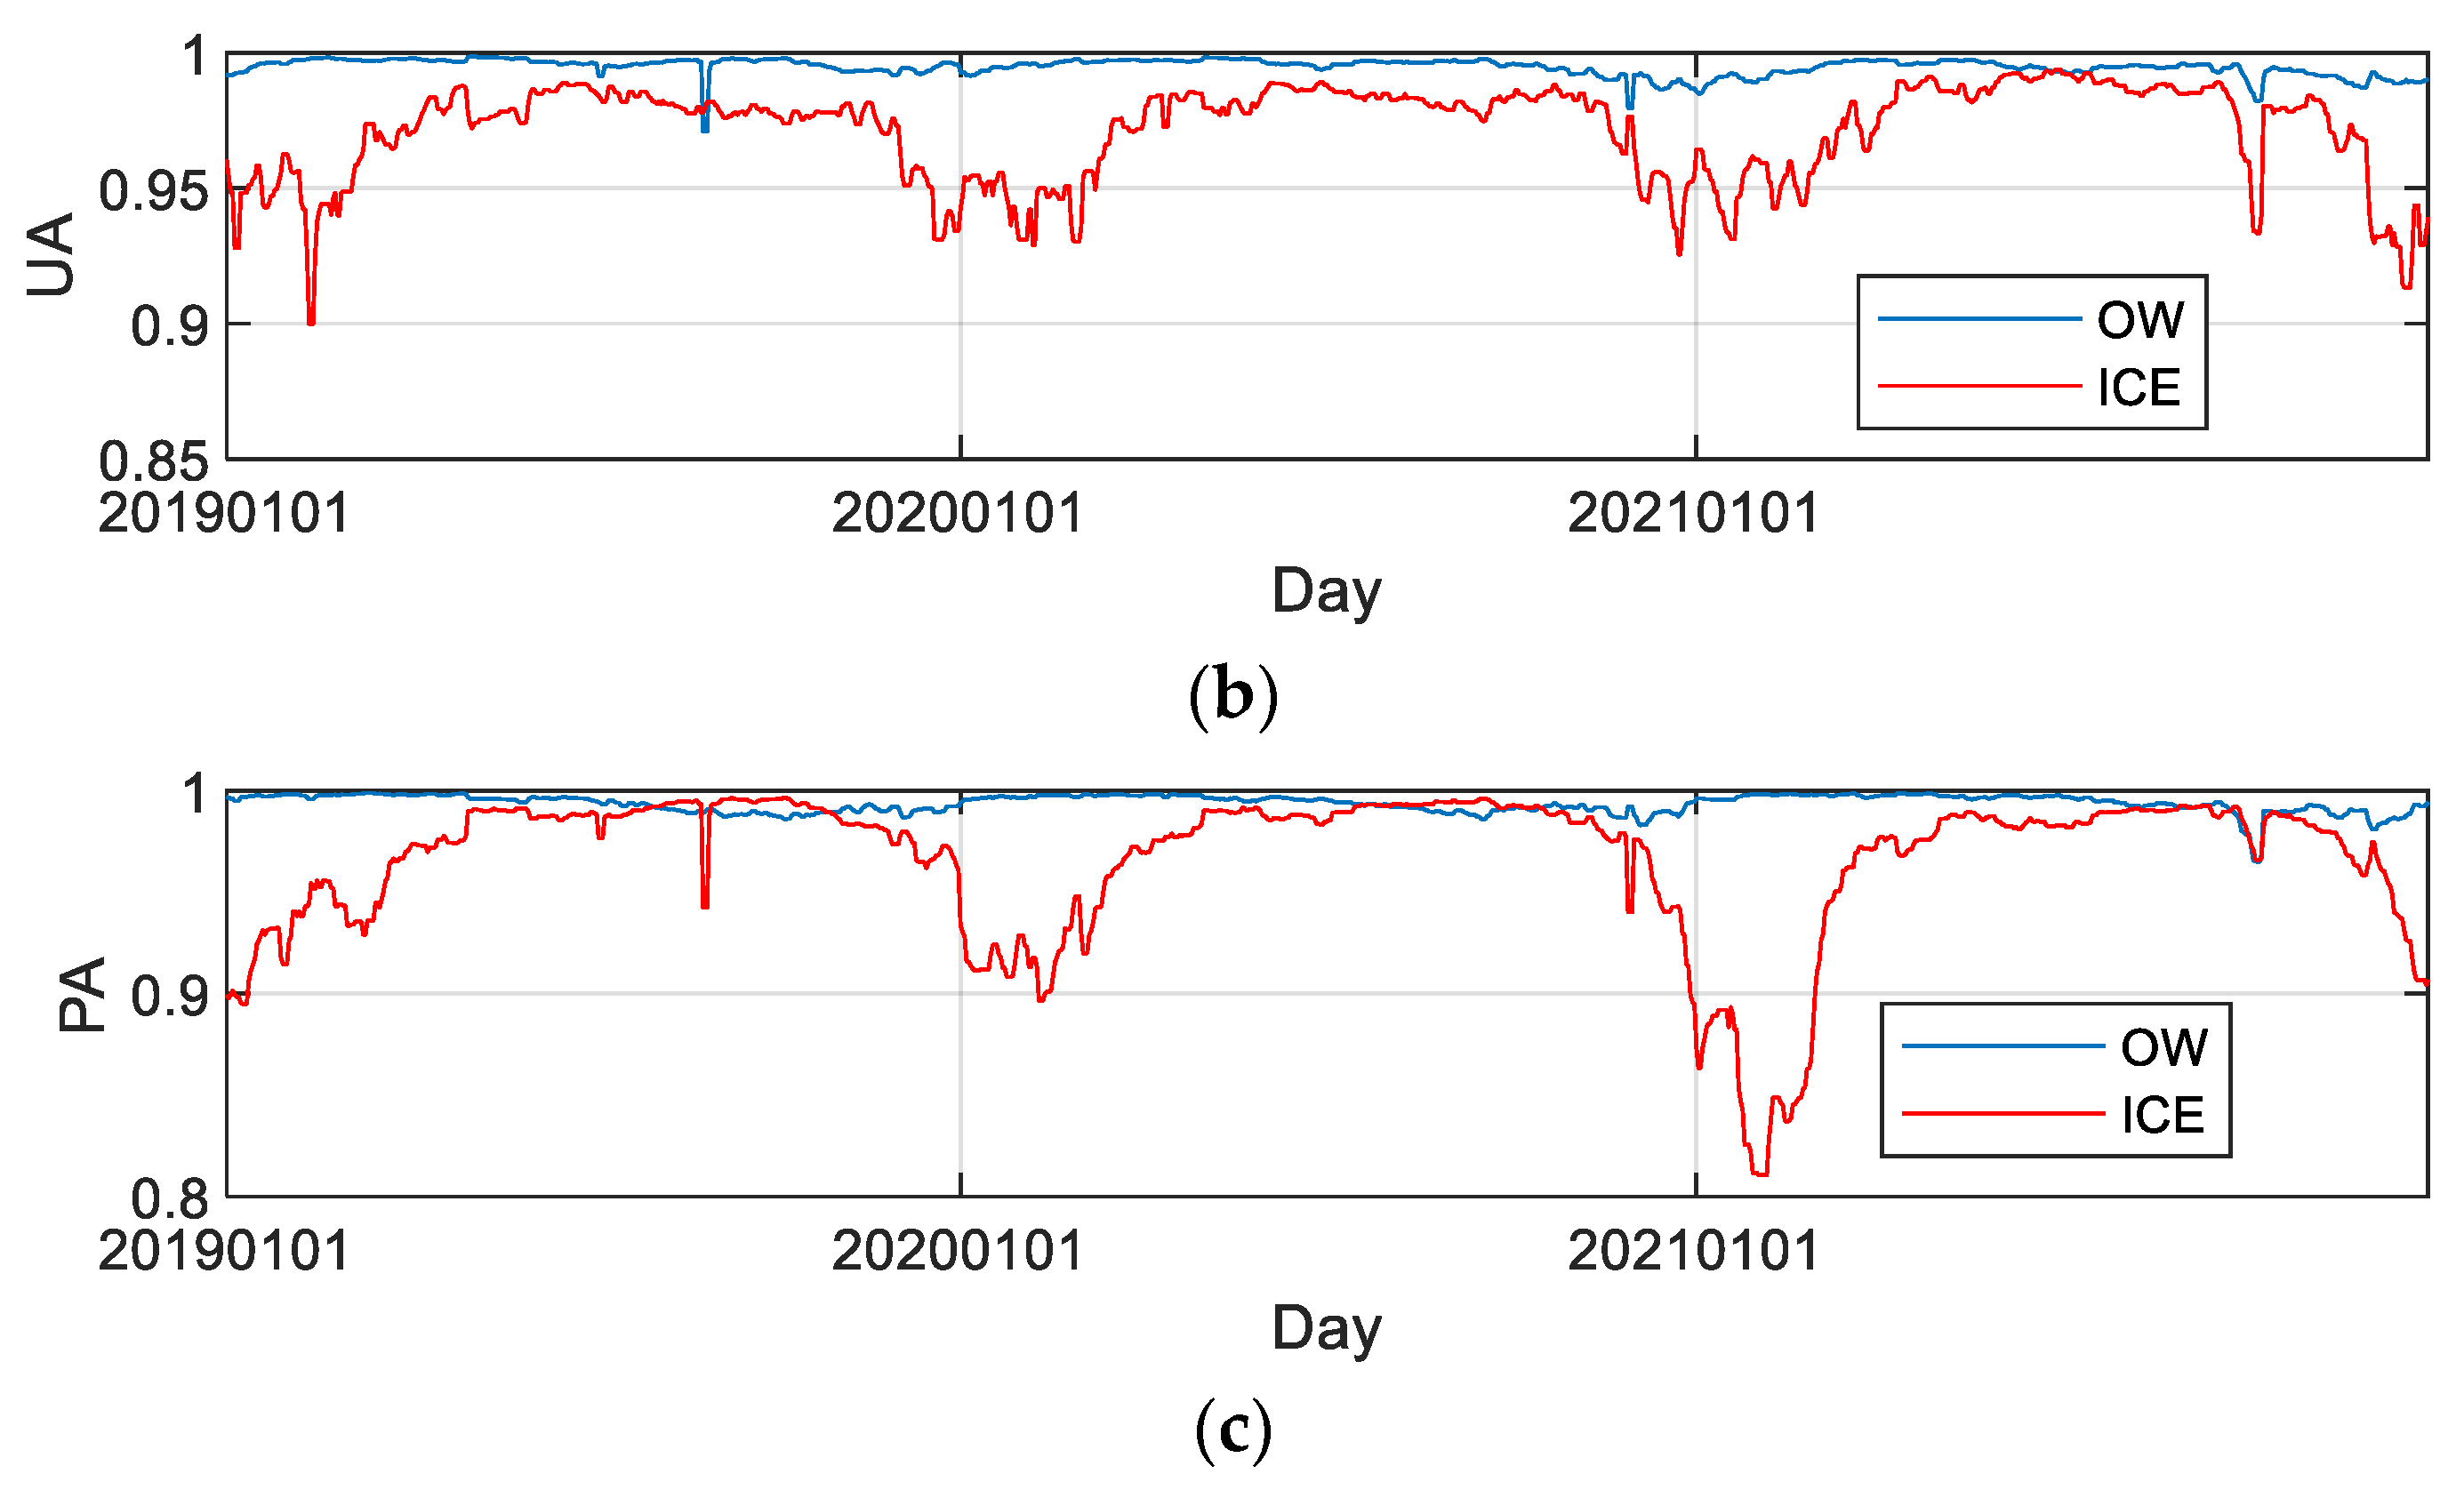
5.2. Assessment of Ice-Type Discrimination Results with OSISAF Ice-Type Product
5.3. Assessment of Ice Water Discrimination Results with MODIS Images
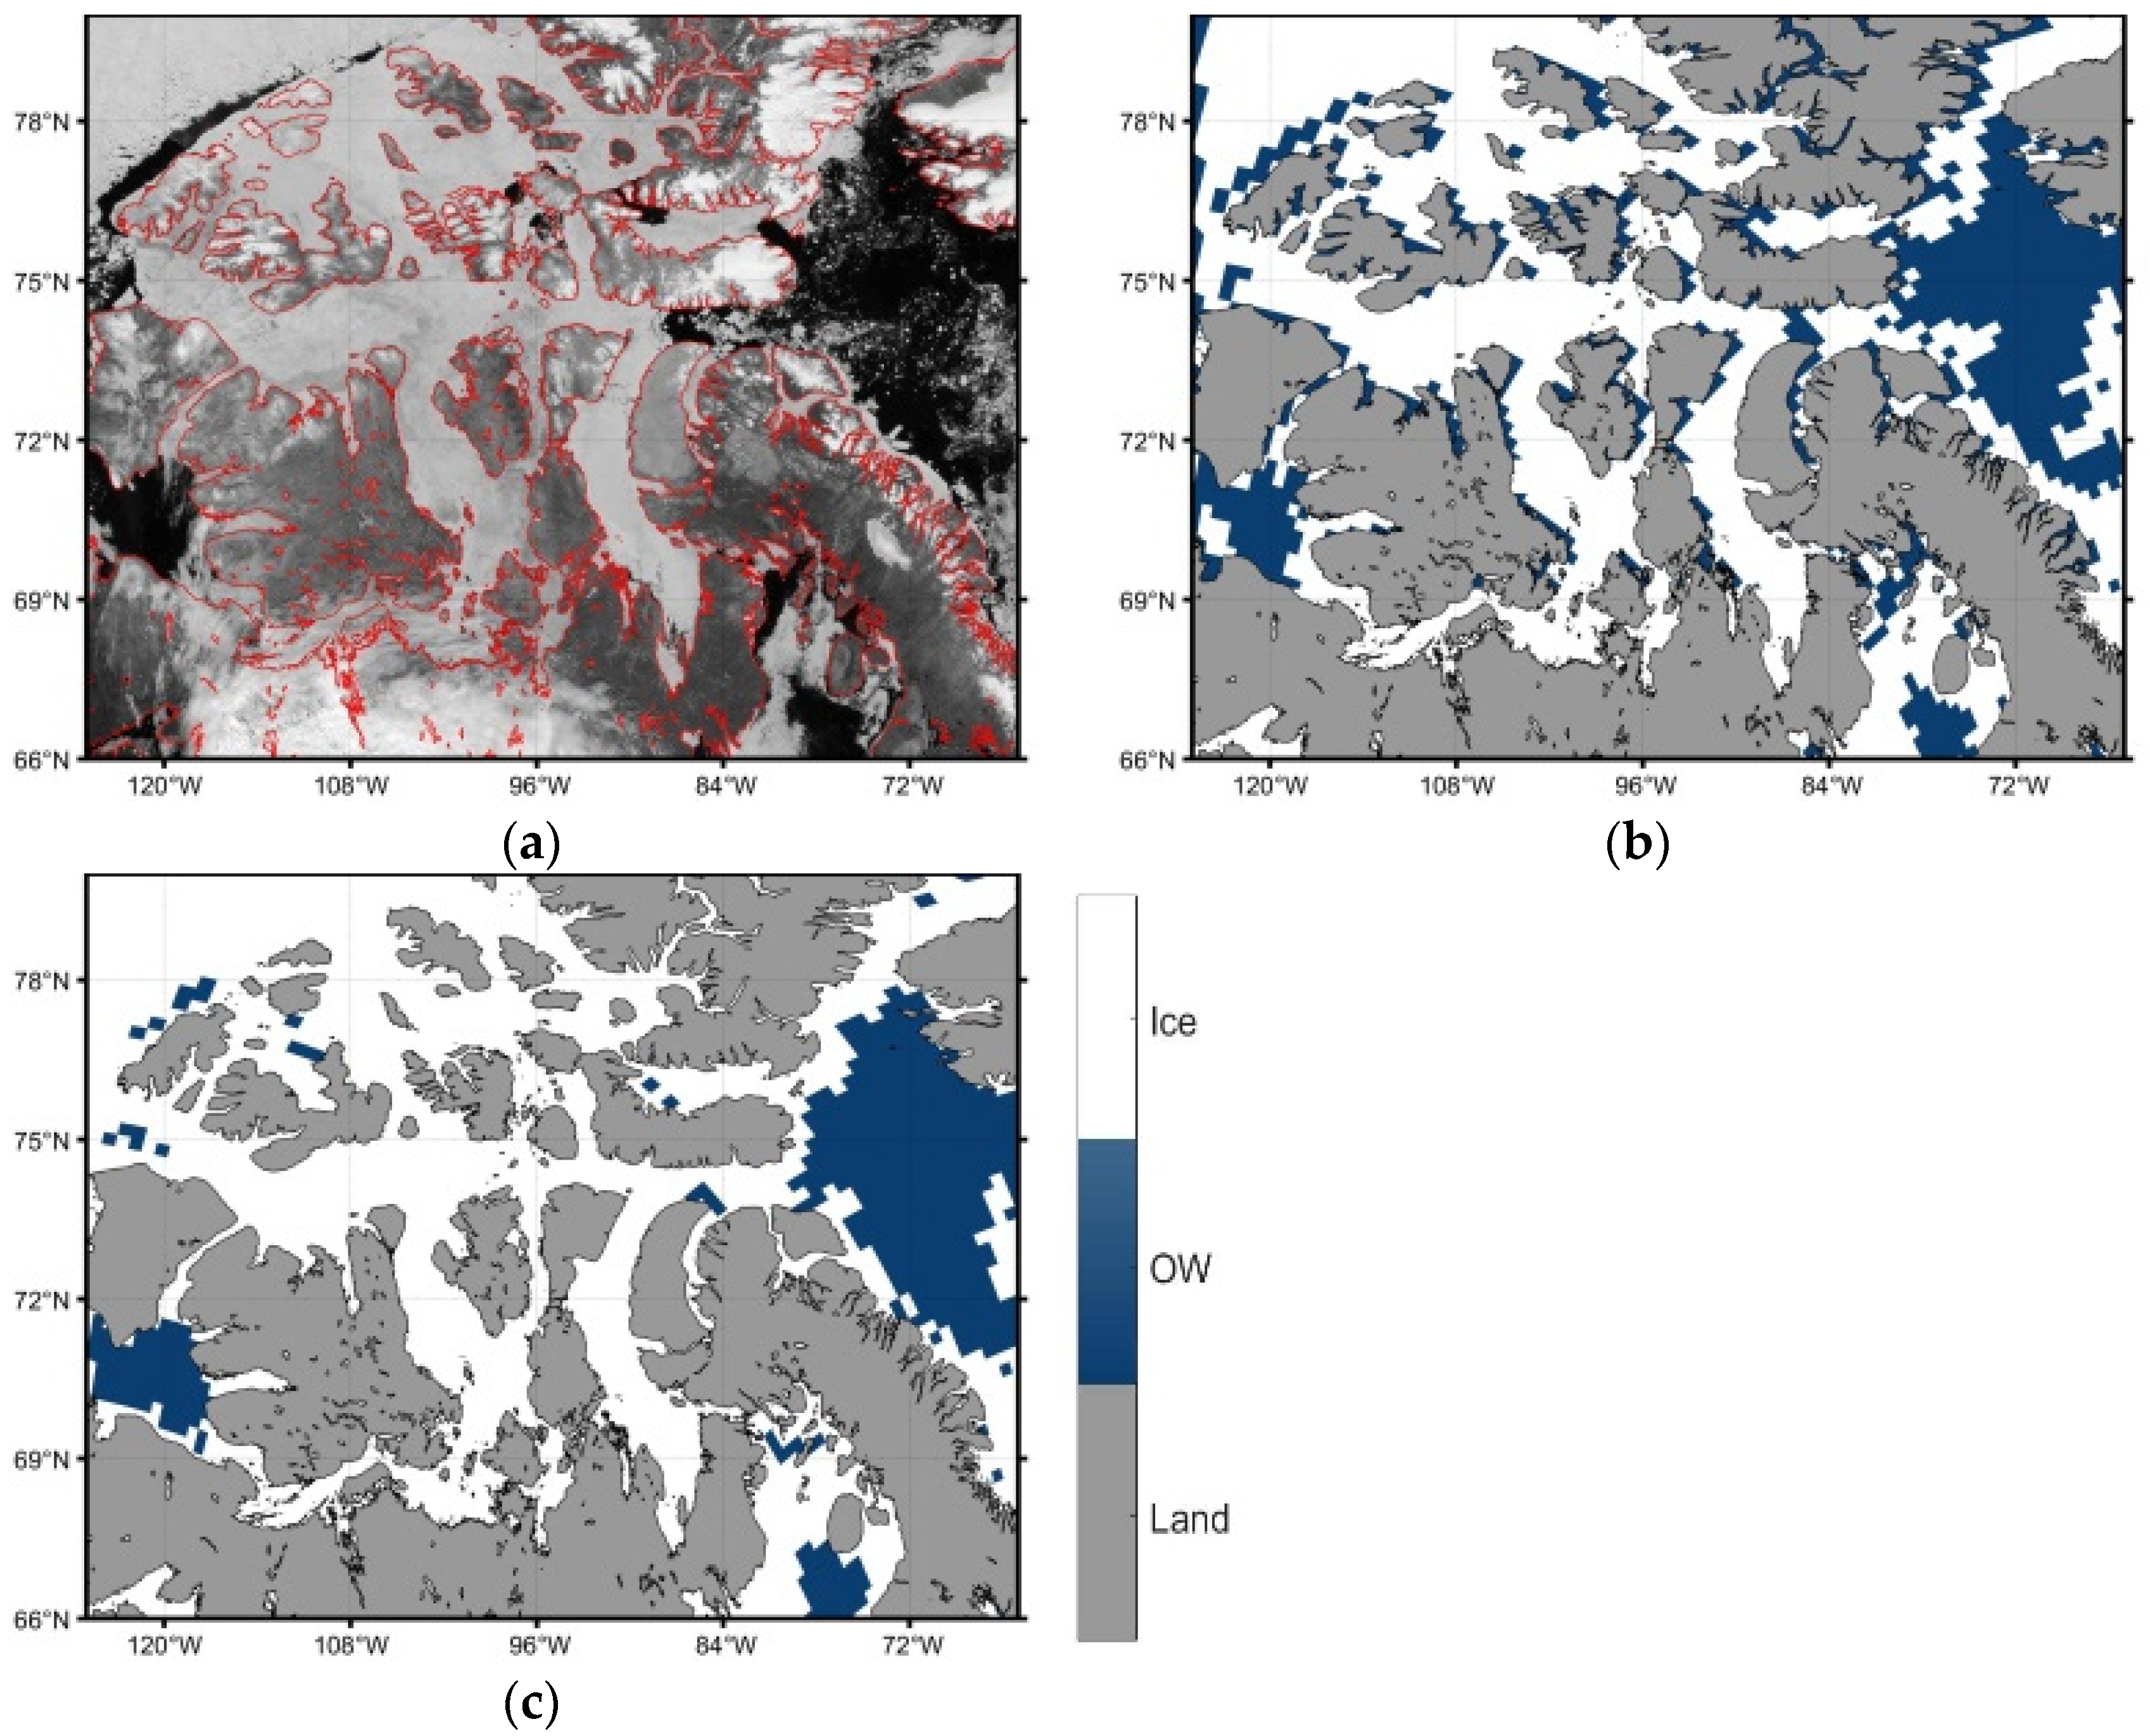
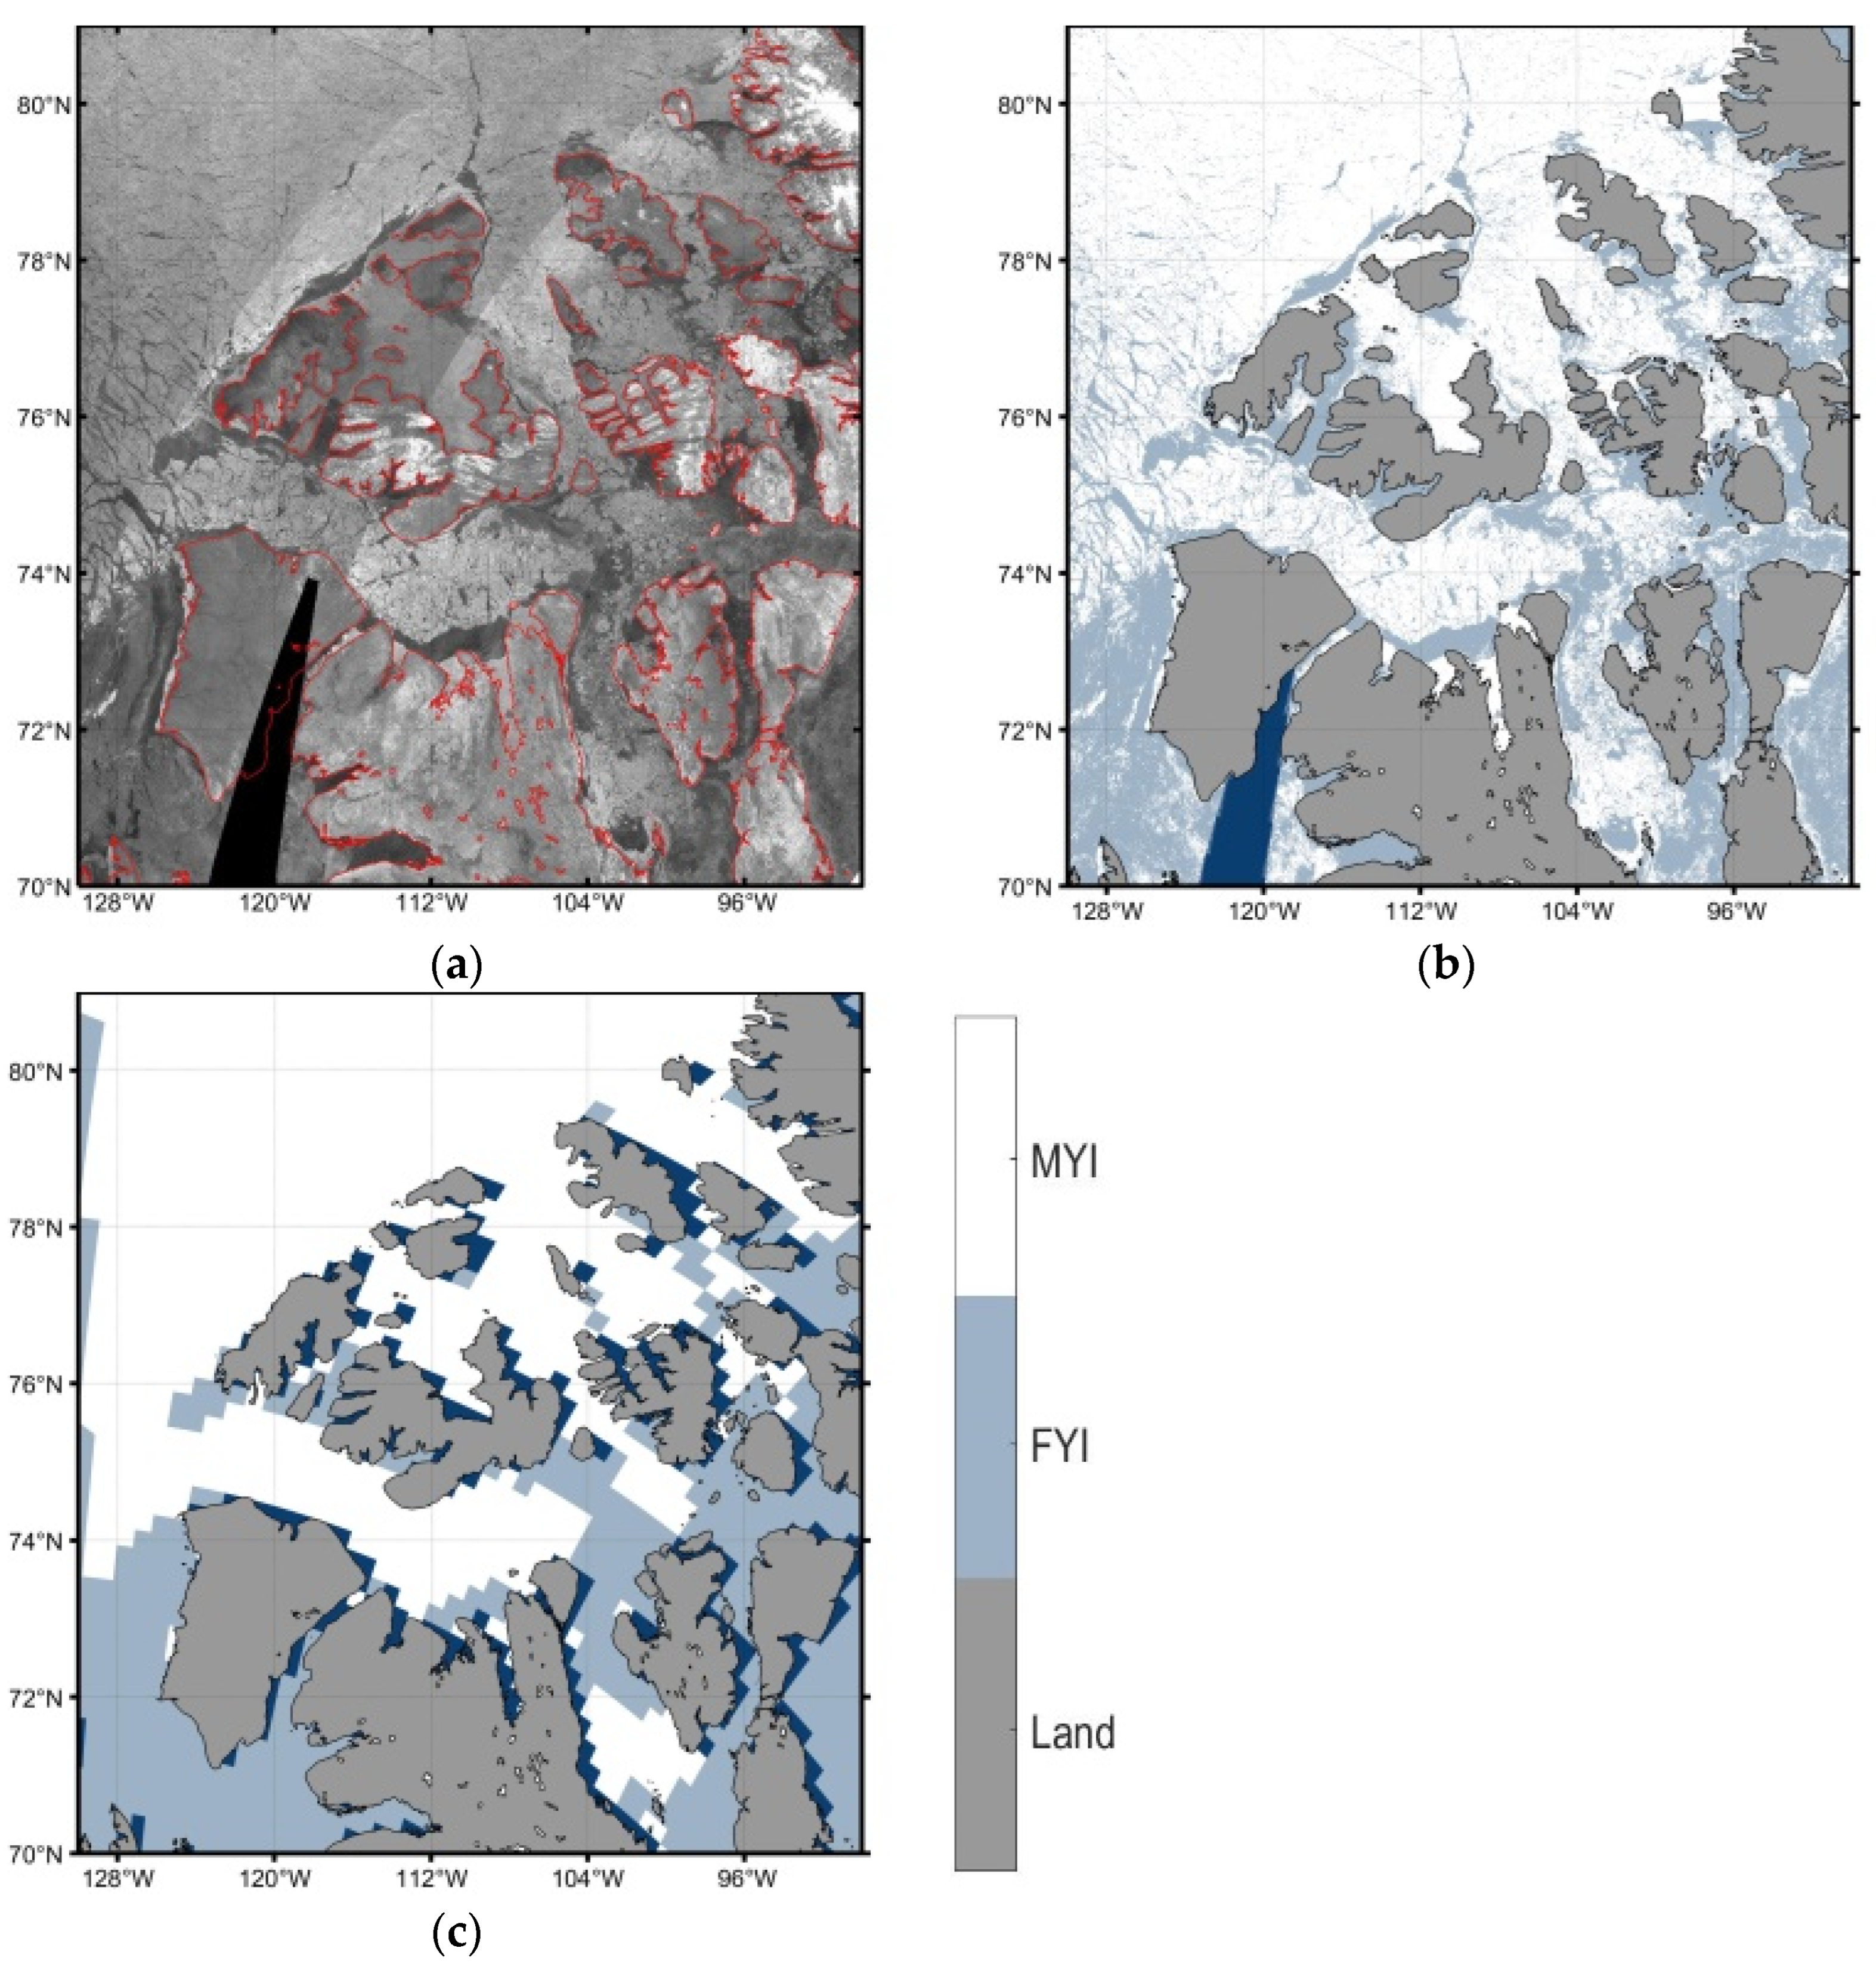
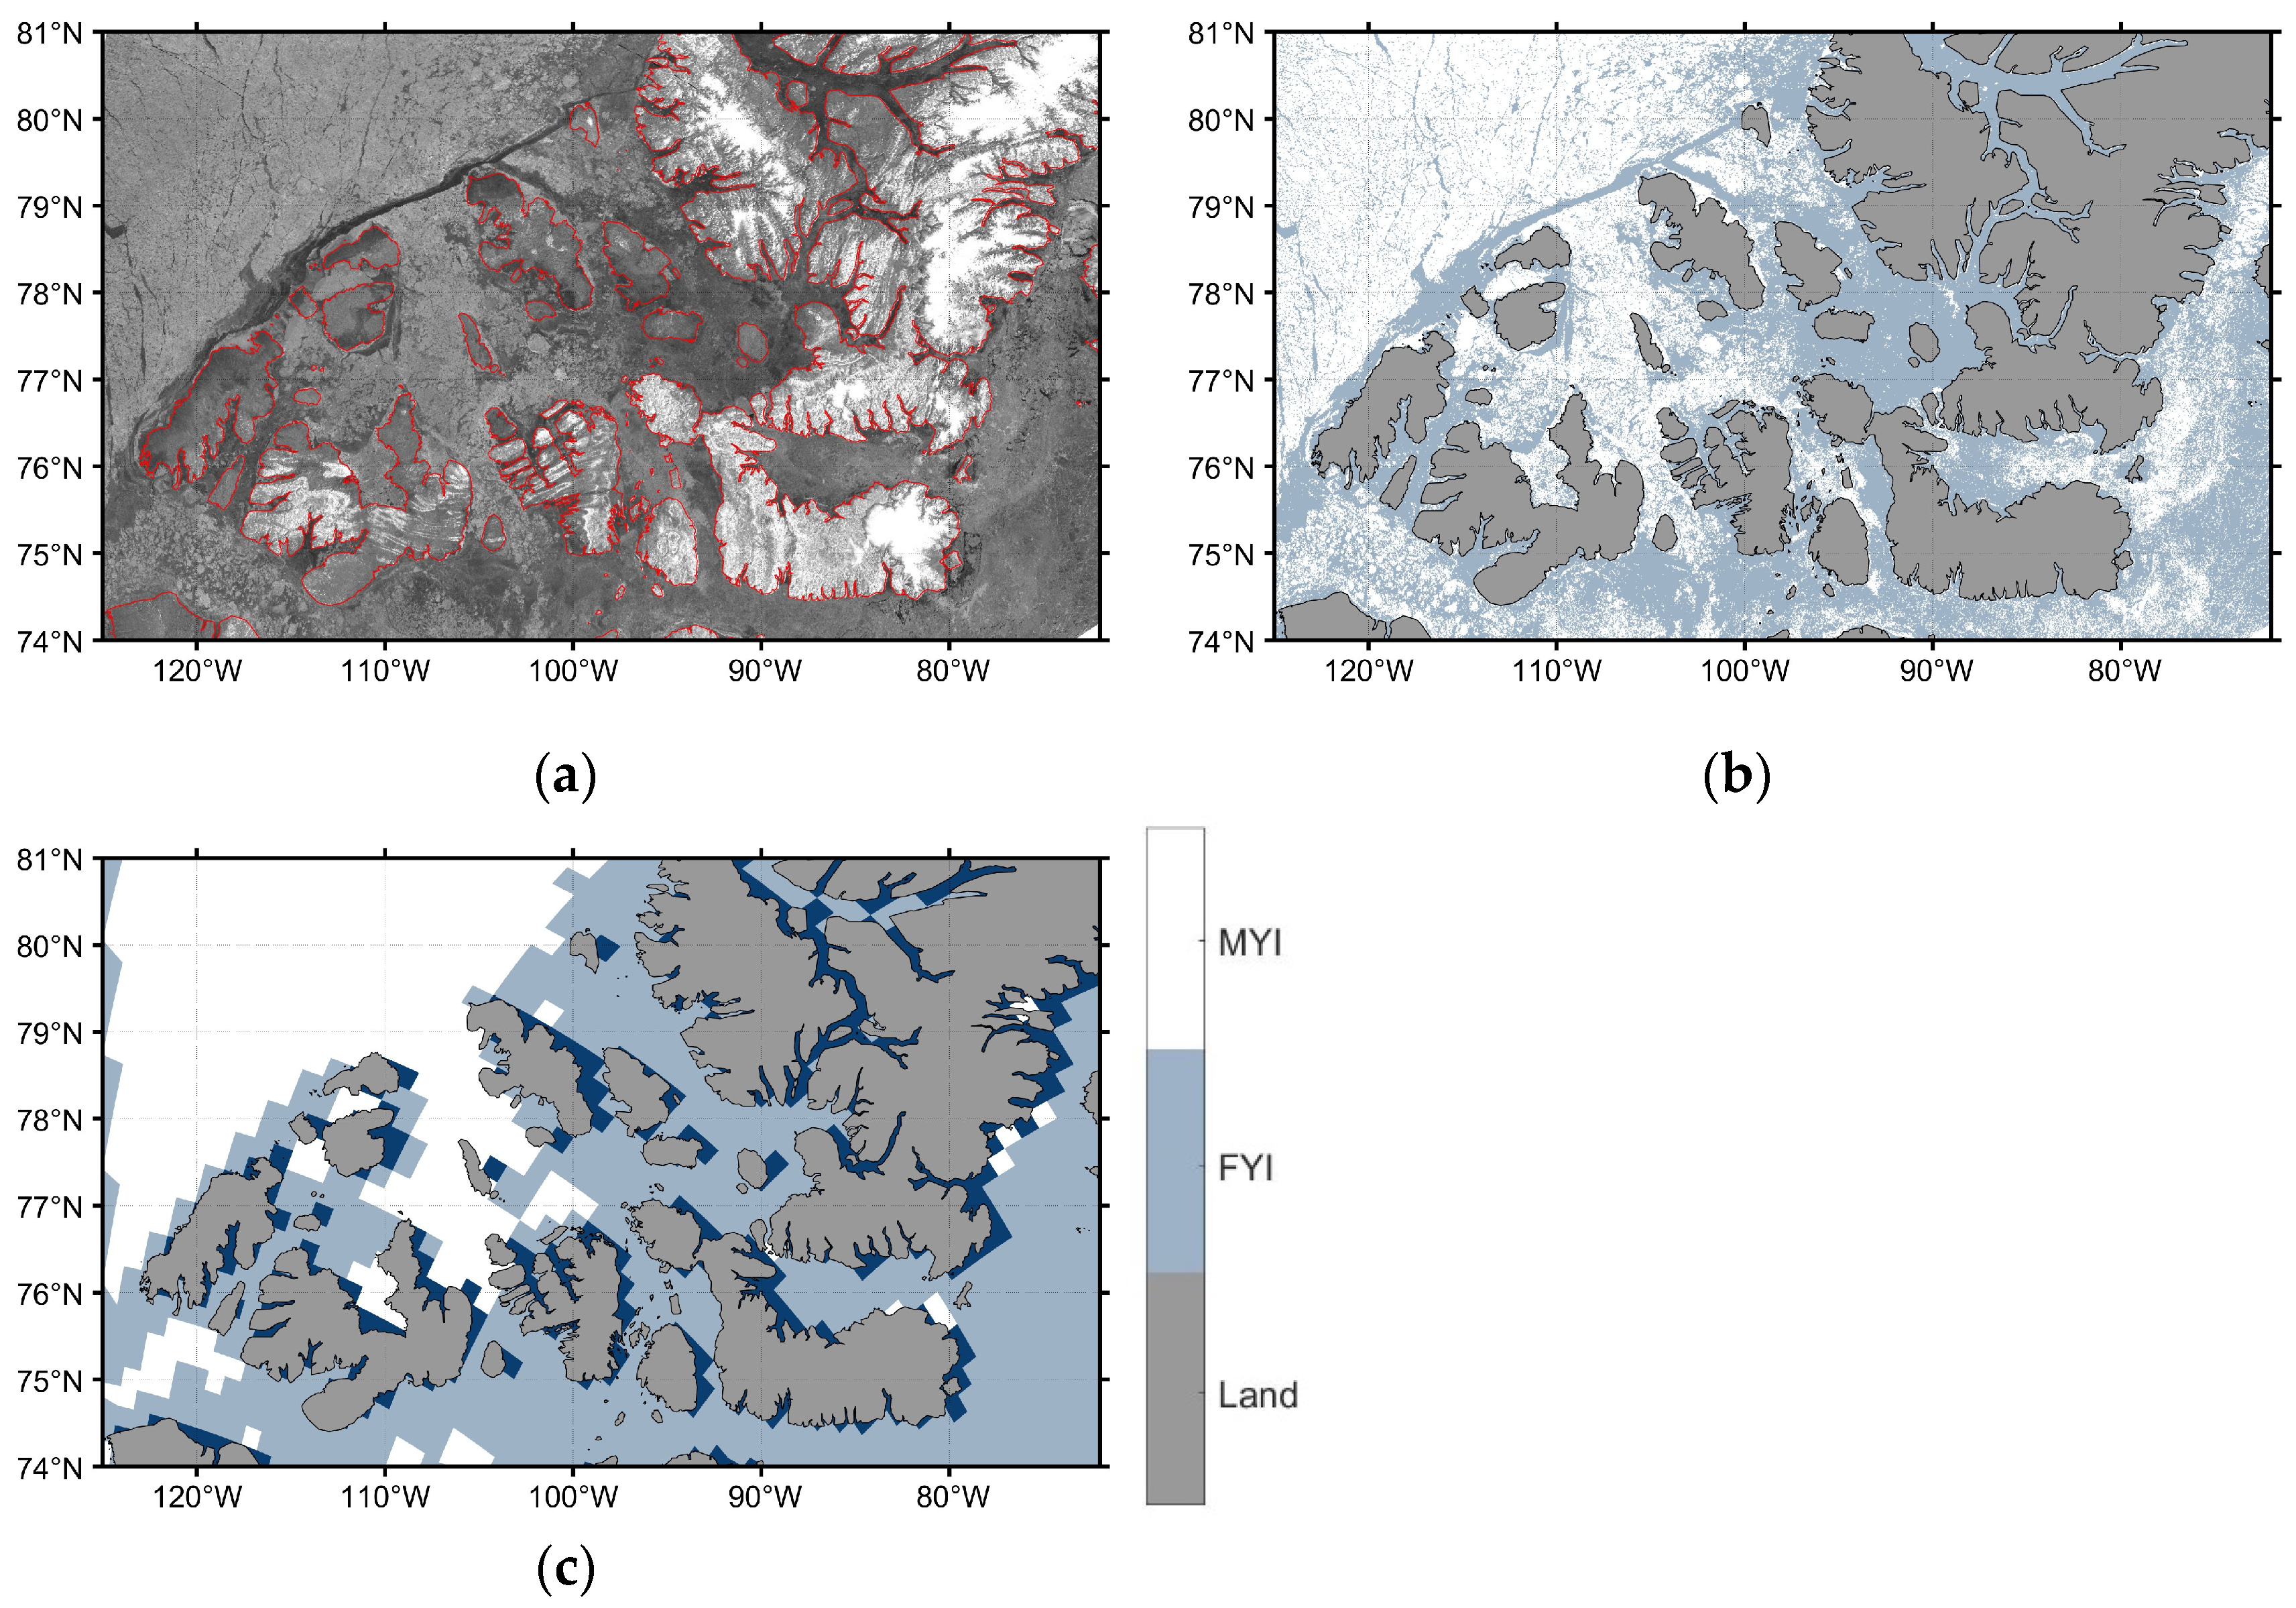
5.4. Assessment of Ice-Type Discrimination Results with SAR Images
6. Conclusions
- (1)
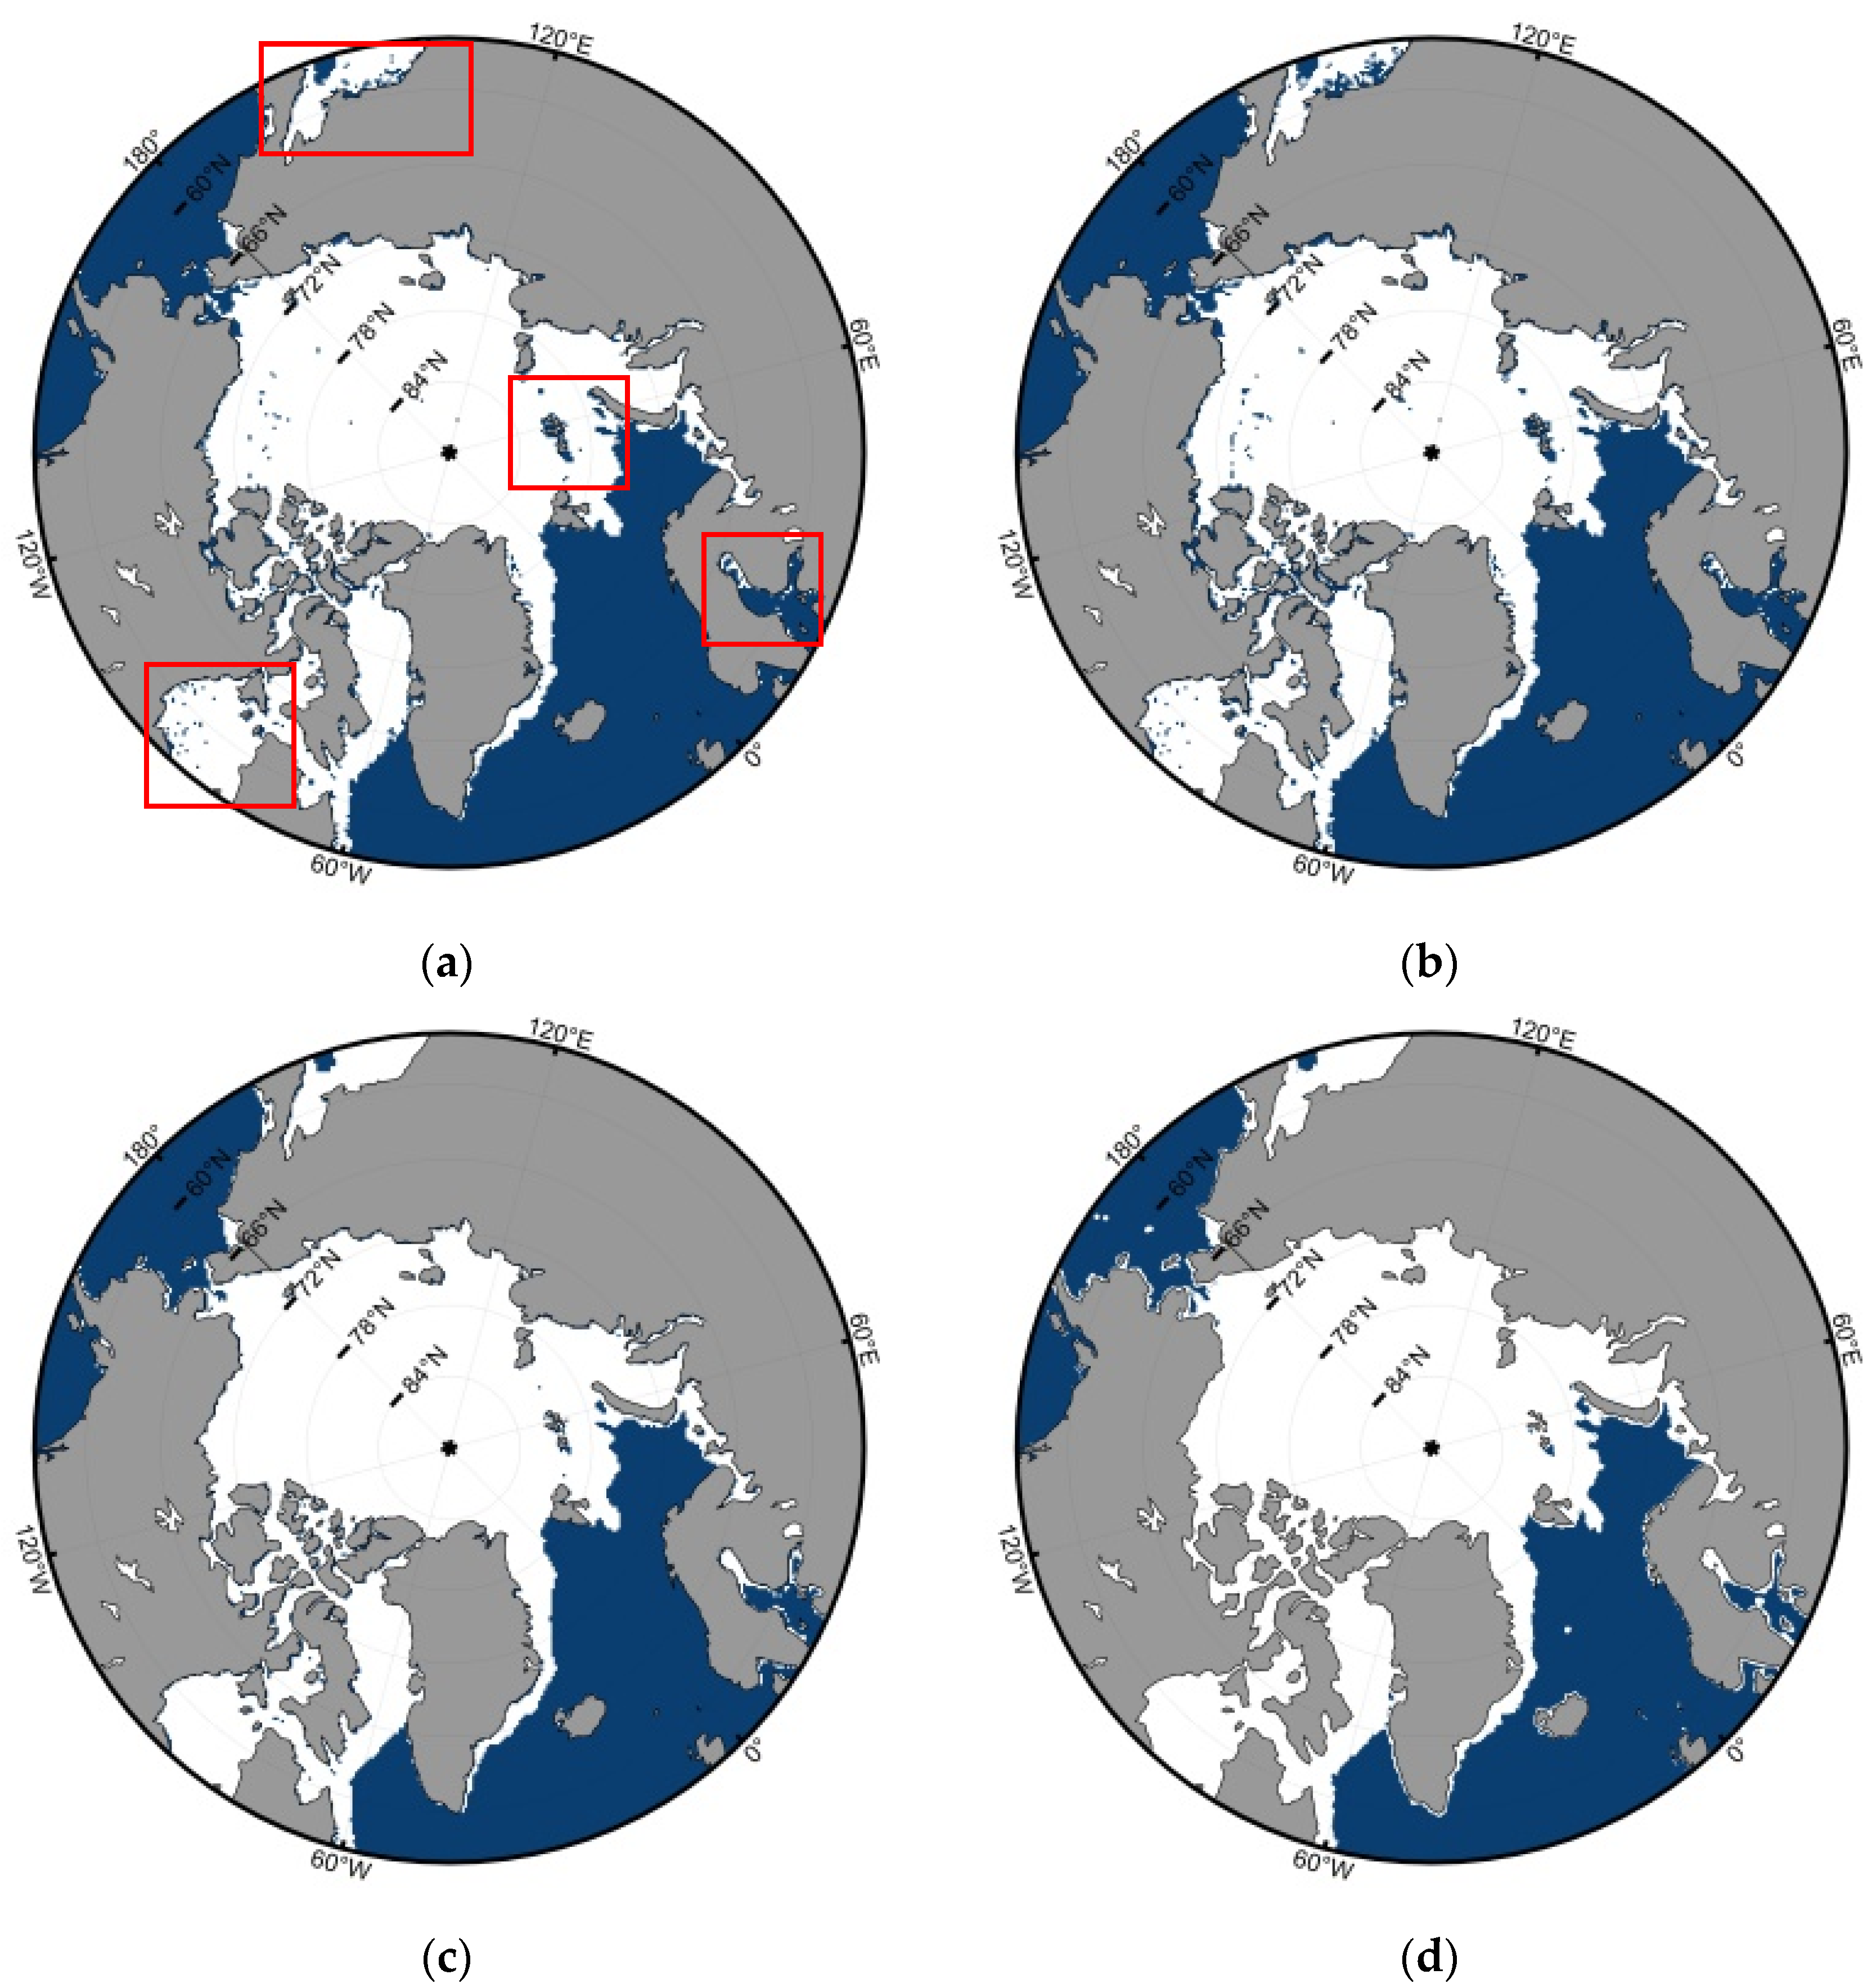
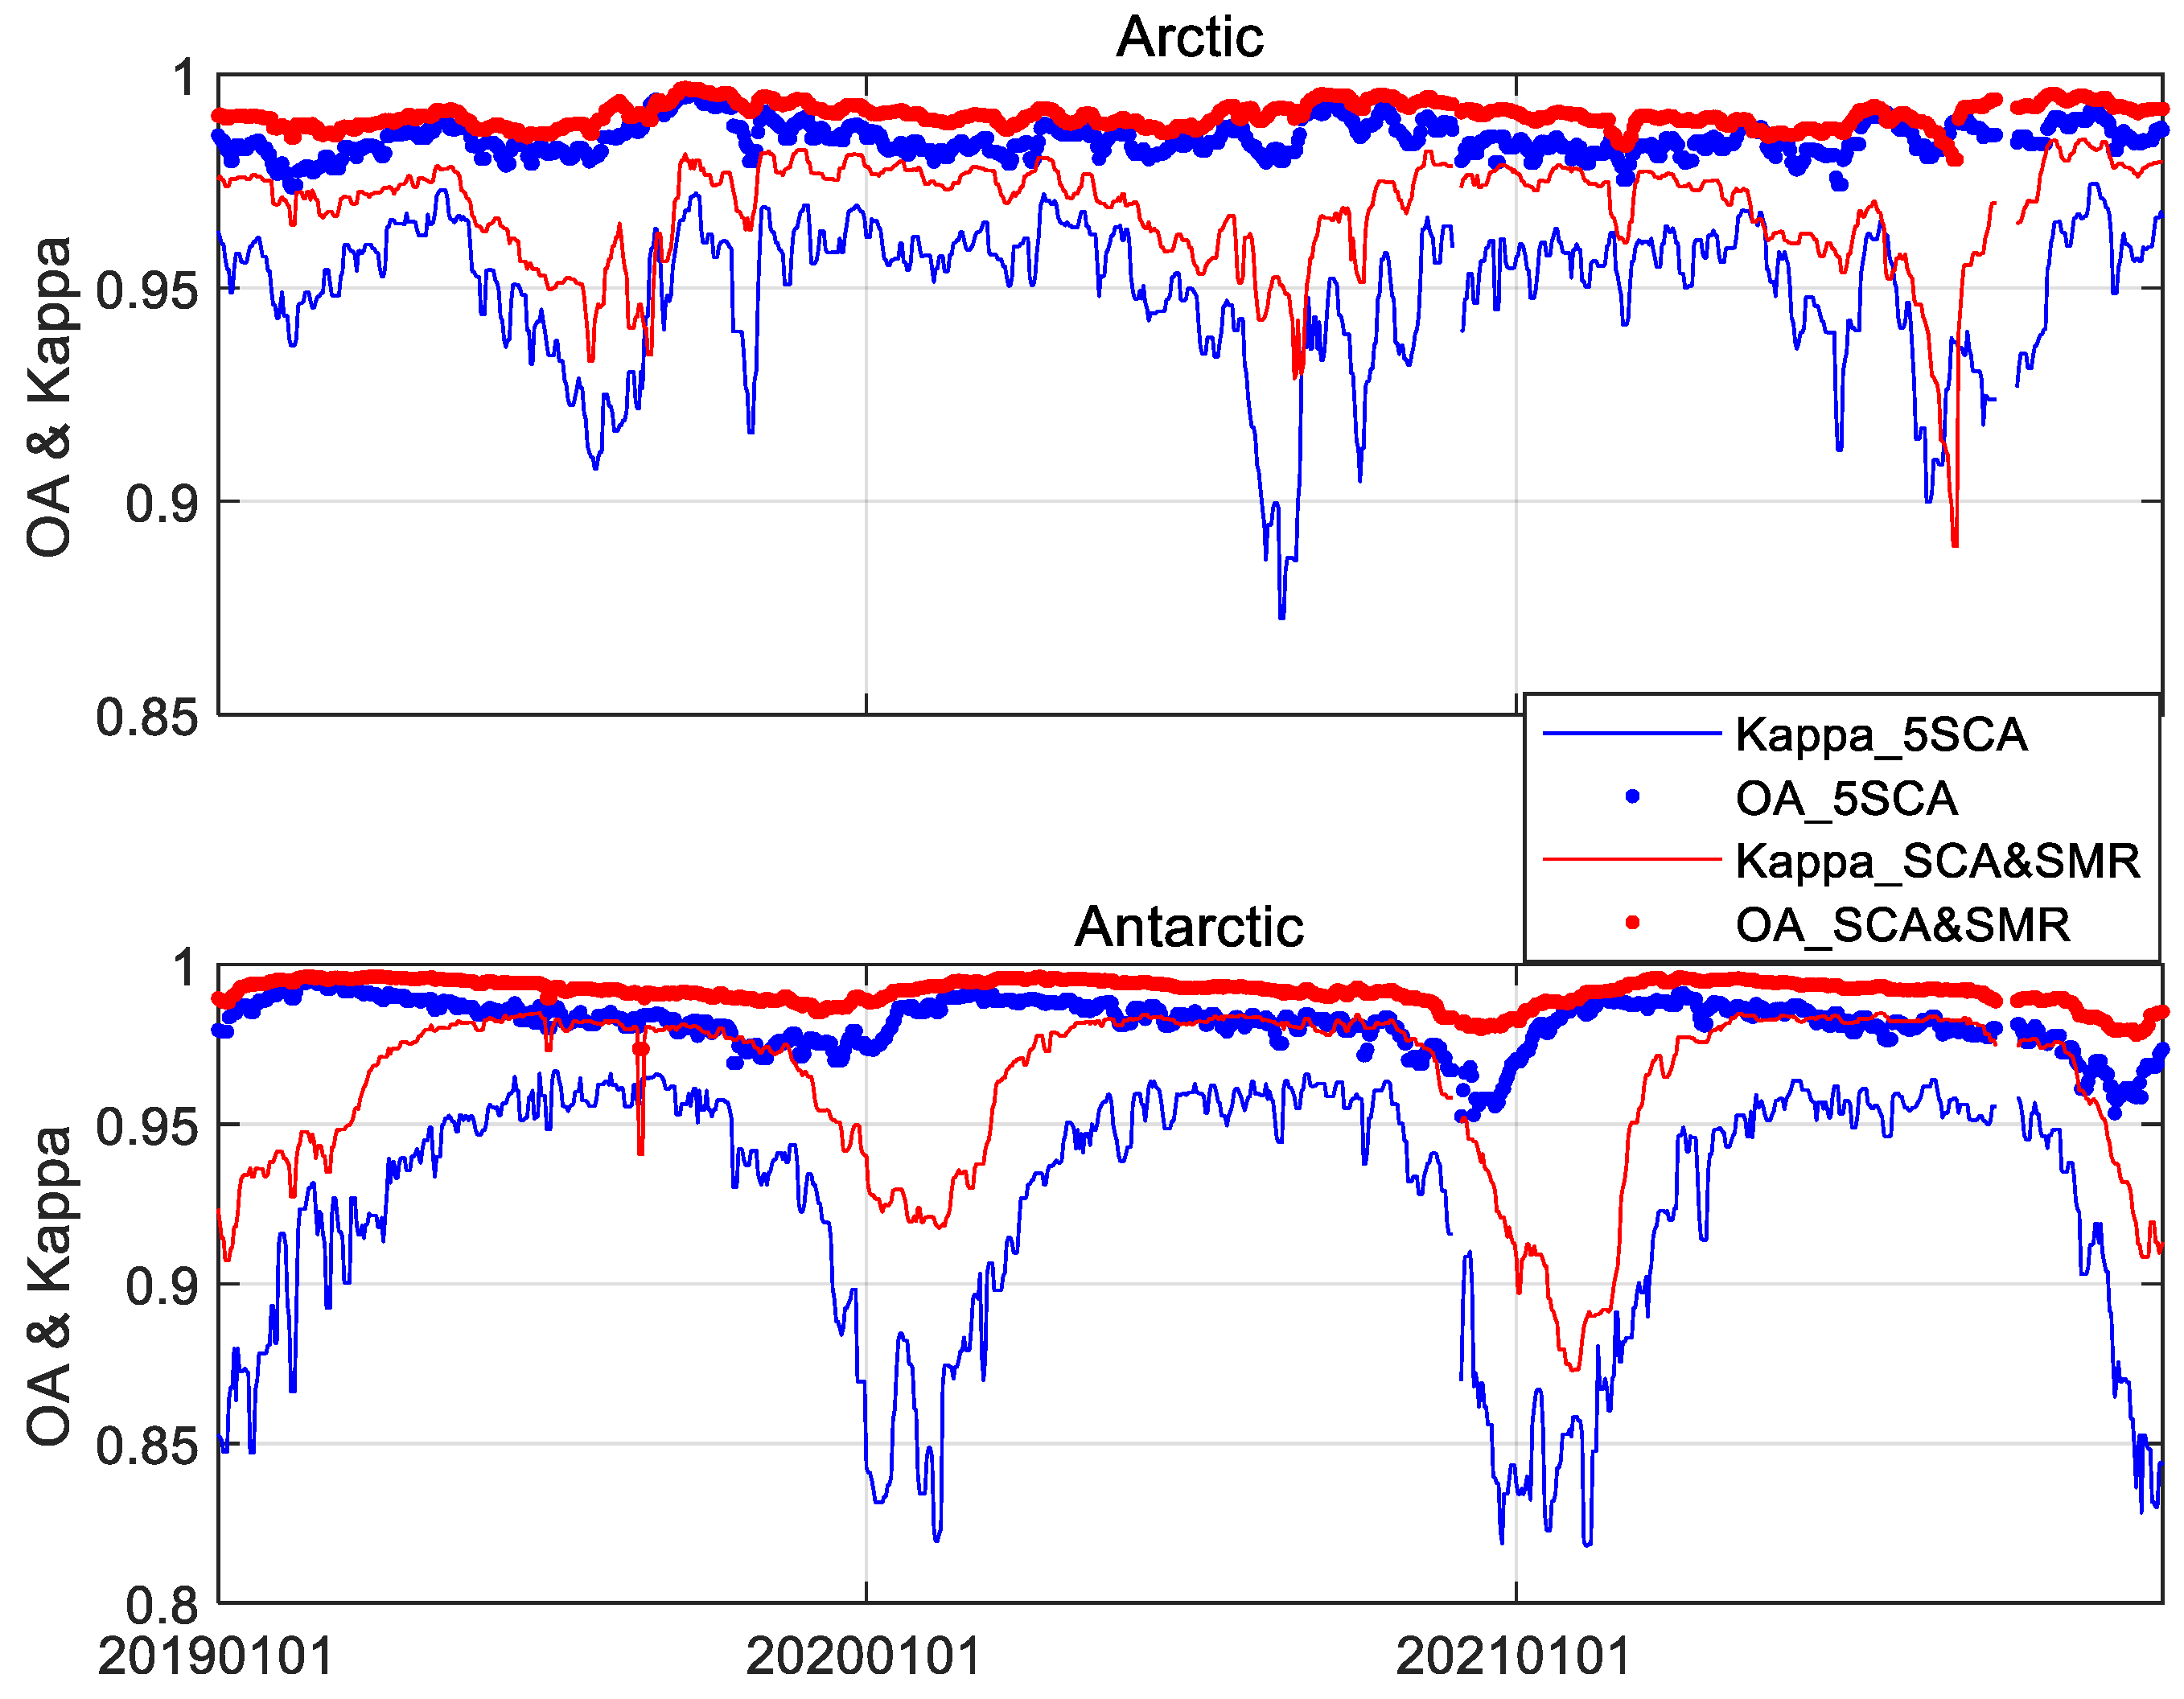
- In this study, the classification distance and correlation coefficient were used to select the scattering parameters of SCA and the microwave radiation parameters of SMR suitable for ice water discrimination and sea ice type discrimination, which reduces the redundancy of the input data. At the same time, including SMR brightness temperature data can obtain better ice water discrimination results than SCA data alone. The sea ice extent results obtained using HY-2B products are between NSIDC 15% and NSIDC 30%, and the result of OSISAF is lower than those of the other three sea ice extents. The sea ice extent difference between HY-2B and NSIDC 15% is the smallest. The IIEE evaluation results show that the sea ice edge of HY-2B is closer to the sea ice edge of OSISAF than that of NSIDC. Using 3 years of the OSISAF sea ice edge product as reference data, the averaged OA of the HY-2B ice water discrimination results of the Arctic and Antarctic is better than 99%. Compared with the results of MODIS ice water recognition, the overall accuracy is up to 96%.
- (2)
- The results of the Arctic MYI extent agree with the OSISAF sea ice type products. Using the 3-year OSISAF product as the reference data, the OA of the HY-2B sea ice type results is approximately 97%. Using the results of SAR sea ice type recognition to evaluate the same results of this study, the overall accuracy is better than 86%. The recognition method of FYI/MYI needs to be further studied to improve the stability and classification accuracy. The detailed comparison of sea ice type classification results over some local areas, e.g., the north marine area of Greenland, will be analyzed with long time-series products of HY-2B and OSISAF.
Author Contributions
Funding
Data Availability Statement
Acknowledgments
Conflicts of Interest
References
- Meredith, M.; Cassotta, S. Polar Regions. In IPCC Special Report on the Ocean and Cryosphere in a Changing Climate; Pörtner, H.-O., Roberts, D.C., Masson-Delmotte, V., Zhai, P., Tignor, M., Poloczanska, E., Mintenbeck, K., Alegría, A., Nicolai, M., Okem, A., et al., Eds.; Cambridge University Press: Cambridge, UK, 2022; pp. 203–320. [Google Scholar]
- Comiso, J.C.; Meier, W.N.; Gersten, R. Variability and trends in the Arctic Sea ice cover: Results from different techniques. J. Geophys. Res. Oceans 2017, 122, 6883–6900. [Google Scholar] [CrossRef]
- Onarheim, I.H.; Eldevik, T.; Smedsrud, L.H.; Stroeve, J.C. Seasonal and Regional Manifestation of Arctic Sea Ice Loss. J. Clim. 2018, 31, 4917–4932. [Google Scholar] [CrossRef]
- Ludescher, J.; Yuan, N.; Bunde, A. Detecting the statistical significance of the trends in the Antarctic sea ice extent: An indication for a turning point. Clim. Dyn. 2019, 53, 237–244. [Google Scholar] [CrossRef]
- Turner, J.; Phillips, T.; Marshall, G.J.; Hosking, J.S.; Pope, J.O.; Bracegirdle, T.J.; Deb, P. Unprecedented springtime retreat of Antarctic sea ice in 2016. Geophys. Res. Lett. 2017, 44, 6868–6875. [Google Scholar] [CrossRef]
- Kusahara, K.; Reid, P.; Williams, G.D.; Massom, R.; Hasumi, H. An ocean-sea ice model study of the unprecedented Antarctic sea ice minimum in 2016. Environ. Res. Lett. 2018, 13, 084020. [Google Scholar] [CrossRef]
- Rivas, M.B.; Otosaka, I.; Stoffelen, A.; Verhoef, A. A scatterometer record of sea ice extents and backscatter: 1992–2016. Cryosphere 2018, 12, 2941–2953. [Google Scholar] [CrossRef]
- Zhang, Z.; Yu, Y.; Li, X.; Hui, F.; Cheng, X.; Chen, Z. Arctic sea ice classification using microwave scatterometer and radiometer data during 2002–2017. IEEE Trans. Geosci. Remote Sens. 2019, 57, 5319–5328. [Google Scholar] [CrossRef]
- Onstott, R.G. SAR and Scatterometer Signatures of Sea Ice. In Microwave Remote Sensing of Sea Ice; Geophysical Monograph Series; American Geophysical Union: Washington, DC, USA, 1992; pp. 73–104. [Google Scholar] [CrossRef]
- Sinha, N.K.; Shokr, M. Sea Ice: Physics and Remote Sensing, 1st ed.; John Wiley & Sons: Hoboken, NJ, USA, 2015; pp. 412–424. [Google Scholar]
- Remund, Q.; Long, D. Automated Antarctic ice edge detection using NSCAT data. IGARSS′97. In Proceedings of the 1997 IEEE International Geoscience and Remote Sensing, Remote Sensing—A Scientific Vision for Sustainable Development, Singapore, 3–8 August 1997; pp. 1841–1843. [Google Scholar]
- Remund, Q.P.; Long, D.G. Sea ice extent mapping using Ku band scatterometer data. J. Geophys. Res. Oceans 1999, 104, 11515–11527. [Google Scholar] [CrossRef]
- Otosaka, I.; Rivas, M.B.; Stoffelen, A. bayesian sea ice detection with the ERS scatterometer and sea ice backscatter model at C-band. IEEE Trans. Geosci. Remote Sens. 2018, 56, 2248–2254. [Google Scholar] [CrossRef]
- Rivas, M.B.; Stoffelen, A. New bayesian algorithm for sea ice detection with QuikSCAT. IEEE Trans. Geosci. Remote Sens. 2011, 49, 1894–1901. [Google Scholar] [CrossRef]
- Rivas, M.B.; Verspeek, J.; Verhoef, A.; Stoffelen, A. Bayesian sea ice detection with the advanced scatterometer ASCAT. IEEE Trans. Geosci. Remote Sens. 2012, 50, 2649–2657. [Google Scholar] [CrossRef]
- Li, M.; Zhao, C.; Zhao, Y.; Wang, Z.; Shi, L. Polar sea ice monitoring using HY-2A scatterometer measurements. Remote Sens. 2016, 8, 688. [Google Scholar] [CrossRef]
- Shi, L.; Li, M.; Zhao, C.; Wang, Z.; Shi, Y.; Zou, J.; Zeng, T. Sea ice extent retrieval with HY-2A scatterometer data and its assessment. Acta Oceanol. Sin. 2017, 36, 76–83. [Google Scholar] [CrossRef]
- Brath, M.; Kern, S.; Stammer, D. Sea ice classification during freeze-up conditions with multifrequency scatterometer data. IEEE Trans. Geosci. Remote Sens. 2013, 51, 3336–3353. [Google Scholar] [CrossRef]
- Swan, A.M.; Long, D.G. Multiyear arctic sea ice classification using QuikSCAT. IEEE Trans. Geosci. Remote Sens. 2012, 50, 3317–3326. [Google Scholar] [CrossRef]
- Lindell, D.B.; Long, D.G. Multiyear Arctic sea ice classification using OSCAT and QuikSCAT. IEEE Trans. Geosci. Remote Sens. 2016, 54, 167–175. [Google Scholar] [CrossRef]
- Lindell, D.B.; Long, D.G. Multiyear Arctic ice classification using ASCAT and SSMIS. Remote Sens. 2016, 8, 294. [Google Scholar] [CrossRef]
- Zhang, Z.; Yu, Y.; Shokr, M.; Li, X.; Ye, Y.; Cheng, X.; Chen, Z.; Hui, F. Intercomparison of Arctic sea ice backscatter and ice type classification using Ku-band and C-band scatterometers. IEEE Trans. Geosci. Remote Sens. 2021, 60, 4301718. [Google Scholar] [CrossRef]
- Nghiem, S.; Rigor, I.; Clemente-Colón, P.; Neumann, G.; Li, P. Geophysical constraints on the Antarctic sea ice cover. Remote Sens. Environ. 2016, 181, 281–292. [Google Scholar] [CrossRef]
- Jia, Y.; Yang, J.; Lin, M.; Zhang, Y.; Ma, C.; Fan, C. Global assessments of the HY-2B measurements and cross-calibrations with Jason-3. Remote Sens. 2020, 12, 2470. [Google Scholar] [CrossRef]
- HY-2B. Available online: http://www.nsoas.org.cn/news/content/2018-11/23/44_697.html (accessed on 1 February 2022).
- Pearson, F. Map Projections: Theory and Applications; CRC Press: Boca Raton, FL, USA, 1990. [Google Scholar]
- Snyder, J.P. Map Projections—A Working Manual; US Government Printing Office: Washington, DC, USA, 1987. [Google Scholar]
- Nghiem, S.; Bertoia, C. Study of Multi-Polarization C-Band Backscatter Signatures for Arctic Sea Ice Mapping with Future Satellite SAR. Can. J. Remote Sens. 2001, 27, 387–402. [Google Scholar] [CrossRef]
- Cavalieri, D.J.; Parkinson, C.L.; Gloersen, P.; Zwally, H.J. Sea Ice Concentrations from Nimbus-7 SMMR and DMSP SSM/I-SSMIS Passive Microwave Data, Version 1; NASA National Snow and Ice Data Center Distributed Active Archive Center: Boulder, CO, USA, 1996. [Google Scholar]
- Global Sea Ice Edge. Available online: https://osi-saf.eumetsat.int/products/osi-402-d (accessed on 10 May 2022).
- Global Sea Ice Type. Available online: https://osi-saf.eumetsat.int/products/osi-403-d (accessed on 10 May 2022).
- Available online: https://worldview.earthdata.nasa.gov/ (accessed on 10 May 2022).
- Available online: http://www.seaice.dk (accessed on 10 May 2022).
- Breivik, L.-A.; Eastwood, S.; Lavergne, T. Use of C-Band Scatterometer for Sea Ice Edge Identification. IEEE Trans. Geosci. Remote Sens. 2012, 50, 2669–2677. [Google Scholar] [CrossRef]
- Maulik, U.; Chakraborty, D. Remote Sensing Image Classification: A survey of support-vector-machine-based advanced techniques. IEEE Geosci. Remote Sens. Mag. 2017, 5, 33–52. [Google Scholar] [CrossRef]
- Aaboe, S.; Down, E.; Eastwood, S. Algorithm Theoretical Basis Document for the Global Sea-Ice Edge and Type, v3.4. In SAF/OSI/CDOP3/MET-Norway/TEC/MA/379; EUMETSAT OSISAF—Ocean and Sea Ice Satellite Application Facility: Darmstadt, Germany, 2021. [Google Scholar]
- Available online: https://www.mathworks.com/help/stats/fitcsvm.html (accessed on 10 January 2023).
- Goessling, H.F.; Tietsche, S.; Day, J.J.; Hawkins, E.; Jung, T. Predictability of the Arctic sea ice edge. Geophys. Res. Lett. 2016, 43, 1642–1650. [Google Scholar] [CrossRef]
- Zampieri, L.; Goessling, H.F.; Jung, T. Bright prospects for arctic sea ice prediction on subseasonal time scales. Geophys. Res. Lett. 2018, 45, 9731–9738. [Google Scholar] [CrossRef]










| Sensor Name | SCA | SMR | ||||
|---|---|---|---|---|---|---|
| Frequency (GHz) | 13.256 | 6.925 | 10.7 | 18.7 | 23.8 | 37.0 |
| Polarization | HH, VV | V, H | V, H | V, H | V | V, H |
| Spatial resolution (km) | 25 | 90 × 150 | 70 × 110 | 36 × 60 | 30 × 52 | 20 × 35 |
| Swath width | 1350 km for HH 1700 km for VV | 1600 km | ||||
| Incidence angle | 41° for HH 48° for VV | 53° | ||||
| NSIDC 15% | NSIDC 30% | OSISAF | ||
|---|---|---|---|---|
| Arctic | Bias (106 km2) | −0.19 | 0.35 | 1.76 |
| Standard Deviation (106 km2) | 0.14 | 0.16 | 0.77 | |
| Antarctic | Bias (106 km2) | −0.16 | 0.49 | 0.6 |
| Standard Deviation (106 km2) | 0.13 | 0.21 | 0.2 | |
| OA | Kappa | UA_OW | UA_Ice | PA_OW | PA_Ice | |
|---|---|---|---|---|---|---|
| Arctic | 99.02% | 0.967 | 99.47% | 97.36% | 99.28% | 97.38% |
| Antarctic | 99.13% | 0.963 | 99.49% | 97.16% | 99.37% | 96.63% |
| HY-2B | |||||
|---|---|---|---|---|---|
| Water | Ice | Total | PA | ||
| MODIS | Water | 370 | 70 | 440 | 84.09% |
| Ice | 123 | 1592 | 1715 | 92.83% | |
| Total | 493 | 1662 | 2155 | ||
| UA | 75.05% | 95.79% | |||
| OA: 91.04% | Kappa coefficient: 0.736 | ||||
| HY-2B | |||||
|---|---|---|---|---|---|
| Water | Ice | Total | PA | ||
| MODIS | Water | 194 | 34 | 228 | 85.09% |
| Ice | 82 | 582 | 664 | 87.65% | |
| Total | 276 | 616 | 892 | ||
| UA | 70.29% | 94.48% | |||
| OA: 87.00% | Kappa coefficient: 0.680 | ||||
| HY-2B | |||||
|---|---|---|---|---|---|
| FYI | MYI | Total | PA | ||
| SAR | FYI | 965 | 121 | 1086 | 88.86% |
| MYI | 220 | 1282 | 1502 | 85.35% | |
| Total | 1185 | 1403 | 2588 | ||
| UA | 81.43% | 91.38% | |||
| OA: 86.82% | Kappa coefficient: 0.733 | ||||
| HY-2B | |||||
|---|---|---|---|---|---|
| FYI | MYI | Total | PA | ||
| SAR | FYI | 1275 | 138 | 1413 | 90.23% |
| MYI | 166 | 949 | 1115 | 85.11% | |
| Total | 1441 | 1087 | 2528 | ||
| UA | 88.48% | 87.30% | |||
| OA: 87.98% | Kappa coefficient: 0.755 | ||||
Disclaimer/Publisher’s Note: The statements, opinions and data contained in all publications are solely those of the individual author(s) and contributor(s) and not of MDPI and/or the editor(s). MDPI and/or the editor(s) disclaim responsibility for any injury to people or property resulting from any ideas, methods, instructions or products referred to in the content. |
© 2024 by the authors. Licensee MDPI, Basel, Switzerland. This article is an open access article distributed under the terms and conditions of the Creative Commons Attribution (CC BY) license (https://creativecommons.org/licenses/by/4.0/).
Share and Cite
Zeng, T.; Shi, L.; Shi, Y.; Lu, D.; Wang, Q. Polar Sea Ice Monitoring Using HY-2B Satellite Scatterometer and Scanning Microwave Radiometer Measurements. Remote Sens. 2024, 16, 2486. https://doi.org/10.3390/rs16132486
Zeng T, Shi L, Shi Y, Lu D, Wang Q. Polar Sea Ice Monitoring Using HY-2B Satellite Scatterometer and Scanning Microwave Radiometer Measurements. Remote Sensing. 2024; 16(13):2486. https://doi.org/10.3390/rs16132486
Chicago/Turabian StyleZeng, Tao, Lijian Shi, Yingni Shi, Dunwang Lu, and Qimao Wang. 2024. "Polar Sea Ice Monitoring Using HY-2B Satellite Scatterometer and Scanning Microwave Radiometer Measurements" Remote Sensing 16, no. 13: 2486. https://doi.org/10.3390/rs16132486
APA StyleZeng, T., Shi, L., Shi, Y., Lu, D., & Wang, Q. (2024). Polar Sea Ice Monitoring Using HY-2B Satellite Scatterometer and Scanning Microwave Radiometer Measurements. Remote Sensing, 16(13), 2486. https://doi.org/10.3390/rs16132486


