Abstract
The accurate prediction of landslide susceptibility relies on effectively handling landslide absence samples in machine learning (ML) models. However, existing research tends to generate these samples in feature space, posing challenges in field validation, or using physics-informed models, thereby limiting their applicability. The rapid progress of interferometric synthetic aperture radar (InSAR) technology may bridge this gap by offering satellite images with extensive area coverage and precise surface deformation measurements at millimeter scales. Here, we propose an InSAR-based sampling strategy to generate absence samples for landslide susceptibility mapping in the Badong–Zigui area near the Three Gorges Reservoir, China. We achieve this by employing a Small Baseline Subset (SBAS) InSAR to generate the annual average ground deformation. Subsequently, we select absence samples from slopes with very slow deformation. Logistic regression, support vector machine, and random forest models demonstrate improvement when using InSAR-based absence samples, indicating enhanced accuracy in reflecting non-landslide conditions. Furthermore, we compare different integration methods to integrate InSAR into ML models, including absence sampling, joint training, overlay weights, and their combination, finding that utilizing all three methods simultaneously optimally improves landslide susceptibility models.
1. Introduction
Landslide susceptibility is defined as the likelihood of landslide occurrences under given geo-environmental conditions. It represents a fundamental step toward assessing landslide hazards and developing mitigation strategies, especially in mountainous areas, where geological hazards are often concealed, harmful, and ubiquitous due to the high altitude, steep terrain, and dense vegetation [1]. China has complex geological environments, with a large proportion (>65%) of mountain areas prone to landslides [2]. Seismic activities, climatic extremes, and the increasingly acute human disturbances from unplanned urban expansions and deforestation frequently occur in the mountains, triggering substantial major landslides and subsequent casualties and economic losses [3,4]. Such socioeconomic burdens have prompted a significant surge in research papers on landslide susceptibility mapping (LSM) [5]. Among these, machine learning (ML)-based LSM has gained widespread popularity due to its high performance in addressing challenges and improving accuracies for capturing the spatial locations of landslides and delineating areas prone to potential landslides [6,7].
ML-based landslide susceptibility maps are premised on the reliability of two types of samples: samples describing conditions where landslides have occurred (landslide presence data) and samples representing conditions where no landslides have been observed (landslide absence data) [8]. Landslide presence data are usually generated from landslide inventories produced by field investigations and the interpretation of aerial photos or satellite remote sensing images. Landslide absence data are sampled from areas other than those described in landslide presence data using various strategies [9]. Incorporating landslide absence data properly is crucial because it can appropriately control the expansion of high-susceptibility landslide areas [10]. Various absence sampling methods have been proposed to improve the accuracy and quality of LSM. They can be broadly classified into two types: geographic and feature-based generations [8]. Classic geographic generation methods, such as random sampling and buffer-controlled analysis, collect landside absence data from areas distant from known landslides. However, they cannot ensure that the selected areas are entirely free from landslides, since the known landslide inventory may not cover all locations where landslides have occurred. Feature-based generation assumes that future landslides are more likely to occur under environmental conditions similar to those causing past landslide events. Following this principle, landslide presence and absence data can be separated in the feature space. Target space exteriorization sampling and utilizing Mahalanobis distances are two examples of this approach [11,12]. However, the generated absence data acquired with these methods are virtual and exist only in the feature space, making field validation difficult.
Recent studies have indicated that involving physical laws and expert knowledge in ML methods enhances LSM accuracy and interpretability. Several investigations have utilized physical models to better select landslide absence samples. For instance, Wei et al. (2021) applied the TRIGRS model to convert the spatially discrete lithology information into the continuous safety factor (Fs) within a specified range and pre-selected landslide absence samples by limiting Fs [13]. Then, a convolutional neural network (CNN) model was trained using historical landslide presence samples and physics-informed landslide absence samples. They concluded that compared to the traditional CNN model, this hybrid approach performs better, enhancing CNN’s adaptability to a new study area. Liu et al. (2023) employed a Scoops 3D model for qualitative slope stability analysis, extracting landslide absence samples from areas with Fs greater than 1.5 [9,13]. The generated landslide absence samples are more rational than those derived from random sampling. However, one major drawback of physics-informed methods is that they require a deep understanding of the physical processes governing slope stability and various geotechnical parameters, such as soil depth, shear strength parameters, and groundwater configurations [9]. Obtaining such comprehensive knowledge is challenging and costly, and these limitations force researchers to rely on approximate data, which introduces uncertainties, especially in complex and regional settings. Therefore, finding a more straightforward and interpretable approach that generates landslide absence samples at larger scales is imperative.
The rapid progress of remote sensing technologies, particularly interferometric synthetic aperture radar (InSAR), presents a promising opportunity to bridge the aforementioned gap. InSAR deformation data, known for their extensive area coverage and precise surface deformation measurements at millimeter scales, can effectively capture slope activities such as ground uplift and subsidence [1,14]. This capability facilitates the identification of potential landslide-prone areas [15]. A comparative analysis between ML-based LSM and InSAR deformation results reveals spatial congruence, with higher deformation points coinciding with elevated susceptibility levels and more stable points in regions with lower susceptibility levels [16]. In this context, we may assume InSAR’s ability to distinguish between stable and unstable slopes helps select landslide absence samples. Indeed, previous studies have highlighted the enhanced accuracy of landslide susceptibility models by integrating InSAR technology. Standard integration methods based on InSAR data involve updating landslide inventories [17], cross-validating traditional LSM [16], joint training for landslide conditioning factors [18], and weighted overlays of results either through a contingency matrix [19,20] or an empirical formula [3,15]. However, there is a gap in the literature regarding the exploration of InSAR deformation data for selecting landslide absence samples.
The Three Gorges Reservoir Area (TGRA) in China is recognized as landslide-prone due to its fragile geological conditions, seasonal rainfall, and periodic reservoir filling [19]. Given that more than 5000 landslides have occurred in the TGRA, there is an urgent need for a prompt and accurate LSM assessment. The escalating volume and frequency of remote sensing data, along with advancements in computing platforms for large datasets, create opportunities to explore more accurate LSM assessments with more advanced absence sampling strategies. This study proposes an InSAR-based sampling strategy for generating landslide absence samples. Three commonly used ML methods, including logistic regression (LR), random forest (RF), and support vector machine (SVM), are applied to construct the LSM models, mitigating the randomness associated with a single ML type [21]. To validate the effectiveness of our proposed sampling method, the ML models using landslide absence samples from InSAR-based sampling are compared against those employing the widely used random sampling. The novelty of our study lies in expanding our understanding of integrating InSAR deformation data with LSM and elucidating InSAR’s role in sampling landslide absence data.
2. Materials and Methods
2.1. Study Area and Landslide Inventory
This study focused on the Badong–Zigui section of the TGRA, China, along the Yangtze River (Figure 1). The boundary of the study area is defined by merging a cluster of sub-watersheds, with geographical coordinates spanning from 110°17′ to 110°40′E and 30°56′ to 31°05′N. This section is situated within a low-to-medium mountainous area characterized by deep canyons [22]. The geological structure is complex, with faults and fragmented rock mass. The faults include the Xiannvshan Fault, the Jiuwanxi Fault, the Niukou Fault, and the Xiangluping Fault [23] (Figure 2). The Quaternary Sinian strata are widely exposed, along with a few much older strata, such as Devonian and Silurian ones [24]. The lithology is mostly carbonate, sand shale, marlstone, and mudstone, which is sensitive to landsliding [25].
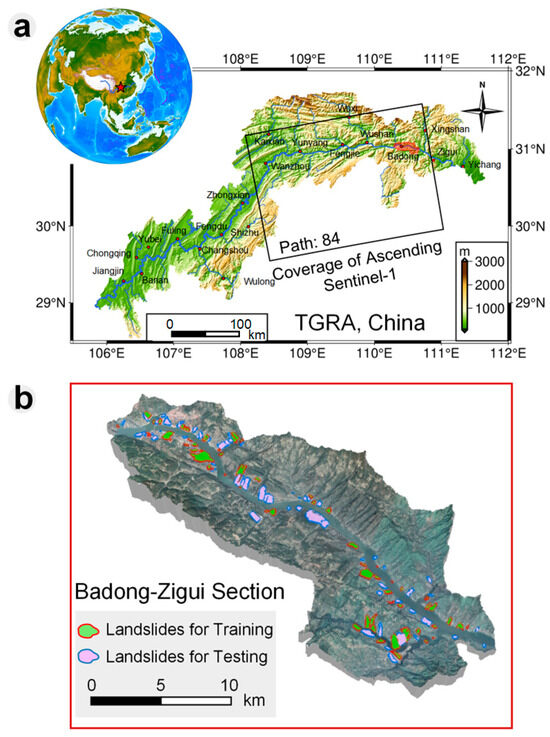
Figure 1.
Geographical location of the study area, with maps of (a) TGRA, China, and (b) the investigated Badong–Zigui section.
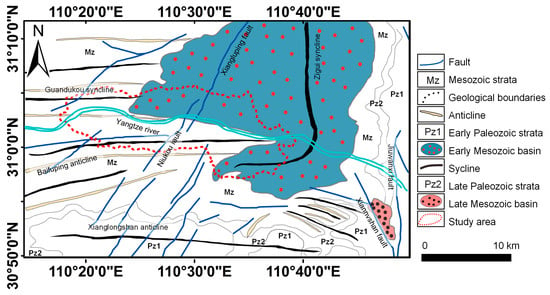
Figure 2.
Geological map of the study area, adapted and digitized from [23,25].
The study area has a humid subtropical climate. The average annual precipitation accounts for 1100 mm, with approximately 70% occurring from May to September. The reservoir water level of TGRA was initially impounded from 69 to 135 m a.s.l. in 2003. It has been undergoing cyclic hydraulic operations since 2009, fluctuating between 145 and 175 m a.s.l. The rapid rise and drawdown of water levels in the TGRA keep modifying the hydrogeological environment of the reservoir banks and promoting bank instability [26]. As a result, many landslides have occurred on slopes adjacent to the reservoir. Based on high-resolution remote sensing imagery, field investigations, and landslide reports, we identified 134 landslides covering an area of 17.77 km2, accounting for 5.06% of the entire study area. Most of them are colluvial landslides, with seasonal rainfall, periodic fluctuation of water level, and anthropogenic activities as the main triggering factors of landslides. These landslides exhibit slow movement, ranging from millimeters to several meters per year, persisting over extended years [19]. Figure 3 illustrates two typical landslides and their micro-geomorphic features, indicating ongoing deformation in the study area.
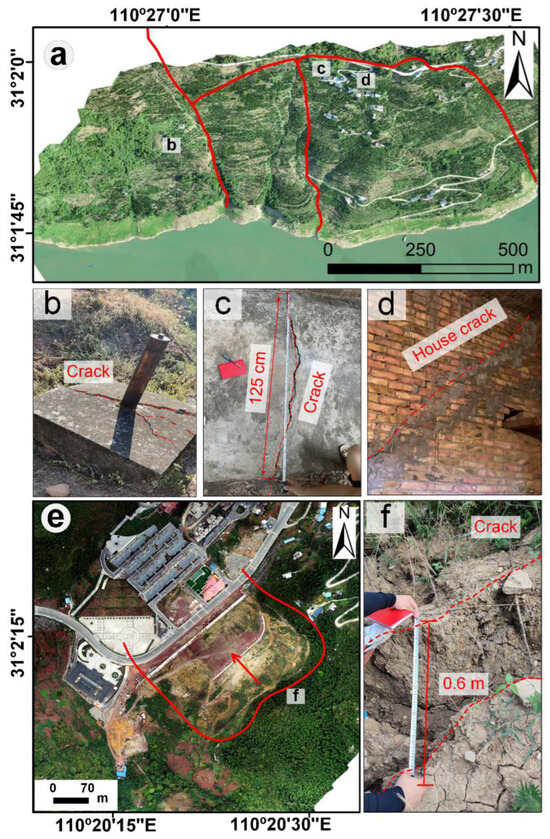
Figure 3.
Typical landslides mapped on unmanned aerial vehicle (UAV) images and their micro-geomorphic features indicating ongoing deformations in the study area. (a) Daping landslide group; (e) Tanjiawan landslide; (b–d,f) field investigation photos. Solid lines: landslide boundaries. Dotted lines: landslide cracks. Arrow: direction of the main slide.
2.2. Methodology
This study was conducted in four stages (Figure 4). Firstly, layers of 13 landslide conditioning factors were prepared for the study area, and their multi-collinearity was checked. Secondly, the Small Baseline Subset (SBAS) InSAR technology was applied to produce annual average ground deformation and select landslide absence samples. Thirdly, landslide-conditioning datasets were constructed, considering the uncertainty with the locations of landslide absence samples. Finally, three ML models were trained, their performance was evaluated using metrics, and the study area was classified accordingly into five subareas with different levels of landslide susceptibility using the natural breaks method.
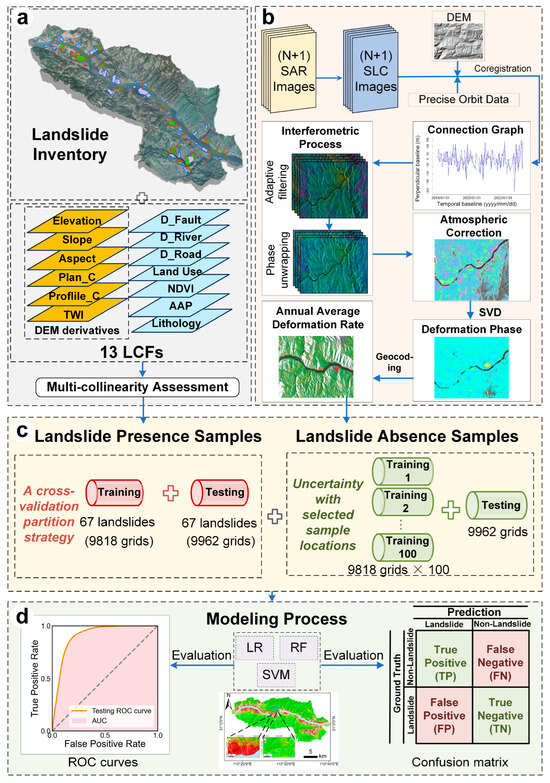
Figure 4.
Methodological flowchart. (a) Data preparation; (b) SBAS-InSAR processing; (c) Construction of landslide presence and absence samples; (d) Modelling process.
2.2.1. Landslide Conditioning Factors
Landslide conditioning factors (LCFs) include the internal geology and the external environment. There is no uniform criterion for selecting LCFs. Considering data availability and the relevance to the landslide mechanism, we selected 13 conditioning factors: elevation, slope, aspect, plan curvature (Plan_C), profile curvature (Profile_C), topographic wetness index (TWI), distance to faults (D_Fault), distance to rivers (D_River), distance to roads (D_Road), land use, the Normalized Difference Vegetation Index (NDVI), average annual precipitation (AAP), and lithology. All LCFs were discretized according to a raster DEM (digital elevation model) with a spatial resolution of 30 m (Figure 5). The data source is presented in Table 1.
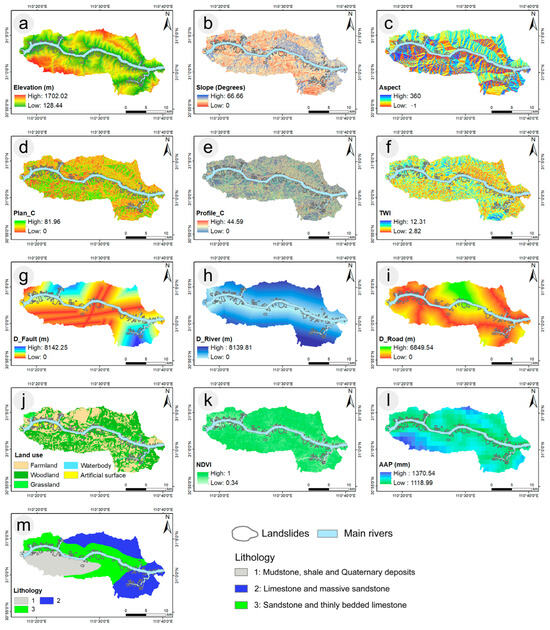
Figure 5.
LCFs used for LSM. (a) Elevation. (b) Slope. (c) Aspect. (d) Plan_C. (e) Profile_C. (f) TWI. (g) D_Fault. (h) D_River. (i) D_Road. (j) Land use. (k) NDVI. (l) AAP. (m) Lithology.

Table 1.
Information on the 13 LCFs.
Multi-collinearity, where two or more covariates are linearly related, can adversely affect the accuracy of a statistical model by increasing the variance of estimates and impede the actual convergence toward the most suitable solution. This paper applied the variance inflation factor (VIF) and Person’s correlation to check the correlations and multi-collinearity of LCFs (Figure 6). VIF is defined as follows:
where Rj is the negative correlation coefficient between the j-th independent variable (Xj) and the other independent variables (Xi). It is widely accepted that VIF values below 5 indicate the absence of multicollinearity, while values between 5 and 10 suggest weak multicollinearity, and values exceeding 10 indicate moderate or higher multicollinearity [5,12]. On the other hand, there is no universal standard for the extent to which correlation represents high collinearity. We follow a previous study by Fu and Wang et al. (2023) and set the correlation values over 0.8 to indicate a strong correlation between two factors [12]. This study identified two LCFs with weak multicollinearity, elevation and AAP, with VIF values of 5.65 and 6.17, respectively. The correlation analysis also revealed that AAP was highly correlated to elevation (0.89). Therefore, AAP was considered responsible for multi-collinearity and was left out of the subsequent analysis.
VIF = 1/(1 − Rj2)
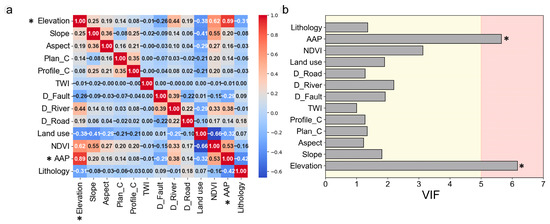
Figure 6.
Multi-collinearity assessment of the 13 LCFs. (a) Person correlation coefficient heat map. (b) VIF values. Factors marked with * indicate the presence of multi-collinearity.
2.2.2. InSAR-Based Sampling Strategy
Sentinel-1 SAR C-band data (5.5 cm wavelength) were obtained from the European Space Agency (ESA). We compiled a dense stack of ascending Sentinel-1 images from 6 January 2018 to 17 March 2023 to derive time-series deformation histories. This study used an Interferometric Wide swath mode with VV polarization.
The SBAS InSAR, proposed by Berardino et al. (2002), applies SAR interferograms with small baselines to minimize inaccuracies in topographic data and the impacts of baseline decorrelation [1,2,27,28,29,30,31]. The general processing of SBAS-InSAR starts from SAR image co-registration (Figure 4). Then, precise orbit files were downloaded from the ESA and preprocessed to reduce the orbital error. With a perpendicular baseline threshold of 200 m and a temporal baseline of 90 days, we generated 441 interferograms. From this set, we carefully selected 291 interferograms with good coherence for subsequent analysis. Next, adaptive filtering and phase unwrapping were performed to acquire a series of unwrapped differential interferograms. Then, we applied a simple linear model to eliminate the topography-dependent atmospheric phase. This procedure is commonly referred to as atmospheric correction [29]. Finally, the deformation rates were obtained through the singular value decomposition (SVD) and geocoded using the DEM.
This study evaluated slope deformation rates along the Long-of-Sight (LOS) direction of Sentinel-1 images. Cruden et al. (1996) suggested that landslides could be classified into seven types based on their deformation rates: extremely slow, very slow, slow, moderate, rapid, very rapid, and extremely rapid [32]. In this respect, landslide absence samples from areas with lower surface deformation rates are theoretically more stable than their neighboring regions. The LOS deformation measurements in this study were projections of three-dimensional (3D) deformation in the actual world onto the 1D LOS direction. Therefore, negative deformation values indicated movements away from the satellite, while positive deformation values indicated those toward the satellite. While comprehending 3D deformation offers a better understanding of surface processes, obtaining the 3D deformation requires multi-orbit satellite SAR observations from both ascending and descending passes. Because this study only had access to ascending Sentinel-1 images, we relied on LOS InSAR measurements, following methodologies employed in relevant studies [29,33,34,35].
Predefined deformation thresholds were assigned to differentiate landslide-prone areas and safe areas. The choices of thresholds are case-specific and depend on the mechanical properties of the failed material, failure mechanism, sensor measurement precision, and investigation objectives [36,37]. This study addressed this issue statistically, considering the in-phase response between landslide susceptibility and deformation rates identified in previous studies [16]. The Kriging tool in ArcGIS 10.8 was employed to interpolate the SBAS measurement points, fill in the no-data areas associated with the decorrelation of SAR images due to the steep terrain and dense vegetation, and generate the deformation rates for the entire study area. Then, the absolute values of deformation rates were reclassified into five levels using the natural breaks method: very low, low, moderate, high, and very high. Areas with very low deformation rates are considered safe areas from which landslide absence samples can be selected.
2.2.3. Construction of Datasets for LS Modeling
We adopted a cross-validation strategy to partition landslides for training (n = 67) and those for testing (n = 67), as indicated by Figure 1b. Landslide records were discretized into 30 m grids corresponding to the DEM used. Then, all grid cells on the landslides were used to construct landslide presence samples, resulting in 9818 cells for training and 9962 cells for testing.
Landslide absence samples equal to landslide presence samples were randomly extracted from the predefined safe area. The pool of available samples for selection significantly exceeded the required quantity. The uncertainty inherent in selecting landslide absence samples leads to diverse training datasets and the development of varied trained models [38]. To assess uncertainty in selected sample locations, we generated 100 sets of diverse landslide absence samples for training, each derived from partially distinct spatial positions. After combining these absence samples with the landslide presence samples, we constructed 100 training datasets and, thus, 100 training models. Then, the trained models were evaluated using various metrics against a consistent testing dataset whose landslide presence samples were from 67 testing landslides, and land-slide absence samples were from the InSAR-defined safe area, all with fixed locations.
2.2.4. Landslide Susceptibility Prediction Modeling
Logistic regression (LR) is one of the most widely utilized methods in multivariate statistical analysis. It predicts the probability of event occurrences or classifies a dependent variable by establishing the log-odds for the event as a linear combination of predictor variables. The maximum likelihood method is used to calculate the regression coefficients, followed by a gradient iteration to estimate the parameters. Logistic regression is mathematically expressed as
where P is the probability of the event occurrence ranging from 0 to 1, Z is the sum of all input variables based on weight values, βi (i = 1, 2, 3…n) is the regression coefficient based on the training samples, n is the number of independent variables, and Xi (i = 1, 2, 3…n) is the independent variable.
P = 1/(1 + e−z)
Z = β0 + β1X1 + β2X2 + … + βnXn
Support vector machine (SVM) can solve problems with high-dimensional, small samples, and nonlinear features, and is therefore frequently used for LSM [39]. The core idea of SVM is the use of kernel functions to search for the best classification hyperplane in the feature space to maximize the interval between positive and negative samples on the training dataset [12]. Once no hyperplane in the current feature space can linearly divide the sample categories, the original feature space can be mapped to a higher-dimensional feature space by a kernel function to make the samples linearly divisible. The selection of the kernel function strongly influences the classification accuracy of SVM. Commonly used kernel functions include linear (LN), polynomial (PL), radial basis function (RBF), and sigmoid (SIG) kernels. This study applies RBF-SVM to calculate the landslide susceptibility index because it can perform better than other kernel functions in non-linear classification [39].
The basic concept of random forest (RF) is to develop multiple decision trees on random subsets [40]. It uses bootstrap aggregation to select samples from the original dataset to train a tree. Each tree votes independently. Then, the voting results of all decision trees are integrated, and the category that appears most in all decision trees is considered the final prediction result. This bootstrapping procedure leads to better model performance because it integrates several decision tree models to obtain the optimal prediction results, decreasing the variance of the model without increasing the bias [41,42]. In general, the number of decision trees (n_estimators) and the maximum ratio of features (max_features) are the most critical parameters influencing the accuracy of RF models [8]. A large value of n_estimators will improve the modeling accuracy, but it also increases the complexity and modeling time [43]. The max_features parameter limits the number of features to be branched. In this study, we applied the grid search method to find the optimal hyperparameters for the RF model. After many trials, the value of n_estimators was set to 100, and that of max_features was set to 4.
2.2.5. Model Performance Evaluation
We selected six metrics to assess the predictive performance of the model. Firstly, the area under the curve (AUC) was derived from the receiver operator curve (ROC) to evaluate the comprehensive performance of the models [43]. Then, a confusion matrix was used to assess the performance of a classification model by comparing the predicted class labels with the actual class labels. The matrix contains four terms: true positives (TP), false positives (FP), true negatives (TN), and false negatives (FN). From the confusion matrix, five metrics can be calculated, including accuracy, precision, recall, specificity, and F1-score, as follows:
accuracy = (TP + TN)/(TP + TN + FP + FN)
precision = TP/(TP + FP)
recall = TP/(FN + TP)
specificity = TN/(TN + FP)
F1 score = 2(precision × recall)/(precision + recall)
3. Results
3.1. InSAR-Defined Safe Areas
The maximum annual average deformation rate, determined through SBAS-InSAR technology, reached 67.7 mm/yr (Figure 7a). After conducting the Kriging interpolation (Figure 7b), the absolute values of annual deformation rates were classified into five grades using the natural breaks method (Figure 7c). These grades represented 0.527%, 5.47%, 18.86%, 37.22%, and 37.92%, respectively, from high to slow deformation. We designated areas with the slowest deformation grade (i.e., deformation rate < 2.4 mm/yr) as safe areas for selecting non-landslide samples. However, within some areas designated as landslides, cells with the slowest deformation also exist. To avoid contradictions and overlaps between landslide and non-landslide samples, we excluded cells with the slowest deformation within landslides from the designated safe areas (Figure 7d).
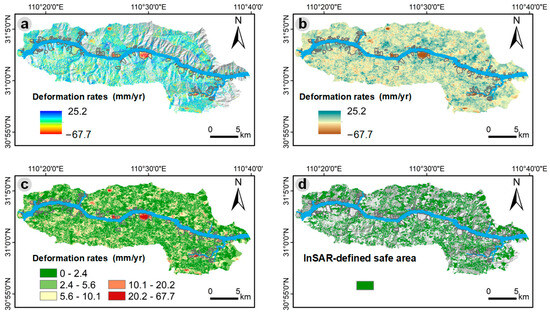
Figure 7.
SBAS-InSAR results. (a) SBAS points mapped on terrain shadows. (b) Deformation rates interpolated using the Kriging tool in ArcGIS. (c) Absolute values of interpolated deformation rates in five natural breakpoint intervals. (d) Spatial distribution of InSAR-defined safe areas mapped on terrain shadows.
3.2. Enhanced Landslide Susceptibility Maps with InSAR-Based Absence Sampling
Figure 8 contrasts landslide susceptibility maps from different ML models employing InSAR-based sampling and random sampling, respectively. The study area, divided into five subareas based on distinct levels of landslide susceptibility using the natural breaks method, exhibits similar spatial patterns with higher-susceptibility areas consistently appearing in a strip along both banks of the Yangtze River. This spatial pattern indicates that the fluctuation of reservoir water elevation significantly influences bank-slope stability [30]. Moreover, these areas are interconnected with densely populated regions, frequent engineering activities, and vegetation depletion, which collectively exacerbate landslide susceptibility [15].

Figure 8.
Landslide susceptibility maps generated by three ML algorithms and under two absence sampling strategies. (a–c) Maps using LR, RF, and SVM, respectively, with non-landslide samples from InSAR-based sampling. (d–f) Maps using LR, RF, and SVM, respectively, but with non-landslide samples from random sampling.
A subsequent examination of the ROC curves reveals that the susceptibility maps using the InSAR-based sampling strategy outperform those using random sampling by approximately 1% in AUC in Figure 9a. This indicates that our proposed sampling strategy performs better for all models. In addition, the InSAR-derived landslide absence sampling improved model performance by increasing the percentages in the ‘high’ and ‘very high’ classes or decreasing those in the ‘low’ and ‘very low’ classes (Figure 10a). Figure 10b further illustrates that after applying the InSAR-based sampling strategy, there was an increase in landslide percentages within the ‘high’ and ‘very high’ classes. However, it is important to note that the landslide density remains lower for the LR and SVM models in these classes (Figure 10c), irrespective of the sampling strategy used. This may imply that compared to RF, the LR and SVM models tend to incorporate more landslide grids at the cost of overestimating the percentages of ‘High’ and ‘Very High’ landslide susceptibility classes, decreasing their landslide density.
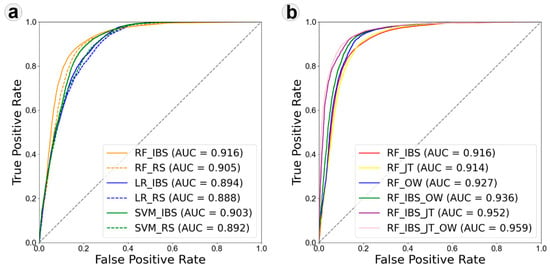
Figure 9.
Comparisons of ROC curves for (a) three ML models with non-landslide samples derived from InSAR-based sampling (IBS) and random sampling (RS), corresponding to Figure 8, and (b) RF models under various InSAR integration methods, including IBS, joint training (JT), overlay weights (OW), the combination of IBS and OW, the combination of IBS and JT, and the combination of IBS, JT, and OW methods, corresponding to Figure 11.
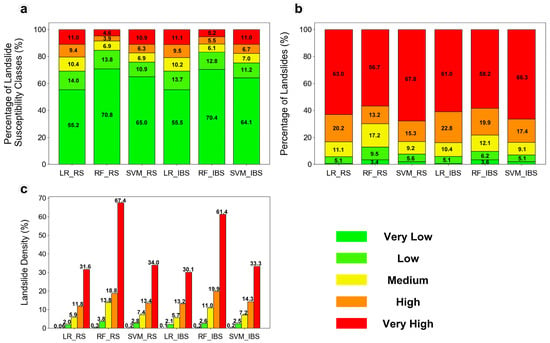
Figure 10.
Details of landslide susceptibility statistics corresponding to Figure 8. (a) Percentages of landslide susceptibility class, (b) percentages of landslides, and (c) landslide density. LR_RS, RF_RS, and SVM_RS refer to LR, RF, and SVM models using random sampling. LR_IBS, RF_IBS, and SVM_IBS refer to LR, RF, and SVM using InSAR-based sampling.
3.3. Comparison of Different InSAR Integration Methods and Their Combined Use
We compared the effectiveness of the InSAR-based sampling strategy against two classic InSAR integration methods: joint training and overlay weights methods. The joint training method incorporates InSAR deformation data as one of the LCFs into the base dataset [15,44]. The overlay weights method assigns weights of 0.61 and 0.39 to the RF model and SBAS-InSAR results, respectively, and then combines them through the weighted overlay operation [3,19,20,30]. Here, we chose the RF model for integration with InSAR deformation data due to RF’s superior performance, as indicated in Section 3.2.
Figure 11a–c provide a comparative analysis of landslide susceptibility maps generated by RF models that utilize different InSAR integration methods. The AUC metric reveals a range of values between 0.914 and 0.927 for these susceptibility maps. The RF models that integrate InSAR data through joint training and the proposed InSAR-based sampling strategy exhibit comparable model performance. However, the RF model utilizing the overlay weights method stands out, showing the best performance based on the AUC value. We assume that the outstanding performance of the overlay weights method may stem from its ability to fully utilize InSAR deformation information, encompassing both high- and low-deformation regions. In contrast, the InSAR-based sampling strategy only utilizes information from low-deformation areas for selecting non-landslide samples. Despite the joint training method fully using InSAR deformation information, this advantage may be compromised by the unreasonable use of landslide absence samples from random sampling.
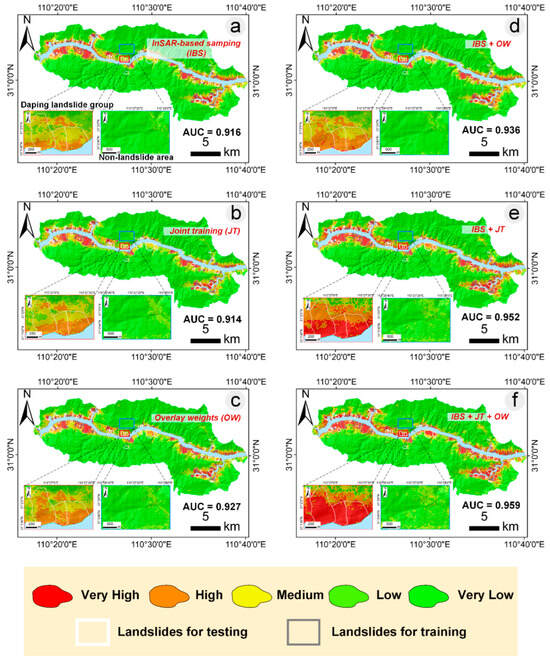
Figure 11.
Landslide susceptibility maps generated by RF models under various InSAR integration methods. (a–c) Maps produced with InSAR-based sampling (IBS), joint training (JT), and overlay weights (OW), respectively. (d–f) Maps combining IBS and OW, combining IBS and JT, and combining the IBS, JT, and OW methods, respectively.
We further explore the potential enhancement of LSM through the combined use of multiple InSAR integration methods. The susceptibility maps in Figure 11d–f, generated by RF models combining different InSAR integration methods, demonstrate noteworthy improvements. Combining InSAR-based sampling and overlay weights increases the model’s AUC value to 0.936. Similarly, InSAR-based sampling and joint training raised the AUC value to 0.952. Further, combining InSAR-based sampling, joint training, and overlay weights yields an AUC value of 0.959. A comparison of ROC curves in Figure 9b intuitively demonstrates the improvement achieved by combining three InSAR integration methods. In addition, Figure 12 shows that this combined approach of the three InSAR integration methods increased the percentages of landslide susceptibility classes and landslides in the high and very high categories while maintaining a rational level of landslide density. These results highlight the effectiveness of integrating multiple InSAR methods in enhancing LSM performance and providing more precise and reliable predictions of landslide-prone areas.
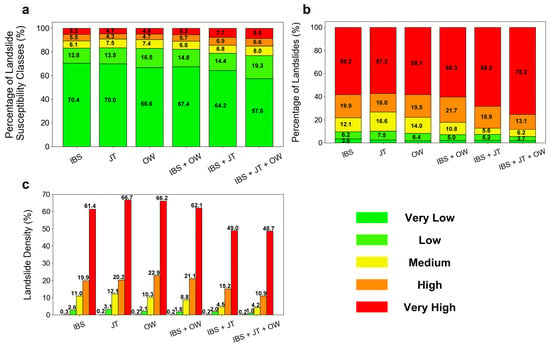
Figure 12.
Details of landslide susceptibility statistics corresponding to Figure 11. (a) Percentages of landslide susceptibility class, (b) percentages of landslides, and (c) landslide density.
4. Discussion
4.1. Uncertainty Analysis of InSAR-Enhanced LSM
ML models are inherently sensitive to data distributions, with their performance potentially inflated by coincidental factors such as data shift, stochastic variance, overfitting, data quality issues, or inadequate validation strategies [5,45]. To address these challenges and quantify the uncertainty of the InSAR-based sampling strategy, this study trained 100 different models with spatially distinct non-landslide samples. The distributions of evaluation metrics are summarized in Figure 13. The results indicate a positive impact of our InSAR-based sampling strategy on the three models compared to random sampling, with an average improvement of ca. 1% across the six selected evaluation metrics, despite the uncertainty in the chosen locations of landslide absence samples. Thus, we conclude that non-landslide samples derived from InSAR-defined safe areas more accurately represent non-landslide conditions than those obtained through random sampling. Additionally, the RF models show superior performance compared to the LR and SVM models. Similar insights can also be found in previous studies, indicating that RF models have more advanced capabilities in terms of accuracy and robustness [15,45,46]. Furthermore, we also assessed the uncertainty associated with the combined use of multiple InSAR integration methods. The results confirm the consistently optimal performance of ML models when combining three InSAR integration methods with evaluation metrics exhibiting a higher mean value, and a lower standard deviation (Figure 14). This suggests that combining multiple InSAR integration methods could further reduce the uncertainty of the InSAR-based absence sampling strategy and facilitate more stable and superior model performance of LSM.
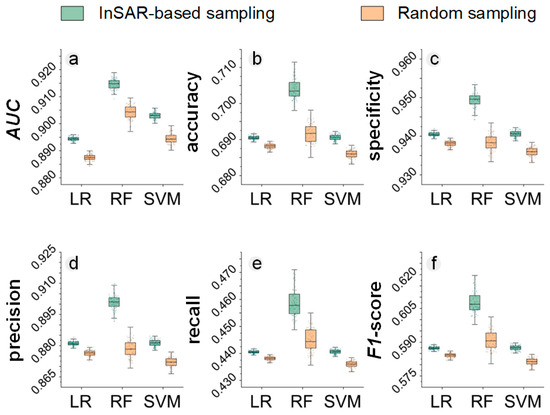
Figure 13.
Box plots summarizing evaluation metric distribution from 600 training models, including three types of ML algorithms, each trained across two different absence sampling strategies. (a) AUC. (b) ACC. (c) specificity. (d) precision. (e) recall. (f) F1-score. Note that ML models with non-landslides from random sampling serve as benchmark models, and each dot corresponds to a model training under a specific training dataset.
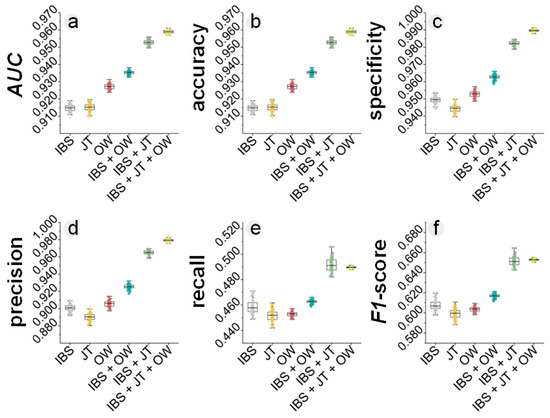
Figure 14.
Box plots summarizing the evaluation metric distribution from 600 RF training models, with each of the six InSAR integration methods trained 100 times: (a) AUC; (b) ACC; (c) specificity; (d) precision; (e) recall; (f) F1-score. Each dot corresponds to a model training under a specific training dataset.
4.2. Empirical Cross-Checking via InSAR Dynamics at the Daping Landslide Group
Accurately identifying credible landslide-prone areas is crucial for managing geological hazards and enables the efficient allocation of public resources and planning by government agencies [47]. Within this context, cross-validations of landslide susceptibility results must be carried out at localities with suspiciously high susceptibility levels. Some studies applied fieldwork to validate their assessment results [3,23,48]. However, a tricky issue associated with slow-moving landslides is that their deformation might span an exceptionally long period, and close monitoring based on field observations would be labor-intensive and resource-consuming. To solve this dilemma, this study explores the use of InSAR to validate high-susceptibility areas generated by LSM. LSM, inferred from machine learning methods, primarily captures the relationship between landslide occurrences and features [45]. In contrast, InSAR-derived deformation intuitively reflects slope dynamics, making it a popular way to identify potential landslides [37,49,50,51]. Thus, we hypothesize that InSAR-derived deformation can validate LSM-identified landslide-prone areas.
The Daping landslide group data were excluded when training the landslide susceptibility models. Thus, the derived insights regarding the LSM accuracy can be validated with InSAR deformation dynamics in this locality. From Figure 15a, we observe prominent deformation features with substantial deformation primarily manifesting in the central sections of the left block (Figure 15b). In particular, this deformation exhibits significant spatial-temporal variations corresponding to the diversified landslide evolution on the landslide surface. These findings highlight the instability of the Daping landslide group and thus support the credibility of the escalated susceptibility level in this locality, as shown in Figure 11a–f.
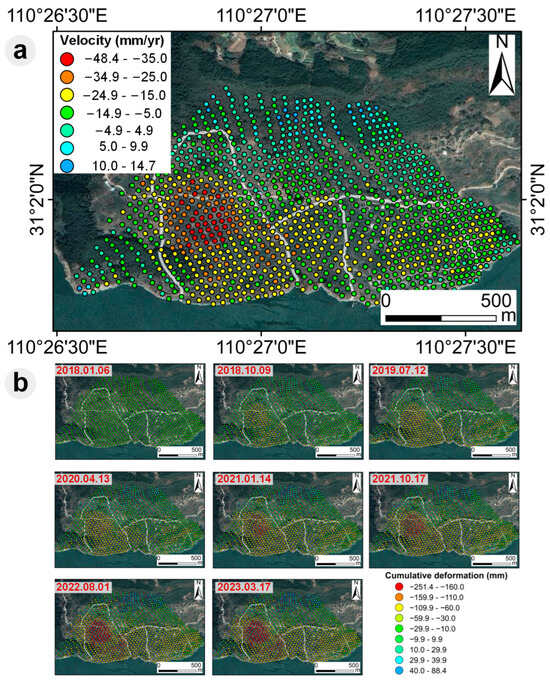
Figure 15.
Diagrams of (a) annual average deformation rate and (b) time series deformation of the Dapaing landslide group, TGRA.
4.3. Advantages and Future Recommendations
The rapid progress of InSAR technology has opened new opportunities for more accurate LSM. With the free and open dissemination strategy of Sentinel-1 satellite images at high temporal resolution and global coverage, InSAR has become a low-cost landslide monitoring technique, and high-precision Deformation maps can be quickly generated and regularly updated [34,52,53]. Various time-series InSAR technology, including stacking InSAR, SBAS InSAR, and persistent scatterer/distributed scatter (PS/DS)-InSAR, were developed based on multiple-period SAR images with millimeter accuracy [2,19,35,54,55,56,57,58]. In this study, we apply the SBAS InSAR technique to derive deformation information from a dense Sentinel-1 time series because SBAS-InSAR exhibits superior performance in effectively mitigating errors caused by decoherence and atmospheric delay in the spatial baseline [18,31,59,60,61].
The performance of LSM predictive models has been enhanced by integrating InSAR-derived deformation through absence sampling strategy, joint training, overlay weights, or a combination of these methods. However, there is limited research on using InSAR deformation data to select landslide absence samples. This study highlights InSAR’s unique role in absence sampling for LSM by explicitly associating absence samples with low deformation values. While physics-informed models like TRIGRS and Scoops 3D have been explored to select absence samples in areas with higher safety factor values, their application is restricted in smaller areas due to difficulties in obtaining detailed geotechnical parameters such as soil depth, shear strength, and groundwater configurations [9,13,38,62]. In contrast, our proposed sampling strategy can be applied to larger areas, primarily because of unrestricted access to space-born SAR satellite images, especially from Sentinel-1. This broader application makes the proposed strategy more versatile and practical for large-area landslide monitoring and prediction.
In this study, we ensured that the landslide absence samples had clear physical significance by selecting areas with low deformations as defined by InSAR measurements. Our proposed absence sampling strategy achieved better performance than traditional random sampling. However, we acknowledge that our proposed method suffers some uncertainties due to a limited temporal span of SAR data compared to landslide evolution processes. This may result in inconsistent patterns between landslide susceptibility and deformation [3], although this issue is quite common for slow-moving landslides because their lifetime ranges from days to hundreds of years [63]. In addition, integrating SAR images with other remote sensing data, such as high-resolution optical images and Light Detection and Ranging (LiDAR), may aid in selecting landslide absence samples [1,33,50]. High-resolution optical images and LiDAR can intuitively capture the micro-geomorphological features, including landslide fissures, ravines, and tension cracks. Such features play a vital role in understanding landslide dynamics and assessing stability [14,51,64], thereby eliminating false negatives in selecting landslide absence samples. The collaborative use of multi-source data from space-, sky-, and ground-based platforms provides high-quality and complementary information for landslide prevention and warning [1,2,3,30,65,66,67]. Although this method has not been widely applied in the field of LSM, we believe that in the future, it could help optimize the credibility of landslide absence samples and generate more accurate ML-based algorithms for LSM. This direction is critical to advancing our understanding and predictive capabilities in LSM.
5. Conclusions
This study introduced an InSAR-based sampling strategy for generating absence samples in LSM within the Badong–Zigui area in the TGRA, China. Utilizing the SBAS InSAR technology, we computed annual average ground deformation and selected absence samples from areas displaying very slow deformation. We employed three predictive models (LR, SVM, and RF) to verify the efficacy of our sampling strategy for susceptibility zoning. Our findings highlight a positive impact of the InSAR-based sampling on LR, RF, and SVM models, indicating that samples from InSAR-defined safe areas more accurately represent non-landslide conditions than randomly selected negatives. Additionally, we compared the effectiveness of different InSAR integration methods, including absence sampling, joint training, overlay weights, and their combined usage. The results demonstrated the optimal enhancement of landslide susceptibility models from the use of these three InSAR integration methods. Finally, we cross-checked the improved landslide susceptibility maps using InSAR-derived deformation dynamics at the Daping landslide group, consolidating the effectiveness of incorporating InSAR technology into the LSM predictive models.
Author Contributions
Conceptualization, R.Z., Z.F. (Zhice Fang) and L.Z.; methodology, R.Z., A.D. and L.Z.; data curation, R.Z.; writing—original draft preparation, R.Z.; writing—review and editing, R.Z., Z.F. (Zhice Fang), A.M., Z.F. (Zijin Fu), J.D. and T.O.; supervision, T.O. All authors have read and agreed to the published version of the manuscript.
Funding
This work was funded by the China Scholarship Council (Grant No. 202008050048).
Data Availability Statement
The data that support this study are available from the first author upon reasonable request. The data are not publicly available due to [ethical reasons].
Acknowledgments
We thank the editor and four anonymous reviewers for their constructive suggestions and comments to improve the paper.
Conflicts of Interest
The authors declare no conflicts of interest.
References
- Xu, Q.; Guo, C.; Dong, X.; Li, W.; Lu, H.; Fu, H.; Liu, X. Mapping and Characterizing Displacements of Landslides with InSAR and Airborne LiDAR Technologies: A Case Study of Danba County, Southwest China. Remote Sens. 2021, 13, 4234. [Google Scholar] [CrossRef]
- Xu, Q.; Zhao, B.; Dai, K.; Dong, X.; Li, W.; Zhu, X.; Yang, Y.; Xiao, X.; Wang, X.; Huang, J.; et al. Remote sensing for landslide investigations: A progress report from China. Eng. Geol. 2023, 321, 107156. [Google Scholar] [CrossRef]
- Cao, C.; Zhu, K.; Xu, P.; Shan, B.; Yang, G.; Song, S. Refined landslide susceptibility analysis based on InSAR technology and UAV multi-source data. J. Clean. Prod. 2022, 368, 133146. [Google Scholar] [CrossRef]
- Liu, W.; Zhang, Y.; Liang, Y.; Sun, P.; Li, Y.; Su, X.; Wang, A.; Meng, X. Landslide Risk Assessment Using a Combined Approach Based on InSAR and Random Forest. Remote Sens. 2022, 14, 2131. [Google Scholar] [CrossRef]
- Dong, A.; Dou, J.; Fu, Y.; Zhang, R.; Xing, K. Unraveling the evolution of landslide susceptibility: A systematic review of 30-years of strategic themes and trends. Geocarto Int. 2023, 38, 2256308. [Google Scholar] [CrossRef]
- Liu, Q.; Tang, A.; Huang, D. Exploring the uncertainty of landslide susceptibility assessment caused by the number of non–landslides. Catena 2023, 227, 107109. [Google Scholar] [CrossRef]
- Zhiyong, F.; Changdong, L.; Wenmin, Y. Landslide susceptibility assessment through TrAdaBoost transfer learning models using two landslide inventories. Catena 2023, 222, 106799. [Google Scholar] [CrossRef]
- Zhu, A.; Miao, Y.; Liu, J.; Bai, S.; Zeng, C.; Ma, T.; Hong, H. A similarity-based approach to sampling absence data for landslide susceptibility mapping using data-driven methods. Catena 2019, 183, 104188. [Google Scholar] [CrossRef]
- Liu, S.; Wang, L.; Zhang, W.; Sun, W.; Fu, J.; Xiao, T.; Dai, Z. A physics-informed data-driven model for landslide susceptibility assessment in the Three Gorges Reservoir area. Geosci. Front. 2023, 14, 101621. [Google Scholar] [CrossRef]
- Hong, H.; Miao, Y.; Liu, J.; Zhu, A. Exploring the effects of the design and quantity of absence data on the performance of random forest-based landslide susceptibility mapping. Catena 2019, 176, 45–64. [Google Scholar] [CrossRef]
- Rabby, Y.W.; Li, Y.; Hilafu, H. An objective absence data sampling method for landslide susceptibility mapping. Sci. Rep. 2023, 13, 1740. [Google Scholar] [CrossRef] [PubMed]
- Fu, Z.; Wang, F.; Dou, J.; Nam, K.; Ma, H. Enhanced Absence Sampling Technique for Data-Driven Landslide Susceptibility Mapping: A Case Study in Songyang County, China. Remote Sens. 2023, 15, 3345. [Google Scholar] [CrossRef]
- Wei, X.; Zhang, L.; Luo, J.; Liu, D. A hybrid framework integrating physical model and convolutional neural network for regional landslide susceptibility mapping. Nat. Hazards 2021, 109, 471–497. [Google Scholar] [CrossRef]
- Li, Y.; Zuo, X.; Zhu, D.; Wu, W.; Yang, X.; Guo, S.; Shi, C.; Huang, C.; Li, F.; Liu, X. Identification and Analysis of Landslides in the Ahai Reservoir Area of the Jinsha River Basin Using a Combination of DS-InSAR, Optical Images, and Field Surveys. Remote Sens. 2022, 14, 6274. [Google Scholar] [CrossRef]
- Miao, F.; Ruan, Q.; Wu, Y.; Qian, Z.; Kong, Z.; Qin, Z. Landslide Dynamic Susceptibility Mapping Base on Machine Learning and the PS-InSAR Coupling Model. Remote Sens. 2023, 15, 5427. [Google Scholar] [CrossRef]
- Xie, Z.; Chen, G.; Meng, X.; Zhang, Y.; Qiao, L.; Tan, L. A comparative study of landslide susceptibility mapping using weight of evidence, logistic regression and support vector machine and evaluated by SBAS-InSAR monitoring: Zhouqu to Wudu segment in Bailong River Basin, China. Environ. Earth Sci. 2017, 76, 313. [Google Scholar] [CrossRef]
- He, Y.; Wang, W.; Zhang, L.; Chen, Y.; Chen, Y.; Chen, B.; He, X.; Zhao, Z. An identification method of potential landslide zones using InSAR data and landslide susceptibility. Geomat. Nat. Hazards Risk 2023, 14, 2185120. [Google Scholar] [CrossRef]
- Zhang, Y.; Chen, Y.; Ming, D.; Zhu, Y.; Ling, X.; Zhang, X.; Lian, X. Landslide hazard analysis based on SBAS-InSAR and MCE-CNN model: A case study of Kongtong, Pingliang. Geocarto Int. 2022, 38, 1–22. [Google Scholar] [CrossRef]
- Zhou, C.; Cao, Y.; Hu, X.; Yin, K.; Wang, Y.; Catani, F. Enhanced dynamic landslide hazard mapping using MT-InSAR method in the Three Gorges Reservoir Area. Landslides 2022, 19, 1585–1597. [Google Scholar] [CrossRef]
- Ciampalini, A.; Raspini, F.; Lagomarsino, D.; Catani, F.; Casagli, N. Landslide susceptibility map refinement using PSInSAR data. Remote Sens. Environ. 2016, 184, 302–315. [Google Scholar] [CrossRef]
- Dou, J.; Yunus, A.P.; Merghadi, A.; Shirzadi, A.; Nguyen, H.; Hussain, Y.; Avtar, R.; Chen, Y.; Pham, B.T.; Yamagishi, H. Different sampling strategies for predicting landslide susceptibilities are deemed less consequential with deep learning. Sci. Total Environ. 2020, 720, 137320. [Google Scholar] [CrossRef] [PubMed]
- Wu, Y.; Pei, J.; Wang, Z.; Zhang, Y.; Yuan, H. Analysis on the Characteristics of Crustal Structure and Seismotectonic Environment in Zigui Basin, Three Gorges. Front. Earth Sci. 2021, 9, 780209. [Google Scholar] [CrossRef]
- Peng, L.; Niu, R.; Huang, B.; Wu, X.; Zhao, Y.; Ye, R. Landslide susceptibility mapping based on rough set theory and support vector machines: A case of the Three Gorges area, China. Geomorphology 2014, 204, 287–301. [Google Scholar] [CrossRef]
- Yu, X.; Gao, H. A landslide susceptibility map based on spatial scale segmentation: A case study at Zigui-Badong in the Three Gorges Reservoir Area, China. PLoS ONE 2020, 15, e229818. [Google Scholar] [CrossRef] [PubMed]
- Wang, Q.; Wang, Y.; Niu, R.; Peng, L. Integration of Information Theory, K-Means Cluster Analysis and the Logistic Regression Model for Landslide Susceptibility Mapping in the Three Gorges Area, China. Remote Sens. 2017, 9, 938. [Google Scholar] [CrossRef]
- Hua, Y.; Wang, X.; Li, Y.; Xu, P.; Xia, W. Dynamic development of landslide susceptibility based on slope unit and deep neural networks. Landslides 2021, 18, 281–302. [Google Scholar] [CrossRef]
- Berardino, P.; Fornaro, G.; Lanari, R.; Sansosti, E. A new algorithm for surface deformation monitoring based on small baseline differential SAR interferograms. IEEE Trans. Geosci. Remote Sens. 2002, 40, 2375–2383. [Google Scholar] [CrossRef]
- Dun, J.; Feng, W.; Yi, X.; Zhang, G.; Wu, M. Detection and Mapping of Active Landslides before Impoundment in the Baihetan Reservoir Area (China) Based on the Time-Series InSAR Method. Remote Sens. 2021, 13, 3213. [Google Scholar] [CrossRef]
- Zhang, L.; Dai, K.; Deng, J.; Ge, D.; Liang, R.; Li, W.; Xu, Q. Identifying Potential Landslides by Stacking-InSAR in Southwestern China and Its Performance Comparison with SBAS-InSAR. Remote Sens. 2021, 13, 3662. [Google Scholar] [CrossRef]
- Dai, K.; Chen, C.; Shi, X.; Wu, M.; Feng, W.; Xu, Q.; Liang, R.; Zhuo, G.; Li, Z. Dynamic landslides susceptibility evaluation in Baihetan Dam area during extensive impoundment by integrating geological model and InSAR observations. Int. J. Appl. Earth Obs. Geoinf. 2023, 116, 103157. [Google Scholar] [CrossRef]
- Yao, J.; Yao, X.; Liu, X. Landslide Detection and Mapping Based on SBAS-InSAR and PS-InSAR: A Case Study in Gongjue County, Tibet, China. Remote Sens. 2022, 14, 4728. [Google Scholar] [CrossRef]
- Cruden, D.M.; Varnes, D.J. Landslide Types and Processes. In Landslides, Investigation and Mitigation; Transportation Research Board Special Report; Turner, A.K., Schuster, R.L., Eds.; Transportation Research Board: Washington, DC, USA, 1996; Volume 247, pp. 36–75. [Google Scholar]
- Zhao, C.; Liang, J.; Zhang, S.; Dong, J.; Yan, S.; Yang, L.; Liu, B.; Ma, X.; Li, W. Integration of Sentinel-1A, ALOS-2 and GF-1 Datasets for Identifying Landslides in the Three Parallel Rivers Region, China. Remote Sens. 2022, 14, 5031. [Google Scholar] [CrossRef]
- Zhou, C.; Cao, Y.; Yin, K.; Wang, Y.; Shi, X.; Catani, F.; Ahmed, B. Landslide Characterization Applying Sentinel-1 Images and InSAR Technique: The Muyubao Landslide in the Three Gorges Reservoir Area, China. Remote Sens. 2020, 12, 3385. [Google Scholar] [CrossRef]
- Liu, X.; Zhao, C.; Zhang, Q.; Lu, Z.; Li, Z.; Yang, C.; Zhu, W.; Liu-Zeng, J.; Chen, L.; Liu, C. Integration of Sentinel-1 and ALOS/PALSAR-2 SAR datasets for mapping active landslides along the Jinsha River corridor, China. Eng. Geol. 2021, 284, 106033. [Google Scholar] [CrossRef]
- Zhang, Y.; Li, Y.; Meng, X.; Liu, W.; Wang, A.; Liang, Y.; Su, X.; Zeng, R.; Chen, X. Automatic Mapping of Potential Landslides Using Satellite Multitemporal Interferometry. Remote Sens. 2023, 15, 4951. [Google Scholar] [CrossRef]
- Jia, H.; Wang, Y.; Ge, D.; Deng, Y.; Wang, R. InSAR Study of Landslides: Early Detection, Three-Dimensional, and Long-Term Surface Displacement Estimation—A Case of Xiaojiang River Basin, China. Remote Sens. 2022, 14, 1759. [Google Scholar] [CrossRef]
- Wei, X.; Zhang, L.; Gardoni, P.; Chen, Y.; Tan, L.; Liu, D.; Du, C.; Li, H. Comparison of hybrid data-driven and physical models for landslide susceptibility mapping at regional scales. Acta Geotech. 2023, 18, 4453–4476. [Google Scholar] [CrossRef]
- Dou, J.; Yunus, A.P.; Bui, D.T.; Merghadi, A.; Sahana, M.; Zhu, Z.; Chen, C.; Han, Z.; Pham, B.T. Improved landslide assessment using support vector machine with bagging, boosting, and stacking ensemble machine learning framework in a mountainous watershed, Japan. Landslides 2020, 17, 641–658. [Google Scholar] [CrossRef]
- Al-Najjar, H.A.H.; Pradhan, B.; Beydoun, G.; Sarkar, R.; Park, H.; Alamri, A. A novel method using explainable artificial intelligence (XAI)-based Shapley Additive Explanations for spatial landslide prediction using Time-Series SAR dataset. Gondwana Res. 2023, 123, 107–124. [Google Scholar] [CrossRef]
- Zhang, K.; Wu, X.; Niu, R.; Yang, K.; Zhao, L. The assessment of landslide susceptibility mapping using random forest and decision tree methods in the Three Gorges Reservoir area, China. Environ. Earth Sci. 2017, 76, 405. [Google Scholar] [CrossRef]
- Huang, F.; Chen, J.; Liu, W.; Huang, J.; Hong, H.; Chen, W. Regional rainfall-induced landslide hazard warning based on landslide susceptibility mapping and a critical rainfall threshold. Geomorphology 2022, 408, 108236. [Google Scholar] [CrossRef]
- Liu, L.; Zhang, Y.; Xiao, T.; Yang, C. A frequency ratio-based sampling strategy for landslide susceptibility assessment. Bull. Eng. Geol. Environ. 2022, 81, 360. [Google Scholar] [CrossRef]
- Arsyad, A.; Muhiddin, A.B. Landslide Susceptibility Mapping for Road Corridors Using Coupled InSAR and GIS Statistical Analysis. Nat. Hazards Rev. 2023, 24, 05023007. [Google Scholar] [CrossRef]
- Merghadi, A.; Yunus, A.P.; Dou, J.; Whiteley, J.; ThaiPham, B.; Bui, D.T.; Avtar, R.; Abderrahmane, B. Machine learning methods for landslide susceptibility studies: A comparative overview of algorithm performance. Earth-Sci. Rev. 2020, 207, 103225. [Google Scholar] [CrossRef]
- Huang, F.; Yan, J.; Fan, X.; Yao, C.; Huang, J.; Chen, W.; Hong, H. Uncertainty pattern in landslide susceptibility prediction modelling: Effects of different landslide boundaries and spatial shape expressions. Geosci. Front. 2022, 13, 101317. [Google Scholar] [CrossRef]
- De Graff, J.V.; Romesburg, H.C.; Ahmad, R.; McCalpin, J.P. Producing landslide-susceptibility maps for regional planning in data-scarce regions. Nat. Hazards 2012, 64, 729–749. [Google Scholar] [CrossRef]
- Zeng, T.; Wu, L.; Hayakawa, Y.S.; Yin, K.; Gui, L.; Jin, B.; Guo, Z.; Peduto, D. Advanced integration of ensemble learning and MT-InSAR for enhanced slow-moving landslide susceptibility zoning. Eng. Geol. 2024, 331, 107436. [Google Scholar] [CrossRef]
- Yao, J.; Lan, H.; Li, L.; Cao, Y.; Wu, Y.; Zhang, Y.; Zhou, C. Characteristics of a rapid landsliding area along Jinsha River revealed by multi-temporal remote sensing and its risks to Sichuan-Tibet railway. Landslides 2022, 19, 703–718. [Google Scholar] [CrossRef]
- Yi, Z.; Xingmin, M.; Allesandro, N.; Tom, D.; Guan, C.; Colm, J.; Yuanxi, L.; Xiaojun, S. Characterization of pre-failure deformation and evolution of a large earthflow using InSAR monitoring and optical image interpretation. Landslides 2022, 19, 35–50. [Google Scholar] [CrossRef]
- Zhang, C.; Li, Z.; Yu, C.; Chen, B.; Ding, M.; Zhu, W.; Yang, J.; Liu, Z.; Peng, J. An integrated framework for wide-area active landslide detection with InSAR observations and SAR pixel offsets. Landslides 2022, 19, 2905–2923. [Google Scholar] [CrossRef]
- Luo, W.; Dou, J.; Fu, Y.; Wang, X.; He, Y.; Ma, H.; Wang, R.; Xing, K. A Novel Hybrid LMD-ETS-TCN Approach for Predicting Landslide Displacement Based on GPS Time Series Analysis. Remote Sens. 2023, 15, 229. [Google Scholar] [CrossRef]
- Chen, X.; Achilli, V.; Fabris, M.; Menin, A.; Monego, M.; Tessari, G.; Floris, M. Combining Sentinel-1 Interferometry and Ground-Based Geomatics Techniques for Monitoring Buildings Affected by Mass Movements. Remote Sens. 2021, 13, 452. [Google Scholar] [CrossRef]
- Dai, K.; Deng, J.; Xu, Q.; Li, Z.; Shi, X.; Hancock, C.; Wen, N.; Zhang, L.; Zhuo, G. Interpretation and sensitivity analysis of the InSAR line of sight displacements in landslide measurements. Gisci. Remote Sens. 2022, 59, 1226–1242. [Google Scholar] [CrossRef]
- Shen, Y.; Dai, K.; Wu, M.; Zhuo, G.; Wang, M.; Wang, T.; Xu, Q. Rapid and Automatic Detection of New Potential Landslide Based on Phase-Gradient DInSAR. IEEE Geosci. Remote Sens. Lett. 2022, 19, 4514205. [Google Scholar] [CrossRef]
- Bekaert, D.P.S.; Handwerger, A.L.; Agram, P.; Kirschbaum, D.B. InSAR-based detection method for mapping and monitoring slow-moving landslides in remote regions with steep and mountainous terrain: An application to Nepal. Remote Sens. Environ. 2020, 249, 111983. [Google Scholar] [CrossRef]
- Kang, Y.; Lu, Z.; Zhao, C.; Xu, Y.; Kim, J.; Gallegos, A.J. InSAR monitoring of creeping landslides in mountainous regions: A case study in Eldorado National Forest, California. Remote Sens. Environ. 2021, 258, 112400. [Google Scholar] [CrossRef]
- Kim, J.; Coe, J.A.; Lu, Z.; Avdievitch, N.N.; Hults, C.P. Spaceborne InSAR mapping of landslides and subsidence in rapidly deglaciating terrain, Glacier Bay National Park and Preserve and vicinity, Alaska and British Columbia. Remote Sens. Environ. 2022, 281, 113231. [Google Scholar] [CrossRef]
- Liu, X.; Yao, X.; Yao, J. Accelerated Movements of Xiaomojiu Landslide Observed with SBAS-InSAR and Three-Dimensional Measurements, Upper Jinsha River, Eastern Tibet. Appl. Sci. 2022, 12, 9758. [Google Scholar] [CrossRef]
- Su, X.; Zhang, Y.; Meng, X.; Rehman, M.U.; Khalid, Z.; Yue, D. Updating Inventory, Deformation, and Development Characteristics of Landslides in Hunza Valley, NW Karakoram, Pakistan by SBAS-InSAR. Remote Sens. 2022, 14, 4907. [Google Scholar] [CrossRef]
- Xiao, B.; Zhao, J.; Li, D.; Zhao, Z.; Zhou, D.; Xi, W.; Li, Y. Combined SBAS-InSAR and PSO-RF Algorithm for Evaluating the Susceptibility Prediction of Landslide in Complex Mountainous Area: A Case Study of Ludian County, China. Sensors 2022, 22, 8041. [Google Scholar] [CrossRef]
- Jiang, H.; Zou, Q.; Jiang, Y.; Zhou, B.; Yao, H.; Cui, J.; Zhou, W.; Chen, S. Development of an integrated model for assessing landslide susceptibility on vegetated slopes under random rainfall scenarios. Ecol. Eng. 2024, 199, 107150. [Google Scholar] [CrossRef]
- Chen, L.; Ma, P.; Yu, C.; Zheng, Y.; Zhu, Q.; Ding, Y. Landslide susceptibility assessment in multiple urban slope settings with a landslide inventory augmented by InSAR techniques. Eng. Geol. 2023, 327, 107342. [Google Scholar] [CrossRef]
- Dong, X.; Yin, T.; Dai, K.; Pirasteh, S.; Zhuo, G.; Li, Z.; Yu, B.; Xu, Q. Identifying Potential Landslides on Giant Niexia Slope (China) Based on Integrated Multi-Remote Sensing Technologies. Remote Sens. 2022, 14, 6328. [Google Scholar] [CrossRef]
- Hamdi, L.; Defaflia, N.; Merghadi, A.; Fehdi, C.; Yunus, A.P.; Dou, J.; Pham, Q.B.; Abdo, H.G.; Almohamad, H.; Al-Mutiry, M. Ground Surface Deformation Analysis Integrating InSAR and GPS Data in the Karstic Terrain of Cheria Basin, Algeria. Remote Sens. 2023, 15, 1486. [Google Scholar] [CrossRef]
- Merghadi, A.; Abderrahmane, B.; Tien Bui, D. Landslide Susceptibility Assessment at Mila Basin (Algeria): A Comparative Assessment of Prediction Capability of Advanced Machine Learning Methods. Isprs Int. J. Geo-Inf. 2018, 7, 268. [Google Scholar] [CrossRef]
- Hamdi, L.; Defaflia, N.; Fehdi, C.; Merghadi, A. InSAR Investigation on DRAA-Douamis Sinkholes in Cheria Northeastern of Algeria. In Proceedings of the IGARSS 2020-2020 IEEE International Geoscience and Remote Sensing Symposium, Waikoloa, HI, USA, 26 September–2 October 2020; IEEE: Piscataway, NJ, USA, 2020; pp. 1034–1037. [Google Scholar]
Disclaimer/Publisher’s Note: The statements, opinions and data contained in all publications are solely those of the individual author(s) and contributor(s) and not of MDPI and/or the editor(s). MDPI and/or the editor(s) disclaim responsibility for any injury to people or property resulting from any ideas, methods, instructions or products referred to in the content. |
© 2024 by the authors. Licensee MDPI, Basel, Switzerland. This article is an open access article distributed under the terms and conditions of the Creative Commons Attribution (CC BY) license (https://creativecommons.org/licenses/by/4.0/).