Article

Disasters and Archaeology: A Remote Sensing Approach for Determination of Archaeology At-Risk to Desertification in Sistan

School of Archaeology, The University of Oxford, South Parks Road, Oxford OX1 3TG, UK
Remote Sens. 2024, 16(13), 2382; https://doi.org/10.3390/rs16132382
Submission received: 27 March 2024 / Revised: 23 May 2024 / Accepted: 29 May 2024 / Published: 28 June 2024
(This article belongs to the Special Issue Applications of Remote Sensing in Landscape Archaeology)

Abstract

:
Desertification in semi-arid environments poses a significant risk to the archaeology within arid and semi-arid regions. Due to multiple political and physical barriers, accessing desertification-prone areas is complex, complicating pathways towards generating a hands-on understanding of the time–depth and distribution of archaeology throughout these regions. This research developed a remote sensing methodology to determine the areas of Sistan experiencing the highest levels of desertification and the threat of that desertification to known and potential archaeology. As desertification processes are occurring rapidly, this work’s methodology is straightforward and efficient. In a region of vast archaeological value, desertification threatens to prevent archaeologists from potential insight and discovery. This work showcases the opportunity for remote sensing to work as a tool for accessing archaeology in physically inaccessible desertification-prone regions.

1. Introduction

Desertification often suggests the expansion of deserts, and while the process can involve the encroachment of sand, its full definition is more informative. According to the United Nations Convention, desertification is “land degradation in arid, semi-arid, and dry sub-humid areas resulting from various factors, including climatic variations and human activities” (United Nations Convention to Combat Desertification). In simpler terms, it refers to land degradation or reduced fertility in dry landscapes. Desertification is a complex issue influenced by multiple factors, such as drought, wind, and human development. Drylands encompass 46 percent of Earth and impact 38 percent of the global population [1]. Desertification poses a significant threat to archaeology in various regions worldwide [2,3,4]. Although desertification is a longstanding natural process, as evidenced in the archaeological record [5], the acceleration of desertification poses a substantial and immediate threat to archaeology.
Encompassing an expansive area of approximately 2000 square kilometers, the Sistan Basin (Figure 1) extends from eastern Iran to southwestern Afghanistan. Desertification in the Sistan Basin is intertwined with the area’s arid climatic conditions and dwindling access to water resources. The region’s climatic conditions are further underscored by scorching heat, with summer temperatures reaching 43.3 degrees Celsius [6]. Moreover, Iran’s annual mean maximum temperatures are trending upwards, with an incremental increase of 0.31 to 0.59 degrees per decade [6]. The Helmand River, originating from the snowmelt of the Sanglach Range in the Hindu Kush of Afghanistan, runs through the Sistan Basin, ultimately feeding into the shared Afghan and Iranian Hāmūn Lake. Unfortunately, the lake has been steadily diminishing due to prolonged drought conditions [7,8], alongside an enduring century-and-a-half-long dispute over water distribution from the Helmand River [9]. The region’s topography contributes to its arid character, as the Albros Mountains enclose it to the north and the Zagros Mountains to the west [10] Sistan lies within a dust-prone zone, with the Dasht-e Kavir to the northeast, the Dasht-e Lut to the west, and the Registan Desert to the east. The persistence of aridity and the proliferation of dust particles, particularly during the period from May to September when the notorious annual Wind of 120 Days prevails, are exacerbated by the interaction between the cold, high-pressure system originating from the Hindu Kush and the thermal, low-pressure system emanating from eastern Iran and western Afghanistan. The depletion of Lake Hāmūn has compounded the region’s dust predicament, as the lake’s desiccation leaves behind a fine silt that has led to a marked escalation in dust emissions and, consequently, desertification in recent years [7,11]. This combination and the natural wind corridor created by the region’s unique topography [10] make this dust-laden landscape ideal for desertification.

The Archaeology

The Sistan Basin has served as a crucial habitation area, a significant transit point [12], and a focal point for the early development of Zoroastrianism [13]. However, our understanding of the region’s archaeology has been significantly limited by the challenges posed by its harsh and unpredictable environment. The harsh climate, marked by extreme summer heat and relentless winds, has hindered prolonged archaeological exploration, as evidenced by an early report which states, “The summer heat and wind . . . curtailed a more ambitious program to a week’s operation” [4] (p. 9). International, national, and neighbouring conflicts have further contributed to this region’s intermittent and under-explored archaeology. Despite these challenges, archaeologists have concluded that human presence in Sistan dates to 3000 BCE [4,14,15,16].
Dedicated archaeological efforts in Sistan were carried out in the 1930s by the Hackin-Carl-Meunié mission, followed by colleagues who excavated nearby sites throughout the nineteenth century [4,15,17]. Notably, Fairservis excavated and surveyed the surrounding landscape from 1949 to 1951 in southwestern Afghanistan and Eastern Iran [4]. Fairservis’s survey presented a comprehensive summary of his findings, correlating different periods with specific regions and drawing explicit connections with Stein’s work [18], particularly emphasizing consistency in painted wares. Following Fairservis, in 1966, a significant survey of the Helmand Valley identified forty-five sites, confirming the presence of prehistoric occupation in the region [4]. The most recent and extensive archaeological undertaking in Afghanistan’s Sistan, the Helmand Sistan Project, occurred from 1971 to 1979 [16]. This project documented 200 sites from the Bronze Age to the present day and synthesized and built upon previous research efforts in the region. It aimed to provide a comprehensive cultural overview of the past and present of the region. The Helmand Sistan Project is one of the area’s last large-scale and long-term research initiatives, given the disruptions caused by the Soviet invasion in 1979 and the subsequent ongoing internal and international conflicts in the region. The protracted War in Afghanistan, involving the United States and Taliban leadership, persisted from 2001 to 2021. Additionally, the Sistan and Baluchestan insurgency [19] and ongoing conflicts along the Sistan border between Afghanistan and Iran [20,21] have rendered archaeological fieldwork exceedingly tricky at the time of writing this work.
Due to the ongoing safety hazards for fieldwork, remote sensing is the best option for archaeological work to progress within the region. Several projects have taken to task the adaption of remote sensing to at-risk cultural heritage. Remote sensing is ideally suited to understand the extent and ongoing implications of desertification for archaeology. This research compiles past survey work and new site documentation from the Endangered Archaeology in the Middle East and North Africa (EAMENA) database, generating an understanding of the threat of desertification to the region’s known and yet-to-be-discovered archaeological record.

2. Method

There are many ways to approach desertification in remote sensing. The combination of various spectral indices can provide insight into land degradation and sand cover resulting from desertification processes. According to the impact of types of desertification on archaeological resources, desertification trends yielded by the current model correspond to both dust inundation and land degradation [22] (p. 5). The current method utilizes imagery from Landsat 8 Operational Land Imager (OLI) due to the sensor’s spatial and temporal resolution, allowing observation of the Basin’s change over time.
The current methodology focuses on simplicity and reproducibility, relying on indices that yield sufficient, accurate, and appropriate results without excessive processing, technological prowess, or time. In addition, the variables for the present methodology were kept simple and limited to five, including only the three indices, wind speed, and elevation variables. Furthermore, the resolution of the imagery was kept to the most available imagery for public access, with the greatest temporal resolution and accessibility, utilizing Landsat data exclusively. It is noted that Sentinel data might also meet these ends, but Landsat was chosen for this case study due to access to a temporal resolution that future users might deem necessary. High-resolution data were avoided to showcase the utility of open source, and medium-resolution data to ensure widespread application for future users.

2.1. Data Acquisition

Satellite imagery was accessed via EarthExplorer, an API managed by the United States Geological Survey (USGS), specifying the Landsat 8 Operational Land Imager (OLI) Level 2, Collection 2, Tier 1 imagery collection. The download specifications included Bands 1 to 7 for processing the spectral indices of the normalized difference vegetation index (NDVI), top grain soil index (TGSI), and modified normalized difference water index (MNDWI). The download specifications were set to include the study area and beyond, including the Helmand Valley, to understand regional desertification interactions impacting the study area. In ArcGIS Pro 3.3, images were merged into composite, mosaicked GeoTIFFs for further processing. Surface data, including wind speed, geological, and climactic data, were collected from the Global Wind Atlas, the Princeton University Library, and ESRI’s ArcGIS Hub. Desertification trends for Sistan were evaluated using Landsat 8 OLI imagery and surface reflectance from 2015 to 2021, resulting in 1905 images (Table 1). The study focused on 2015, 2017, and 2021 for efficient processing and evaluating the landscape’s change at shorter intervals. Imagery included composite images each year, with total image counts per year exceeding 300 (Figure 2). Ancillary data, including wind speed, geological, and climactic data, were collected from the Global Wind Atlas, the Princeton University Library, and ESRI’s ArcGIS Hub.

2.2. Processing

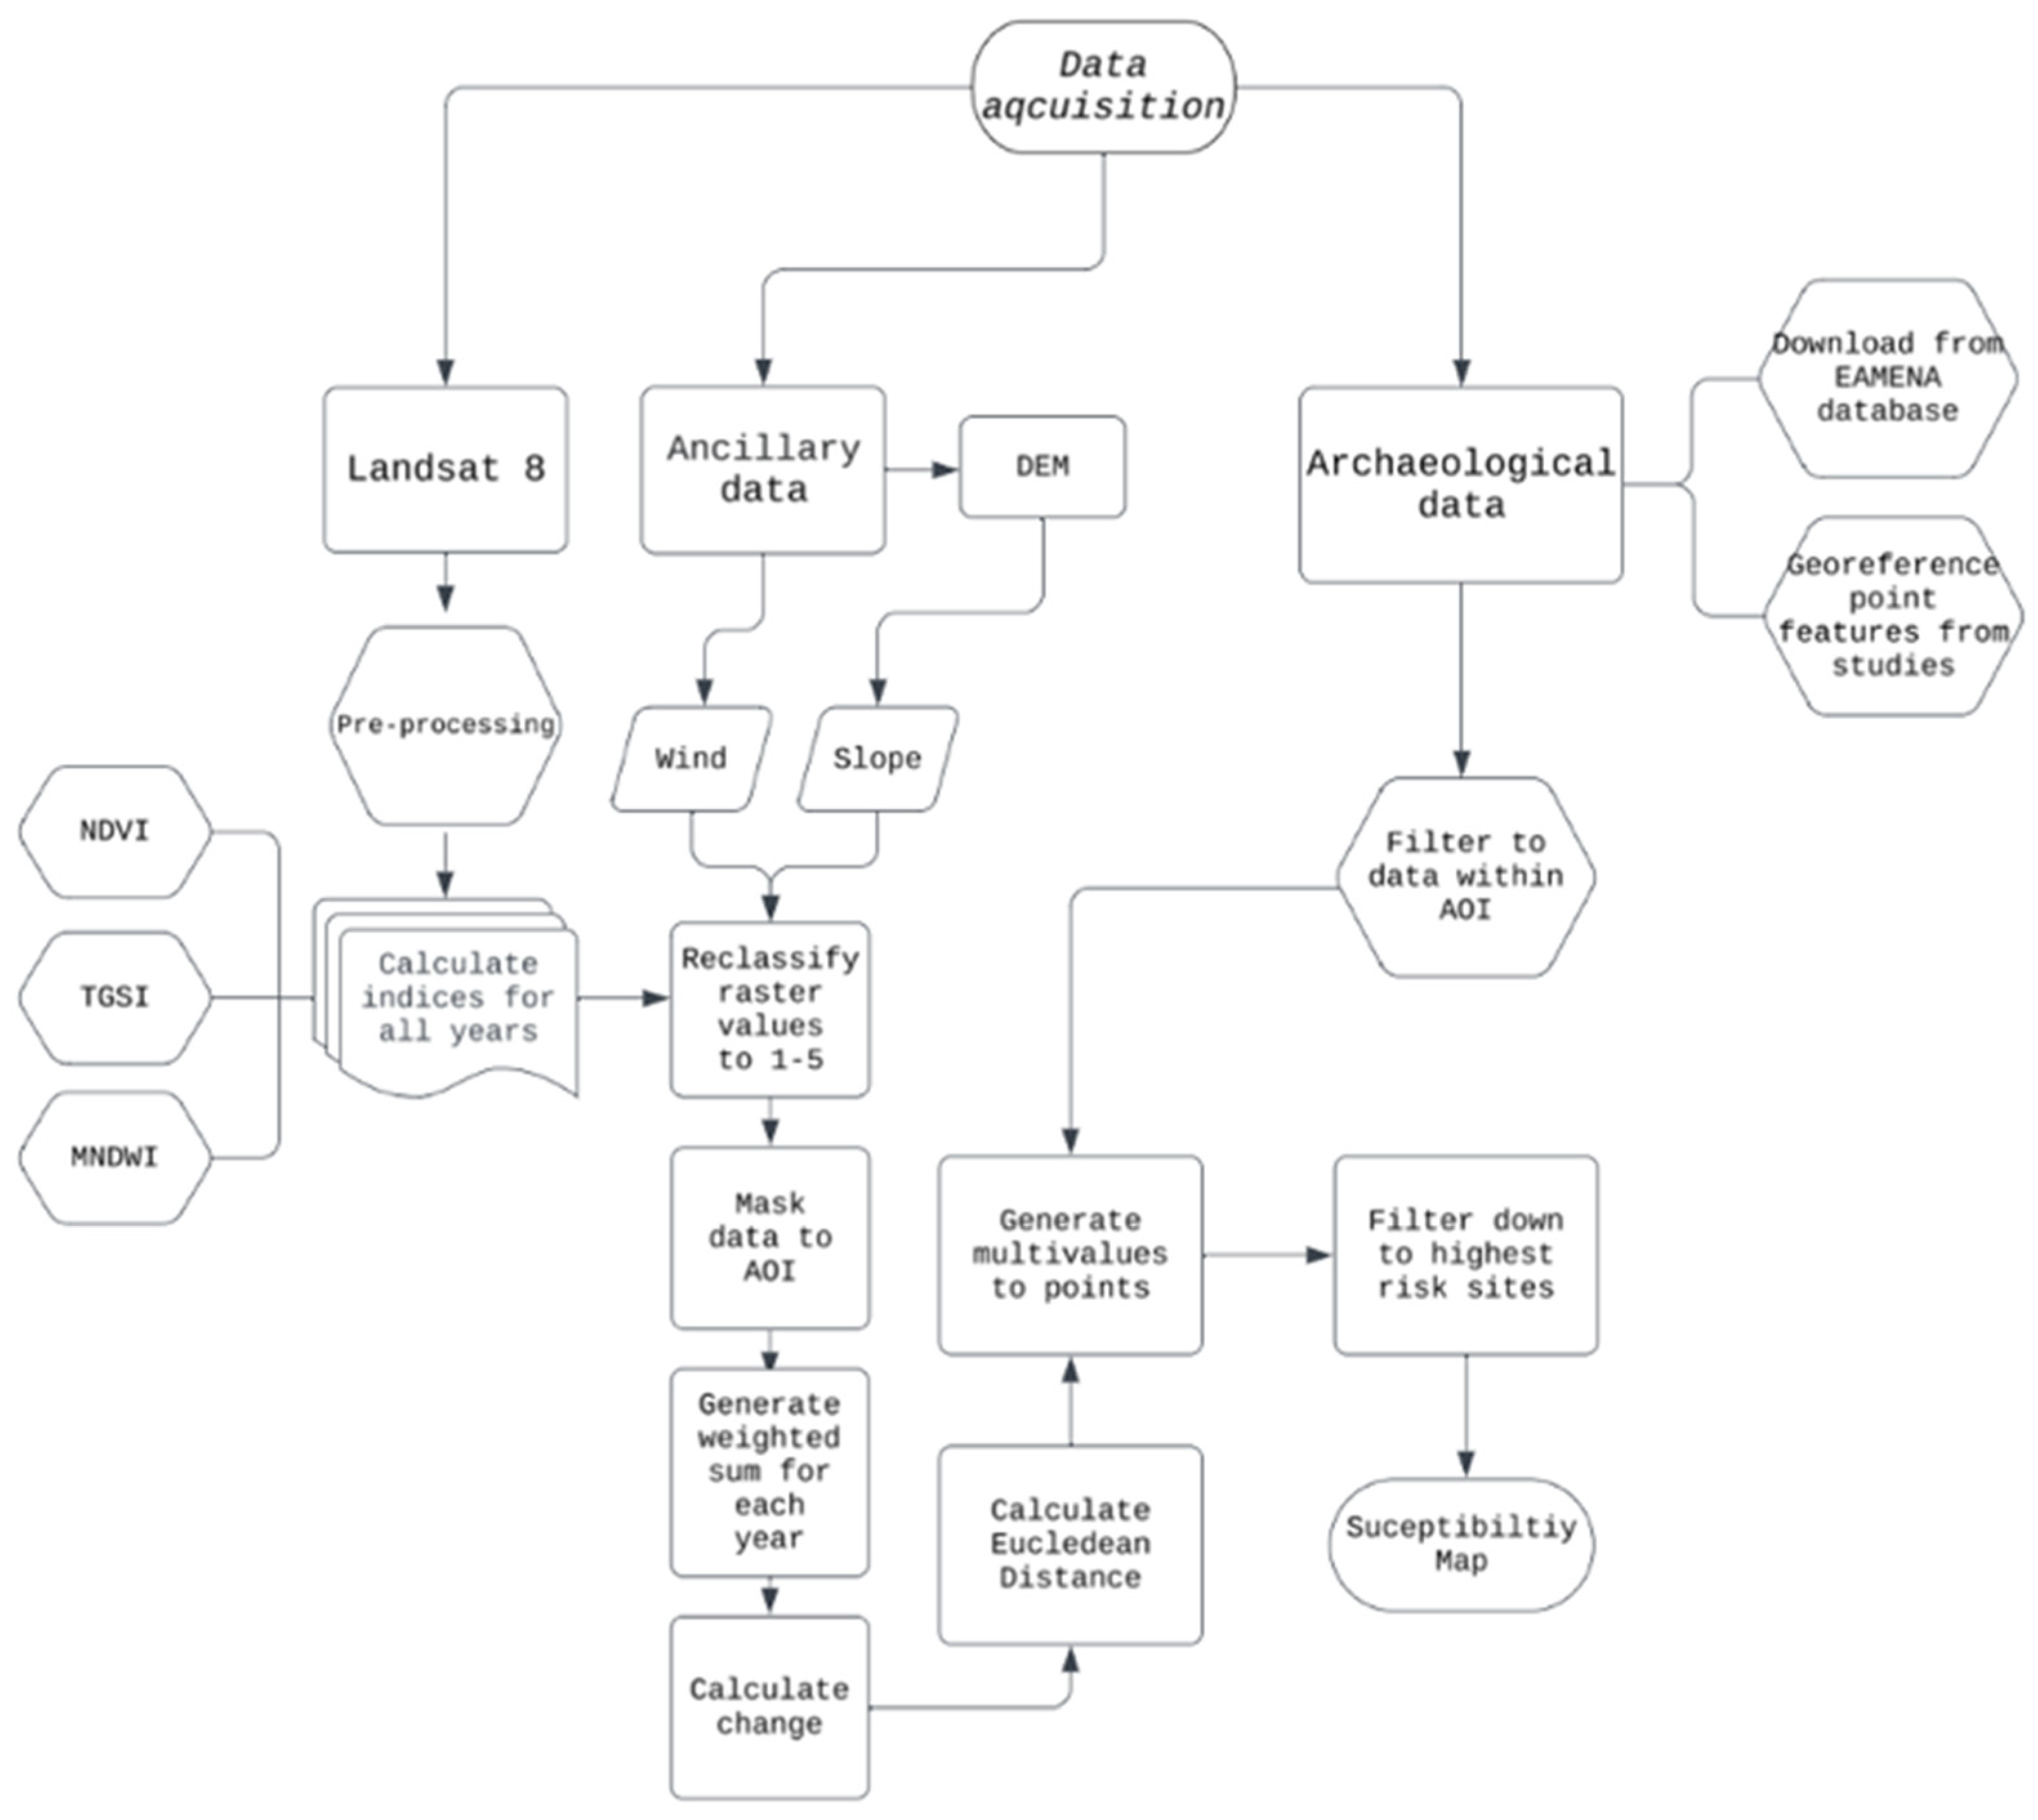
The indices were chosen to allow for ease of processing, and therefore reproducibility for future studies. The normalised difference vegetation index (NDVI), top grain soil index (TGSI), and modified normalised difference water index (MNDWI) were combined using ArcPro’s raster calculator. These indices and archaeological data were collected and filtered to generate the final desertification susceptibility map for known and potential regional areas.

2.2.1. Normalised Difference Vegetation Index (NDVI)

The NDVI measures the extent of and health of vegetation. NDVI is calculated by measuring the difference between the vegetation reflective near-infrared (NIR) and the vegetation absorbing red (R) bands (Equation (1)). The chlorophyll in vegetation reflects NIR and green light while absorbing red and blue light. NDVI values range from −1 to 1, with higher values indicating denser vegetation and lower values likely indicating water. In the instance of NDVI values closer to zero, it likely means a lack of vegetation.

2.2.2. Top Grain Soil Index (TGSI)

The TGSI computes the grain size of the topsoil. TGSI is calculated utilising the red (R), blue (B), and green (G) bands (Equation (2)). TGSI values range between −1 and 1. Negative values correlate with less or no sand and values < 0.20 indicate sand cover.

2.2.3. Modified Normalised Difference Water Index (MNDWI)

The MNDWI indicates the presence of water in imagery using the green and short-wave infrared (SWIR) bands (Equation (3)). MNDWI values range from −1 to 1, with 1 corresponding to higher water values. MNDWI also has the benefit of diminishing built-up features that may otherwise be falsely interpreted as water [23]. MNDWI is useful in the present case study due to the unknown extent of water resources across Sistan.
N D V I = G R E E N N I R G R E E N + N I R
T G S I = R E D B L U E R E D + B L U E + G R E E N
M N D W I = G R E E N S W I R G R E E N + S W I R
C h a n g e = Y e a r F i n a l Y e a r I n i t i a l
Raster values for each year’s image were reclassified to equal 1 to 5 to normalise comparisons across years. Each year’s desertification extent was calculated using a weight of 2 for the indexed year, 2 for slope, and 1 for wind speed (wind speed received a lower weight to account for coarser spatial resolution (100 m) of the data)). Finally, the yearly change was determined by taking the previous year’s composite index image for the following year (Equation (4)). This methodological breakdown is quick and straightforward and provides a general understanding of the known archaeology at risk and regions at the highest risk of desertification (Figure 3).
In addition to NDVI, TGSI, and MNDWI, wind speed and slope were added to the final desertification analysis, with data collected from the Global Wind Atlas and DEM collected from ASTER imagery. All years from 2014 to 2021 were processed and combined using a raster calculator with the indices. Each image’s final resulting value was reclassified to equal 1 to 5 to normalize comparisons across years. Each year’s desertification extent was calculated using a weight of 2 for the indexed year, 2 for slope, and 1 for wind speed (wind speed received a lower weight to account for poorer resolution). Finally, a raster calculator was used to determine the yearly change by taking the previous year’s composite index image from the following year (Equation (4)). This methodological breakdown is quick and straightforward and provides a general understanding of the known archaeology at risk and regions of the AOI at the highest risk of desertification.
Many approaches to remote sensing include the indices of the albedo, bare soil index (BSI), and soil adjusted vegetation index (SAVI), all of which suit the appropriate environments and would likely apply to Sistan’s desertification issue [22,24].
The current methodology, however, was most interested in simplicity and reproducibility, relying on indices that, when correlated with ancillary data, would yield sufficient, accurate, and appropriate results without excessive processing adeptness or time. In addition, the variables for the present methodology were kept simple and limited to five, including only the three indices, wind speed and elevation. In other studies, variables to measure desertification can range from one to nine [22]. This simplicity intentionally allows for replication across areas of interest by omitting or adding variables as appropriate per a given landscape.

2.3. Archaeological Data

Point features were accessed from the EAMENA database, Fairservis’ study in 1961 [4], and the Helmand Sistan Project to understand the extent of identified archaeology under threat. The EAMENA database is a collaborative open-source platform developed by the Getty Conservation Institute and the World Monuments Fund, with known and regularly updated site locations accessible to researchers and heritage experts. The EAMENA database is quarriable, and sites or archaeological features can be extracted in tabular form. The coordinates for the features are within the tabulated data and can be projected as points and or polygons for use in a GIS. The EAMENA database yielded 988-point features within the study area. Fairservis identified 114 sites, including descriptions and illustrations, which have proven helpful in interpreting imagery. The Helmand Valley Project (HVP) identified 200 sites, 108 of which reside within the current work’s study area. These three studies were chosen solely due to the ample locations for archaeologically sensitive material across the region. There is the implied assumption of overlap across these studies’ sites, with many surveys conducting reinvestigations of previously recorded sites across the region. As a result of inconsistent characterization and site numbering, multiple names and characterizations could be assigned to the same site [16].

3. Results

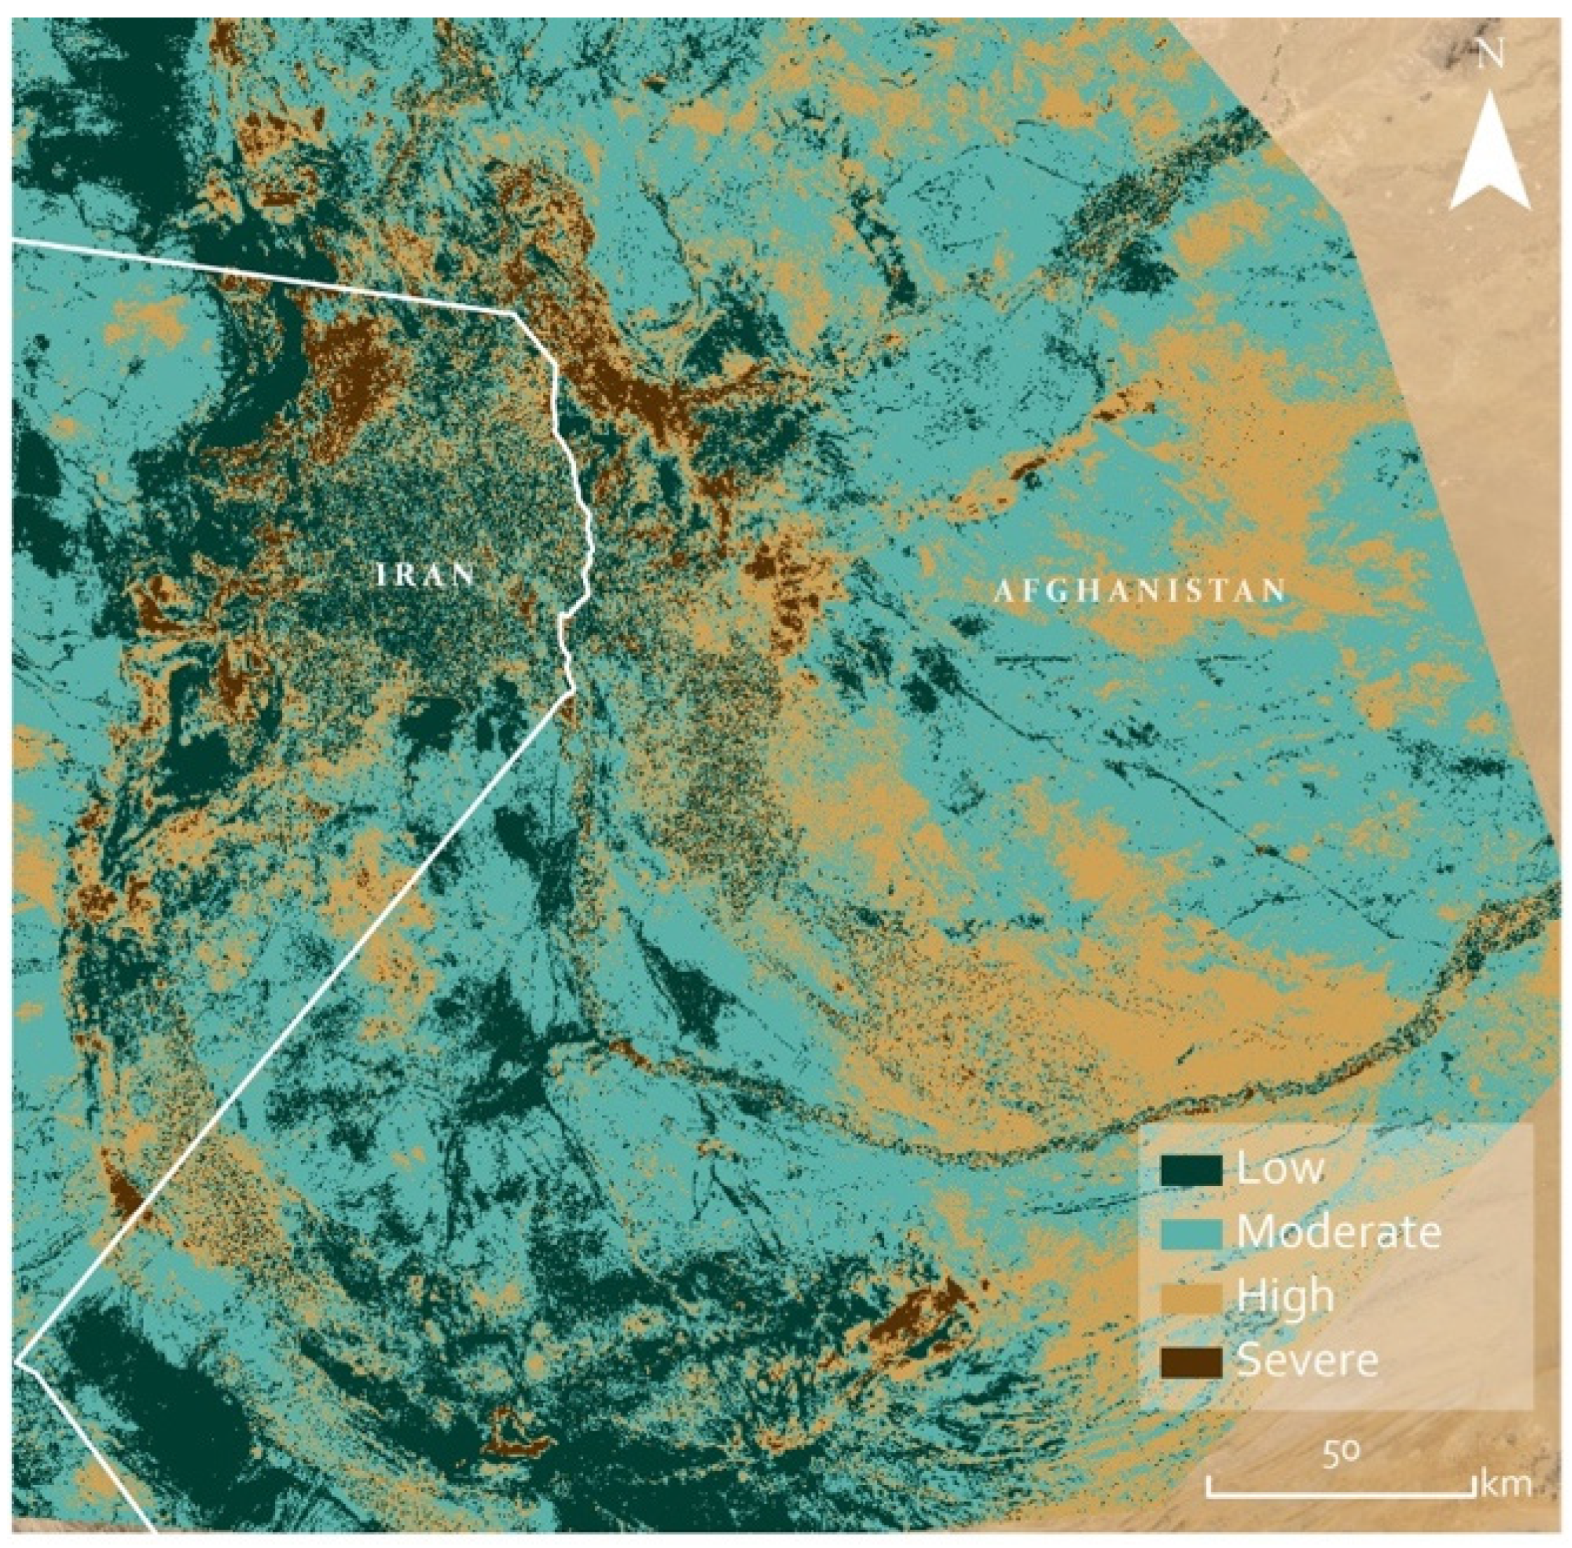
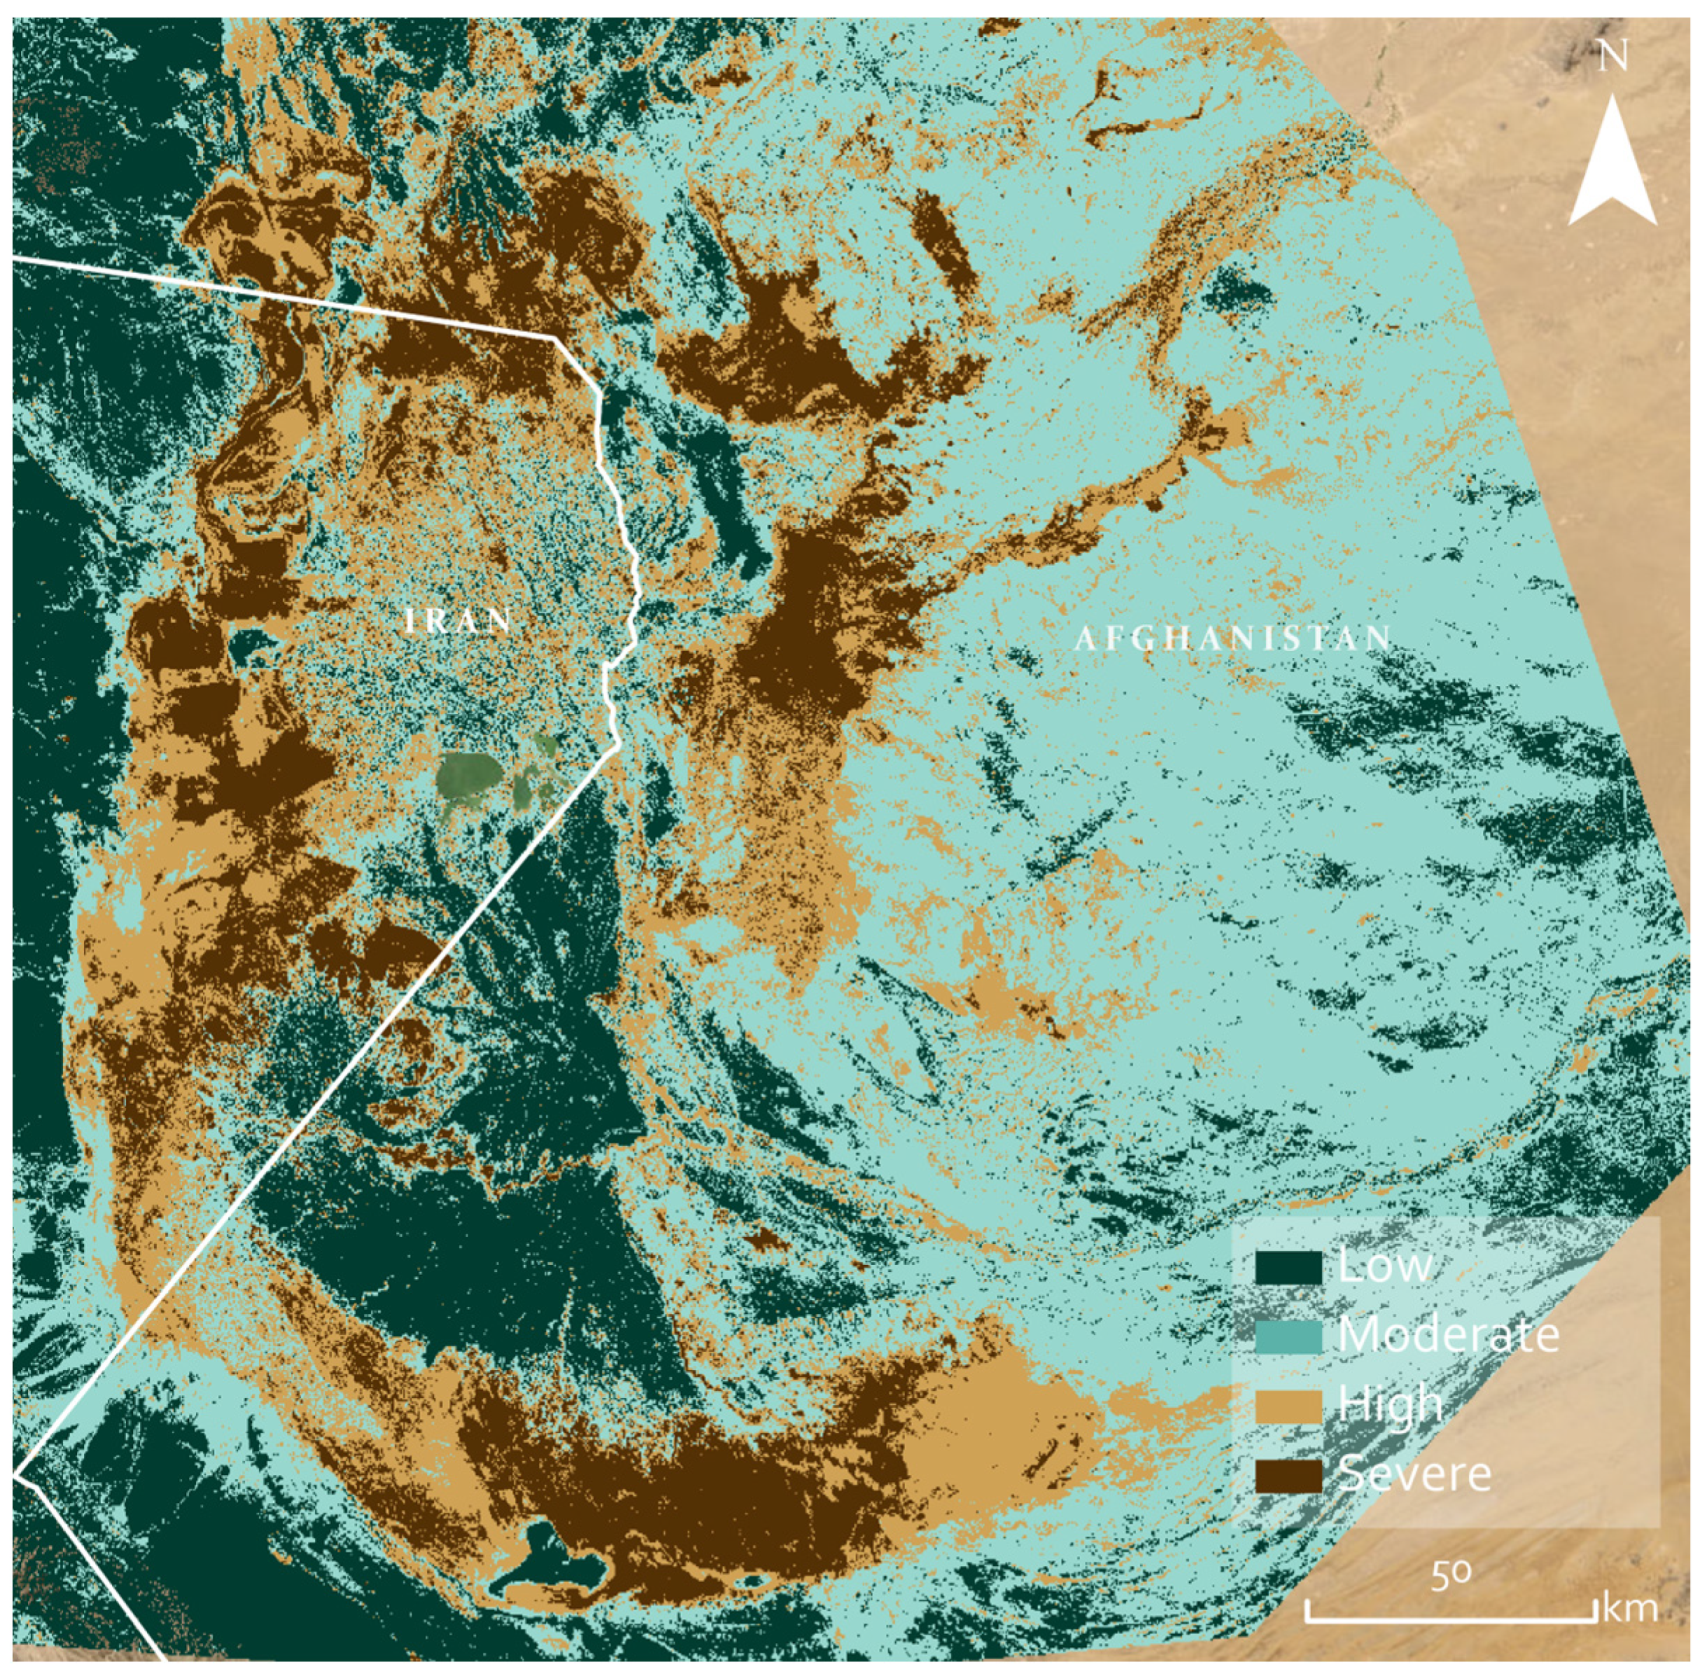
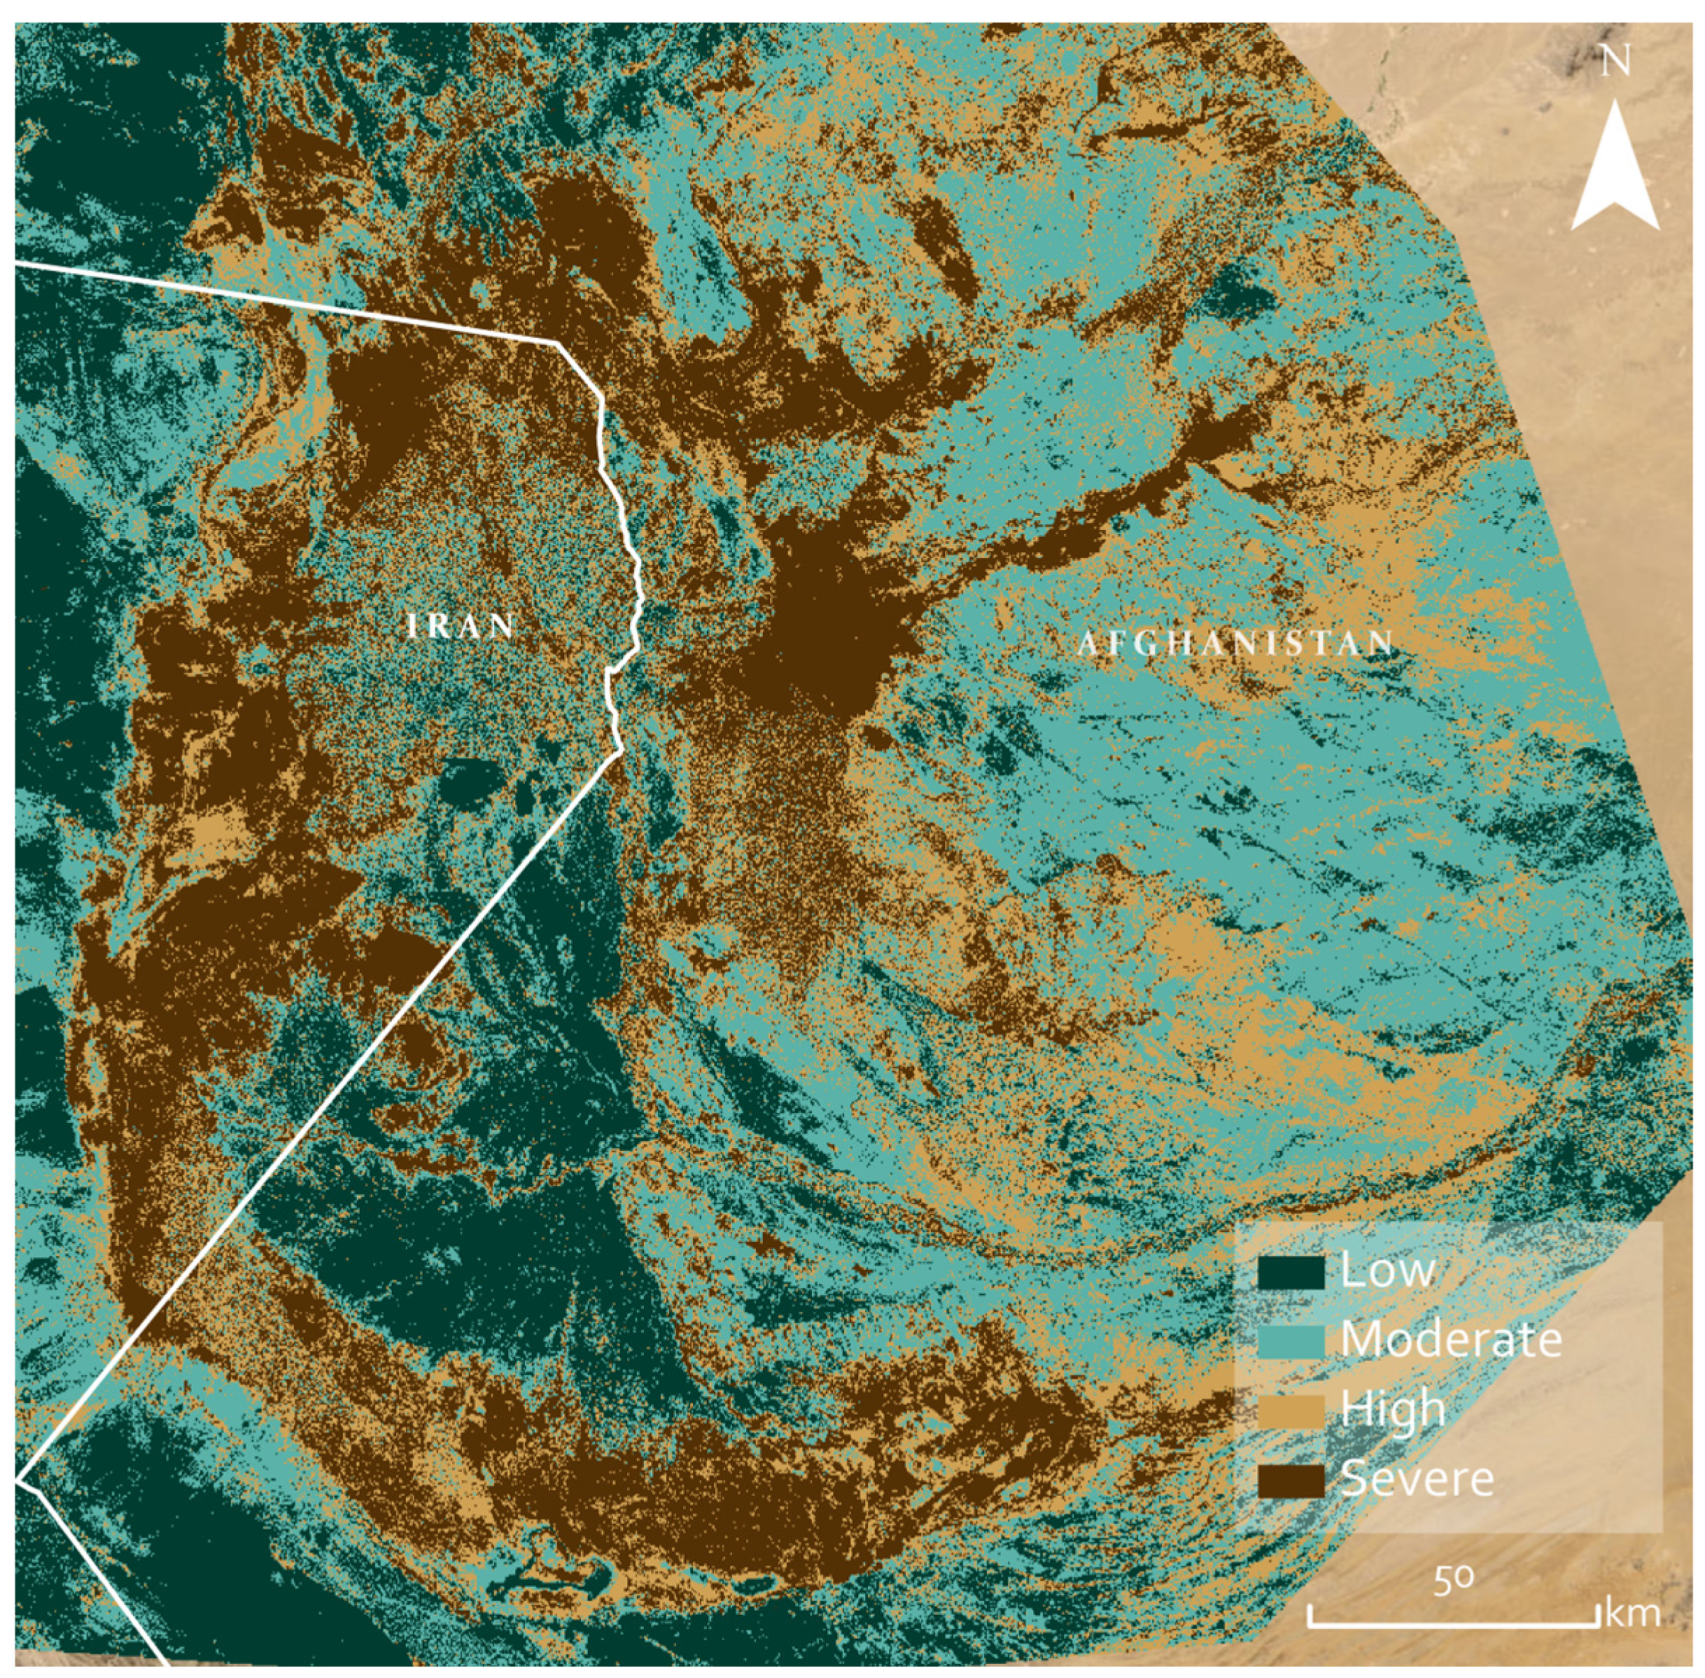
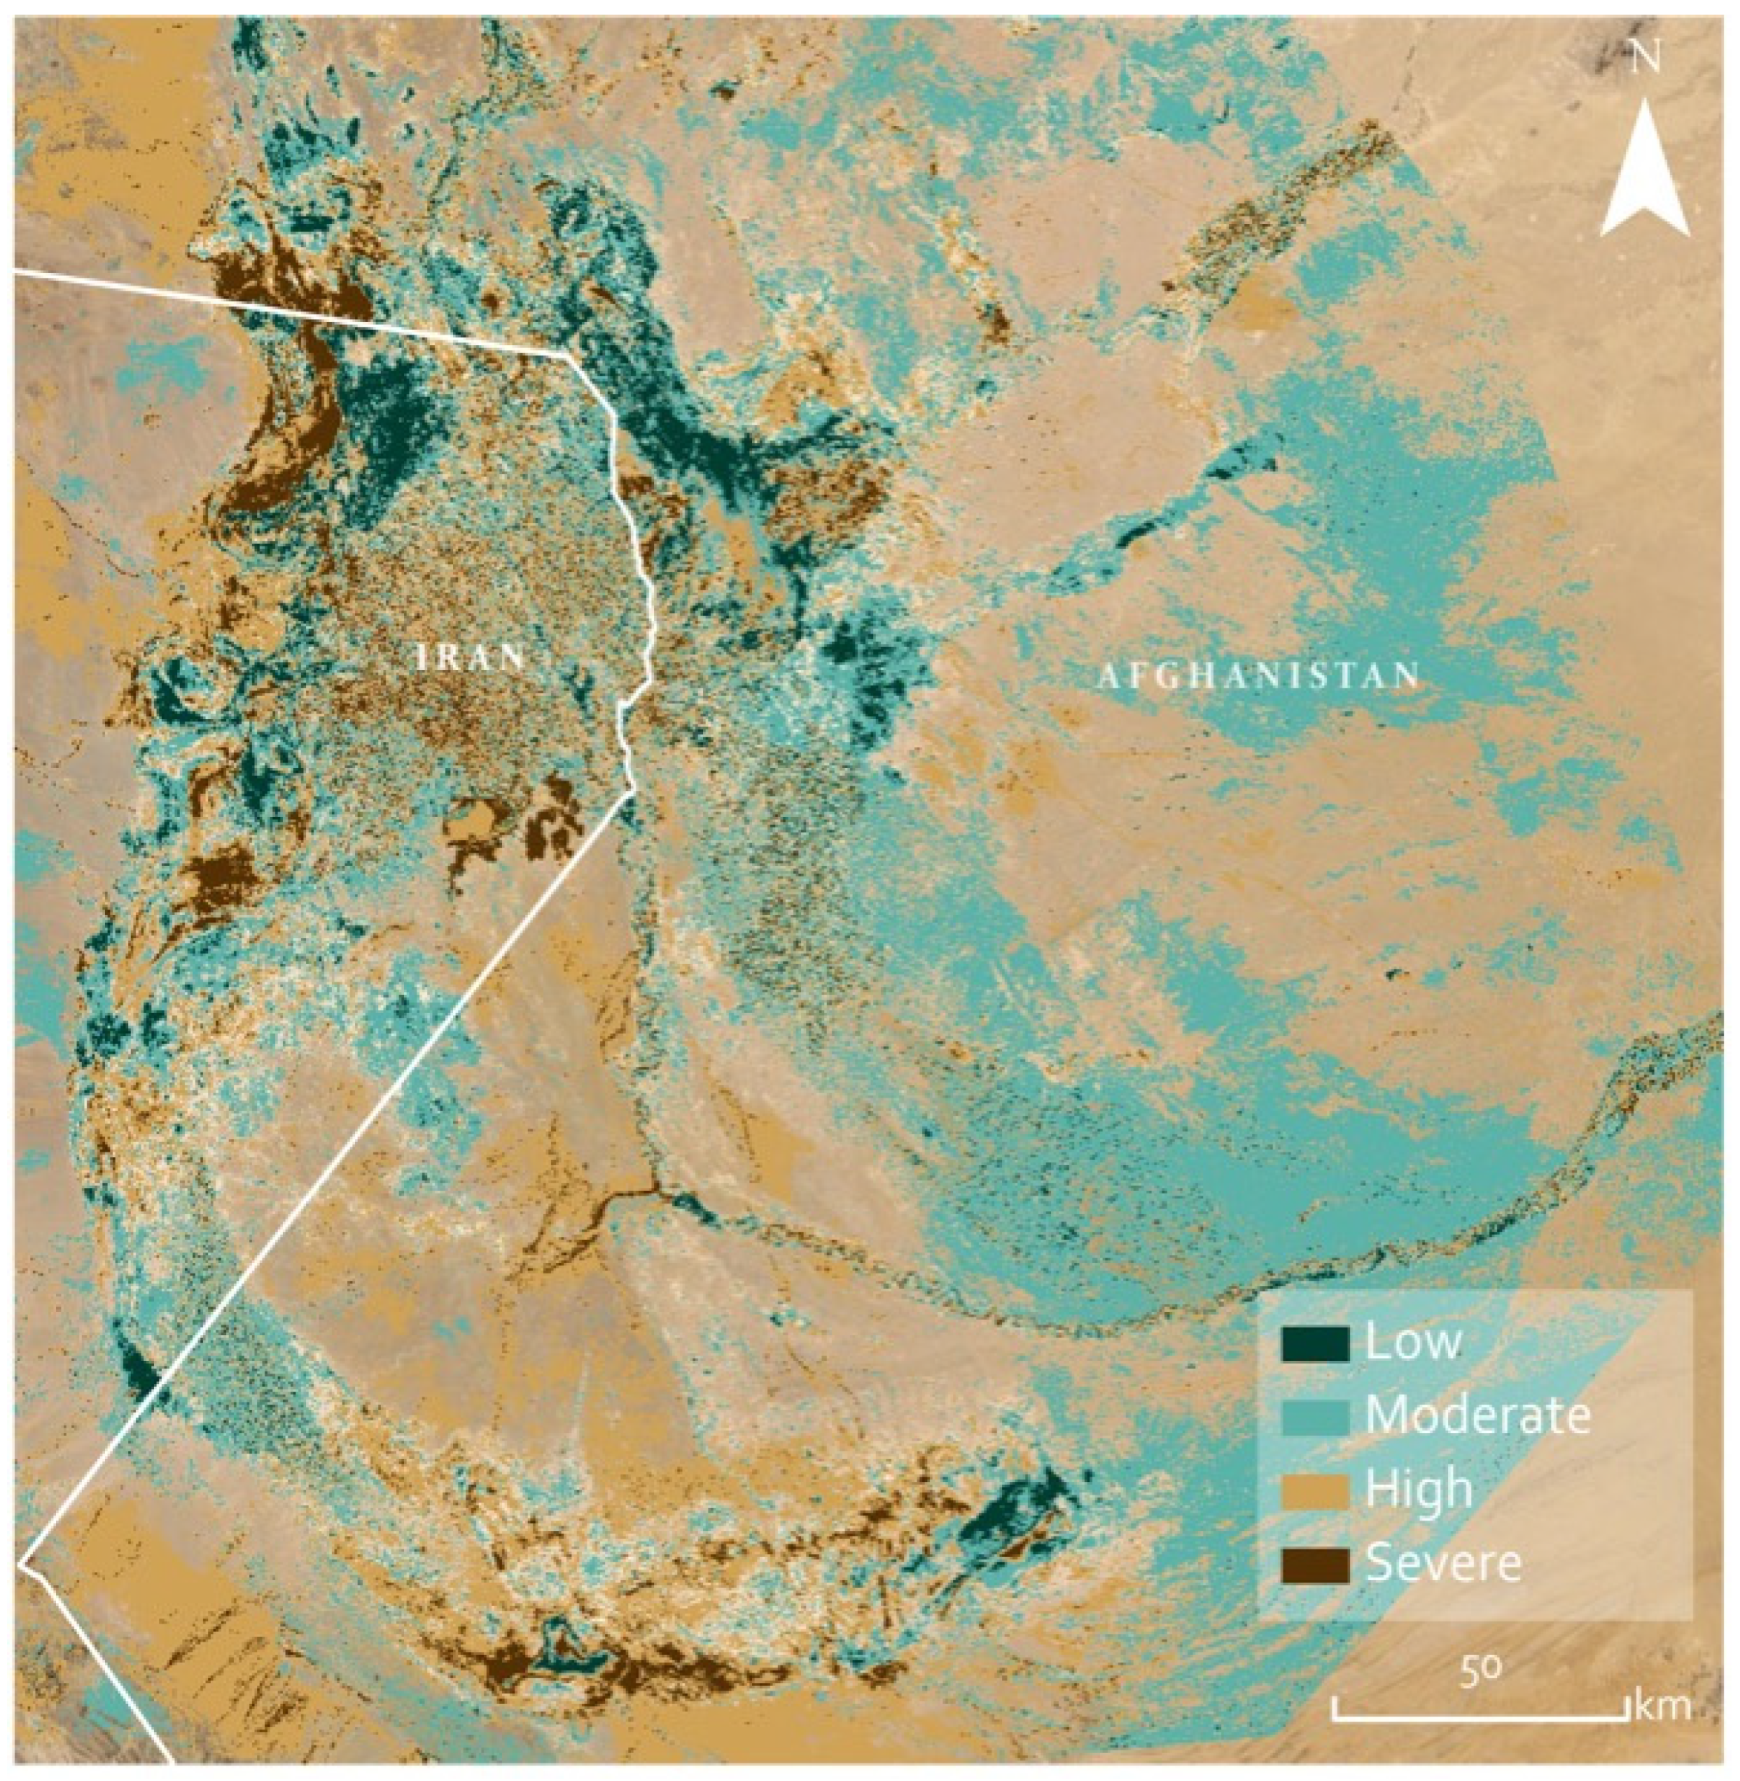
Desertification for 2015, 2017, and 2021 steadily increased. Desertification trends for 2015–2021 were significant, with an overall increase in desertification according to the model. The areas of greatest desertification across these years included areas to the north, east, and west of Lake Hāmūn and to the south, southwest of the southernmost portion of Helmand River. Lower levels of desertification were highlighted in the far west, northwest, and central plains near Helmand. It was expected that these regions would yield lower levels of desertification as they are concentrated in areas where either built-up cities exist (for example, Zabul in Iran) or are near areas heavily irrigated throughout Afghanistan (correlated with poppy production [25]. The years 2015 and 2017 experienced a high level of desertification, while 2020 experienced a decrease in desertification levels, with 2021 yielding a high level of desertification.
Desertification levels in 2015–2020 sensibly yielded high levels of desertification as was expected due to ongoing droughts [26,27,28] and the inequitable allocation of water resources from the Helmand River [29,30]. The decrease in desertification yielded by the model was also expected due to flooding (Figure 4) in 2020 [31]. Increasing temperatures cause desertification and lead to more extreme precipitation events [32]. The flood that impacted Sistan in 2020 may sound like a reprieve from desertification; however, its impact can be hazardous when flooding impacts parched soil. Desertification leaves behind a hardened, less porous soil, limiting the ability of soils to absorb incoming water [32]. This hardened soil increases flood velocity and can threaten people, infrastructure, and archaeological resources [33]. In 2021, desertification levels returned to approximately the level seen before 2020’s flooding. However, a flood of the 2020 level showcases the interplay between drought and extreme precipitation well. Rather than mitigate the excessiveness of drought and desertification in Sistan, extreme rainfall and drought galvanize one another [34]. Due to rising global temperatures, the drought–flood abrupt alternative (DFAA) is an increasingly regular phenomenon [35]. This DFAA interplay is showcased in the methodology, demonstrating yet further damage caused beyond desertification to the archaeology within the region. Desertification trends follow a consistent pattern across the landscape, with a consistent build-up in the plain to the south and southwest of the study area. A rounding desertification effect follows the landscape’s topography from the southeast and southwest to the northwest. Desertification trends increased from 2015 to 2021, including flooding in 2020 (Figure 5). From 2015 to 2017, desertification increased (Figure 6); from 2017 to 2021, desertification continued to increase, but not at the same rate as in previous years (Figure 7). Desertification trends near Lake Hāmūn resulted in high rates of desertification across all years apart from the year of flooding in 2020, after which desertification continued in 2021.

4. Discussion

A comprehensive analysis has yet to be presented such as the one offered within the present work’s methodology of desertification across the Sistan Basin. However, many studies have validated the current methodology via multiple variables that comprise desertification processes, including dust accumulation, wind speed, drought, and flooding. These studies serve as proxy validation for the results presented within this work. Lake Hāmūn is the primary water source for both Iran and Afghan Sistan. The Hāmūn was desiccated entirely in 2000 [27,36]. The Helmand River supplies Lake Hāmūn, accounting for over half of Hāmūn’s water supply [37]. The flow of the Helmand, however, has been drastically limited due to both anthropogenic and natural factors, including Afghanistan’s upriver dam construction and a decrease in the regularity of annual precipitation across Sistan [26,27,28]. It is notable that the increase in water use has been prohibited due to damming across Afghanistan and is correlated with Afghanistan’s increase in opium cultivation throughout the region (UNODC. 2020), ‘Opium cultivation in Afghanistan has increased from 900 km2 (in 2000) to over 3300 km2 (in 2017). The major opium canters of the country (almost equal to 75%) are found in the provinces located in the Helmand Basin [27] (p. 1241). Building upon Akbari and Haghighi’s [27] study on diminishing water resources, a study assessed the impact of the drying of Lake Hāmūn on increasing dust particles and subsequent dust storms [7]. This study showcased the temporal change of Sistan’s water bodies, correlated these data with wind levels, and finally modelled the extent of dust inundation resulting from these interactions. The study found that dust in the Sistan region has increased up to 80%. The drying of water bodies has resulted in a 77% increase in climactic heating in Sistan due to this dust accumulation [7] (p. 11). There is also evidence of a decline in the water bodies of the Chah Nimeh reservoir (in the southeast of Sistan) following 1997 and the recession of flow from the Helmand River [29]. The deep water of the reservoir decreased by 22.7 to 15% from 2002 to 2011, and shallow water decreased from 9.1 to 4.7% [29] (p. 8). This reduction in water increases silt (‘The change in salt land increased from 6.9 to 19.1%’ [29] (p. 8)). and coupled with the yearly wind, increases the likelihood of an environment ideal for desertification. These issues plaguing Sistan all give credence to the results exemplified by this work’s methodology and the dramatic desertification ongoing and increasing throughout the region.

4.1. Application to Archaeology

4.1.1. Record Prioritisation

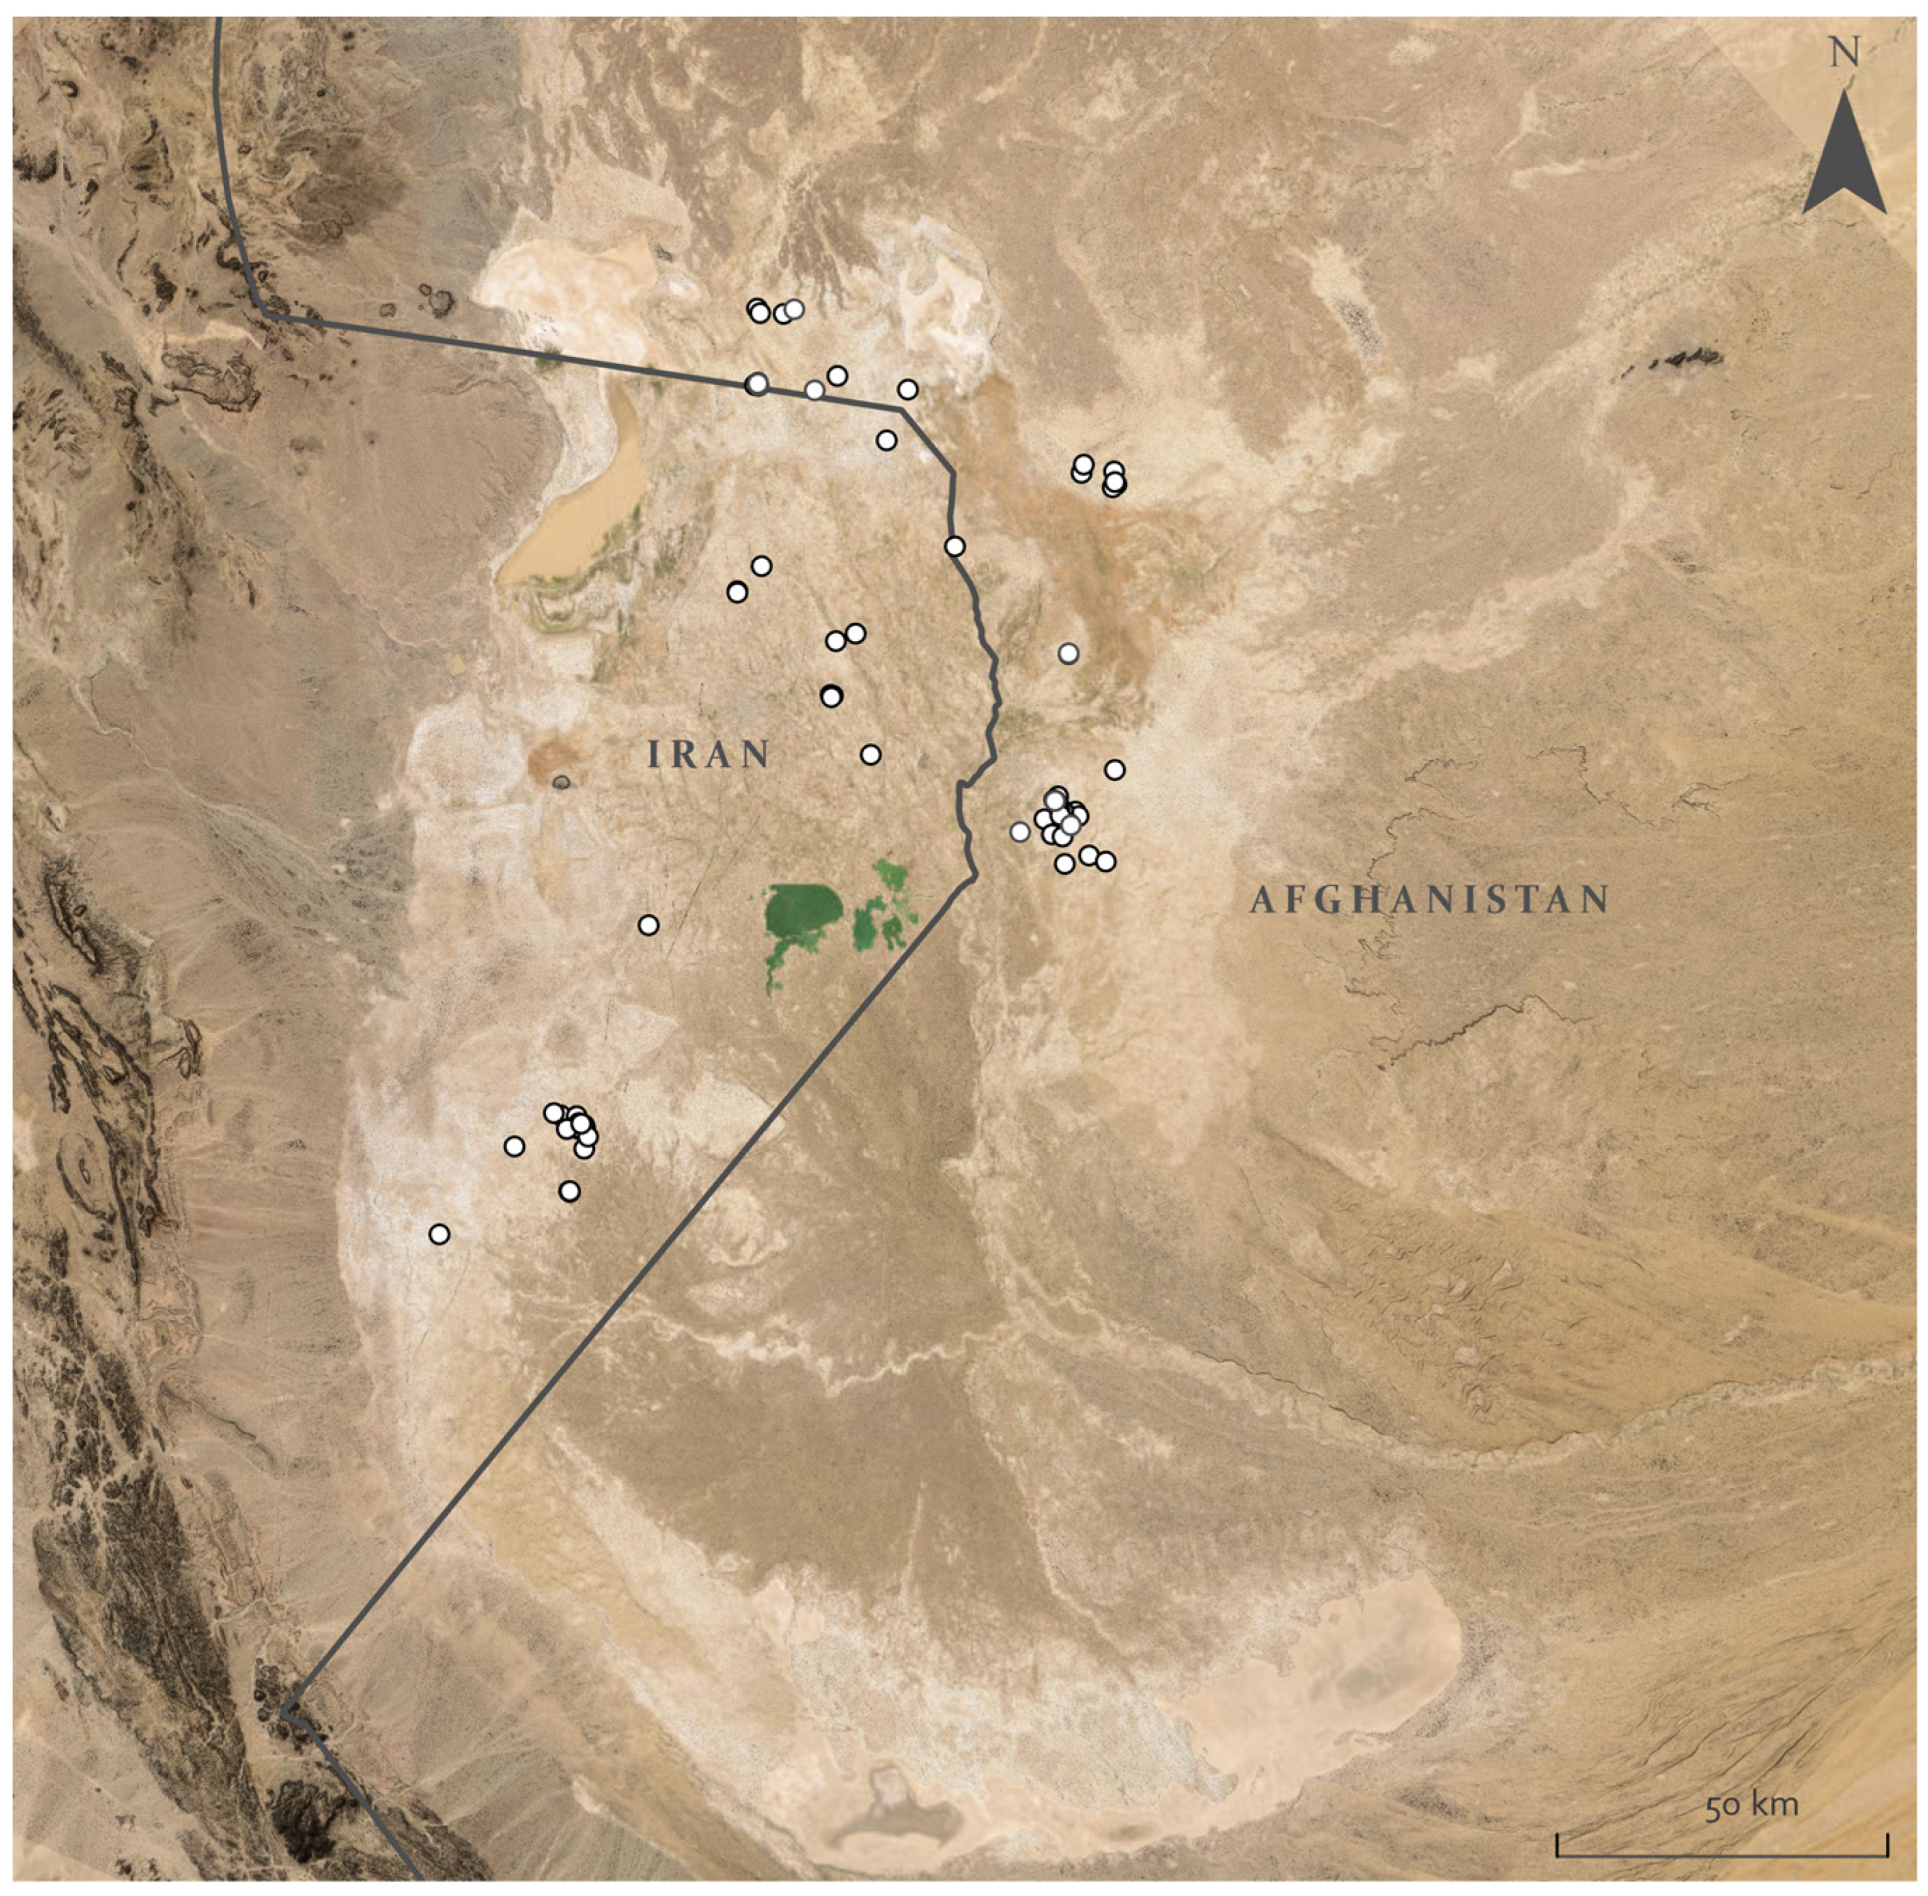
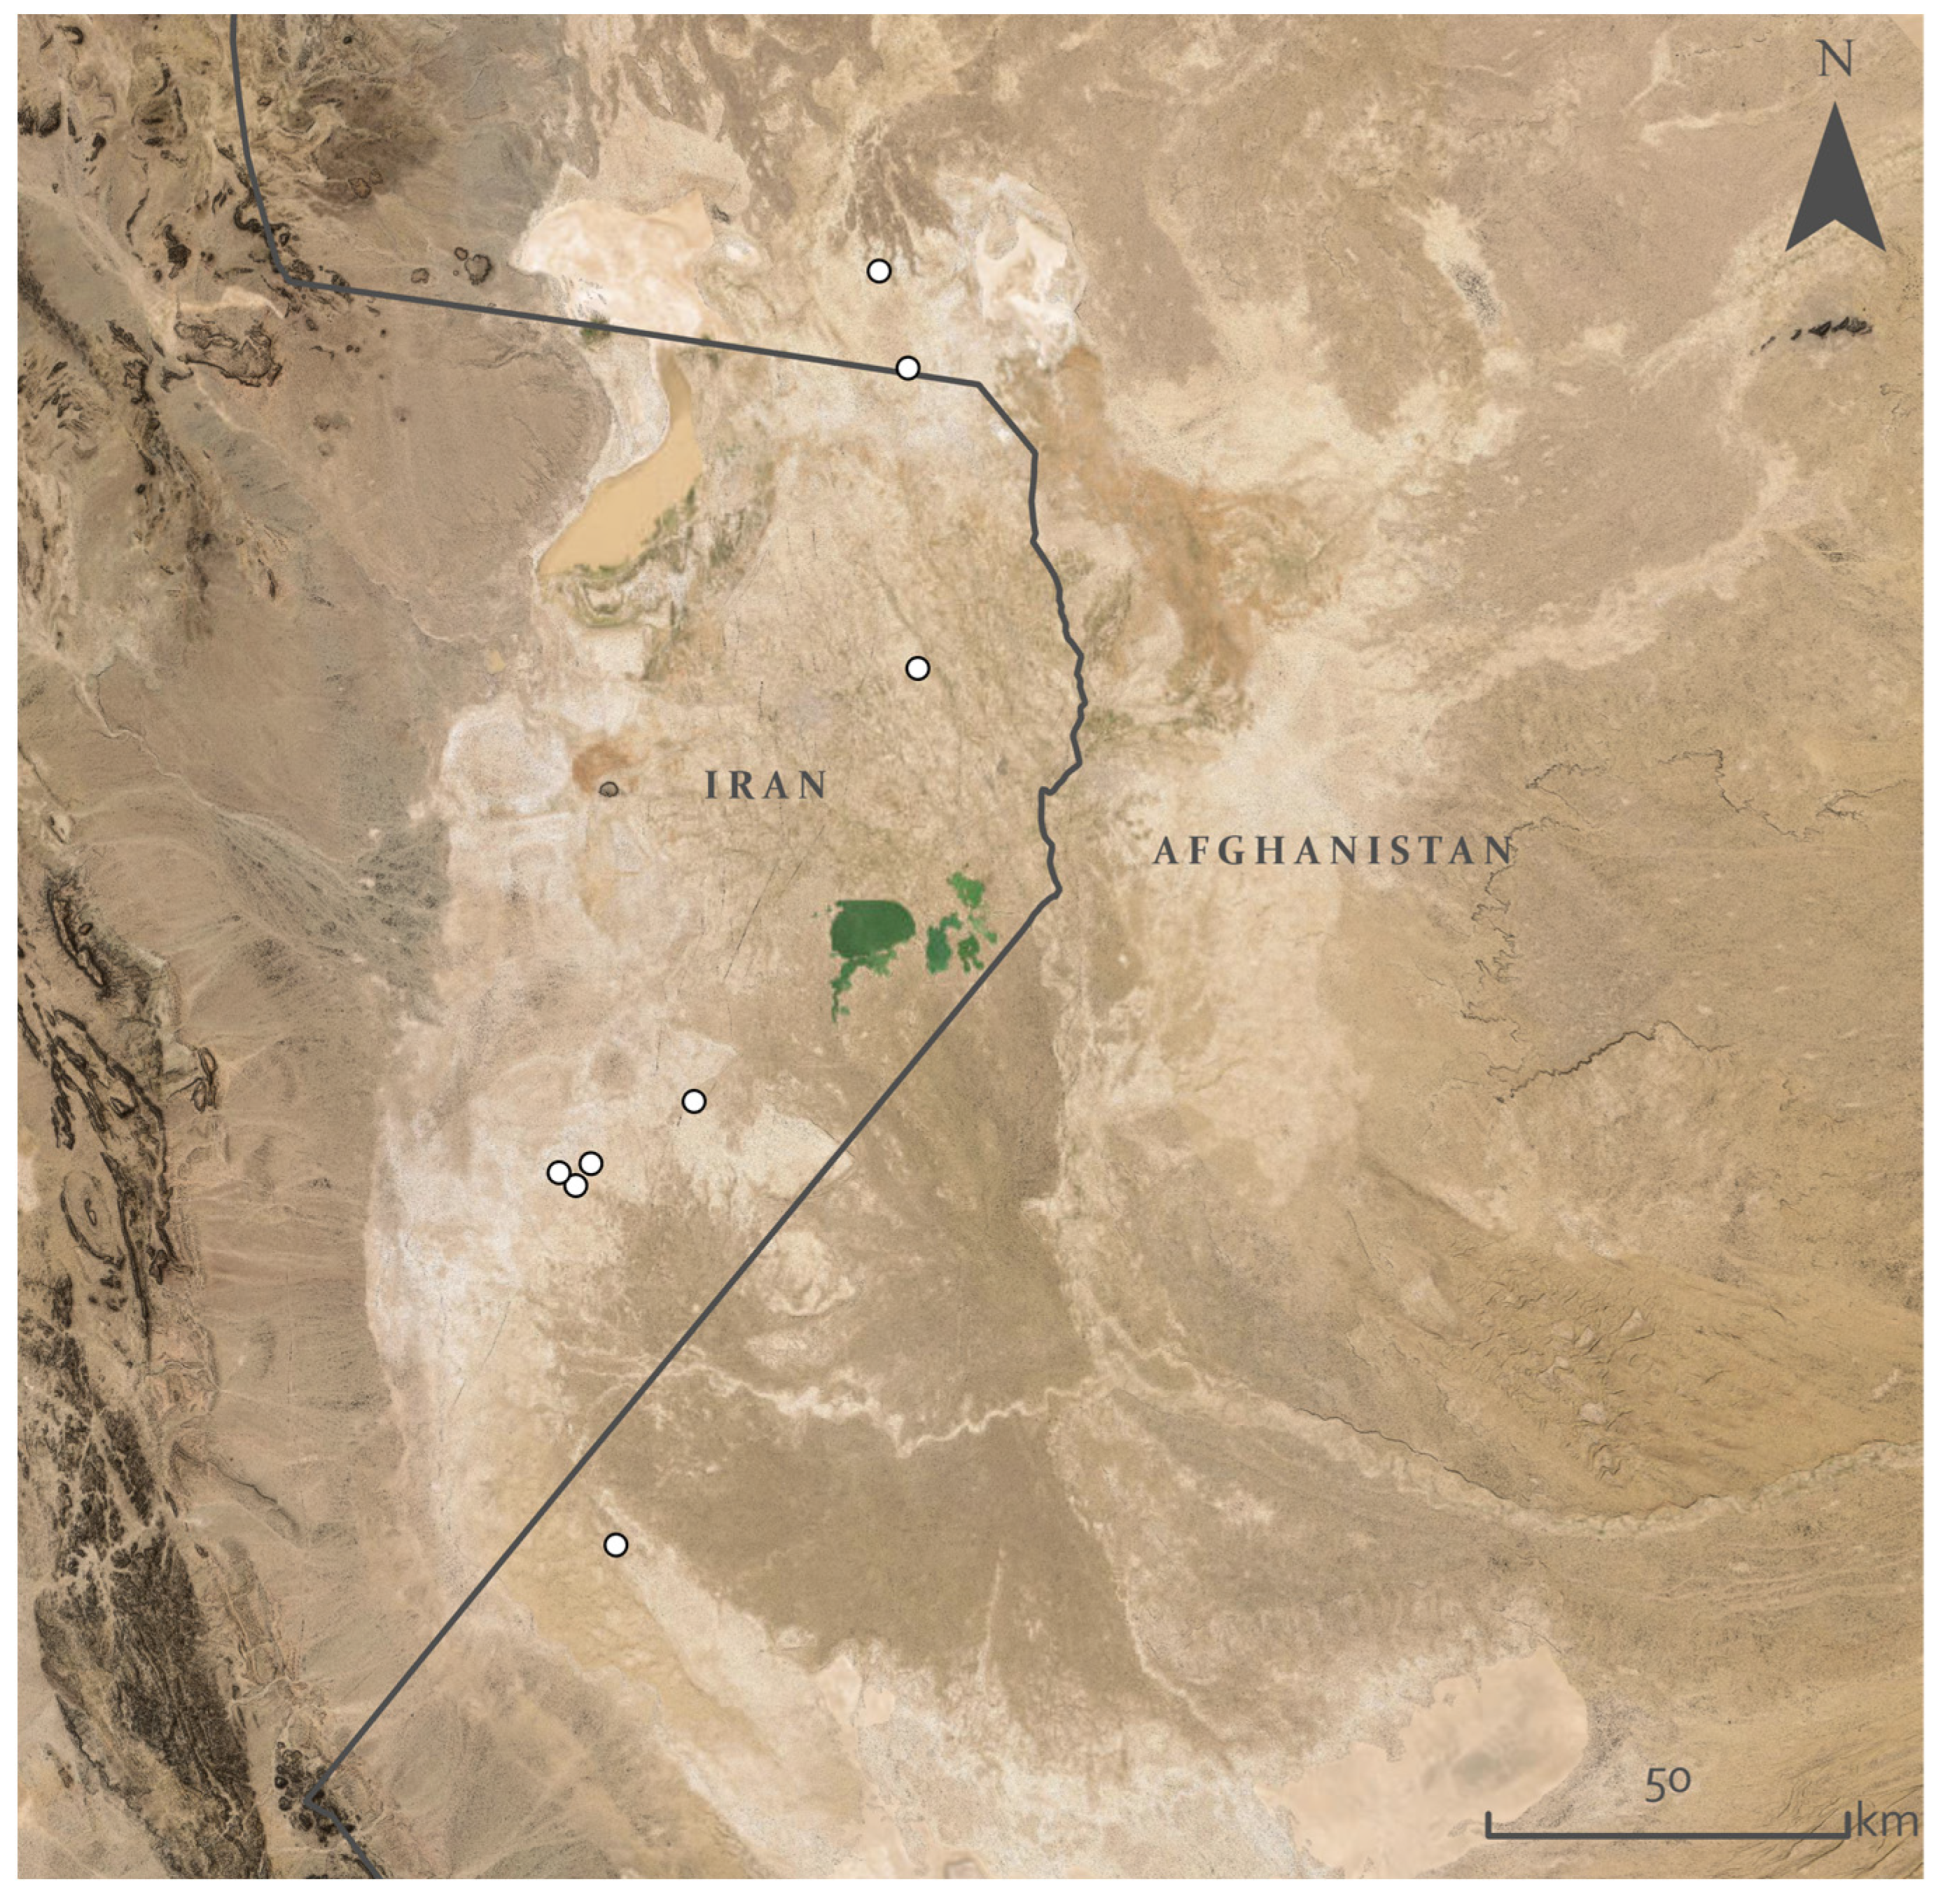
To demonstrate record prioritization for the current study, desertification results from the most recent year were utilized to determine which archaeological sites are currently under the most significant threat of desertification. Archaeological point and polygonal records were extracted from the EAMENA database. In ArcPro, sites were selected with criteria indicating that they resided within the 2021 desertification raster image’s cells classified at ‘severe’ risk of desertification. This resulted in approximately 87 high-risk features (Figure 8). Fairservis’ collection of 114 sites included six at high risk of desertification (Figure 9). Fairservis describes these at-risk sites in detail, providing a further understanding of the archaeological character of the landscape [4]. Fairservis frequently mentions the impact of desertification processes on what he calls site 109, stating, ‘Wind and water erosion had cut deeply into the ground of the site . . . The piles of sherds were accumulated in very soft, windblown silt . . . Some of the graves had been undercut by the wind so that an occasional vessel hung out of the bluffs above our heads . . . pp. 69–72). Of the Helmand Sistan Project’s 200 sites, 18 were at high risk of desertification (Figure 10). These sites are positioned in Afghanistan (as the project did not cross into Iran) and reside in a cluster central to the study area, east of Lake Hāmūn. These at-risk sites are from various periods, including the Parthian, Sassanian, and Timurid. According to the survey, the Parthian and Sassanian periods were the most flourishing for the region [16]. Palaces were built during this time, and Zoroastrianism became rooted, with the survey identifying several fire temples [16]. One site at risk, Sar-o-Tar, holds evidence that it hosted a place of extensive agriculture and prosperity. The site showcases historic dune inundation across its relatively lengthy habitation [16]. Evidence of the survey for the presence of the Timurid period under threat of desertification includes discovering several mudbrick buildings, coinage, glazed pottery, and imported goods from China [16].
This prioritization method is unique in that it can be utilized quantitatively or qualitatively. Due to the medium spatial resolution of the Landsat 8 data, there is ample ability to visualize the image’s cells with the highest levels of desertification. The clarity of where levels are and are not high allows for a quick analysis of which sites residing in these areas should be prioritized due to their level of risk. As the records in the EAMENA database are primarily from later, unknown to the Islamic period, it would be interesting to explore the hypothesis that this is the result of sites existing on top of older sites or the result of sites nearby not showing up on imagery due to desertification processes, for example, buried by sand.

4.1.2. Transitional Sites

Sand accumulation limits access to sites and potential sites both physically and digitally. The results of the current desertification threat for Sistan provide an opportunity to home in areas of potentially inundated sites in the region. This can be demonstrated by looking at sites from the EAMENA database. A site within a high threat of desertification (Figure 11) with an unknown period, interpreted as a destroyed building or enclosure, can be seen via satellite imagery as a transitory state of dune inundation from 2012 to 2021. The period and interpretation of this site are unknown; however, it looks like a 17th-century caravanserai that served as a large oasis for travelers moving through such vast desert landscapes [38].

4.1.3. Landscape Regional Prioritisation

By utilizing the EAMENA database and past surveys in the region, this research helps narrow down where to search for sites and the extent of the damage to previously discovered sites. With an understanding of the desertification intensity occurring across the region, areas with known heightened levels of desertification can be prioritized. From 2015 to 2021, for example, the areas that had experienced the most desertification over time were identified (Figure 12). The areas with the highest rates of desertification across the region for this period are largely concentrated in the northeast, near Lake Hāmūn and to the southeast, on the Afghanistan side of the area. This information is valuable not only for digital identification and documentation but also in the off chance that archaeological endeavors are permitted within the region again, helping archaeologists prioritize where to look for sites, whether known, in transition, or unknown.

5. Conclusions

Future work relevant to desertification and archaeology in Sistan can include machine learning to detect sites in desertification-prone environments. In regions such as Sistan, where the site and record density are high, machine learning can enable a more thorough and time-efficient classification of potential archaeology [39]. Machine learning algorithms can be applied in the current context to more than just deciphering archaeology but also understanding sand or dunes’ movement [40]. Monitoring dune movement, if rapid, monthly, or even annually, would provide a more robust understanding of archaeological resources near sand inundation.
It is evident that desertification is a major, but not the only, threat to archaeological resources throughout arid regions like Sistan. As evidenced by Sistan’s flood of 2020, acute levels of precipitation events are increasing in arid areas [8]. Global temperatures, especially in the past two decades, have significantly increased extreme weather events [41]. Floods can particularly threaten archaeology when desertification is met with flooding. What is usually perpetually dry land is less porous and behaves similarly to hardened concrete, increasing flood velocity [42]. In the future, this work will also create a remote-sensing understanding of how the interplay between desertification and flooding threatens archaeological resources across the area.
The impact of desertification on Sistan’s archaeology is multifaceted. Despite the ongoing natural circumstances of desert environments, increasing global temperatures are intensifying the impact of desertification. Desert environments like Sistan hold a treasure trove of known and yet-to-be-explored potential archaeology. This archaeology is not only important physically, but it can also enable archaeologists to understand these regions’ regional and widespread importance.
Limited access to regions such as Sistan due to ongoing political restrictions and dangerous conflict makes the proactive, pre-destruction documentation of archaeology nearly impossible. It is not always bad, as in the case of sites such as Sar-o-Tar, sand accumulation and dune movement can preserve sites from looting and environmental degradation. However, the concealment of sites makes it difficult for archaeologists to understand and study the archaeology of an already dangerous and difficult-to-access region. Remote sensing can be used to understand desertification processes and their impact on archaeology across the region. This case study showcases a simple and effective application of remote sensing to archaeology under threat of desertification. This application is simple enough to be implemented in any area of the world and by any skill level. Remote sensing provides a way to enable archaeologists to prioritize and locate at-risk archaeology before it is worse than just inaccessible but lost forever.

Funding

This research is an excerpt from a larger project that received funding from Keble College Oxford and The School of Archaeology fund from Oxford University’s School of Archaeology.

Data Availability Statement

The original contributions presented in the study are included in the article, further inquiries can be directed to the corresponding author.

Conflicts of Interest

The author declares no conflicts of interest.

References

  1. United Nations Convention to Combat Desertification. UNCCD FAQ. Available online: https://www.unccd.int/unccd-faq#:~:text=What%20is%20Desertification%3F,and%20dry%20sub%2Dhumid%20areas (accessed on 22 December 2023).
  2. Barker, G.W.; Creighton, O.H.; Gilbertson, D.D.; Hunt, C.O.; Mattingly, D.J.; McLaren, S.J.; Thomas, D.C.; Morgan, G.C. The Wadi Faynan Project, Southern Jordan: A Preliminary Report on Geomorphology and Landscape Archaeology. Levant 1997, 29, 19–40. [Google Scholar] [CrossRef]
  3. Barker, G.; Gilbertson, D. Desertification, Land Degradation and Land Abandonment in the Rhône Valley, France. In The Archaeology of Drylands; Routledge: London, UK, 2000; pp. 355–373. [Google Scholar]
  4. Fairservis, W.A. Archaeological Studies in the Seistan Basin of Southwestern Afghanistan and Eastern Iran. Anthropological Papers of the American Museum of Natural History; American Museum of Natural History: New York, NY, USA, 1961; Volume 48, p. 1. [Google Scholar]
  5. Madole, R.F. Stratigraphic Evidence of Desertification in the West-Central Great Plains within the Past 1000 Yr. Geology 1994, 22, 483–486. [Google Scholar] [CrossRef]
  6. Soltani, A.; Hajjarpour, A.; Vadez, V. Analysis of chickpea yield gap and water-limited potential yield in Iran. Field Crops Res. 2016, 185, 21–30. [Google Scholar] [CrossRef]
  7. Boloorani, A.D.; Najafi, M.S.; Soleimani, M.; Papi, R.; Torabi, O. Influence of Hamoun Lakes’ Dry Conditions on Dust Emission and Radiative Forcing over Sistan Plain, Iran. Atmos. Res. 2022, 272, 106152. [Google Scholar] [CrossRef]
  8. Whitney, J.W. Geology, Water, and Wind in the Lower Helmand Basin, Southern Afghanistan; Scientific Investigations Report; U.S. Geological Survey: Reston, VA, USA, 2006.
  9. Fatemeh, A. Water Dispute Escalating between Iran and Afghanistan; Atlantic Council, Southeast Asia Center: Online, 2016; pp. 2–10. [Google Scholar]
  10. Alizadeh-Choobari, O.; Zawar-Reza, P.; Sturman, A. The Wind of 120 Days and Dust Storm Activity over the Sistan Basin. Atmos. Res. 2014, 143, 328–341. [Google Scholar] [CrossRef]
  11. Miri, A.; Moghaddamnia, A.; Pahlavanravi, A.; Panjehkeh, N. Dust Storm Frequency after the 1999 Drought in the Sistan Region, Iran. Clim. Res. 2010, 41, 83–90. [Google Scholar] [CrossRef]
  12. Scerrato, U. A Probable Achaemenid Zone in Persian Sistan. East West 1962, 13, 186–197. [Google Scholar]
  13. Bosworth, C.E. Edmund. Sistan and Its Local Histories. Iran. Stud. 2000, 33, 31–43. [Google Scholar] [CrossRef]
  14. Abramiuk, M.A. Correlating Findings from the Central Helmand Archaeological Study (CHAS) with Those from Previous Surveys in the Central Helmand Valley, Afghanistan. Afghanistan 2019, 2, 1–28. [Google Scholar] [CrossRef]
  15. Ghirshman, R. Recherches Prehistoriques en Afghanistan: Fouilles de Nad-i-Ali dans le Seistan Afghan. Rev. Arts Asiat. 1942, XIII, 10–22. [Google Scholar]
  16. Trousdale, W.B.; Allen, M. The Archaeology of Southwest Afghanistan; Edinburgh University Press: Edinburgh, UK, 2022. [Google Scholar]
  17. Dales, G.F. New Excavations at Nad-i-Ali (Sorkh Dagh), Afghanistan. Research Monograph Serie; University of California: Berkley, CA, USA, 1977. [Google Scholar]
  18. Stein, A. An Archaeological Tour along the Waziristan Border. Geogr. J. 1928, 71, 377. [Google Scholar] [CrossRef]
  19. Elliott, M.G. Counterinsurgency in Sistan-Baluchistan: Evaluating Iranian Effectiveness in Countering Ethnic Insurgency; Naval Postgraduate School: Monterey, CA, USA, 2020. [Google Scholar]
  20. Mirlotfi, M.R.; Jahantigh, H. A Survey of the Sense of Spatial Belonging to a Destination Country among Afghan Transnational Immigrants (Case Study: Border Villages in Sistan). Pizhūhish Barnāmahʹrīzī-I Rūstāyī 2018, 7, 1–16. [Google Scholar]
  21. Nagheeby, M. The Worst or the Best Treaty? Analysing the Equitable and Reasonable Utilization Principle in the Legal Arrangements of the Helmand River. Asian J. Int. Law 2023, 14, 25–44. [Google Scholar] [CrossRef]
  22. Rivera-Marin, D.; Dash, J.; Ogutu, B. The Use of Remote Sensing for Desertification Studies: A Review. J. Arid. Environ. 2022, 206, 104829. [Google Scholar] [CrossRef]
  23. Singh, K.V.; Setia, R.; Sahoo, S.; Prasad, A.; Pateriya, B. Evaluation of NDWI and MNDWI for Assessment of Waterlogging by Integrating Digital Elevation Model and Groundwater Level. Geocarto Int. 2015, 30, 650–661. [Google Scholar] [CrossRef]
  24. Zolfaghari, F.; Azarnivand, H.; Khosravi, H.; Zehtabian, G.; Sigaroudi, S.K. Monitoring the Severity of Degradation and Desertification by Remote Sensing (Case Study: Hamoun International Wetland). Front. Environ. Sci. 2022, 10, 902687. [Google Scholar] [CrossRef]
  25. United Nations. Afghanistan Opium Survey. UNODC and Illicit Crop Monitoring. 2020. Available online: https://www.unodc.org/unodc/en/crop-monitoring/index.html?tag=Afghanistan (accessed on 6 February 2023).
  26. Akbari, M.; Mirchi, A.; Roozbahani, A.; Gafurov, A.; Kløve, B.; Haghighi, A.T. Desiccation of the Transboundary Hamun Lakes between Iran and Afghanistan in Response to Hydro-Climatic Droughts and Anthropogenic Activities. J. Great Lakes Res. 2022, 48, 876–889. [Google Scholar] [CrossRef]
  27. Akbari, M.; Haghighi, A.T. Satellite-Based. Agricultural Water Consumption Assessment in the Ungauged and Transboundary Helmand Basin between Iran and Afghanistan. Remote Sens. Lett. 2022, 13, 1236–1248. [Google Scholar] [CrossRef]
  28. Mianabadi, A.; Davary, K.; Mianabadi, H.; Karimi, P. International Environmental Conflict Management in Transboundary River Basins. Water Resour. Manag. 2020, 34, 3445–3464. [Google Scholar] [CrossRef]
  29. Amiri, F.; Rahdari, V.; Najafabadi, S.M.; Pradhan, B.; Tabatabaei, T. Erratum to: Multi-Temporal Landsat Images Based on Eco-Environmental Change Analysis in and around Chah Nimeh Reservoir, Sistan and Balochestan (Iran). Environ. Earth Sci. 2014, 72, 811. [Google Scholar] [CrossRef]
  30. Saatsaz, M. A Historical Investigation on Water Resources Management in Iran. Environ. Dev. Sustain. 2020, 22, 1749–1785. [Google Scholar] [CrossRef]
  31. Rajabi, M.; Nahavandchi, H.; Hoseini, M. Evaluation of CYGNSS Observations for Flood Detection and Mapping during Sistan and Baluchestan Torrential Rain in 2020. Water 2020, 12, 2047. [Google Scholar] [CrossRef]
  32. Kreibich, H.; Van Loon, A.F.; Schröter, K.; Ward, P.J.; Mazzoleni, M.; Sairam, N.; Abeshu, G.W.; Agafonova, S.; AghaKouchak, A.; Aksoy, H.; et al. The Challenge of Unprecedented Floods and Droughts in Risk Management. Nature 2022, 608, 80–86. [Google Scholar] [CrossRef]
  33. Anderson, K. The Impact of Increased Flooding Caused by Climate Change on Heritage in England and North Wales, and Possible Preventative Measures: What Could/Should Be Done? Built. Herit. 2023, 7, 7–15. [Google Scholar] [CrossRef]
  34. Zhou, W.; Liu, D.; Zhang, J.; Jiang, S.; Xing, S.; Wang, J.; Cheng, Y.; Chen, N. Identification and Frequency Analysis of Drought–Flood Abrupt Alternation Events Using a Daily-Scale Standardized Weighted Average of the Precipitation Index. Front. Environ. Sci. 2023, 11, 4412. [Google Scholar] [CrossRef]
  35. Bai, X.; Zhao, C.; Tang, Y.; Zhang, Z.; Yang, B.; Wang, Z. Identification, Physical Mechanisms and Impacts of Drought–Flood Abrupt Alternation: A Review. Front. Earth Sci. 2023, 11, 1203603. [Google Scholar] [CrossRef]
  36. Pekel, J.-F.; Cottam, A.; Gorelick, N.; Belward, A.S. High-Resolution Mapping of Global Surface Water and Its Long-Term Changes. Nature 2016, 540, 418–422. [Google Scholar] [CrossRef] [PubMed]
  37. Ahlers, R.; Brandimarte, L.; Kleemans, I.; Sadat, S.H. Ambitious Development on Fragile Foundations: Criticalities of Current Large Dam Construction in Afghanistan. Geoforum 2014, 54, 49–58. [Google Scholar] [CrossRef]
  38. Bar-Oz, G.; Galili, R.; Fuks, D.; Erickson-Gini, T.; Tepper, Y.; Shamir, N.; Avni, G. Caravanserai Middens on Desert Roads: A New Perspective on the Nabataean–Roman Trade Network across the Negev. Antiquity 2022, 96, 592–610. [Google Scholar] [CrossRef]
  39. Kochanski, K.; Mohan, D.; Horrall, J.; Rountree, B.; Abdulla, G. Deep Learning Predictions of Sand Dune Migration. arXiv 2019, arXiv:1912.10798. [Google Scholar]
  40. Wang, Z.; Shi, Y.; Zhang, Y. Review of Desert Mobility Assessment and Desertification Monitoring Based on Remote Sensing. Remote Sens. 2023, 15, 4412. [Google Scholar] [CrossRef]
  41. Stott, P. How climate change affects extreme weather events. Science 2016, 352, 1517–1518. [Google Scholar] [CrossRef] [PubMed]
  42. Abd-Elaty, I.; Shoshah, H.; Zeleňáková, M.; Kushwaha, N.L.; El-Dean, O.W. Forecasting of Flash Floods Peak Flow for Environmental Hazards and Water Harvesting in Desert Area of El-Qaa Plain, Sinai. Int. J. Environ. Res. Public Health 2022, 19, 6049. [Google Scholar] [CrossRef] [PubMed]
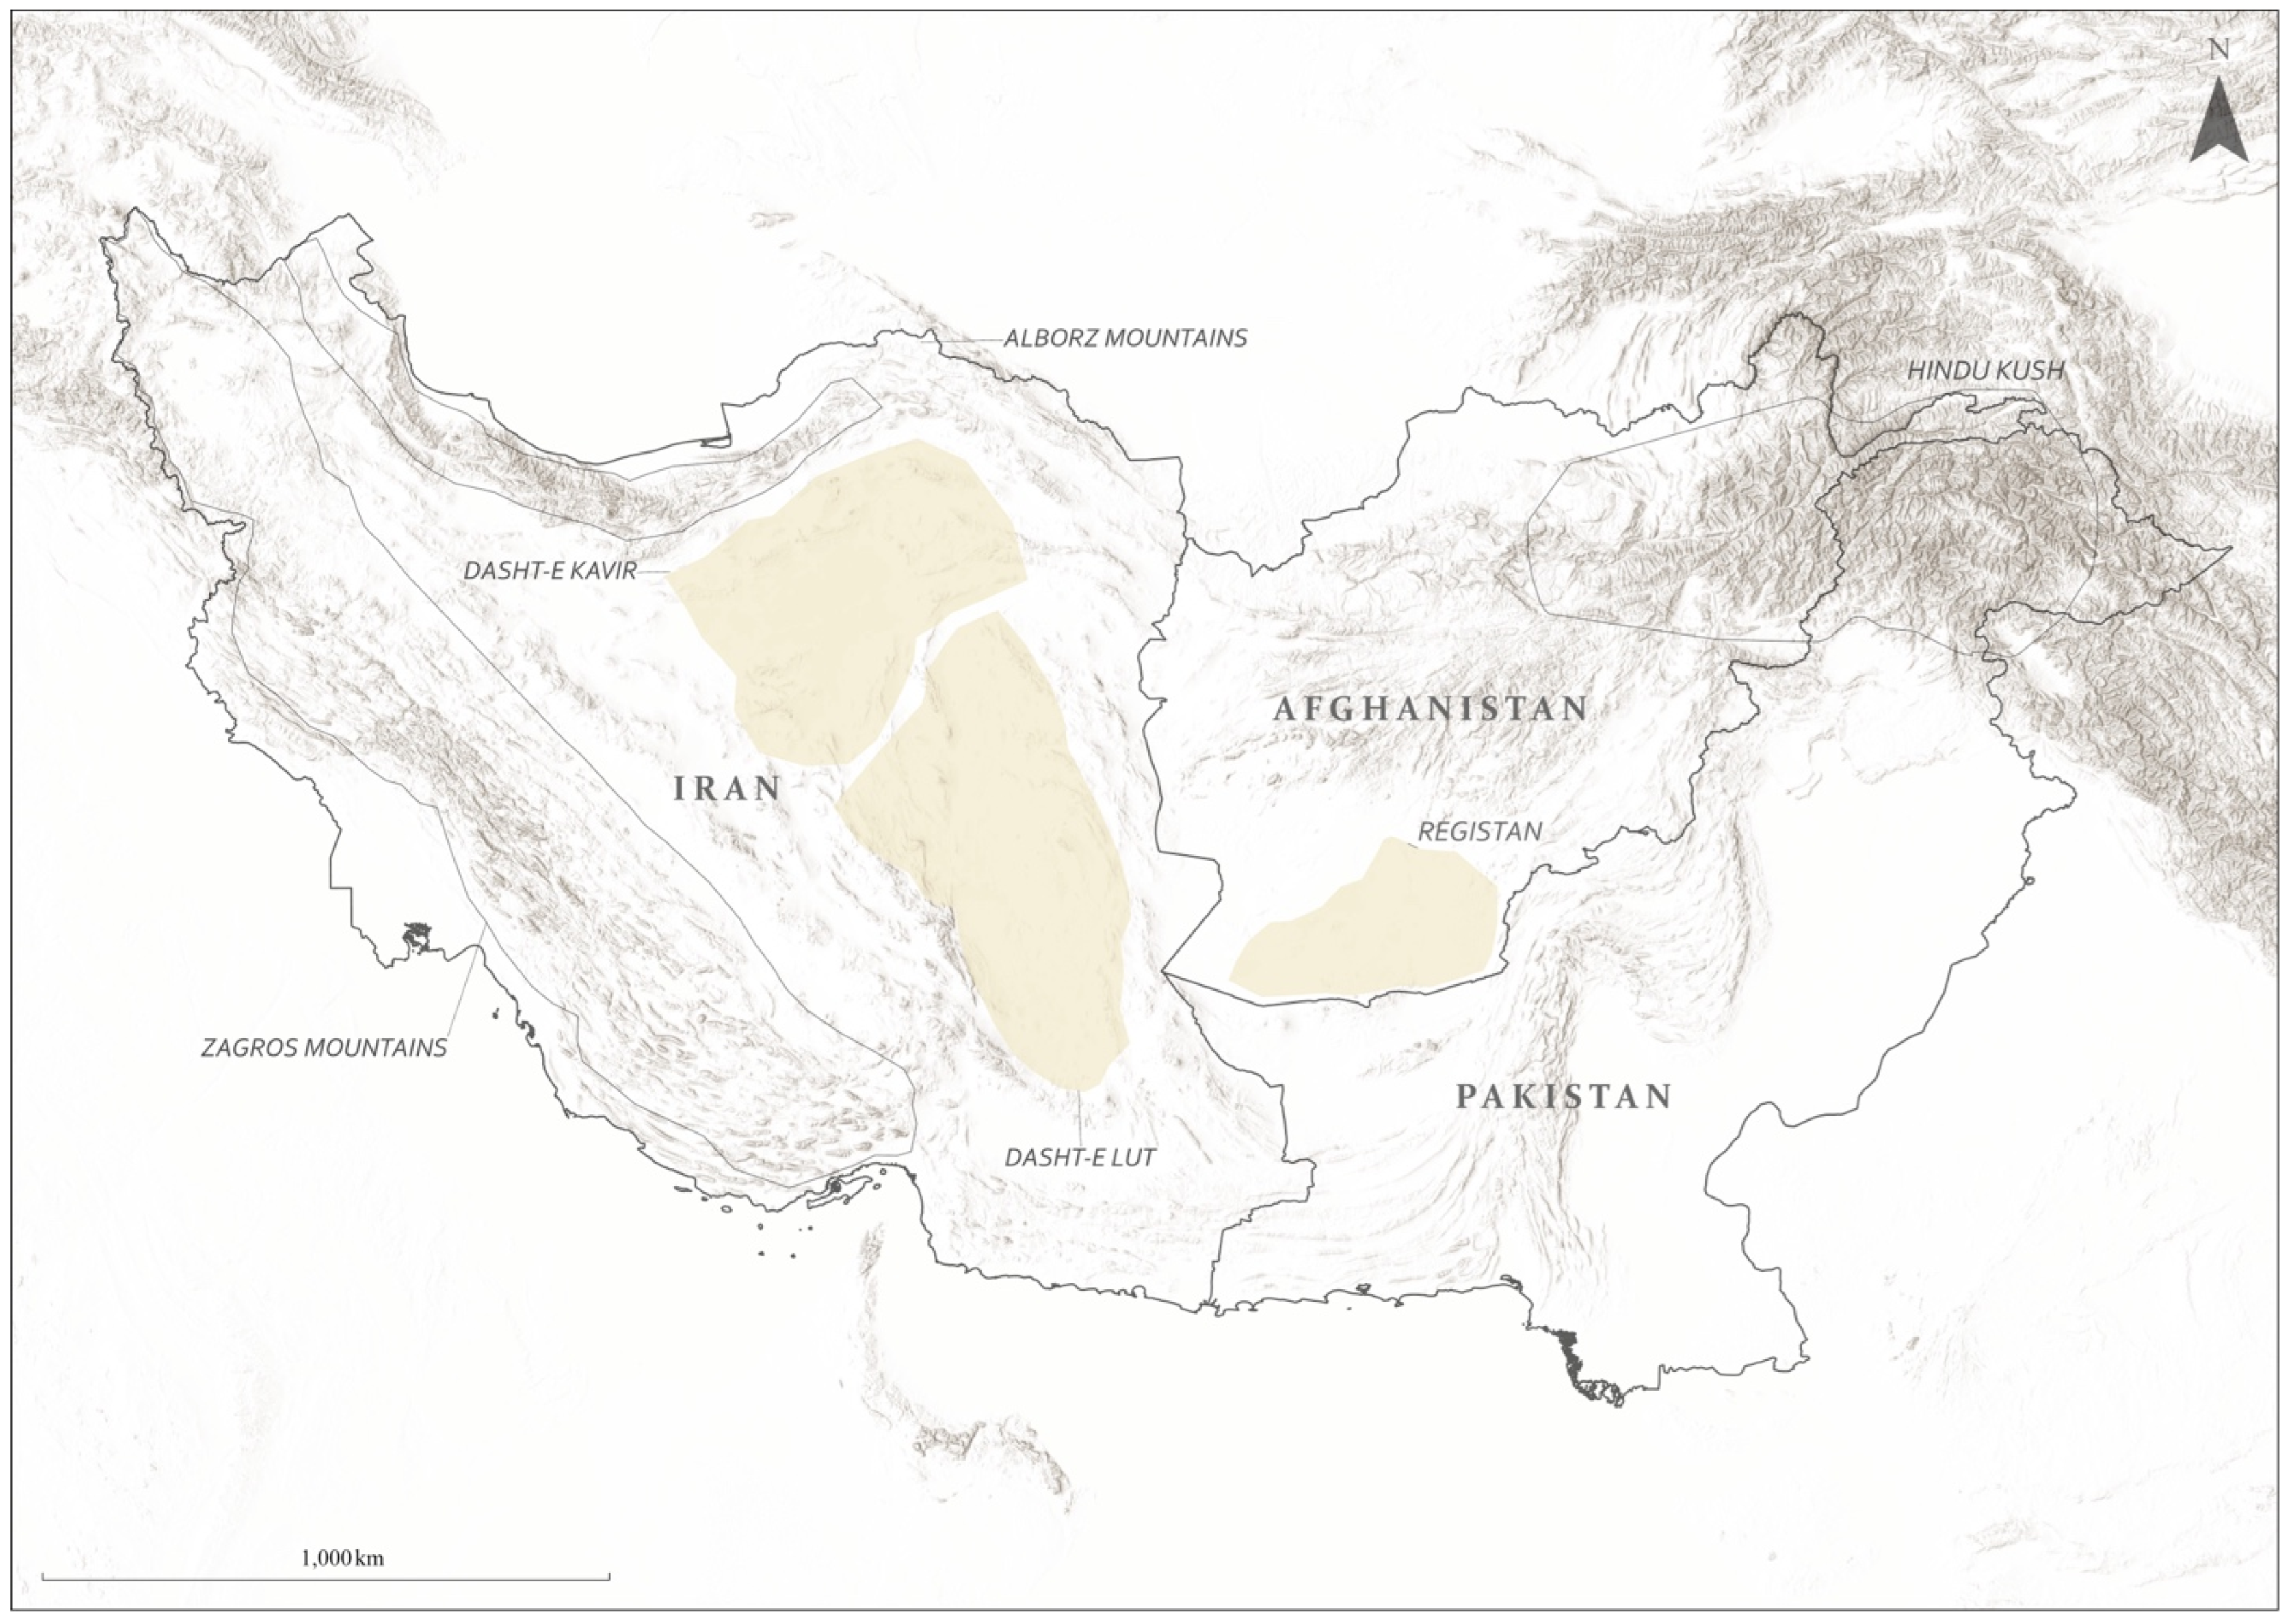
Figure 1. The Sistan Basin with pertinent deserts and topographic features.
Remotesensing 16 02382 g001
Figure 2. Total images per year.
Remotesensing 16 02382 g002
Figure 3. Method workflow.
Remotesensing 16 02382 g003
Figure 4. Desertification during 2020, a year of heavy flooding.
Remotesensing 16 02382 g004
Figure 5. Change 2015 to 2021.
Remotesensing 16 02382 g005
Figure 6. Change 2015 to 2017.
Remotesensing 16 02382 g006
Figure 7. Change 2020 to 2021.
Remotesensing 16 02382 g007
Figure 8. Distribution of high-risk records from EAMENA.
Remotesensing 16 02382 g008
Figure 9. Distribution of high-risk records from Fairservis.
Remotesensing 16 02382 g009
Figure 10. Distribution of high-risk records from the Helmand Sistan Project.
Remotesensing 16 02382 g010
Figure 11. Newly discovered high-risk site over time. (a) 2012; (b) 2016; (c) 2021.
Remotesensing 16 02382 g011
Figure 12. Desertification extent from 2015 to 2021.
Remotesensing 16 02382 g012
Table 1. Imagery data sources and specifications.
Platform/SensorProcessing LevelDataset TypeNumber of ImagesDates
Landsat 8 Operational Land Imager (OLI)Collection 2, Tier 1Surface reflectance1905January 2015–December 2021
Disclaimer/Publisher’s Note: The statements, opinions and data contained in all publications are solely those of the individual author(s) and contributor(s) and not of MDPI and/or the editor(s). MDPI and/or the editor(s) disclaim responsibility for any injury to people or property resulting from any ideas, methods, instructions or products referred to in the content.