Article

The Synergy between Artificial Intelligence, Remote Sensing, and Archaeological Fieldwork Validation

by
Daniel Canedo
1,*,
João Hipólito
2,
João Fonte
3,
Rita Dias
2,4,
Tiago do Pereiro
2,
Petia Georgieva
1,
Luís Gonçalves-Seco
3,5,
Marta Vázquez
3,6,
Nelson Pires
3,
Pastor Fábrega-Álvarez
7,
Fernando Menéndez-Marsh
1 and
António J. R. Neves
1
1
Institute of Telecommunications/Institute of Electronics and Informatics Engineering of Aveiro/Department of Electronics, Telecommunications and Informatics, University of Aveiro, 3810-193 Aveiro, Portugal
2
ERA Arqueologia, Calçada de Santa Catarina, 9C, 1495-705 Cruz Quebrada, Portugal
3
UMAIA, University of Maia, 4475-690 Maia, Portugal
4
ICArEHB, Campus de Gambelas, Universidade do Algarve, 8005-139 Faro, Portugal
5
INESC TEC—Institute for Systems and Computer Engineering, Technology and Science, 4200-465 Porto, Portugal
6
N2i, Polytechnic Institute of Maia, 4475-690 Maia, Portugal
7
Instituto de Ciencias del Patrimonio, Consejo Superior de Investigaciones Científicas, Edificio Fontán, Bloque 4, Cidade da Cultura, Monte Gaias s/n, 15707 Santiago de Compostela, Spain
*
Author to whom correspondence should be addressed.
Remote Sens. 2024, 16(11), 1933; https://doi.org/10.3390/rs16111933
Submission received: 18 April 2024 / Revised: 15 May 2024 / Accepted: 21 May 2024 / Published: 28 May 2024
(This article belongs to the Special Issue Applications of Remote Sensing in Landscape Archaeology)

Abstract

:
The increasing relevance of remote sensing and artificial intelligence (AI) for archaeological research and cultural heritage management is undeniable. However, there is a critical gap in this field. Many studies conclude with identifying hundreds or even thousands of potential sites, but very few follow through with crucial fieldwork validation to confirm their existence. This research addresses this gap by proposing and implementing a fieldwork validation pipeline. In northern Portugal’s Alto Minho region, we employed this pipeline to verify 237 potential burial mounds identified by an AI-powered algorithm. Fieldwork provided valuable information on the optimal conditions for burial mounds and the specific factors that led the algorithm to err. Based on these insights, we implemented two key improvements to the algorithm. First, we incorporated a slope map derived from LiDAR-generated terrain models to eliminate potential burial mound inferences in areas with high slopes. Second, we trained a Vision Transformer model using digital orthophotos of both confirmed burial mounds and previously identified False Positives. This further refines the algorithm’s ability to distinguish genuine sites. The improved algorithm was then tested in two areas: the original Alto Minho validation region and the Barbanza region in Spain, where the location of burial mounds was well established through prior field work.

Graphical Abstract

1. Introduction

This work focuses on mapping a particular type of archaeological site, burial mounds, using a deep learning approach and remote sensing data. Burial mounds are typically characterized by a rounded geometric shape that contrasts with their surroundings. They often have a central depression, a distinctive feature that helps in their identification. This work takes a crucial step forward by incorporating field validation of AI inferences, building on existing research that addresses the potential and limitations of AI-based burial mound site detection [1,2,3,4,5,6,7]. Deep learning uses complex algorithms to automatically identify patterns in vast numbers of data, especially images. This is crucial in archaeology, where manually identifying archaeological features from remote sensing data can be time-consuming. Archaeologists are employing these algorithms to detect archaeological sites and features in various data types [8,9,10,11,12,13], such as LiDAR data, multispectral, hyperspectral, and satellite aerial imagery. By allowing them to identify and map potential archaeological sites or features, the output of such algorithms allows archaeologists to plan targeted surveys, saving both time and resources. Despite these advantages, it is important to acknowledge limitations. Due to the inherent variability of archaeological data, these algorithms can generate a significant number of False Positives, where natural formations or modern structures are misinterpreted as archaeological sites. Therefore, integrating deep learning with the expertise of archaeologists remains crucial to accurate interpretation and successful application [14]. Distinguishing between archaeological features and other natural or artificial shapes is a challenge not just for AI, but also for humans. This limitation contributes to the high number of False Positives seen in AI-based methods to uncover archaeological sites and artifacts. Researchers are actively addressing this issue by refining the models and increasing the quality and quantity of available data. We hypothesize that by conducting fieldwork validation of AI-generated inferences, it is possible to gain crucial insights about the topographical context of both True Positives and False Positives. For example, field validation can reveal vegetation patterns or subtle changes in soil composition associated with True Positives, differentiating them from natural features misinterpreted as burial mounds. This knowledge can then be used to refine the algorithms for future archaeological surveys. The primary objective of this work is to iteratively refine the algorithm designed to detect burial mounds. This refinement process is based on insights gained from experienced archaeologists during field surveys and digital validation. The main goal is to enhance the algorithm’s performance and address the recurring issue of False Positives often encountered when deploying machine learning models on challenging aerial imagery. This combined field survey and data analysis approach has the potential to revolutionize archaeological site detection through AI, allowing faster, more accurate identification of burial mounds with a significant reduction in false positives.
Contextual information about this work is presented in Section 2. The statistics and knowledge originating from the validation of the fieldwork are outlined in Section 3. The algorithm refinement based on the knowledge obtained from fieldwork validation is discussed in Section 4. The results obtained from the refined algorithms applied to the Alto Minho and Barbanza regions are presented in Section 5. The discussion is presented in Section 6. Finally, the concluding remarks are formulated in Section 7.

2. Method

Building on our previous work, where we proposed a machine learning pipeline to uncover burial mounds in the Alto Minho region of northern Portugal [7], this work is a deeper investigation. The LiDAR data used for Alto Minho (2.220 km2) have a point cloud density of 2 points per square meter. Without conducting any reclassification or manual correction, the pre-existing classification of the point clouds available for this work was utilized. This was followed by TIN interpolation. In summary, from the classified LiDAR point clouds, 1-meter Digital Terrain Models (DTMs) were extracted and further divided into four tiles to facilitate analysis. From these, Local Relief Models (LRMs) [15,16] were generated to enhance the visualization of archaeological microtopographies, considered a robust and consistent visualization technique [17,18] for detecting burial mounds. We annotated around 276 known burial mounds [19,20] and automatically built an image dataset. The dataset was then augmented using a copy and paste data enhancement technique [21] and used to train an object detection algorithm, namely, You Only Look Once (YOLO) [22]. This algorithm was then deployed in the Alto Minho region, and all inferences went through a post-processing validation step. The post-processing part is responsible for removing potential False Positives. It is equipped with an algorithm inspired by the Location-Based Ranking (LBR) algorithm proposed by [23]. The LBR assumes that the location of archaeological sites in the landscape is not random but is the result of certain characteristics of the past and present environment. Therefore, inferences that are located in improbable locations are discarded. Furthermore, post-processing is equipped with a Local Outlier Factor (LOF) [24] algorithm which was trained on the raw LiDAR point clouds to remove inferences that do not present a similar 3D morphology to the burial mounds. The proposed work produced 648 burial mound inferences, which was a drastic 81% reduction from the original 3417 inferences. This reduction resulted from the deliberate attempt to mitigate False Positives, which was aligned to provide archaeologists with reliable inferences. This ensures that archaeological missions have a higher chance of discovering sites and features of archaeological relevance. Following this, four archaeologists with experience in remote sensing digitally confirmed 470 of the 648 features identified as potential burial mounds. More details can be found in our previous work [7].
Typically, most works in the literature with similar endeavors conclude their work at this point, which was also the case for our previous work. However, we believe that obtaining additional empirical knowledge about the relationship between landscape and topographical context and AI behavior is possible by performing fieldwork validation. This knowledge can be used to refine models and algorithms. With this iterative process, it is conceivable to achieve increasingly reliable inferences, mitigating the False Positive problem. Therefore, four tumuli clusters that covered each of the four tiles were randomly selected for fieldwork validation in the Alto Minho region, containing 237 of the 470 digitally validated burial mounds. Two archaeologists with field survey experience conducted ground truth validation.

3. Fieldwork Validation

3.1. Methodology—Alto Minho

As mentioned previously, the algorithm initially identified 648 inferences, of which 470 were digitally validated by experts as potential burial mounds. Of these 470 inferences, based on aspects related to their location and current field access, 237 were selected for ground truth validation, all located in the Alto Minho region. As a result of the fieldwork, those 237 inferences were divided into accessible (N = 150, 63.3%) and non-accessible (N = 87, 36.7%) and further classified into three main categories, according to the attribution of a confidence level:
True Positive (TP).
False Positive (FP).
Uncertain.
Within the uncertain category, a segmentation was made according to the greater or lesser tendency of the inference to be a True Positive or a False Positive. The following subcategories were created (Figure 1):
Very Likely True Positive (VL-TP);
Probable True Positive (P-TP);
Eventual True Positive (E-TP);
Very Likely False Positive (VL-FP);
Probable False Positive (P-FP);
Eventual False Positive (E-FP).
The criteria that led to this classification are presented in detail in the following sub-subsections, combining a mixture of objective and subjective criteria.

3.1.1. True Positive (TP)

For a burial mound to be classified as True Positive, that is, with a minimum confidence level of 85%, certain criteria had to be met, including the following:
Terrain morphology tends to be flat, such as hilltops, plateaus, and gentle slopes;
Terrain morphology is characterized by a central elevation creating a circular burial mound shape;
Violation pit;
Visual control over the surrounding landscape;
The presence of stone elements potentially associated with the monument.
In addition to the criteria mentioned above, the following factors were also considered to improve the confidence level of a True Positive classification.
The presence of stone elements: stone slabs or other elements found in the vicinity, even if reused in later constructions, could be indicative of a burial mound;
The distribution of similar monuments: the presence of other burial mounds of the same type in the surrounding area can support the identification of a particular inference;
Toponymy: place names or historical accounts mentioning burial mounds in the area can provide valuable clues.

3.1.2. False Positive (FP)

A burial mound inference is classified as a False Positive (minimum confidence level of 85%) when on-site observations under optimal visibility conditions (i.e., the absence of vegetation and other obstructive natural or artificial elements) across the terrain unequivocally demonstrate the complete absence of any archaeological remains or any other features typically associated with a burial mound’s location.

3.1.3. Very Likely True Positive (VL-TP)

The Very Likely True Positive classification is assigned to inferences with a confidence level/probability of being True Positive that ranges between 70% and 84%. Inferences that, from the following list, meet the two mandatory conditions and at least two other conditions are in this category.
The terrain morphology is characterized by a central elevation creating a circular burial mound shape (mandatory);
The probable presence of a breach cone (mandatory);
Flat or slightly sloped terrain;
Visual control over the surrounding landscape;
The presence of stone elements potentially associated with a monument;
The presence of archaeological remains in the vicinity of the study area;
Toponymy (place names or historical accounts mentioning burial mounds).

3.1.4. Probable True Positive (P-TP)

The Probable True Positive classification is assigned to inferences with a confidence level/probability of being True Positive that ranges between 60% and 69%. Inferences that, from the following list, meet the mandatory condition and at least one other condition are in this category.
The terrain morphology is characterized by a central elevation creating a circular burial mound shape (mandatory);
Flat or slightly sloped terrain;
The presence of stone elements that could potentially belong to the monument;
The probable presence of a breach cone;
Visual control over the surrounding landscape;
The presence of archaeological remains in the vicinity of the study area.

3.1.5. Eventual True Positive (E-TP)

The Eventual True Positive classification is assigned to inferences with a confidence level/probability of being True Positive that ranges between 50% and 59%, meaning that at least one of the following conditions is verified.
The terrain morphology is characterized by a central elevation creating a circular burial mound shape;
The presence of archaeological remains in the vicinity of the study area.

3.1.6. Very Likely False Positive (VL-FP)

The Very Likely False Positive classification is assigned to inferences with a confidence level/probability of being False Positive that ranges between 70% and 84%. The inferences that, from the following list, meet the two mandatory conditions and at least two non-mandatory conditions are in this category.
A terrain morphology not typical of a burial mound (mandatory);
Steep slopes and irregular terrain (mandatory);
Limited visual control of the surrounding landscape;
A high percentage of surface rock outcrops;
Located in a valley bottom;
Poor terrain visibility during ground truthing.

3.1.7. Probable False Positive (P-FP)

The Probable False Positive classification is assigned to inferences with a confidence level/probability of being False Positive that ranges between 60% and 69%. The inferences that, from the following list, meet the two mandatory conditions and at least one non-mandatory condition are in this category.
A terrain morphology not typical of a burial mound (mandatory);
Very steep slopes and very irregular terrain (mandatory);
Limited visual control of the surrounding landscape;
A high percentage of surface rock outcrops;
Located in a valley bottom.

3.1.8. Eventual False Positive (E-FP)

The Eventual False Positive classification is assigned to inferences with a confidence level/probability of being False Positive that ranges between 50% and 59%, meaning that at least two of the following conditions are verified.
A terrain morphology not typical of a burial mound;
Very steep slopes and very irregular terrain;
Limited visual control of the surrounding landscape; a high percentage of surface rock outcrops;
Located in a valley bottom.

3.1.9. Non-Accessible

This category includes inferences in which the ground truth team could not reach the central point (or its vicinity) for on-site observation. This could be due to limited ground visibility (obstacles or vegetation cover that hinder on-site observations) and undisturbed burial mounds (untouched mounds with no surface stone features and minimal elevation might be difficult to definitively classify as True Positives without further archaeological investigation). These inferences accounted for 36.7% of the total inferences and were not considered for algorithm refinement. As a result, they did not influence the results discussed in Section 5.

3.2. Results—Alto Minho

Field observations were significantly impacted by factors limiting ground visibility and access to inferred burial mound locations. This resulted in a high percentage (63.7%) of inferences that were not classified as True Positive or False Positive. Table 1 summarizes these findings in more detail.

3.2.1. True Positives

Visual analysis of the terrain alone proved to be insufficient to assign high confidence levels, resulting in a lower-than-desired number of True Positives; as such, we did not assign 100% confidence to any inference. This would have required identifying unequivocal monument structures, such as clear dolmen components, which were not observed. Excluding the Castro Laboreiro plateau, known for its existing burial mound concentration, no specific areas exhibited clusters of True Positives. The 23 (9.7%) inferences are predominantly located in flat terrain, often far from current settlements. Although most inferences suggest the presence of a potential violation pit, very few revealed any physical stone remains. Table 2 details the True Positive classifications, segmented by confidence level.

3.2.2. False Positives

From the total inferences considered for fieldwork, 63 (26.6%) were identified as False Positives. Contrary to what was found for True Positives, in 37 of those situations (58.7%), the False Positive classification was assigned with a confidence level of 100% (details in Table 3). Most False Positives are justified by the occurrence of near-surface bedrock (N = 34).
To understand what led the model to incorrectly predict burial mounds, False Positives were classified on site during fieldwork, as illustrated in Table 4.

3.2.3. Uncertain

From the inferences selected to be subject to ground truth validation, 64 (27%) deserve a classification that lies between the True Positive and the False Positive, which means that the confidence level for being in one of those categories is in the range of 50–84%.
As shown in Table 5, some inferences emerged as potential True Positives. However, these inferences were excluded from the True Positive category due to limitations in the analysis, such as visual obstructions that hinder the evaluation of the site’s control over the surrounding area or the morphology of the terrain not fully being captured by the data.
On the other hand, a similar situation can be observed for the potential False Positive, as can be seen in Table 6. A large number of inferences with an assigned confidence level between 60% and 69% is observed, since, without good ground visibility, the confidence level drops considerably, and those inferences cannot be classified as False Positives.

3.2.4. Non-Accessible

A significant portion (N = 87, 36.7%) of the inferences fell into the non-accessible category. These sites were inaccessible due to challenging terrain and limited field access. Field conditions significantly impacted the results, not only by hindering access, but also by restricting ground visibility. However, the established criteria for inference categorization and confidence levels suggest that additional fieldwork could potentially increase the number of True Positives. Clearing vegetation in some areas of interest might improve the results. However, inferences lacking surface archaeological remains or those suspected to be intact burial mounds (without violation pits) would require additional archaeological surveys to confirm a True Positive.

3.3. Barbanza

For the past 30 years, archaeologists have extensively studied the “megalithic phenomenon” in the Barbanza region [25,26,27,28]. This wealth of field data on the location of numerous burial mounds makes Barbanza an ideal case study to evaluate our integrated AI, remote sensing, and fieldwork validation approach.

4. Algorithm Refinement

Based on the knowledge obtained during the fieldwork validation and described in Section 3, the algorithms were refined. Figure 2 presents a diagram of the proposed algorithm refinements.
To test the proposed algorithms, the Alto Minho and Barbanza regions were selected. The latter was chosen because we have data on True and False Positives, validated through fieldwork. Figure 3 illustrates the LRM of Alto Minho, including the original 648 inferences and the 237 inferences covered in the fieldwork validation.
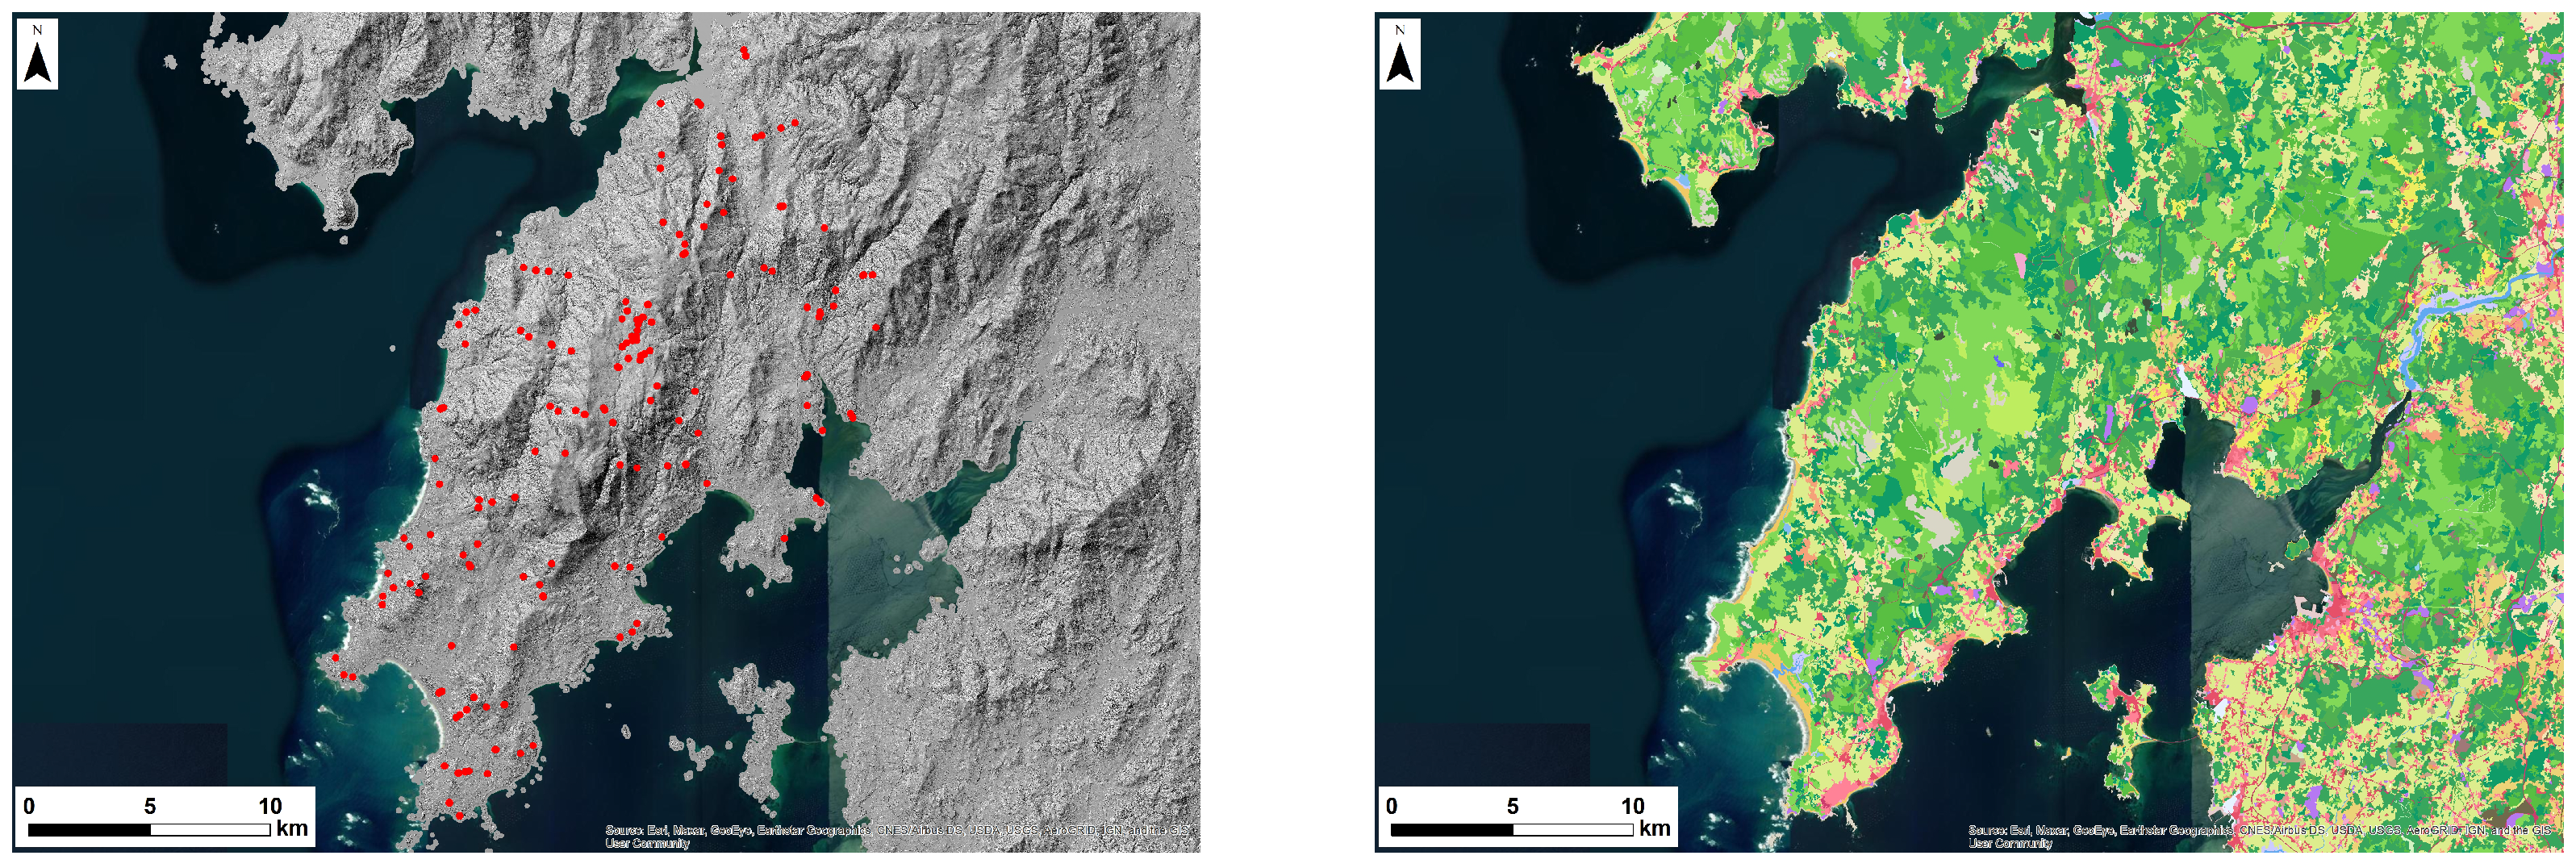
As for Barbanza, it is a deeply studied region, as most burial mounds are known, and other works in the literature also detected this type of archaeological site with AI [6], rendering it adequate for comparative analysis. Figure 4 illustrates the LRM of Barbanza, including the 164 inferences resulting from the methodology proposed in our previous work, using the high-resolution land use and land cover information system of Spain [29] (SIOSE) for the LBR block. The chosen year for SIOSE was 2011 because the first LiDAR survey by IGN-PNOA covering the Barbanza region (450 km2) was conducted in 2010. These LiDAR data have a point cloud density of 1 point per square meter. Without conducting any reclassification or manual correction, the pre-existing classification of the point clouds available for this work was utilized. This was followed by TIN interpolation.
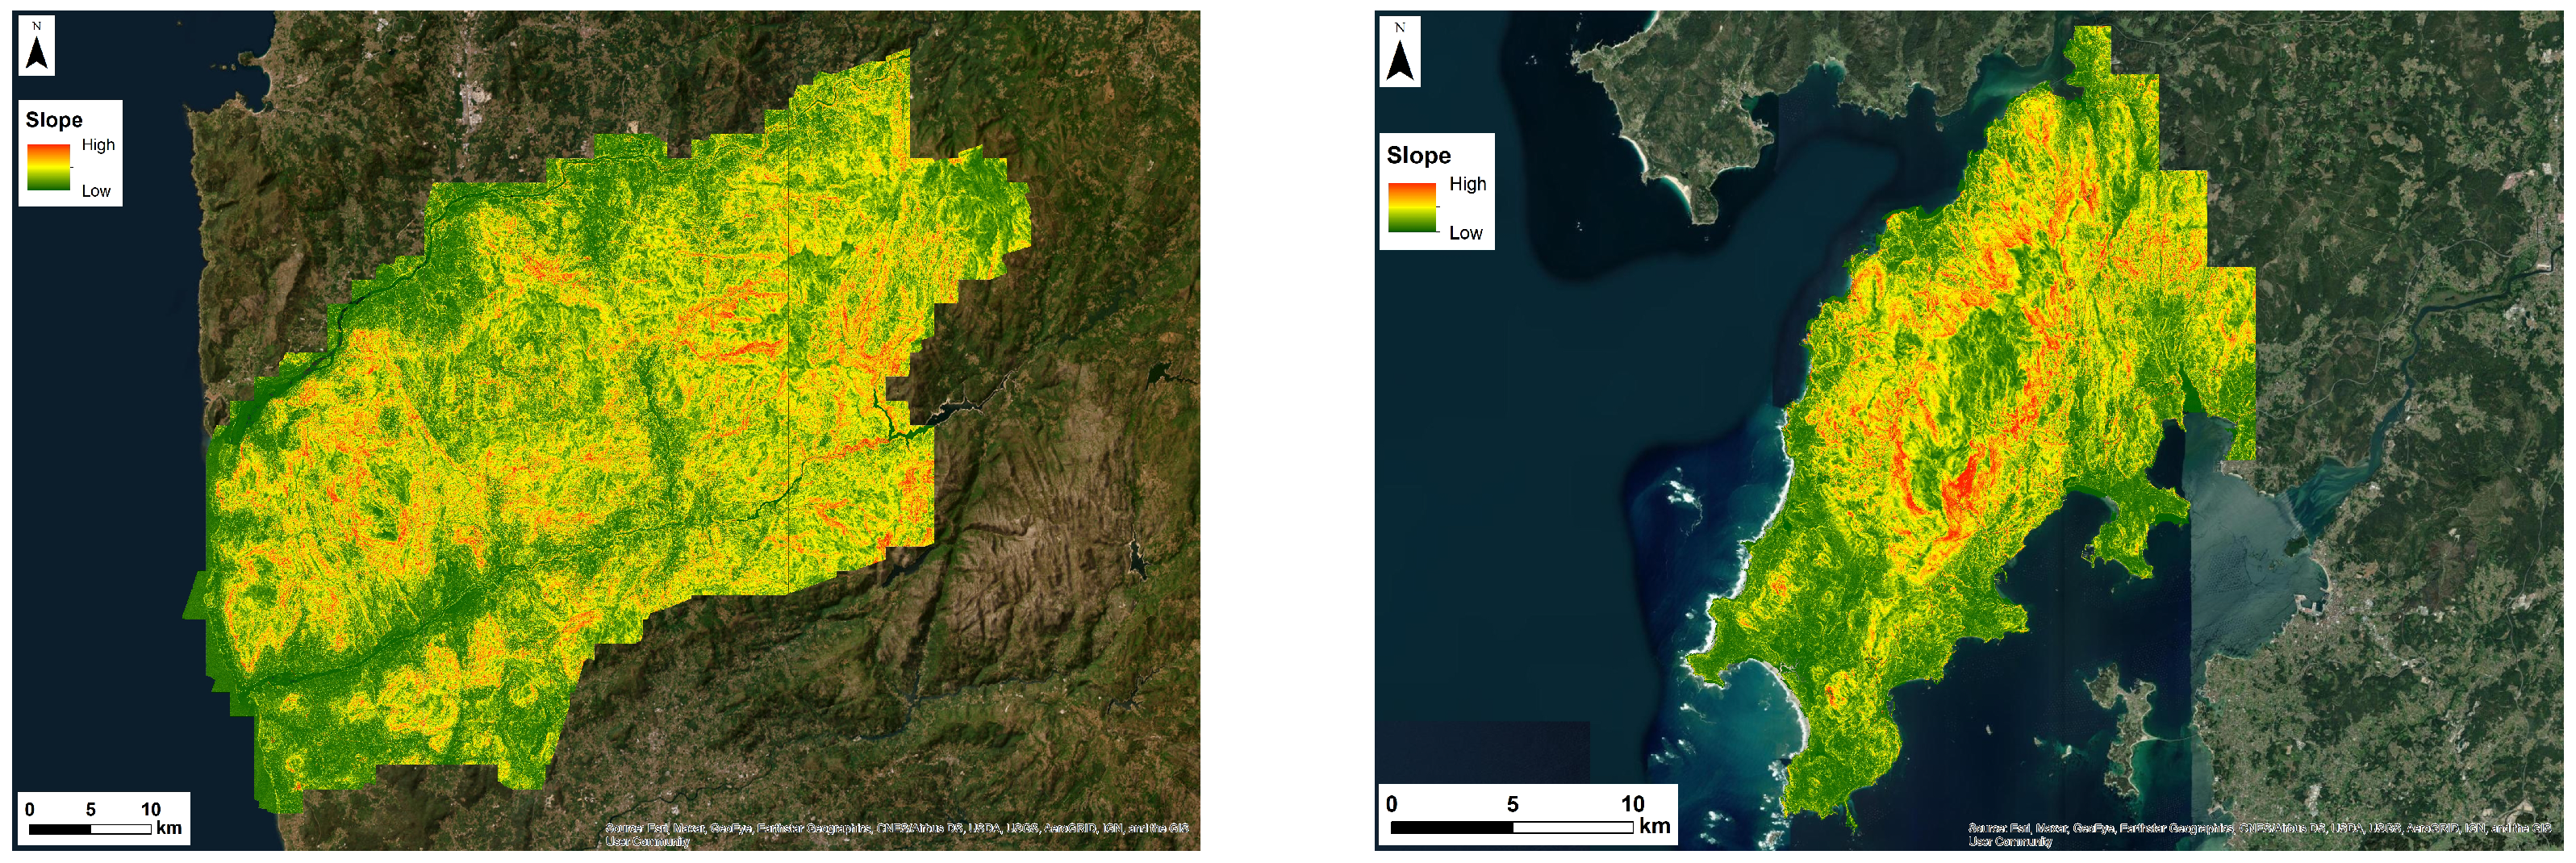
As discussed in Section 3, some False Positives were identified in areas with steep slopes. Taking into account this fact, the slope maps [30] were derived from the LiDAR-derived DTMs. Essentially, the slope is the first derivative of the DTM, representing the rate of elevation change for each pixel at angles from 0° to 90°. Figure 5 illustrates the slope maps of Alto Minho and Barbanza.
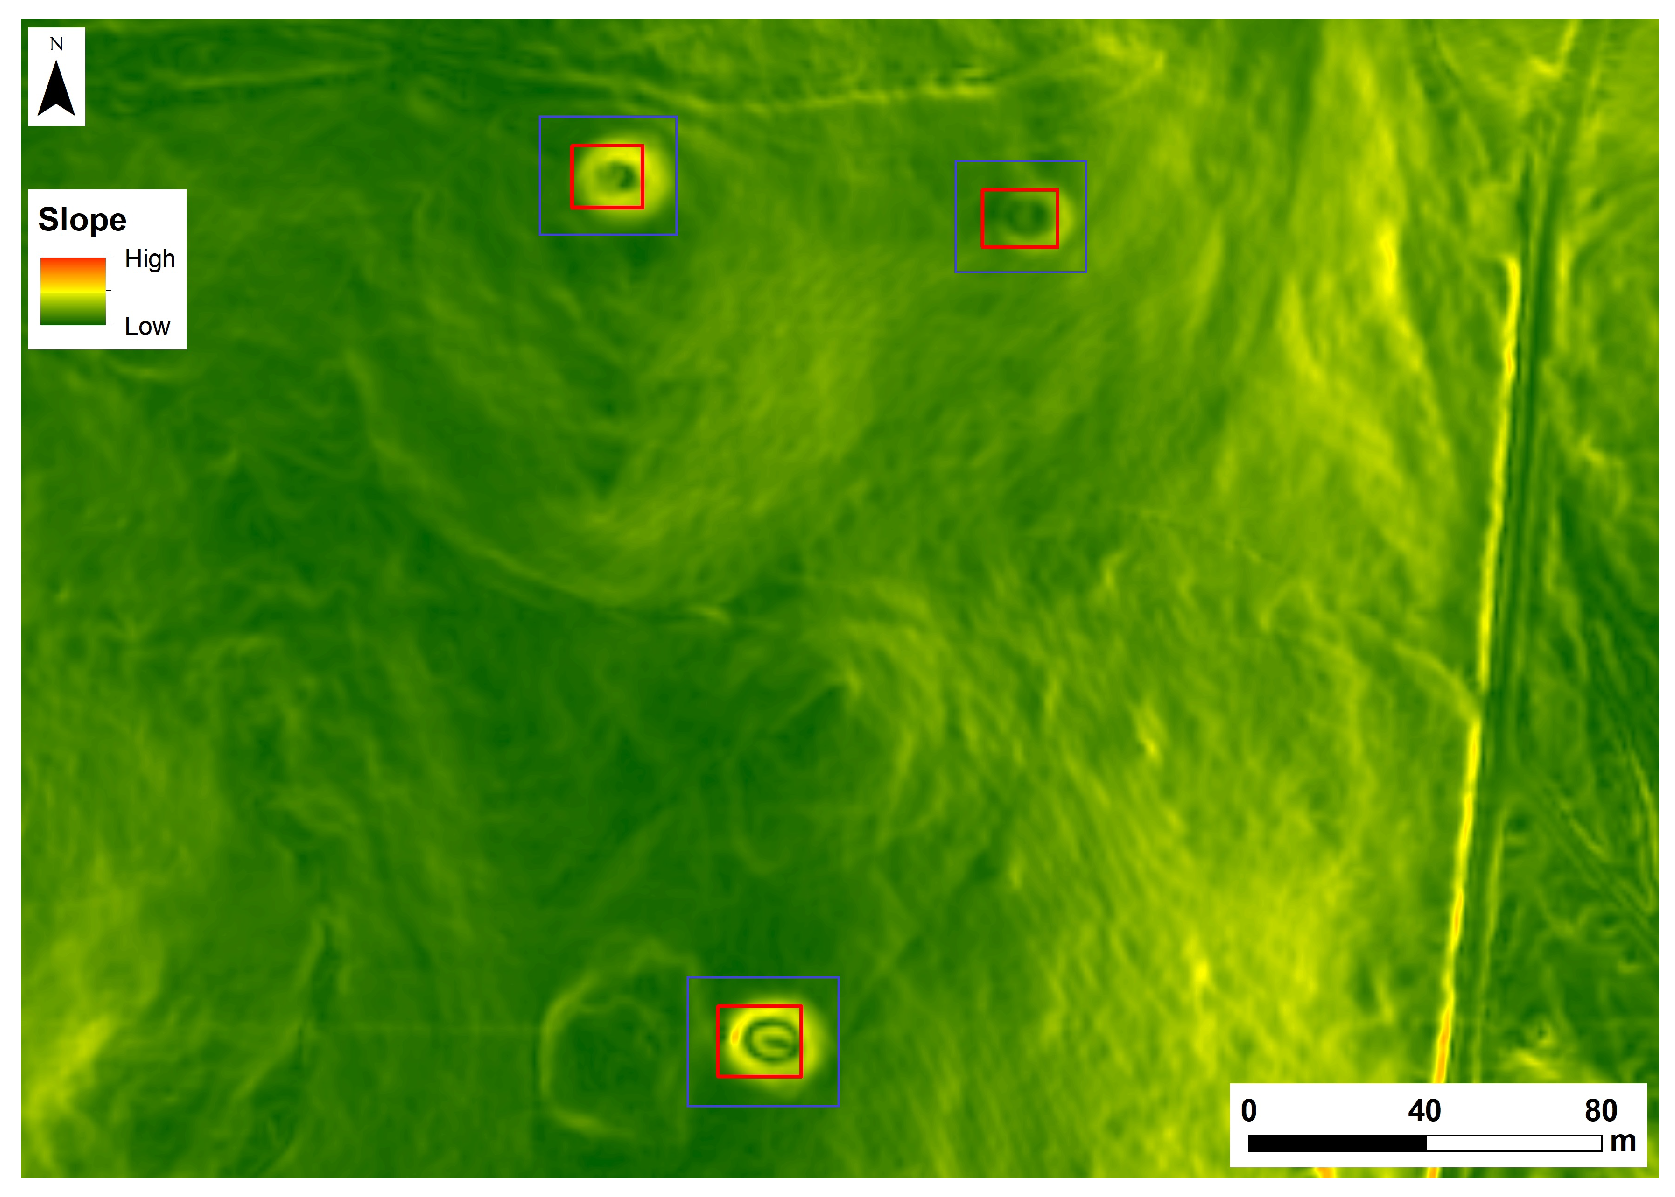
Slope maps were used to filter potential False Positives in areas characterized by significant topographic gradients. To achieve this filtering, the mean slope within a predefined neighborhood surrounding the inference was calculated. This neighborhood is defined by expanding the original bounding box of the inference by a specified distance (25 pixels) in all directions. Figure 6 illustrates this concept.
To characterize the typical slope of the terrain surrounding burial mounds, we leveraged the 276 known and annotated instances used to train the models in our prior research. Figure 7 illustrates the histogram obtained.
By establishing the characteristic slope of the terrain surrounding known burial mounds, we can eliminate inferences that exceed a predefined inclination threshold.
Fieldwork validation has revealed a subcategory of False Positives that present a greater challenge for removal due to their inconspicuous characteristics. To address these challenges, we propose to take advantage of the Vision Transformer (ViT) model [31] for image classification as the final filtering stage. ViT models are a recent technology that essentially replaced the reliance on Convolutional Neural Networks (CNNs) for image processing tasks with transformers. A transformer is a deep learning architecture characterized by a self-attention mechanism responsible for weighing the importance of each element in the input sequence in relation to the others [32]. This technology has seen great success in the context of natural language processing [33], and ViT models are also matching or exceeding the state of the art in many image classification datasets [34]. Due to the overall success of this technology conveyed in the literature, a ViT model may find some discernible characteristics within the False Positives that could have been challenging to identify during fieldwork validation. To test this hypothesis, an image dataset containing two classes was built: burial mounds and False Positives.
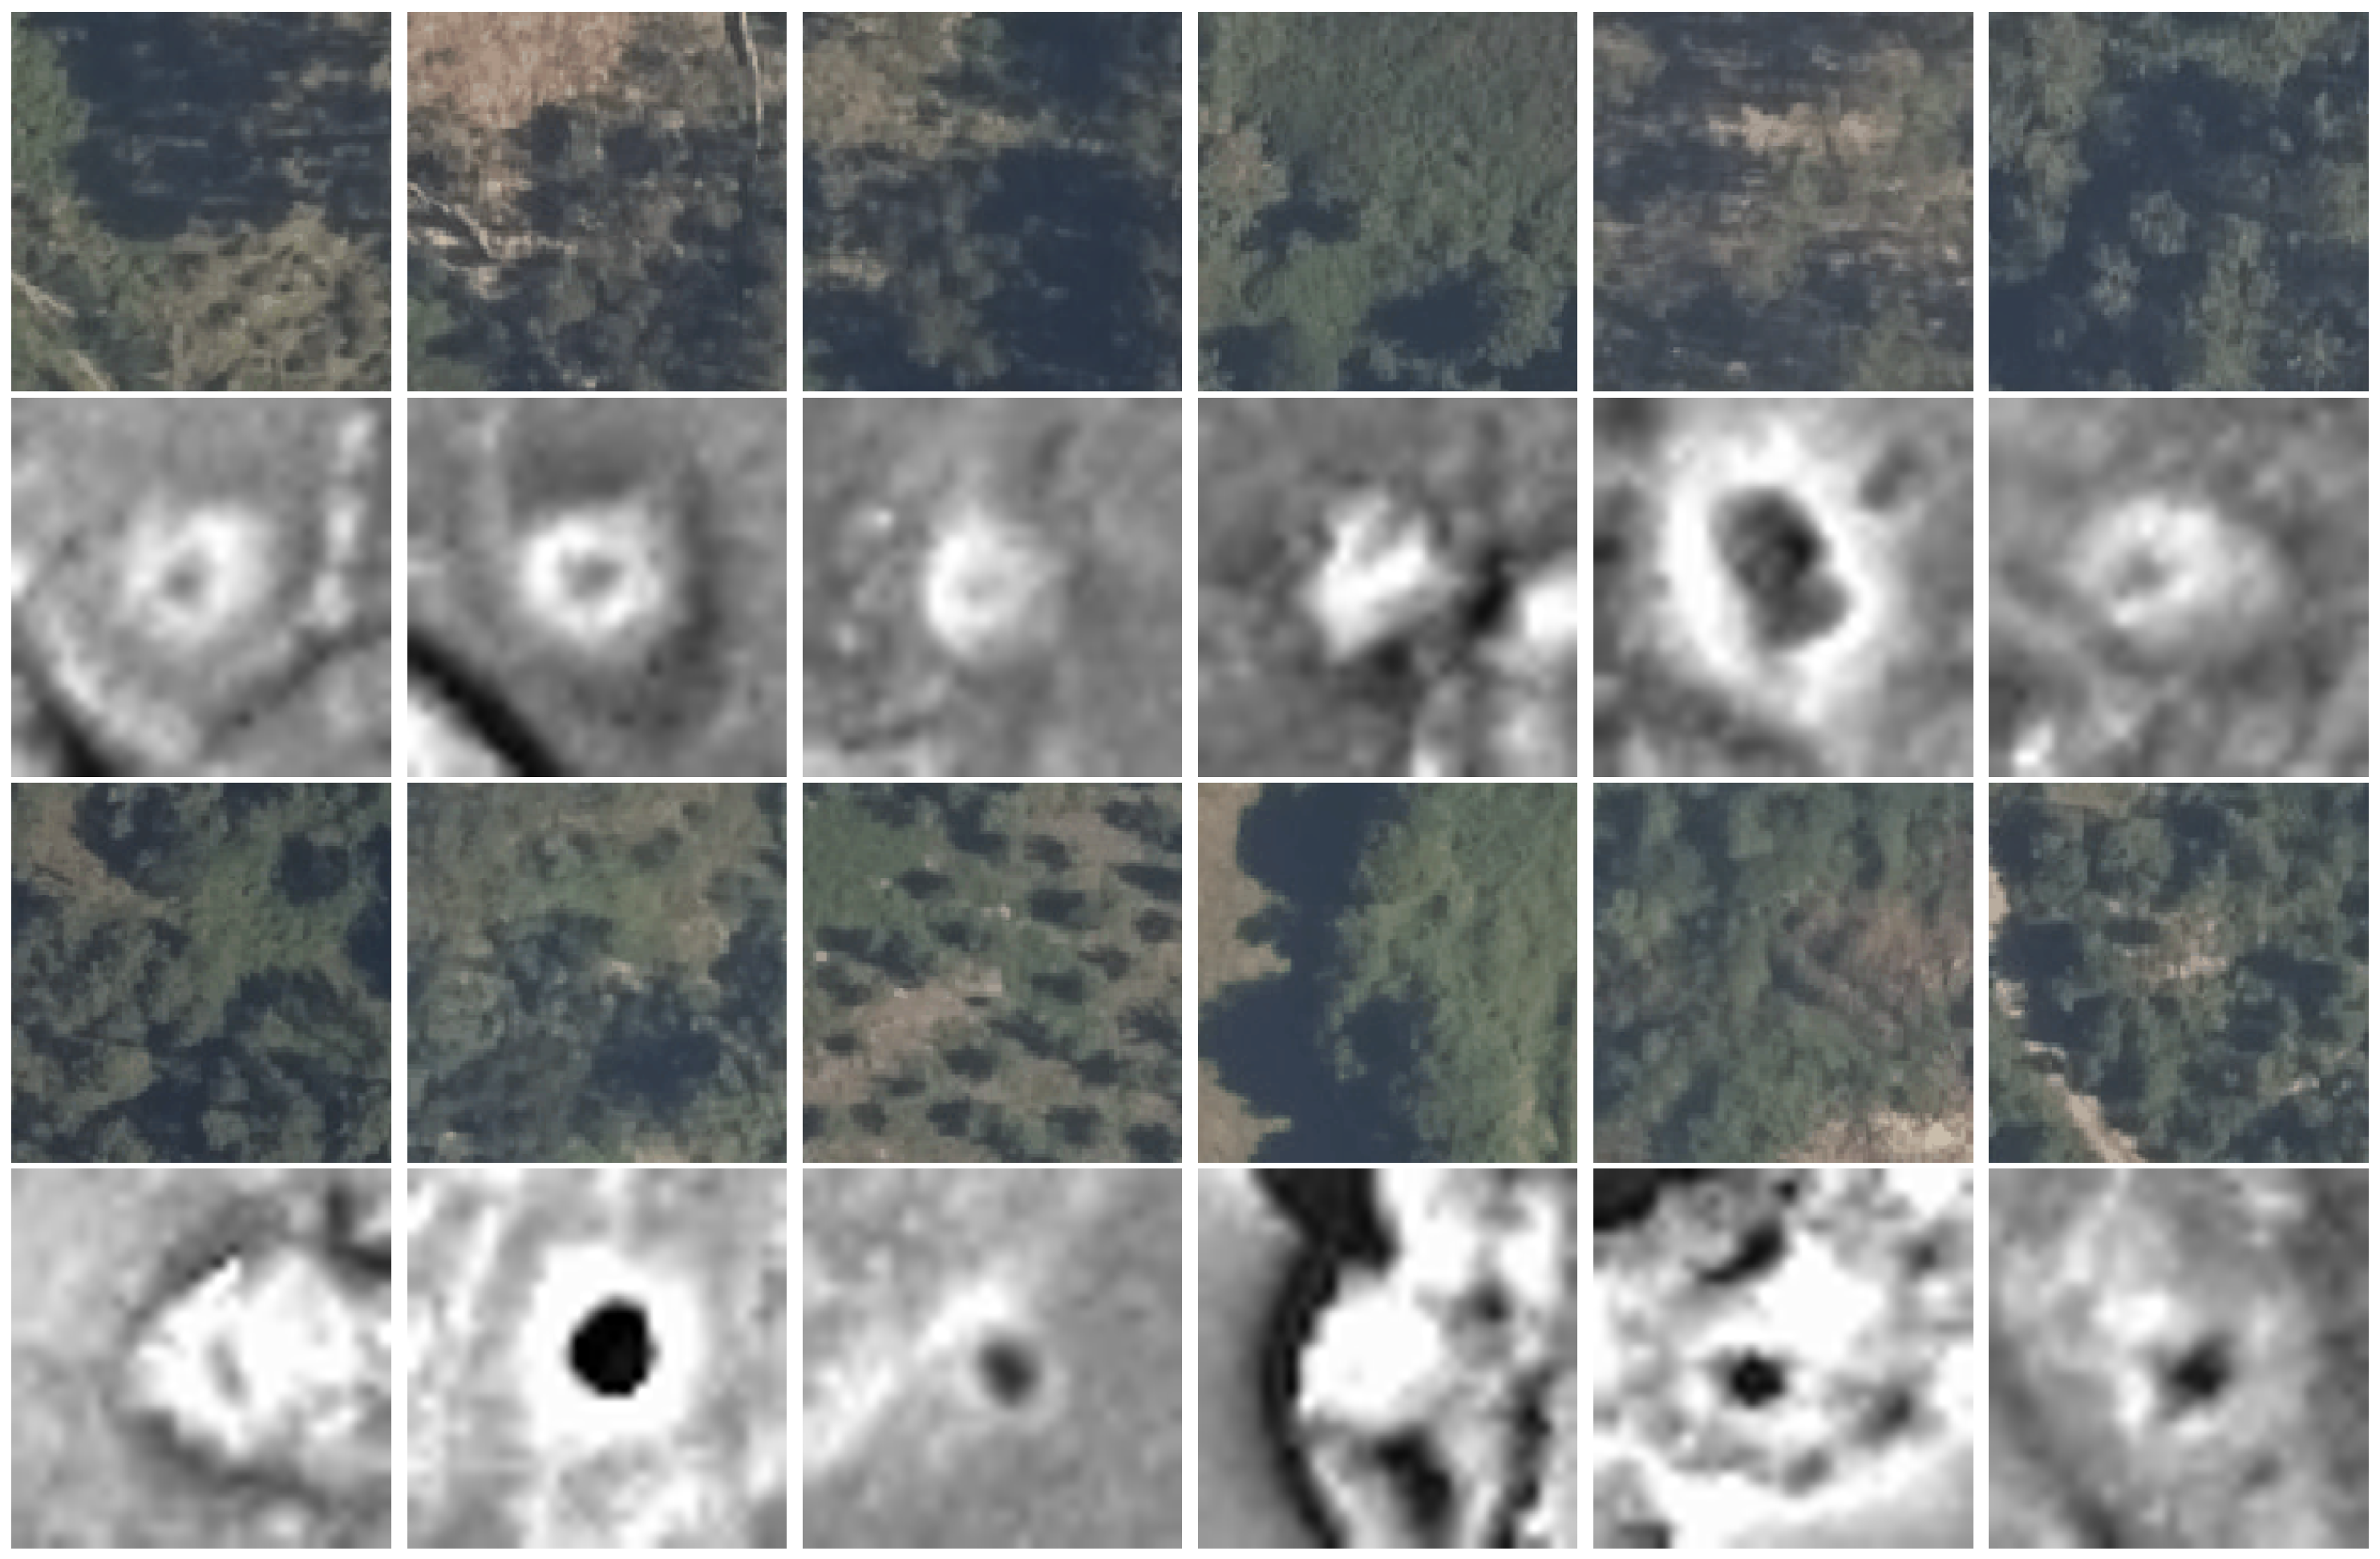
To obtain the necessary samples, the known and annotated 276 burial mounds of Alto Minho were considered for the burial mound class, and the 178 inferences that were digitally invalidated in our previous work were considered for the False Positive class. In this digital validation, four expert archaeologists visually classified the inferences as potential True Positives and False Positives. They used QGIS and were assisted by LiDAR-derived LRMs, Google Satellite images, Bing Aerial images, and aerial images from Direção-Geral do Território (DGT), the Portuguese territorial institution. The images were dated 2021, 2018, 2004–2006, and 1995. The RGB (red, green, and blue) bands of the DGT 25 cm orthophotos from 2021 were used [35] to crop 224 × 224 images of burial mounds and False Positives. The selected orthophotos are more recent than the LiDAR data used, as they are significantly better quality. Figure 8 illustrates samples of the dataset.
To increase the size of the dataset and achieve class balance, data augmentation was performed. Seven geometric transformations were considered: flip left to right, flip top to bottom, 90° rotation, 180° rotation, 270° rotation, transpose, and transverse. Figure 9 illustrates the proposed data augmentation applied to a False Positive sample, and Table 7 presents the dataset achieved that was used to train the ViT model.
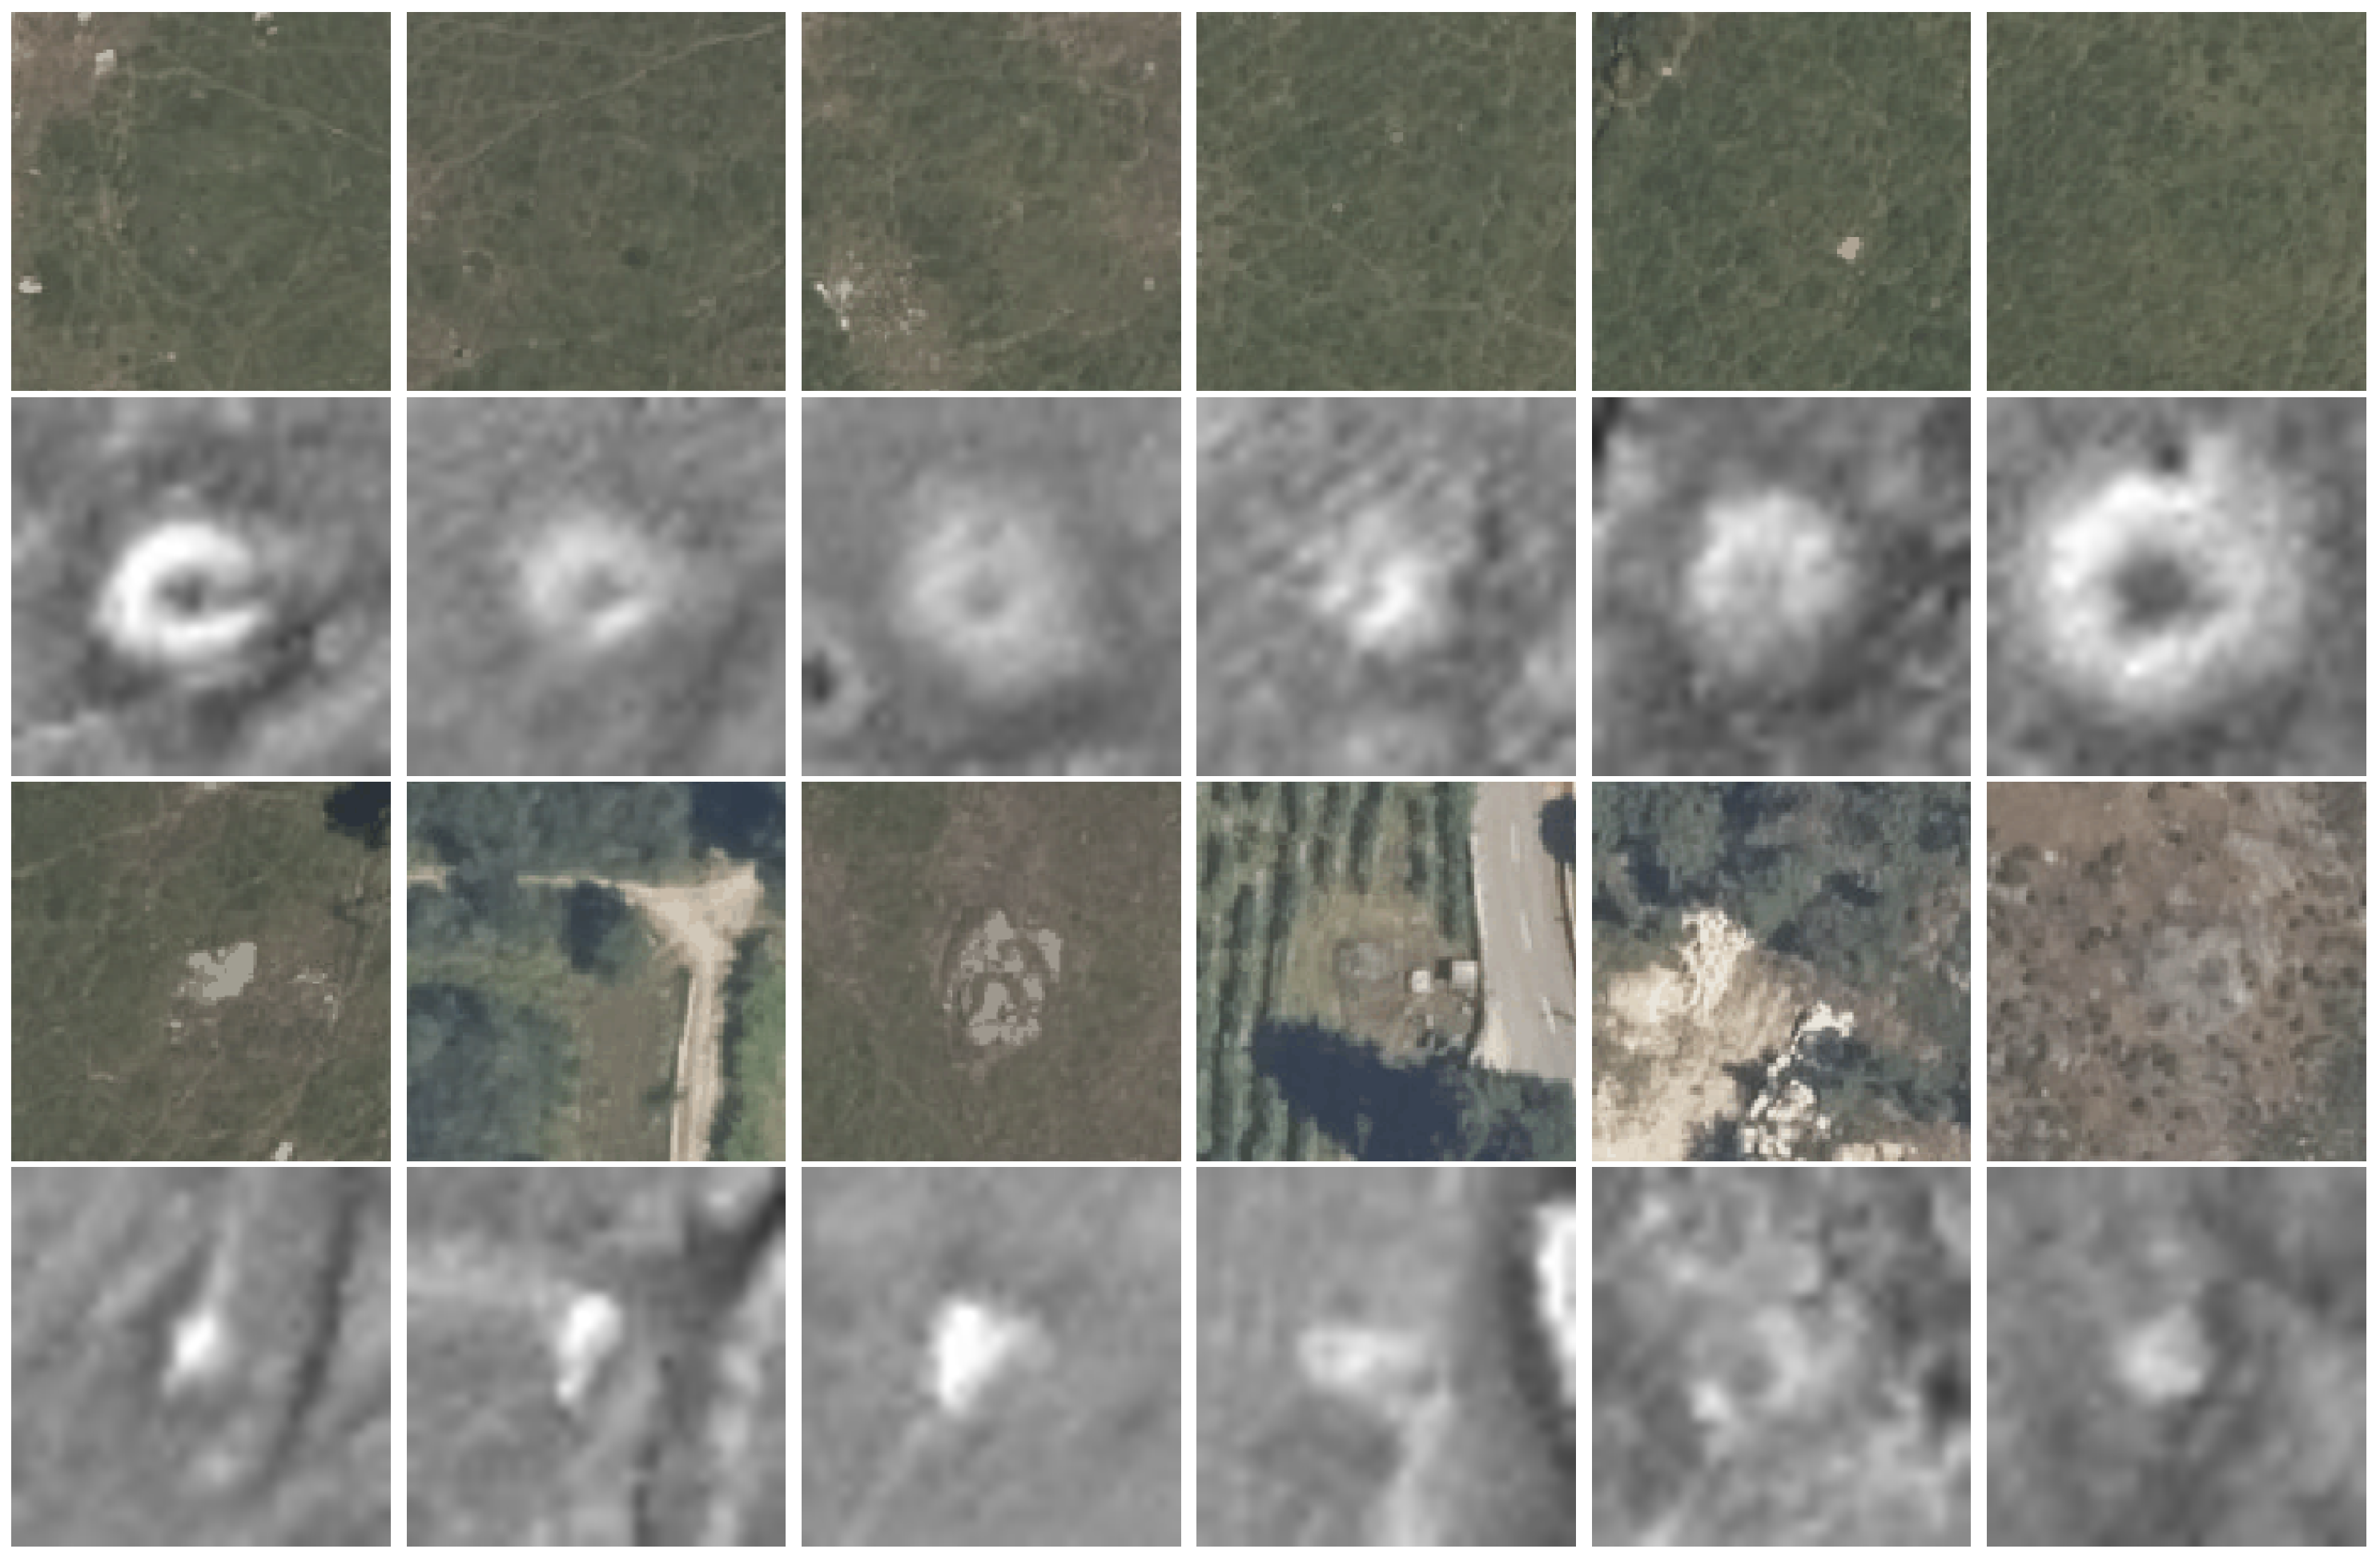
A ViT model pre-trained on ImageNet-21k (14 million images, 21,843 classes) at resolution 224 × 224 [31] was fine-tuned with this dataset. The optimizer used was AdamW [36] ( β 1 = 0.9, β 2 = 0.999, ϵ = 1 × 10⁻⁸) with a learning rate of 5 × 10⁻⁵. The image resolution was set to 224 × 224, the batch size was set to 32, and the model was trained for 25 epochs, saving the best weights. The training was performed with an Nvidia GeForce RTX 3080 10 GB GDDR6X GPU and an AMD Ryzen 5 5600X 6-Core 3.7GHz CPU (Santa Clara, CA, USA), and it took 572 s. The best iteration achieved a validation accuracy of 0.91 and a validation loss of 0.43. The training of the model could be hindered by the challenge of distinguishing burial mounds and False Positives in some orthophotos, as they are obscured by dense vegetation. Figure 10 illustrates some of these challenging samples.

5. Results

In this section, the results of the proposed algorithms are discussed. Section 5.1 discusses the results obtained in the Alto Minho region, where the fieldwork validation was carried out. Section 5.2 discusses the results obtained in the Barbanza region.

5.1. Alto Minho

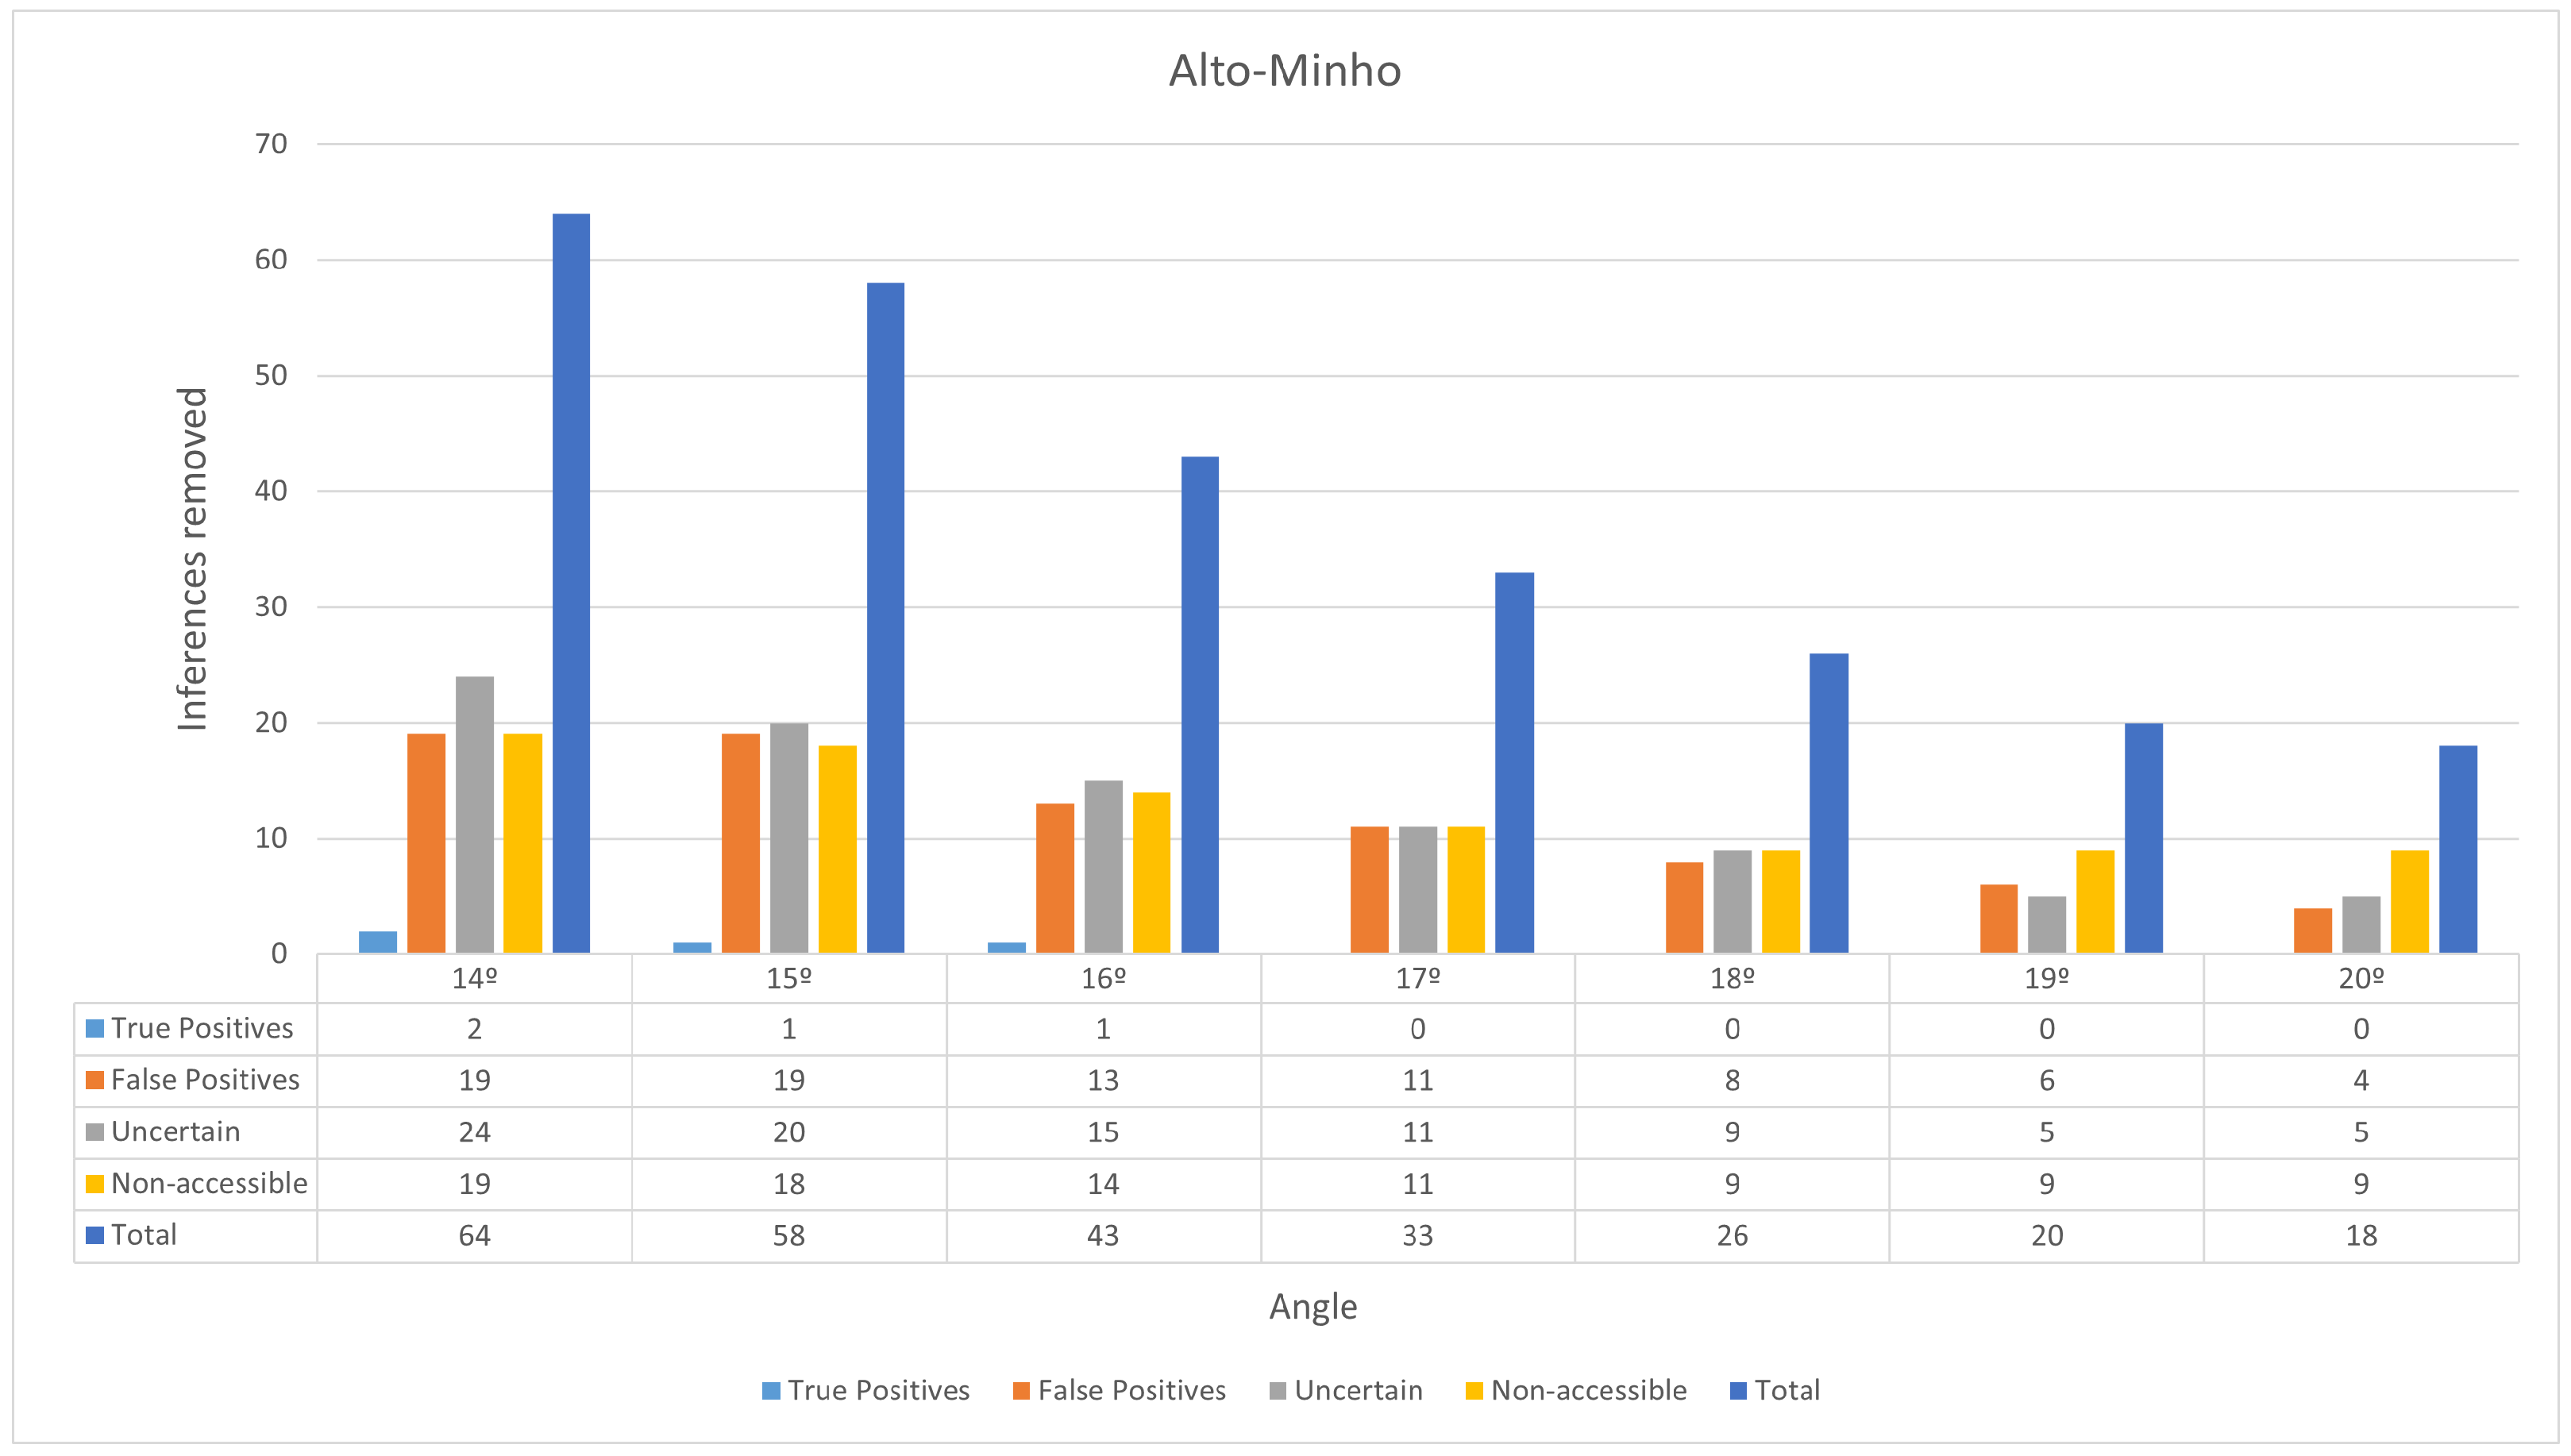
The number of inferences the slope filter removes varies according to the chosen angle threshold. Figure 11 illustrates the results.
To ensure objectivity, only the inferences that were classified as True Positives and False Positives during the fieldwork validation were considered. A total of 23 inferences were classified as True Positives and 63 inferences were classified as False Positives. Suppose an angle threshold that does not exclude any True Positives and maximizes the number of removed False Positives: 17°. With this threshold, 11 of the 63 False Positives are removed, decreasing their number to 52. The ViT model trained in Section 4 then classified the digital orthophoto representation of these True Positive and False Positive inferences. It managed to achieve 65% precision, correctly classifying the 23 True Positives and 26 of the remaining 52 False Positives. This process essentially removes 26 False Positives, further reducing their number from 52 to 26. Table 8 illustrates the results of the proposed algorithm refinements for Alto Minho.
With an angle threshold of 17°, the proposed approach was able to eliminate 37 inferences that were confirmed to be False Positives during fieldwork, while not eliminating True Positives, increasing precision from 27% to 47%. Calculating the recall is impossible as the ground truth is unknown.

5.2. Barbanza

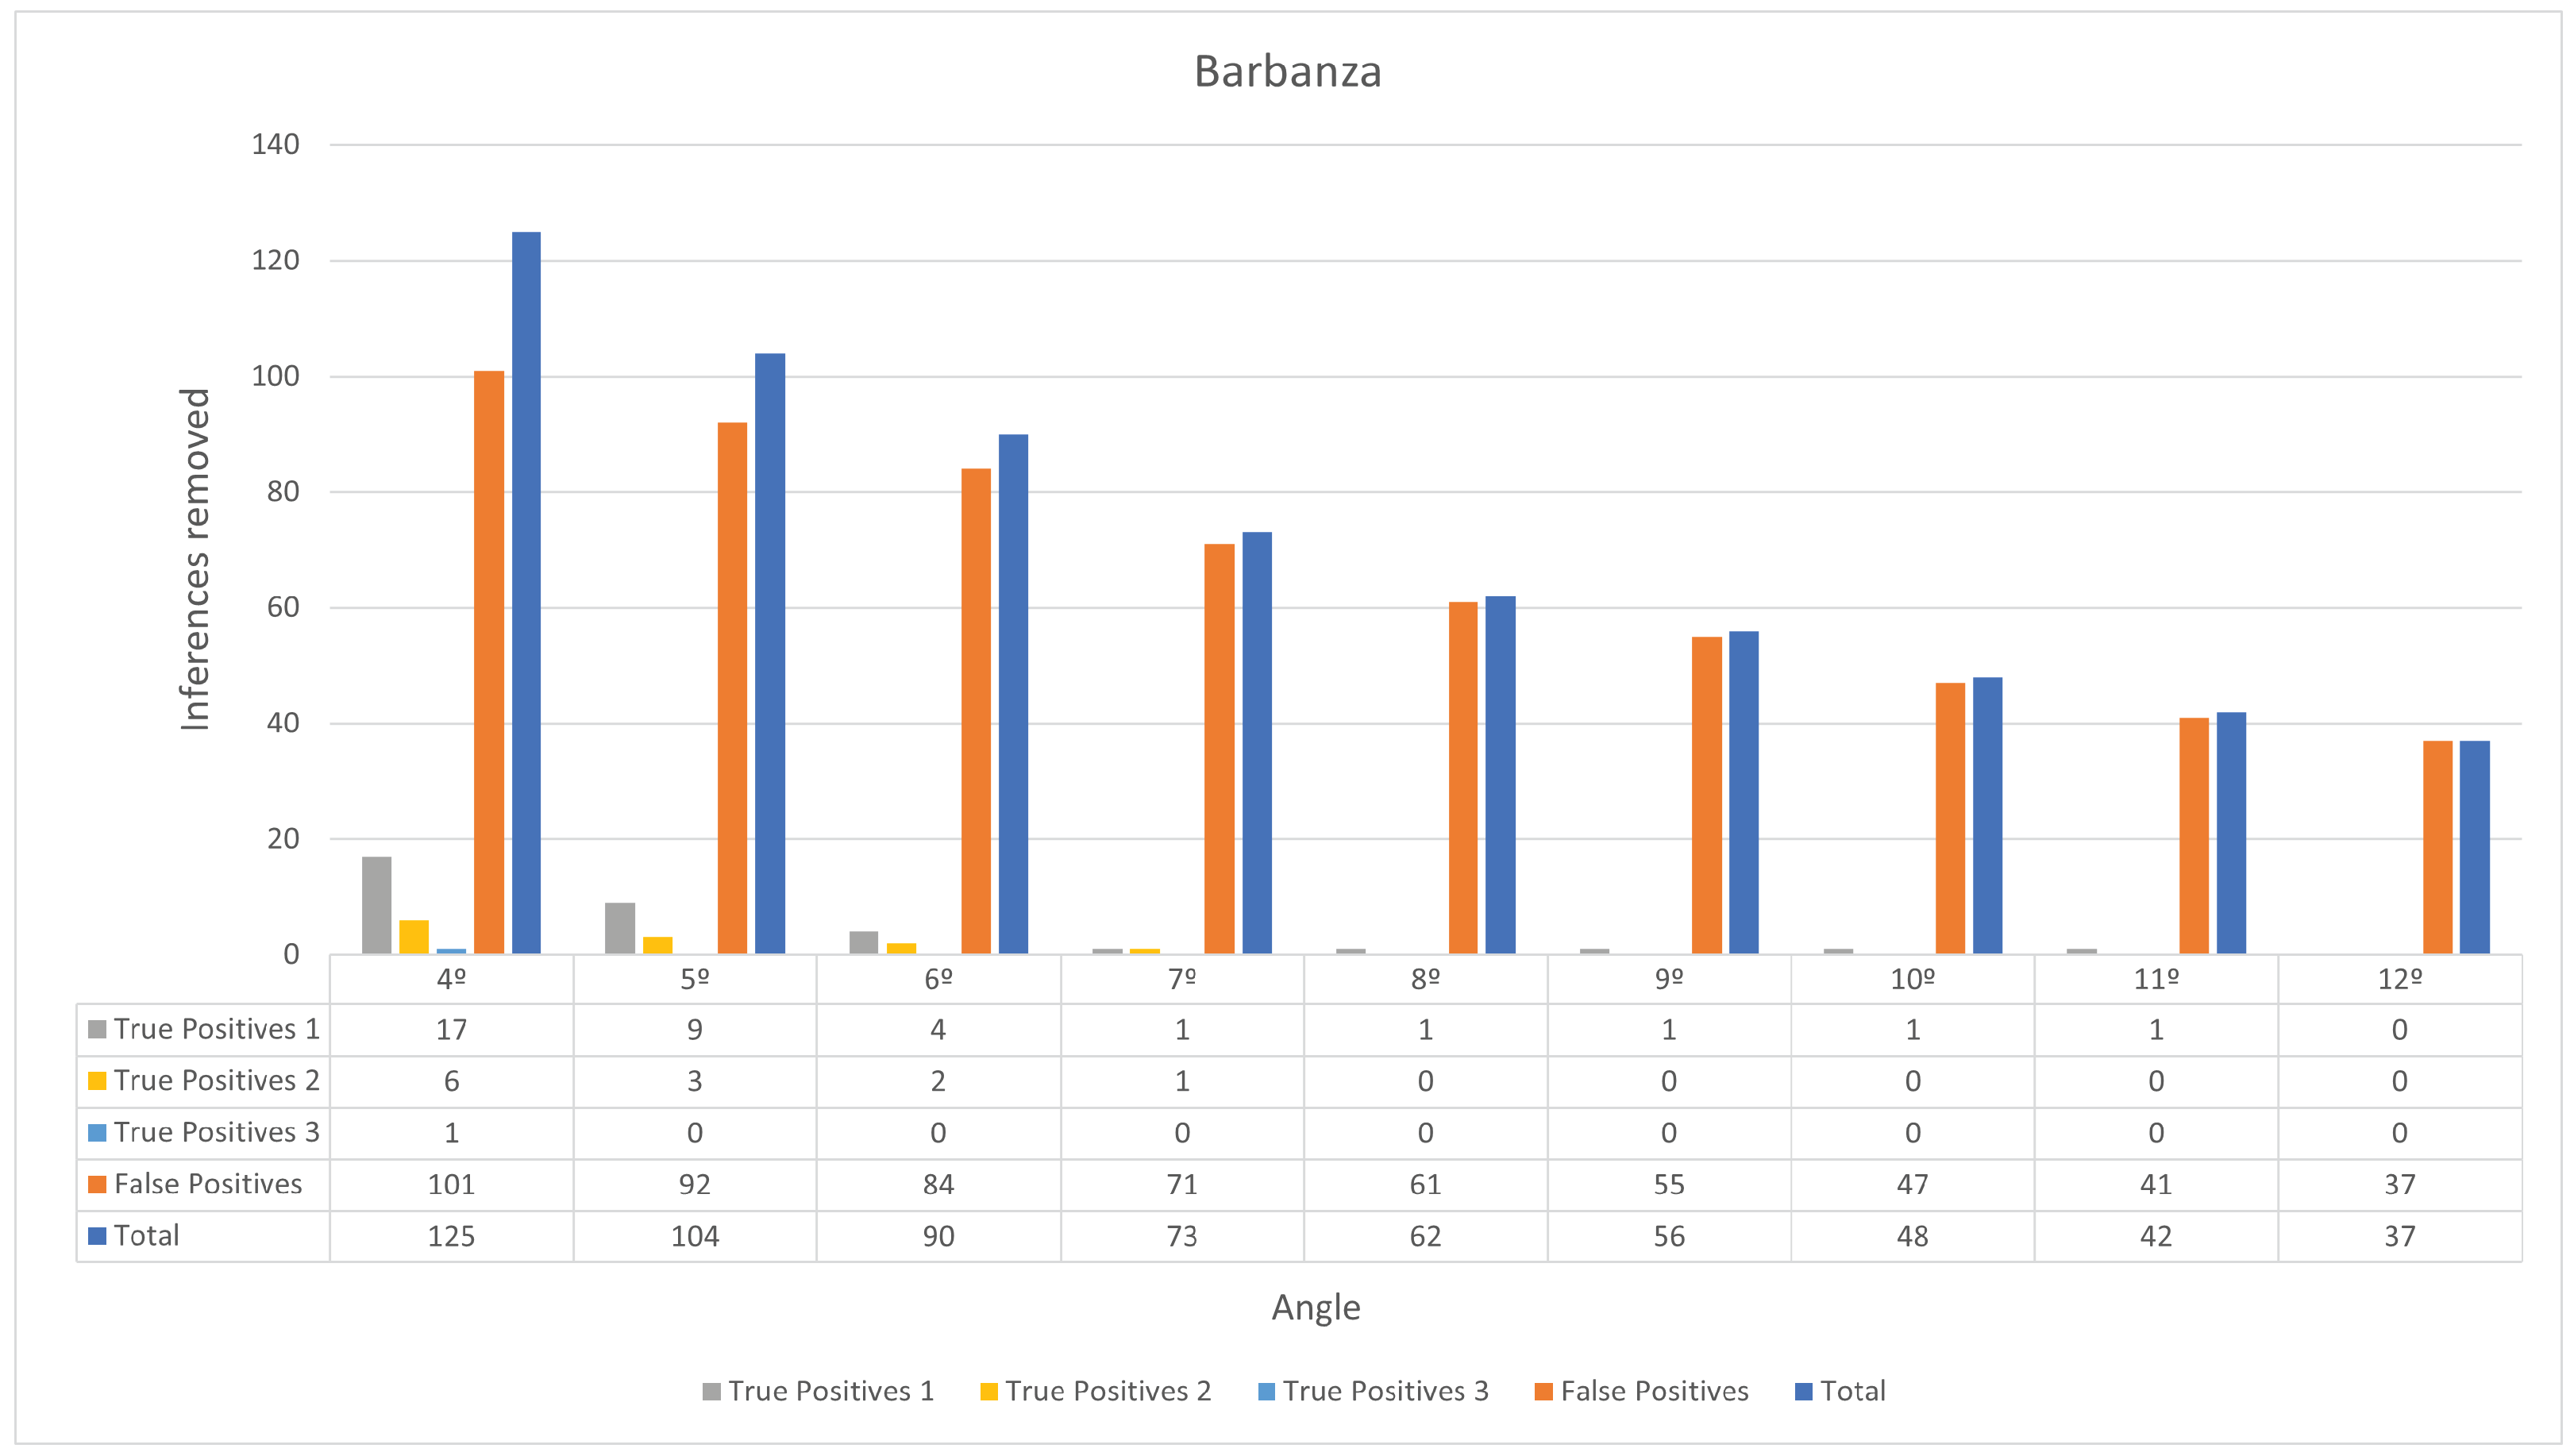
Once again, the number of inferences the slope filter removes varies according to the angle threshold. When compiling these results, it was observed that burial mounds appear to be located within flatter regions in Barbanza, compared to Alto Minho. Figure 12 illustrates the results for the slope filter in relation to the angle threshold.
To ensure objectivity, any inference that does not coincide with a known burial mound in Barbanza is a False Positive. The ground truth in Barbanza consists of 152 burial mounds. Of the original 164 inferences, 49 are True Positives and 115 are False Positives. Suppose an angle threshold that does not exclude any True Positives and maximizes the number of False Positives removed: 12°. With this threshold, 37 False Positives were removed, decreasing their number to 78. The ViT model trained in Section 4 then classified the digital orthophoto representation of these True Positive and False Positive inferences. The RGB bands of the IGN-PNOA 25 cm orthophotos from 2017 were used [37]. These are more recent than the year when the LiDAR data were captured, since the orthophotos of that respective year have an overall worse quality, which deteriorates the ViT performance. The ViT model managed to achieve 73% accuracy, correctly classifying 40 of the 49 True Positives and 52 of the 78 False Positives. This process essentially removes 9 True Positives and 52 False Positives from the inferences, reducing their numbers to 40 and 26, respectively. Table 9 illustrates the results of the proposed algorithm refinements for Barbanza.
With an angle threshold of 12°, the proposed approach removed 89 False Positives, at the cost of removing 9 True Positives, increasing the F1 score from 31% to 37%. A similar work conducted in Galicia [6] trained a YOLO model to detect burial mounds and trained a Random Forest classifier to eliminate regions with soils not conducive to their presence. Table 10 presents a comparative analysis between the proposed approach and the aforementioned work.

6. Discussion

In Section 5, the results obtained from the proposed inference pipeline are presented. This study introduces a fieldwork validation methodology, detailed in Section 3, aimed at validating burial mound inferences from our previous work [7]. The valuable insights provided by the experts who conducted the fieldwork and the digital validation enabled the algorithm to be refined by incorporating a slope filter and a ViT model. This refinement led to a significant increase in the F1 score across both study regions discussed in this manuscript. This improvement showcased the importance of bridging the gap between archaeological expertise and machine learning to address the prevalent problem of False Positives resulting from aerial imagery processing.
However, despite this improvement, it is essential to consider the generalizability of this work. First, both studied regions share a similar topology, and the morphology of burial mounds is also comparable. Thus, even though the YOLOv5 and ViT models were trained exclusively on data from Alto Minho, they demonstrated reliable generalization when making predictions on data from Barbanza. However, this may not necessarily hold true if these models predicted data with different topologies and burial mound morphologies. In such a scenario, fine-tuning the models for this new data type would be necessary, a step that was not required in this work. Furthermore, despite the similarity in topology between Alto Minho and Barbanza, a significant disparity was observed in the slope of the areas that house these burial mounds, as shown in Figure 11 and Figure 12. These areas housing burial mounds in Barbanza are flatter than Alto Minho, making it more difficult to set a threshold for the slope filter that can be efficiently applied across regions.
Another notable point is the endless possibilities for post-process optimization of the results, as illustrated in Figure 2. This diagram has the potential to expand further in line with emerging archaeological insights. At some point, this growth becomes unsustainable for any Geographic Information System (GIS), as it would necessitate handling numerous types of data and implementing systems for automated processing. Archaeological data are extensive and resource-intensive, which could cause storage and processing time issues. For further investigation in this field, a model-centric approach should be considered. This involves upgrading models to the most suitable and up-to-date versions for the data type at hand, exploring methods to enhance model performance to minimize the need for extensive post-processing. Furthermore, leveraging archaeological expertise to enrich training datasets could better guide models in their search for archaeological sites. Exploring digital validation methodologies is also essential, particularly considering the time and financial constraints associated with fieldwork validation. These methodologies must address these challenges and equip machine learning models with the required archaeological expertise to effectively detect archaeological sites.

7. Conclusions

This study investigated the powerful synergy between AI and fieldwork validation in archaeology, specifically focusing on the detection of burial mounds. This collaborative approach offers a promising solution to the well-documented issue of False Positives arising from AI-based detection of archaeological sites and features. The fieldwork validation detailed in Section 3 provided critical knowledge about the landscape context of both True Positives and False Positives produced by our previous work when detecting burial mounds [7]. Building on these insights, the algorithm proposed in our previous work was refined on the basis of the empirical knowledge gained from fieldwork validation. The data resulting from this validation, including information on True Positives and False Positives, enriched the datasets used to fine-tune the machine learning models for future archaeological surveys [9,38]. We used slope maps derived from LiDAR-derived DTMs to eliminate inferences in high-slope regions. In addition, a Vision Transformer (ViT) model was trained on digital orthophotos of confirmed burial mounds and previously identified False Positives. This ViT model acts as a final filter for removing False Positives. These refinements led to a significant improvement in the algorithm’s performance in both regions. The precision in Alto Minho increased from 27% to 47%. The F1 score in Barbanza increased from 31% to 37%. A similar work conducted in Galicia [6] obtained an F1 score of 29% when identifying burial mounds in the Barbanza region, which is 8% less than the proposed approach.
In reality, the results shown could be better. In Alto Minho, potential burial mounds classified as Uncertain in Section 3 were not considered in the calculations, as they still require further validation. In Barbanza, every detection that did not coincide with the known burial mounds contributed as a False Positive in the calculations, although some promising inferences could, in fact, be burial mounds. Although this work offers valuable improvements, the field requires continuous research and development. Using the knowledge gained from fieldwork and the digital validation of AI algorithms, we can significantly enhance this iterative process. This collaborative approach has immense potential to revolutionize archaeological research and cultural heritage management, leading to significant improvements in the accuracy of automatic site detection.

Author Contributions

D.C.: Conceptualization, Methodology, Software, Formal Analysis, Investigation, Data Curation, Writing—Original Draft, Visualization; J.H.: Conceptualization, Methodology, Validation, Formal Analysis, Investigation, Data Curation, Writing—Review and Editing, Visualization; J.F.: Conceptualization, Methodology, Resources, Data Curation, Writing—Review and Editing, Supervision, Project Administration; R.D.: Resources, Methodology, Writing—Review and Editing, Supervision, Project Administration, Funding Acquisition; T.d.P.: Resources, Writing—Review and Editing; P.G.: Writing—Review and Editing, Supervision, Project Administration; L.G.-S.: Resources, Data Curation, Writing—Review and Editing; M.V.: Writing—Review and Editing, Supervision, Project Administration, Funding Acquisition; N.P.: Resources, Writing—Review and Editing; P.F.-Á.: Resources, Writing—Review and Editing; F.M.-M.: Resources, Writing—Review and Editing; A.J.R.N.: Writing—Review and Editing, Supervision, Project Administration, Funding Acquisition. All authors have read and agreed to the published version of the manuscript.

Funding

This work was supported in part by the project ‘Odyssey: Platform for Automated Sensing in Archaeology’ (Ref. ALG-01-0247-FEDER-070150), co-financed by COMPETE 2020 and Regional Operational Program Lisboa 2020, through Portugal 2020 and FEDER. This work was also funded in part by the PRR—Recovery and Resilience Plan and by the NextGenerationEU funds at Universidade de Aveiro, through the scope of the Agenda for Business Innovation ‘NEXUS: Pacto de Inovação—Transição Verde e Digital para Transportes, Logística e Mobilidade’ (Project no. 53 with the application C645112083-00000059). This study was further supported by the European Union-NextGenerationEU, through the National Recovery and Resilience Plan of the Republic of Bulgaria, project N0 BG-RRP-2.004-0005; and FCT/MCTES through national funds and when applicable co-funded EU funds under the project UIDB/50008/2020-UIDP/50008/2020. INCIPIT-CSIC funded the fieldwork that generated the Barbanza area tumuli database through the project ‘Prospección arqueológica dirigida a la teledetección y documentación de las mámoas de la Península de Barbarza’, directed by one of the authors of this paper (P. Fábrega-Álvarez).

Data Availability Statement

Embargo on data due to commercial restrictions: The data that support the findings will be available in ODYSSEY at https://odyssey.pt/ following an embargo from the date of publication to allow for commercialization of research findings.

Acknowledgments

The authors are grateful to the Comunidade Intermunicipal do Alto Minho (CIM Alto Minho) for providing the airborne LiDAR data for the Alto Minho region.

Conflicts of Interest

The authors declare no conflicts of interest.

Abbreviations

The following abbreviations are used in this manuscript:
AIartificial intelligence
LiDARLight Detection and Ranging
UAVUnmanned Aerial Vehicle
DTMDigital Terrain Model
LRMLocal Relief Model
YOLOYou Only Look Once
LBRLocation-Based Ranking
LOFLocal Outlier Factor
SIOSESistema de Información sobre Ocupación del Suelo de España
ViTVision Transformer
CNNConvolutional Neural Network
RGBRed, Green, and Blue
DGTDireção Geral do Território
IGNInstituto Geográfico Nacional
PNOAPlan Nacional de Ortofotografía Aérea
GISGeographic Information System

References

  1. Verschoof-van der Vaart, W.B.; Lambers, K. Applying automated object detection in archaeological practice: A case study from the southern Netherlands. Archaeol. Prospect. 2022, 29, 15–31. [Google Scholar] [CrossRef]
  2. Orengo, H.A.; Conesa, F.C.; Garcia-Molsosa, A.; Lobo, A.; Green, A.S.; Madella, M.; Petrie, C.A. Automated detection of archaeological mounds using machine-learning classification of multisensor and multitemporal satellite data. Proc. Natl. Acad. Sci. USA 2020, 117, 18240–18250. [Google Scholar] [CrossRef] [PubMed]
  3. Freeland, T.; Heung, B.; Burley, D.; Clark, G.; Knudby, A. Automated feature extraction for prospection and analysis of monumental earthworks from aerial LiDAR in the Kingdom of Tonga. J. Archaeol. Sci. 2016, 69, 64–74. [Google Scholar] [CrossRef]
  4. Guyot, A.; Hubert-Moy, L.; Lorho, T. Detecting Neolithic Burial Mounds from LiDAR-Derived Elevation Data Using a Multi-Scale Approach and Machine Learning Techniques. Remote Sens. 2018, 10, 225. [Google Scholar] [CrossRef]
  5. Cerrillo Cuenca, E. An approach to the automatic surveying of prehistoric barrows through LiDAR. Quat. Int. 2017, 435B, 135–145. [Google Scholar] [CrossRef]
  6. Berganzo-Besga, I.; Orengo, H.A.; Lumbreras, F.; Carrero-Pazos, M.; Fonte, J.; Vilas-Estévez, B. Hybrid MSRM-Based Deep Learning and Multitemporal Sentinel 2-Based Machine Learning Algorithm Detects Near 10k Archaeological Tumuli in North-Western Iberia. Remote Sens. 2021, 13, 4181. [Google Scholar] [CrossRef]
  7. Canedo, D.; Fonte, J.; Seco, L.G.; Vázquez, M.; Dias, R.; Do Pereiro, T.; Hipólito, J.; Menéndez-Marsh, F.; Georgieva, P.; Neves, A.J.R. Uncovering Archaeological Sites in Airborne LiDAR Data with Data-Centric Artificial Intelligence. IEEE Access 2023, 11, 65608–65619. [Google Scholar] [CrossRef]
  8. Bickler, S.H. Machine Learning Arrives in Archaeology. Adv. Archaeol. Pract. 2021, 9, 186–191. [Google Scholar] [CrossRef]
  9. Casini, L.; Marchetti, N.; Montanucci, A.; Orrù, V.; Roccetti, M. A human–AI collaboration workflow for archaeological sites detection. Sci. Rep. 2023, 13, 8699. [Google Scholar] [CrossRef]
  10. Fiorucci, M.; Khoroshiltseva, M.; Pontil, M.; Traviglia, A.; Del Bue, A.; James, S. Machine Learning for Cultural Heritage: A Survey. Pattern Recognit. Lett. 2020, 133, 102–108. [Google Scholar] [CrossRef]
  11. Argyrou, A.; Agapiou, A. A Review of Artificial Intelligence and Remote Sensing for Archaeological Research. Remote Sens. 2022, 14, 6000. [Google Scholar] [CrossRef]
  12. Chapinal-Heras, D.; Díaz-Sánchez, C. A review of AI applications in human sciences research. Digit. Appl. Archaeol. Cult. Herit. 2024, 32, e00323. [Google Scholar] [CrossRef]
  13. Câmara, A.; de Almeida, A.; Caçador, D.; Oliveira, J. Automated methods for image detection of cultural heritage: Overviews and perspectives. Archaeol. Prospect. 2023, 30, 153–169. [Google Scholar] [CrossRef]
  14. Karamitrou, A.; Sturt, F.; Bogiatzis, P.; Beresford-Jones, D. Towards the use of artificial intelligence deep learning networks for detection of archaeological sites. Surf. Topogr. Metrol. Prop. 2022, 10, 044001. [Google Scholar] [CrossRef]
  15. Hesse, R. LiDAR-derived Local Relief Models—A new tool for archaeological prospection. Archaeol. Prospect. 2010, 17, 67–72. [Google Scholar] [CrossRef]
  16. Hesse, R. Using lidar-derived Local Relief Models (lrm) as a new tool for archaeological prospection. In Landscape Archaeology between Art and Science; Amsterdam University Press: Amsterdam, The Netherlands, 2015; p. 369. [Google Scholar]
  17. Guyot, A.; Lennon, M.; Hubert-Moy, L. Objective comparison of relief visualization techniques with deep CNN for archaeology. J. Archaeol. Sci. Rep. 2021, 38, 103027. [Google Scholar] [CrossRef]
  18. Jaturapitpornchai, R.; Poggi, G.; Sech, G.; Kokalj, Z.; Fiorucci, M.; Traviglia, A. Impact of LiDAR visualisations on semantic segmentation of archaeological objects. arXiv 2024, arXiv:2404.05512. [Google Scholar]
  19. Bettencourt, A.M.S.; Boas, L.V. Monumentos Megalíticos do Alto Minho. Uma Paisagem Milenar. Viagem no Tempo. História e Património Cultural do Alto Minho; Comunidade Intermunicipal do Alto Minho: Viana do Castelo, Portugal, 2021; pp. 35–44. [Google Scholar]
  20. Ferreira de Sousa, M.G. O Fenómeno Tumular e Megalítico da Região Galaico-Portuguesa do Miño. Ph.D. Thesis, Universidade de Santiago de Compostela, Santiago de Compostela, Spain, 2013. Available online: http://hdl.handle.net/10347/7510 (accessed on 20 May 2024).
  21. Dwibedi, D.; Misra, I.; Hebert, M. Cut, paste and learn: Surprisingly easy synthesis for instance detection. In Proceedings of the IEEE International Conference on Computer Vision, Venice, Italy, 22–29 October 2017; pp. 1301–1310. [Google Scholar]
  22. Redmon, J.; Divvala, S.; Girshick, R.; Farhadi, A. You only look once: Unified, real-time object detection. In Proceedings of the IEEE Conference on Computer Vision and Pattern Recognition, Las Vegas, NV, USA, June 26–July 1 2016; pp. 779–788. [Google Scholar]
  23. Verschoof-van der Vaart, W.B.; Lambers, K.; Kowalczyk, W.; Bourgeois, Q.P. Combining deep learning and location-based ranking for large-scale archaeological prospection of LiDAR data from the Netherlands. ISPRS Int. J. Geo-Inf. 2020, 9, 293. [Google Scholar] [CrossRef]
  24. Alghushairy, O.; Alsini, R.; Soule, T.; Ma, X. A review of local outlier factor algorithms for outlier detection in big data streams. Big Data Cogn. Comput. 2020, 5, 1. [Google Scholar] [CrossRef]
  25. Criado-Boado, F.; Villoch-Vázquez, V. La monumentalización del Paisaje: Percepción actual y sentido original en el Megalitismo de la Sierra de Barbanza (Galicia). Trab. Prehist. 1998, 55, 63–80. [Google Scholar] [CrossRef]
  26. González-García, A.C.; Criado-Boado, F.; Vilas-Estévez, B. Megalithic skyscapes in Galicia. Complutum 2009, 20, 23–38. [Google Scholar]
  27. Carrero-Pazos, M.; Bustelo-Abuín, J.; Barbeito-Pose, V.; Rodríguez-Rellán, C. Locational preferences and spatial arrangement in the barrow landscape of Serra do Barbanza (North-western Iberia). J. Archaeol. Sci. Rep. 2020, 31, 102351. [Google Scholar] [CrossRef]
  28. Valcarce, R.F.; Rodríguez-Rellán, C.; Bustelo Abuín, J.; Barbeito Pose, V. Building up the land: A new appraisal to the megalithic phenomenon in the Barbanza peninsula (Galicia, NW Spain). In de Gibraltar aos Pirenéus; Fundaçâo Lapa do Lobo: Nelas, Portugal, 2018; p. 85. [Google Scholar]
  29. Sistema de Información de Ocupación del Suelo de España. Available online: https://www.siose.es/presentacion (accessed on 19 March 2024).
  30. Strahler, A.N. Quantitative slope analysis. Geol. Soc. Am. Bull. 1956, 67, 571–596. [Google Scholar] [CrossRef]
  31. Dosovitskiy, A.; Beyer, L.; Kolesnikov, A.; Weissenborn, D.; Zhai, X.; Unterthiner, T.; Dehghani, M.; Minderer, M.; Heigold, G.; Gelly, S.; et al. An image is worth 16 × 16 words: Transformers for image recognition at scale. arXiv 2020, arXiv:2010.11929. [Google Scholar]
  32. Lin, T.; Wang, Y.; Liu, X.; Qiu, X. A survey of transformers. AI Open 2022, 3, 111–132. [Google Scholar] [CrossRef]
  33. Wolf, T.; Debut, L.; Sanh, V.; Chaumond, J.; Delangue, C.; Moi, A.; Cistac, P.; Rault, T.; Louf, R.; Funtowicz, M.; et al. Transformers: State-of-the-art natural language processing. In Proceedings of the 2020 Conference on Empirical Methods in Natural Language Processing: System Demonstrations, Online, 16–20 November 2020. [Google Scholar]
  34. Maurício, J.; Domingues, I.; Bernardino, J. Comparing vision transformers and convolutional neural networks for image classification: A literature review. Appl. Sci. 2023, 13, 5521. [Google Scholar] [CrossRef]
  35. Ortofotomapas. Available online: https://www.dgterritorio.gov.pt/Ortofotomapas-2021 (accessed on 19 March 2024).
  36. Loshchilov, I.; Hutter, F. Decoupled weight decay regularization. arXiv 2017, arXiv:1711.05101. [Google Scholar]
  37. Plan Nacional de Ortofotografía Aérea. Available online: https://pnoa.ign.es/ (accessed on 19 March 2024).
  38. Olivier, M.; Verschoof-van der Vaart, W. Implementing State-of-the-Art Deep Learning Approaches for Archaeological Object Detection in Remotely-Sensed Data: The Results of Cross-Domain Collaboration. J. Comput. Appl. Archaeol. 2021, 4, 274–289. [Google Scholar] [CrossRef]
Figure 1. Categorization of 237 inferences subjected to ground truthing.
Remotesensing 16 01933 g001
Figure 2. Inference pipeline. The previous work and consequent algorithm refinement presented in the current work are outlined.
Remotesensing 16 01933 g002
Figure 3. The LRM of Alto Minho including the original 648 inferences, and the 237 inferences covered in the fieldwork validation are marked with yellow.
Remotesensing 16 01933 g003
Figure 4. On the left, the LRM of Barbanza including the 164 inferences resulting from the methodology proposed in our previous work in red. On the right, the SIOSE used for the LBR algorithm.
Remotesensing 16 01933 g004
Figure 5. Slope maps of Alto Minho and Barbanza, respectively. The slope goes from 0° (low) to 90° (high).
Remotesensing 16 01933 g005
Figure 6. Barbanza slope map with an overlaid inference. The slope goes from 0° (low) to 90° (high). The red bounding box designates the inference, while the blue bounding box was generated by expanding the red one by 25 pixels. The pixels encompassed by the blue and red bounding boxes define the region used to compute the mean slope of where the potential burial mound is located.
Remotesensing 16 01933 g006
Figure 7. Histogram representing the mean inclination angle of the vicinity of known burial mounds.
Remotesensing 16 01933 g007
Figure 8. Samples of the dataset comprising images cropped from the orthophotomap. The first and second rows represent burial mounds and their LRM representations for visualization purposes, respectively. The third and fourth rows represent False Positives and their LRM representations for visualization purposes, respectively.
Remotesensing 16 01933 g008
Figure 9. Data augmentation: flip left to right, flip top to bottom, 90° rotation, 180° rotation, 270° rotation, transpose, and transverse, respectively.
Remotesensing 16 01933 g009
Figure 10. Some challenging samples of the dataset due to dense canopy and vegetation. The first and second rows represent burial mounds and their LRM representations for visualization purposes, respectively. The third and fourth rows represent False Positives and their LRM representations for visualization purposes, respectively.
Remotesensing 16 01933 g010
Figure 11. Results obtained for the slope filter in Alto Minho. See Section 3 for details about the labels.
Remotesensing 16 01933 g011
Figure 12. Results obtained for the slope filter in Barbanza. True Positives 1 corresponds to burial mounds that are observable with a violation pit, True Positives 2 corresponds to burial mounds that are observable but do not have a violation pit, and True Positives 3 corresponds to burial mounds that are not observable.
Remotesensing 16 01933 g012
Table 1. Summary of field validation results.
 True PositiveFalse PositiveUncertainNon-AccessibleTotal
Inferences23636487237
Percentage9.7%26.6%27%36.7%100%
Table 2. True Positive classification segmented by confidence level.
Confidence Level (Percentage)Inferences
100%0
95–99%6
90–94%7
85–89%10
Total23
Table 3. False Positive classification segmented by confidence level.
Confidence Level (Percentage)Inferences
100%37
95–99%7
90–94%1
85–89%18
Total63
Table 4. On-site classification of False Positives.
On-Site ClassificationInferences
Bedrock34
Slopes5
Structures7
Other17
Table 5. VL-TP, P-TP, and E-TP results scaled by confidence level.
Inference Category (Confidence Level)Inferences
VL-TP (70–84%)10
P-TP (60–69%)17
E-TP (50–59%)7
Total34
Table 6. VL-FP, P-FP, and E-FP results scaled by confidence level.
Inference Category (Confidence Level)Inferences
VL-FP (70–84%)4
P-FP (60–69%)21
E-FP (50–59%)5
Total30
Table 7. Burial mound and False Positive dataset used to train the ViT model.
DatasetBurial MoundsFalse Positives
Training set10001000
Validation set424424
Table 8. Results for Alto Minho (slope filter angle threshold = 17°).
TotalSlope FilterViT Model
True Positives232323
False Positives635226
Precision0.270.310.47
Table 9. Results for Barbanza (slope filter angle threshold = 12°).
TotalSlope FilterViT Model
True Positives494940
False Positives1157826
False Negatives103103112
Precision0.300.390.61
Recall0.320.320.26
F1 Score0.310.350.37
Table 10. Comparative analysis with a similar work conducted in Barbanza [6].
Berganzo-Besga et al. [6]Proposed Approach
True Positives3540
False Positives5326
False Negatives117112
Precision0.400.61
Recall0.230.26
F1 Score0.290.37
Disclaimer/Publisher’s Note: The statements, opinions and data contained in all publications are solely those of the individual author(s) and contributor(s) and not of MDPI and/or the editor(s). MDPI and/or the editor(s) disclaim responsibility for any injury to people or property resulting from any ideas, methods, instructions or products referred to in the content.