Regional Landslide Susceptibility Assessment and Model Adaptability Research
Abstract
1. Introduction
2. Study Area
3. Methods
3.1. CF Model
3.2. FR Model
3.3. LR Model
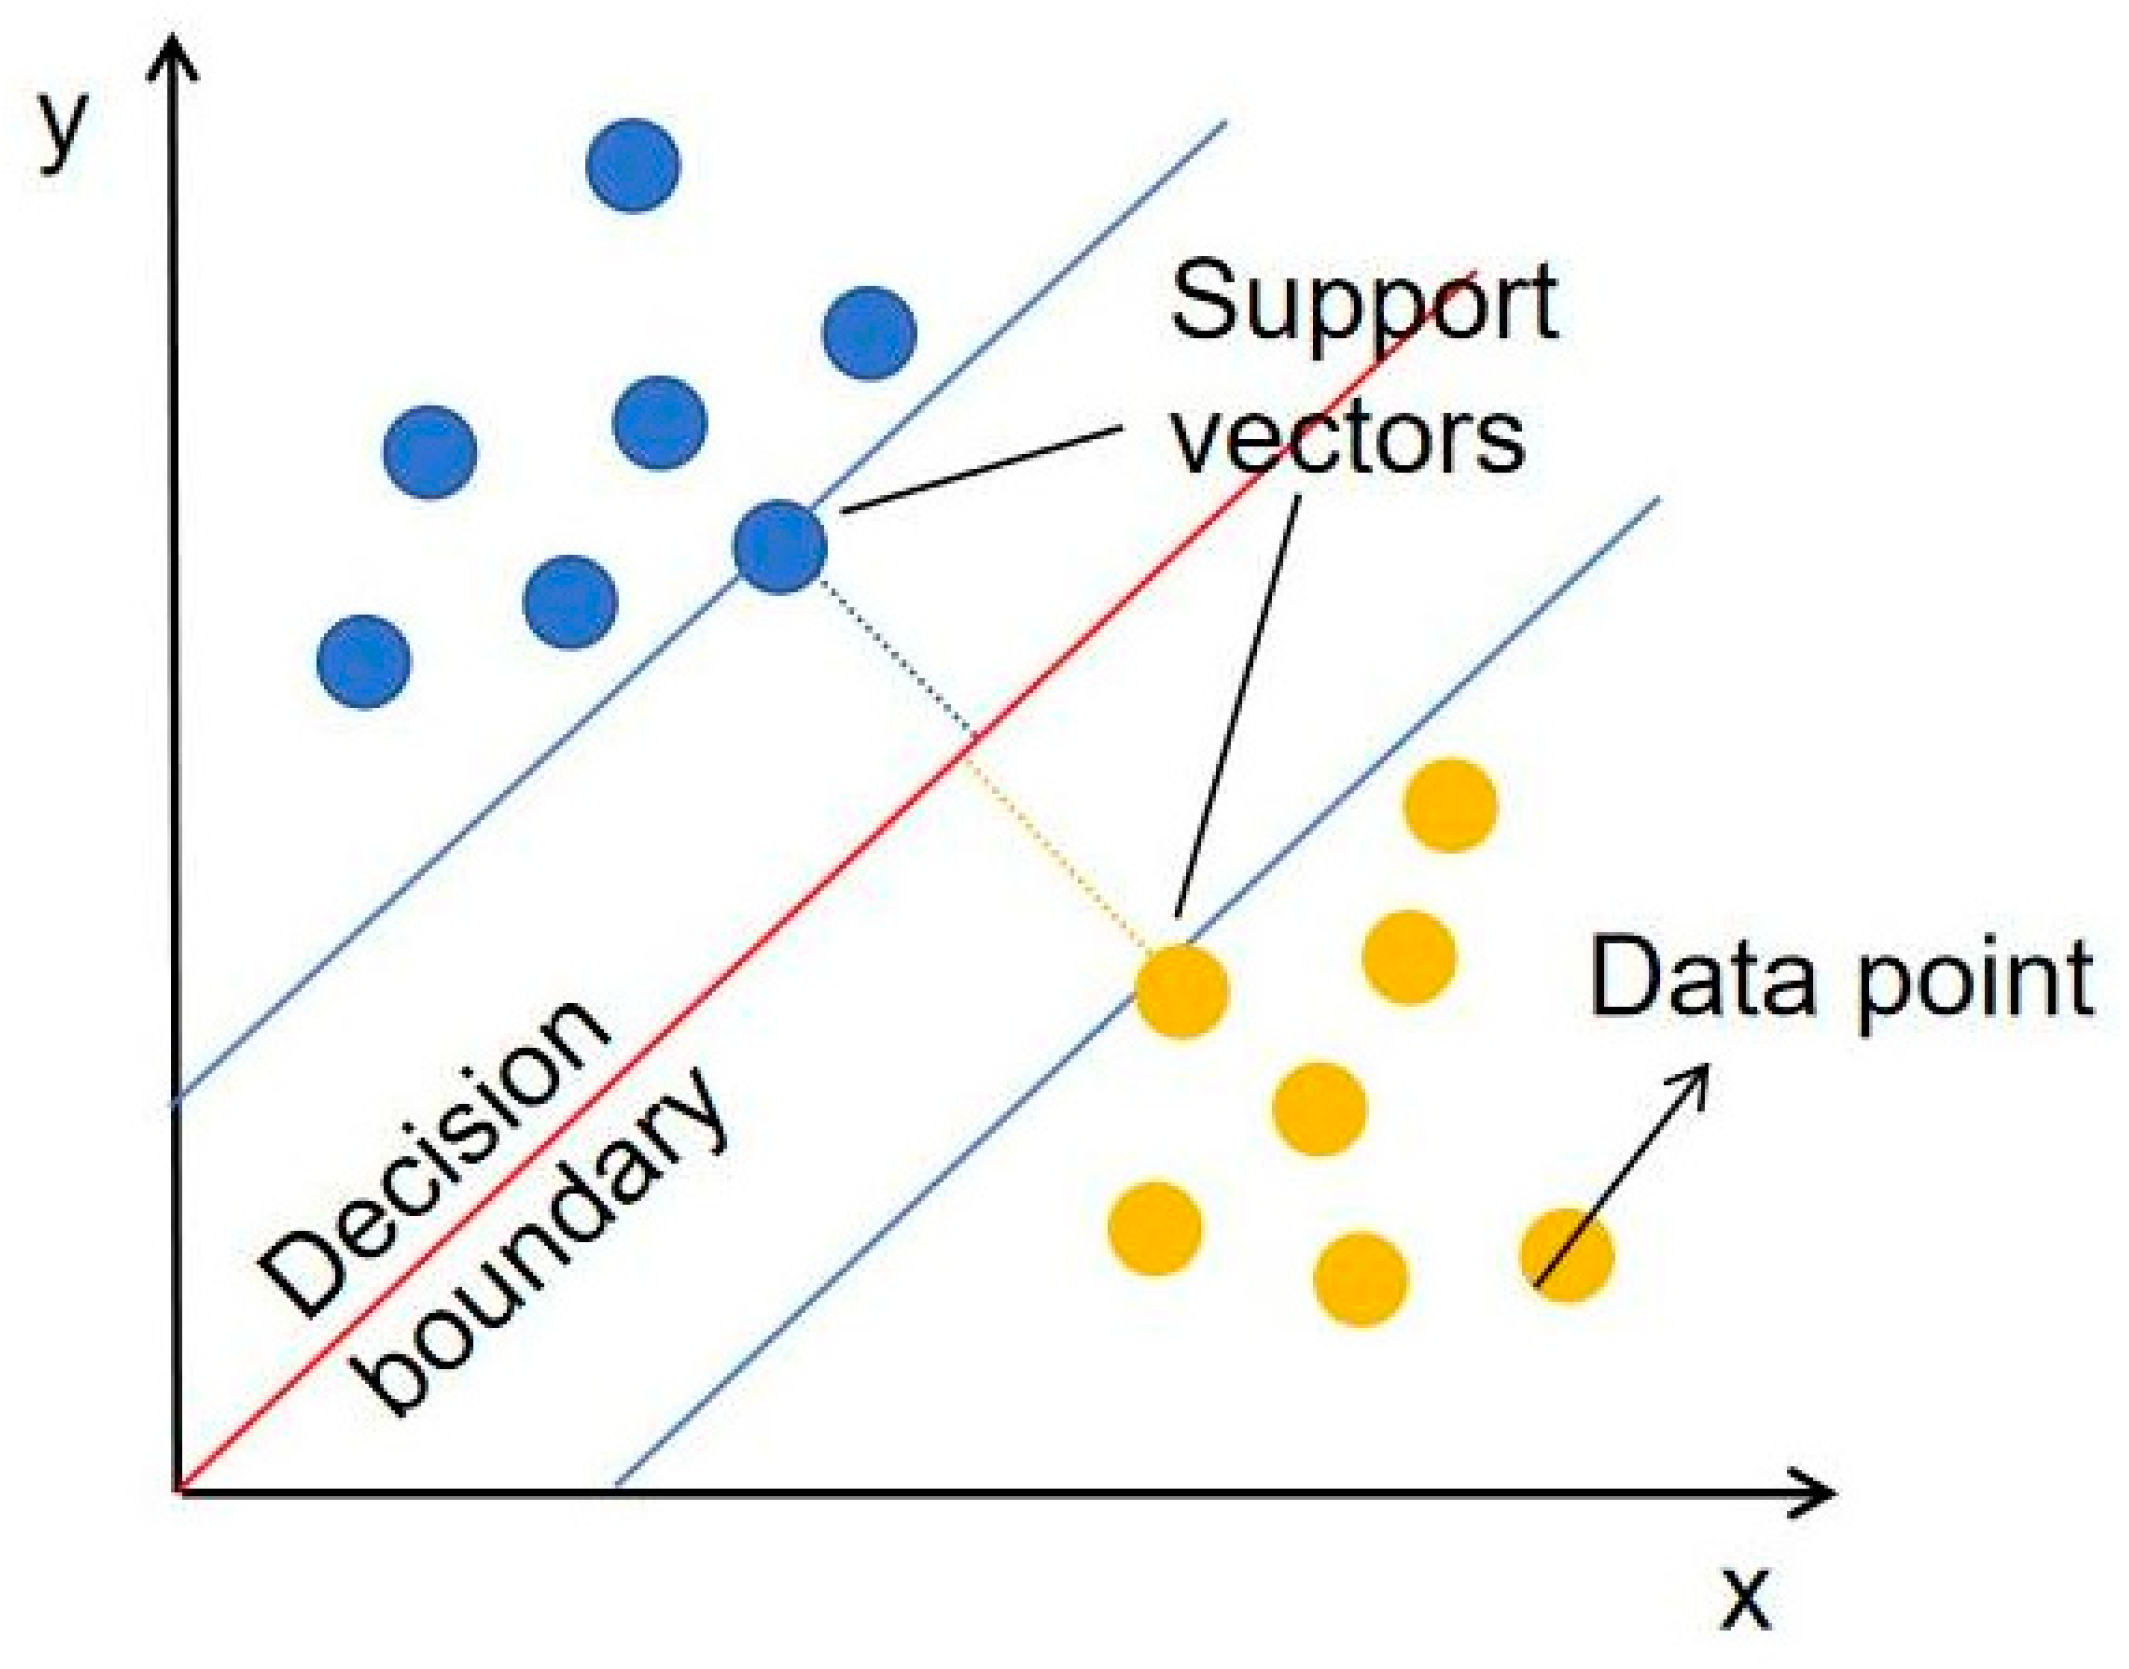
3.4. SVM Model
3.5. RF Model
3.6. ROC Curve Accuracy Assessment
3.7. Susceptibility Assessment
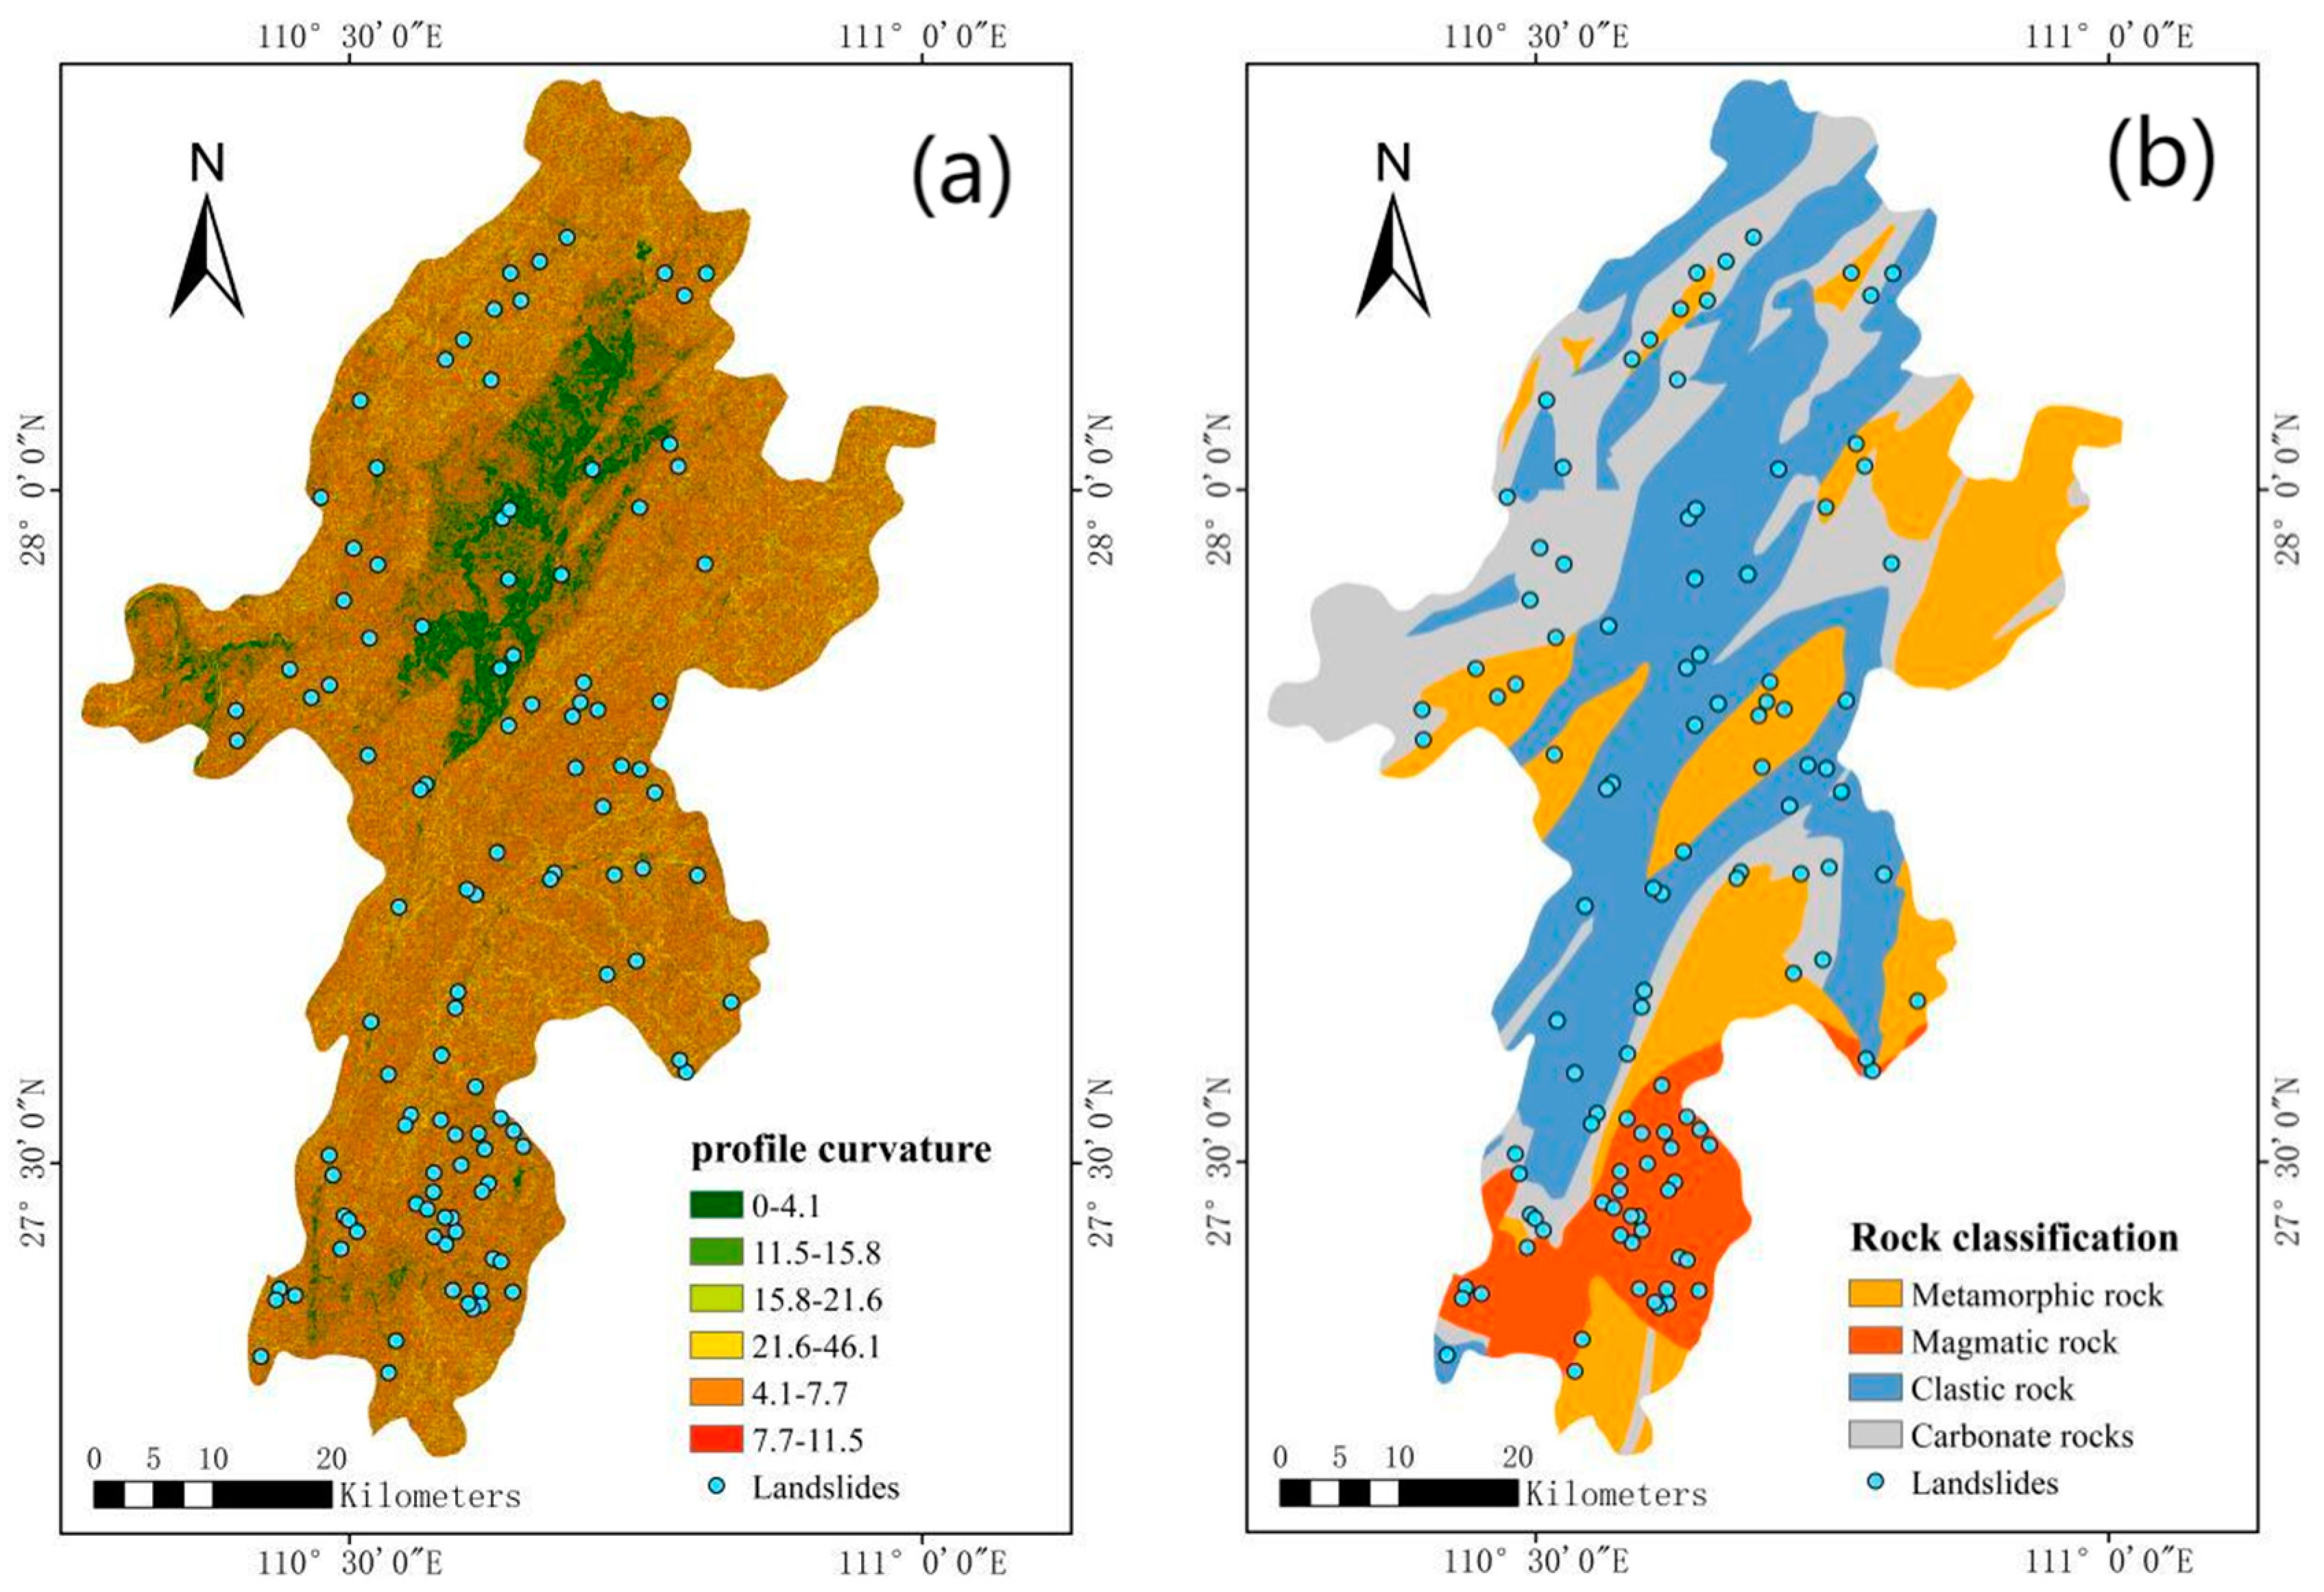
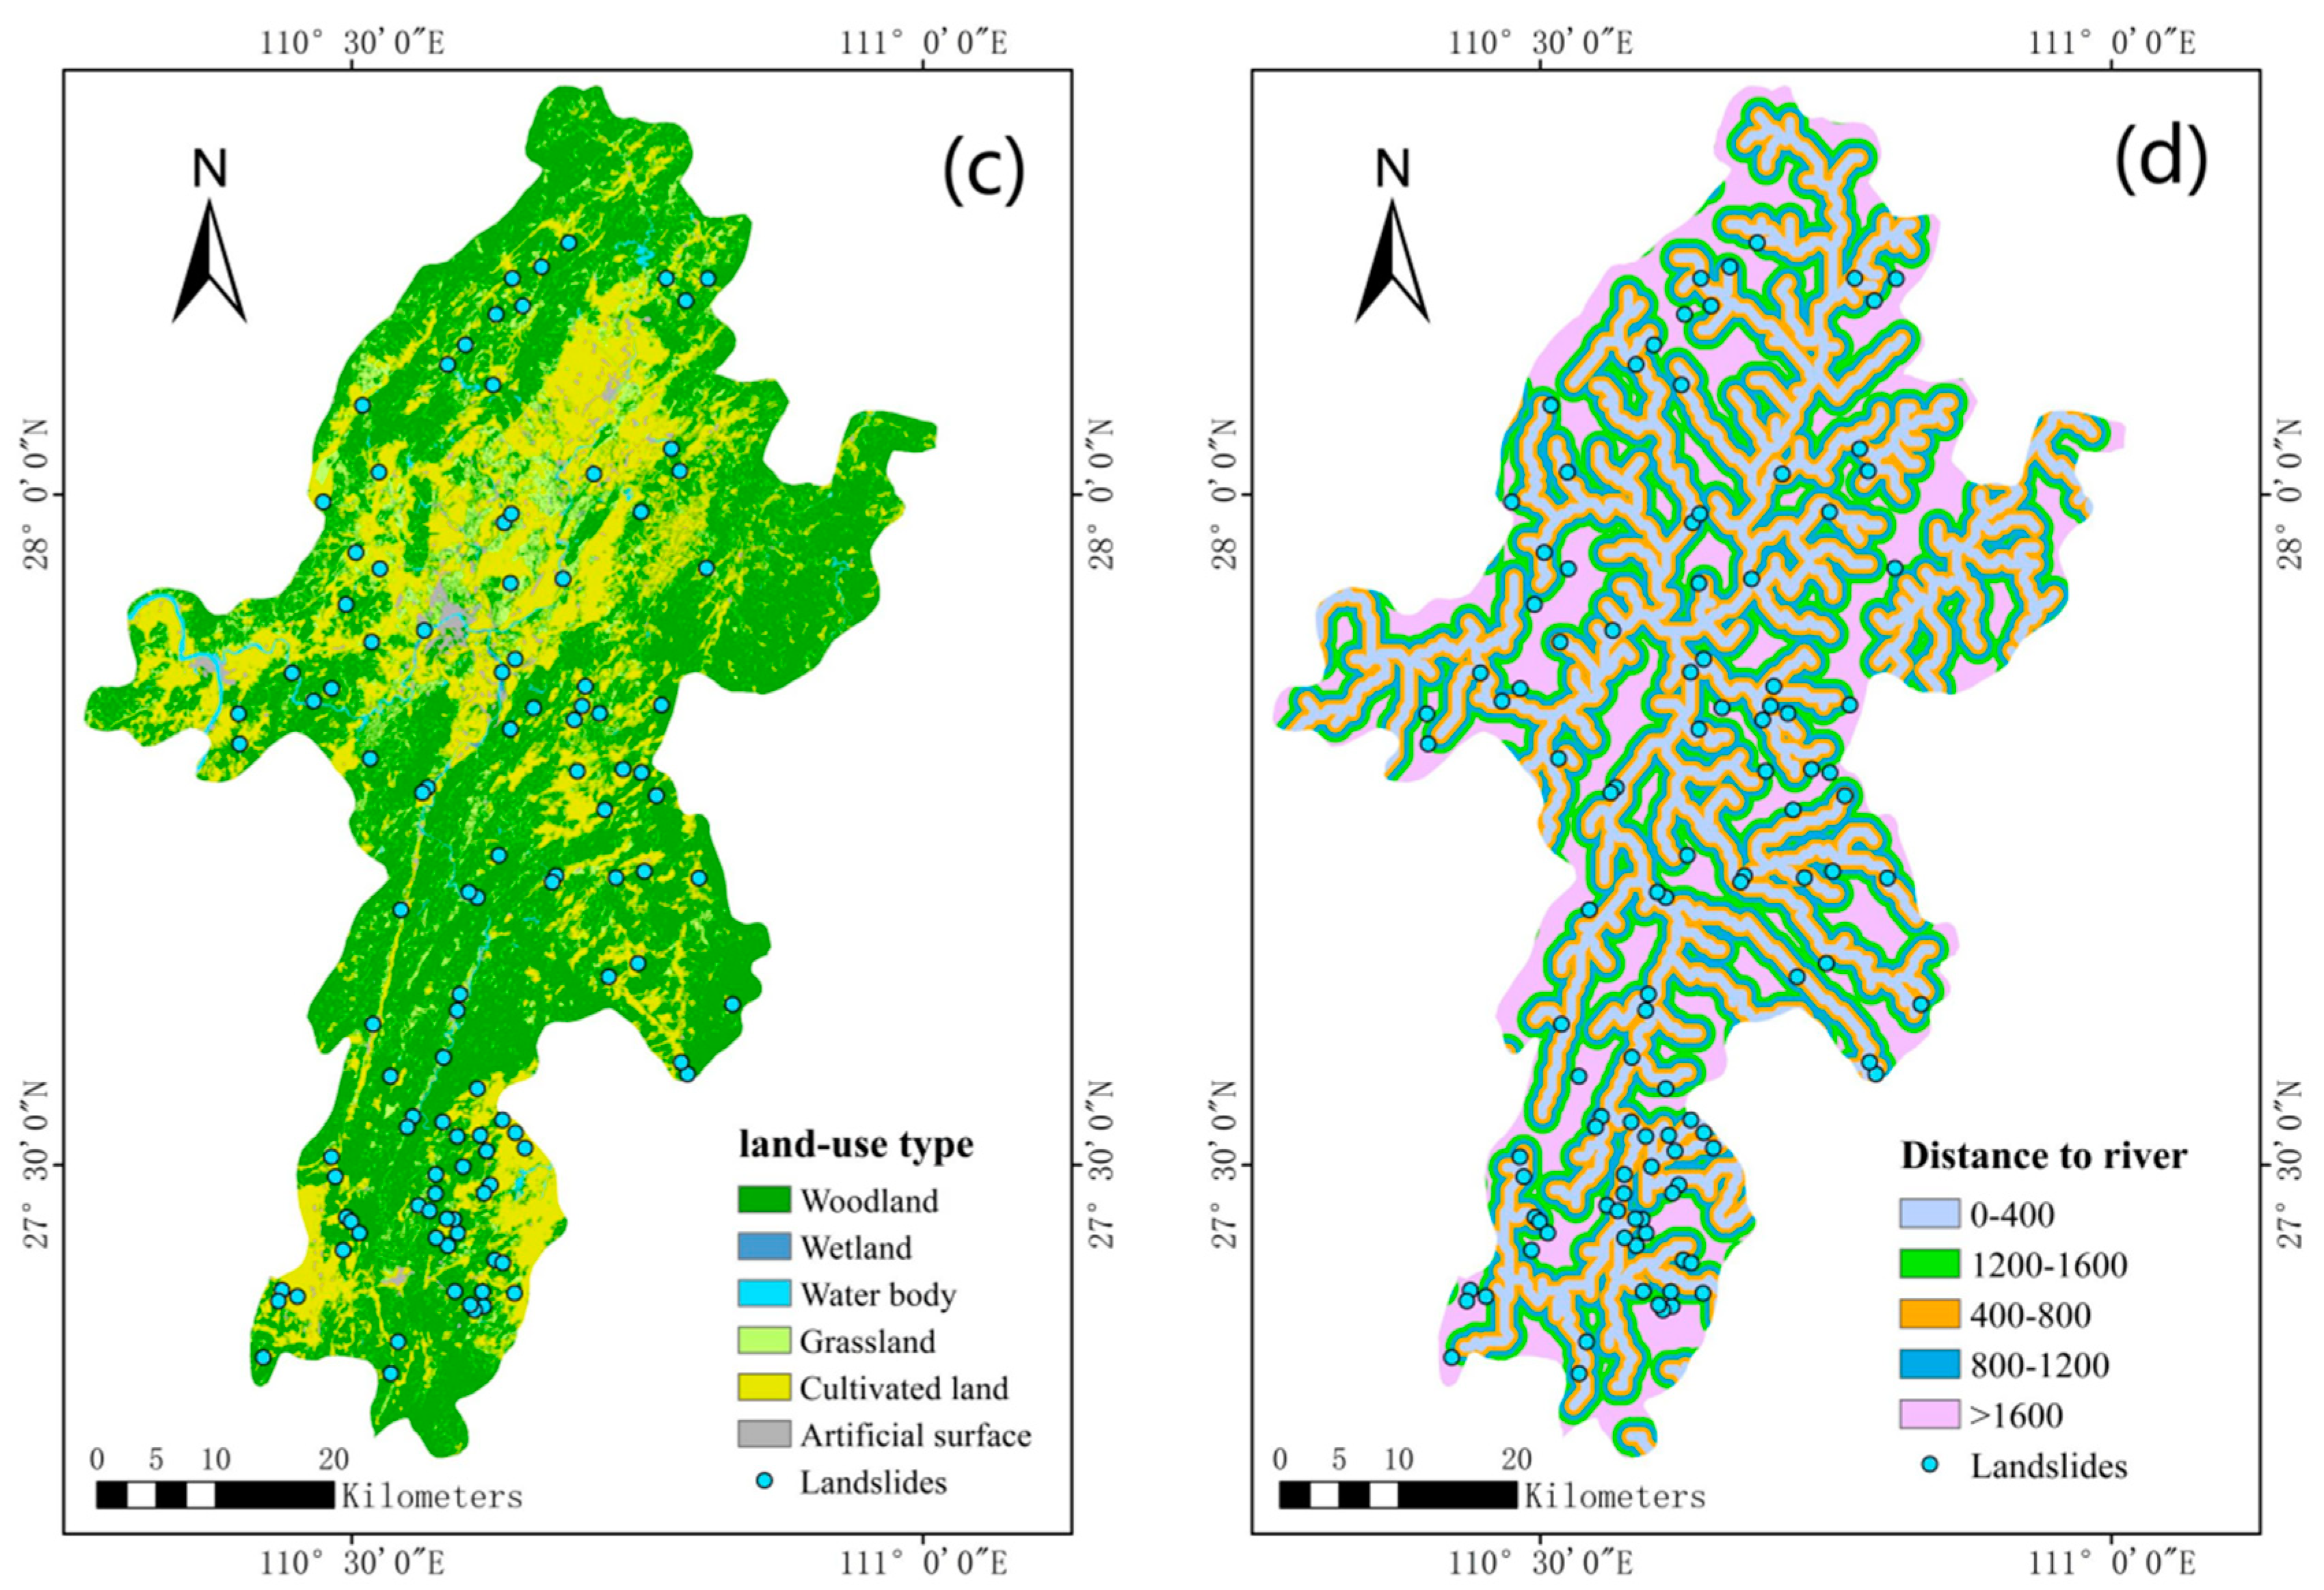
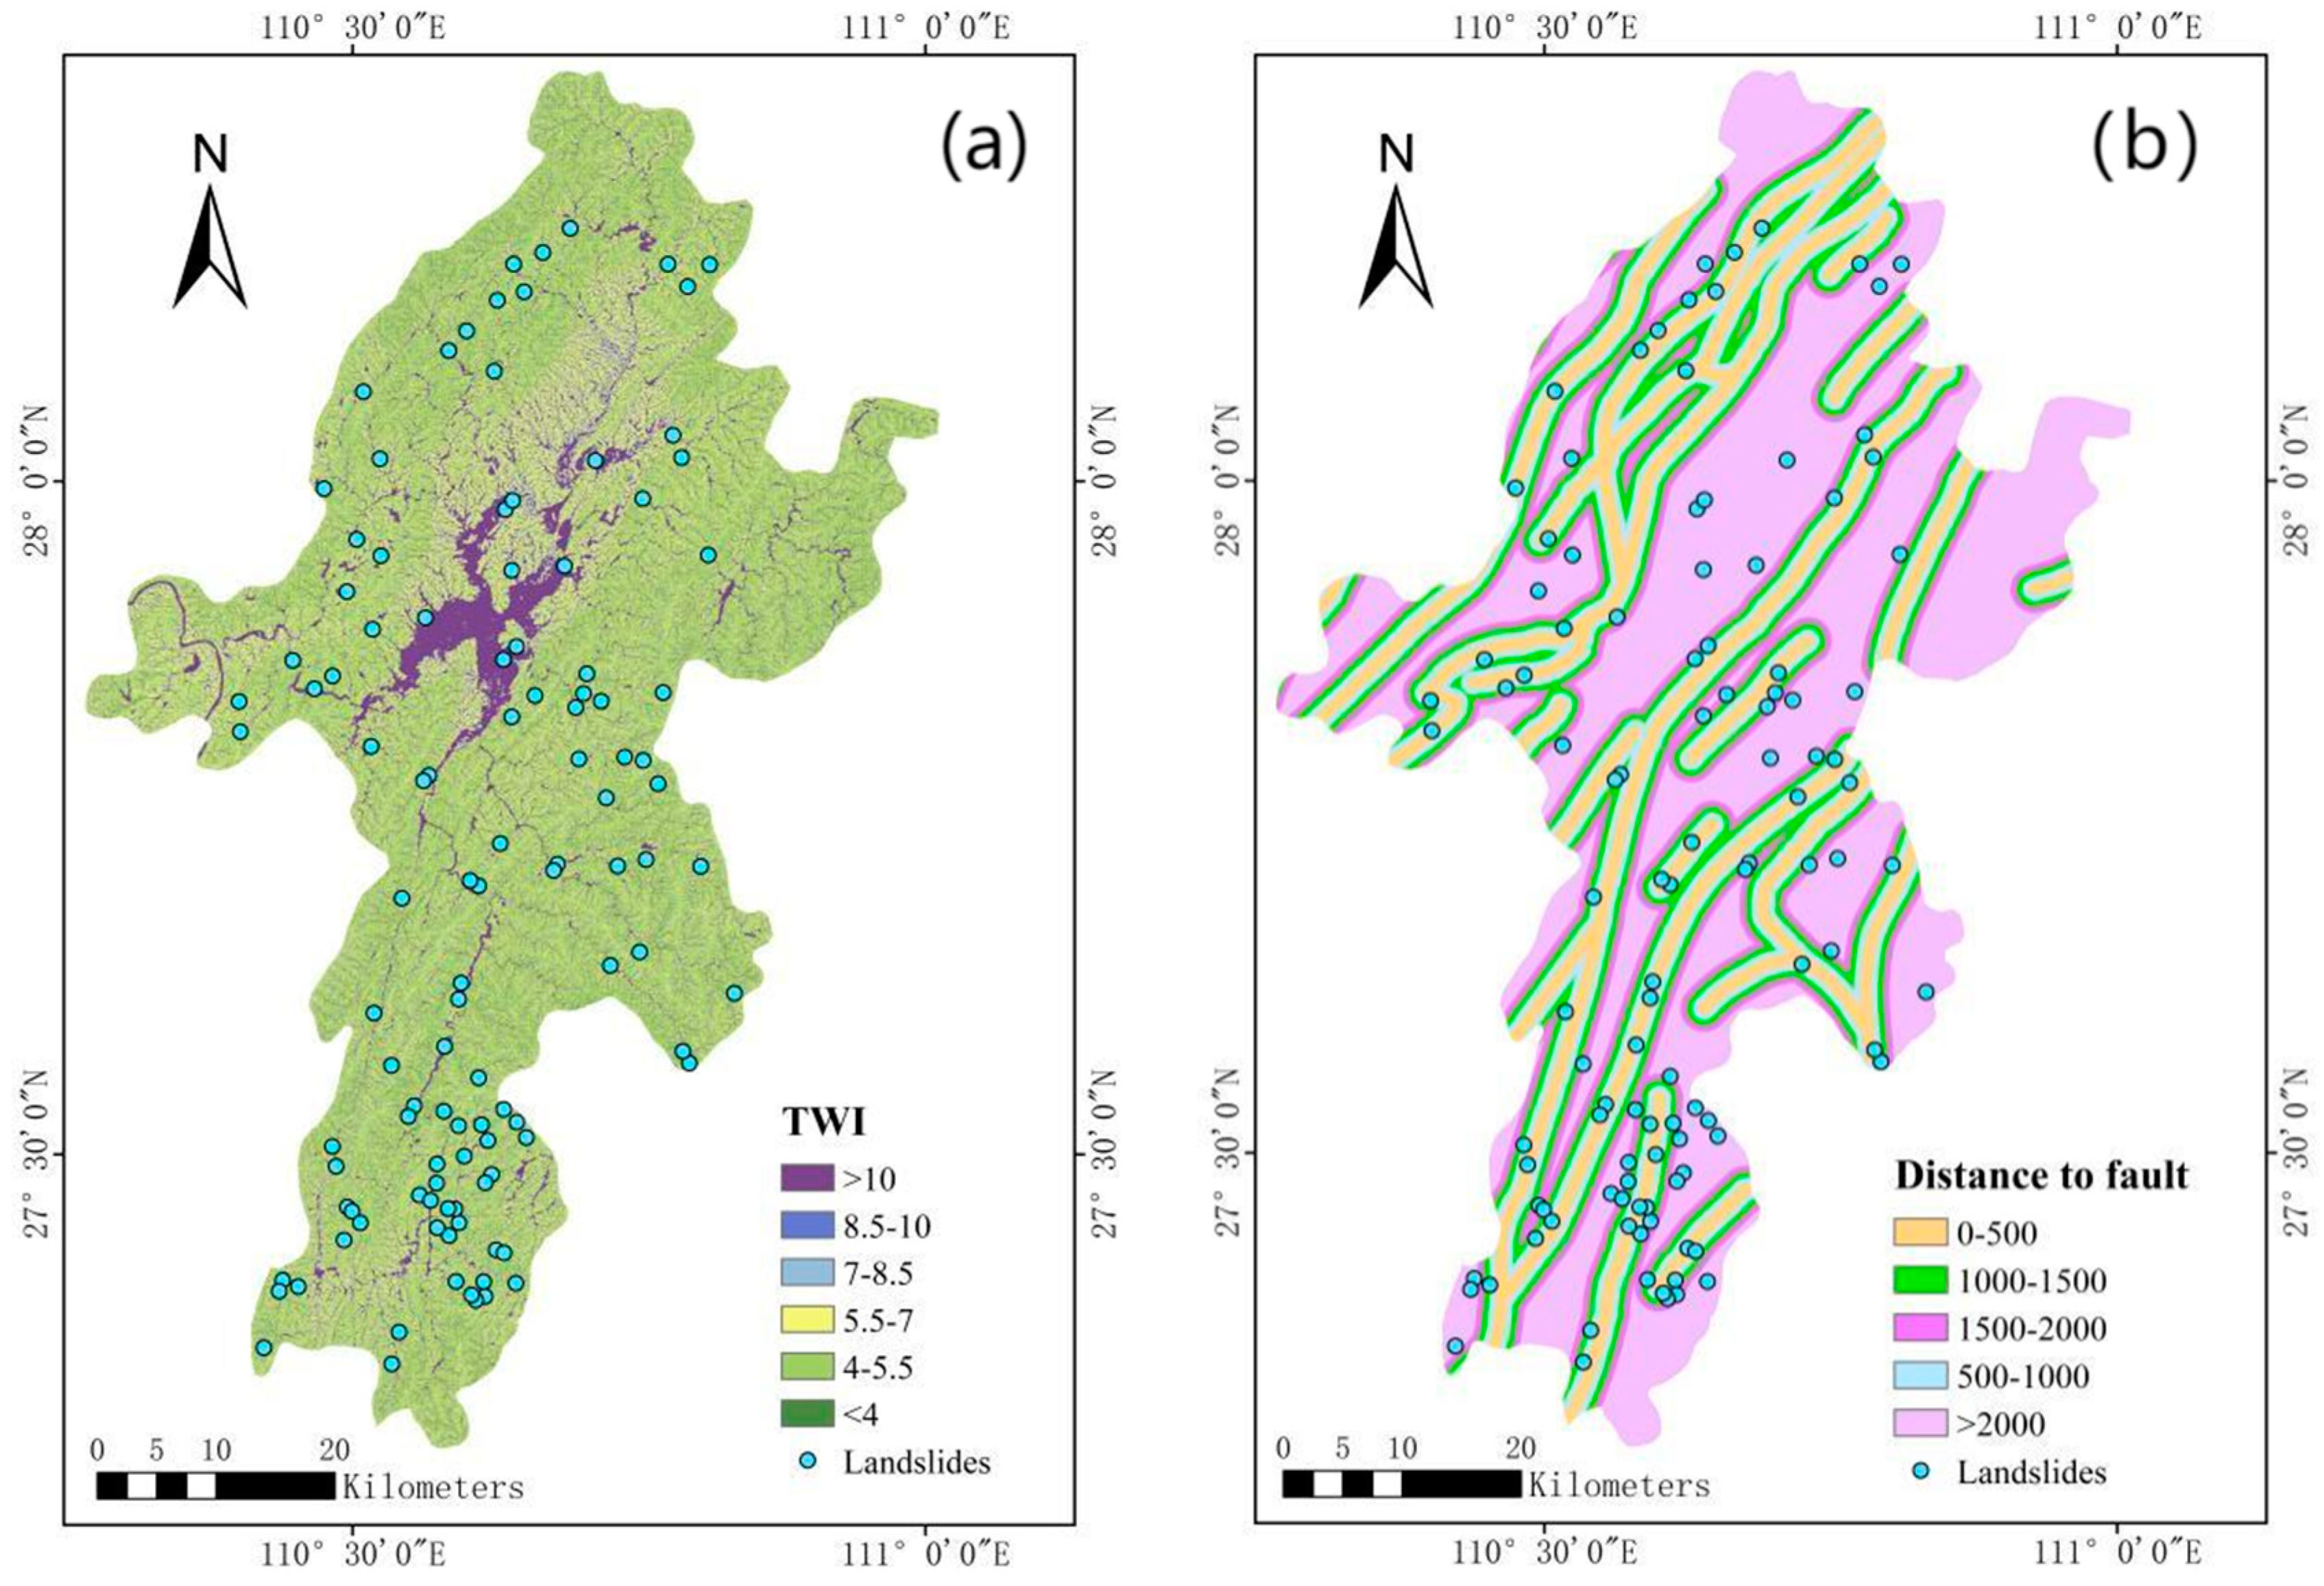
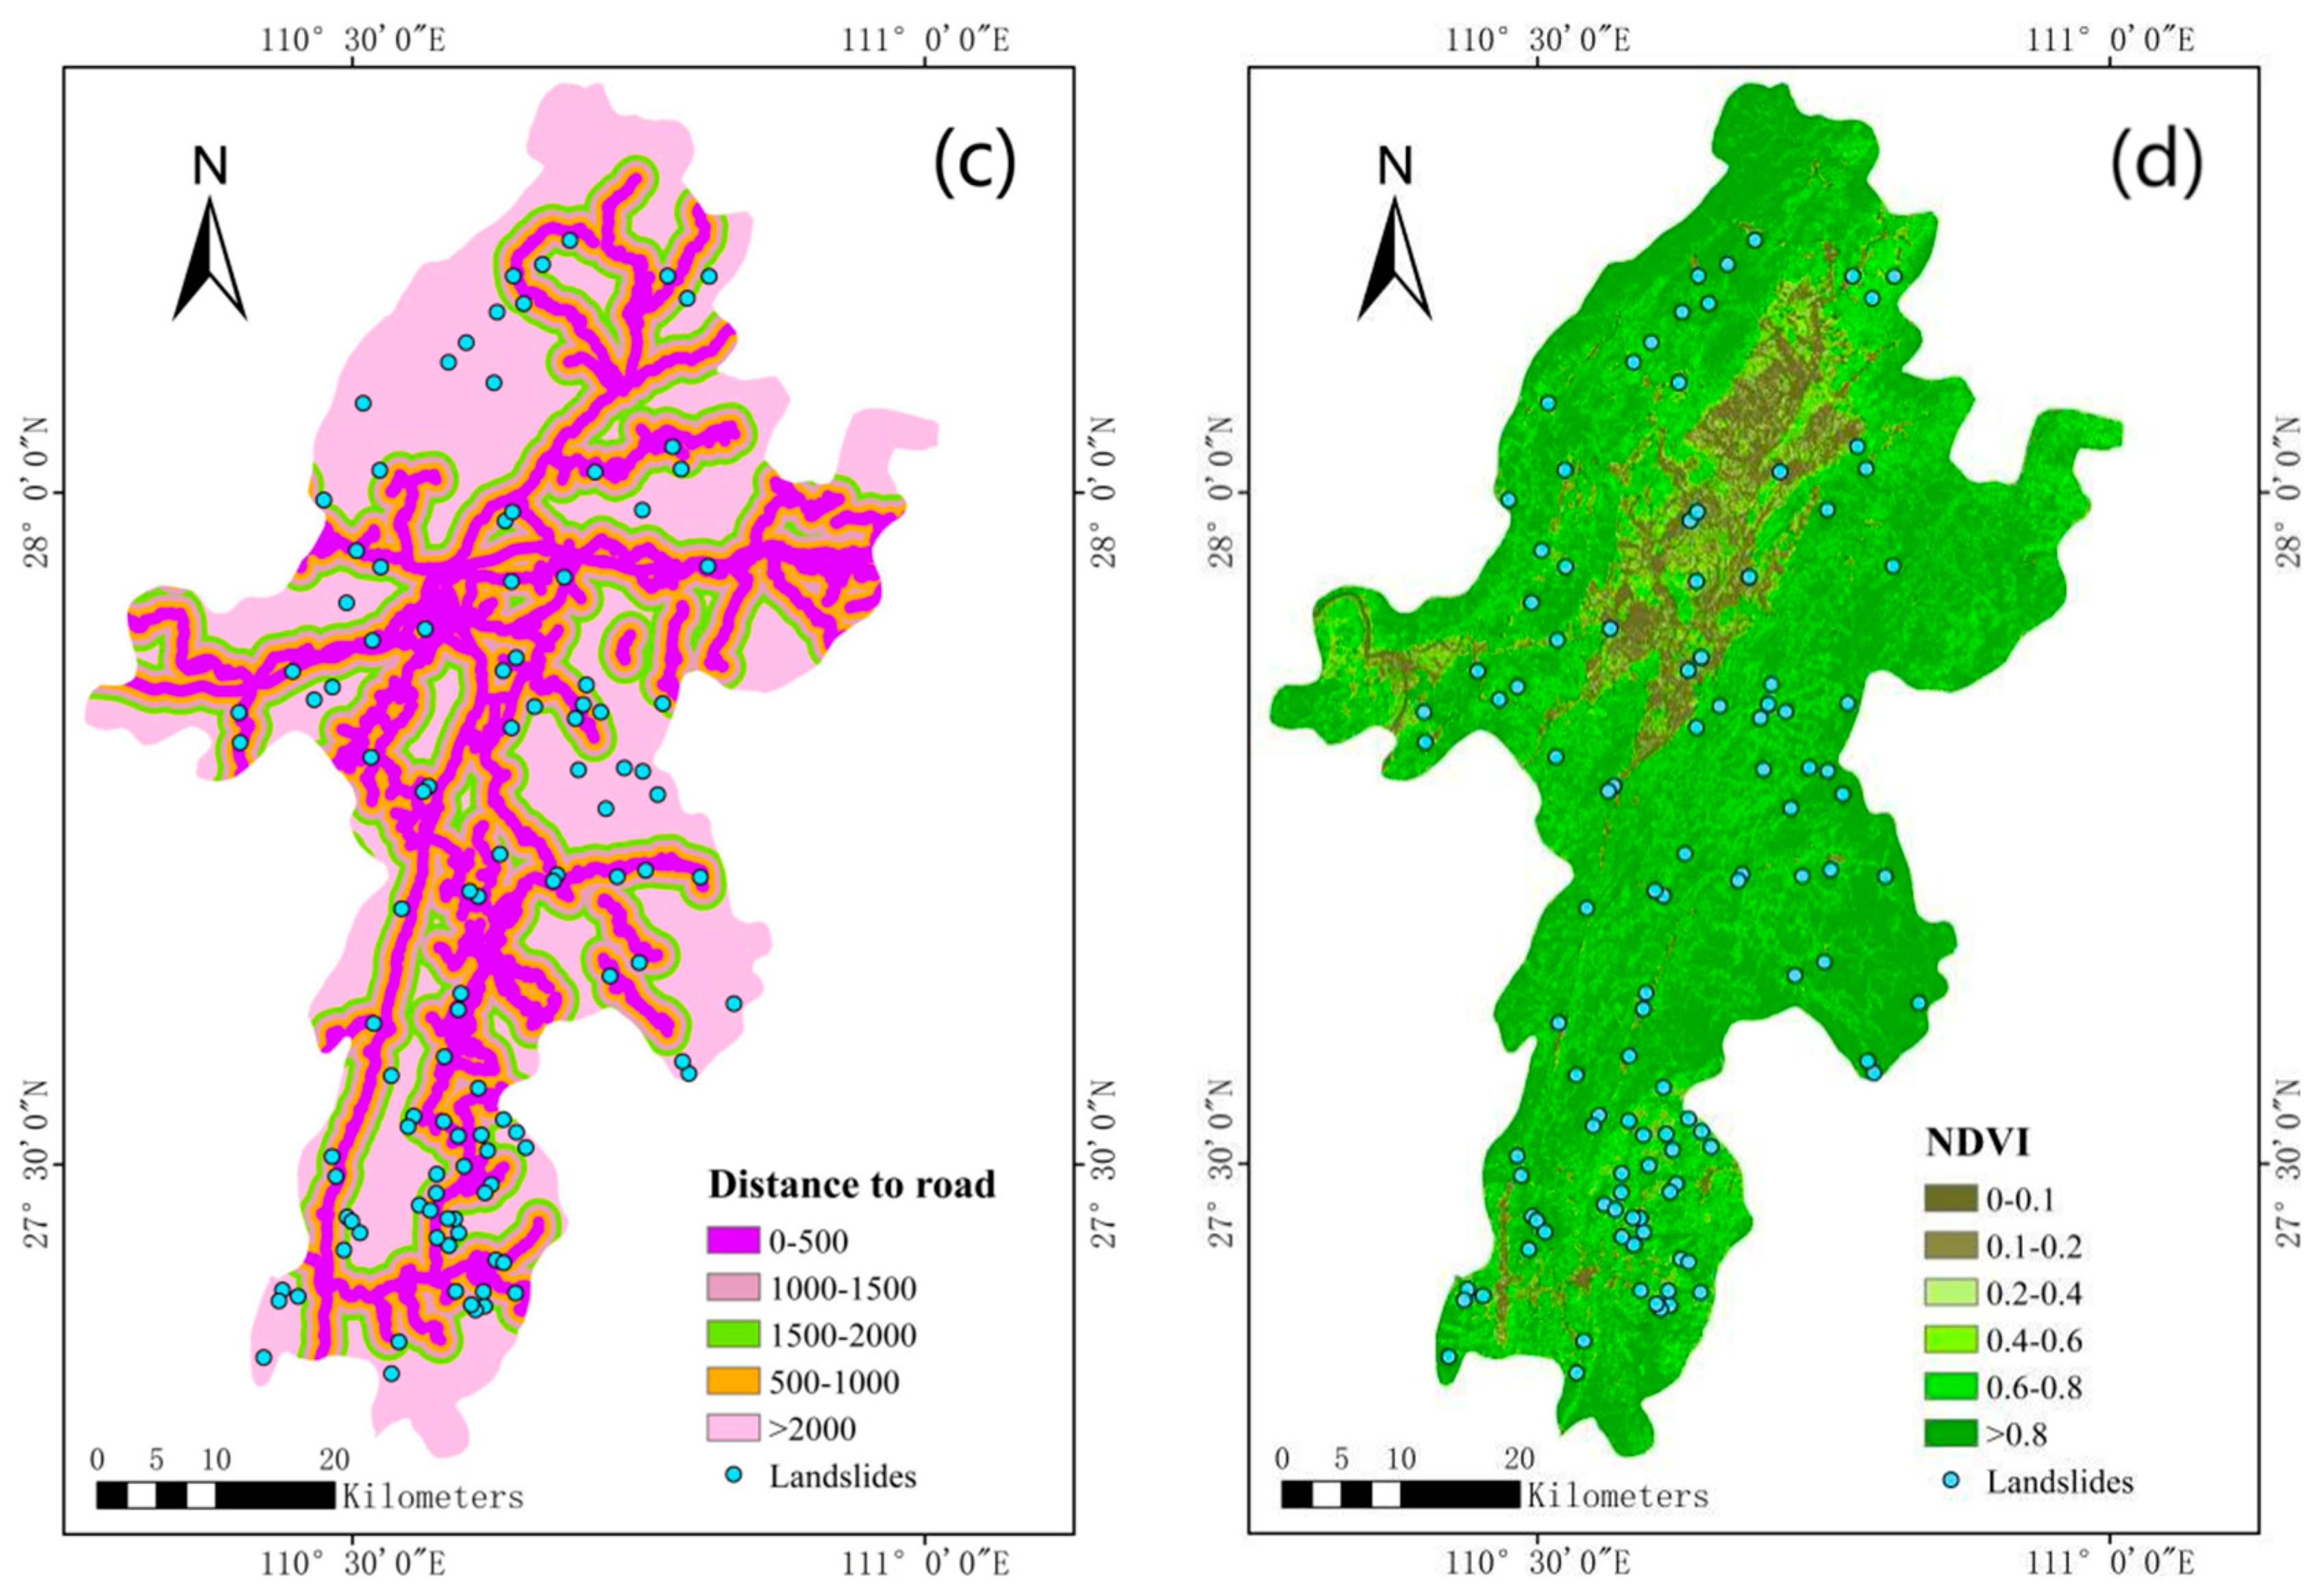
Selection of Landslide Influencing Factors
3.8. Data Sources and Processing
3.9. Utilization of CF + LR Model and FR + LR Model for Landslide Susceptibility Zoning
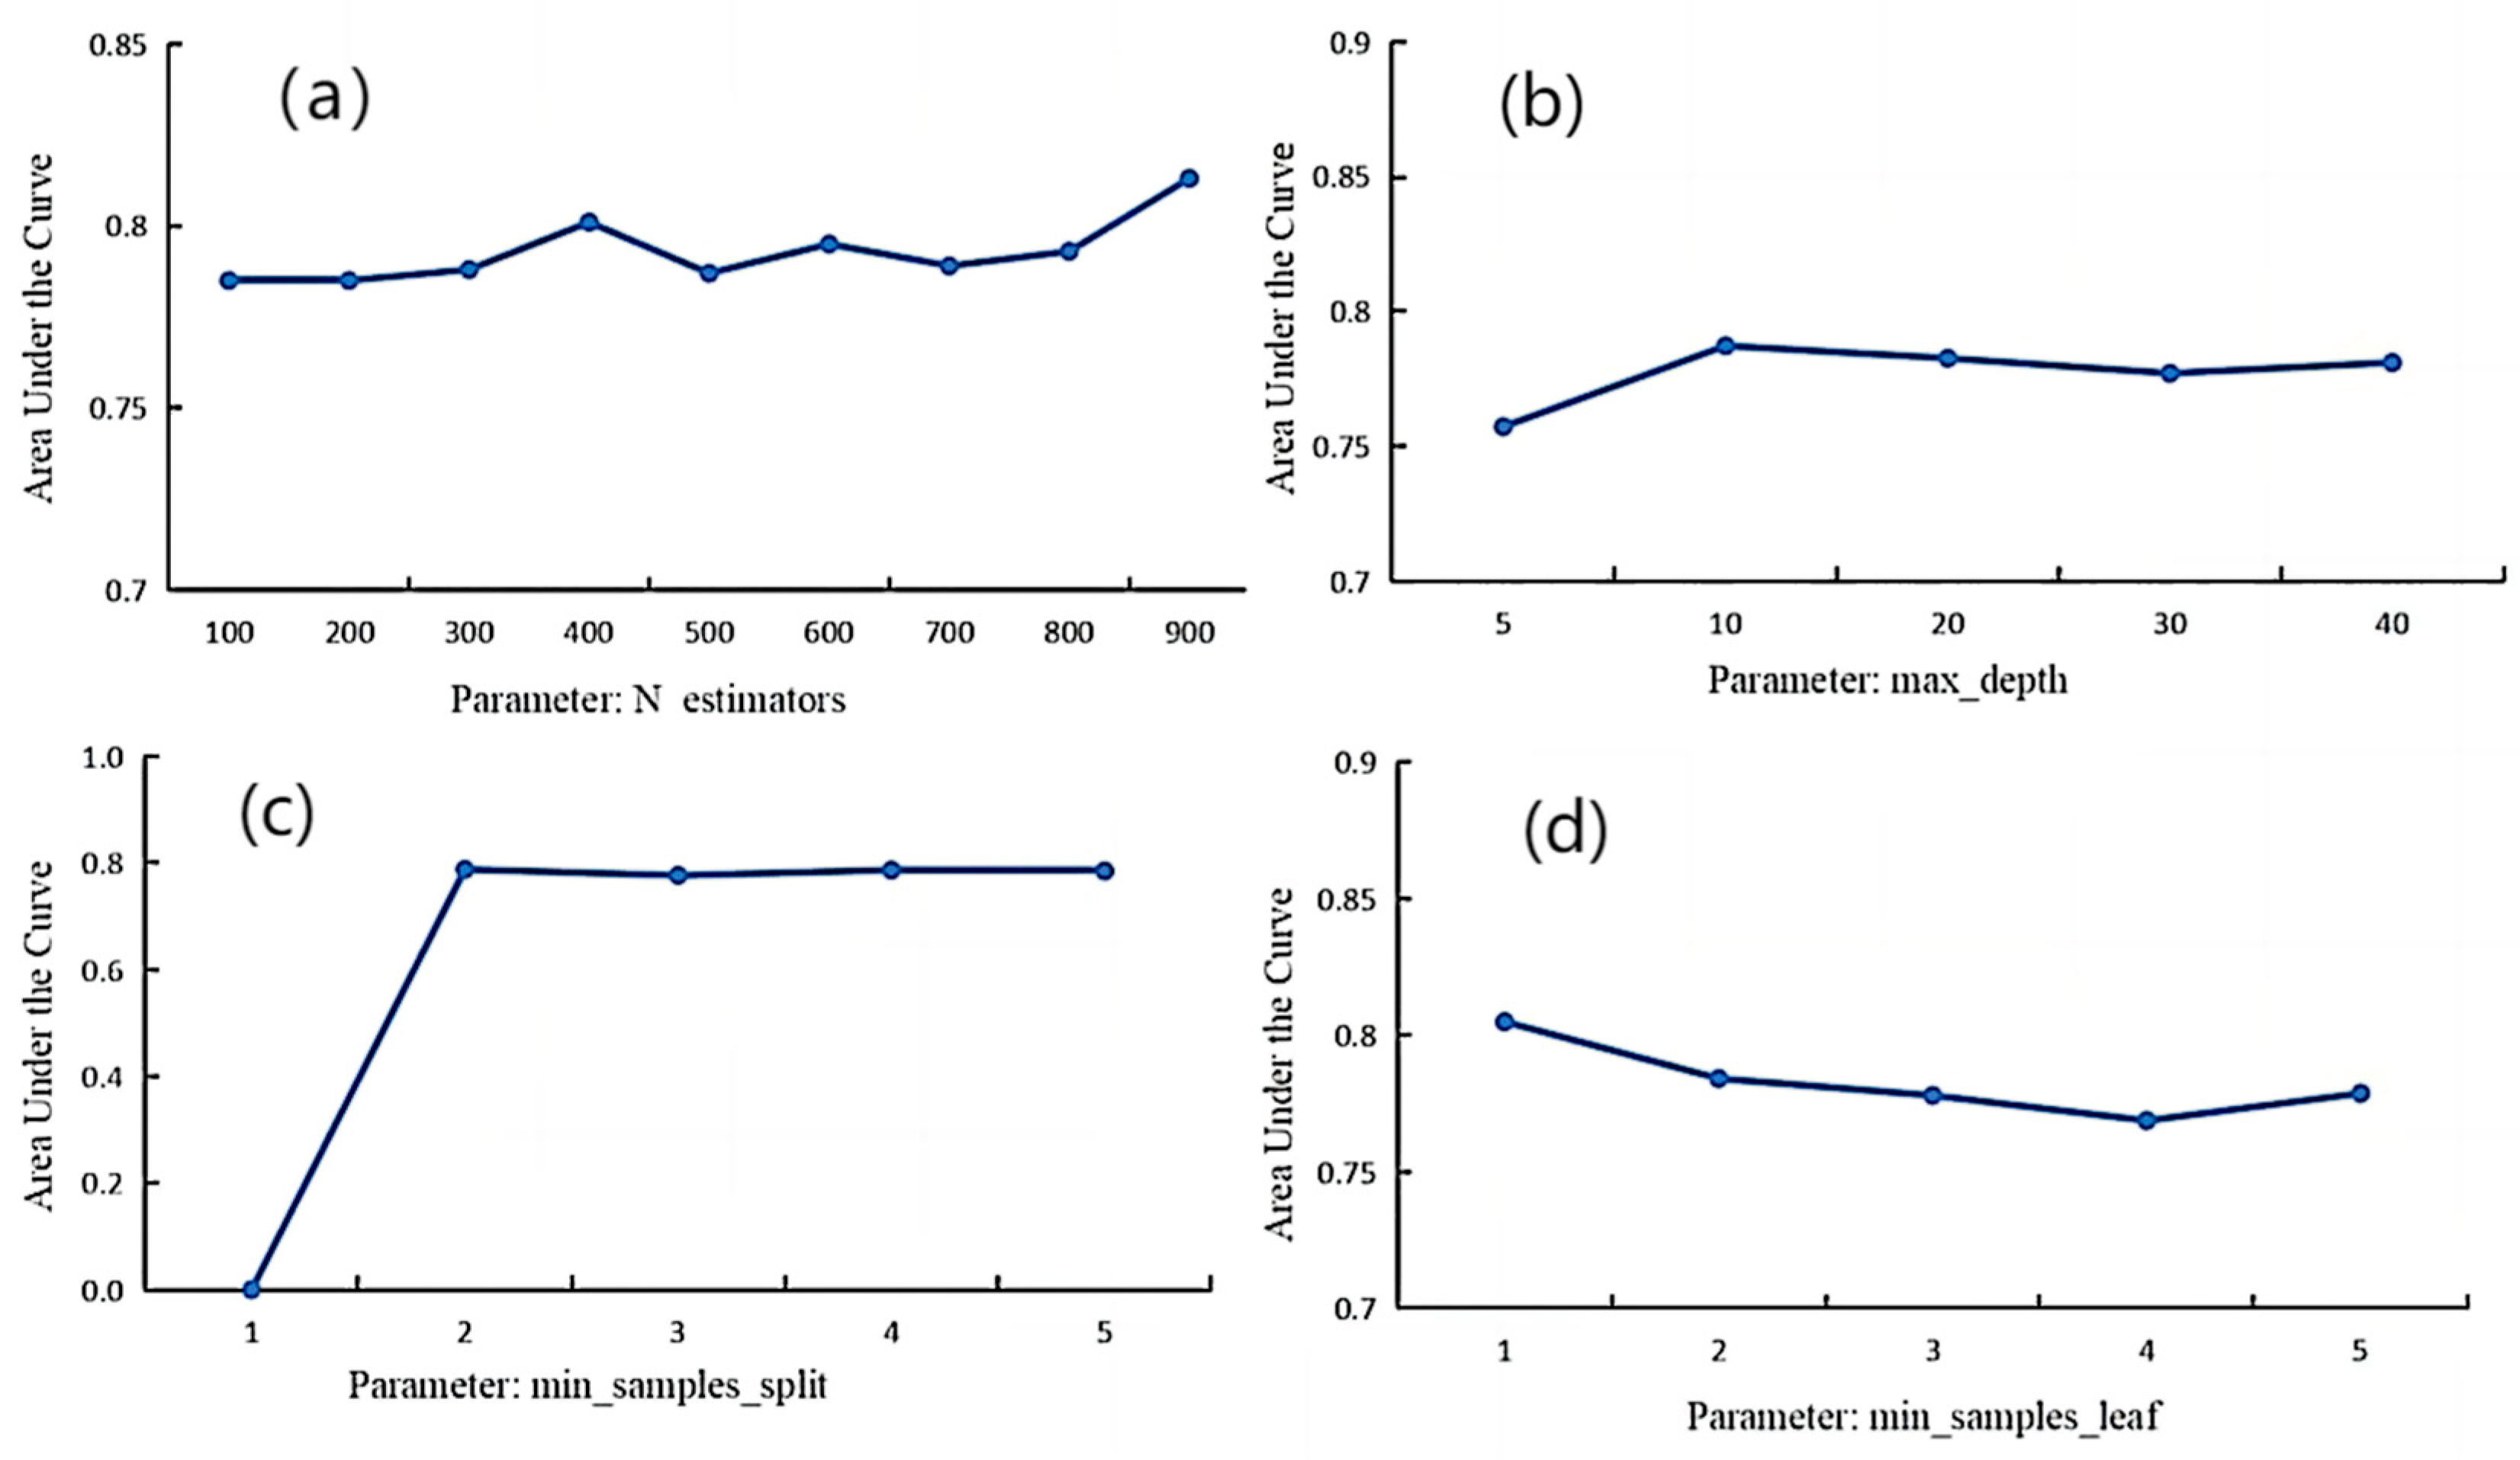
3.10. Utilization of RF Model and SVM Model for Landslide Susceptibility Zoning
4. Results
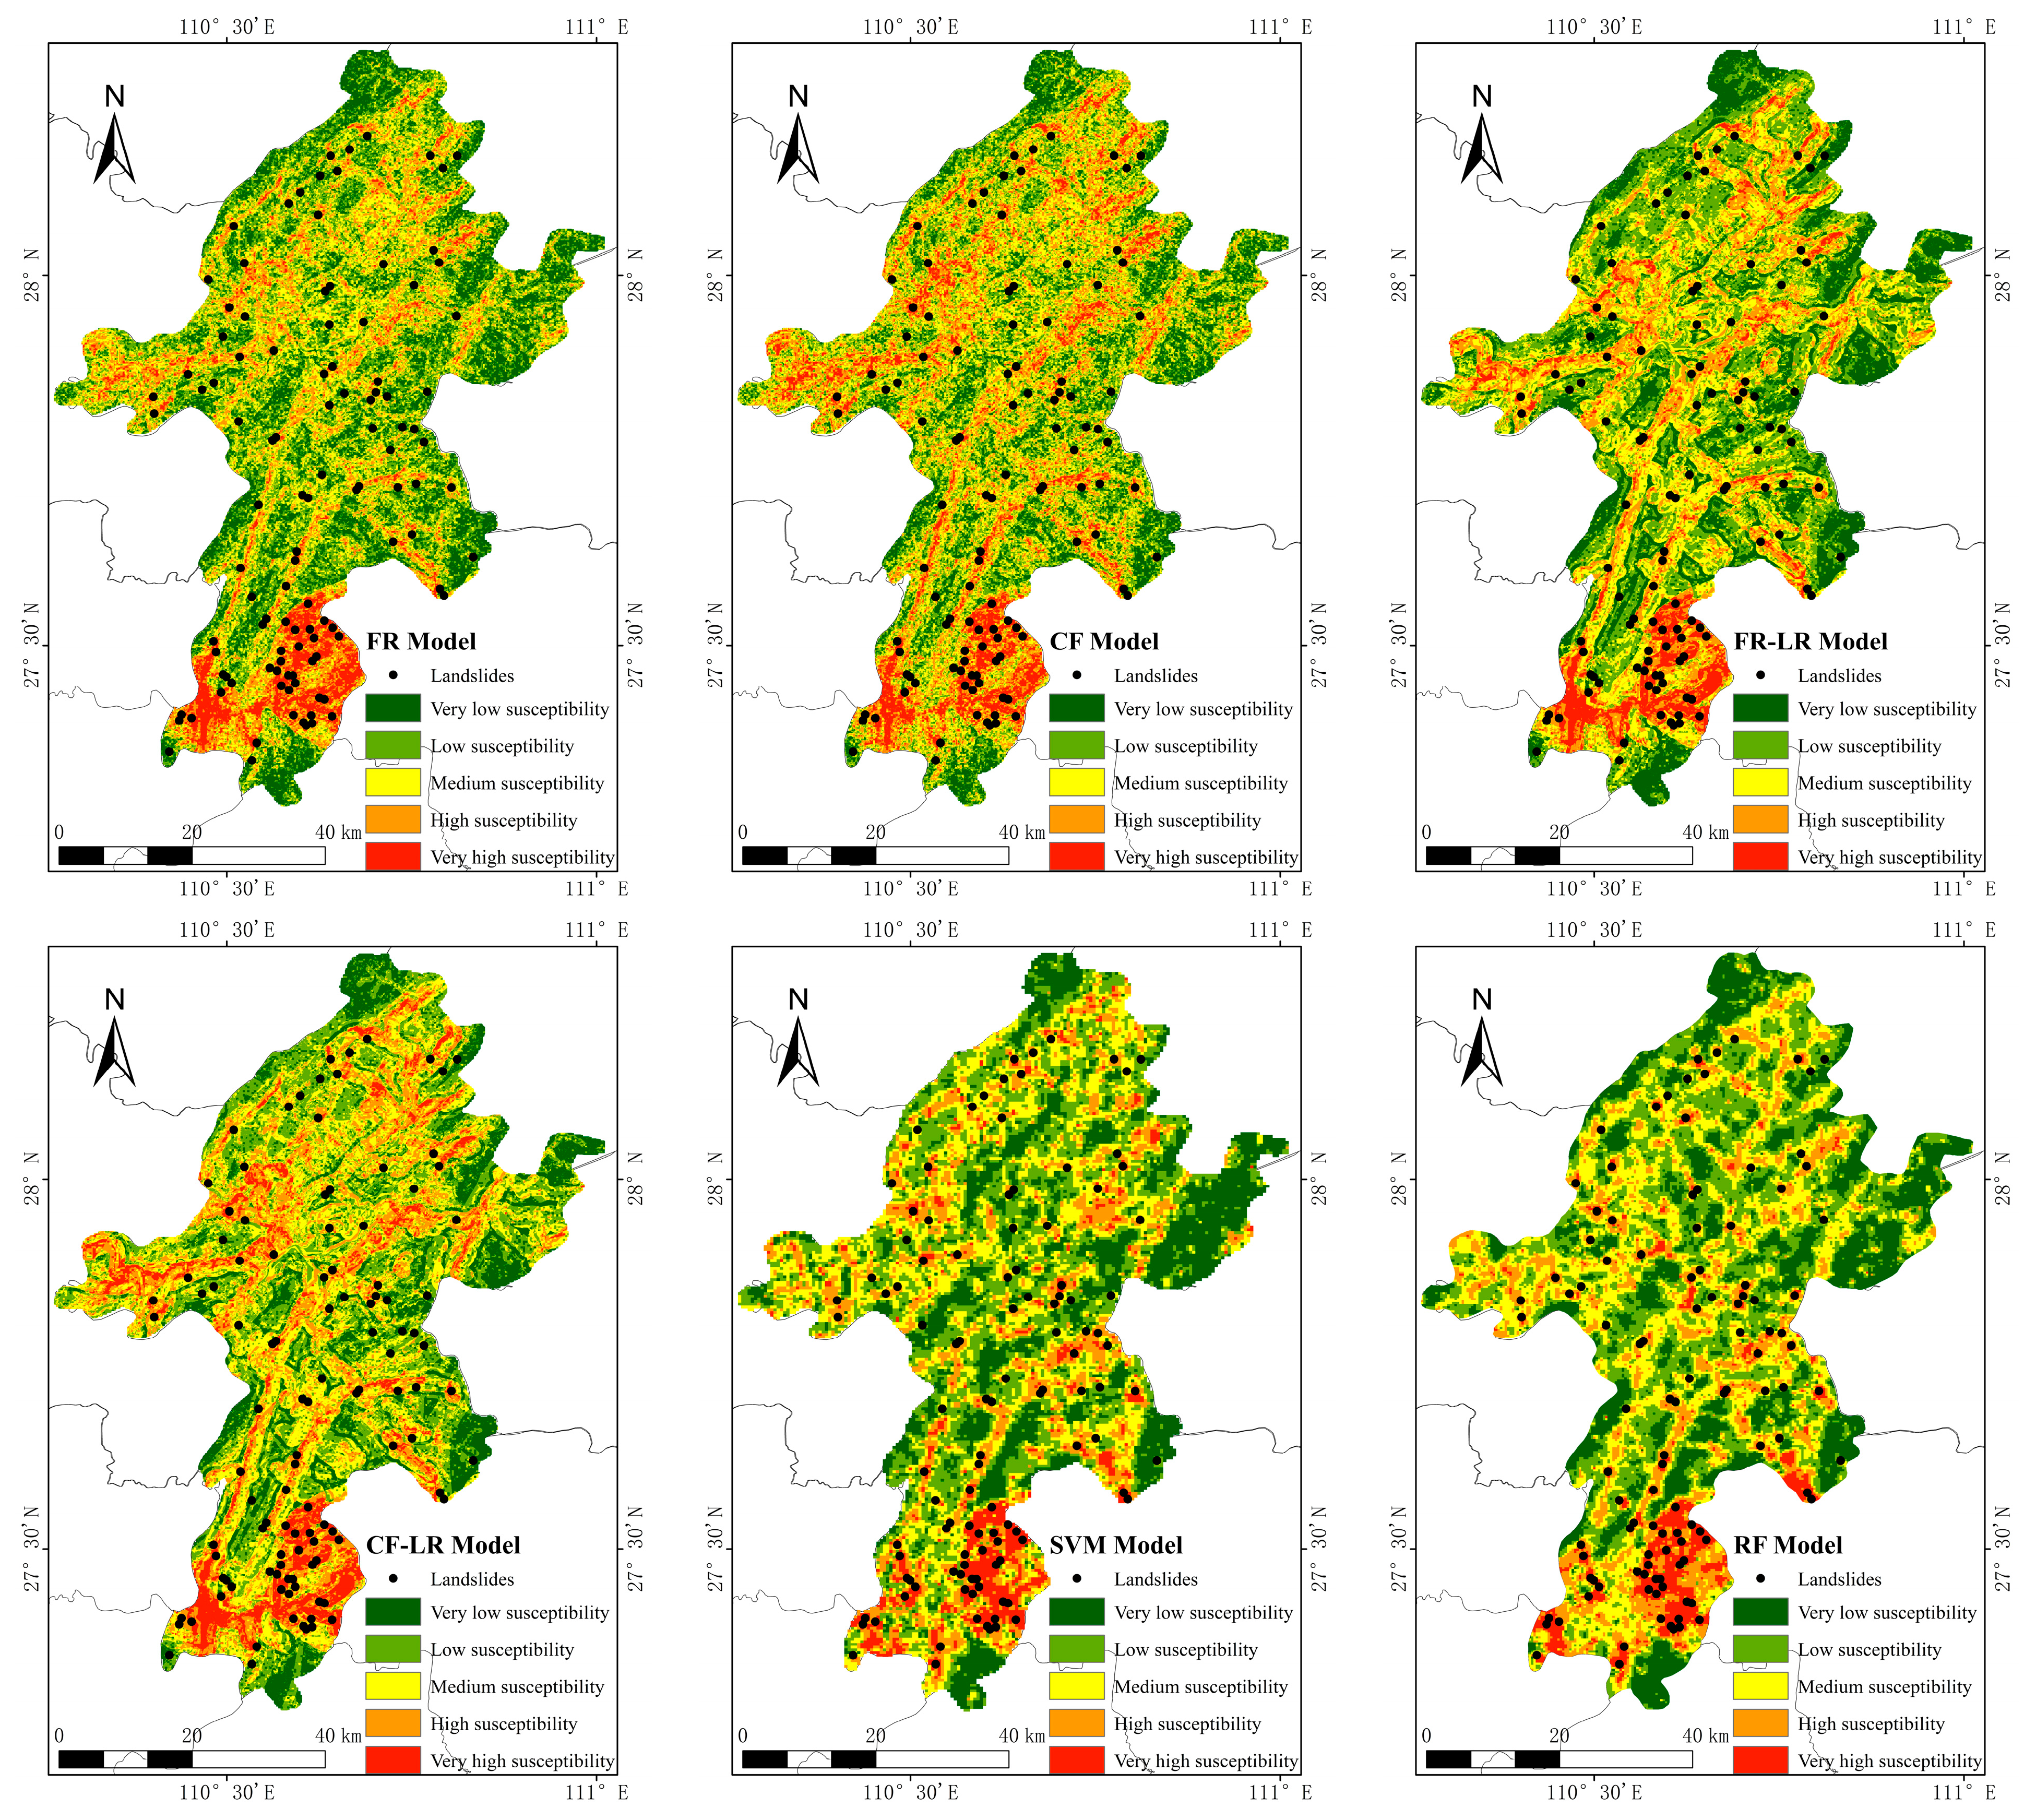
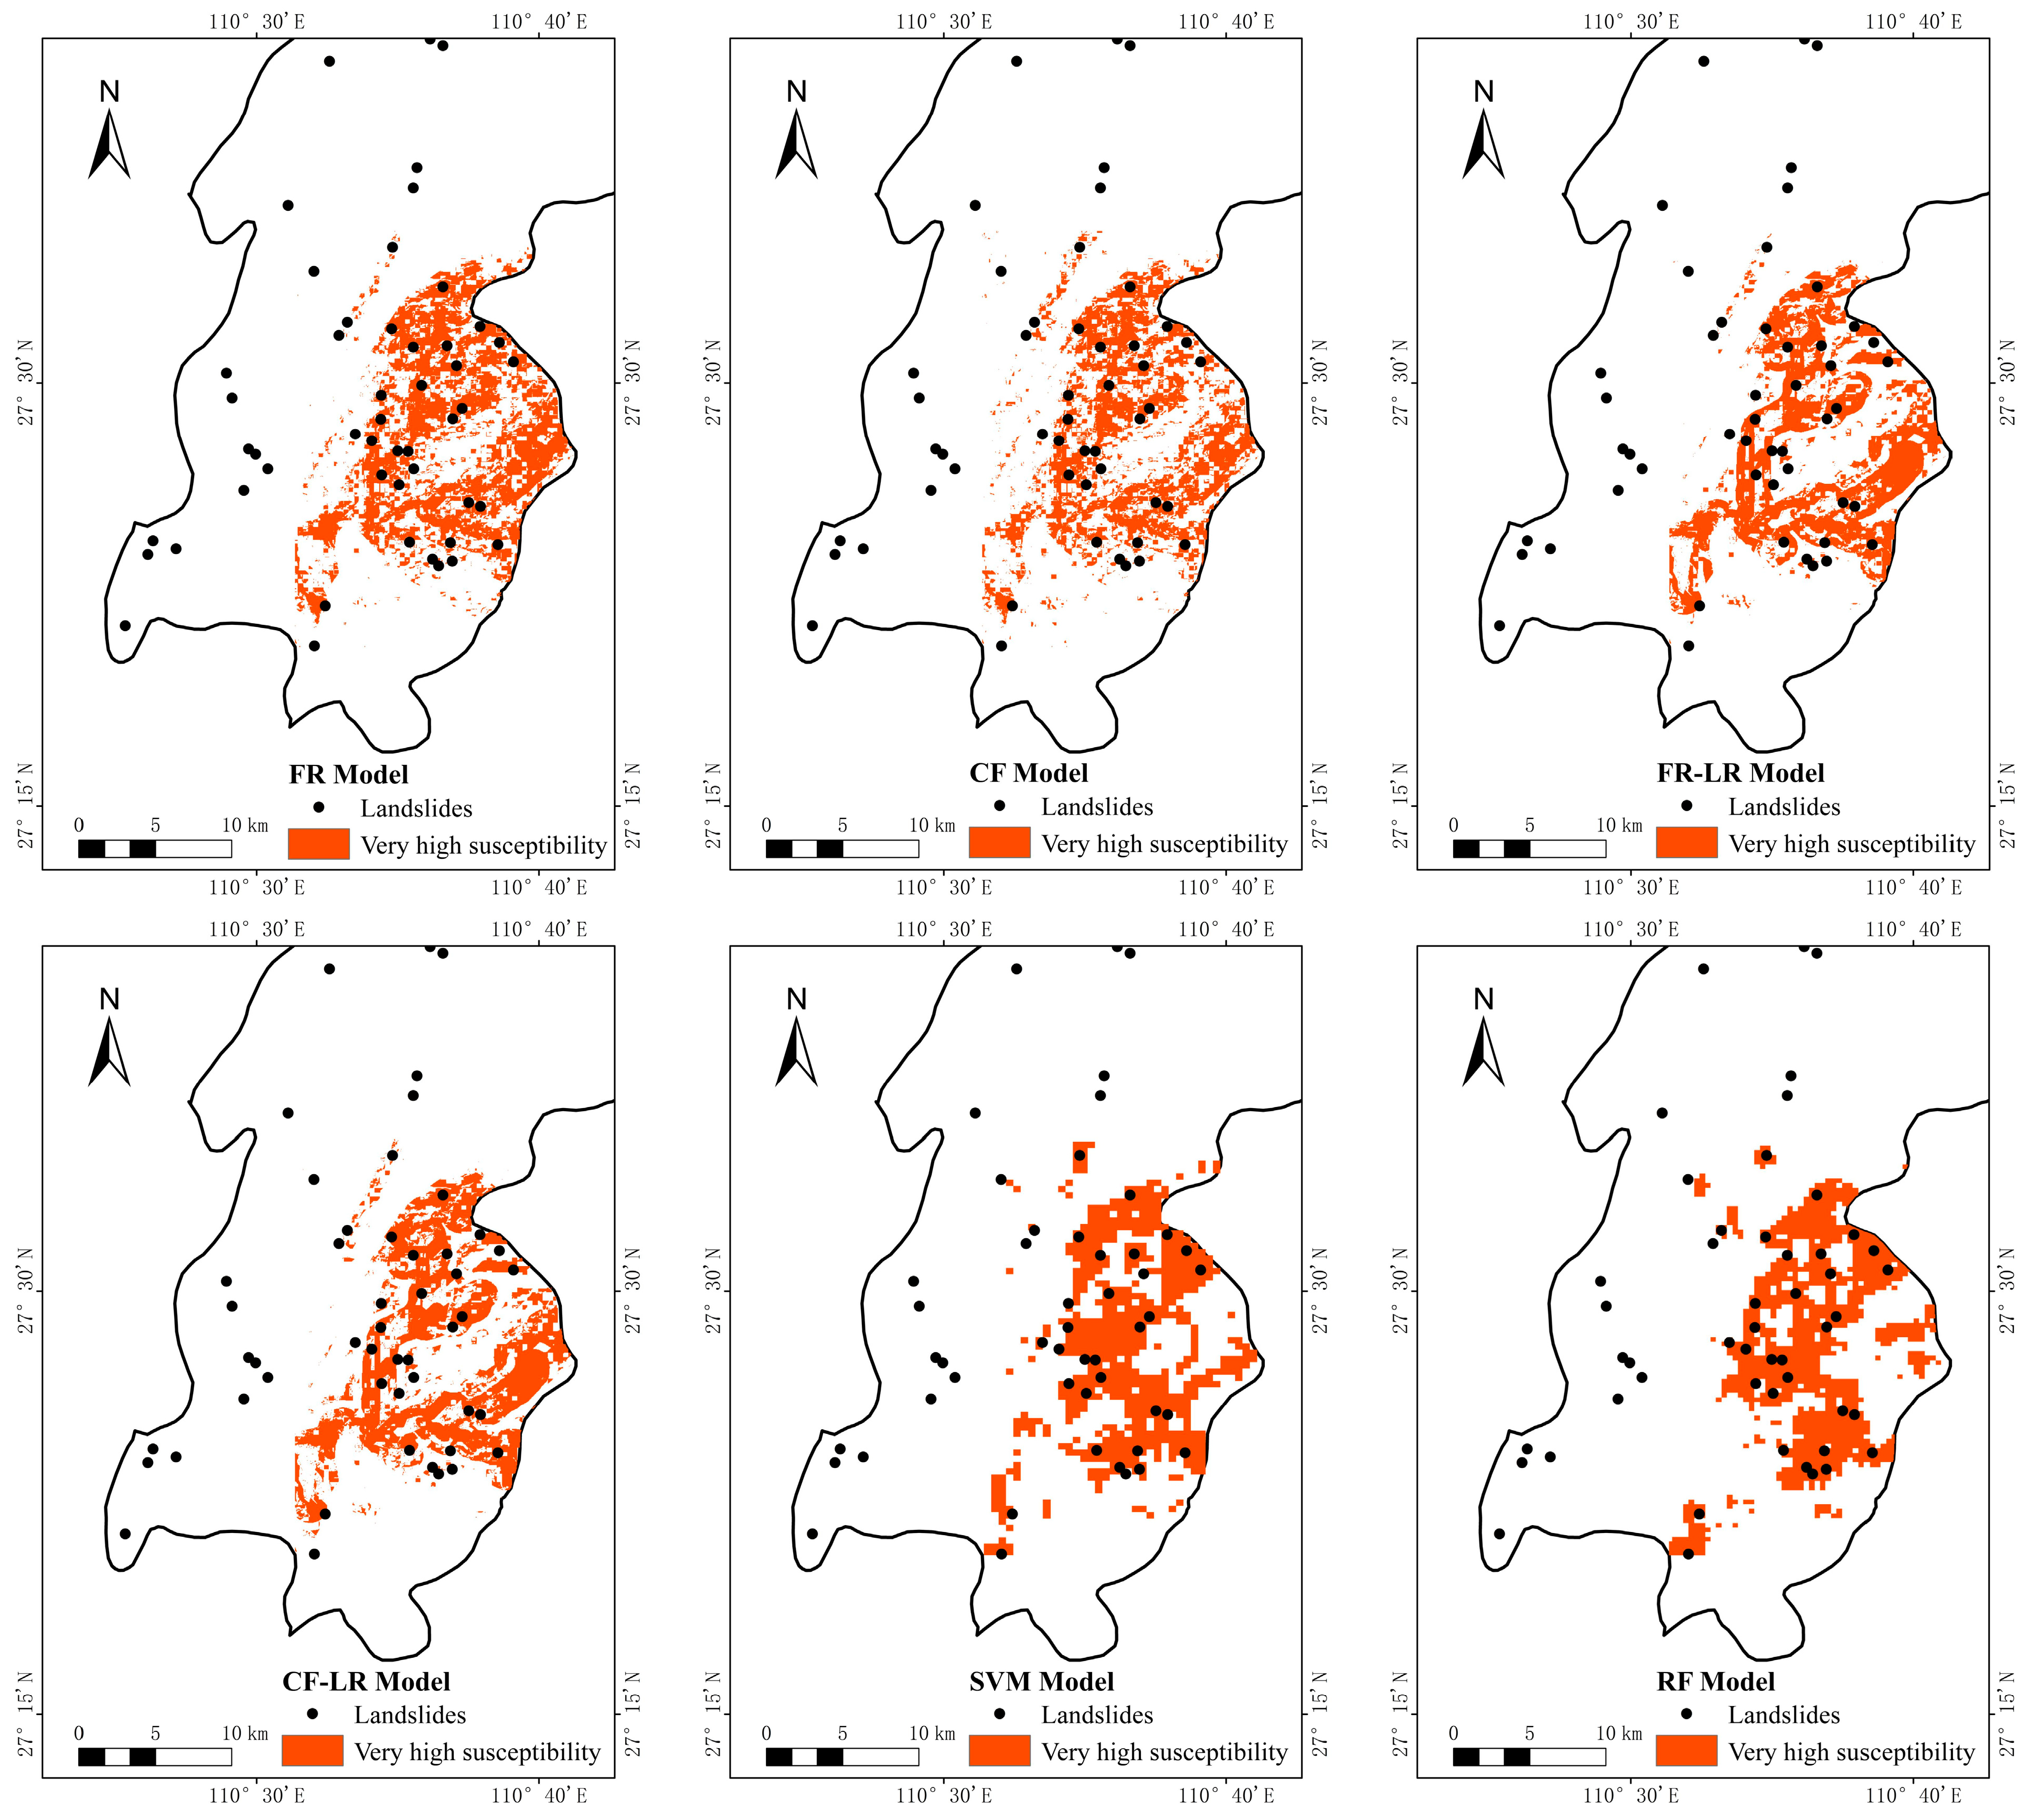
4.1. Landslide Susceptibility Zoning Results
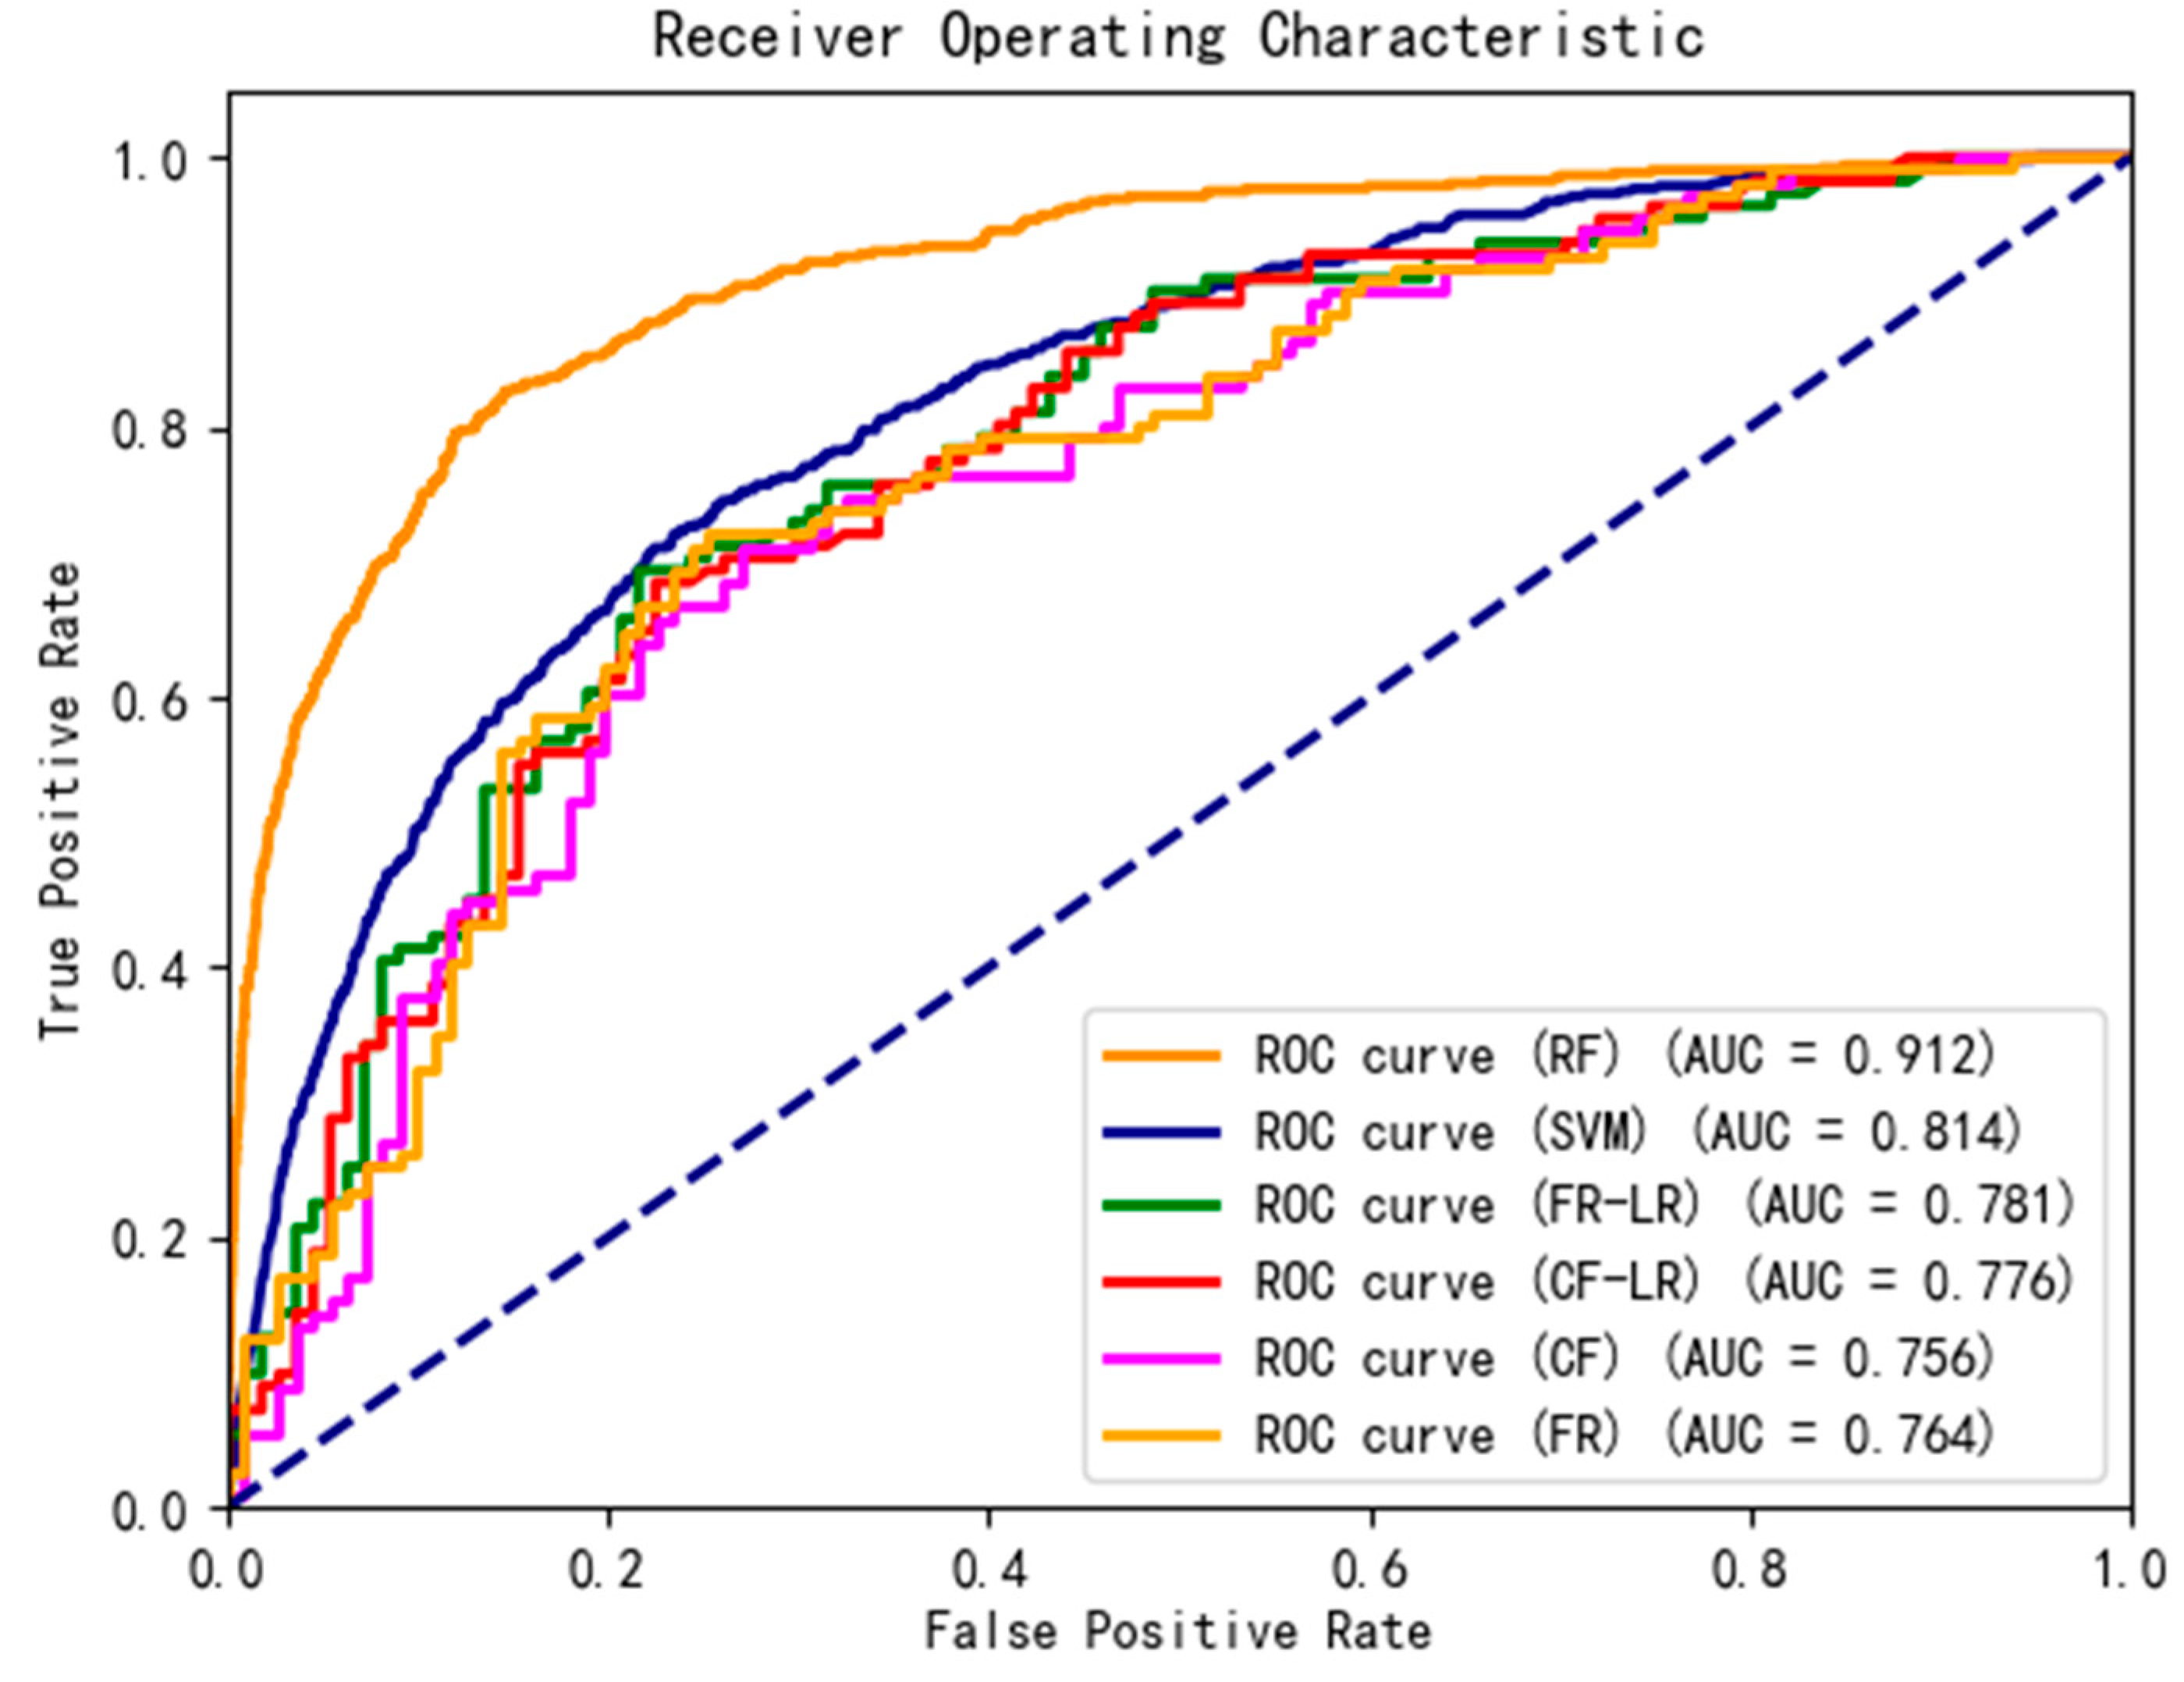
4.2. Model Accuracy Assessment
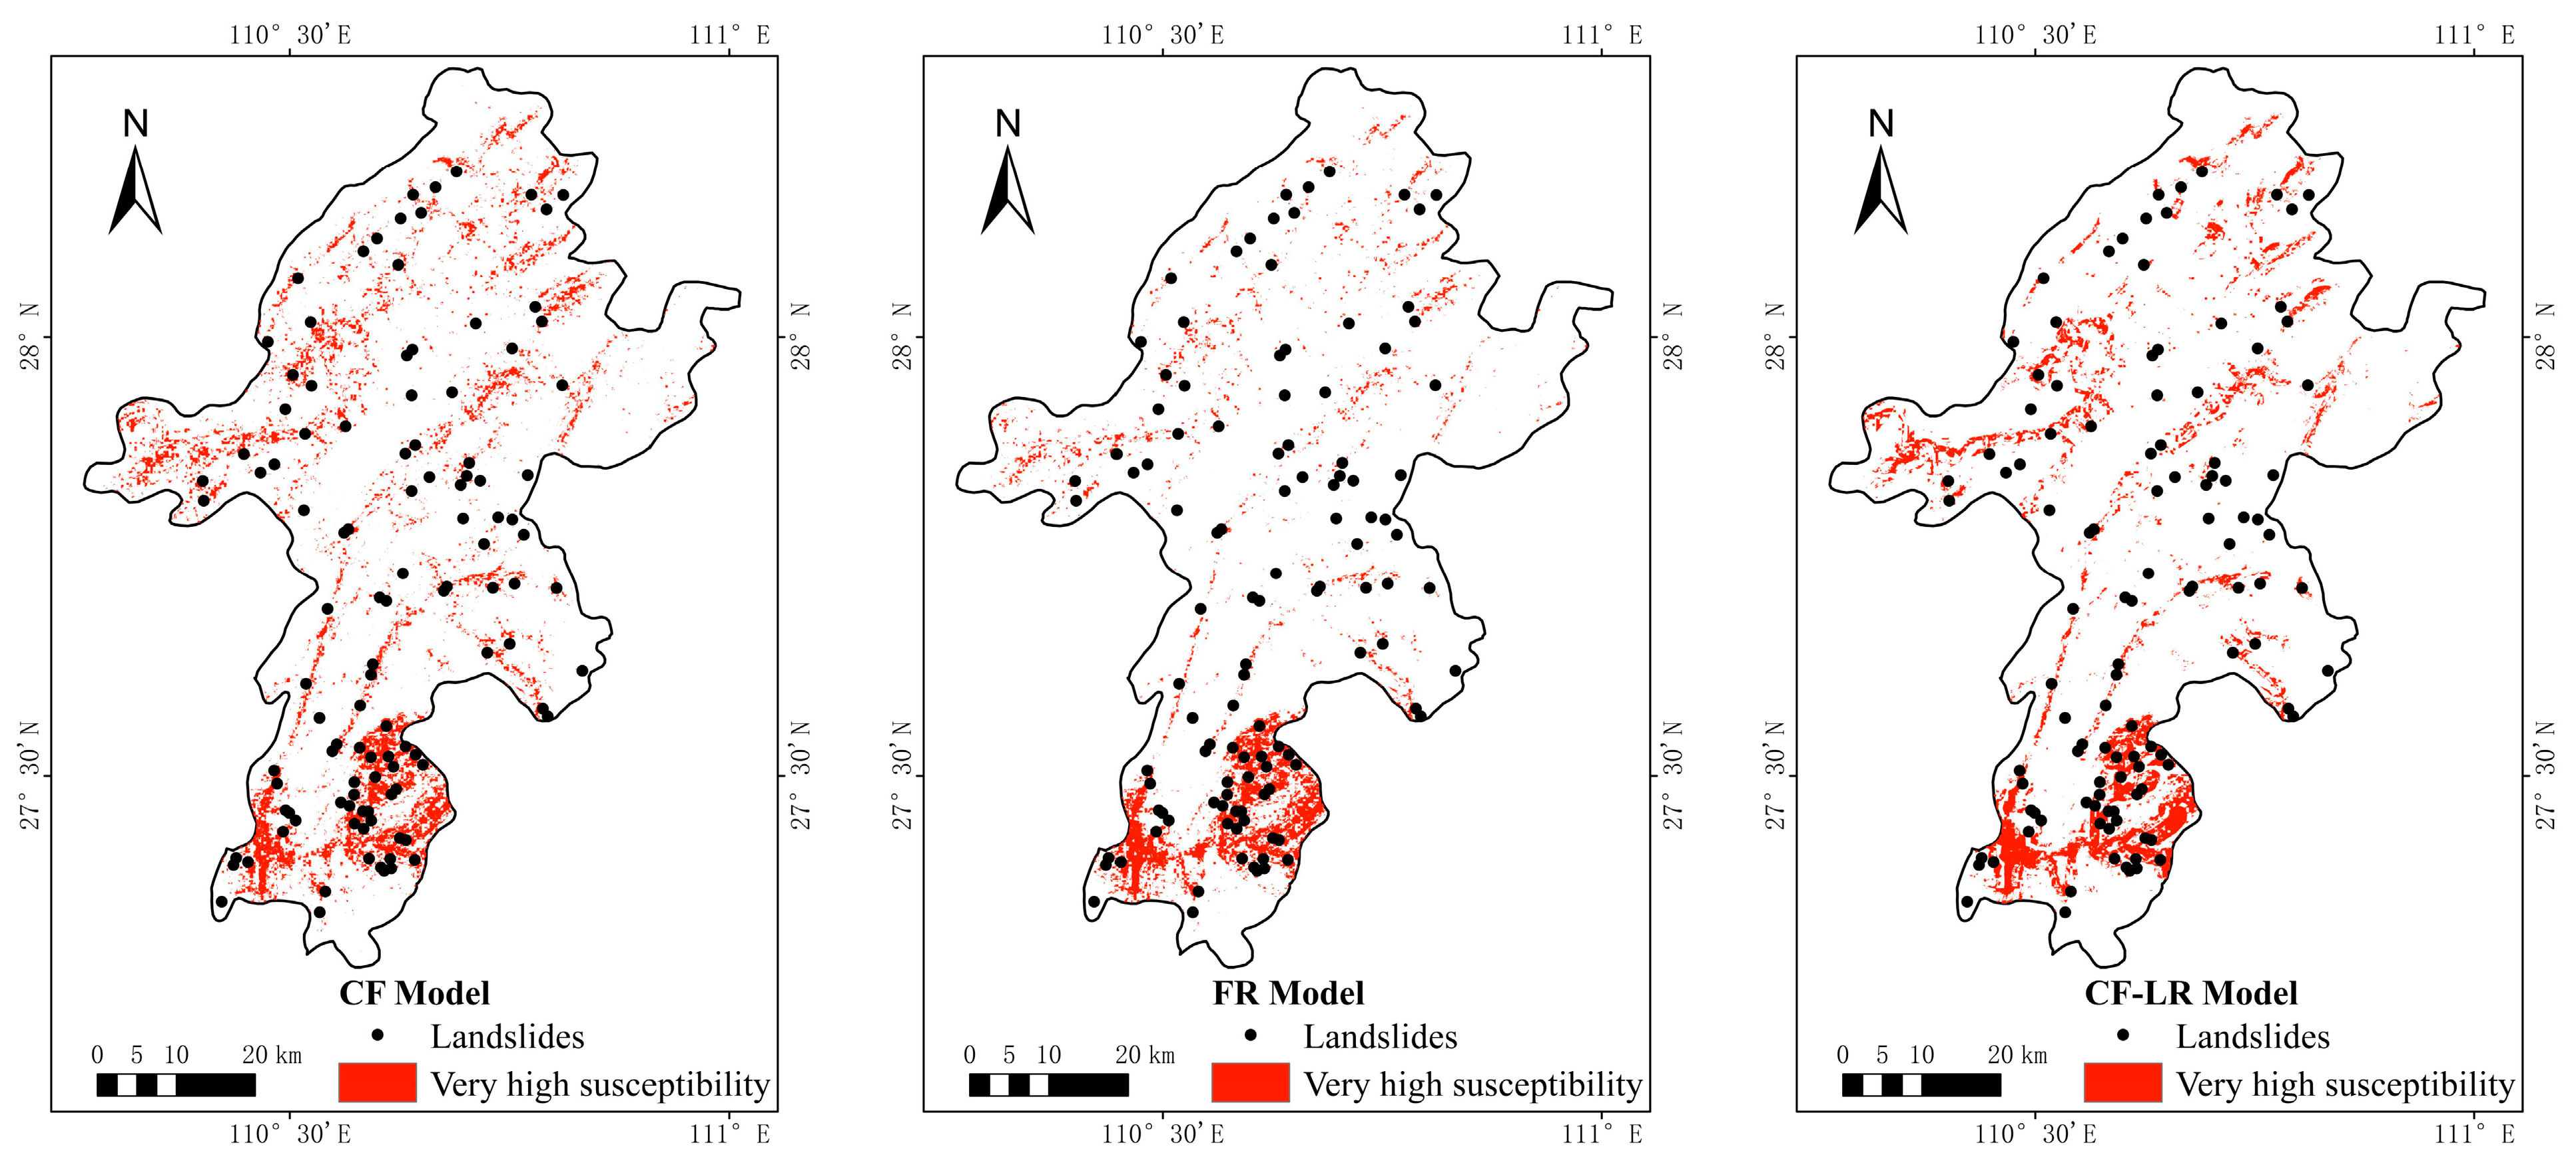
4.3. Model Adaptability Analysis
5. Discussion
5.1. Limitations in Landslide Research
5.2. Selection of Landslide Influencing Factors
6. Conclusions
Author Contributions
Funding
Data Availability Statement
Conflicts of Interest
References
- Gariano, L.S.; Guzzetti, F. Landslides in a changing climate. Earth-Sci. Rev. 2016, 162, 227–252. [Google Scholar] [CrossRef]
- Alessandro, N.; Catherine, P.; Kathryn, L.; Sophie, T.; Itahisa, G.; Emma, M.; Christian, A.; Annie, W. Mapping landslides from space: A review. Landslides 2024, 21, 1041–1052. [Google Scholar]
- Sun, J. Hard particle force in a soft fracture. Sci. Rep. 2019, 9, 3065. [Google Scholar] [CrossRef] [PubMed]
- Sun, J.; Wang, G. Transport model of underground sediment in soils. Sci. World J. 2013, 2013, 367918. [Google Scholar]
- Sun, J.; Wang, G. Research on underground water pollution caused by geological fault through radioactive stratum. J. Radioanal. Nucl. Chem. 2013, 297, 27–32. [Google Scholar]
- Sciarra, M.; Coco, L.; Urbano, T. Assessment and validation of GIS-based landslide susceptibility maps: A case study from Feltrino stream basin (Central Italy). Bull. Eng. Geol. Environ. 2017, 76, 437–456. [Google Scholar] [CrossRef]
- Jiménez-Perálvarez, D.J.; Irigaray, C.; Hamdouni, E.R.; Chacón, J. Building models for automatic landslide-susceptibility analysis, mapping, and validation in ArcGIS. Nat. Hazards 2009, 50, 571–590. [Google Scholar] [CrossRef]
- Huang, Y.; Zhao, L. Review on landslide susceptibility mapping using support vector machines. Catena 2018, 165, 520–529. [Google Scholar] [CrossRef]
- Kadavi, R.P.; Lee, C.; Lee, S. Application of Ensemble-Based Machine Learning Models to Landslide Susceptibility Mapping. Remote Sens. 2018, 10, 1252. [Google Scholar] [CrossRef]
- Guzzetti, F.; Cardinali, M.; Reichenbach, P.; Cipolla, F.; Sebastiani, C.; Galli, M.; Salavati, P. Landslides triggered by the 23 November 2000 rainfall event in the Imperia Province, Western Liguria, Italy. Eng. Geol. 2004, 73, 229–245. [Google Scholar] [CrossRef]
- Schlögel, R.; Marchesini, I.; Alvioli, M.; Reichenbach, P.; Rossi, M. Optimizing landslide susceptibility zonation: Effects of DEM spatial resolution and slope unit delineation on logistic regression models. Geomorphology 2018, 301, 10–20. [Google Scholar] [CrossRef]
- Wang, Z.; Wang, D.; Guo, Q.; Wang, D. Regional landslide hazard assessment through integrating susceptibility index and rainfall process. Nat. Hazards 2020, 104, 2153–2173. [Google Scholar] [CrossRef]
- Yu, C.; Chen, J. Application of a GIS-based slope unit method for landslide susceptibility mapping in Helong City: Comparative assessment of ICM, AHP, and RF model. Symmetry 2020, 12, 1848. [Google Scholar] [CrossRef]
- Wang, Z.; Ma, C.; Qiu, Y.; Xiong, H.; Li, M. Refined zoning of landslide susceptibility: A case study in Enshi County, Hubei, China. Int. J. Environ. Res. Public Health 2022, 19, 9412. [Google Scholar] [CrossRef] [PubMed]
- Ba, Q.; Chen, Y.; Deng, S.; Yang, J.; Li, H. A comparison of slope units and grid cells as mapping units for landslide susceptibility assessment. Earth Sci. Inform. 2018, 11, 373–388. [Google Scholar] [CrossRef]
- Mansouri, R.M.R. Landslide susceptibility zonation using analytical hierarchy process and GIS for the Bojnurd region, northeast of Iran. Landslides 2014, 11, 1079–1091. [Google Scholar] [CrossRef]
- Silalahi, S.E.F.; Pamela Arifianti, Y.; Hidayat, F. Landslide susceptibility assessment using frequency ratio model in Bogor, West Java, Indonesia. Geosci. Lett. 2019, 6, 10. [Google Scholar] [CrossRef]
- Pourghasemi, R.H.; Moradi, R.H.; Aghda, F.M.S. Landslide susceptibility mapping by binary logistic regression, analytical hierarchy process, and statistical index models and assessment of their performances. Nat. Hazards 2013, 69, 749–779. [Google Scholar] [CrossRef]
- Choi, J.; Oh, H.; Lee, H.; Lee, C.; Lee, S. Combining landslide susceptibility maps obtained from frequency ratio, logistic regression, and artificial neural network models using ASTER images and GIS. Eng. Geol. 2011, 124, 12–23. [Google Scholar] [CrossRef]
- Van Den Eeckhaut, M.; Reichenbach, P.; Guzzetti, F.; Rossi, M.; Poesen, J. Combined landslide inventory and susceptibility assessment based on different mapping units: An example from the Flemish Ardennes, Belgium. Nat. Hazards Earth Syst. Sci. 2009, 9, 507–521. [Google Scholar] [CrossRef]
- Deng, H.; Wu, X.; Zhang, W.; Liu, Y.; Li, W.; Li, X.; Zhou, P.; Zhuo, W. Slope-unit scale landslide susceptibility mapping based on the random forest model in deep valley areas. Remote Sens. 2022, 14, 4245. [Google Scholar] [CrossRef]
- Yeon, Y.; Han, J.; Ryu, H.K. Landslide susceptibility mapping in Injae, Korea, using a decision tree. Eng. Geol. 2010, 116, 274–283. [Google Scholar] [CrossRef]
- Wang, L.J.; Guo, M.; Sawada, K.; Lin, J.; Zhang, J. Landslide susceptibility mapping in Mizunami City, Japan: A comparison between logistic regression, bivariate statistical analysis and multivariate adaptive regression spline models. Catena 2015, 135, 271–282. [Google Scholar] [CrossRef]
- Shi-biao, B.; Ping, L.; Jian, W. Landslide Susceptibility Assessment of the Youfang Catchment using Logistic Regression. J. Mt. Sci. 2015, 12, 816–827. [Google Scholar]
- Xing, X.; Wu, C.; Li, J.; Zhang, L.; He, R. Susceptibility assessment for rainfall-induced landslides using a revised logistic regression method. Nat. Hazards 2021, 106, 97–117. [Google Scholar] [CrossRef]
- Park, S.-J.; Lee, C.-W.; Lee, S.; Lee, M.-J. Landslide susceptibility mapping and comparison using decision tree models: A Case Study of Jumunjin Area, Korea. Remote Sens. 2018, 10, 1545. [Google Scholar] [CrossRef]
- Wu, X.; Song, Y.; Chen, W.; Kang, G.; Qu, R.; Wang, Z.; Wang, J.; Lv, P.; Chen, H. Analysis of Geological Hazard Susceptibility of Landslides in Muli County Based on Random Forest Algorithm. Sustainability 2023, 15, 4328. [Google Scholar] [CrossRef]
- Van Den, E.M.; Hervás, J.; Jaedicke, C.; Malet, J.; Montanarella, L.; Nadim, F. Statistical modelling of Europe-wide landslide susceptibility using limited landslide inventory data. Landslides 2012, 9, 357–369. [Google Scholar] [CrossRef]
- He, Q.; Jiang, Z.; Wang, M.; Liu, K. Landslide and wildfire susceptibility assessment in Southeast Asia using ensemble machine learning methods. Remote Sens. 2021, 13, 1572. [Google Scholar] [CrossRef]
- Kim, J.C.; Lee, S.; Jung, H.S.; Lee, S. Landslide susceptibility mapping using random forest and boosted tree models in Pyeong-Chang, Korea. Geocarto Int. 2018, 33, 1000–1015. [Google Scholar] [CrossRef]
- Saito, H.; Nakayama, D.; Matsuyama, H. Comparison of landslide susceptibility based on a decision-tree model and actual landslide occurrence: The Akaishi Mountains, Japan. Geomorphology 2009, 109, 108–121. [Google Scholar] [CrossRef]
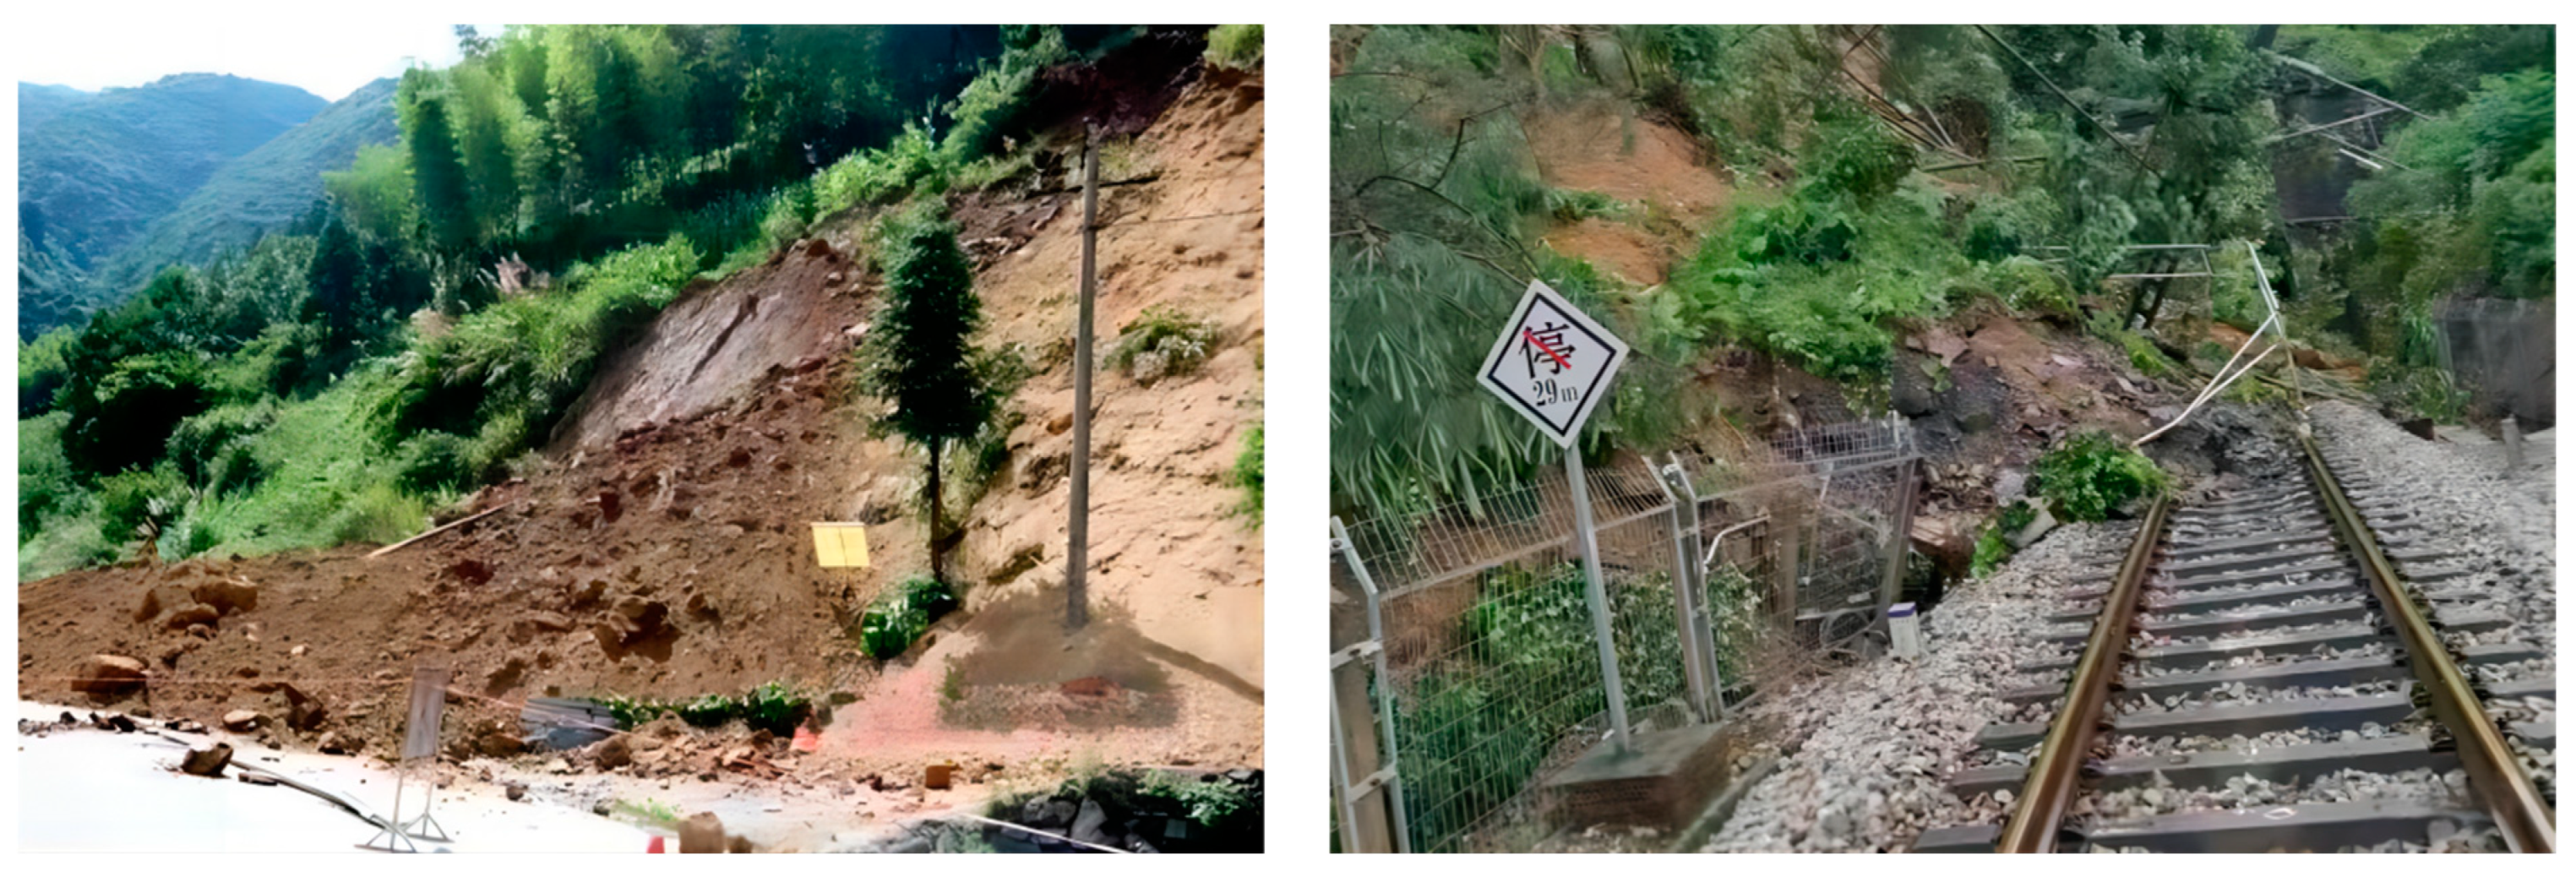
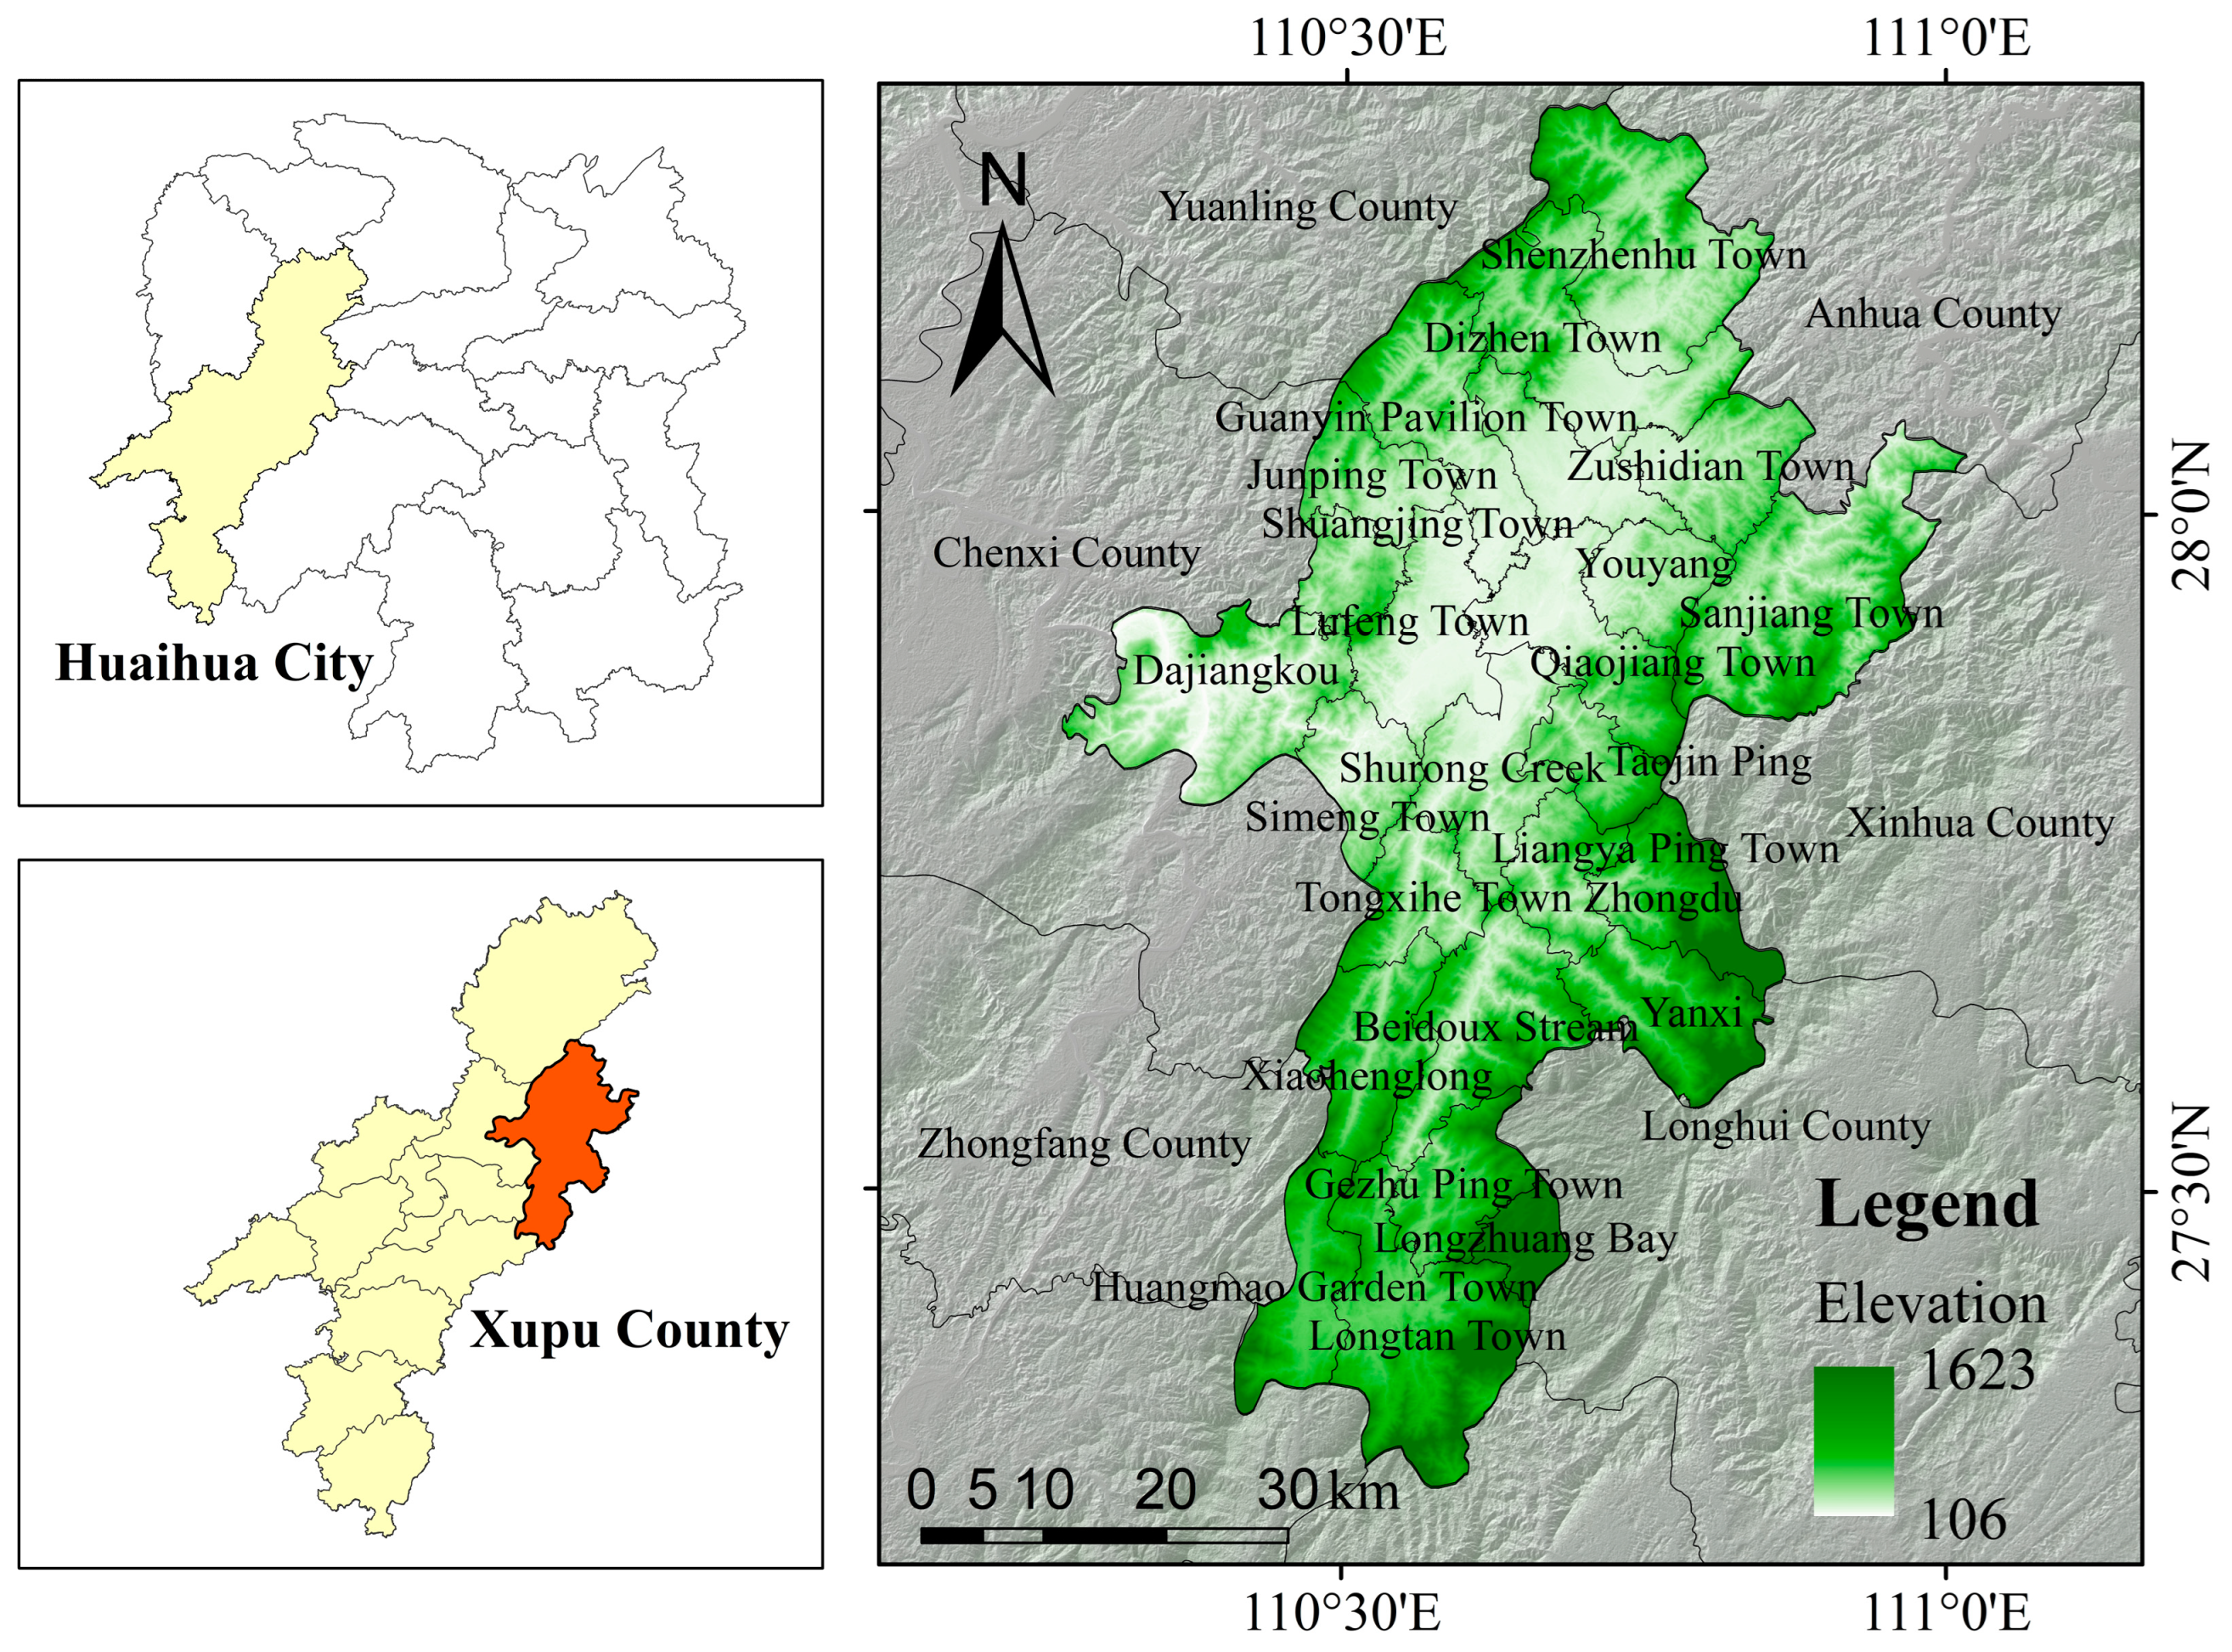

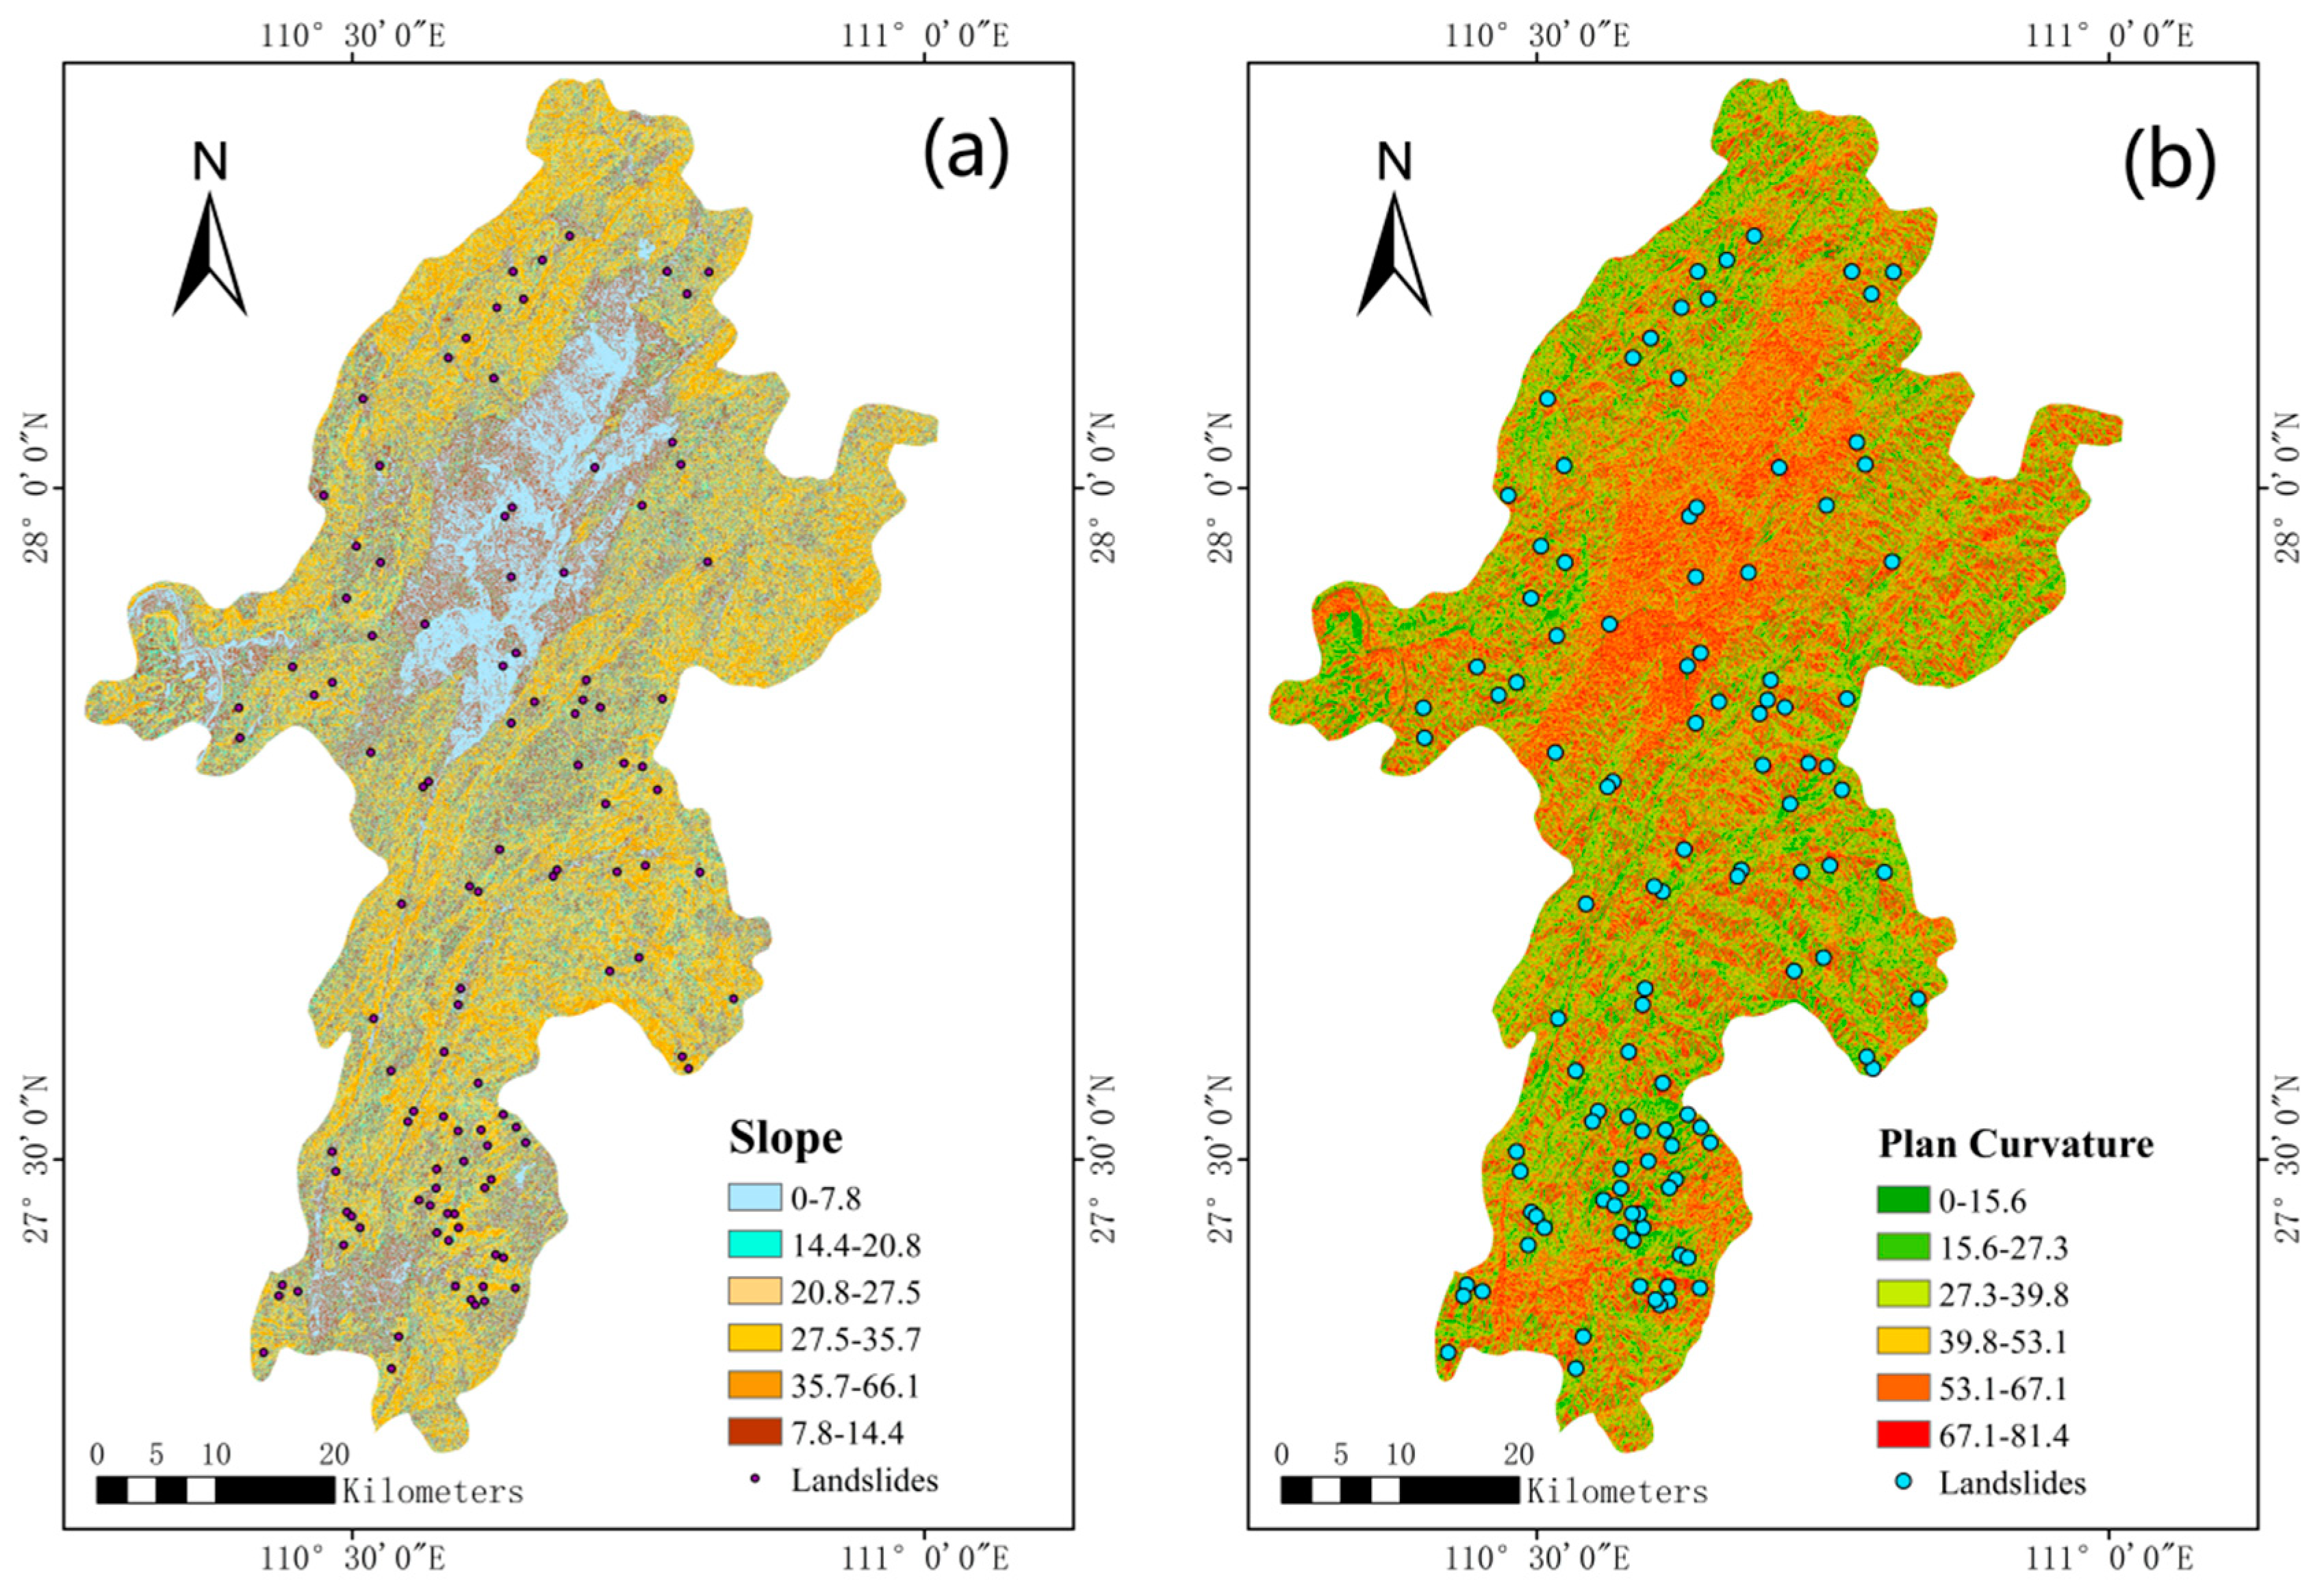



| Xupu County Townships | Area/km2 | Number of Landslide Points | Proportion of Total Disaster Points | Landslide Density |
|---|---|---|---|---|
| Beidou Xi Town | 172.8 | 5 | 0.045 | 0.029 |
| Dajiangkou Town | 236.4 | 5 | 0.045 | 0.021 |
| Luozhuang Town | 205.0 | 5 | 0.045 | 0.024 |
| Gezhi Ping Town | 98.9 | 18 | 0.162 | 0.182 |
| Guanyin Pavilion Town | 168.7 | 4 | 0.036 | 0.024 |
| Huangmaoyuan Town | 114.1 | 10 | 0.090 | 0.088 |
| Junping Town | 89.4 | 2 | 0.018 | 0.022 |
| Liangyaping Town | 85.0 | 3 | 0.027 | 0.035 |
| Longtan Town | 244.5 | 11 | 0.099 | 0.045 |
| Longzhuang Bay | 45.2 | 1 | 0.009 | 0.022 |
| Lufeng Town | 142.3 | 2 | 0.018 | 0.014 |
| Qiaojing Town | 146.9 | 3 | 0.027 | 0.020 |
| Sanjiang Town | 287.9 | 1 | 0.009 | 0.003 |
| Shenzi Lake Town | 244.1 | 3 | 0.027 | 0.012 |
| Shu Rongxi | 59.9 | 3 | 0.027 | 0.050 |
| Shuang Well Town | 105.0 | 2 | 0.018 | 0.019 |
| Shuidong Town | 145.5 | 5 | 0.045 | 0.034 |
| Sisong Town | 85.1 | 2 | 0.018 | 0.023 |
| Taojin Ping Town | 68.4 | 8 | 0.072 | 0.117 |
| Tongxi River Town | 89.0 | 4 | 0.036 | 0.045 |
| Xiao Henglong | 129.7 | 2 | 0.018 | 0.015 |
| Yanxi | 139.2 | 5 | 0.045 | 0.036 |
| Youyang | 84.0 | 1 | 0.009 | 0.012 |
| Zhongdu | 120.6 | 4 | 0.036 | 0.033 |
| Zushi Temple Town | 115.9 | 2 | 0.018 | 0.017 |
| Factor | Categories | FR | CF | Factor | Categories | FR | CF |
|---|---|---|---|---|---|---|---|
| DEM /m | 106–298 | 0.888 | −0.112 | Profile curvature | 0–4.1 | 0.930 | −0.070 |
| 298–462 | 0.991 | −0.009 | 4.1–7.7 | 1.191 | 0.161 | ||
| 462–638 | 0.787 | −0.213 | 7.7–11.5 | 0.959 | −0.041 | ||
| 638–846 | 1.154 | 0.133 | 11.5–15.8 | 0.721 | −0.279 | ||
| 846–1107 | 1.785 | 0.440 | 15.8–21.6 | 1.190 | 0.159 | ||
| 1107–1623 | 0.788 | −0.212 | 21.6–46.1 | 0.931 | −0.069 | ||
| Slope /° | 0–7.8 | 0.486 | −0.514 | Land-use type | Cultivated land | 1.896 | 0.472 |
| 7.8–14.4 | 1.027 | 0.027 | Woodland | 0.589 | −0.411 | ||
| 14.4–20.8 | 1.290 | 0.225 | Grassland | 1.153 | 0.132 | ||
| 20.8–27.5 | 1.466 | 0.318 | Wetland | 0.000 | −1.000 | ||
| 27.5–35.7 | 0.641 | −0.359 | Waterbody | 0.729 | −0.271 | ||
| 35.7–66.1 | 0.760 | −0.240 | Artificial surface | 1.755 | 0.430 | ||
| Aspect | Plane | 0.000 | −1.000 | Distance to road /m | 0–500 | 1.198 | 0.165 |
| North | 0.795 | −0.205 | 500–1000 | 1.549 | 0.354 | ||
| Northeast | 0.668 | −0.332 | 1000–1500 | 0.550 | −0.450 | ||
| East | 0.750 | −0.250 | 1500–2000 | 1.030 | 0.030 | ||
| Southeast | 0.658 | −0.342 | >2000 | 0.762 | −0.238 | ||
| South | 1.538 | 0.350 | Plan curvature | 0–15.6 | 1.517 | 0.341 | |
| Southwest | 0.919 | −0.081 | 15.6–27.3 | 1.008 | 0.008 | ||
| West | 1.348 | 0.258 | 27.3–39.8 | 1.317 | 0.241 | ||
| Northwest | 1.308 | 0.236 | 39.8–53.1 | 0.768 | −0.232 | ||
| NDVI | 0–0.1 | 1.709 | 0.415 | 53.1–67.1 | 0.658 | −0.342 | |
| 0.1–0.2 | 0.531 | −0.469 | 67.1–81.4 | 0.697 | −0.303 | ||
| 0.2–0.4 | 1.710 | 0.415 | Distance to fault /m | 0–500 | 1.424 | 0.298 | |
| 0.4–0.6 | 1.030 | 0.029 | 500–1000 | 1.183 | 0.154 | ||
| 0.6–0.8 | 1.108 | 0.098 | 1000–1500 | 1.172 | 0.147 | ||
| >0.8 | 0.705 | −0.295 | 1500–2000 | 1.130 | 0.115 | ||
| Relief amplitude /m | 0–68 | 0.621 | −0.379 | >2000 | 0.650 | −0.350 | |
| 68–118 | 0.896 | −0.104 | Rock classification | Carbonate rock | 1.082 | 0.076 | |
| 118–160 | 1.298 | 0.230 | Metamorphic rock | 0.645 | −0.355 | ||
| 160–203 | 0.838 | −0.162 | Clastic rock | 0.727 | −0.273 | ||
| 203–255 | 1.369 | 0.269 | Magmatic rock | 2.750 | 0.679 | ||
| 255–536 | 0.847 | −0.153 | Twi | <4 | 0.483 | −0.517 | |
| Distance to river /m | 0–400 | 1.584 | 0.369 | 4–5.5 | 1.041 | 0.039 | |
| 400–800 | 0.830 | −0.170 | 5.5–7 | 1.083 | 0.076 | ||
| 800–1200 | 0.710 | −0.290 | 7–8.5 | 0.831 | −0.169 | ||
| 1200–1600 | 0.995 | −0.005 | 8.5–10 | 1.714 | 0.416 | ||
| >1600 | 0.724 | −0.276 | >10 | 0.619 | −0.381 |
| Factor | B | Standard Error | Wald Test Statistic | Degrees of Freedom | Significance | Exp(B) |
|---|---|---|---|---|---|---|
| Twi | 2.26 | 0.905 | 6.24 | 1 | 0.012 | 9.587 |
| Land-use type | 1.442 | 0.411 | 12.344 | 1 | 0 | 4.231 |
| Rock classification | 1.77 | 0.466 | 14.457 | 1 | 0 | 5.874 |
| Fault | 1.484 | 0.623 | 5.672 | 1 | 0.017 | 4.411 |
| River | 1.608 | 0.601 | 7.165 | 1 | 0.007 | 4.994 |
| Road | 2.209 | 0.635 | 12.11 | 1 | 0.001 | 9.111 |
| Constant | 0.122 | 0.162 | 0.569 | 1 | 0.451 | 1.13 |
| Factor | B | Standard Error | Wald Test Statistic | Degrees of Freedom | Significance | Exp(B) |
|---|---|---|---|---|---|---|
| Twi | 1.891 | 0.737 | 6.591 | 1 | 0.01 | 6.627 |
| Land-use type | 1.057 | 0.286 | 13.654 | 1 | 0 | 2.877 |
| Rock classification | 0.906 | 0.238 | 14.487 | 1 | 0 | 2.474 |
| Fault | 1.411 | 0.554 | 6.492 | 1 | 0.011 | 4.1 |
| River | 1.115 | 0.442 | 6.353 | 1 | 0.012 | 3.049 |
| Road | 2.05 | 0.538 | 14.528 | 1 | 0 | 7.771 |
| Constant | −8.918 | 1.445 | 38.08 | 1 | 0 | 0 |
| Type | Parameter |
|---|---|
| C | 3 |
| kernel | RBF |
| gamma | 0.4 |
| Type | Parameter |
|---|---|
| n_estimators | 900 |
| max_depth | 10 |
| min_samples_split | 2 |
| min_samples_leaf | 1 |
| Model | Very High Susceptibility | High Susceptibility | Medium Susceptibility | Low Susceptibility | Very Low Susceptibility |
|---|---|---|---|---|---|
| FR Model | 27 | 46 | 15 | 16 | 7 |
| CF Model | 31 | 48 | 13 | 16 | 3 |
| FR-LR Model | 22 | 43 | 25 | 16 | 5 |
| CF-LR Model | 26 | 44 | 25 | 12 | 4 |
| SVM Model | 51 | 28 | 26 | 5 | 1 |
| RF Model | 81 | 22 | 8 | 0 | 0 |
| Model | Number of Landslide | Occurrences Area/km2 | Landslide Density |
|---|---|---|---|
| FR Model | 18 | 223.5 | 0.08 |
| CF Model | 18 | 321.9 | 0.06 |
| FR-LR Model | 16 | 245.9 | 0.07 |
| CF-LR Model | 15 | 306.2 | 0.05 |
| SVM Model | 28 | 243.6 | 0.11 |
| RF Model | 31 | 221.1 | 0.14 |
Disclaimer/Publisher’s Note: The statements, opinions and data contained in all publications are solely those of the individual author(s) and contributor(s) and not of MDPI and/or the editor(s). MDPI and/or the editor(s) disclaim responsibility for any injury to people or property resulting from any ideas, methods, instructions or products referred to in the content. |
© 2024 by the authors. Licensee MDPI, Basel, Switzerland. This article is an open access article distributed under the terms and conditions of the Creative Commons Attribution (CC BY) license (https://creativecommons.org/licenses/by/4.0/).
Share and Cite
Zhang, Z.; Sun, J. Regional Landslide Susceptibility Assessment and Model Adaptability Research. Remote Sens. 2024, 16, 2305. https://doi.org/10.3390/rs16132305
Zhang Z, Sun J. Regional Landslide Susceptibility Assessment and Model Adaptability Research. Remote Sensing. 2024; 16(13):2305. https://doi.org/10.3390/rs16132305
Chicago/Turabian StyleZhang, Zhiqiang, and Jichao Sun. 2024. "Regional Landslide Susceptibility Assessment and Model Adaptability Research" Remote Sensing 16, no. 13: 2305. https://doi.org/10.3390/rs16132305
APA StyleZhang, Z., & Sun, J. (2024). Regional Landslide Susceptibility Assessment and Model Adaptability Research. Remote Sensing, 16(13), 2305. https://doi.org/10.3390/rs16132305


