Article

Integrating NTL Intensity and Building Volume to Improve the Built-Up Areas’ Extraction from SDGSAT-1 GLI Data

1
Key Laboratory of Geographic Information Science, Ministry of Education, East China Normal University, Shanghai 200241, China
2
School of Geographic Sciences, East China Normal University, Shanghai 200241, China
3
Key Laboratory of Spatial-Temporal Big Data Analysis and Application of Natural Resources in Megacities, Ministry of Natural Resources, Shanghai 200241, China
4
School of Geospatial Engineering and Science, Sun Yat-sen University, Zhuhai 519082, China
5
Key Laboratory of Urban Land Resources Monitoring and Simulation, Ministry of Natural Resources, Shenzhen 518060, China
6
Key Laboratory of Spatial Data Mining and Information Sharing of Ministry of Education, National & Local Joint Engineering Research Center of Satellite Geospatial Information Technology, Fuzhou University, Fuzhou 350108, China
7
The Academy of Digital China, Fuzhou University, Fuzhou 350108, China
*
Author to whom correspondence should be addressed.
Remote Sens. 2024, 16(13), 2278; https://doi.org/10.3390/rs16132278
Submission received: 21 May 2024 / Revised: 19 June 2024 / Accepted: 19 June 2024 / Published: 21 June 2024

Abstract

:
Urban built-up areas are the main space carrier of population and urban activities. It is of great significance to accurately identify urban built-up area for monitoring urbanization dynamics and their impact on Sustainable Development Goals. Using only nighttime light (NTL) remote sensing data will lead to omission phenomena in urban built-up area extraction, especially for SDGSAT-1 glimmer imager (GLI) data with high spatial resolution. Therefore, this study proposed a novel nighttime Lights integrate Building Volume (LitBV) index by integrating NTL intensity information from SDGSAT-1 GLI data and building volume information from Digital Surface Model (DSM) data to extract built-up areas more accurately. The results indicated that the LitBV index achieved remarkable results in the extraction of built-up areas, with the overall accuracy of 81.25%. The accuracy of the built-up area extraction based on the LitBV index is better than the results based on only NTL data and only building volume. Moreover, experiments at different spatial resolutions (10 m, 100 m, and 500 m) and different types of NTL data (SDGSAT-1 GLI data, Luojia-1 data, and NASA’s Black Marble data) showed that the LitBV index can significantly improve the extraction accuracy of built-up areas. The LitBV index has a good application ability and prospect for extracting built-up areas with high-resolution SDGSAT-1 GLI data.

1. Introduction

Cities have developed into hubs of human activity [1]. It is estimated that about 70% of the world’s population will live in cities by 2050 [2]. Urbanization accelerates changes to the landscape and global climate [3], posing enormous challenges to biodiversity and human well-being [4,5]. The expansion of urban built-up areas is the most significant manifestation of urbanization process. An urban built-up area is not only the main gathering area of the population and economic activities, but also the spatial carrier of urban activities [6]. The United Nations Sustainable Development Goal (SDG) 11 emphasizes the need to quantify changes in urban built-up areas for sustainable cities and human settlements [7,8,9]. Therefore, the accurate identification of urban built-up areas helps us understand the dynamics of urbanization and human activities, which is of great significance for mitigating the global crisis and achieving the SDGs.
Over the past few decades, a large amount of data and methods have been developed to map the dynamics of global urban built-up areas. Remote sensing satellite data are widely used in mapping urban built-up areas in large areas [10,11,12,13]. With the development of remote sensing technology, new remote sensing data represented by nighttime light (NTL) remote sensing data have shown unique advantages in the study of urbanization [14]. By capturing artificial light sources in the city, NTL data reflect various social activities of human beings at night [15], and have been successfully applied in the research of urban issues such as economic indicator estimation [16], population estimation [17], urban center identification [18], impervious water surface extraction [19], carbon emission [20], and poverty evaluation [21]. Remote sensing images of NTL have been widely verified and applied in depicting urbanized areas (built-up areas) [22,23,24].
At present, the threshold method is a widely used and effective method to extract the urban built-up area based on the radiation intensity of NTL [22,24,25,26,27,28]. According to the brightness threshold of NTL, the boundaries of urban limits (built-up areas) and other types of areas (such as suburban and rural areas) can be divided [22]. Imhoff et al. [25] used the threshold method based on remote sensing images of NTL for the first time to convert “city lights” into “urban areas” maps. Liu et al. [26] used statistical data to propose the optimal thresholds for extracting urban areas from nighttime light imagery. Shi et al. [24] used the statistical data-assisted threshold method to reveal the ability of NTL data from the Visible Infrared Imaging Radiometer Suite (VIIRS) carried by the Suomi National Polar-Orbiting Partnership (Suomi NPP) satellite to extract urban built-up areas. Based on Defense Meteorological Satellite Program (DMSP)/Operational Linescan System (OLS) NTL data, Zhou et al. [22] developed the quantile method to extract urban built-up areas by successively excluding rural and suburban areas from potential urban agglomerations. The quantile method does not require the participation of auxiliary data and can obtain better results than other methods.
In November 2021, the Sustainable Development Science Satellite 1 (SDGSAT-1) was launched. The NTL remote sensing images from the SDGSAT-1 glimmer imager (GLI) are multi-band (three RGB bands and one panchromatic band) and have high spatial resolution (40 m/10 m). The SDGSAT-1 GLI provides new data for urban studies and the evaluation of the UN SDGs [29]. The availability of SDGSAT-1 GLI data with high spatial resolution is a unique opportunity to extract fine-scale urban built-up areas.
However, although high spatial resolution SDGSAT-1 GLI data have achieved great breakthroughs in urban spatial detail [29], buildings (especially residential buildings) that are not illuminated at night are often not recorded in its images. Li et al. [30] developed an improved quantile method based on SDGSAT-1 GLI data to extract urban built-up areas. It can be seen from the results of Li et al. [30] that there are omission phenomena in the results of built-up area extraction based on SDGSAT-1 GLI data, and effectiveness accuracy in Shanghai is only 0.2428. Similarly, using building data alone to extract urban built-up areas also results in omission problems. For example, there are no buildings (i.e., building volume is zero) on a horizontal road, which causes the built-up area division based on a building volume threshold to incorrectly exclude the road. Therefore, using only NTL data or only building volume data will result in omission or commission in the extraction of built-up areas.
A large part of urban light at night is emitted by buildings, so the distribution and function of buildings are closely related to the distribution and intensity of urban light [31,32,33]. Some researchers studied the relationship between urban architectural form and nighttime light intensity, and found that building height or volume was positively correlated with night light intensity [34,35,36,37]. Wu et al. [38] explored the relationship between global NTL remote sensing data and urban building data on multiple spatial scales, and the results showed that the spatial pattern between nighttime light intensity and building form could be used as an indicator of urbanization. Combining NTL intensity and building form can improve the accuracy of urban problem research [37,39,40].
Therefore, this study attempts to combine NTL information with building information, integrating socio-economic and physical environment aspects to enhance the extraction effect of urban built-up areas based on SDGSAT-1 GLI data. The main contents include: (1) proposing a novel LitBV index, which combines NTL intensity and building volume; (2) applying the LitBV index based on SDGSAT-1 GLI data to extract urban built-up areas; and (3) testing the application prospect of the LitBV index in different spatial resolutions and different types of NTL data.

2. Study Area and Datasets

2.1. Study Area

In this study, Shanghai, China, is selected as the research area (Figure 1). Shanghai is one of the largest cities in the world, with an area of 6340.5 km2 and a population larger than 25 million people, making it one of the most densely populated cities in the world. There are frequent social and economic activities in Shanghai at night, and the information from night lighting is abundant. In addition, Shanghai, as a highly urbanized metropolis, has a large number of large commercial buildings and high-density residential buildings with different shapes and forms. Shanghai’s abundant information on night activities and diverse buildings make it an ideal experimental area for studying NTL intensity and the three-dimensional structures of urban buildings.

2.2. Datasets

In this paper, three types of NTL remote sensing data and building 3D data, as well as 3 kinds of auxiliary dataset, were used.

2.2.1. SDGSAT-1 GLI Data

The SDGSAT-1 GLI data provide high spatial resolution information on urban nighttime lights. SDGSAT-1 GLI data are available in 4 bands: color bands (R/G/B) with a spatial resolution of 40 m and a panchromatic band with a spatial resolution of 10 m. In this study, panchromatic band data with a high spatial resolution of 10 m were used to obtain as much spatial detail as possible and tap the application potential of high spatial resolution NTL data. We downloaded the SDGSAT-1 GLI data from the International Research Center for Big Data for Sustainable Development Goals (data imaging time: 21:03:40 local time on 13 December 2021).
However, due to the correction error of the sensor components’ response function, the influence of external temperature and environment on the photoelectric system, and the influence of atmosphere on the incident short-wave radiation flux [41,42], there are obvious stripes and salt-and-pepper noise phenomena in SDGSAT-1 GLI data. Stripes and salt-and-pepper noise pervaded the entire image, affecting both qualitative and quantitative image-based analysis [42,43]. In our previous work [44], a denoising algorithm for SDGSAT-1 GLI data was developed, which successfully solved the noise problem in images. Here, we use the denoising algorithm to de-noise SDGSAT-1 GLI panchromatic band data.
In addition, NTL data from Luojia-1 and NASA’s Black Marble product suite (VNP46A4 data) were used to discuss the application effect of our method on different data types. The Luojia-1 data have a spatial resolution of about 130 m and are downloaded from the High-Resolution Earth Observation System of the Hubei Data and Application Center (http://59.175.109.173:8888/app/login.html (accessed on 20 June 2019)). Black Marble data have a spatial resolution of 500 m and are downloaded from the Level-1 and Atmosphere Archive and Distribution System (LAADS) Distributed Active Archive Centers (DAACs) (https://ladsweb.modaps.eosdis.nasa.gov (accessed on 6 March 2024)). To match the building volume data, the Luojia-1 data were resampled to a spatial resolution of 100 m.

2.2.2. Building Volume Data

This study obtained the digital surface model (DSM) of Shanghai in 2021 from the Shanghai Surveying and Mapping Institute. The DSM has a spatial resolution of 0.25 m and a vertical accuracy of 0.5 m. The DSM data include the height of the buildings and the height of the relief of the terrain. In order to obtain the height of the buildings, we obtained the digital terrain model (DTM) from the DSM by a mathematical morphological filter according to the method of Wu et al. [37]. The DTM is then subtracted from the DSM data to obtain the normalization DSM (nDSM) data, which represent the net height of surface entities. nDSM data include not only buildings but also some non-buildings such as vegetation. Therefore, this paper uses the “Building” type in the high-resolution land cover type data (SinoLC-1 data with 1 m spatial resolution [45]) to mask the nDSM data and extract the height of the building. Pixel values outside the “Building” type are assigned a height of 0. Then, multiply the area of the pixel by the nDSM height value to obtain the building volume. Finally, the building volume data were adjusted to the same 10 m spatial resolution as the SDGSAT-1 GLI data, using the aggregation method.

2.2.3. Auxiliary Datasets

This study obtained the 10 m resolution land cover type data of ESRI (https://livingatlas.arcgis.com/landcoverexplorer (accessed on 8 March 2024)), 100 m resolution land cover type data of Copernicus Global Land Cover Layers (CGLS-LC100) (https://lcviewer.vito.be/download (accessed on 8 March 2024)), and 500 m resolution land cover type data of MODIS (MCD12Q1) (https://ladsweb.modaps.eosdis.nasa.gov/ (accessed on 8 March 2024)), and uses the category “Built-up Area” as the reference data for the extraction results of the built area.

3. Methods

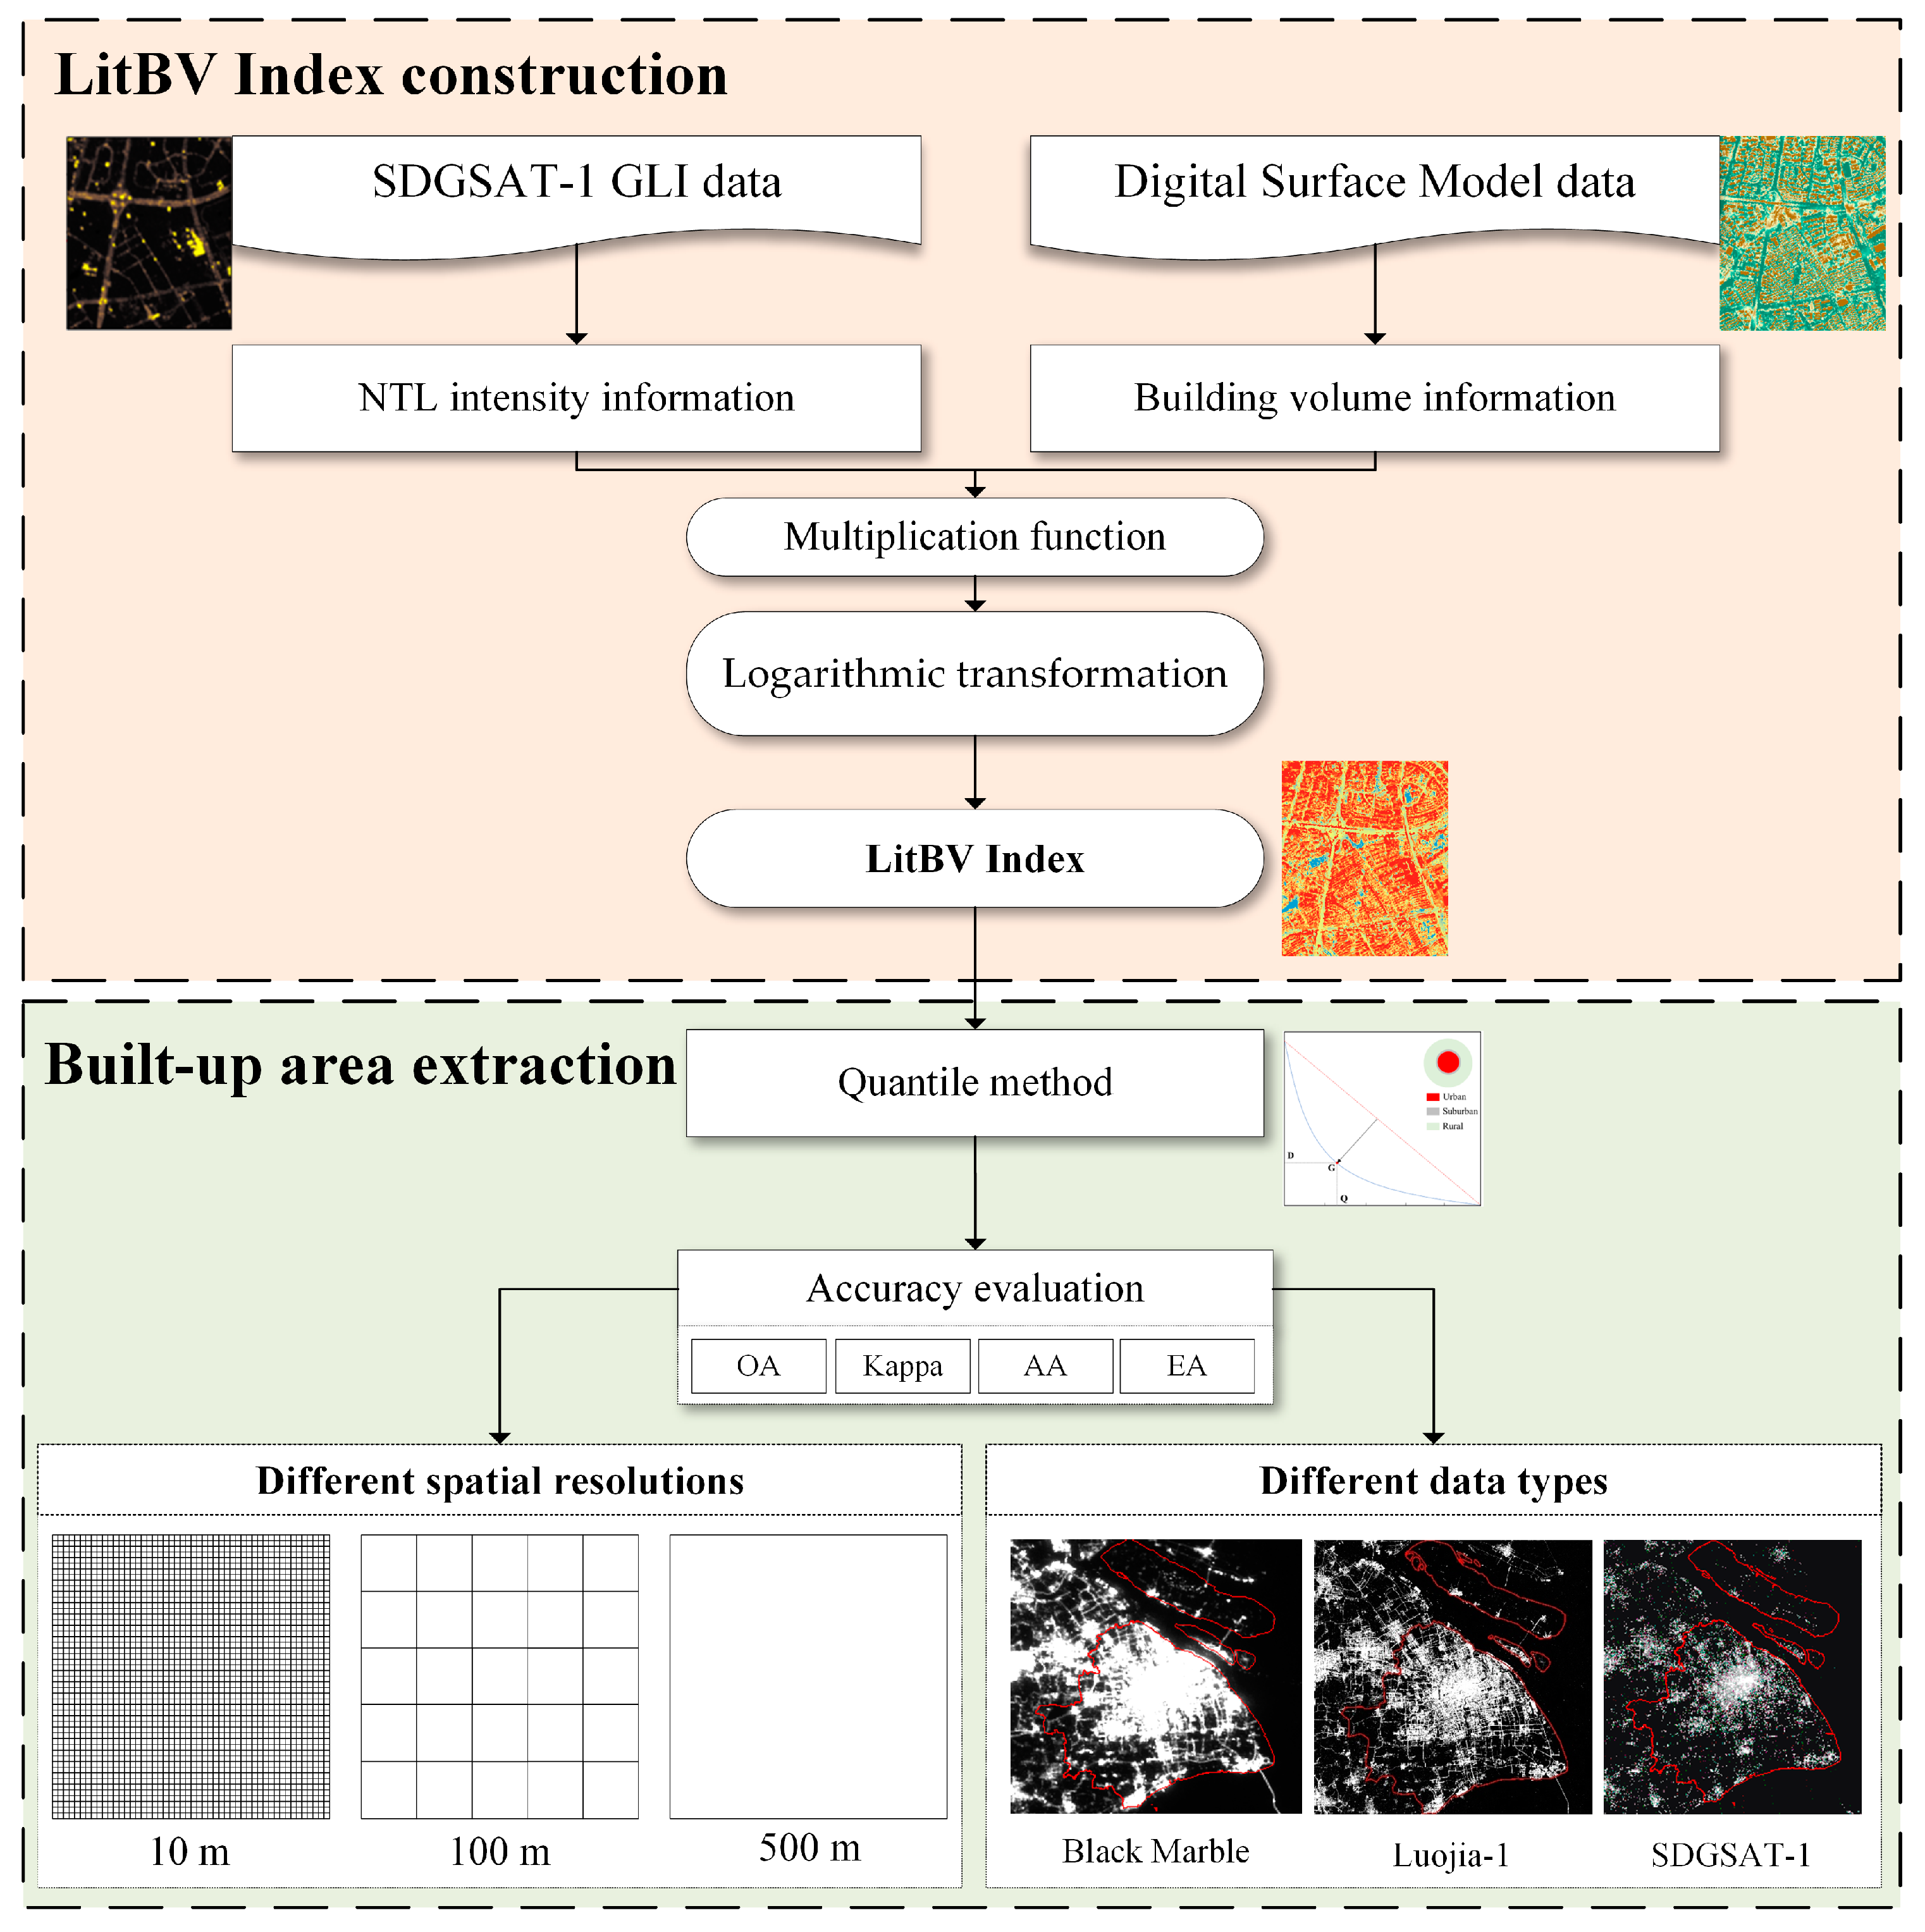
The research methods and contents of this paper include two parts (Figure 2): (1) the integration of NTL information and building information; and (2) the extraction of the built-up area. Specifically, in order to further verify the application prospect of the LitBV index proposed in this study, we carried out the built-up area extraction experiments on different spatial resolutions in the results. SDGSAT-1 GLI data were resampled to spatial resolutions of 100 m and 500 m to represent different spatial resolutions based on the same data. In addition, the application effect of the LitBV index in different types of NTL data was further discussed. SDGSAT-1 GLI data, Luojia-1 data, and NASA’s Black Marble data represent three typical NTL data derived from completely different sensors.

3.1. Integration of NTL Information and Building Information

In this study, considering that from the countryside to the urban center, the greater the NTL intensity and the larger the building volume the more likely it is to be an urban built-up area, a new nighttime Lights integrate Building Volume (LitBV) index (Formula (1)) was constructed in the form of multiplication to extract the built-up area. The approach was inspired by the work of Zhao et al. [46] and Eberenz et al. [47].
L i t B V i = ln ( N T L i + δ × ( B V i + δ ) )
where L i t B V i is the LitBV index of the i th pixel, and N T L i and B V i represent the NTL intensity and building volume of the i th pixel, respectively. To avoid pixels that are unilluminated but have buildings, or illuminated but have no buildings, being assigned zero values, the added δ is equal to 1. In addition, the NTL intensity multiplied by the building volume in some pixels will result in a very large value, resulting in a great variation in the central area of the city and a small variation in the boundary between the built-up area and the unbuilt-up area. Yu et al. [48] proved that logarithmic transformation can expand the difference between the built-up area and the unbuilt-up area and significantly improve the extraction effect of built-up areas. Therefore, in the extraction of built-up areas, logarithmic transformation was used to further enhance the index.

3.2. Extraction of Built-Up Area

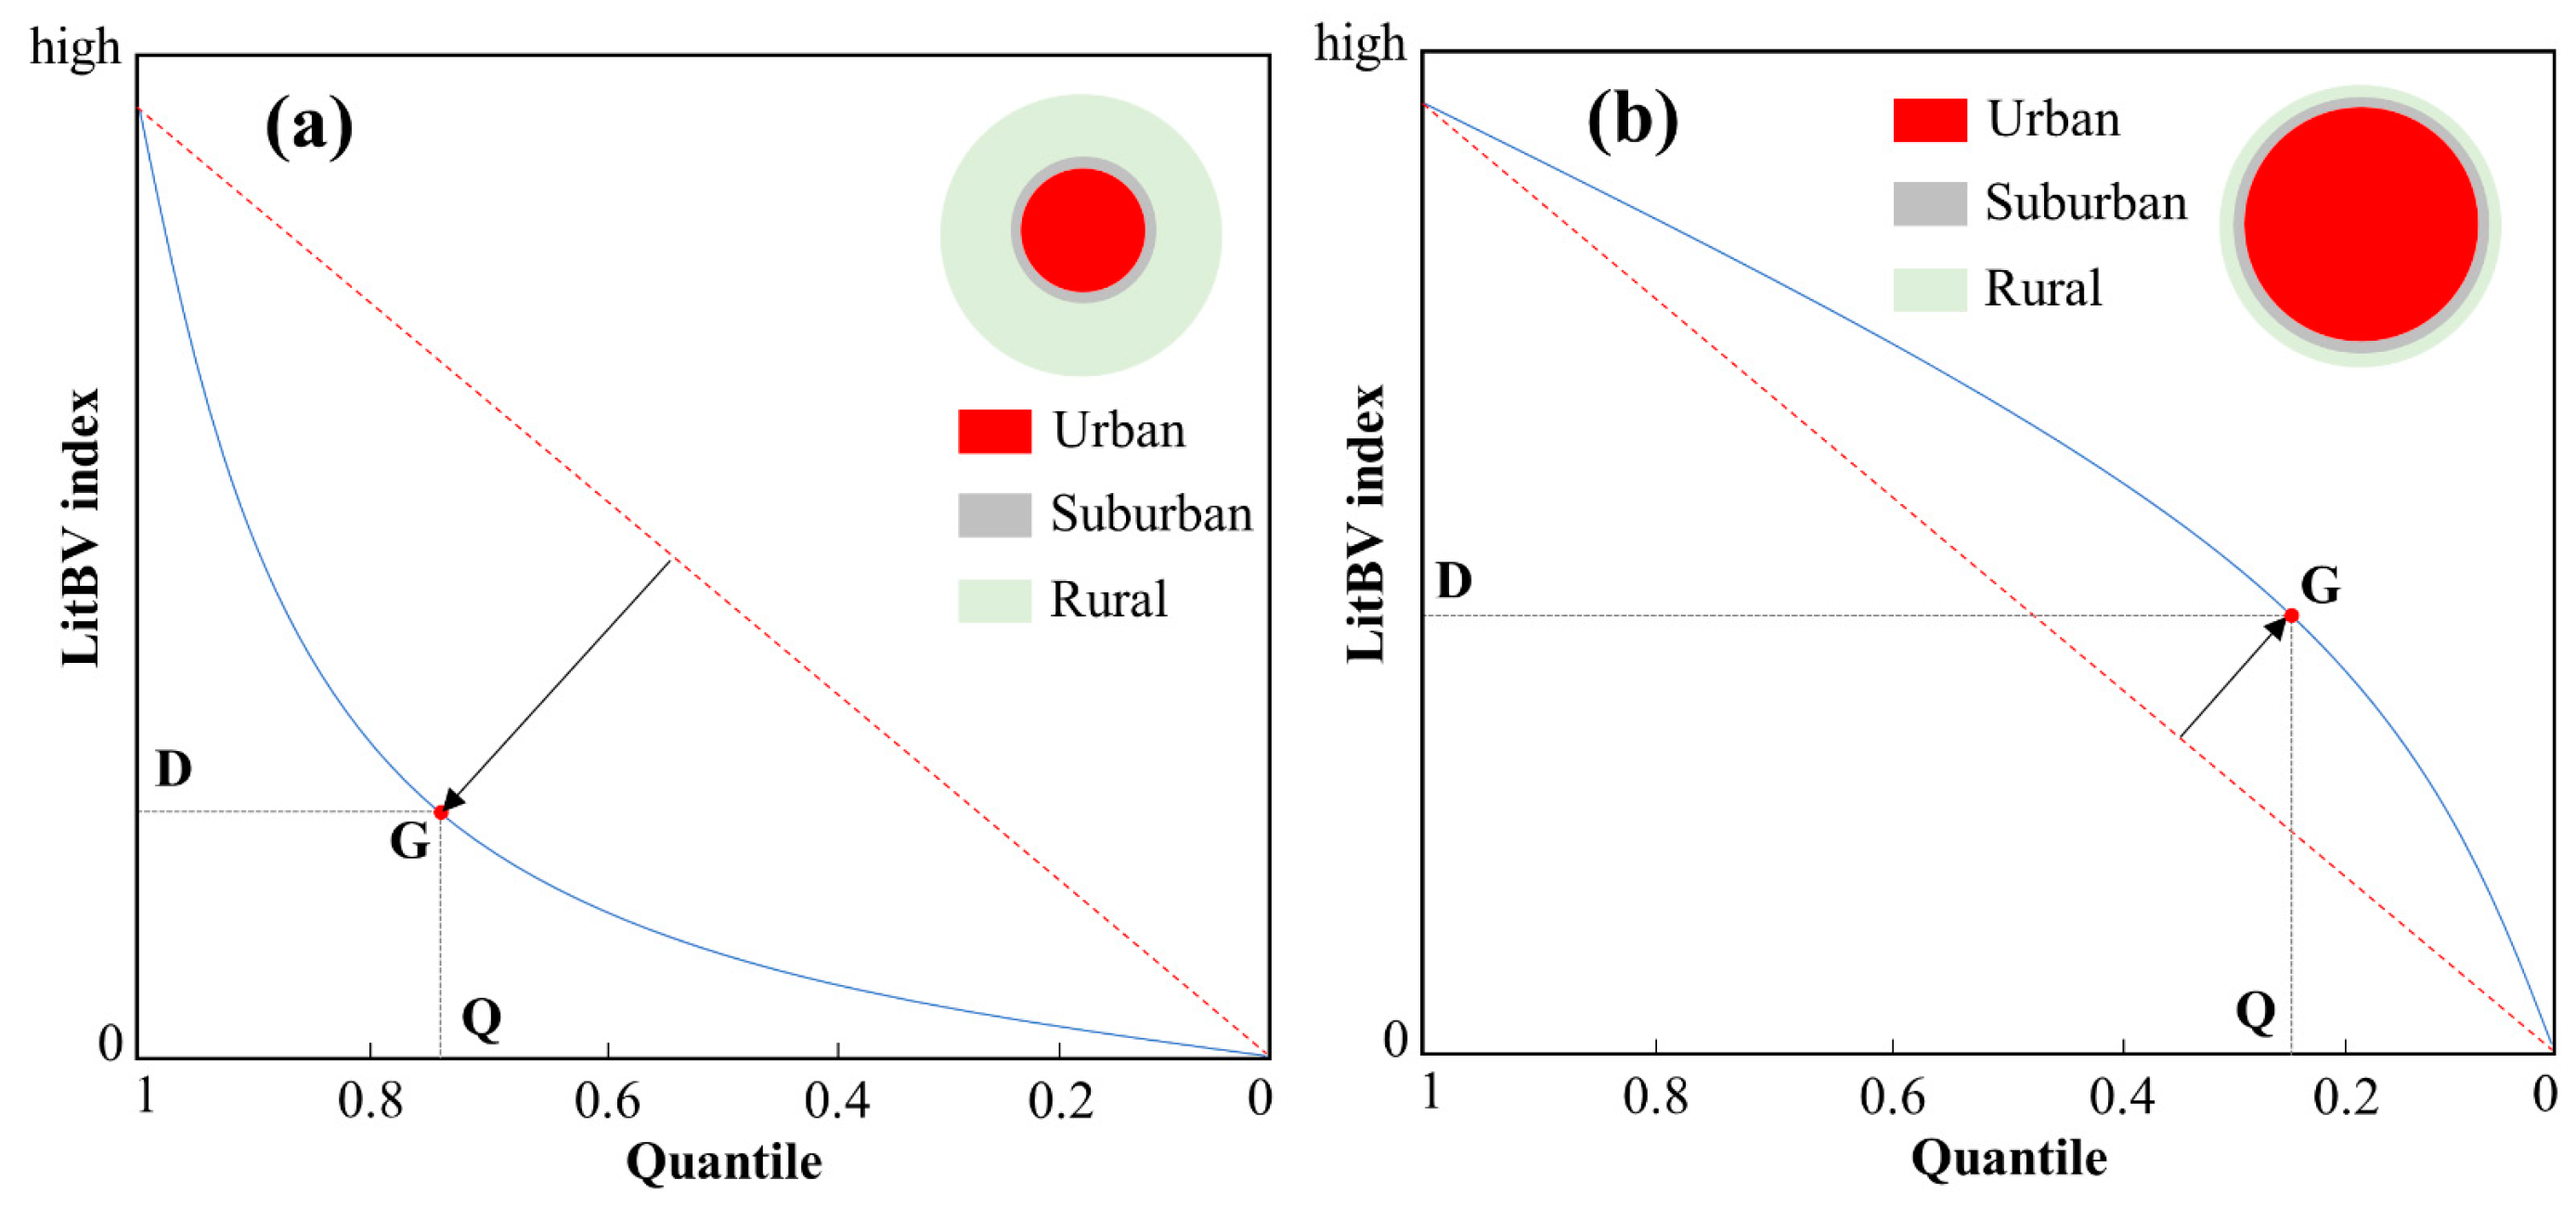
In this paper, the downward quantile method was used to extract the built-up area to test the application ability of the LitBV index, considering that the downward quantile method has been successfully applied to the panchromatic band of SDGSAT-1 GLI data [30]. The principle of the quantile method is shown in Figure 3; urban areas are separated from surrounding surface types in potential urban clusters by determining a threshold of the LitBV index. LitBV index values vary rapidly along the border between urban, suburban, and rural areas. The quantile curve (i.e., index values of different quantile grades) is below the reference line (the linear decrease in index values from highest to lowest) for the predominantly rural area (Figure 3a) and above the reference line for the predominantly urban area (Figure 3b). Thus, the turning point G (the point at which the quantile curve differs the most from the reference line) represents the demarcation boundary between different types (i.e., urban, suburban, and rural area). Then, a heuristic rule (Figure 4) is adopted to obtain the threshold of urban built-up area extraction: first, excluding pixels with LitBV index values higher than the threshold D1 (urban and suburban areas) and then excluding pixels with LitBV index values higher than the threshold D2 (rural areas). More details of the downward quantile method can be seen in Zhou et al. [22] and Li et al. [30].
In this study, overall accuracy (OA) and Kappa Coefficient were used to measure the accuracy of built-up area extraction. In addition, for comparison with other similar studies, two other accuracy evaluation measures used in Li et al.’s [30] study were applied: Applicability Accuracy ( A A ) and Effectiveness Accuracy ( E A ). The AA represents the proportion of built-up area in extracted information, and the EA refers to the proportion of the extracted real built-up area that has been extracted.
A A = 1 A r e a c o m m i s s i o n B u i l t   u p   A r e a N T L
where A r e a c o m m i s s i o n is the commission area compared with the reference land cover data, and B u i l t   u p   A r e a N T L is the whole built-up area derived based on the NTL data.
E A = 1 A r e a o m i s s i o n B u i l t   u p   A r e a L U L C
where A r e a o m i s s i o n is the omission area compared with the reference land cover data, and B u i l t   u p   A r e a L U L C is the whole built-up area derived based on the reference land cover data.

4. Results

4.1. Characteristics of LitBV Index

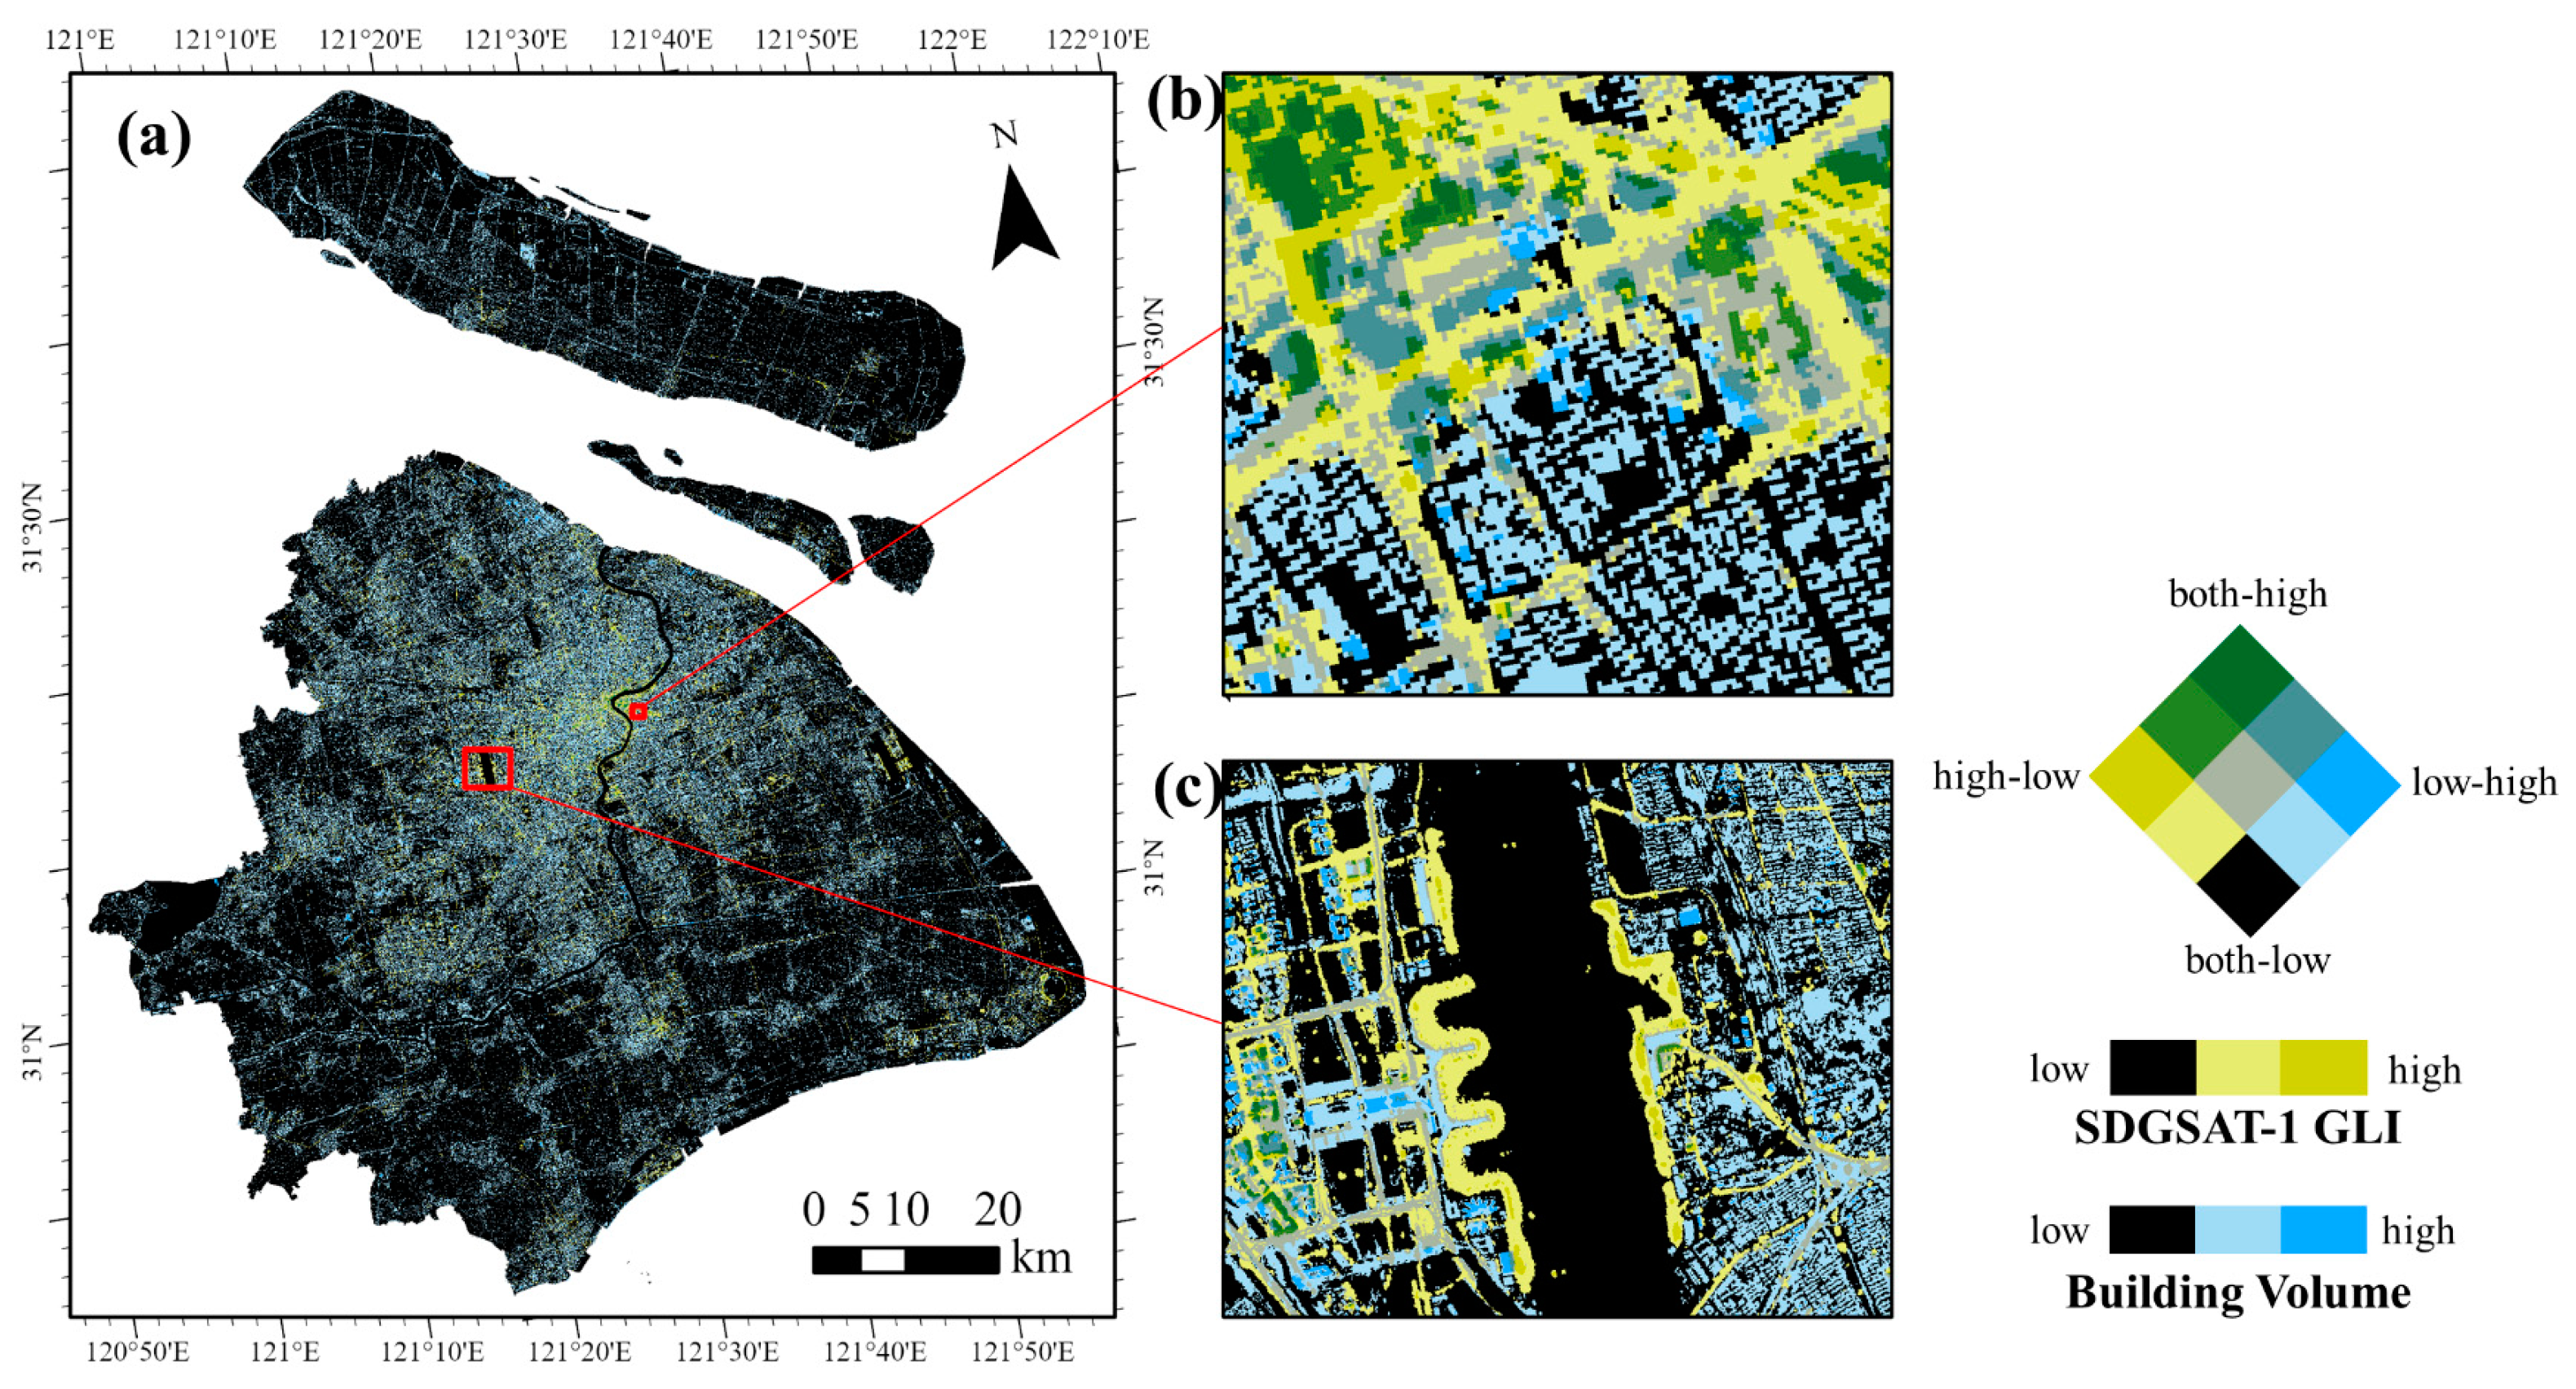
Figure 5 shows the spatial distribution relationship between the NTL intensity from SDGSAT-1 GLI data and the building volume from nDSM data. It can be seen that most areas in the suburbs of Shanghai are black, indicating that the NTL intensity and building volume in these areas are very low; these areas are almost all farmland or water, with almost no buildings or night lighting. The road shows obvious high NTL intensity and small building volume. In the residential area divided by the road, there are a large number of residential buildings, but the night lighting in the residential area is very low. In general, NTL information can be integrated with building information to represent the urban entity and its scope.
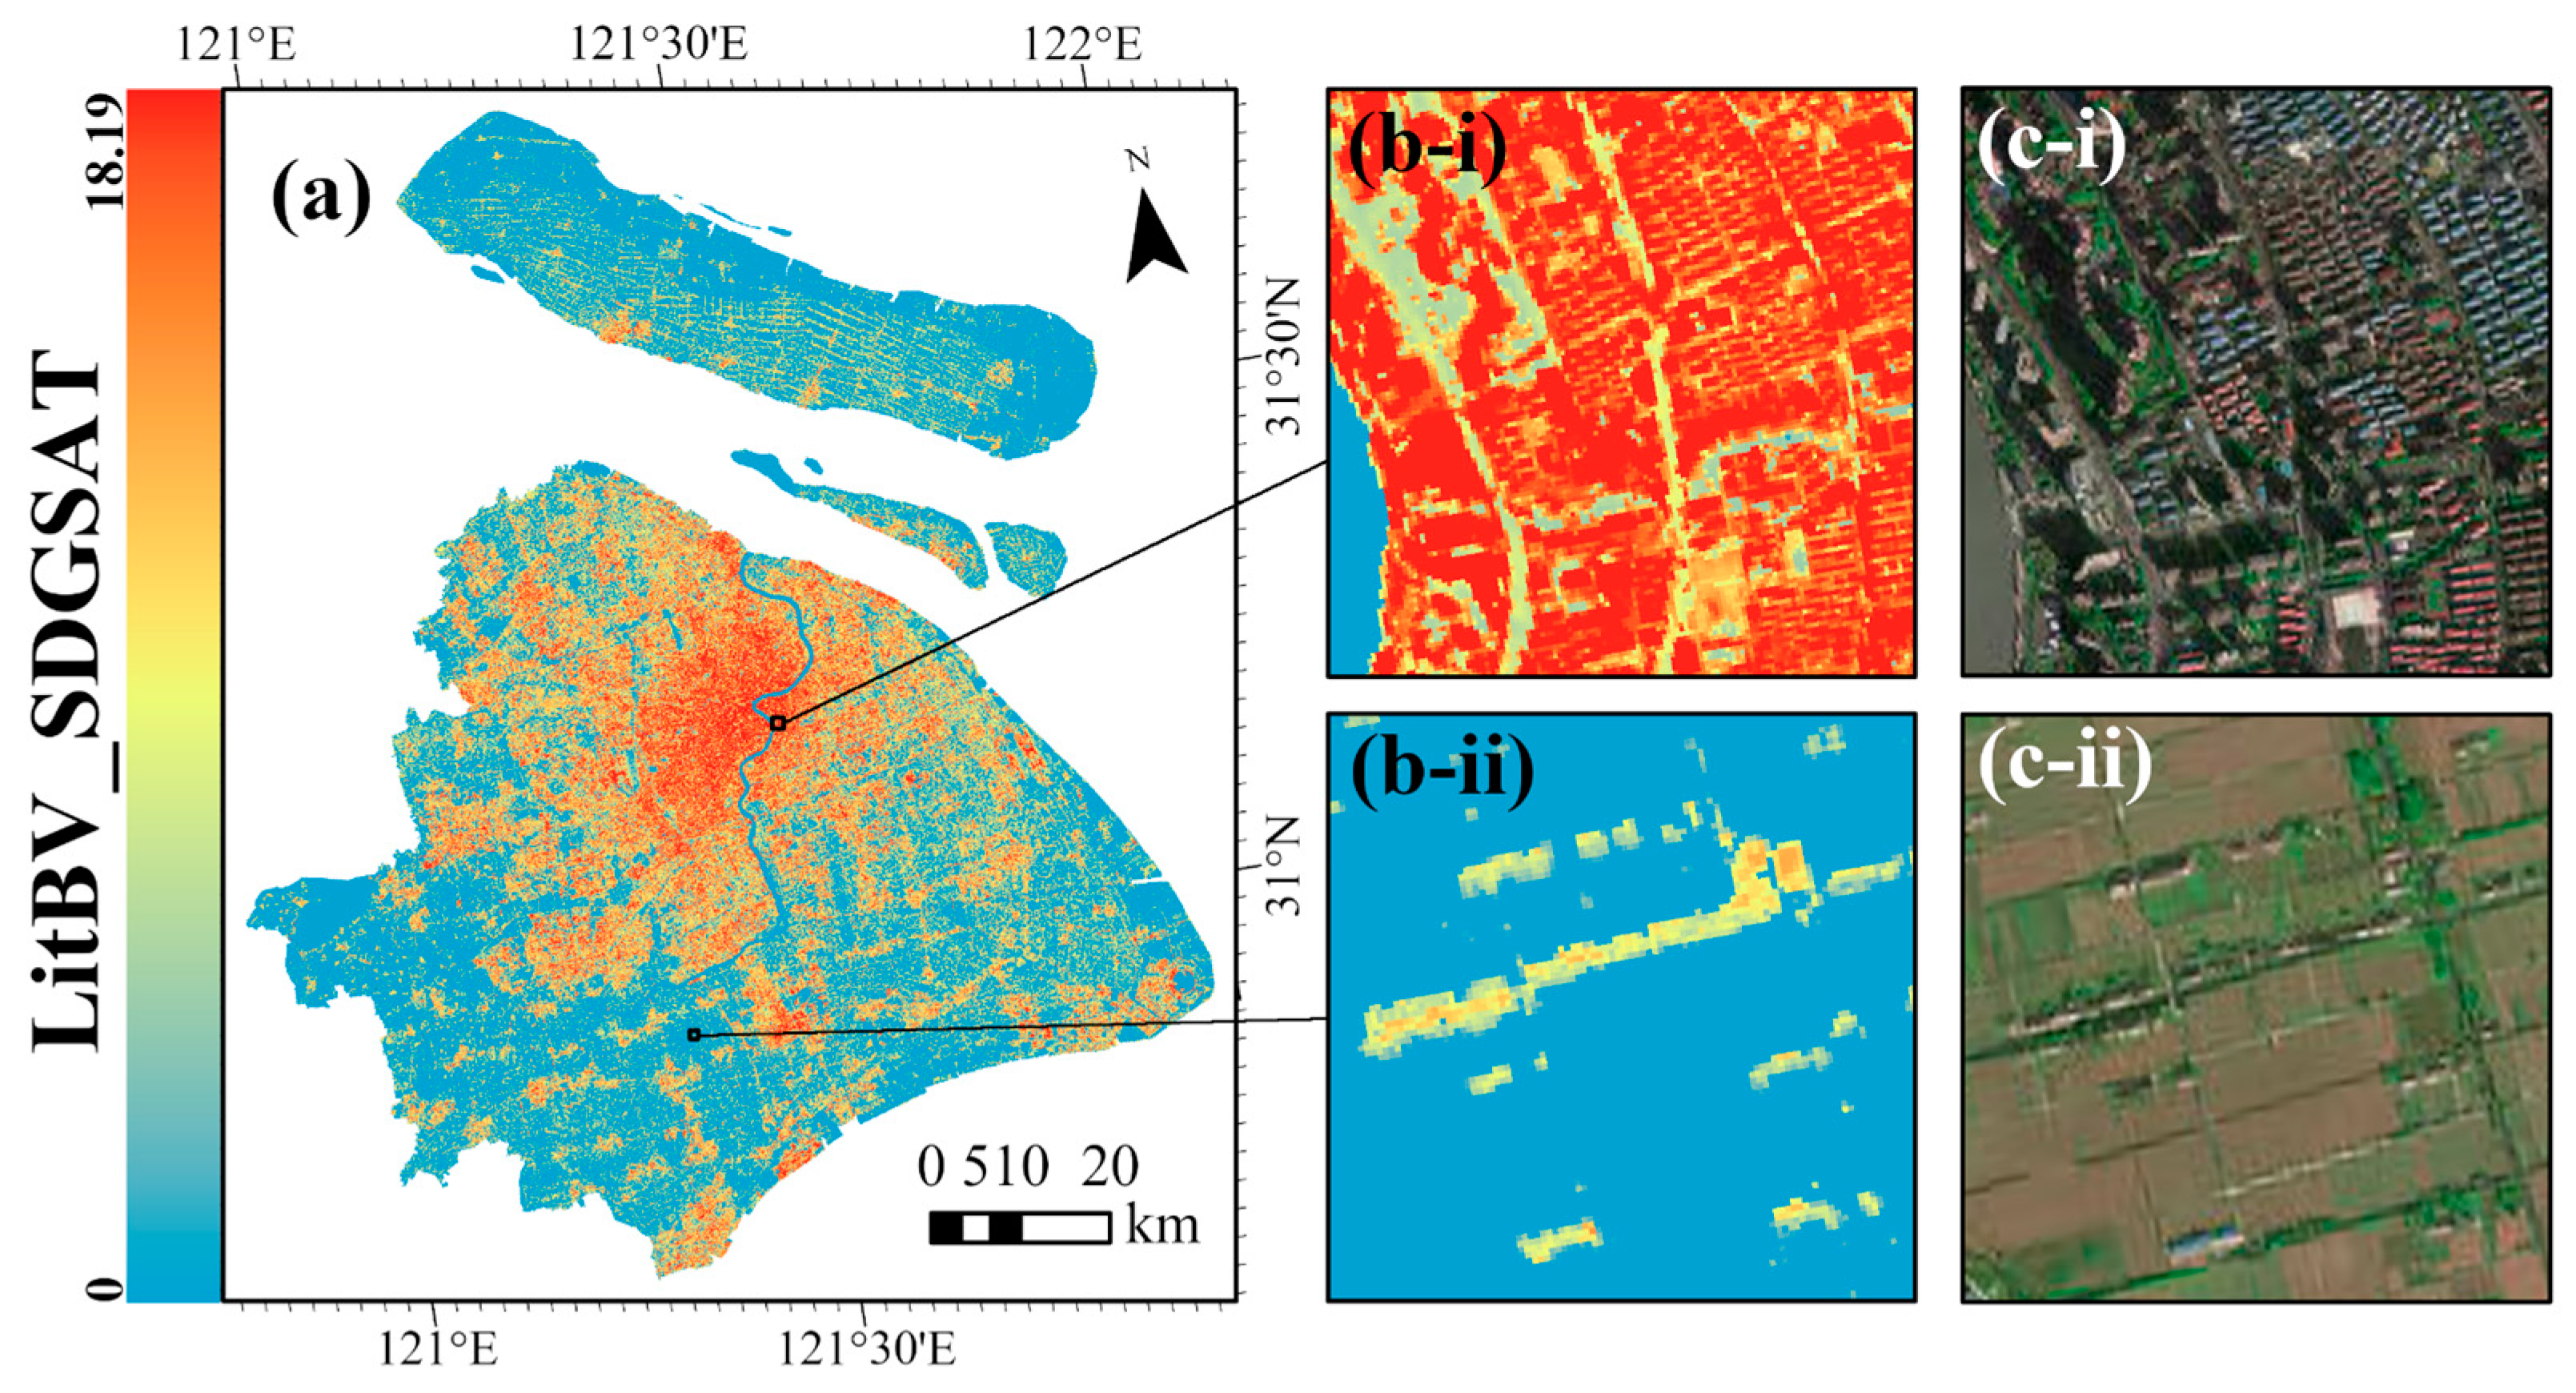
Figure 6 shows the distribution of the LitBV index in the study area. The minimum value of the LitBV index is 0, and the larger the LitBV index, the richer the information volume of NTL intensity and building volume. Areas with lighting and buildings show significantly high values, while areas with non-human activities such as water bodies and farmland show low values. Combined with high-resolution daytime images, it can be seen that the densely built areas in Figure 6(b-i) have a high LitBV index, reflecting rich information about the built environment and human activities. The farmlands in Figure 6(b-ii) have lower LitBV values, but farmhouses and field-hardened roads are still visible in the LitBV index.

4.2. Built-Up Area Extraction Results

According to the downward quantile method, the extraction threshold of urban built-up areas was obtained at 10 m spatial resolution. The built-up area extraction threshold based on the SDGSAT-1 GLI data is 10, the threshold based on the building volume is 466.500, and the threshold based on the LitBV is 2.068. Figure 7 shows the extraction results of urban built-up areas.
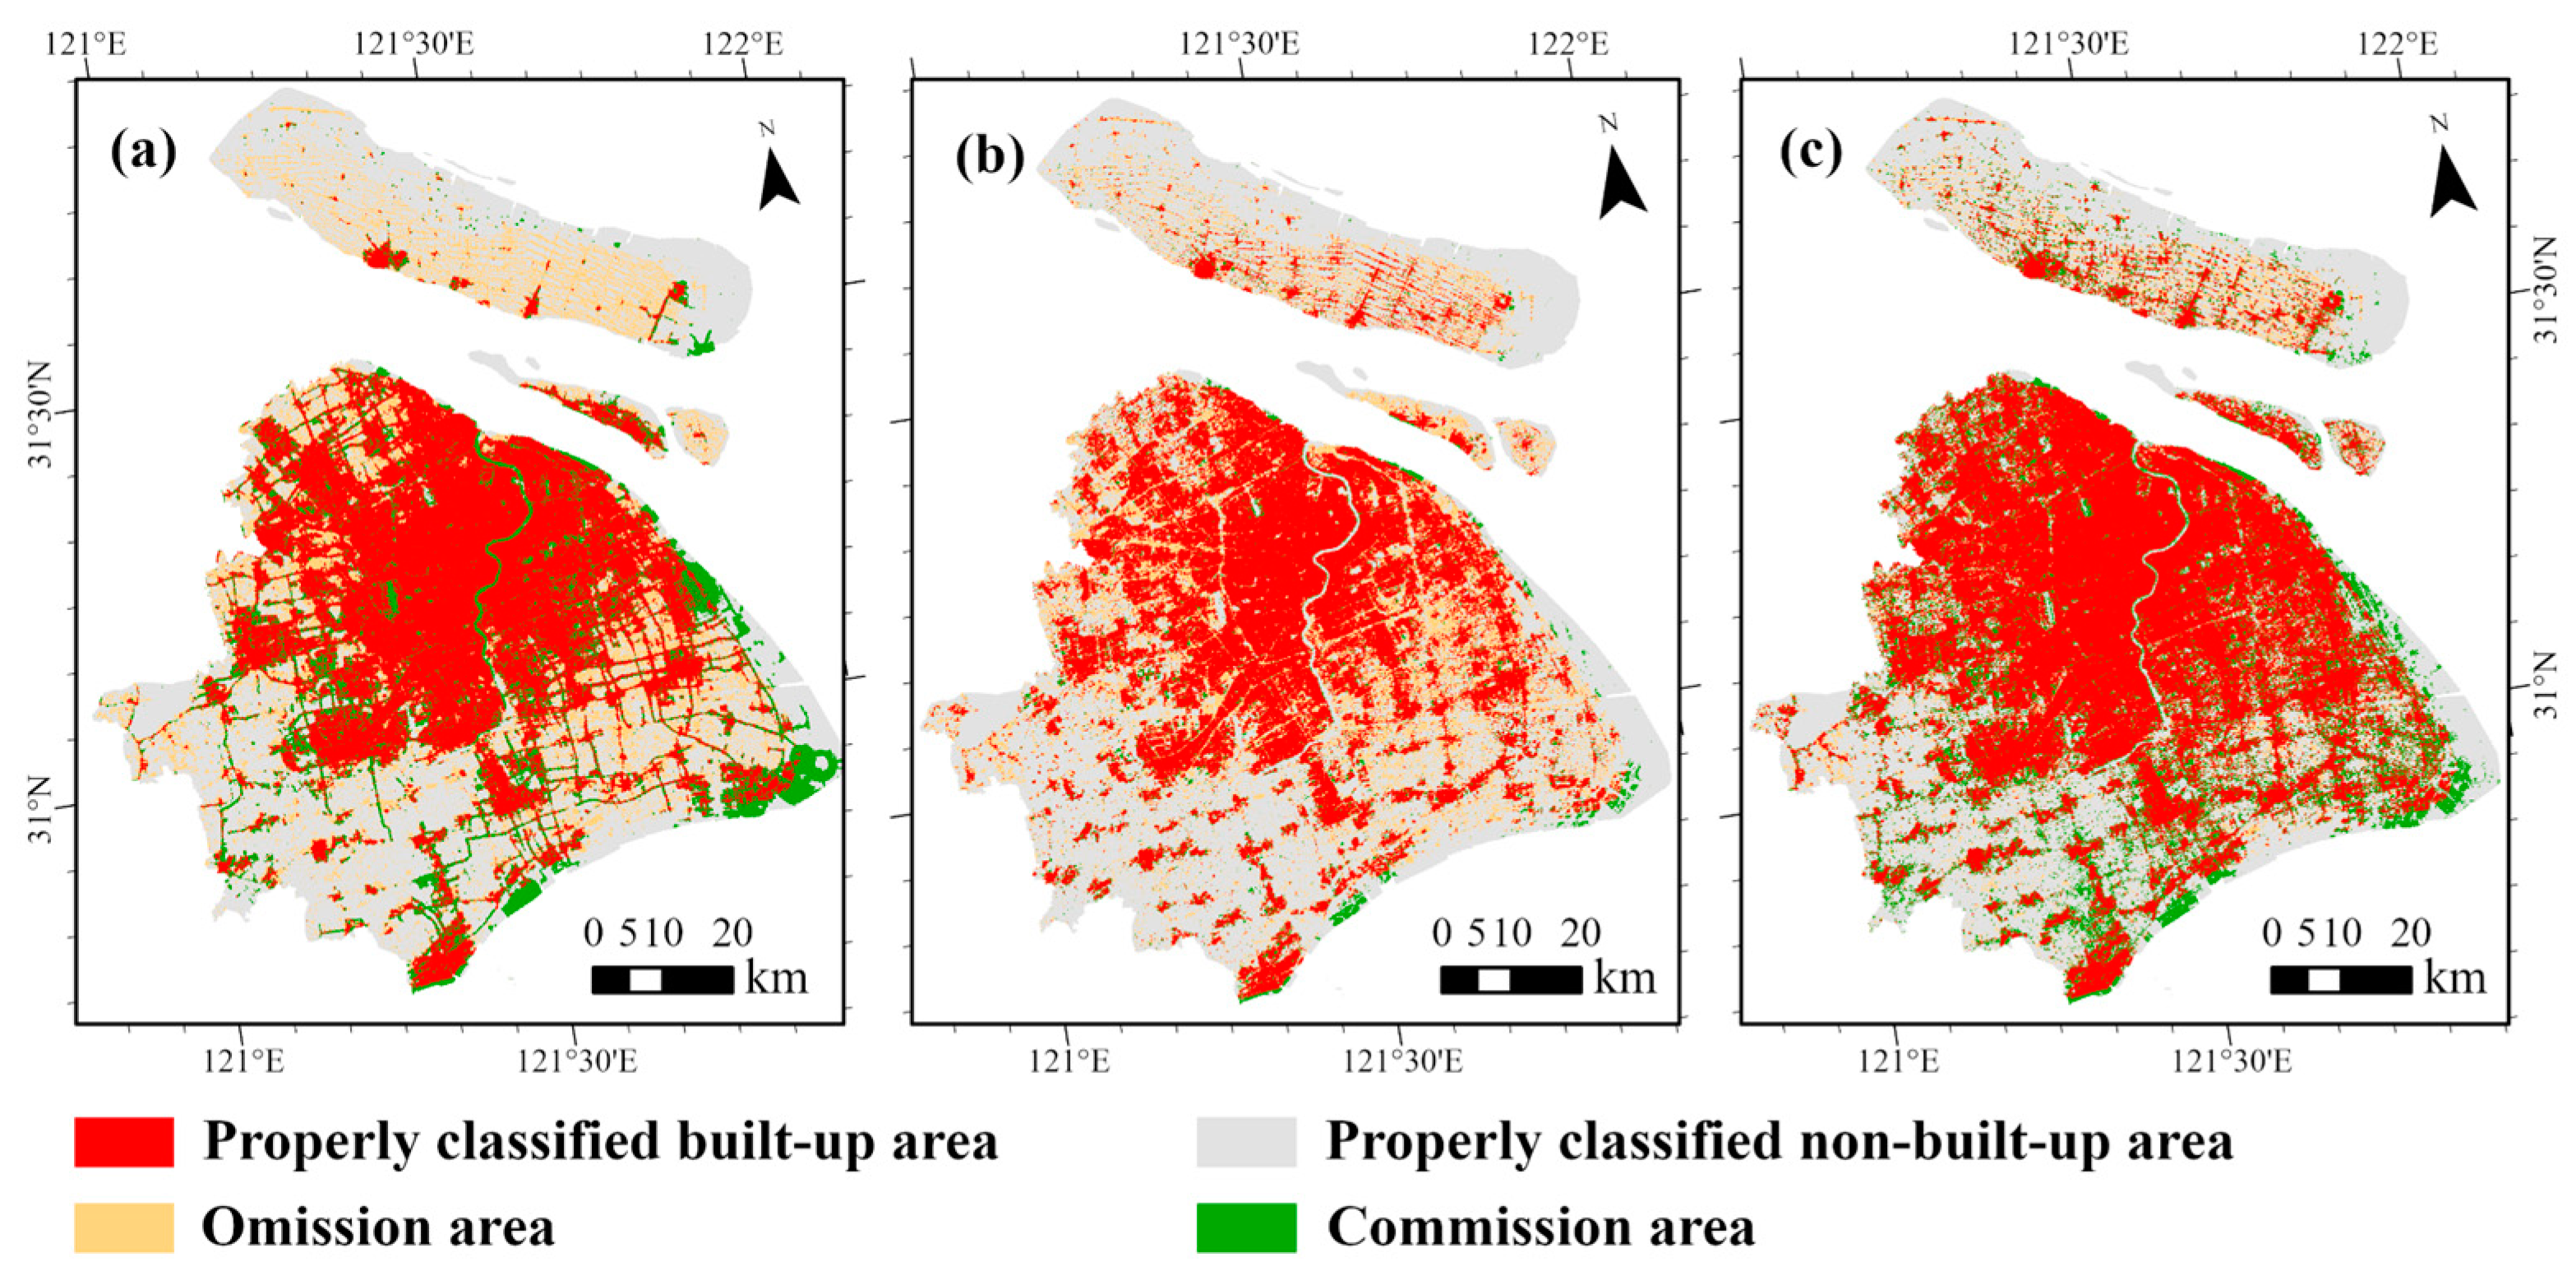
There is obvious blooming phenomenon in the original NTL remote sensing image, which leads to strong NTL intensity in the non-built-up area. Some of the non-built-up areas (green in Figure 7(a-i) is the river) are incorrectly identified as built-up areas. Urban night lighting mainly comes from street lamps [49,50,51], and in residential areas, night lighting is usually very low, which will cause the residential areas that originally belong to the built-up areas to be undetected (Figure 7(a-ii)). The volume of buildings represents the distribution of urban buildings well in the built-up area, and the road is obviously an important part of the built-up area. However, the building volume value of the road tends to 0, resulting in the omission of a large number of roads in the built-up area extraction results based on the building volume (Figure 7b). As can be seen from Figure 7c, the extraction results of built-up areas based on the log-transformed LitBV index can well avoid the commission of non-built-up areas such as rivers, effectively supplement the information of residential areas and roads, and greatly reduce the problems of commission and omission. The extraction results based on the log-transformed LitBV index are more consistent with the real built-up area distribution.
As shown in Table 1, the accuracy of built-up area extraction based on original NTL data and based on building volume is 56.27% and 56.19%, respectively, while the accuracy based on the log-transformed LitBV index can reach 81.25%. The Kappa coefficient of built-up area extraction accuracy based on the LitBV index is also significantly higher than the other two data types, indicating that the extraction results of the built-up area are more consistent with the real built-up area distribution. The AA represents the proportion of the built-up area in the extracted information, i.e., user’s accuracy (UA). The results show that the AA based on the original NTL data is 0.9459, which is comparable to the results of Li et al. [30] (AA is 0.9012, EA is 0.2428). The log-transformed LitBV index-based AA is also over 0.9, with fewer commissions. The EA represents the proportion of real built-up areas that are correctly classified, i.e., producer’s accuracy (PA). The results show that the EA based on the original NTL data and based on building volume is only 0.2799 and 0.3483, respectively, with a large number of omission areas, while the EA based on the log-transformed LitBV index is 0.7481, which greatly alleviates the omission problem.
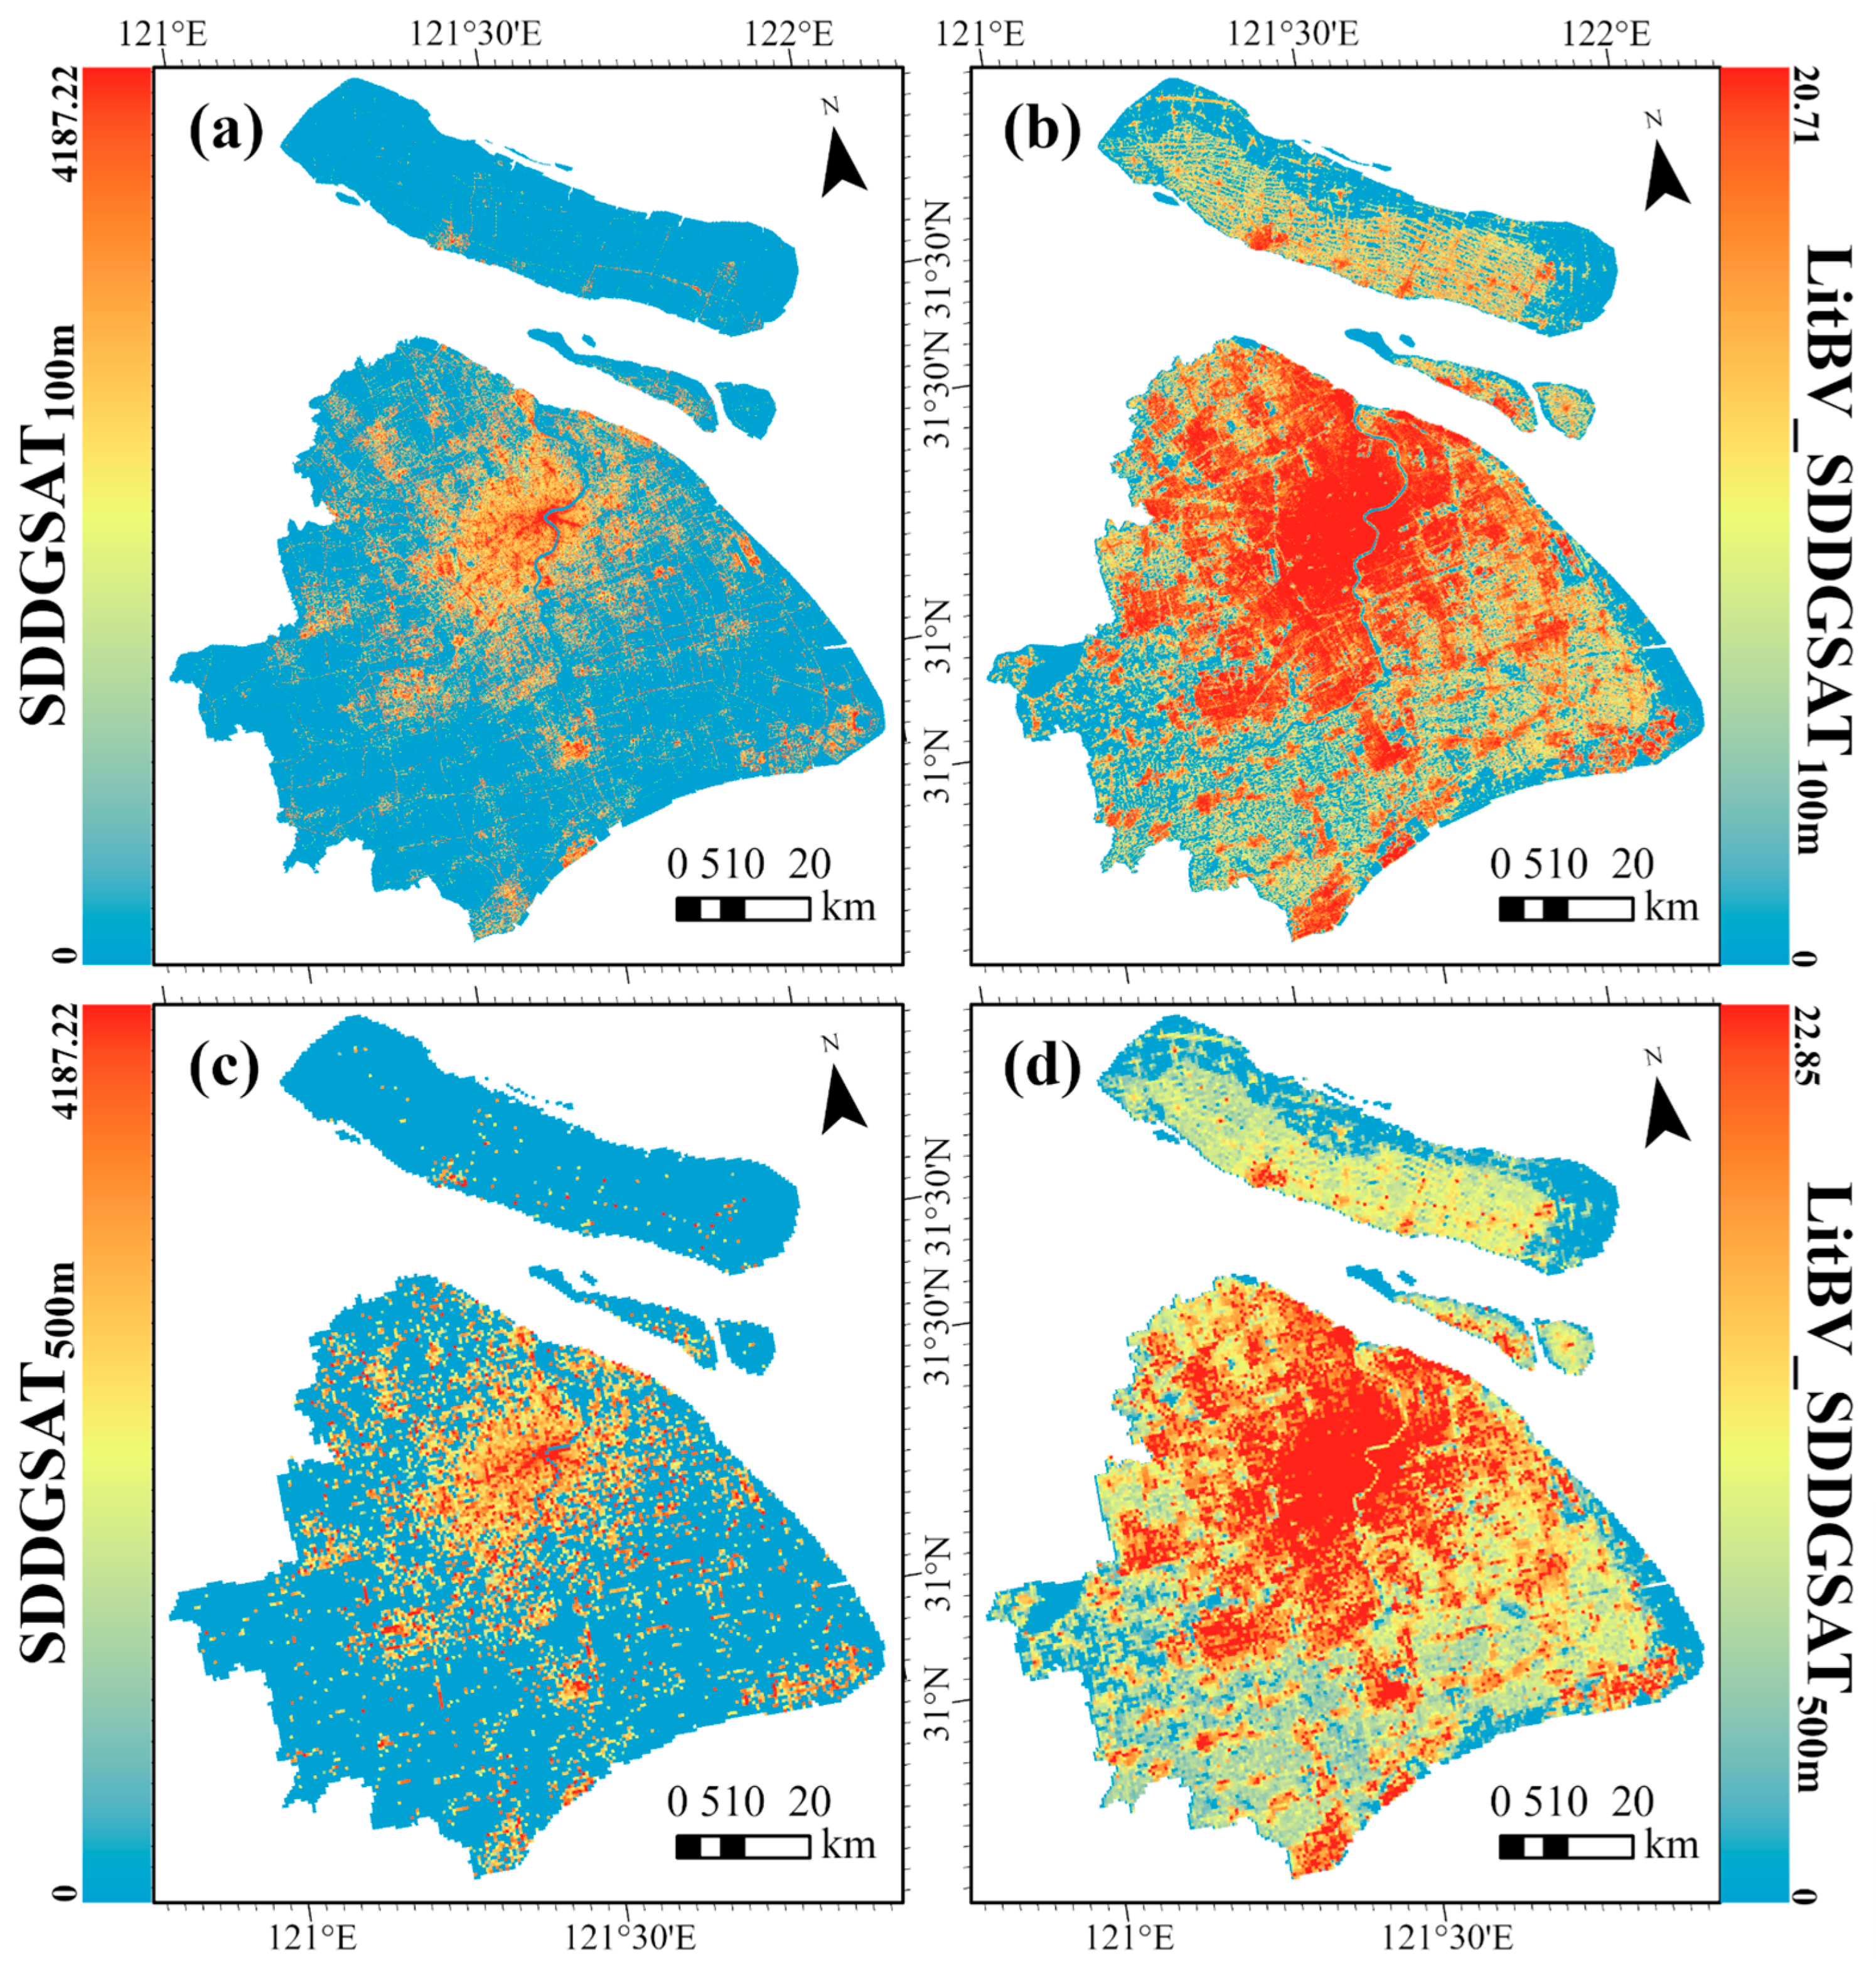
Figure 8 shows the LitBV index based on SDGSAT-1 GLI data resampled to 100 and 500 m, respectively. It can be found that the LitBV index, which incorporates NTL intensity and building volume, has a wider spatial distribution range than the original NTL data at different resolutions. The original NTL data have a large numerical dynamic range between the urban center area and the suburban area, while the LitBV index value distribution is more uniform.
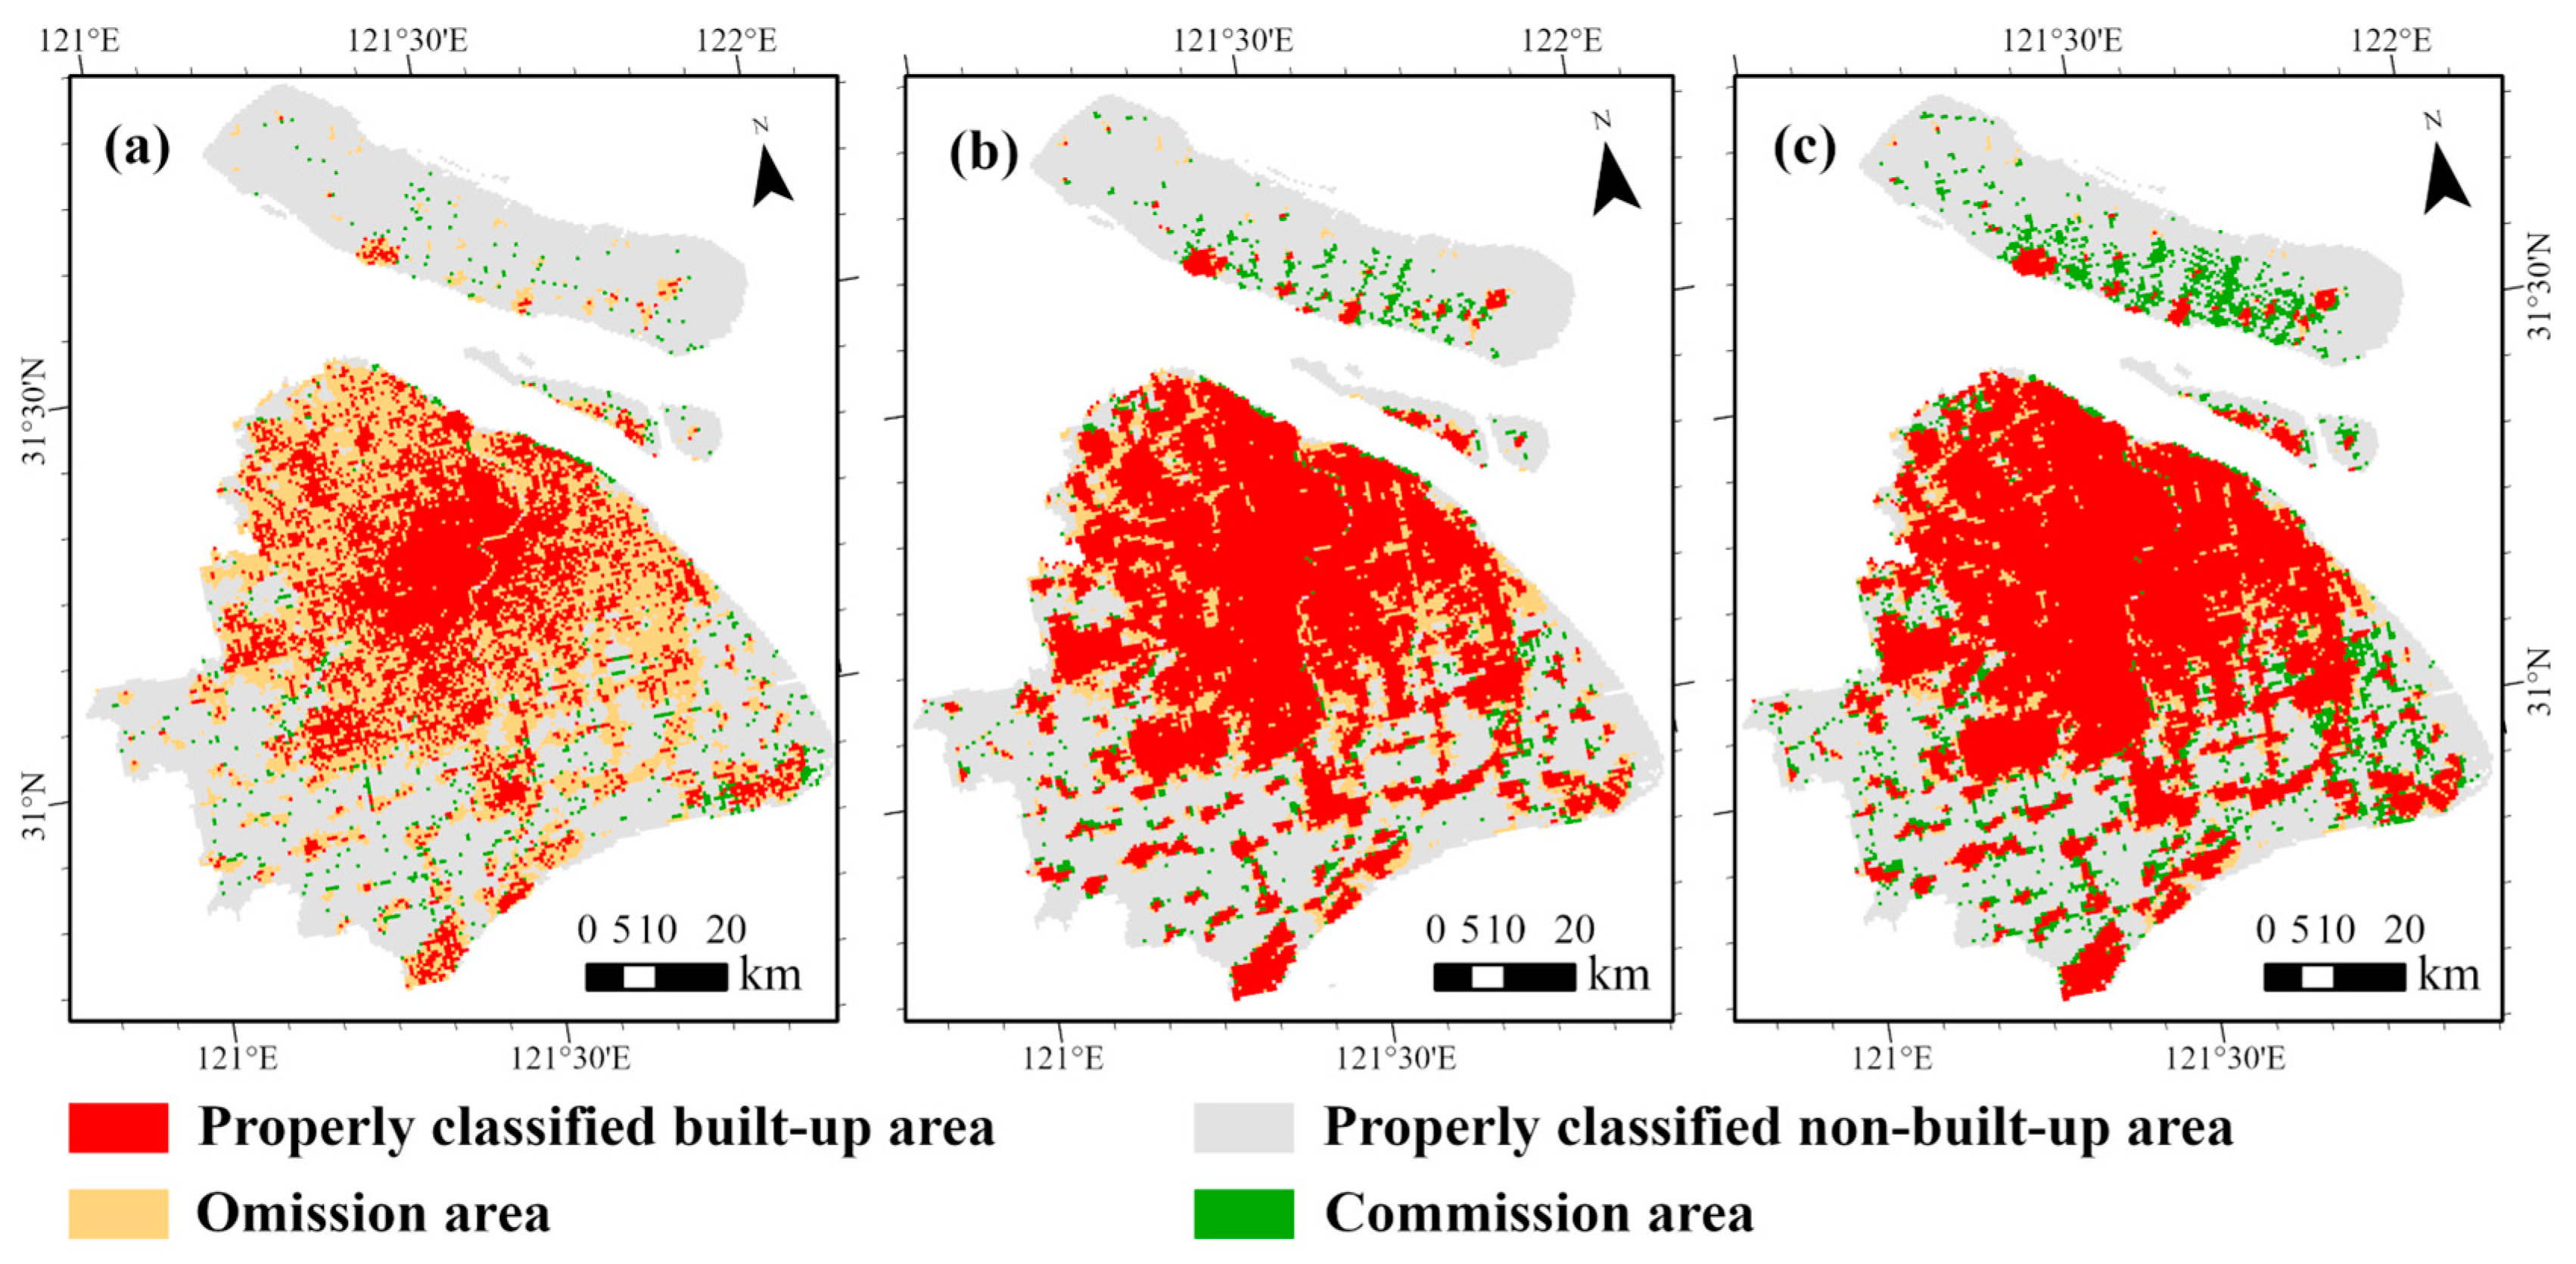
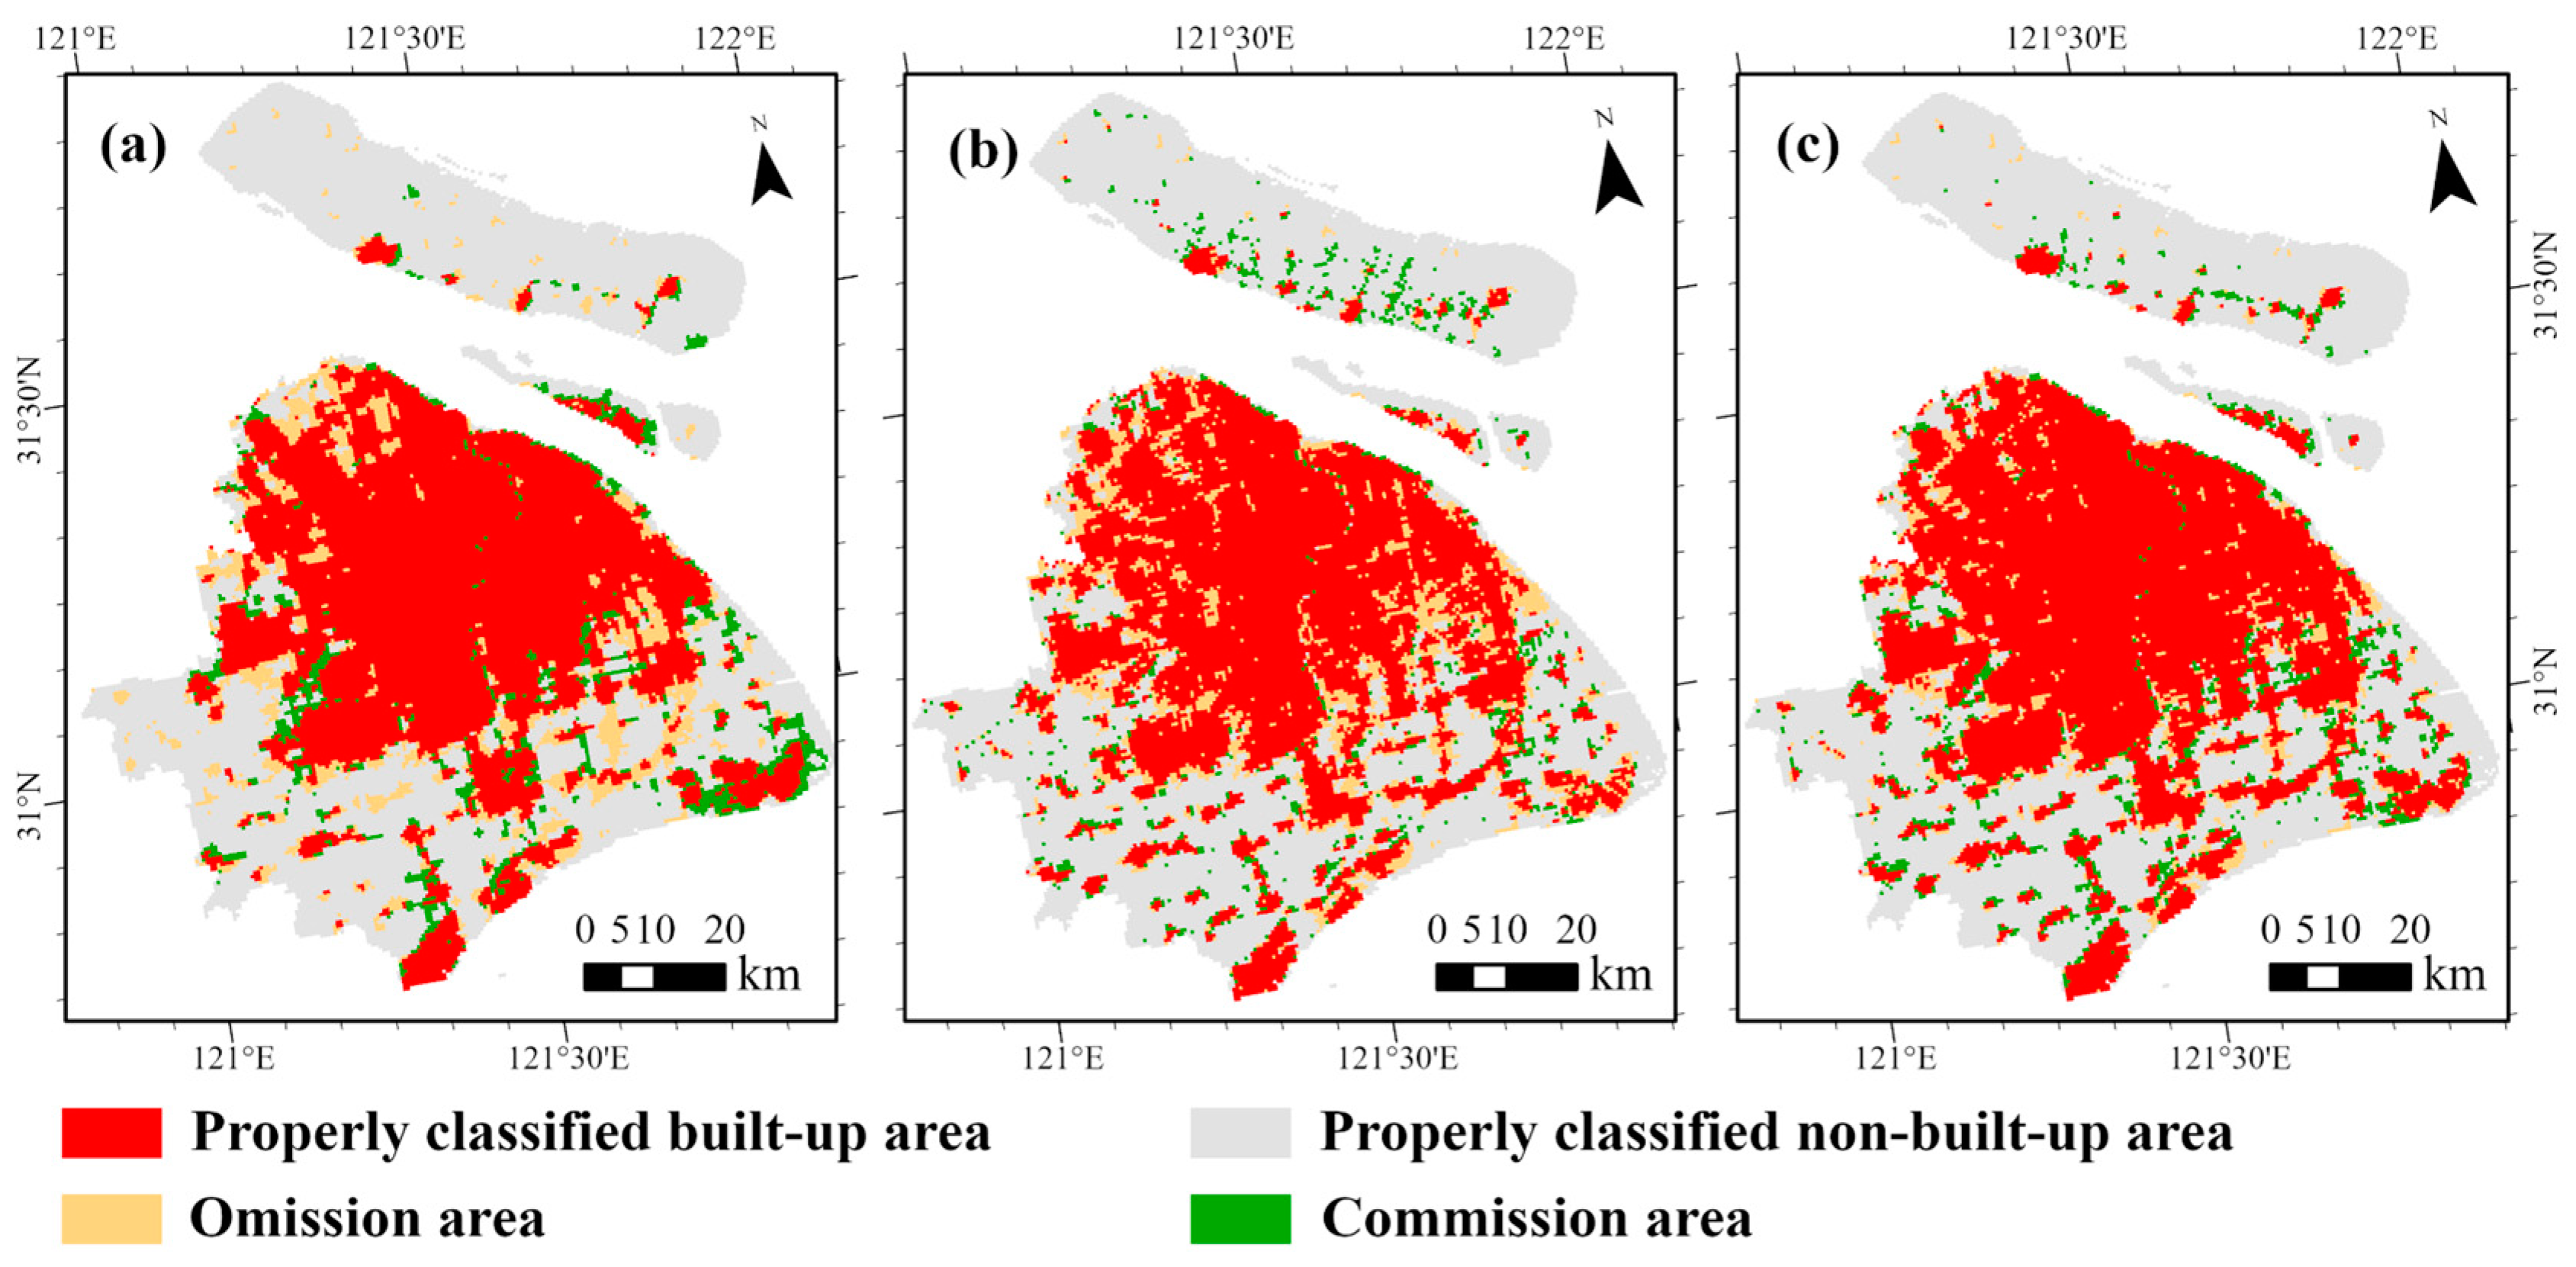
The downward quantile method was used to extract built-up areas at the two resolutions. At the 100 m spatial resolution, the threshold of division based on the original NTL data is 1.102, the threshold based on the building volume is 8225, and the threshold based on the LitBV index is 6.838. At the 500 m spatial resolution, the threshold based on original NTL data is 0.019, the threshold based on building volume is 259,759, and the threshold based on LitBV index is 11.478. Figure 9 and Figure 10 are the extraction results of built-up areas at 100 m spatial resolution and 500 m spatial resolution, respectively. It can be seen that at different spatial resolutions, there are still a large number of omission areas in the extraction results of built-up areas based on the original NTL data (yellow areas in Figure 9a and Figure 10a). In the extraction results of built-up areas based on the LitBV index (Figure 9c and Figure 10c), the area of correctly classified built-up areas was significantly improved. There are a few commission phenomena in the extraction results of built-up areas based on the LitBV index (green areas in Figure 9c and Figure 10c). The commissions mainly occurred in the southeast of Shanghai and Chongming Island in the northeast. In recent years, the urbanization of these two areas has developed rapidly, and the land cover type has changed rapidly. The existing land cover data are based on the annual average status to identify the land cover type, so the current land cover reference data in these rapidly changing regions have a certain uncertainty, resulting in a poor comparative verification effect of the extraction results in this paper. In fact, the construction of buildings and lighting infrastructure usually means that the area has been developed as a built-up area, so the extraction results of the built-up area with the LitBV index integrating building information and night lighting information may be more realistic. In the quantitative evaluation (Table 2 and Table 3), the accuracy of built-up area extraction based on original NTL data is less than 70%, while the accuracy of built-up area extraction based on the LitBV index is more than 80%. Although the AA accuracy of the built-up area extraction results based on original NTL data and building volume is higher, the overall performance of the built-up area extraction results based on the LitBV index is better. Moreover, the extraction accuracy at 500 m spatial resolution is higher than that at 100 m spatial resolution.

5. Discussion

Experiments with different spatial resolutions confirmed the efficacy of the LitBV index in SDGSAT-1 GLI data. What is the applicability of the LitBV index to different types of NTL data? By using the method proposed in this study, LitBV_Luojia and LitBV_BlackMarble (Figure 11) were built, respectively based on Luojia-1 data and Black Marble data. Then, the applicability and effect of LitBV_Luojia and LitBV_BlackMarble in extracting the built-up area were tested.
Using the downward quantile method, the threshold of built-up area division based on Luojia-1 data is 10256, the threshold based on LitBV_Luojia index is 13.627, the threshold based on NASA’s Black Marble data is 162, and the threshold of built-up area division based on LitBV_BlackMarble index is 16.363. Figure 12 and Table 4 show the extraction results of built-up areas based on Luojia-1 data. The results based on the original Luojia-1 data found a lot of commissions, the overall accuracy is only 74.08%, and AA and EA are low. Particularly at airports and coastal industrial areas, unusually high NTL intensity leads to the commission of built-up areas (Figure 12a). There are some omissions in the results based on the building volume, which can be seen as the omission phenomenon caused by the road (Figure 12b), and EA is the lowest, only 0.6308. The extraction results based on the LitBV_Luojia index are optimal (Figure 12c), and the overall accuracy is the highest, reaching 80.33%. Although there are still a small number of commissions, it significantly alleviates the problem of omission, and AA and EA are higher. Figure 13 and Table 5 show the extraction results of built-up area using NASA’s Black Marble data. Table 5 shows that although the overall accuracy of the three kinds of data is similar, the result based on the original Black Marble data still has more commissions and AA is lower. Results based on the building volume have more omissions and lower EA.
All in all, the LitBV index has achieved good results in extracting built-up areas. Especially in the high spatial resolution of SDGSAT-1 GLI data, the LitBV index greatly improves its application capability. At present, the improvement in spatial resolution is an important manifestation of the updating iteration of NTL remote sensing data. The emergence of NTL data with an increasingly fine resolution can provide a very large stage for the application of the LitBV index, and the LitBV index may play a greater role in future applications.

6. Conclusions

This paper proposed a novel LitBV index for the extraction of built-up areas based on NTL data. Through the convenient multiplication and logarithm transformation method, the LitBV index can effectively integrate the city nighttime lighting information from the NTL remote sensing data and the city three-dimensional information from the building volume. Information complementation improved the application performance of NTL remote sensing data.
The LitBV index has achieved remarkable results in the extraction of built-up areas. The accuracy of the built-up area extraction based on the LitBV index is better than the results based on the only NTL data and the results based on the only building volume data. The extraction of built-up areas based on the LitBV index reduces the problem of omission and commission, especially for SDGSAT-1 GLI data with high spatial resolution. Moreover, experiments in our study showed that the LitBV index can improve the extraction accuracy of built-up areas at different resolutions and in different types of data. The LitBV index can provide a significant boost to the refined monitoring of SDGs based on SDGSAT-1 GLI data.

Author Contributions

Conceptualization, B.Y., C.W. and S.L.; methodology, S.L., Z.C., B.W. and J.Z.; validation, S.L. and C.W.; formal analysis, S.L., C.W., Z.C., B.W. and J.Z.; writing—original draft preparation, S.L.; writing—review and editing, B.Y., C.W., Z.C., B.W. and Y.H.; visualization, S.L.; supervision, B.Y. and J.W.; funding acquisition, B.Y., C.W. and Y.H. All authors have read and agreed to the published version of the manuscript.

Funding

This work was supported by the National Natural Science Foundation of China (Grant No. 42371332, 42301530, 42071306), the China Postdoctoral Science Foundation (Grant No. 2022M721149), and the Shanghai Sailing Program (Grant No. 23YF1410000).

Data Availability Statement

Datasets are available on request from the authors.

Acknowledgments

It is acknowledged that the SDGSAT-1 data are kindly provided by the International Research Center of Big Data for Sustainable Development Goals (CBAS). Thanks go to the anonymous reviewers for their valuable comments.

Conflicts of Interest

The authors declare no conflicts of interest.

References

  1. Wigginton, N.S.; Fahrenkamp-Uppenbrink, J.; Wible, B.; Malakoff, D. Cities are the Future. Science 2016, 352, 904–905. [Google Scholar] [CrossRef] [PubMed]
  2. United Nations. World Urbanization Prospects: The 2007 Revision; United Nations: New York, NY, USA, 2007. [Google Scholar]
  3. Defries, R.S.; Bounoua, L.; Collatz, G.J. Human modification of the landscape and surface climate in the next fifty years. Glob. Chang. Biol. 2002, 8, 438–458. [Google Scholar] [CrossRef]
  4. Seto, K.C.; Güneralp, B.; Hutyra, L.R. Global forecasts of urban expansion to 2030 and direct impacts on biodiversity and carbon pools. Proc. Natl. Acad. Sci. USA 2012, 109, 16083–16088. [Google Scholar] [CrossRef] [PubMed]
  5. Cao, Q.; Yu, D.; Georgescu, M.; Wu, J.; Wang, W. Impacts of future urban expansion on summer climate and heat-related human health in eastern China. Environ. Int. 2018, 112, 134–146. [Google Scholar] [CrossRef] [PubMed]
  6. Zhang, D.; Zhou, C.; Xu, W. Spatial-Temporal Characteristics of Primary and Secondary Educational Resources for Relocated Children of Migrant Workers: The Case of Liaoning Province. Complexity 2020, 2020, 7457109. [Google Scholar] [CrossRef]
  7. United Nations. Global Indicator Framework for the Sustainable Development Goals and Targets of the 2030 Agenda for Sustainable Development; United Nations: New York, NY, USA, 2007. [Google Scholar]
  8. Wang, Y.; Huang, C.; Feng, Y.; Zhao, M.; Gu, J. Using Earth Observation for Monitoring SDG 11.3.1-Ratio of Land Consumption Rate to Population Growth Rate in Mainland China. Remote Sens. 2020, 12, 357. [Google Scholar] [CrossRef]
  9. Cai, G.; Zhang, J.; Du, M.; Li, C.; Peng, S. Identification of urban land use efficiency by indicator-SDG 11.3.1. PLoS ONE 2021, 15, e0244318. [Google Scholar] [CrossRef] [PubMed]
  10. Li, X.; Gong, P.; Liang, L. A 30-year (1984–2013) record of annual urban dynamics of Beijing City derived from Landsat data. Remote Sens. Environ. 2015, 166, 78–90. [Google Scholar] [CrossRef]
  11. Zhu, Z.; Zhou, Y.; Seto, K.C.; Stokes, E.C.; Deng, C.; Pickett, S.T.A.; Taubenböck, H. Understanding an urbanizing planet: Strategic directions for remote sensing. Remote Sens. Environ. 2019, 228, 164–182. [Google Scholar] [CrossRef]
  12. Liu, C.; Yang, K.; Bennett, M.M.; Guo, Z.; Cheng, L.; Li, M. Automated Extraction of Built-Up Areas by Fusing VIIRS Nighttime Lights and Landsat-8 Data. Remote Sens. 2019, 11, 1571. [Google Scholar] [CrossRef]
  13. Chen, F.; Wang, N.; Yu, B.; Wang, L. Res2-Unet, a New Deep Architecture for Building Detection from High Spatial Resolution Images. IEEE J. Sel. Top. Appl. Earth Obs. Remote Sens. 2022, 15, 1494–1501. [Google Scholar] [CrossRef]
  14. Yu, B.; Wang, C.; Gong, W.; Chen, Z.; Shi, K.; Wu, B.; Hong, Y.; Li, Q.; Wu, J. Nighttime light remote sensing and urban studies: Data, methods, applications, and prospects. Natl. Remote Sens. Bull. 2021, 25, 342–364. [Google Scholar] [CrossRef]
  15. Zhao, M.; Zhou, Y.; Li, X.; Cao, W.; He, C.; Yu, B.; Li, X.; Elvidge, C.D.; Cheng, W.; Zhou, C. Applications of Satellite Remote Sensing of Nighttime Light Observations: Advances, Challenges, and Perspectives. Remote Sens. 2019, 11, 1971. [Google Scholar] [CrossRef]
  16. Shi, K.; Yu, B.; Huang, Y.; Hu, Y.; Yin, B.; Chen, Z.; Chen, L.; Wu, J. Evaluating the Ability of NPP-VIIRS Nighttime Light Data to Estimate the Gross Domestic Product and the Electric Power Consumption of China at Multiple Scales: A Comparison with DMSP-OLS Data. Remote Sens. 2014, 6, 1705–1724. [Google Scholar] [CrossRef]
  17. Bennett, M.M.; Smith, L.C. Advances in using multitemporal night-time lights satellite imagery to detect, estimate, and monitor socioeconomic dynamics. Remote Sens. Environ. 2017, 192, 176–197. [Google Scholar] [CrossRef]
  18. Chen, Z.; Yu, B.; Song, W.; Liu, H.; Wu, Q.; Shi, K.; Wu, J. A New Approach for Detecting Urban Centers and Their Spatial Structure With Nighttime Light Remote Sensing. IEEE Trans. Geosci. Remote Sens. 2017, 55, 6305–6319. [Google Scholar] [CrossRef]
  19. Gong, P.; Li, X.; Wang, J.; Bai, Y.; Chen, B.; Hu, T.; Liu, X.; Xu, B.; Yang, J.; Zhang, W.; et al. Annual maps of global artificial impervious area (GAIA) between 1985 and 2018. Remote Sens. Environ. 2020, 236, 111510. [Google Scholar] [CrossRef]
  20. Shi, K.; Yu, B.; Zhou, Y.; Chen, Y.; Yang, C.; Chen, Z.; Wu, J. Spatiotemporal variations of CO2 emissions and their impact factors in China: A comparative analysis between the provincial and prefectural levels. Appl. Energy 2019, 233–234, 170–181. [Google Scholar] [CrossRef]
  21. Shi, K.; Chang, Z.; Chen, Z.; Wu, J.; Yu, B. Identifying and evaluating poverty using multisource remote sensing and point of interest (POI) data: A case study of Chongqing, China. J. Clean. Prod. 2020, 255, 120245. [Google Scholar] [CrossRef]
  22. Zhou, Y.; Li, X.; Asrar, G.R.; Smith, S.J.; Imhoff, M. A global record of annual urban dynamics (1992–2013) from nighttime lights. Remote Sens. Environ. 2018, 219, 206–220. [Google Scholar] [CrossRef]
  23. Cao, X.; Chen, J.; Imura, H.; Higashi, O. A SVM-based method to extract urban areas from DMSP-OLS and SPOT VGT data. Remote Sens. Environ. 2009, 113, 2205–2209. [Google Scholar] [CrossRef]
  24. Shi, K.; Huang, C.; Yu, B.; Yin, B.; Huang, Y.; Wu, J. Evaluation of NPP-VIIRS night-time light composite data for extracting built-up urban areas. Remote Sens. Lett. 2014, 5, 358–366. [Google Scholar] [CrossRef]
  25. Imhoff, M.; Lawrence, W.T.; Stutzer, D.C.; Elvidge, C.D. A technique for using composite DMSP/OLS “City Lights” satellite data to map urban area. Remote Sens. Environ. 1997, 61, 361–370. [Google Scholar] [CrossRef]
  26. Liu, Y.; Delahunty, T.; Zhao, N.; Cao, G. These lit areas are undeveloped: Delimiting China’s urban extents from thresholded nighttime light imagery. Int. J. Appl. Earth Obs. Geoinf. 2016, 50, 39–50. [Google Scholar] [CrossRef]
  27. Liu, Z.; He, C.; Zhang, Q.; Huang, Q.; Yang, Y. Extracting the dynamics of urban expansion in China using DMSP-OLS nighttime light data from 1992 to 2008. Landsc. Urban Plan. 2012, 106, 62–72. [Google Scholar] [CrossRef]
  28. Zhao, M.; Zhou, Y.; Li, X.; Cheng, W.; Zhou, C.; Ma, T.; Li, M.; Huang, K. Mapping urban dynamics (1992–2018) in Southeast Asia using consistent nighttime light data from DMSP and VIIRS. Remote Sens. Environ. 2020, 248, 111980. [Google Scholar] [CrossRef]
  29. Guo, H.; Dou, C.; Chen, h.; Liu, J.; Fu, B.; Li, X.; Zou, Z.; Liang, D. SDGSAT-1: The world’s first scientific satellite for sustainable development goals. Sci. Bull. 2022, 68, 34–38. [Google Scholar] [CrossRef] [PubMed]
  30. Li, C.; Chen, F.; Wang, N.; Yu, B.; Wang, L. SDGSAT-1 nighttime light data improve village-scale built-up delineation. Remote Sens. Environ. 2023, 297, 113764. [Google Scholar] [CrossRef]
  31. Sutton, P.C.; Roberts, D.; Elvidge, C.D.; Meji, H. A Comparison of Nighttime Satellite Imagery and Population Density for the Continental United States. Photogramm. Eng. Remote Sens. 1997, 63, 1303–1313. [Google Scholar]
  32. Zhu, X.; Tan, X.; Liao, M.; Liu, T.; Su, M.; Zhao, S.; Xu, Y.N.; Liu, X. Assessment of a New Fine-Resolution Nighttime Light Imagery From the Yangwang-1 (“Look up 1”) Satellite. IEEE Geosci. Remote Sens. Lett. 2022, 19, 650520. [Google Scholar] [CrossRef]
  33. Tan, X.; Chen, R.; Zhu, X.; Li, X.; Chen, J.; Wong, M.S.; Xu, S.; Xu, Y.N. Spatial heterogeneity of uncertainties in daily satellite nighttime light time series. Int. J. Appl. Earth Obs. Geoinf. 2023, 123, 103484. [Google Scholar] [CrossRef]
  34. Wang, C.; Qin, H.; Zhao, K.; Dong, P.; Yang, X.; Zhou, G.; Xi, X. Assessing the Impact of the Built-Up Environment on Nighttime Lights in China. Remote Sens. 2019, 11, 1712. [Google Scholar] [CrossRef]
  35. Wu, B.; Yang, C.; Chen, Z.; Wu, Q.; Yu, S.; Wang, C.; Li, Q.; Wu, J.; Yu, B. The Relationship Between Urban 2-D/3-D Landscape Pattern and Nighttime Light Intensity. IEEE J. Sel. Top. Appl. Earth Obs. Remote Sens. 2022, 15, 478–489. [Google Scholar] [CrossRef]
  36. Shi, L.; Foody, G.M.; Boyd, D.S.; Girindram, R.; Wang, L.; Du, Y.; Ling, F. Night-time lights are more strongly related to urban building volume than to urban area. Remote Sens. Lett. 2020, 11, 29–36. [Google Scholar] [CrossRef]
  37. Wu, B.; Yang, C.; Wu, Q.; Wang, C.; Wu, J.; Yu, B. A building volume adjusted nighttime light index for characterizing the relationship between urban population and nighttime light intensity. Comput. Environ. Urban Syst. 2023, 99, 101911. [Google Scholar] [CrossRef]
  38. Wu, B.; Huang, H.; Wang, Y.; Shi, S.; Wu, J.; Yu, B. Global spatial patterns between nighttime light intensity and urban building morphology. Int. J. Appl. Earth Obs. Geoinf. 2023, 124, 103495. [Google Scholar] [CrossRef]
  39. Chen, H.; Wu, B.; Yu, B.; Chen, Z.; Wu, Q.; Lian, T.; Wang, C.; Li, Q.; Wu, J. A New Method for Building-Level Population Estimation by Integrating LiDAR, Nighttime Light, and POI Data. J. Remote Sens. 2021, 2021, 9803796. [Google Scholar] [CrossRef]
  40. Li, K.; Chen, Y. Chen A Genetic Algorithm-Based Urban Cluster Automatic Threshold Method by Combining VIIRS DNB, NDVI, and NDBI to Monitor Urbanization. Remote Sens. 2018, 10, 277. [Google Scholar] [CrossRef]
  41. Liu, Y.; Long, T.; Jiao, W.; Du, Y.; He, G.; Chen, B.; Huang, P. Automatic segment-wise restoration for wide irregular stripe noise in SDGSAT-1 multispectral data using side-slither data. Egypt. J. Remote Sens. Space Sci. 2023, 26, 747–757. [Google Scholar] [CrossRef]
  42. Liu, Y.; Long, T.; Jiao, W.; Chen, B.; Cheng, B.; Du, Y.; He, G.; Huang, P. Leveraging “Night–Day” Calibration Data to Correct Stripe Noise and Vignetting in SDGSAT-1 Nighttime-Light Images. IEEE Trans. Geosci. Remote Sens. 2023, 61, 5616923. [Google Scholar] [CrossRef]
  43. Zhang, D.; Cheng, B.; Shi, L.; Gao, J.; Long, T.; Chen, B.; Wang, G. A Destriping Algorithm for SDGSAT-1 Nighttime Light Images Based on Anomaly Detection and Spectral Similarity Restoration. Remote Sens. 2022, 14, 5544. [Google Scholar] [CrossRef]
  44. Liu, S.; Wang, C.; Chen, Z.; Li, W.; Zhang, L.; Wu, B.; Huang, Y.; Li, Y.; Ni, J.; Wu, J.; et al. Efficacy of the SDGSAT-1 glimmer imagery in measuring sustainable development goal indicators 7.1.1, 11.5.2, and target 7.3. Remote Sens. Environ. 2024, 305, 114079. [Google Scholar] [CrossRef]
  45. Li, Z.; He, W.; Cheng, m.; Hu, J.; Yang, G.; Zhang, H. SinoLC-1: The first 1 m resolution national-scale land-cover map of China created with a deep learning framework and open-access data. Earth Syst. Sci. Data 2023, 15, 4749–4780. [Google Scholar] [CrossRef]
  46. Zhao, N.; Liu, Y.; Cao, G.; Samson, E.; Zhang, J. Forecasting China’s GDP at the pixel level using nighttime lights time series and population images. GIScience Remote Sens. 2017, 54, 407–425. [Google Scholar] [CrossRef]
  47. Eberenz, S.; Stocker, D.; Röösli, T.; Bresch, D.N. Asset exposure data for global physical risk assessment. Earth Syst. Sci. Data 2020, 12, 817–833. [Google Scholar] [CrossRef]
  48. Yu, B.; Tang, M.; Wu, Q.; Yang, C.; Deng, S.; Shi, K.; Peng, C.; Wu, J.; Chen, Z. Urban Built-Up Area Extraction from Log- Transformed NPP-VIIRS Nighttime Light Composite Data. IEEE Geosci. Remote Sens. Lett. 2018, 15, 1279–1283. [Google Scholar] [CrossRef]
  49. Liu, S.; Wang, C.; Chen, Z.; Li, Q.; Wu, Q.; Li, Y.; Wu, J.; Yu, B. Enhancing nighttime light remote Sensing: Introducing the nighttime light background value (NLBV) for urban applications. Int. J. Appl. Earth Obs. Geoinf. 2024, 126, 103626. [Google Scholar] [CrossRef]
  50. Gaston, K.J.; Bennie, J. Demographic effects of artificial nighttime lighting on animal populations. Environ. Rev. 2014, 22, 323–330. [Google Scholar] [CrossRef]
  51. Li, X.; Ma, R.; Zhang, Q.; Li, D.; Liu, S.; He, T.; Zhao, L. Anisotropic characteristic of artificial light at night—Systematic investigation with VIIRS DNB multi-temporal observations. Remote Sens. Environ. 2019, 233, 111357. [Google Scholar] [CrossRef]
Figure 1. NTL intensity of SDGSAT-1 GLI data and nDSM height of Shanghai. (a) SDGSAT-1 GLI data; (b) nDSM data; (a-i) and (b-i) locally enlarged images.
Remotesensing 16 02278 g001
Figure 2. The flowchart of this study.
Remotesensing 16 02278 g002
Figure 3. A conceptual model of quantile-based approach in a potential urban cluster for urban- (a) and rural (b)-dominated potential clusters. The blue curve is the quantile curve of the LitBV index value, and the red line is the reference line. Turning points (G) are identified locations (quantile level at Q with a threshold of DN value at D) with the maximum gap between these two lines (Zhou et al. [22]).
Remotesensing 16 02278 g003
Figure 4. Downward heuristic rules of mapping different urban clusters (Li et al. [30]). The downward quantile method excludes pixels with LitBV index values higher than threshold D, first eliminating urban and suburban areas (D1), then rural areas (D2). The urban built-up areas can be divided after the rural areas are eliminated.
Remotesensing 16 02278 g004
Figure 5. Spatial distribution pattern of NTL intensity from SDGSAT-1 GLI and building volume. The natural breakpoint method was used to divide the NTL intensity of SDGSAT-1 GLI and the building volume into three levels. Black to yellow indicates that the NTL intensity was from low to high, and black to blue indicates that the building volume was from small to large. (a) Spatial distribution of NTL intensity from SDGSAT-1 GLI and building volume in Shanghai; (b) locally enlarged image in commercial area; (c) locally enlarged image in airport.
Remotesensing 16 02278 g005
Figure 6. (a) The distribution of LitBV index in Shanghai; (b) locally enlarged image of LitBV index in (i) urban area and (ii) suburban area; (c) high resolution daytime remote sensing image in (i) urban area and (ii) suburban area.
Remotesensing 16 02278 g006
Figure 7. Built-up area extraction results. (a) Extraction results based on SDGSAT-1 GLI data, locally enlarged image in (i) urban area and (ii) suburban area; (b) extraction results based on building volume, locally enlarged image in (i) urban area and (ii) suburban area; (c) extraction results based on LitBV index, locally enlarged image in (i) urban area and (ii) suburban area.
Remotesensing 16 02278 g007
Figure 8. LitBV index at different resolutions. (a) SDGSAT-1 GLI data at 100 m spatial resolution; (b) LitBV index based on SDGSAT-1 GLI data at 100 m spatial resolution; (c) SDGSAT-1 GLI data at 500 m spatial resolution; (d) LitBV index based on SDGSAT-1 GLI data at 500 m spatial resolution.
Remotesensing 16 02278 g008
Figure 9. Built-up area extraction results at 100 m spatial resolution. (a) Extraction results based on SDGSAT-1 GLI data; (b) extraction results based on building volume; (c) extraction results based on LitBV index.
Remotesensing 16 02278 g009
Figure 10. Built-up area extraction results at 500 m spatial resolution. (a) Extraction results based on SDGSAT-1 GLI data; (b) extraction results based on building volume; (c) extraction results based on LitBV index.
Remotesensing 16 02278 g010
Figure 11. LitBV index based on different data. (a) Luojia-1 data; (b) LitBV index based on Luojia-1 data; (c) NASA’s Black Marble data; (d) LitBV index based on NASA’s Black Marble data.
Remotesensing 16 02278 g011
Figure 12. (a) Built-up area extraction results based on Luojia-1 data; (b) extraction results based on building volume; (c) extraction results based on LitBV_Luojia index.
Remotesensing 16 02278 g012
Figure 13. (a) Built-up area extraction results based on NASA’s Black Marble data; (b) extraction results based on building volume; (c) extraction results based on LitBV_BlackMarble index.
Remotesensing 16 02278 g013
Table 1. The accuracy of the results of built-up area extraction (pixels).
Extraction Result
SDGSAT-1 GLIBuilding VolumeLitBV
BANon-BABANon-BABANon-BA
Reference dataBA11,256,91028,964,03614,009,12626,211,82030,077,58210,129,476
Non-BA644,11226,845,1463,451,11524,038,1432,559,92524,893,245
Overall accuracy56.27%56.19%81.25%
Kappa0.22050.19700.6274
AA0.94590.80230.9216
EA0.27990.34830.7481
BA: built-up area, Non-BA: non-built-up area.
Table 2. The accuracy of the results of built-up area extraction at 100 m spatial resolution.
Extraction Result
SDGSAT100mBuilding Volume100mLitBV_SDGSAT100m
BANon-BABANon-BABANon-BA
Reference dataBA127,681214,780215,771126,268303,10239,359
Non-BA26,174309,02421,282314,33893,686241,512
Overall accuracy64.44%78.23%80.37%
Kappa0.29300.56580.6066
AA0.82990.91020.7639
EA0.37280.63080.8851
BA: built-up area, Non-BA: non-built-up area.
Table 3. The accuracy of the results of built-up area extraction at 500 m spatial resolution.
Extraction Result
SDGSAT500mBuilding Volume500mLitBV_SDGSAT500m
BANon-BABANon-BABANon-BA
Reference dataBA5893777010,71599411,8541809
Non-BA67812,754301212,374224911,183
Overall accuracy68.82%85.21%85.02%
Kappa0.37910.70480.7004
AA0.89680.78060.8405
EA0.43130.91510.8676
BA: built-up area, Non-BA: non-built-up area.
Table 4. The accuracy of the results of built-up area extraction based on Luojia-1 data.
Extraction Result
Luojia-1 DataBuilding VolumeLitBV_Luojia
BANon-BABANon-BABANon-BA
Reference dataBA237,240105,232215,771126,268297,24745,325
Non-BA71,053264,13421,282314,33888,059247,584
Overall accuracy74.08%78.23%80.33%
Kappa0.48020.56580.6061
AA0.76950.91020.7715
EA0.69270.63080.8677
BA: built-up area, Non-BA: non-built-up area.
Table 5. The accuracy of the results of built-up area extraction based on NASA’s Black Marble data.
Extraction Result
BlackMarble DataBuilding VolumeLitBV_BlackMarble
BANon-BABANon-BABANon-BA
Reference dataBA10,691297610,71599411,9401727
Non-BA142212,029295212,457126712,184
Overall accuracy85.26%85.45%88.96%
Kappa0.67590.70930.7792
AA0.88260.78400.9041
EA0.78220.91510.8736
BA: built-up area, Non-BA: non-built-up area.
Disclaimer/Publisher’s Note: The statements, opinions and data contained in all publications are solely those of the individual author(s) and contributor(s) and not of MDPI and/or the editor(s). MDPI and/or the editor(s) disclaim responsibility for any injury to people or property resulting from any ideas, methods, instructions or products referred to in the content.