Abstract
Global Navigation Satellite System (GNSS) signals experience delays when passing through the atmosphere due to the presence of free electrons in the ionosphere and air density in the non-ionized part of the atmosphere, known as the troposphere. The Precise Point Positioning (PPP) technique demonstrates highly accurate positioning along with Zenith Tropospheric Delay (ZTD) estimation. ZTD estimation is valuable for various applications including climate modelling and determining atmospheric water vapor. Current GNSS network resolutions are not completely sufficient for the scale of a few kilometres that regional climate and weather models are increasingly adopting. The Centipede-RTK network is a low-cost option for increasing the spatial resolution of tropospheric monitoring. This study is motivated by the question of whether low-cost GNSS networks can provide a viable alternative without compromising data quality or precision. This study compares the performance of the low-cost Centipede-RTK network in calculating the Zenith Tropospheric Delay (ZTD) to that of the existing EUREF Permanent Network (EPN), using two alternative software packages, RTKLIB demo5 version and CSRS-PPP version 3, to ensure robustness and software independence in the findings. This investigation indicated that the ZTD estimations from both networks are almost identical when processed by the CSRS-PPP software, with the highest mean difference being less than 3.5 cm, confirming that networks such as Centipede-RTK could be a reliable option for dense precise atmospheric monitoring. Furthermore, this study revealed that the Centipede-RTK network, when processed using CSRS-PPP, provides ZTD estimations that are very similar and consistent with the EUREF ZTD product values. These findings suggest that low-cost GNSS networks like Centipede-RTK are viable for enhancing network density, thus improving the spatial resolution of tropospheric monitoring and potentially enriching climate modelling and weather prediction capabilities, paving the way for broader application and research in GNSS meteorology.
1. Introduction
Global Navigation Satellite Systems (GNSSs) have made significant advances in geodetic research, providing precise measurements of the Earth’s surface. GNSS technologies play an important role in atmospheric science through GNSS meteorology, which analyzes GNSS signals to derive atmospheric data using the extensive global network of GNSS stations that were originally established for geodetic research purposes. This greatly improves our understanding of the troposphere’s spatial and temporal variations [1]. Current GNSS networks, such as the International GNSS Service (IGS) [2] and the EUREF Permanent Network (EPN) [3], support various scientific efforts, such as the maintenance of reference systems [4] and the monitoring of atmospheric delays [1]. However, achieving a higher density of stations, which is required to estimate more detailed atmospheric dynamics, is constrained by significant financial barriers. Deploying and maintaining GNSS stations involves significantly high costs, ranging from $10,000 to $25,000 for each piece of geodetic GNSS equipment (receiver and antenna) on a regular and uniform network, substantially limiting network expansion [5]. In response to these challenges, the development of low-cost GNSS network systems is a promising step forward. The Centipede-RTK network (https://centipede.fr, accessed on 15 June 2024) exemplifies this innovation by demonstrating how low-cost GNSS solutions can enable a dense network of stations for more detailed and dense observations. This cooperative approach not only aims to significantly enhance the density and coverage of the global GNSS network to improve the bias estimation towards the goal of reaching precise positioning, but it also emphasizes innovation’s critical role in propelling the fields of GNSS meteorology and atmospheric science.
The potential of low-cost devices has gained prominence in GNSS research due to their proven feasibility, accuracy, and practical applications. Low-cost GNSS receivers have been shown to perform as well as high-end geodetic-grade receivers, providing precise results for both kinematic and static positioning [6]. Furthermore, research into the significant advantages of low-cost dual-frequency receivers has demonstrated their effectiveness in improving the precision of GNSS applications. This is particularly true for applications that use Precise Point Positioning (PPP) to estimate tropospheric delays. Such improvements in accuracy are critical for precise measurements of atmospheric water vapor, and represent a significant advancement in the field of GNSS meteorology [7]. Further research into this field, including detailed case studies, has shed light on these low-cost receivers’ ability to monitor atmospheric water vapor variations and accurately estimate the Zenith Total Delay (ZTD), despite the limitations imposed by antenna performance. These investigations point to the promising potential of low-cost receivers in roles requiring high precision, such as numerical weather prediction, despite their inherent challenges [8]. In addition, GNSS technology has been recognized as one of the few methods capable of functioning as a reliable atmospheric water vapor sensor. This capability is attributed to a vast global network of stations outfitted with high-quality GNSS receivers and antennas that provide continuous, precise, and dependable atmospheric data [6,9]. Recent studies comparing the performance of low-cost and geodetic-grade GNSS receivers have shown that low-cost devices can provide high precision in both kinematic and static positioning, emphasizing the importance of these less expensive options in atmospheric science and meteorology [10]. Moreover, previous studies have investigated the Centipede-RTK network’s application in a variety of research activities, including water vapor monitoring over specific areas [11], precision agriculture [12], hydrographic purposes [13], and as a preliminary Continuous Operating Reference Station (CORS) network [14] to determine the precision of positioning solutions in common areas. This network was additionally examined for its performance in mountainous locations, where accurate estimates of atmospheric delays are critical even with geodetic-grade receivers [15].
Building on previously discussed challenges and potential solutions, this study directly addresses the critical issue of insufficient GNSS network density, which is exacerbated by the prohibitively expensive deployment of high-cost geodetic receivers. Despite the fact that there are many permanent GNSS stations around the world, including over 2000 in Europe, the spatial resolution for tropospheric observation is still limited to 20 to 100 km. This resolution is inadequate for the scale of a few kilometers that regional climate and weather models are increasingly adopting. Recognizing the critical need for denser networks to improve atmospheric monitoring capabilities, our research is motivated by the question of whether low-cost GNSS networks can provide a viable alternative without sacrificing data quality or precision. This research conducts a comparative analysis of ZTD estimates derived from two different GNSS networks: the innovative, low-cost, open-sourced Centipede-RTK network and the traditional, high-cost EUREF network. The nearest station from each of the two networks has been selected using a five-week dataset so that each network has five stations total for a thorough comparison. This approach facilitates a focused evaluation of the spatial and temporal variability of the ZTDs captured by both networks, providing critical insights into the Centipede-RTK network’s relative effectiveness for atmospheric studies. In order to evaluate the influence of processing software on the outcomes of our investigation, we utilized two distinct open-source solutions: the RTKLIB software package and the web-based service CSRS-PPP (Canadian Spatial Reference System precise point positioning service). This dual-software strategy highlights the robustness of this study by ensuring that our findings are resilient and independent of software variances.
This work aims to contribute to atmospheric science by investigating how low-cost GNSS networks, such as Centipede-RTK, can improve the spatial resolution of tropospheric monitoring. The densification of GNSS networks has made it possible to understand better the dispersion of water vapor, which could result in more precise predictions of rainfall and extreme weather occurrences. This could provide important new information for researchers studying climate change. This study highlights the value of low-cost GNSS options in addressing the present gaps in atmospheric monitoring and modelling capabilities, in addition to attempting to test their feasibility against high-cost alternatives like the EUREF network.
Tropospheric Delay
GNSS signals experience delays when passing through the atmosphere due to the presence of free electrons in the ionosphere and air density in the non-ionized part of the atmosphere, known as the troposphere. The troposphere’s influence on GNSS signals is quantified through the concept of refractivity. The refractive index, n, or the total refractivity, N, of the troposphere can be quantified as:
This total refractivity, N, can be divided into two primary components: the hydrostatic or dry component () and the wet component (), attributed to dry gases and water vapor, respectively [16]. These components are functions of meteorological variables such as air pressure (p), temperature (T), and water vapor partial pressure (e) [17]:
where coefficients , , and are empirically derived values, listed below [18]:
- .
- .
- .
The delay caused by the troposphere to the signal can be calculated as an integral of the total refractivity N along the propagation path w from the receiver r to the satellite s:
Furthermore, the tropospheric delay is composed of hydrostatic and wet components, hence the equation for can be separated into
The total tropospheric delay in the slant path delay can be mapped to the zenith direction, resulting in the Zenith Tropospheric Delay (ZTD), which is the sum of the Zenith Hydrostatic Delay (ZHD) and the Zenith Wet Delay (ZWD), as outlined in the following equation:
where and represent the hydrostatic and wet mapping functions dependent on the elevation angle, and represents higher-order terms such as the horizontal gradients. is determined by integrating N in the zenith direction [18]:
This demonstrates the relationship between the Zenith Tropospheric Delay and the troposphere’s refractivity, which varies along the signal’s path with meteorological conditions.
2. Materials and Methods
The PPP technique has been implemented using two separate software packages with different configurations. One is the open-source RTKLIB post-processing software package (available at https://www.rtklib.com/, accessed on 15 June 2024), providing an interactive and configurable analysis experience, while the other is the Canadian Spatial Reference System (CSRS-PPP), a powerful online service (https://webapp.csrs-scrs.nrcan-rncan.gc.ca/geod/tools-outils/ppp.php, accessed on 15 June 2024) that closely matches the International GNSS Service’s ZTD values (within a 1 cm difference) [19]. Table 1 summarizes the main characteristics of the software and online services used in this study.

Table 1.
Comparison of capabilities of the software packages used in this study.
RTKLIB is an open-source software package for standard and precise GNSS positioning initially developed by Takasu and Yasuda [20]. All the settings are set through the software via its graphical user interface. Several studies have shown that ZTD estimates derived from ionosphere-free (IF) PPP have a comparable standard deviation with those obtained from relative positioning based on double-differenced observations with resolved ambiguities [7,21,22]. The PPP algorithm can determine the troposphere’s parameters. PPP utilizes both pseudorange and carrier phase GNSS observation data from a single dual-frequency receiver. PPP uses the ionospheric-free linear combination to eliminate ionosphere biases. The ionosphere-free linear combination can be described as follows [23]:
where and are the multipath errors due to linear combination, while and are the noise errors caused by linear combination. To eliminate satellite orbital () and clock errors (), precise orbit and clock corrections are required. As a result, PPP can be simplified into the following:
where and are the hydrostatic and wet mapping functions, respectively, represents the Zenith Hydrostatic Delay, and represents the Zenith Wet Delay. PPP mainly estimates four types of parameters: the receiver position (), the receiver clock (), the Zenith Total Delay (), and the ambiguities on both frequencies ( and ). The mapping function in terms of the elevation angle and the azimuth angle between the satellite and the receiver is calculated as
and the tropospheric delay is calculated as
where is the tropospheric Zenith Total Delay in meters. This parameter is estimated from the Extended Kalman Filter [24] together with the north component of the tropospheric gradient () and the east component of the tropospheric gradient (). (El) and (El) are the hydrostatic and wet mapping function, respectively. is the tropospheric Zenith Hydrostatic Delay in meters, which is given by the Saastamoinen model (Equation (14)) with the zenith angle z = 0 and relative humidity .
where
- z is the zenith angle (rad) as .
- p is the total pressure (hPa).
- T is the absolute temperature (K) of the air.
- h is the geodetic height above MSL (mean sea level).
- e is the partial pressure (hPa) of water vapor.
For the mapping function, the RTKLIB demo5 version uses the Niell Mapping Function (NMF) ( https://www.rtklib.com/, accessed on 15 June 2024), which depends only on the site coordinates and day of the year. A summary of the capabilities of the software used for this study is shown in Table 1.
The CSRS-PPP service was launched in 2003. It allows GNSS users to collect data in the field and upload these data to Natural Resources Canada (NRCan) servers (more details can be found https://webapp.csrs-scrs.nrcan-rncan.gc.ca/geod/tools-outils/ppp.php, accessed on 15 June 2024). In CSRS-PPP, ZTD estimations are performed using a backward smoothing replacement, with the final covered satellite ambiguity parameters retained constant throughout all the epochs. This method is used to obtain the best station Zenith path delay time series based on all the observations throughout the observation session. The mapping function utilized in CSRS-PPP is the Global Mapping Function (GMF), which, unlike NMF (used by RTKLIB), is derived from a numerical weather model. As previously said, a summary of the capabilities of the software used for this study is also shown in Table 1.
To investigate the reliability of ZTD estimates from low-cost GNSS networks, data were collected from two distinct networks: the Centipede-RTK network and the EUREF network (https://epncb.oma.be/, accessed on 15 May 2024), to conduct a comparative analysis between low-cost and high-cost GNSS networks.
The Centipede Network represents a newer generation of GNSS networks that use low-cost GNSS receivers and offer open-source services, which is particularly appealing in this regard. The network consists of around 700 GNSS CORSs built by public institutions, individuals, and business operators worldwide. The GNSS station density varies due to volunteer activities, resulting in incomplete coverage. Most of the CORSs operate in France, with some operating in other countries (Figure 1). The Institut national de la recherche agronomique (INRAE) provides financial assistance for the project, which has benefited from resources provided by research institutes, government agencies, and private firms since it started in 2019.
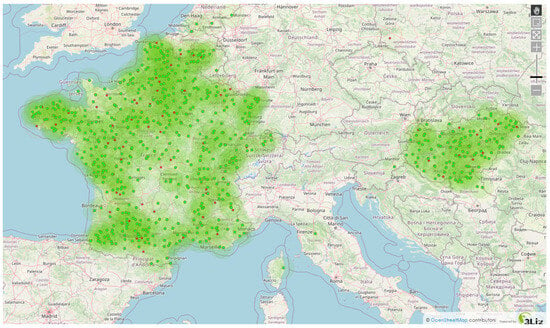
Figure 1.
CentipedeRTK GNSS network map (https://centipede.fr/index.php/view/map/?repository=cent&project=centipede, accessed on 15 June 2024).
The EUREF Permanent GNSS Network consists of a CORS network, data centres providing access to the station data, analysis centres that analyze the GNSS data, product centres or coordinators that generate the EPN products, and a central bureau that is responsible for the daily monitoring and management of the EPN. It is composed of about 420 GNSS CORSs (Figure 2), and all contributions to the EPN are provided on a voluntary basis, with more than 100 European agencies/universities involved. The EPN operates under well-defined international standards and guidelines ( https://epncb.oma.be/_documentation/guidelines/, accessed on 15 May 2024), which are subscribed to by its contributors. These guidelines guarantee the long-term quality of the EPN products, including the ZTD estimation.
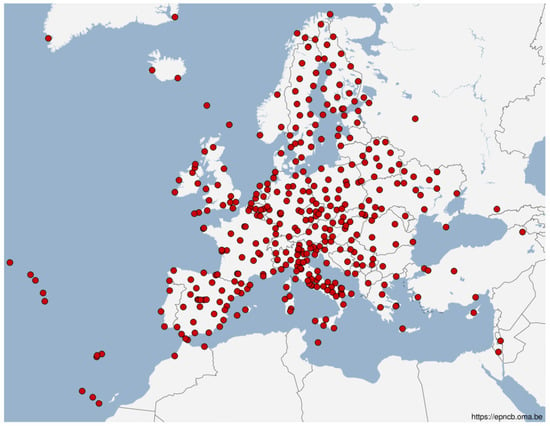
Figure 2.
EUREF GNSS network map (https://www.epncb.oma.be/_networkdata/stationmaps.php, accessed on 15 May 2024).
In this study, five stations were carefully chosen from the low-cost Centipede-RTK network across France, with a parallel selection of the nearest corresponding stations from the permanent EUREF GNSS Network to facilitate a comprehensive comparative analysis. A summary of these stations can be found in Table 2. Furthermore, Table 3 presents five pairs of stations from both networks, which are mentioned in Table 2, emphasizing the distance and elevation disparities between each pair.

Table 2.
Summary of stations chosen from Centipede-RTK and EUREF Network.

Table 3.
Paired stations from Centipede-RTK and EUREF Networks with distance and height difference.
These stations have been selected in order to represent a variety of environmental situations, ensuring comprehensive coverage of both geographic and atmospheric conditions, as shown in Figure 3.
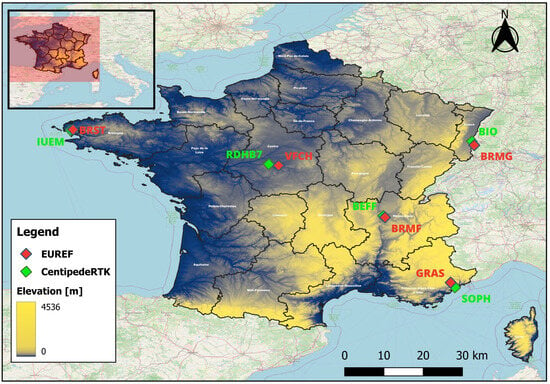
Figure 3.
Chosen stations from 2 distinct networks (Study area).
In the Alpes-Maritimes, the Centipede-RTK network’s SOPH station and its EUREF counterpart, GRAS, have been selected as representative CORSs in areas where the tropospheric delays can vary due to the Mediterranean Sea and alpine geography. Furthermore, the BRMF and BEFF stations are strategically located near Lyon in the urbanized alpine area of Auvergne–Rhône-Alpes to investigate urban atmospheric effects. Along Germany’s eastern border, the BRMG and BIO stations on the Upper Rhine Plain provide a steady atmospheric backdrop for consistent GNSS signal analysis. In the Centre region, specifically Villefranche-sur-Cher, the VFCH and RDHB7 stations are noted for their low urban effect and proximity to rivers, which are critical for investigating interactions between surface water bodies and the atmosphere. The BRST and IUEM stations on the western Brittany coast have been selected because they are located in areas noted for their warm temperatures, high humidity, and heavy precipitation, they round out the geographic broadness, and they contribute to this study’s analysis of environmental impacts on ZTD data.
Among the five station pairs chosen, the height difference between SOPH and GRAS is significantly greater than the other four pairs (Table 3). The height difference between SOPH and GRAS is 1140.50 m, which is substantial enough to affect the accuracy of the ZTD estimates. The ZTD is impacted by atmospheric conditions that change with elevation. To ensure that ZTD values obtained from stations at significantly different elevations are similar, it is necessary to account for these height discrepancies. Without such modifications, inconsistencies can bring mistakes into the analysis, reducing the precision of the results. In order to make the results comparable, height correction using a / height dependency model has been applied. In particular, the hydrostatic delay decreases approximately linearly with height, as written in Equation (15):
where H is the scale height of the hydrostatic component, typically around 8 km. Then, the wet component () is more variable but can also be approximated as in Equation (16):
where is the scale height of the wet component, typically around 2 km. Thus, given , it is possible to calculate the new (Equation (17)) as the sum of the (Equation (15)) and (Equation (16)) at height h.
This correction takes into account the variations in atmospheric pressure and water vapor content that occur with changes in elevation, which can otherwise introduce significant errors into the analysis. By applying this model, we can normalize the ZTD values across stations at different elevations, thereby enhancing the precision and reliability of our results. This process ensures that the derived ZTD values are consistent and accurate, regardless of the height differences between the stations.
GNSS data from the EUREF Network and the Centipede-RTK Network were streamed for this investigation using Networked Transport of RTCM of Internet Protocol (NTRIP). This protocol allows for the broadcast of GNSS data over the internet while supporting a variety of user platforms. For the EUREF Network, NTRIP client credentials were obtained via contacting the Italian Space Agency (ASI) broadcaster, which has been operating the EUREF NTRIP broadcaster since 2009. Credentials for the Centipede-RTK Network were set up using the access information provided on the Centipede-RTK website. All data streams were managed using the STRSVR (Stream-to-Server) tool within the RTKLIB software package. To evaluate the temporal variability of Zenith Tropospheric Delay, GNSS data from neighboring stations in the EUREF and Centipede Networks were collected simultaneously over a 24 h period at each study location. To reliably identify ZTD trends, the data sample frequency is set to 1 Hz, with recordings taking place every 30 s over weeks 8 to 12 of 2024. In this way, it has been possible to perform a comparison of ZTD estimations and temporal patterns across both networks, providing a more complete knowledge of the ZTD’s temporal dynamics.
3. Results
This study explored a scientific question about the quality and reliability of tropospheric estimations obtained by low-cost GNSS networks, assessing their potential as alternatives to existing, high-cost networks. As a result, RTKLIB and CSRS-PPP were used to estimate the ZTD from data collected from five Centipede Network sites and corresponding EUREF Network stations in various geographical locations over five weeks, in order to assess the temporal and spatial viability. We focused our investigation on data acquired from weeks of the year (WOY) 8 to 12 of 2024. Each week’s dataset includes data from Monday to Friday. This choice was made due to technical challenges with the computer’s power supply and internet connection over the weekend, resulting in data gaps. To maintain the integrity and continuity of our datasets, we omitted weekends and only used data collected during the week. The two software tools were used not to compare RTKLIB with CSRS-PPP, but rather to ensure that the analyses made and the obtained results are independent of the software used.
Prior to doing the statistical analysis, we constructed ZTD time series plots to facilitate comparison visualization, assisting in the detection of variations and patterns in the ZTD variability for the Centipede Network. Subsequently, a statistical comparison of the ZTD was performed to examine the quality and reliability of the tropospheric estimations made by the Centipede-RTK (low-cost), assessing their potential as replacements to the existing, high-cost network.
3.1. ZTD Time Series
The ZTD estimations were plotted against time to produce the ZTD time series. Each time series figure includes ZTD data from the two GNSS network stations, processed using RTKLIB and CSRS-PPP software solutions. We developed a comparative framework by evaluating the temporal trends in the ZTD variability offered by the two networks. These plots help to detect differences and patterns in the ZTD variability for the Centipede Network, allowing for a better understanding of the estimation processes and their respective accuracies. The two continuous lines represent the results obtained from the RTKLIB software, while the dashed ones represent those from CSRS-PPP, where the red colour represents the Centipede stations and the blue represents the EUREF ones. Both for the BRMG-BIO (Figure 4) and BRMF-BEFF (Figure 5) pairs, the ZTD estimations obtained from the CSRS-PPP software are more smoothed and reliable than those obtained from RTKLIB, which provides unacceptable and unreliable estimations over the whole period. The results are similar on some days, but the trends are quite different.
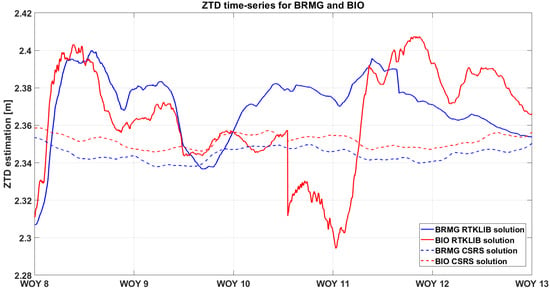
Figure 4.
ZTD time series for BRMG vs BIO for weeks of the year (WOY) 8 to 12.
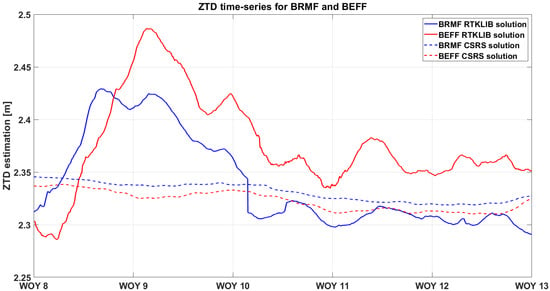
Figure 5.
ZTD time series for BRMF vs BEFF for weeks of the year (WOY) 8 to 12.
3.2. Statistical Comparison
The comparison of the derived ZTD estimates from the stations within both networks over five randomly selected weeks was processed by two separate software types, RTKLIB and CSRS-PPP, and plotted independently for each pair of stations. During the first phase, the ZTD estimations were processed with RTKLIB and CSRS-PPP. The findings were then plotted separately for each pair of stations to make a clear visual comparison. The example plot (Figure 6) illustrates this comparative analysis.
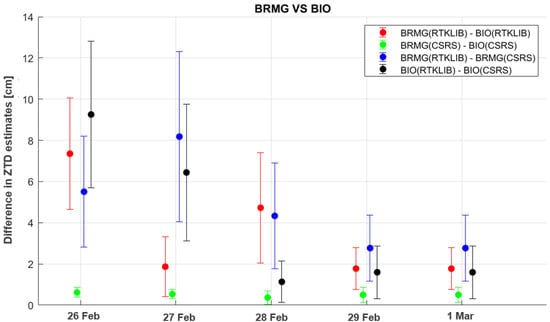
Figure 6.
Comparative ZTD estimates variability across BRMG and BIO stations.
The absolute differences in the color-coded scatter plots, with the error bars indicating the standard deviation of the measurements from the five days, were considered representative of a standard week for these stations. As previously stated, this standard week includes only weekdays and excludes weekends. This strategy was used to limit the impact of technical problems with the computer’s power supply and internet connection that happened on weekends, resulting in data gaps. To ensure the integrity and continuity of our datasets, we concentrated on the continuous data collected on Monday through Friday. This graphical technique demonstrates the variability and precision of the ZTD estimates over one week, which is precisely representative of the other four weeks.
The initial comparative analysis revealed that the ZTD estimates obtained from RTKLIB were inconsistent and unreliable, as shown in Figure 6. These discrepancies, in addition to Figure 4 and Figure 5, highlighted significant issues with the RTKLIB-derived ZTD estimates, justifying the decision to exclude them from further analysis. Consequently, this study focused exclusively on the ZTD estimates derived from CSRS-PPP, ensuring the reliability and accuracy of our findings.
Following the decision to focus on the CSRS-PPP software due to the unreliability of the RTKLIB results, we present the ZTD comparisons for each pair of stations processed by CSRS-PPP. Figure 7, Figure 8, Figure 9, Figure 10 and Figure 11 illustrate the ZTD estimate differences processed by the CSRSS-PP software for each pair of stations and provide a comprehensive view of the temporal trends and variabilities within the network.
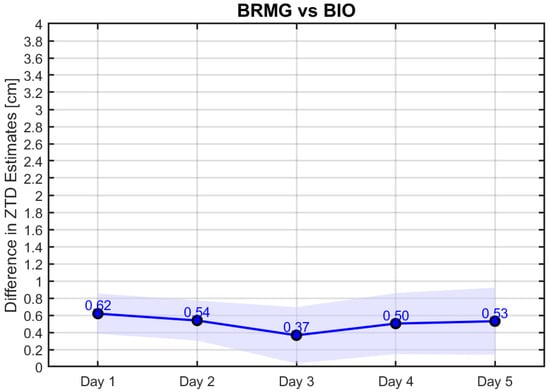
Figure 7.
Comparative ZTD estimate variability across BRMG and BIO stations.
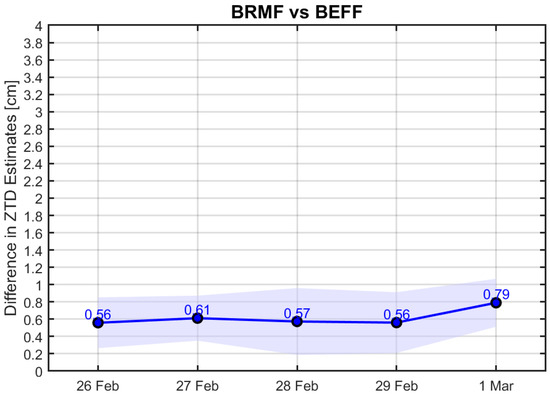
Figure 8.
Comparative ZTD estimate variability across BRMF and BEFF stations.
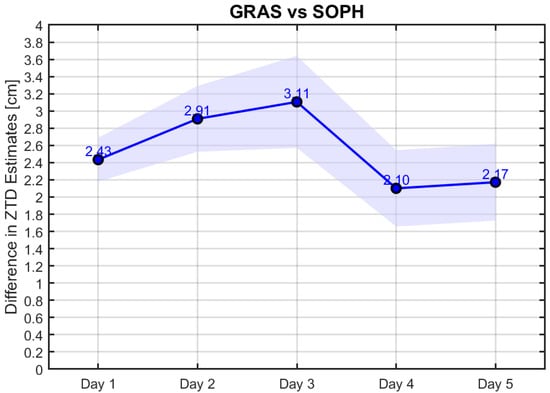
Figure 9.
Comparative ZTD estimate variability across GRAS and SOPH stations.
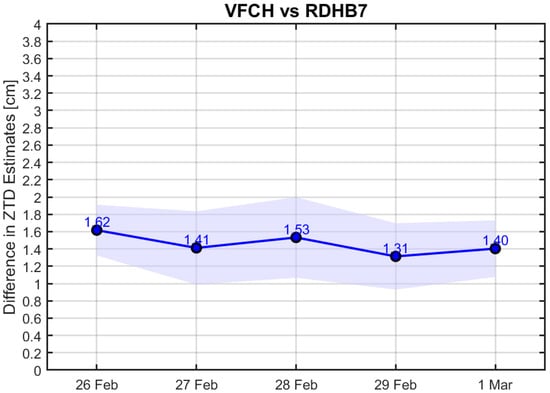
Figure 10.
Comparative ZTD estimate variability across VFCH and RDHB7 stations.
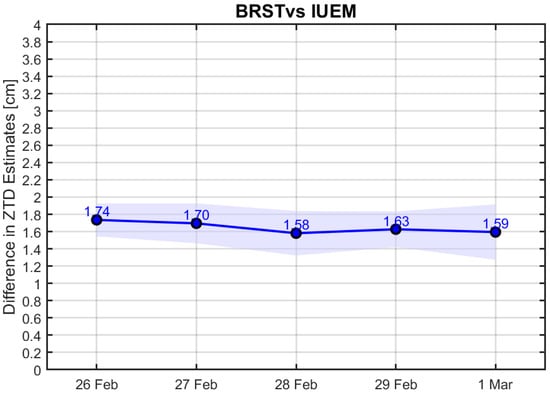
Figure 11.
Comparative ZTD estimate variability across BRST and IUEM stations.
All of the figures (Figure 7, Figure 8, Figure 9, Figure 10 and Figure 11) show a clear alignment of the ZTD estimate values across different days between the Centipede and EUREF stations, indicating temporal consistency in the observations from both networks.
Figure 7 and Figure 8 represent similar findings, small differences (less than 1 cm mean differences) with few variances and minor standard deviations. This highlights the close proximity and similar behavior of the two stations of each pair, one from the Centipede-RTK network and the other from the EUREF network, when processed with CSRS-PPP.
Figure 9, Figure 10 and Figure 11 also demonstrate the close alignment and comparable performance of the two stations of each pair. However, they exhibit slightly larger mean differences. For the pair stations in western France (BRST and IUEM) and central France (VFCH and RDHB7), the mean differences are less than 2 cm. For the SOPH and GRAS station pair, the mean differences are less than 3.5 cm.
The results obtained from the previous plots are summarized in Table 4. This approach enables a clear visualization of the findings, making it easier to compare the performance of the Centipede-RTK network with the EUREF network.

Table 4.
Range of mean and maximum ZTD differences for all station pairs over a five-week period using CSRS-PPP.
Moreover, in order to assess the quality performance of the Centipede-RTK network in ZTD estimation, the Root Mean Square Error (RMSE) is used as the quality indicator in this performance assessment, which is computed as
where n is the total number of ZTD estimations, and the ZTD EUREF product is the reference value considered for the comparison and for the quality check, downloaded from the EUREF website (https://epncb.oma.be/_networkdata/data_access/dailyandhourly/datacentres.php, accessed on 15 May 2024) on an hourly scale. The results are shown in Figure 12, Figure 13, Figure 14, Figure 15 and Figure 16.
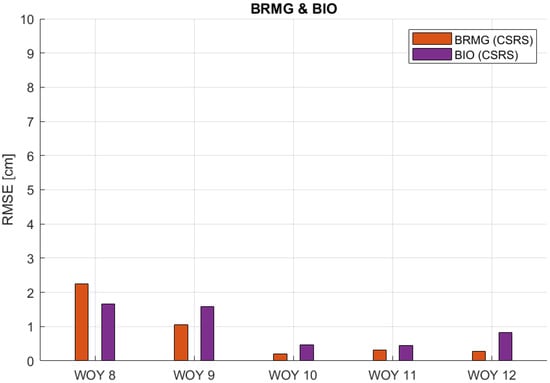
Figure 12.
RMSE values of ZTD estimates for BRMG and BIO stations in respect to the EUREF ZTD product for weeks of the year (WOY) 8 to 12.
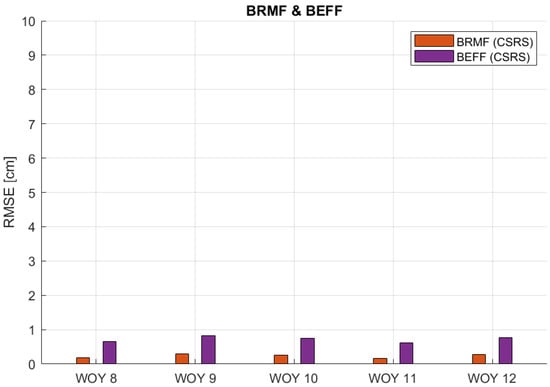
Figure 13.
RMSE values of ZTD estimates for BRMF and BEFF stations in respect to the EUREF ZTD product for weeks of the year (WOY) 8 to 12.
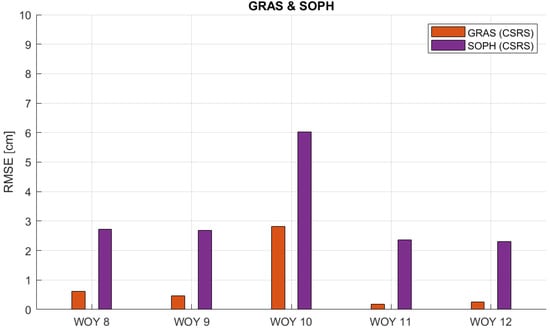
Figure 14.
RMSE values of ZTD estimates for GRAS and SOPH stations in respect to the EUREF ZTD product for weeks of the year (WOY) 8 to 12.
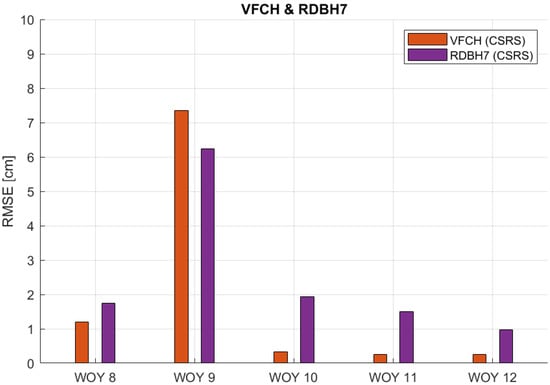
Figure 15.
RMSE values of ZTD estimates for VFCH and RDHB7 stations in respect to the EUREF ZTD product for weeks of the year (WOY) 8 to 12.
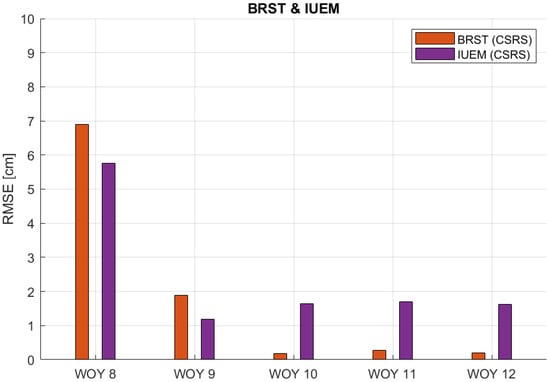
Figure 16.
RMSE values of ZTD estimates for BRST and IUEM stations in respect to the EUREF ZTD product for weeks of the year (WOY) 8 to 12.
Figure 13 demonstrates that the BRMF and BEFF stations consistently have very low RMSE values, with each falling below 1 cm for the whole five weeks. This trend demonstrates the reliability and consistency of these stations’ ZTD estimates. Figure 12, Figure 15 and Figure 16 show a similar trend for both stations from each pair, with slightly higher RMSE values that stay below 2 cm. However, there are notable exceptions indicating unusual RMSE spikes, such as WOY 9 for the VFCH and RDBH7 stations, as well as WOY 8 for the BRST and IUEM stations. These anomalies and outliers suggest specific conditions or factors influencing the data quality for those periods. Figure 14 also exhibits the same general behavior but with RMSE values less than 3 cm, except for an anomaly at WOY 10. During this period, the GRAS station also shows higher RMSE values. This unusual pattern indicates a potential fault or specific conditions affecting the data quality for that particular pair of stations in that period.
Table 5 demonstrates that the Zenith Tropospheric Delay (ZTD) estimations from both networks are consistent with the EUREF ZTD product, as shown by the low RMSE values. Although there are values exceeding 7–8 cm, these are caused by some outliers, as indicated in the previous figures. Furthermore, the precision acquired with CSRS-PPP is consistent across all the pairs of stations.

Table 5.
RMSE values obtained considering CSRS-PPP software.
4. Discussion
The results reported in the previous section demonstrate that CSRS-PPP provides appropriate and reliable Zenith Tropospheric Delay (ZTD) estimations with the low-cost network, in contrast to the results obtained from RTKLIB, which were not acceptable. This indicates that, in the context of this research, CSRS-PPP is the appropriate software. Consequently, we chose to focus and continue our analysis exclusively with CSRS-PPP. This finding underscores one of the key objectives of this study: to highlight the disparities in results produced by different software types when processing the same data and to identify the most reliable processing tool for our specific needs. The greater precision of CSRS-PPP and the differences between the two software packages can be attributed to different factors. Firstly, CSRS-PPP uses the Global Mapping Function (GMF) based on numerical weather model data, whereas RTKLIB uses the Niell Mapping Function (NMF), which is simply based on the site coordinates and the day of the year. The GMF, incorporating weather model data, provides a more accurate representation of the tropospheric delay. While the use of the Niell Mapping Function can cause 1–2 cm ZTD errors, we observed errors up to 15 cm, indicating that other factors also contribute significantly to the discrepancies in precision between the two software packages. Secondly, the software-specific cutoff angles further contribute to the discrepancies. The EUREF ZTD product has a cutoff angle of 7 degrees, CSRS-PPP set at 7.5 degrees (which is not configurable), and RTKLIB set at a 10-degree cutoff as the closest choice. This difference in cutoff angles can have an impact on the ZTD estimation accuracy since RTKLIB may ignore certain satellite signals whereas CSRS-PPP includes them. Additionally, multipath effects, which occur when satellite signals reflect off surrounding surfaces before reaching the GNSS antenna, can induce signal distortion and have an impact on ZTD calculations [19]. Unlike RTKLIB, which allows for significant customization and thorough information, the CSRS-PPP online service has few options and lacks transparency regarding its estimating process. While efforts were made to synchronize the settings between the two platforms where possible, intrinsic discrepancies persisted. Moreover, this limitation constrains our ability to fully investigate and compare the optimality of CSRS-PPP in relation to RTKLIB. All of the aforementioned points emphasize the significance of understanding the underlying models and configurations utilized in various software packages for precise and dependable ZTD estimates. The findings emphasize the importance of careful attention while selecting processing methods for GNSS data, especially in applications requiring high precision.
Furthermore, as indicated in Table 4, the largest mean variances in the ZTD estimates by CSRS-PPP between the station pairs are less than 3.5 cm. Moreover, as can be observed in Table 4, the elevation difference has a considerable impact on the accuracy of the ZTD calculations. When the height disparities between the SOPH and GRAS stations are taken into account, the ZTD discrepancies found are significantly smaller—up to ten times smaller in the case of the mean ZTD difference. This highlights the need for the use of height corrections to improve the precision of the ZTD calculations.
Table 5 reveals the RMSE values of the ZTD processed with CSRS-PPP, compared to the EUREF ZTD product as a reference. The RMSE values for two station pairs (BRMG and BIO, and BRMF and BEFF) are very low (less than 3 cm). The remaining stations (VFCH and RDHB7, BRST and IUEM, and SOPH) have significantly greater RMSE values (less than 8 cm).The reason for these greater RMSE values is due to one week outlier, as shown in Figure 14, Figure 15 and Figure 16. The RMSE values for the other weeks are less than 3 cm, which is consistent with the other stations. Within each pair, the RMSE results are consistent between the Centipede-RTK and EUREF stations. This suggests that greater RMSE values are independent of the network type. Both the low-cost and high-cost stations within each pair had the same RMSE values, indicating that the network type has no major impact on the accuracy of the ZTD predictions.
5. Conclusions
This study assessed the performance of the low-cost Centipede-RTK network in estimating the Zenith Tropospheric Delay (ZTD) and compared it to the existing EUREF network, using two different software packages, RTKLIB and CSRS-PPP, to ensure that the obtained findings are robust and independent of the software used. The key outcomes of this comparison analysis highlight two major findings: Firstly, the ZTD calculations from the Centipede and EUREF networks processed by the CSRS-PPP have practically comparable accuracy values. The biggest mean difference in the ZTD estimates between the two networks was less than 3.5 cm, indicating that their observations were highly correlated and consistent. This closeness emphasizes the low-cost Centipede Network’s reliability as a viable choice for precise tropospheric monitoring. Secondly, this study examined the quality and precision of the ZTD estimates, as measured by the Root Mean Square Error (RMSE). The RMSE values served as a quality indicator, representing the estimated values’ departure from the EUREF ZTD product. It was discovered that regardless of changing geographical and climatic conditions, the low-cost Centipede Network’s ZTD values are consistent with those provided by the EUREF. Furthermore, CSRS-PPP generates ZTD estimations that closely match the EUREF ZTD product values.
The findings show that, despite differences in equipment costs and configurations, the geographical and temporal variability in the ZTD values across both networks is closely related. As a result, low-cost GNSS networks can be used to increase the GNSS network density. They provide an affordable method for improving the spatial resolution of tropospheric monitoring. The ensuing high-resolution temporal and spatial monitoring of the water vapor distribution would allow for more precise predictions of rainfall and extreme weather events. This can have a significant positive impact for climate change studies.
One of the future developments will be to extend the time period of data acquisition and analyze the results for other time windows, excluding the possibility that the good consistency of the results obtained is linked to a seasonal factor. What is shown in this article is only a preliminary study that will need to be extended to ensure both the independence of the results from seasonality and the station selection made in this work.
Author Contributions
Conceptualization, P.D.; methodology, P.D. and M.B.; software, M.B.; validation, P.D. and M.B.; formal analysis, M.B.; investigation, P.D.; resources, P.D.; data curation, M.B.; writing—original draft preparation, M.B.; writing—review and editing, P.D.; visualization, M.B.; supervision, P.D.; project administration, P.D.; funding acquisition, P.D. All authors have read and agreed to the published version of the manuscript.
Funding
This study was carried out within the “PAIN AND GAIN—Positioning and INtelligent Alarms supported by a New Dense GNSS Affordable Infrastructure” project with the number 2022P8C7ZA—funded by European Union—Next Generation EU within the PRIN 2022 program (D.D. 104—02/02/2022 Ministero dell’Università e della Ricerca). This manuscript reflects only the authors’ views and opinions and the Ministry cannot be considered responsible for them.
Data Availability Statement
The raw data supporting the conclusions of this article will be made available by the authors on request.
Acknowledgments
The authors gratefully acknowledge Mujtaba Usman for his help, kindness and valuable support during the first step of the data collection. In addition, the authors acknowledge the developers of the RTKLIB and CSRS-PPP software, as well as the managers of the Centipede-RTK and EUREF networks. The authors would like to thank the reviewers for their careful, constructive and insightful comments in relation to this work.
Conflicts of Interest
The authors declare no conflict of interest.
References
- Vaquero-Martínez, J.; Antón, M. Review on the Role of GNSS Meteorology in Monitoring Water Vapor for Atmospheric Physics. Remote Sens. 2021, 13, 2287. [Google Scholar] [CrossRef]
- Teunissen, P.; Montenbruck, O. Springer Handbook of Global Navigation Satellite Systems; Springer: Berlin/Heidelberg, Germany, 2017. [Google Scholar]
- Kenyeres, A.; Bellet, J.G.; Bruyninx, C.; Caporali, A.; de Doncker, F.; Droscak, B.; Duret, A.; Franke, P.; Georgiev, I.; Bingley, R.; et al. Regional integration of long-term national dense GNSS network solutions. GPS Solut. 2019, 23, 122. [Google Scholar] [CrossRef]
- Liu, G.; Huang, G.; Xu, Y.; Ta, L.; Jing, C.; Cao, Y.; Wang, Z. Accuracy Evaluation and Analysis of GNSS Tropospheric Delay Inversion from Meteorological Reanalysis Data. Remote Sens. 2022, 14, 3434. [Google Scholar] [CrossRef]
- Bramanto, B.; Gumilar, I.; Sidiq, T.P.; Kuntjoro, W.; Tampubolon, D.A. Sensing of the atmospheric variation using Low Cost GNSS Receiver. IOP Conf. Ser. Earth Environ. Sci. 2018, 149, 012073. [Google Scholar] [CrossRef]
- Garrido-Carretero, M.S.; de Lacy-Pérez de los Cobos, M.C.; Borque-Arancón, M.J.; Ruiz-Armenteros, A.M.; Moreno-Guerrero, R.; Gil-Cruz, A.J. Low-cost GNSS receiver in RTK positioning under the standard ISO-17123-8: A feasible option in geomatics. Measurement 2019, 137, 168–178. [Google Scholar] [CrossRef]
- Guerova, G.; Jones, J.; Douša, J.; Dick, G.; de Haan, S.; Pottiaux, E.; Bock, O.; Pacione, R.; Elgered, G.; Vedel, H.; et al. Review of the state of the art and future prospects of the ground-based GNSS meteorology in Europe. Atmos. Meas. Tech. 2016, 9, 5385–5406. [Google Scholar] [CrossRef]
- Krietemeyer, A.; Ten Veldhuis, M.c.; Van der Marel, H.; Realini, E.; Van de Giesen, N. Potential of Cost-Efficient Single Frequency GNSS Receivers for Water Vapor Monitoring. Remote Sens. 2018, 10, 1493. [Google Scholar] [CrossRef]
- Stepniak, K.; Bock, O.; Wielgosz, P. Reduction of ZTD outliers through improved GNSS data processing and screening strategies. Atmos. Meas. Tech. 2018, 11, 1347–1361. [Google Scholar] [CrossRef]
- Romero-Andrade, R.; Trejo-Soto, M.E.; Vázquez-Ontiveros, J.R.; Hernández-Andrade, D.; Cabanillas-Zavala, J.L. Sampling Rate Impact on Precise Point Positioning with a Low-Cost GNSS Receiver. Appl. Sci. 2021, 11, 7669. [Google Scholar] [CrossRef]
- Bosser, P.; Ancelin, J.; Métois, M.; Rolland, L.; Vidal, M. Water vapour monitoring over France using the low-cost GNSS collaborative network Centipede. In Proceedings of the EGU General Assembly 2023, Vienna, Austria, 23–28 April 2023; p. EGU23-9059. [Google Scholar] [CrossRef]
- Dabove, P.; Di Pietra, V. Towards the Use of Low-Cost GNSS Receivers for Permanent Networks in Precision Agriculture. In Proceedings of the 2022 IEEE Workshop on Metrology for Agriculture and Forestry (MetroAgriFor), Perugia, Italy, 3–5 November 2022; pp. 244–248. [Google Scholar]
- Pira, A.; Ancelin, J.; Coulombier, T.; Dausse, D.; Ballu, V.; Testut, L.; Gaugue, A. Physalia: Plateforme HYdrographique pour la Surveillance Altimétrique du Littoral. Lett. D’inf. Résif 2021, 20, 13–14. [Google Scholar]
- Dabove, P.; Di Pietra, V. A Low-Cost Open-Source GNSS Network for Network Real-Time Kinematic Positioning: Which Future and Performances? In Proceedings of the 2023 IEEE/ION Position, Location and Navigation Symposium (PLANS), Monterey, CA, USA, 24–27 April 2023; pp. 272–279. [Google Scholar]
- Dabove, P.; Di Pietra, V. A GNSS Low-Cost RTK Network: Positioning and Atmospheric Monitoring Performances in Mountain Areas. In Proceedings of the 2024 International Technical Meeting of the Institute of Navigation, Long Beach, CA, USA, 23–25 January 2024; pp. 858–868. [Google Scholar] [CrossRef]
- Hofmann-Wellenhof, B.; Lichtenegger, H.; Wasle, E. GNSS–Global Navigation Satellite Systems: GPS, GLONASS, Galileo, and More; Springer Science & Business Media: Berlin/Heidelberg, Germany, 2007. [Google Scholar]
- Essen, L.; Froome, K.D. Dielectric Constant and Refractive Index of Air and Its Principal Constituents at 24,000 Mc./s. Nature 1951, 167, 512–513. [Google Scholar] [CrossRef]
- Wilgan, K.; Hurter, F.; Geiger, A.; Rohm, W.; Bosy, J. Tropospheric refractivity and zenith path delays from least-squares collocation of meteorological and GNSS data. J. Geod. 2017, 91, 117–134. [Google Scholar] [CrossRef]
- Mendez Astudillo, J.; Lau, L.; Tang, Y.T.; Moore, T. Analysing the Zenith Tropospheric Delay Estimates in On-line Precise Point Positioning (PPP) Services and PPP Software Packages. Sensors 2018, 18, 580. [Google Scholar] [CrossRef]
- Takasu, T.; Yasuda, A. Development of the low-cost RTK-GPS receiver with an open source program package RTKLIB. In Proceedings of the International Symposium on GPS/GNSS, Jeju, Republic of Korea, 22–25 September 2009; International Convention Center: Seogwipo-si, Republic of Korea, 2009; Volume 1, pp. 1–6. [Google Scholar]
- Zumberge, J.F.; Heflin, M.B.; Jefferson, D.C.; Watkins, M.M.; Webb, F.H. Precise point positioning for the efficient and robust analysis of GPS data from large networks. J. Geophys. Res. Solid Earth 1997, 102, 5005–5017. [Google Scholar] [CrossRef]
- Baldysz, Z.; Nykiel, G.; Figurski, M.; Araszkiewicz, A. Assessment of the Impact of GNSS Processing Strategies on the Long-Term Parameters of 20 Years IWV Time Series. Remote Sens. 2018, 10, 496. [Google Scholar] [CrossRef]
- Gao, Y.; Chen, K. Performance Analysis of Precise Point Positioning Using Rea-Time Orbit and Clock Products. J. Glob. Position. Syst. 2004, 3, 95–100. [Google Scholar] [CrossRef]
- Ribeiro, M.I. Kalman and extended kalman filters: Concept, derivation and properties. Inst. Syst. Robot. 2004, 43, 3736–3741. [Google Scholar]
Disclaimer/Publisher’s Note: The statements, opinions and data contained in all publications are solely those of the individual author(s) and contributor(s) and not of MDPI and/or the editor(s). MDPI and/or the editor(s) disclaim responsibility for any injury to people or property resulting from any ideas, methods, instructions or products referred to in the content. |
© 2024 by the authors. Licensee MDPI, Basel, Switzerland. This article is an open access article distributed under the terms and conditions of the Creative Commons Attribution (CC BY) license (https://creativecommons.org/licenses/by/4.0/).