Abstract
In recent years, the advancement of CubeSat technology has led to the emergence of high-resolution, flexible imaging satellites as a pivotal source of information for the efficient and precise monitoring of crops. However, the dynamic geometry inherent in flexible side-view imaging poses challenges in acquiring the high-precision reflectance data necessary to accurately retrieve crop parameters. This study aimed to develop an angular correction method designed to generate nadir reflectance from high-resolution satellite side-swing imaging data. The method utilized the Anisotropic Flat Index (AFX) in conjunction with a fixed set of Bidirectional Reflectance Distribution Function (BRDF) parameters to compute the nadir reflectance for the Jilin-1 GP01/02 multispectral imager (PMS). Crop parameter retrieval was executed using regression models based on vegetation indices, the leaf area index (LAI), fractional vegetation cover (FVC), and chlorophyll (T850 nm/T720 nm) values estimated based on angle corrected reflectance compared with field measurements taken in the Inner Mongolia Autonomous Region. The findings demonstrate that the proposed angular correction method significantly enhances the retrieval accuracy of the LAI, FVC, and chlorophyll from Jilin-1 GP01/02 PMS data. Notably, the retrieval accuracy for the LAI and FVC improved by over 25%. We expect that this approach will exhibit considerable potential to improve crop monitoring accuracy from high-resolution satellite side-view imaging data.
1. Introduction
The rapid advancement of remote sensing technology has established it as a crucial tool in the realm of agricultural research. This is attributable to its capability to offer extensive and periodic observations of terrestrial surface data [1,2,3]. Nonetheless, the inherent high spatial heterogeneity observed in agricultural lands, coupled with the dynamic nature of crop development, imposes stringent demands on the timeliness, precision, and sequential integrity of satellite-derived remote sensing data [4]. Within the context of contemporary agricultural practices, the accurate derivation of crop parameters, including the vegetation index, leaf area index (LAI), and chlorophyll concentration, is paramount for the monitoring of crop growth, the estimation of yields, and the stewardship of agricultural resources [5,6].
High-resolution satellites are capable of delivering detailed imagery, which enables the capture of surface features at a finer scale. This enhanced resolution facilitates more precise identification and monitoring of crop growth patterns. However, these high-resolution satellites are inevitably constrained by factors such as optical limitations, bandwidth restrictions, and orbital configurations, which can impede the simultaneous attainment of high spatial and high temporal resolution data [7]. In recent years, the challenge of acquiring satellite data with both a high spatial resolution (less than 10 m) and a high temporal resolution (less than 5 days) has been addressed through the establishment of satellite constellations utilizing extensive satellite networks [8]. The ‘Jilin-1’ constellation, developed by Chang Guang Satellite Technology Co., Ltd., is designed to enable rapid updates of global surface information via a network comprising 138 high-resolution satellites. As a provisional measure towards this goal, the flexibility to adjust the satellite’s angle of inclination can be exploited to reduce its revisit time.
The Jilin-1 GP01/02 satellites constitute pivotal elements within the ‘Jilin-1’ constellation. Equipped with a 5 m multispectral imager, these satellites possess the capability for side-swing imaging up to ±45°, enabling daily revisits to local areas through side-view imaging techniques. When juxtaposed with traditional medium-resolution satellites such as the Landsat series and Sentinel-2, the enhanced imaging flexibility of the Jilin-1 satellites presents heightened challenges to satellite data processing and the inversion of vegetation parameters [8,9,10]. Among these challenges, angle correction emerges as a critical step for achieving more precise surface albedo measurements. The angle effect in satellite imagery is predominantly influenced by the sensor’s observation angle and the solar angle at the time of image acquisition [11]. The Bidirectional Reflectance Distribution Function (BRDF) delineates the relationship between bidirectional reflectance and the spectral, as well as the structural, characteristics of the terrestrial target [12]. It serves as a tool to mitigate discrepancies in observed reflectance that arise from varying incidence and observation angles [13].
MODIS BRDF products have garnered widespread application across a spectrum of satellite sensors, including the Landsat series [14,15,16], Sentinel-2 MSI [17,18], GF-1 WFV [19,20], GF-4 PMS [21], and SPOT [22], and have even been extended to correct for angle effects in UAV observation data [13]. To streamline the computational process, researchers have formulated a suite of fixed BRDF model parameters predicated on MODIS BRDF, which has been effectively utilized to compute nadir reflectance for both Landsat and Sentinel-2 satellites [17,18,23]. The Vermote–Justice–Breon (VJB) method, as developed by Vermote et al., is instrumental in correcting the angle effect in time-series MODIS data. This approach adeptly adjusts BRDF parameters via the linear regression relationship with the normalized difference vegetation index (NDVI) [24,25]. Additionally, an Anisotropic Flat Index (AFX) was devised to extract BRDF prototypes from MODIS data, encapsulating the variability of the fundamental dome–bowl anisotropic reflectance patterns of the terrestrial surface. The AFX method augments the understanding of vegetation structure and other anisotropic reflectance properties of the land surface [26]. Roy et al. [23] have devised a comprehensive method for normalizing Landsat reflectance data to BRDF adjusted reflectance, leveraging MODIS BRDF products. Within the scope of their research, a consistent set of BRDF spectral model parameters was established. Subsequently, this fixed parameter set was effectively utilized to produce Nadir BRDF-adjusted Reflectance (NBAR) for Sentinel-2 satellites [17,18].
Retrieval methods for vegetation parameters such as the LAI, fractional vegetation cover (FVC), chlorophyll, and others, based on remote sensing, are generally categorized into two primary approaches: physical model methods grounded in radiative transfer models, and empirical model methods predicated on vegetation indices [27,28,29]. The physical model approach executes a cost function match by simulating the radiative transfer processes within the vegetation canopy and leaf structure to deduce the physical and chemical properties of the vegetation. This method is characterized by its robust universality, as it is not constrained by environmental conditions or crop types. However, it should be noted that the radiative transfer processes in natural settings are influenced by various factors, including the characteristics of the canopy architecture, and are contingent upon several assumed parameters for simulation [30]. Empirical model methods, on the other hand, are predominantly founded upon establishing regression relationships between observed vegetation parameters and corresponding vegetation indices. These indices include, but are not limited to, the NDVI, the ratio vegetation index (RVI), and the enhanced vegetation index 2 (EVI2), among others [31,32,33]. The efficacy of empirical models is more reliant on the accuracy of the regression relationships and the reliability of the satellite observation data [34]. Prior research has demonstrated that the Jilin-1 GP01/02 satellites possess an absolute radiometric accuracy that is comparable to that of the Sentinel-2A satellite [35], rendering them suitable for high-precision inversion of the crop LAI [36]. Nevertheless, given the unique flexible side-swing imaging capabilities of the Jilin-1 GP01/02 satellites, further investigation is warranted into the evaluation and correction of the angle effect on crop parameters retrieval by these satellites.
This study is primarily concentrated on the correction of the angle effect for high-resolution satellites equipped with side-swing imaging capabilities. We have developed an angle correction methodology that is specifically tailored for the Jilin-1 GP01/02 satellites, enabling accurate reflectance correction under diverse observation geometric conditions. The efficacy of the proposed angle correction method in enhancing the retrieval precision of vegetation indices and crop parameters has been rigorously assessed using an extensive collection of synchronous field measurements. This paper posits that it is imperative to address the angle effect for side-view imaging data obtained from high-resolution satellites. Furthermore, the application of a set of suitably calibrated Anisotropic Flat Index (AFX) parameters can significantly augment the accuracy of crop monitoring endeavors.
2. Materials
2.1. Study Area and Field Measurements
The study area encompassed the Hangjin Rear Banner (40°26′N–41°13′N, 106°34′E–107°24′E), Urat Front Banner (40°28′N–41°16′N, 108°11′E–109°54′E), Zhenglan Banner (42°21′N–42°56′N, 115°30′E–116°13′E), and Horqin Right Front Banner (45°50′N–46°21′N, 121°44′E–122°25′E) in the Inner Mongolia Autonomous Region (Figure 1). The predominant crops in the regions are corn, rice, and sunflower. Field measurements were conducted from 17 July to 18 September 2021, encompassing the flowering, grouting, and ripening phases of the crops (Table 1). Parameters including canopy spectrum, LAI, and FVC were systematically collected. Each measurement was executed in a homogenous field with dimensions no smaller than 100 m × 100 m. Within the central area of each field, five 10 m × 10 m quadrats were established, and the mean of these quadrats was used to represent the field’s canopy spectrum, LAI, and FVC measurements. All measurements were performed under clear sky conditions. Crop canopy spectral data were acquired using an ASD FieldSpec4 spectrometer, which boasts a spectral range from 350 to 2500 nm. LAI measurements were obtained using an LAI-2200C plant canopy analyzer. The FVC was assessed through vertical photography. In vivo chlorophyll, flavanol, and anthocyanin content estimations were performed using an MPM-100 Multi-Pigment-Meter (OPTI-SCIENCES, USA) on fully expanded leaves [37]. For these measurements, adaxial leaf surfaces were selected, with care taken to avoid the leaf midribs when positioning the fluorescence detector for readings.
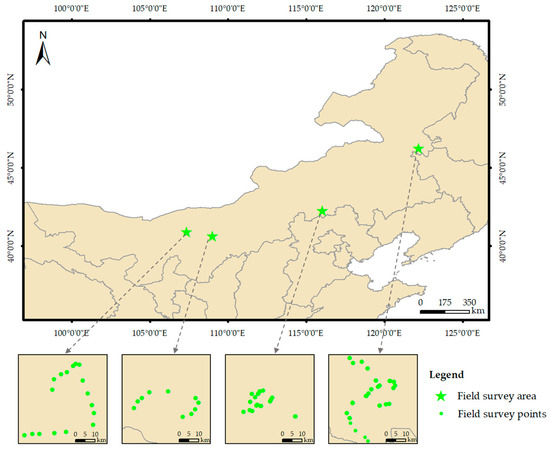
Figure 1.
The distribution map of the study area and the field survey points.

Table 1.
Sites, time, crop type, and growing season information for field survey.
2.2. Jilin-1 GP01/02 Data
The Jilin-1 GP01 and Jilin-1 GP02 satellites, launched on January 12, 2019, were equipped with identical sensor payloads, including a multispectral imager (PMS) and cameras sensitive to short-wave, medium-wave, and long-wave infrared spectra. Each satellite was furnished with a pair of multispectral imagers (PMS1 and PMS2) capable of acquiring remote sensing data across 20 spectral bands at spatial resolutions of 5 m, 10 m, and 20 m, respectively. The swath width for data capture was 60 km, with a lateral swing imaging capability of ±45°. The focus of this paper is on the data procured from the multispectral imager. Table 2 provides an overview of the pertinent technical specifications of the Jilin-1 GP01/02 PMS.

Table 2.
Technical specifications of Jilin-1 GP01/02 PMS.
Due to the use of MODIS BRDF parameters, this paper selected B3 (450–515 nm), B4 (525–600 nm), B5 (630–680 nm), and B6 (784.5–899.5 nm) with a 5 m resolution similar to MODIS satellite settings for the angle effect correction study. Figure 2 illustrates the comparative spectral response functions of the Jilin-1 GP01/02 PMS and MODIS. Given that the blue band is susceptible to contamination from residual atmospheric influences, it was excluded from the accuracy assessment in the monitoring of crop parameters [38].
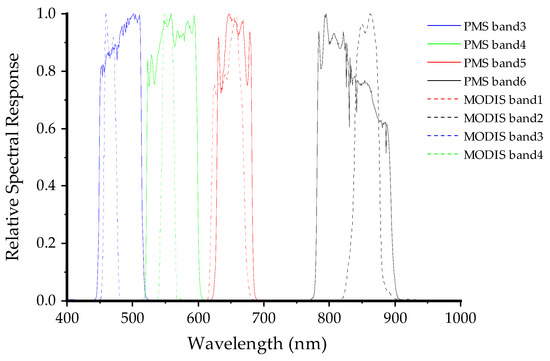
Figure 2.
Spectral response functions of Jilin-1 GP01/02 PMS and MODIS in visible to near-infrared bands.
To ensure congruence between satellite observation data and corresponding field measurements, the Jilin-1 GP01/02 PMS data corresponding to 12 quasi-synchronized scenes were secured. Specifically, satellite and ground observations were synchronized on July 18, July 19, September 11, and September 17. For the remaining satellite data, the temporal discrepancy from the ground measurement acquisition was maintained within a 3-day window. The Jilin-1 GP01/02 PMS data underwent a series of processing steps, including radiometric calibration, atmospheric correction, and geometric correction. Additionally, the imaging geometry parameters for each pixel were calculated, encompassing the solar zenith angle (), view zenith angle (), and relative azimuth angle (). A summary of the imaging times and geometrical information for these data is presented in Table 3.

Table 3.
A list of Jilin-1 GP01/02 PMS data quasi-synchronized with the field survey.
2.3. MODIS Data
The MCD43A1 V6.1 Bidirectional Reflectance Distribution Function and Albedo (BRDF/Albedo) Model Parameters dataset is a daily product with a 500 m resolution and a 16-day composite period. It offers parameter values that pertain to isotropic scattering, volumetric scattering, and geometric-optical scattering across MODIS bands 1 through 7, which correspond to the wavelengths of 645 nm, 859 nm, 469 nm, 555 nm, 1240 nm, 1640 nm, and 2130 nm, respectively. Additionally, the dataset encompasses three broad spectral bands, specified as 300–700 nm, 700–5000 nm, and 300–5000 nm. In the context of this paper, MCD43A1 data synchronized with the dates of the Jilin-1 GP01/02 PMS were secured. The concurrent MCD43A2 dataset was utilized for the quality control of BRDF parameters. Subsequently, a selection criterion was applied, wherein only BRDF parameters associated with pixels of the highest quality and good quality were deemed suitable for inclusion in the correction process. This study aimed to employ the MODIS BRDF parameters of band 1 (645 nm), band 2 (859 nm), and band 4 (555 nm) for the reflectance correction of Jilin-1 GP01/02 PMS green, red, and NIR bands.
3. Methods
3.1. RTLSR BRDF Model
The BRDF is a pivotal function that quantitatively delineates the relationship between ground cover reflectance and the geometry of incidence and observation [39]. Nearly all models for angle effect correction are predicated on the BRDF model framework [40]. The RossThick–LiSparse R (RTLSR) BRDF model [12] stands as one of the most esteemed and widely utilized semi-empirical models, and it is integral to the operational production algorithms for MODIS BRDF and albedo products [41].
Within the RTLSR BRDF model, a linear composite of three distinct scattering components is formulated, encompassing isotropic scattering, volumetric scattering, and geometric-optical scattering. The model’s expression is articulated as follows [12,42]:
where is the Bidirectional Reflectance Distribution Function of λ band; , , and are the weights of isotropic scattering, volume scattering, and geometrically optical scattering, respectively; and and are the volume scattering kernel and the geometric optical kernel, respectively, which are both functions of the solar zenith (), view zenith () and relative azimuth ().
3.2. MODIS-Based Parameters Method
The correction of angle effects in high-resolution satellite imagery, leveraging MODISBRDF parameters, is a prevalent and robust approach. This methodology has garnered widespread application in the rectification of BRDF effects for a spectrum of satellite platforms, including the Landsat series, Sentinel-2, and the GF series satellites [17,18,19,23].
where, represents the nadir reflectance of the Jilin-1 GP01/02 PMS for band λ after BRDF correction, denotes the reflectance of the Jilin-1 GP01/02 PMS for band λ under the actual observation geometry, and signifies the correction coefficient applied to nadir reflectance to account for the differences in the actual observation direction. , and are derived from the MCD43A1 BRDF parameters, and , and describe the observational geometry pertinent to the Jilin -1 GP01/02 PMS.
3.3. AFX Method
The AFX is defined as the ratio of the white sky albedo (WSA) to the isotropic parameter . The formulation of the model is as follows [26]:
where, and are the bi-hemispherical integrals of the volumetric and geometric-optical kernels; here they are 0.189184 and −1.377622, respectively.
The AFX is utilized to discern the general characteristics of surface reflectance anisotropy, as outlined in [43]. Based on this attribute, six distinct classes of spectral BRDF prototypes were categorized. To mitigate the discrepancies in spectral reflectance amplitudes across various surfaces, the raw MODIS BRDF parameters were subjected to normalization. This process involved multiplying the parameters by a scaling factor K, where K = 0.5/. Table 4 shows the AFX ranges and the corresponding normalized BRDF parameters for the six spectral archetypes, specifically within the green, red, and near-infrared bands.

Table 4.
AFX ranges of six BRDF archetypes in normalized (, , and ) forms in the MODIS green, red, and NIR bands.
Utilizing the AFX method, the angular correction for the Jilin-1 GP01/02 PMS data was executed. Initially, the BRDF parameters derived from the MCD43A1 dataset were resampled to resolutions of 5 m. Subsequently, the AFX values were computed in accordance with Equation (4). The normalized BRDF parameters, , , and were ascertained based on the distribution of AFX values. Ultimately, the Jilin-1 GP01/02 PMS data were adjusted using these normalized BRDF parameters. The formula for the correction is presented as follows:
3.4. VJB BRDF Method
A novel BRDF decomposition algorithm, predicated on NDVI has been introduced for the estimation and rectification of the directional effect on satellite-derived surface reflectance time series [24]. This approach quantifies the BRDF profile through two distinct parameters: surface scattering (denoted as R) and volumetric scattering (denoted as V).
The temporal variations in the parameters V and R demonstrated a significant correlation with the fluctuations in the NDVI across vegetated regions [24]. Both V and R were delineated as linear functions of the coefficients , , , and , respectively, each in conjunction with NDV. The aforementioned coefficients can be derived from the MCD43A BRDF parameters, which were resampled to a resolution of 5 m, in conjunction with the NDVI values observed from the Jilin-1 GP01/02 PMS.
3.5. Fixed Parameters Method
Table 5 delineates this set of fixed BRDF model parameters for the green, red, and near-infrared (NIR) bands of the Landsat satellites. Given that the Jilin-1 GP01/02 satellites share identical band settings with both Landsat and Sentinel-2 satellites, it was feasible to apply this same set of fixed parameters for related calculations.

Table 5.
The fixed BRDF parameters for Landsat TM green, red, and NIR bands.
3.6. Development of the Fixed-Jilin-1 Method
Although the Jilin-1 GP01/02 PMS and Landsat 5/7 TM share identical band configurations, discrepancies were observed in their spectral response functions, particularly within the red and NIR bands, Figure 3 illustrates the comparative spectral response curves of these two sensors. Furthermore, in contrast to the Landsat TM, which is limited to imaging at the subsatellite point, the Jilin-1 GP01/02 PMS is capable of a more expansive side-swing angle, extending up to ±45°. Consequently, the fixed parameters originally derived for the Landsat TM may not be directly applicable to the Jilin-1 GP01/02 PMS. It is thus imperative to develop a distinct set of fixed parameters that are tailored for the Jilin-1 GP01/02 PMS. In this study, we produced normalized BRDF parameters for the Jilin-1 GP01/02 PMS, employing both the AFX and fixed parameter methodologies. The procedure is outlined in the following steps: (1) AFXs of each band of the Jilin-1 GP01/02 PMS were calculated based on the Landsat TM’s fixed parameters; (2) the normalized BRDF parameters (, , and ) were determined according to the AFX range of the calculated AFX values of each band in Table 4; and (3) the NBAR of the Jilin-1 GP01/02 PMS was generated by bringing normalized BRDF parameters into the RTLSR BRDF model. Table 6 presents the fixed AFX values and the corresponding normalized BRDF parameters for the green, red, and NIR bands of the Jilin-1 GP01/02 PMS, as calculated by employing the proposed Fixed-Jilin-1 method.
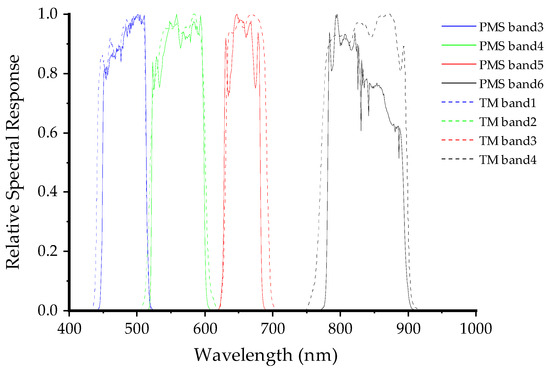
Figure 3.
Spectral response functions of Jilin-1 GP01/02 PMS and Landsat TM in visible to near-infrared bands.

Table 6.
AFXs and normalized BRDF parameters for green, red, and NIR bands of Jilin-1 GP01/02 PMS.
3.7. Vegetation Index Calculation Method
In the present study, empirical statistical regression models for the assessment of the crop LAI, FVC, and chlorophyll were developed utilizing a range of vegetation indices. Table 7 shows the vegetation indices selected for this analysis encompass the RVI [44], the NDVI [45], the Green NDVI (GNDVI) [46], the Green Chlorophyll Vegetation Index (GCVI) [31], EVI2 [47], the Modified Soil-Adjusted Vegetation Index (MSAVI) [48], and the Modified Triangular Vegetation Index 2 (MTVI2) [49].

Table 7.
Vegetation indices used in this research (NIR, red, and green correspond to Jilin-1 GP01/02 PMS band 4, band 3, and band 2, respectively).
A total of 315 in-situ measurements of the LAI, FVC, and chlorophyll (T850 nm/T720 nm) were conducted across corn, rice, and sunflower fields situated in the Inner Mongolia Autonomous Region. The dataset was apportioned, with 80% of the measurements allocated for model development and the remaining 20% reserved for validation purposes. The LAI estimation based on the RVI exhibited a root-mean-square error (RMSE) of 0.73 (determination (R2) = 0.84, Table 8). In comparison, the RMSE for LAI estimations based on other vegetation indices (VIs) varied from 1.33 to 2.48, contingent upon the VI utilized (R2 = 0.32–0.67, Figure 4). The FVC estimation derived from MTVI2 demonstrated an RMSE of 6.9% (R2 = 0.81, Table 8), whereas the RMSE for other VI-based FVC estimations spanned from 12.1% to 32.4%, dependent on the VI in question (R2 = 0.38–0.78, Figure 4). Furthermore, the chlorophyll (T850 nm/T720 nm) estimation predicated on the GCVI had an RMSE of 0.15 (R2 = 0.85, Table 8), and the RMSE for chlorophyll estimations based on other VIs ranged from 0.23 to 0.67, with variation attributed to the VI selected (R2 = 0.45–0.73, Figure 4).

Table 8.
Regression analysis between VIs and the LAI, FVC, chlorophyll (T850 nm/T720 nm).

Figure 4.
VIs-based LAI, FVC, and chlorophyll (T850 nm/T720 nm) estimations. The X-axis is the vegetation index, the left Y-axis is the R2 value, and the right Y-axis is the RMSE value. (a) LAI, (b) FVC, and (c) chlorophyll (T850 nm/T720 nm).
4. Results
4.1. Jilin-1 GP01/02 PMS Angle Effect Correction Validation
The coefficient was employed to assess the efficacy of the angle effect correction across five distinct methodologies for the green, red, and near-infrared bands of the Jilin-1 GP01/02 PMS. Table 9 presents the mean and standard deviation values of for these five correction methods. Analysis of the data reveals that the average values obtained through the VJB method are consistently lower than those of the other four approaches, particularly when > 40°. Under such conditions, the maximum discrepancy in values between the VJB method and the other algorithms can extend to −0.13, with the standard deviation being markedly higher—by several folds or even tens of folds—compared to the other four methods. This observation suggests a potential overcorrection issue associated with the VJB method.

Table 9.
Correction coefficient () of the Jilin-1 GP01/02 PMS in the green, red, and NIR bands under five methods.
Excluding the Fixed-Landsat method, wherein the mean values for the red band surpass 1, the remaining methods all yield values that are less than 1. This contrast implies that the fixed parameters optimized for the Landsat red band are not directly transferable for correcting the red band of the Jilin-1 GP01/02 PMS. Consequently, subsequent analyses will be restricted to the MODIS-based, AFX, and Fixed-Jilin-1 methods. As and increase for these three methods, there is a corresponding decrease in the mean value and an increase in the standard deviation. Notably, for the MODIS-based method, the mean value across the green, red, and NIR bands drops by more than 5.0%, 5.8%, and 1.8%, respectively, when > 40° as opposed to ≈ 20°. Furthermore, the values for both the MODIS-based and AFX methods in the NIR band are considerably higher than those in the green and red bands. In contrast, the Fixed-Jilin-1 method demonstrates greater stability, with standard deviation values that are markedly lower across all bands when compared to the other two methods.
To assess the precision of the angular correction effect across various methods, we conducted a verification using the nadir reflectance data from the Jilin-1 GP01/02 PMS, which were cross-referenced with the simulated green, red, and NIR reflectance values derived from measured spectral data. The reflectance correction accuracy for each method is depicted in Figure 5, Figure 6 and Figure 7 for the green, red, and NIR bands, respectively. Post-correction reflectance values were found to be more closely aligned with actual values, as evidenced by higher coefficients of R2, and a reduced root mean square error (RMSE) and mean relative error (MRE), compared to pre-correction values.
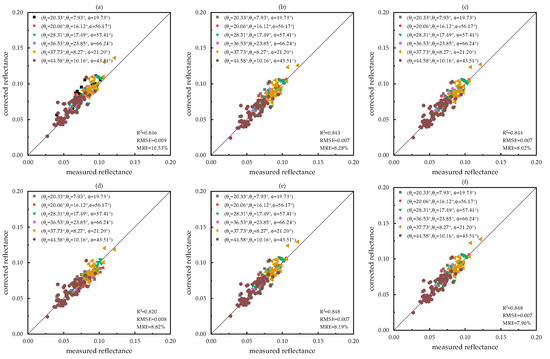
Figure 5.
Green band reflectance validation based on field measured data. The X-axis is the measured reflectance, the Y-axis is the corrected reflectance, the black solid line is the 1:1 line, and the different color scatter points represent the different observation geometry. (a) Original, (b) MODIS-based, (c) AFX, (d) VJB, (e) Fixed-Landsat, And (f) Fixed-Jilin-1.
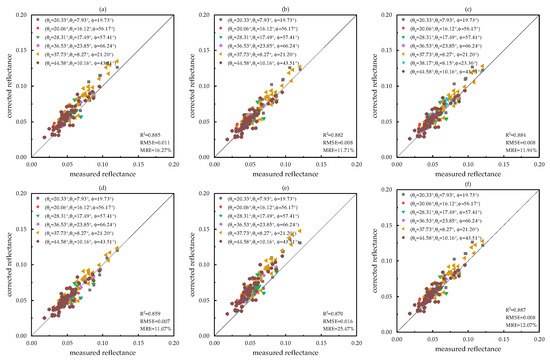
Figure 6.
Red band reflectance validation based on field measured data. The X-axis is the measured reflectance, the Y-axis is the corrected reflectance, the black solid line is the 1:1 line, and the different color scatter points represent the different observation geometry. (a) Original, (b) MODIS-based, (c) AFX, (d) VJB, (e) Fixed-Landsat, And (f) Fixed-Jilin-1.
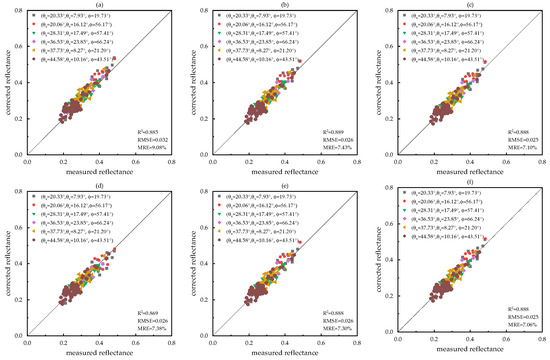
Figure 7.
NIR band reflectance validation based on field measured data. The X-axis is the measured reflectance, the Y-axis is the corrected reflectance, the black solid line is the 1:1 line, and the different color scatter points represent the different observation geometry. (a) Original, (b) MODIS-based, (c) AFX, (d) VJB, (e) Fixed-Landsat, And (f) Fixed-Jilin-1.
Similar to the findings regarding the values, the VJB method exhibited the poorest correlation with the true reflectance, indicated by the lowest R2. The Fixed-Landsat method appears to have exacerbated the impact of the angular effect on the red band, resulting in a corrected reflectance that deviated more significantly from the actual value than before the correction. In contrast, the Fixed-Jilin-1 method demonstrated superior correction accuracy, with R2 values exceeding 0.85 for all three bands and a reduction in the MRE of over 2%.
For smaller viewing and solar angles ( < 30° and < 20°), the impact of the angular effect on reflectance was minimal, and the correction outcomes from the four methods were largely comparable, with the exception of the Fixed-Landsat method’s performance in the red band. However, as angles increased ( > 30° and > 20°), the reflectance values corrected by the four methods converged, with the angular effect becoming more pronounced and leading to varying correction outcomes among the methods. Overall, the comparative effectiveness of the five methods for angular correction on Jilin-1 GP01/02 PMS data can be ranked as follows: Fixed-Jilin-1, AFX, MODIS-based, Fixed-Landsat, and VJB.
4.2. Crop Parameters Retrieval Validation
4.2.1. LAI Retrieval Validation
The LAI was retrieved from both the original and nadir reflectance measurements using a regression formula based on the RVI, followed by the application of five distinct methods for correcting the angle effect. Subsequently, the accuracy of the retrieved LAI was validated against field survey data. As depicted in Figure 8, except for the Fixed-Landsat algorithm, which significantly underestimated the LAI extraction results, the retrieval accuracy from the remaining four methods saw a marked enhancement. Specifically, these methods demonstrated coefficients of R2 greater than or equal to 0.81 and RMSE less than or equal to 0.62, which are substantial improvements over the original reflectance metrics (R2 = 0.76 and RMSE = 0.735). Notably, the Fixed-Jilin-1 method achieved the highest accuracy in LAI retrieval (R2 = 0.82 and RMSE = 0.539). Additionally, the MODIS-based and AFX methods exhibited very similar levels of accuracy in LAI retrieval.
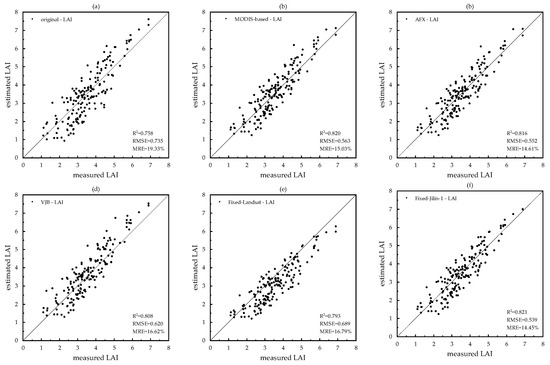
Figure 8.
LAI validation based on field measured data. The X-axis is the measured reflectance, the Y-axis is the corrected reflectance, and the black solid line is the 1:1 line. (a) Original, (b) MODIS-based, (c) AFX, (d) VJB, (e) Fixed-Landsat, and (f) Fixed-Jilin-1.
4.2.2. FVC Retrieval Validation
Figure 9 presents the accuracy of FVC retrieval using various methods for angular correction. The performance of FVC retrieval surpassed that of LAI retrieval, with the coefficient of R2 for FVC retrieval from the original reflectance already exceeding 0.8. Notably, the Fixed-Jilin-1 method significantly enhanced the accuracy of FVC retrieval when compared to the original reflectance. Specifically, the R2 value rose from 0.8 to 0.87, the RMSE decreased from 9.54% to 7.58%, and the MRE reduced by over 35%. However, an underestimation of FVC was observed with the other four methods, despite an improvement in the R2 value. Particularly, the AFX method exhibited the most pronounced underestimation, with an RMSE reaching 11.55%. When the crop coverage is low (FVC < 50%), the influence of the angular effect on FVC retrieval is small, and the application of the five angular correction methods did not lead to a significant improvement in the retrieval accuracy of FVC. Conversely, for higher crop coverage (FVC > 50%), the accuracy of FVC retrieval was markedly enhanced following angular correction.
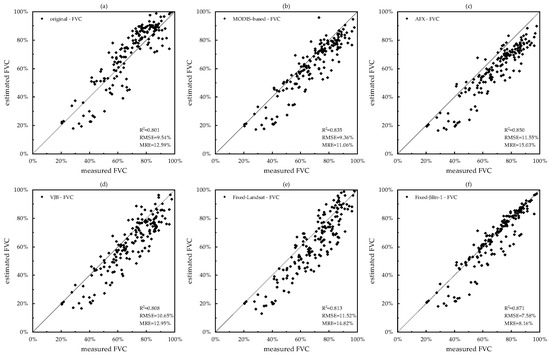
Figure 9.
FVC validation based on field-measured data. The X-axis is the measured reflectance, the Y-axis is the corrected reflectance, and the black solid line is the 1:1 line. (a) Original, (b) MODIS-based, (c) AFX, (d) VJB, (e) Fixed-Landsat, and (f) Fixed-Jilin-1.
4.2.3. Chlorophyll Retrieval Validation
Figure 10 illustrates the accuracy of chlorophyll retrieval, represented by the ratio T850 nm/T720 nm and based on the GCVI, utilizing various angular correction methods. When examining the overall chlorophyll retrieval accuracy across the five correction methods, it is observed that, apart from the VJB method, the distinctions among the remaining methods were not pronounced. Specifically, the variance in R2 and RMSE among these four methods was minimal, with differences of only 0.003 and 0.01, respectively. The VJB method yielded the poorest accuracy for chlorophyll retrieval, which is even lower than that achieved using the original reflectance data. In contrast, the Fixed-Jilin-1 method outperformed the others, showing an increase in R2 of 0.12 and a decrease in RMSE of 0.013 when compared to the chlorophyll retrieval results from the original reflectance.
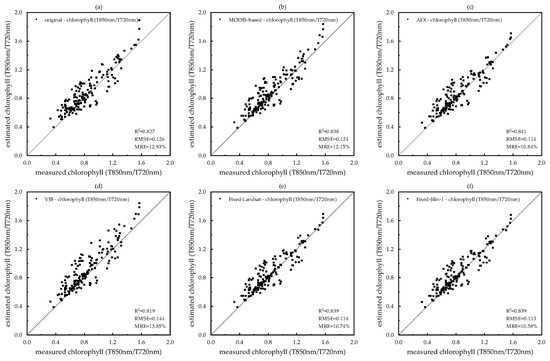
Figure 10.
Chlorophyll (T850 nm/T720 nm) validation based on field measured data. The X-axis is the measured reflectance, the Y-axis is the corrected reflectance, and the black solid line is the 1:1 line. (a) Original, (b) MODIS-based, (c) AFX, (d) VJB, (e) Fixed-Landsat, and (f) Fixed-Jilin-1.
In general, the angular effect exerted a negligible influence on the accuracy of chlorophyll extraction. However, when the chlorophyll ratio (T850 nm/T720 nm) exceeded 1.2, the chlorophyll estimates derived from the original reflectance tended to be higher than the measured values. This discrepancy was significantly mitigated following angular correction, particularly with the Fixed-Jilin-1 method.
In summary, aside from the VJB method, the remaining four methods for angular correction were shown to enhance the retrieval accuracy of the LAI, FV, and chlorophyll content. The MODIS-based, AFX, and Fixed-Landsat methods exhibited comparable performance in improving the retrieval accuracy of these crop parameters. Notably, the Fixed-Jilin-1 method demonstrated superior accuracy in retrieving the LAI, FVC, and CHL across the board.
Furthermore, the retrieval of the LAI, FVC, and CHL exhibited varying sensitivities to the angle effect. This effect also influenced the retrieval accuracy of crop parameters differently, depending on the specific growth stage of the crops.
5. Discussion
5.1. Novelty of the Fixed-Jilin-1 Angle Effect Correction Method
In this study, we introduced a novel method for correcting the angular effects inherent in high-resolution, side-view satellite imagery data. The accuracy of this proposed method was substantiated through validation against measured crop reflectance data, demonstrating superior performance compared to other prevalent methodologies. Extensive research, including the present study, has confirmed the applicability of MODIS BRDF parameters and the fixed BRDF parameters of Landsat satellites for angular correction across a spectrum of satellite sensors, thereby highlighting the universality of these parameters. However, variations in sensor responsiveness, imaging conditions, observation geometry, and spatial resolution necessitate further refinements to these ostensibly universal approaches. This is particularly pertinent for satellites capable of flexible side-swing imaging, which exhibit more dynamic observation geometries, thus necessitating more specialized angular correction methodologies.
Similar to the results of Jiang et al. [20], the VJB method does not show better accuracy than other methods, which is different from the results of Claverie et al. [22]. Both this paper and Jiang et al. [20] focus on crops, while Claverie et al. [22] focus on semi-desert biome, so it can be inferred that the VJB method is greatly affected by the type of land cover. Additionally, the fixed BRDF parameters of Landsat satellites, when compared to other methods, exhibits marked discrepancies in the red band. This discrepancy is primarily attributed to the broader bandwidth of the Jilin-1 GP01/02 red band in contrast to that of the Landsat TM red band (50 nm versus 30 nm), coupled with a wider viewing angle (±45° side-view imaging versus sub-satellite point imaging).
The AFX method achieves superior accuracy in correcting sensor angle effects compared to the MODIS parameter-based approach. This enhanced precision is attributed to AFX’s capacity to limit scale differences in BRDF profiles to a significant degree. At low viewing angles, the stability of the Landsat-based fixed parameters surpasses that of the MODIS method in angle correction for Jilin-1 GP01/02 PMS data, due to their reduced sensitivity to land cover type, condition, or surface disturbance. However, the fixed BRDF parameters falter in accurately depicting BRDF variations at high viewing angles. The AFX method compensates by incorporating surface variation data, suggesting a complementary application with the fixed parameter method under large observation angles. Consequently, the proposed Fixed-Jilin-1 method integrates the strengths of both the AFX and Landsat fixed parameter methods, employing fixed BRDF parameters that are more universally applicable and leveraging AFX to diminish the impact of spatial scale discrepancies. Overall, the proposed method corrects angular effects in Jilin-1 GP01/02 PMS data more effectively, offering a distinct advantage particularly at larger zenith angles.
5.2. Impact of Angle Effect Correction on Vegetation Parameters Retrieval
Given the high spatial heterogeneity of agricultural fields and the rapid fluctuations in crop growth, crop parameters vary considerably across different growth phases, leading to a differential impact of the angular effect on various crop parameters. During the middle and late stages of crop growth, when plant density is elevated, the inversion accuracy for the LAI is markedly lower compared to that for the FVC and CHL. This is partly due to the differential response of the LAI to red band saturation as opposed to the FVC and CHL, a phenomenon also observed by Jiang et al. [47]. Furthermore, the angular effect differentially influences the reflectance of distinct spectral bands [50], resulting in a pronounced variation in the impact of the angular effect on various vegetation indices. Consequently, the inversion algorithms for crop parameters based on these indices will also exhibit variations.
The observational data from the Jilin-1 GP01/02 satellites, which were synchronized with the measured data in this study, are predominantly backscattered, leading to a lower reflectivity post-correction compared to pre-correction. The binomial reflection from vegetation is a complex process involving the transmission of canopy and leaf radiation, which is intricately linked to the type of vegetation, growth phase, and incident light conditions. The data collected in this study pertain to the middle and late stages of crop growth, thus not delving deeply into the more complex, mixed radiation characteristics of the vegetation–soil interface observed during the early stages of crop development.
While the angular effect correction outcomes for the Jilin-1 GP01/02 PMS presented herein are promising, there are inherent limitations. The correction method introduced in this study has been tested solely within the mid-latitudes of the Northern Hemisphere, indicating a need for future research to evaluate the method’s efficacy across a broader range of geographical and environmental contexts. Furthermore, the Jilin-1 GP01/02 PMS encompasses a multitude of narrowband visible light, red edge, and near-infrared bands in addition to the green, red, and near-infrared bands. Future studies will also explore BRDF correction methodologies for these bands to fully leverage the high-resolution and multispectral capabilities of this satellite imagery.
6. Conclusions
This paper assesses the impact of various angular correction methods on the data acquired from the high-resolution, flexible side-view imaging satellite, Jilin-1 GP01/02. We have developed a correction method specifically tailored for the Jilin-1 GP01/02 PMS to enhance the precision of crop parameter extraction. Moreover, this study employed ground-measured data to validate the accuracy of LAI, FV, and CHL retrieval using both pre- and post-correction reflectance. Compared with commonly used angular effect correction methods, the method introduced in this study, termed the Fixed-Jilin-1 method, effectively mitigates the influence of observation geometry on data accuracy. The findings indicate that the Fixed-Jilin-1 method markedly enhances the precision of crop parameter extraction, followed by the AFX method, the MODIS-based method, the Fixed-Landsat method, and the VJB method, respectively. Notably, the retrieval accuracy for the LAI and FVC saw an improvement of over 25%.
Thus, by addressing the angular effect in Jilin-1 GP01/02 PMS data through the Fixed-Jilin-1 method, significant strides are made towards bolstering the inversion accuracy of agricultural vegetation parameters. This approach holds substantial promise for the monitoring of crops using CubeSat constellations and may pave the way for a variety of novel applications within the realm of precision agriculture.
Author Contributions
Conceptualization, J.G. and X.Z.; methodology, J.G.; validation, J.G. and Z.X.; formal analysis, J.G. and R.Z.; investigation, Z.X.; resources, D.W.; data curation, Z.X.; writing—original draft preparation, J.G.; writing—review and editing, R.Z. and J.Y.; visualization, J.Y.; supervision, D.W.; project administration, R.Z.; funding acquisition, D.W. All authors have read and agreed to the published version of the manuscript.
Funding
This research was funded by the China Postdoctoral Science Foundation, grant number 2022M720538, and the Major Science and Technology Program of Jilin Province, grant number YDZJ202303CGZH023.
Data Availability Statement
Restrictions apply to the availability of these data.
Acknowledgments
We thank the Inner Mongolia Autonomous Region Surveying and Mapping Geographic Information Center for supporting the field survey work. We are also grateful to the MODIS team for providing BRDF products that are available online. We also would like to thank the reviewers for their helpful comments.
Conflicts of Interest
Authors Jialong Gong, Xing Zhong, Ruifei Zhu, Zhaoxin Xu, Dong Wang were employed by the company Chang Guang Satellite Technology Co., Ltd. The remaining authors declare that the research was conducted in the absence of any commercial or financial relationships that could be construed as a potential conflict of interest.
References
- Moran, M.S.; Inoue, Y.; Barnes, E.M. Opportunities and limitations for image-based remote sensing in precision crop management. Remote Sens. Environ. 1997, 61, 319–346. [Google Scholar] [CrossRef]
- Zhang, N.; Wang, M.; Wang, N. Precision agriculture—A worldwide overview. Comput. Electron. Agric. 2002, 36, 113–132. [Google Scholar] [CrossRef]
- Sishodia, R.P.; Ray, R.L.; Singh, S.K. Applications of Remote Sensing in Precision Agriculture: A Review. Remote Sens. 2020, 12, 3136. [Google Scholar] [CrossRef]
- Atzberger, C. Advances in Remote Sensing of Agriculture: Context Description, Existing Operational Monitoring Systems and Major Information Needs. Remote Sens. 2013, 5, 949–981. [Google Scholar] [CrossRef]
- Revill, A.; Myrgiotis, V.; Florence, A.; Hoad, S.; Williams, M. Combining Process Modelling and LAI Observations to Diagnose Winter Wheat Nitrogen Status and Forecast Yield. Agronomy 2021, 11, 314. [Google Scholar] [CrossRef]
- Xie, Q.; Dash, J.; Huete, A.; Jiang, A.; Yin, G.; Ding, Y.; Peng, D.; Hall, C.C.; Brown, L.; Shi, Y.; et al. Retrieval of crop biophysical parameters from Sentinel-2 remote sensing imagery. Int. J. Appl. Earth Obs. Geoinf. 2019, 80, 187–195. [Google Scholar] [CrossRef]
- Jiménez-Berni, J.A.; Zarco-Tejada, P.J.; Suárez, L.; Fereres, E. Thermal and Narrowband Multispectral Remote Sensing for Vegetation Monitoring From an Unmanned Aerial Vehicle. IEEE Trans. Geosci. Remote Sens. 2009, 47, 722–738. [Google Scholar] [CrossRef]
- Houborg, R.; McCabe, M. High-Resolution NDVI from Planet’s Constellation of Earth Observing Nano-Satellites: A New Data Source for Precision Agriculture. Remote Sens. 2016, 8, 768. [Google Scholar] [CrossRef]
- Revel, C.; Lonjou, V.; Marcq, S.; Desjardins, C.; Fougnie, B.; Luche, C.C.-D.; Guilleminot, N.; Lacamp, A.-S.; Lourme, E.; Miquel, C.; et al. Sentinel-2A and 2B absolute calibration monitoring. Eur. J. Remote Sens. 2019, 52, 122–137. [Google Scholar] [CrossRef]
- Irons, J.R.; Dwyer, J.L.; Barsi, J.A. The next Landsat satellite: The Landsat data continuity mission. Remote Sens. Environ. 2012, 122, 11–21. [Google Scholar] [CrossRef]
- Ranson, K.J.; Biehl, L.L.; Bauer, M.E. Sun-view angle studies of corn and soybean canopies in support of vegetation canopy reflectance modeling. In AGRISTARS Annual Technical Summary, Report Prepared Undercontract NAS9-16528; Purdue University: West Lafayette, IN, USA, 1983; pp. 95–116. [Google Scholar]
- Roujean, J.L.; Leroy, M.; Deschanps, P.Y. A bidirectional reflectance model of the Earth’s surface for the correction of remote sensing data. J. Geophys. Res. Atmos. 1992, 972, 20455–20468. [Google Scholar] [CrossRef]
- Jiao, Z.; Zhang, H.; Dong, Y.; Liu, Q.; Xiao, Q.; Li, X. An Algorithm for Retrieval of Surface Albedo From Small View-Angle Airborne Observations Through the Use of BRDF Archetypes as Prior Knowledge. IEEE J. Sel. Top. Appl. Earth Obs. Remote Sens. 2015, 8, 3279–3293. [Google Scholar] [CrossRef]
- Leigh, L.M.; Mishra, N.; Haque, M.O.; Aaron, D.; Markham, B. Radiomeric cross calibration of Landsat 8 Operatinal Land Imager. Remote Sens. 2014, 6, 12619–12638. [Google Scholar]
- He, T.; Liang, S.; Wang, D.; Cao, Y.; Gao, F.; Yu, Y.; Feng, M. Evaluating land surface albedo estimation from Landsat MSS, TM, ETM +, and OLI data based on the unified direct estimation approach. Remote Sens. Environ. 2018, 204, 181–196. [Google Scholar] [CrossRef]
- Sun, Y.; Wang, B.; Teng, S.; Liu, B.; Zhang, Z.; Li, Y. Continuity of Top-of-Atmosphere, Surface, and Nadir BRDF-Adjusted Reflectance and NDVI between Landsat-8 and Landsat-9 OLI over China Landscape. Remote Sens. 2023, 15, 4948. [Google Scholar] [CrossRef]
- Roy, D.P.; Li, J.; Zhang, H.K.; Yan, L.; Huang, H.; Li, Z. Examination of Sentinel-2A multi-spectral instrument (MSI) reflectance anisotropy and the suitability of a general method to normalize MSI reflectance to nadir BRDF adjusted reflectance. Remote Sens. Environ. 2017, 199, 25–38. [Google Scholar] [CrossRef]
- Roy, D.; Li, Z.; Zhang, H. Adjustment of Sentinel-2 Multi-Spectral Instrument (MSI) Red-Edge Band Reflectance to Nadir BRDF Adjusted Reflectance (NBAR) and Quantification of Red-Edge Band BRDF Effects. Remote Sens. 2017, 9, 1325. [Google Scholar] [CrossRef]
- Liu, L.; Gao, H.; Pan, Z.; Qian, Y.; Han, Q.; Zhang, X.; Shi, T. Satellite-based time series calibration of GF-1 WFV sensors for large view zenith angle observations. Int. J. Remote Sens. 2018, 39, 8293–8316. [Google Scholar] [CrossRef]
- Jiang, H.; Jia, K.; Wang, Q.; Shang, J.; Liu, J.; Xie, X.; Dong, T. Angular Effect Correction for Improved LAI and FVC Retrieval Using GF-1 Wide Field View Data. IEEE Trans. Geosci. Remote Sens. 2023, 61, 1–14. [Google Scholar] [CrossRef]
- Lu, J.; He, T.; Liang, S.; Zhang, Y. An Automatic Radiometric Cross-Calibration Method for Wide-Angle Medium-Resolution Multispectral Satellite Senso Using Landsat Data. IEEE Trans. Geosci. Remote Sens. 2022, 60, 5604011. [Google Scholar] [CrossRef]
- Claverie, M.; Vermote, E.; Franch, B.; He, T.; Hagolle, O.; Kadiri, M.; Masek, J. Evaluation of Medium Spatial Resolution BRDF-Adjustment Techniques Using Multi-Angular SPOT4 (Take5) Acquisitions. Remote Sens. 2015, 7, 12057–12075. [Google Scholar] [CrossRef]
- Roy, D.P.; Zhang, H.K.; Ju, J.; Gomez-Dans, J.L.; Lewis, P.E.; Schaaf, C.B.; Sun, Q.; Li, J.; Huang, H.; Kovalskyy, V. A general method to normalize Landsat reflectance data to nadir BRDF adjusted reflectance. Remote Sens. Environ. 2016, 176, 255–271. [Google Scholar] [CrossRef]
- Vermote, E.; Justice, C.O.; Breon, F.M. Towards a Generalized Approach for Correction of the BRDF Effect in MODIS Directional Reflectances. IEEE Trans. Geosci. Remote Sens. 2009, 47, 898–908. [Google Scholar] [CrossRef]
- Bréon, F.-M.; Vermote, E. Correction of MODIS surface reflectance time series for BRDF effects. Remote Sens. Environ. 2012, 125, 1–9. [Google Scholar] [CrossRef]
- Jiao, Z.; Hill, M.J.; Schaaf, C.B.; Zhang, H.; Wang, Z.; Li, X. An Anisotropic Flat Index (AFX) to derive BRDF archetypes from MODIS. Remote Sens. Environ. 2014, 141, 168–187. [Google Scholar] [CrossRef]
- Delegido, J.; Verrelst, J.; Rivera, J.P.; Ruiz-Verdú, A.; Moreno, J. Brown and green LAI mapping through spectral indices. Int. J. Appl. Earth Obs. Geoinf. 2015, 35, 350–358. [Google Scholar] [CrossRef]
- Fang, H.; Baret, F.; Plummer, S.; Schaepman-Strub, G. An Overview of Global Leaf Area Index (LAI): Methods, Products, Validation, and Applications. Rev. Geophys. 2019, 57, 739–799. [Google Scholar] [CrossRef]
- Kimm, H.; Guan, K.; Jiang, C.; Peng, B.; Luo, Y. Deriving high-spatiotemporal-resolution leaf area index for agroecosystems in the U.S. Corn Belt using Planet Labs CubeSat and STAIR fusion data. Remote Sens. Environ. 2020, 239, 111615. [Google Scholar] [CrossRef]
- Villa, P.; Vecchia, A.D.; Piaser, E.; Bolpagni, R. Assessing PROSPECT performance on aquatic plant leaves. Remote Sens. Environ. 2024, 301, 113926. [Google Scholar] [CrossRef]
- Gitelson, A.A.; Viña, A.; Arkebauer, T.J.; Rundquist, D.C.; Keydan, G.; Leavitt, B. Remote estimation of leaf area index and green leaf biomass in maize canopies. Geophys. Res. Lett. 2003, 30, 1248. [Google Scholar] [CrossRef]
- Liu, S.; Zeng, W.; Wu, L.; Lei, G.; Chen, H.; Gaiser, T.; Srivastava, A.K. Simulating the Leaf Area Index of Rice from Multispectral Images. Remote Sens. 2021, 13, 3663. [Google Scholar] [CrossRef]
- Glenn, E.P.; Huete, A.R.; Nagler, P.L.; Nelson, S.G. Relationship between remotely-sensed vegetation indices, canopy attributes and plant physiological processes What vegetation indices can and cannot tell us about the landscape. Sensors 2008, 8, 2136–2160. [Google Scholar] [CrossRef] [PubMed]
- Ma, Y.; Zhang, Q.; Yi, X.; Ma, L.; Zhang, L.; Huang, C.; Zhang, Z.; Lv, X. Estimation of Cotton Leaf Area Index (LAI) Based on Spectral Transformation and Vegetation Index. Remote Sens. 2021, 14, 136. [Google Scholar] [CrossRef]
- Yang, S.; Huang, S.; Bai, Y.; Jia, Y.; Ba, Q.; Tian, S.; Zhong, X. On-orbit absolute radiometric calibration for the Multi-Spectral Imager of Jilin-1/GP02 based on multiple stable targets. Remote Sens. Technol. Appl. 2023, 38, 803–815. [Google Scholar] [CrossRef]
- Yibo, D.; Ruifei, Z.; Jialong, G.; Dong, W.; Zhong, X. Retrieval of crop Leaf Area Index based on Jilin-1GP image. Remote Sens. Technol. Appl. 2023, 38, 816–826. [Google Scholar]
- Cerovic, Z.G.; Moise, N.; Agati, G.; Latouche, G.; Ghozlen, N.B.; Meyer, S. New portable optical sensors for the assessment of winegrape phenolic maturity based on berry fluorescence. J. Food Compos. Anal. 2008, 21, 650–654. [Google Scholar] [CrossRef]
- Jia, K.; Liang, S.; Gu, X.; Baret, F.; Wei, X.; Wang, X.; Yao, Y.; Yang, L.; Li, Y. Fractional vegetation cover estimation algorithm for Chinese GF-1 wide field view data. Remote Sens. Environ. 2016, 177, 184–191. [Google Scholar] [CrossRef]
- Nicodemus, F.E.; Richmond, J.C.; Hsia, J.J.; Ginsberg, I.W.; Limperis, T. Geometrical Considerations and Nomenclature for Reflectance; National Bureau of Standards, US Department of Commerce: Washington, DC, USA, 1977.
- Schläpfer, D.; Richter, R.; Feingersh, T. Operational BRDF Effects Correction for Wide-Field-of-View Optical Scanners (BREFCOR). IEEE Trans. Geosci. Remote Sens. 2014, 53, 1855–1964. [Google Scholar] [CrossRef]
- Schaaf, C.B.; Gao, F.; Strahler, A.H.; Lucht, W.; Li, X.; Tsang, T.; Strugnell, N.C.; Zhang, X.; Jin, Y.; Muller, J.P. First operational BRDF, albedo nadir reflectance products from MODIS. Remote Sens. Environ. 2002, 83, 135–148. [Google Scholar] [CrossRef]
- Wanner, W.; Ah, S.; Li, X. On the derivation of kernels for kernel-driven models of bidirectional reflectance. J. Geophys. Res. Biogeosci. 1995, 100, 21077–21089. [Google Scholar] [CrossRef]
- Zhang, H.; Jiao, Z.; Dong, Y.; Li, X. Evaluation of BRDF Archetypes for Representing Surface Reflectance Anisotropy Using MODIS BRDF Data. Remote Sens. 2015, 7, 7826–7845. [Google Scholar] [CrossRef]
- Jordan, C.F. Derivation of Leaf-Area Index from Quality of Light on the Forest Floor. Ecology 1969, 50, 663–666. [Google Scholar] [CrossRef]
- Rouse, J.; Haas, R.; Schell, J.; Deering, D. Monitoring vegetation systems in the great plains with ERTS. In R. Monitoring Vegetation Systems in the Great Plains with ERTS[C]//Third NASA Earth Resources Technology Satellite Symposium; NASA Goddard Space Flight Center 3d ERTS-1 Symp., Vol. 1, Sect. A; NASA Goddard Space Flight Center: Greenbelt, MD, USA, 1973; pp. 309–317. Available online: https://ntrs.nasa.gov/citations/19740022614 (accessed on 14 May 2024).
- Gitelson, A.; Merzlyak, M.N. Spectral reflectance changes associated with autumn senescence of Aesculus hippocastanum L. and Acer platanoides L. Leaves. Spectral features and relation to chlorophyll estimation. J. Plant Physiol. 1994, 143, 286–292. [Google Scholar] [CrossRef]
- Jiang, Z.; Huete, A.; Didan, K.; Miura, T. Development of a two-band enhanced vegetation index without a blue band. Remote Sens. Environ. 2008, 112, 3833–3845. [Google Scholar] [CrossRef]
- Qi, J.; Chehbouni, A.; Huete, A.R.; Kerr, Y.H.; Sorooshian, S. A Modified Soil Adjusted Vegetation Index. Remote Sens. Environ. 1994, 48, 119–126. [Google Scholar] [CrossRef]
- Haboudane, D.; Miller, J.R.; Pattey, E.; Zarco-Tejada, P.J.; Strachan, I.B. Hyperspectral vegetation indices and novel algorithms for predicting green LAI of crop canopies: Modeling and validation in the context of precision agriculture. Remote Sens. Environ. 2004, 90, 337–352. [Google Scholar] [CrossRef]
- Gao, F.; He, T.; Masek, J.G.; Shuai, Y.; Schaaf, C.B.; Wang, Z. Angular Effects and Correction for Medium Resolution Sensors to Support Crop Monitoring. IEEE J. Sel. Top. Appl. Earth Obs. Remote Sens. 2014, 7, 4480–4489. [Google Scholar] [CrossRef]
Disclaimer/Publisher’s Note: The statements, opinions and data contained in all publications are solely those of the individual author(s) and contributor(s) and not of MDPI and/or the editor(s). MDPI and/or the editor(s) disclaim responsibility for any injury to people or property resulting from any ideas, methods, instructions or products referred to in the content. |
© 2024 by the authors. Licensee MDPI, Basel, Switzerland. This article is an open access article distributed under the terms and conditions of the Creative Commons Attribution (CC BY) license (https://creativecommons.org/licenses/by/4.0/).