Technical Note

Examining the Capability of the VLF Technique for Nowcasting Solar Flares Based on Ground Measurements in Antarctica

1
Department of Space Physics, School of Electronic Information, Wuhan University, Wuhan 430072, China
2
Hubei Luojia Laboratory, Wuhan 430072, China
3
MNR Key Laboratory for Polar Science, Polar Research Institute of China, Shanghai 200136, China
*
Author to whom correspondence should be addressed.
Remote Sens. 2024, 16(12), 2092; https://doi.org/10.3390/rs16122092
Submission received: 25 April 2024 / Revised: 31 May 2024 / Accepted: 4 June 2024 / Published: 9 June 2024

Abstract

:
Measurements of Very-Low-Frequency (VLF) transmitter signals have been widely used to investigate the effects of various space weather events on the D-region ionosphere, including nowcasting solar flares. Previous studies have established a method to nowcast solar flares using VLF measurements, but only using measurements from dayside propagation paths, and there remains limited focus on day–night mixed paths, which are important for method applicability. Between March and May of 2022, the Sun erupted a total of 56 M-class and 6 X-class solar flares, all of which were well captured by our VLF receiver in Antarctica. Using these VLF measurements, we reexamine the capability of the VLF technique to nowcast solar flares by including day–night mixed propagation paths and expanding the path coverage in longitude compared to that in previous studies. The amplitude and phase maximum changes are generally positively correlated with X-ray fluxes, whereas the time delay is negatively correlated. The curve-fitting parameters that we obtain for the X-ray fluxes and VLF signal maximum changes are consistent with those in previous studies for dayside paths, even though different instruments are used, supporting the flare-nowcasting method. Moreover, the present results show that, for day–night mixed paths, the amplitude and phase maximum changes also scale linearly with the logarithm of the flare X-ray fluxes, but the level of change is notably different from that for dayside paths. The coefficients used in the flare-nowcasting method need to be updated for mixed propagation paths.

1. Introduction

The D-region ionosphere, namely, the lowest layer of the ionosphere (~60–100 km altitude) and the transition region between the neutral and ionized atmosphere, is constantly influenced by various cosmic, solar, magnetospheric, and atmospheric events [1], including solar eclipses [2,3,4,5,6], solar flares [7,8,9,10,11,12], galactic cosmic rays [13,14], lighting discharge [15,16,17,18], and energetic particle precipitation from the Earth’s radiation belts [19,20,21]. Very-Low-Frequency (VLF, 3–30 kHz) waves can travel with relatively low attenuation in the waveguide composed of the Earth’s surface and the lower ionosphere [1,22]. The disturbance of the ionospheric D layer caused by the above-mentioned events is well reflected in the VLF transmitter signals received by ground-based instruments [1,23,24,25]. As such, the VLF technique represents one of the most reliable means to continuously monitor the solar and cosmic activities that affect the D-region ionosphere [26,27,28,29,30,31].
A solar flare is an explosive activity that releases an enormous amount of energy over a short period of time through visible/ultraviolet light and X-rays. After propagating to the Earth’s atmosphere, the X-ray fluxes produced by solar flares can largely enhance the ionization process and cause a rapid increase in the electron density in the ionosphere, especially in the D-region [7,32,33,34]. Such variations in the D-region electron density profile could further modify the VLF signals’ amplitude and phase [35,36,37,38,39].
The relationship between VLF transmitter signals and solar flares has been investigated for decades [32,38]. Mitra [32] summarized the effects of solar flares on the D-region ionosphere: the excess ionization induced by solar flares lowers the effective reflection height and results in perturbation in the VLF signals’ amplitude and phase. By analyzing the variations in the reflection height and VLF phase measurements, McRae and Thomson [38] found that the height lowered by solar flares and phase advancement is nearly proportional to the logarithm of solar X-ray fluxes. Based on this relation, the VLF technique has been proposed for nowcasting solar flare events, as reported by Wenzel et al. [40] and George et al. [41]. A study by Belcher et al. [42] further expanded this idea by determining the fitting coefficients between the VLF phase and solar-flare-emitted X-ray fluxes. Moreover, Hayes et al. [43] reported pulsations of the ionospheric D-region due to small-scale changes in solar flare X-rays. Kumar and Kumar [44] quantified the influence of solar flares on the reflection height and sharpness parameter during solar cycle 24, including low- and high-activity phases.
Between March and May of 2022, solar flares occurred more frequently compared to the past few years during the ascending phase of solar cycle 25. The Sun erupted 6 X-class and 56 M-class solar flares, all of which were well captured by our VLF receiver installed in Antarctica. The nowcasting technique of George et al. [41] and Belcher et al. [42] was mainly developed using VLF measurements from dayside paths, and there remains limited focus on day–night mixed paths. This motivates us to revisit the relationship between changes in VLF signals’ amplitude and phase, and the fluxes of solar flare X-rays using measurements from day–night mixed propagation paths. Moreover, the transmitter–receiver paths utilized in this study can provide broader coverage in longitude than those in previous studies. This study is helpful for improving the applicability of the VLF technique for nowcasting solar flares.

2. Measurements and Methodology

2.1. VLF Measurements of Solar Flares at GWS

We use the VLF data collected between March and May in the year of 2022 at the Great Wall Station (GWS, 62.22°S, 58.96°W) in Antarctica. These data were obtained using a receiver developed by Wuhan University (WHU) and recently deployed in Antarctica [45,46]. Composed of two orthogonal magnetic loop antennae with the shape of a regular triangle [45], this system can pick up broadband electromagnetic signals with frequencies of 1–50 kHz and a sampling frequency of 250 kHz [47,48,49,50,51], which covers the frequency range of VLF transmitters that are principally used to support naval operations. The dynamic range and timing accuracy of this system are ~110 dB and 100 ns, respectively [45].
In this study, to perform an unbiased analysis, we mainly focus on VLF measurements with good signal-to-noise ratios. It is from this perspective that the VLF signals transmitted by NPM (21.42°N, 158.15°W, 21.4 kHz), NAA (44.64°N, 67.28°W, 24.0 kHz), and HWU (46.71°N, 1.25°E, 21.7 kHz) are used. Based on the Minimum Shifting Key (MSK) method [52], we can extract the amplitude and phase data, specifically following the method described in Gross et al. [53].
Since its deployment in early 2022, the WHU VLF system has been recording transmitter signals with a cadence of 10 s (1 s acquisition time and 9 s intervals). The temporal resolution is 10 s. For the sake of analysis, in this study, we average the VLF measurements every 10 s, and amplitude and phase data are obtained with a cadence of 10 s [54]. Table 1 lists the transmitter location, frequency, midpoint location, and length of the great circle path between the different transmitters (NPM, NAA, and HWU) and our receiver at the GWS. Figure 1 shows the corresponding great circle paths between the NPM, NAA, and HWU transmitters and the GWS. The red triangles and pink circle denote the VLF transmitters and the GWS, respectively. Of note, the NAA-GWS and HWU-GWS paths cross the South Atlantic Anomaly (SAA), and the propagation of transmitter signals could be affected by the magnetic field anomaly and energetic precipitation particles therein. We emphasize that the SAA effects are properly removed in this study since we calculate the net change in VLF signals due to solar flares using a detrending method.

2.2. Identifying Solar Flare Events

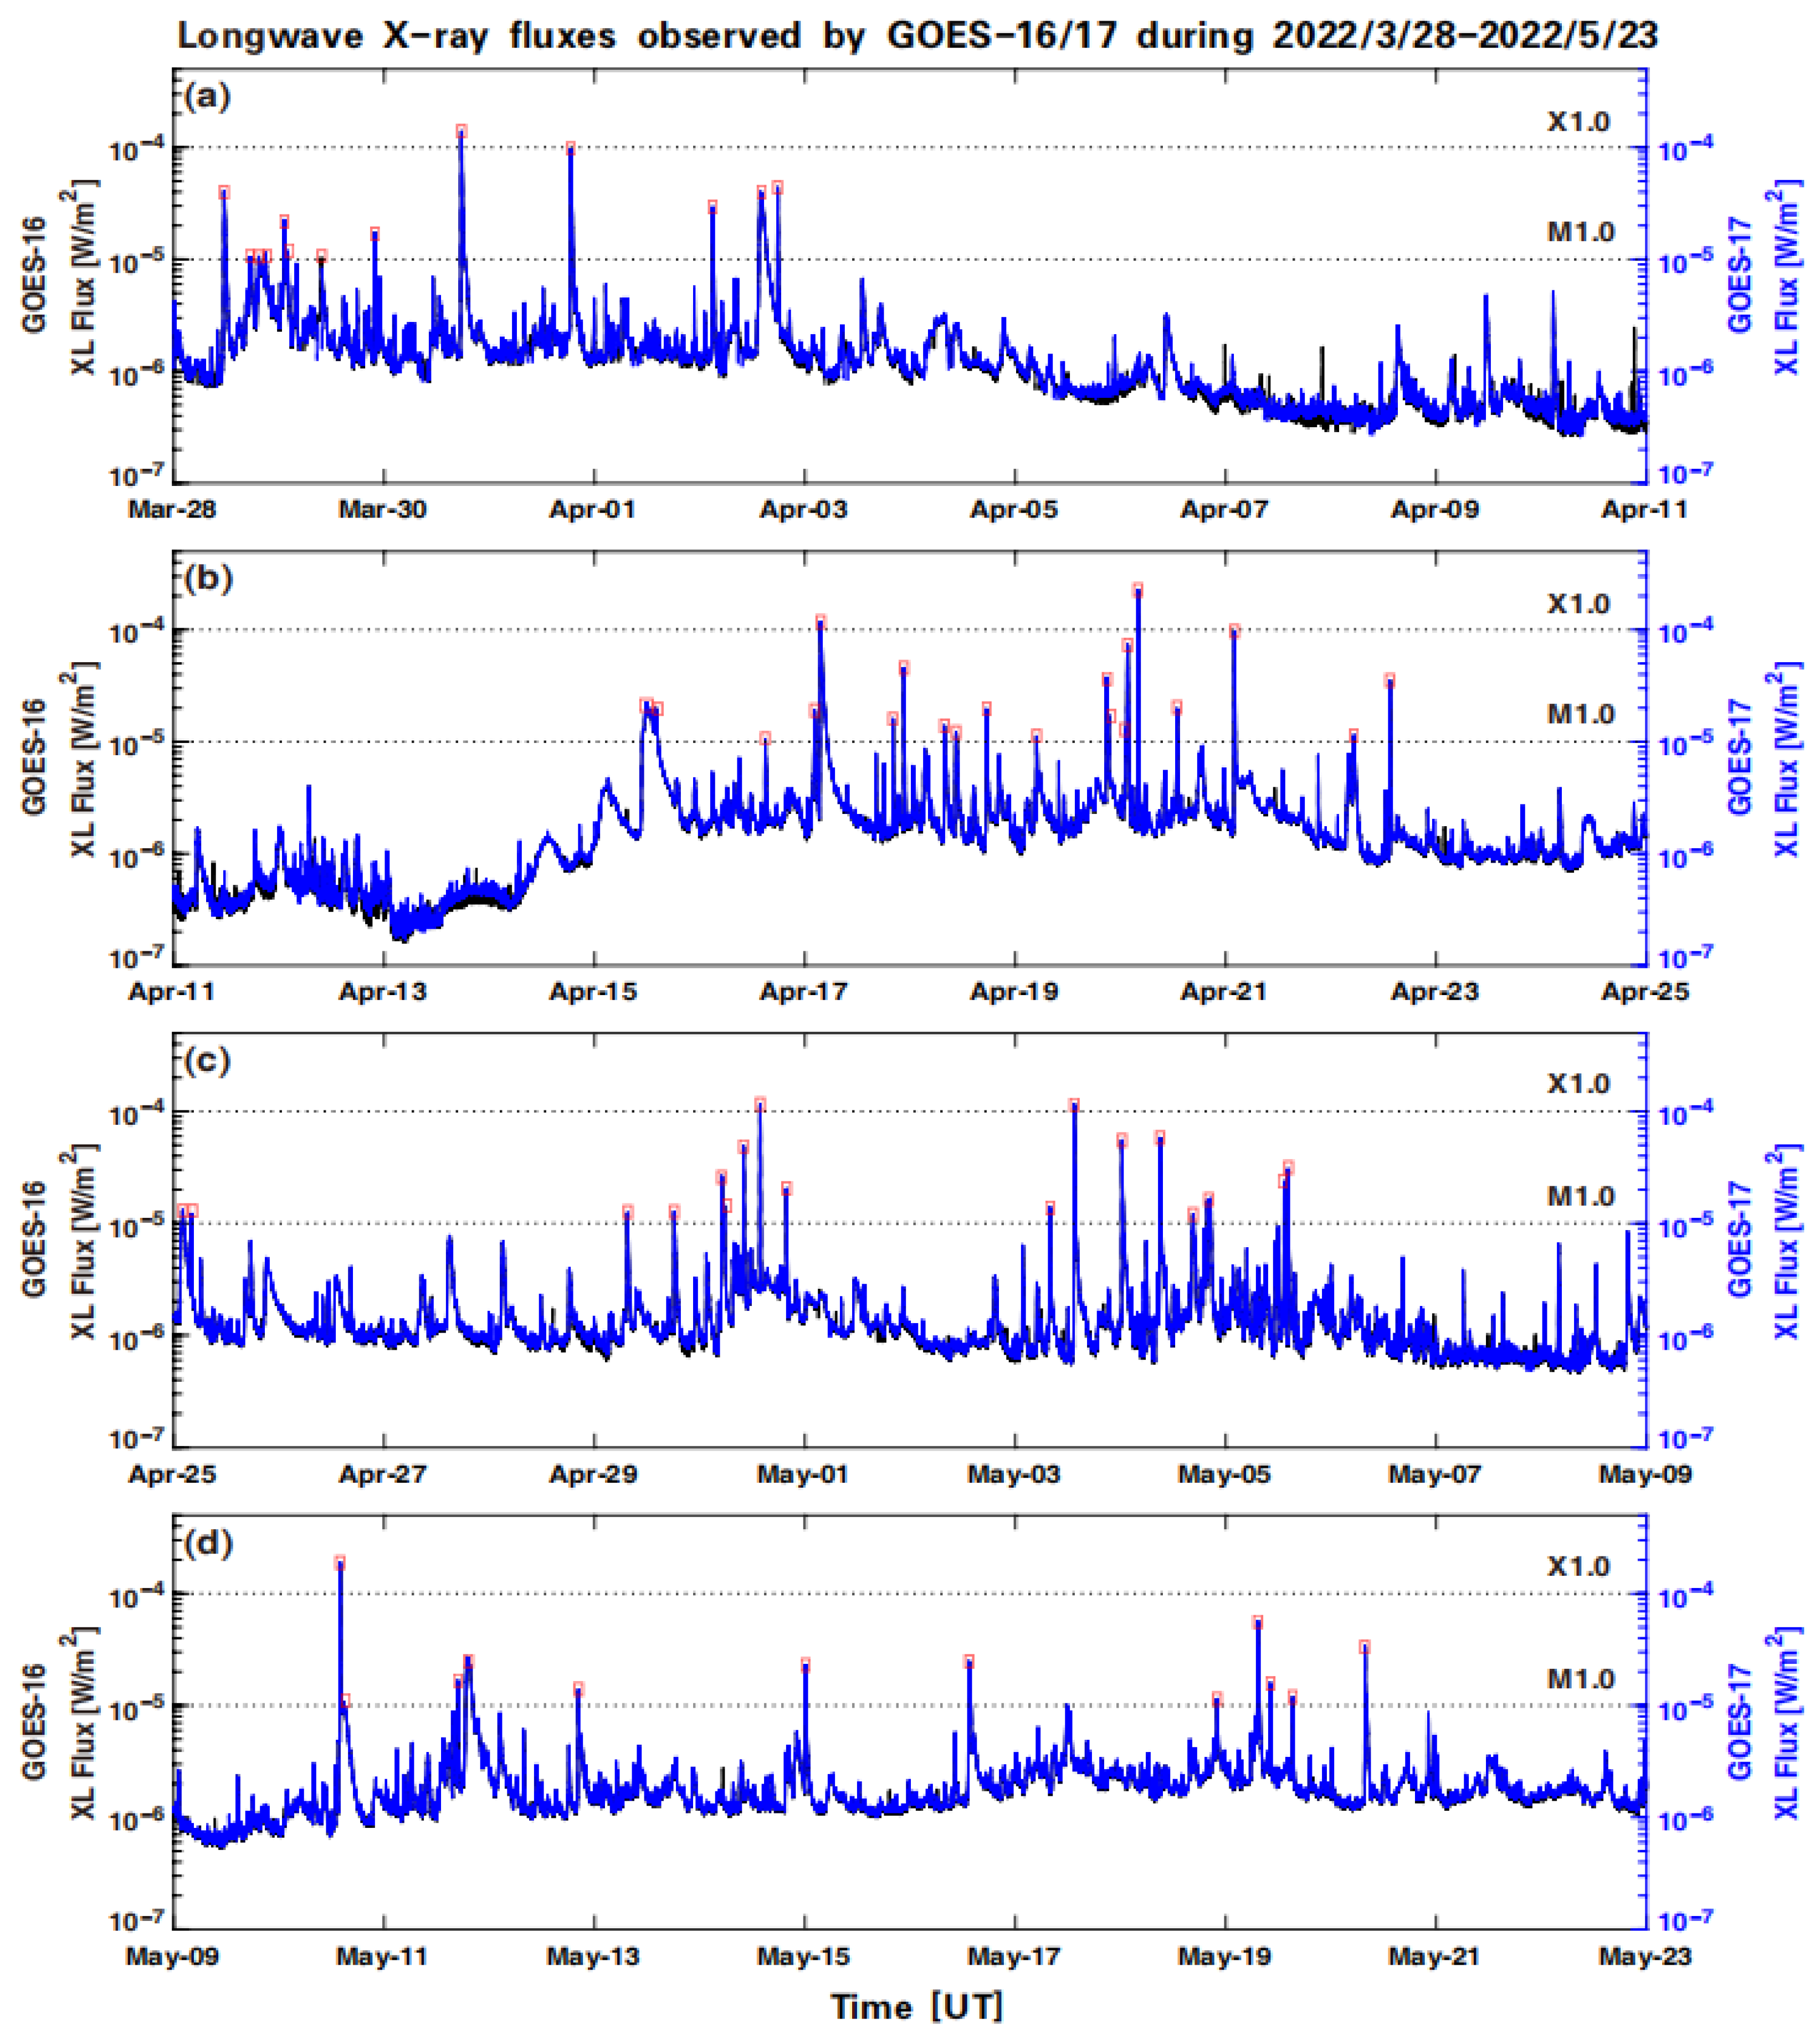
To analyze the VLF response, we first identify the M- and X-class solar flare events between 28 March and 23 May 2022. Specifically, we use the flux data of long-wavelength (XL, 0.1 to 0.8 nm) X-rays provided by the X-Ray Sensor (XRS) B instrument onboard the Geostationary Operational Environment Satellites (GOESs), as obtained from the National Oceanic and Atmospheric Administration (NOAA) website (https://data.ngdc.noaa.gov/platforms/solar-space-observing-satellites/goes/, accessed on 1 January 2024). Figure 2 displays the X-ray fluxes in the XL wavelength range measured by GOESs 16 and 17, as marked using black and blue lines, respectively. As shown in Figure 2, when solar activity is quiet, the XL flux remains less than 10−6 W/m2. As solar activity becomes more intense, for example, during the eruption of solar flares, the XL flux rapidly increases to the order of 10−6–10−4 W/m2 and exhibits great variation with time. The intensity of solar flare eruptions varies from event to event and is typically categorized using the classes of C, M, and X, corresponding to maximum fluxes of 10−6, 10−5, and 10−4 W/m2, respectively. It is not unexpected that the black lines, corresponding to the GOES 16 measurements, lay almost on top of the GOES 17 measurements, and, for simplicity, the GOES 16 data are used for the present analysis.
In this paper, we used GOES data with a 1 s resolution to identify the start times of M- and X-class solar flares with the following criteria: (1) the flux increases continuously for 4 min; (2) the X-ray flux in the XL range is greater than 10−6 W/m2; and (3) the last data point is 1.3 times greater than the initial value. The end time was chosen to be the time when the X-ray flux decreases by a factor of 2 from the peak value of each event. Although our method slightly differs from that defined by NOAA [55], we carefully checked that our method could clearly identify all M- and X-class solar flares, especially events that occur consecutively in time. With this method, we identified the start and end times for the 56 M-class and 6 X-class solar flare events from March 28 to May 23, 2022, as highlighted using red rectangular boxes in Figure 2. The specific start time, end time, peak time, and peak fluxes are provided in Table S1 in the Supporting Information.

2.3. VLF Data Processing

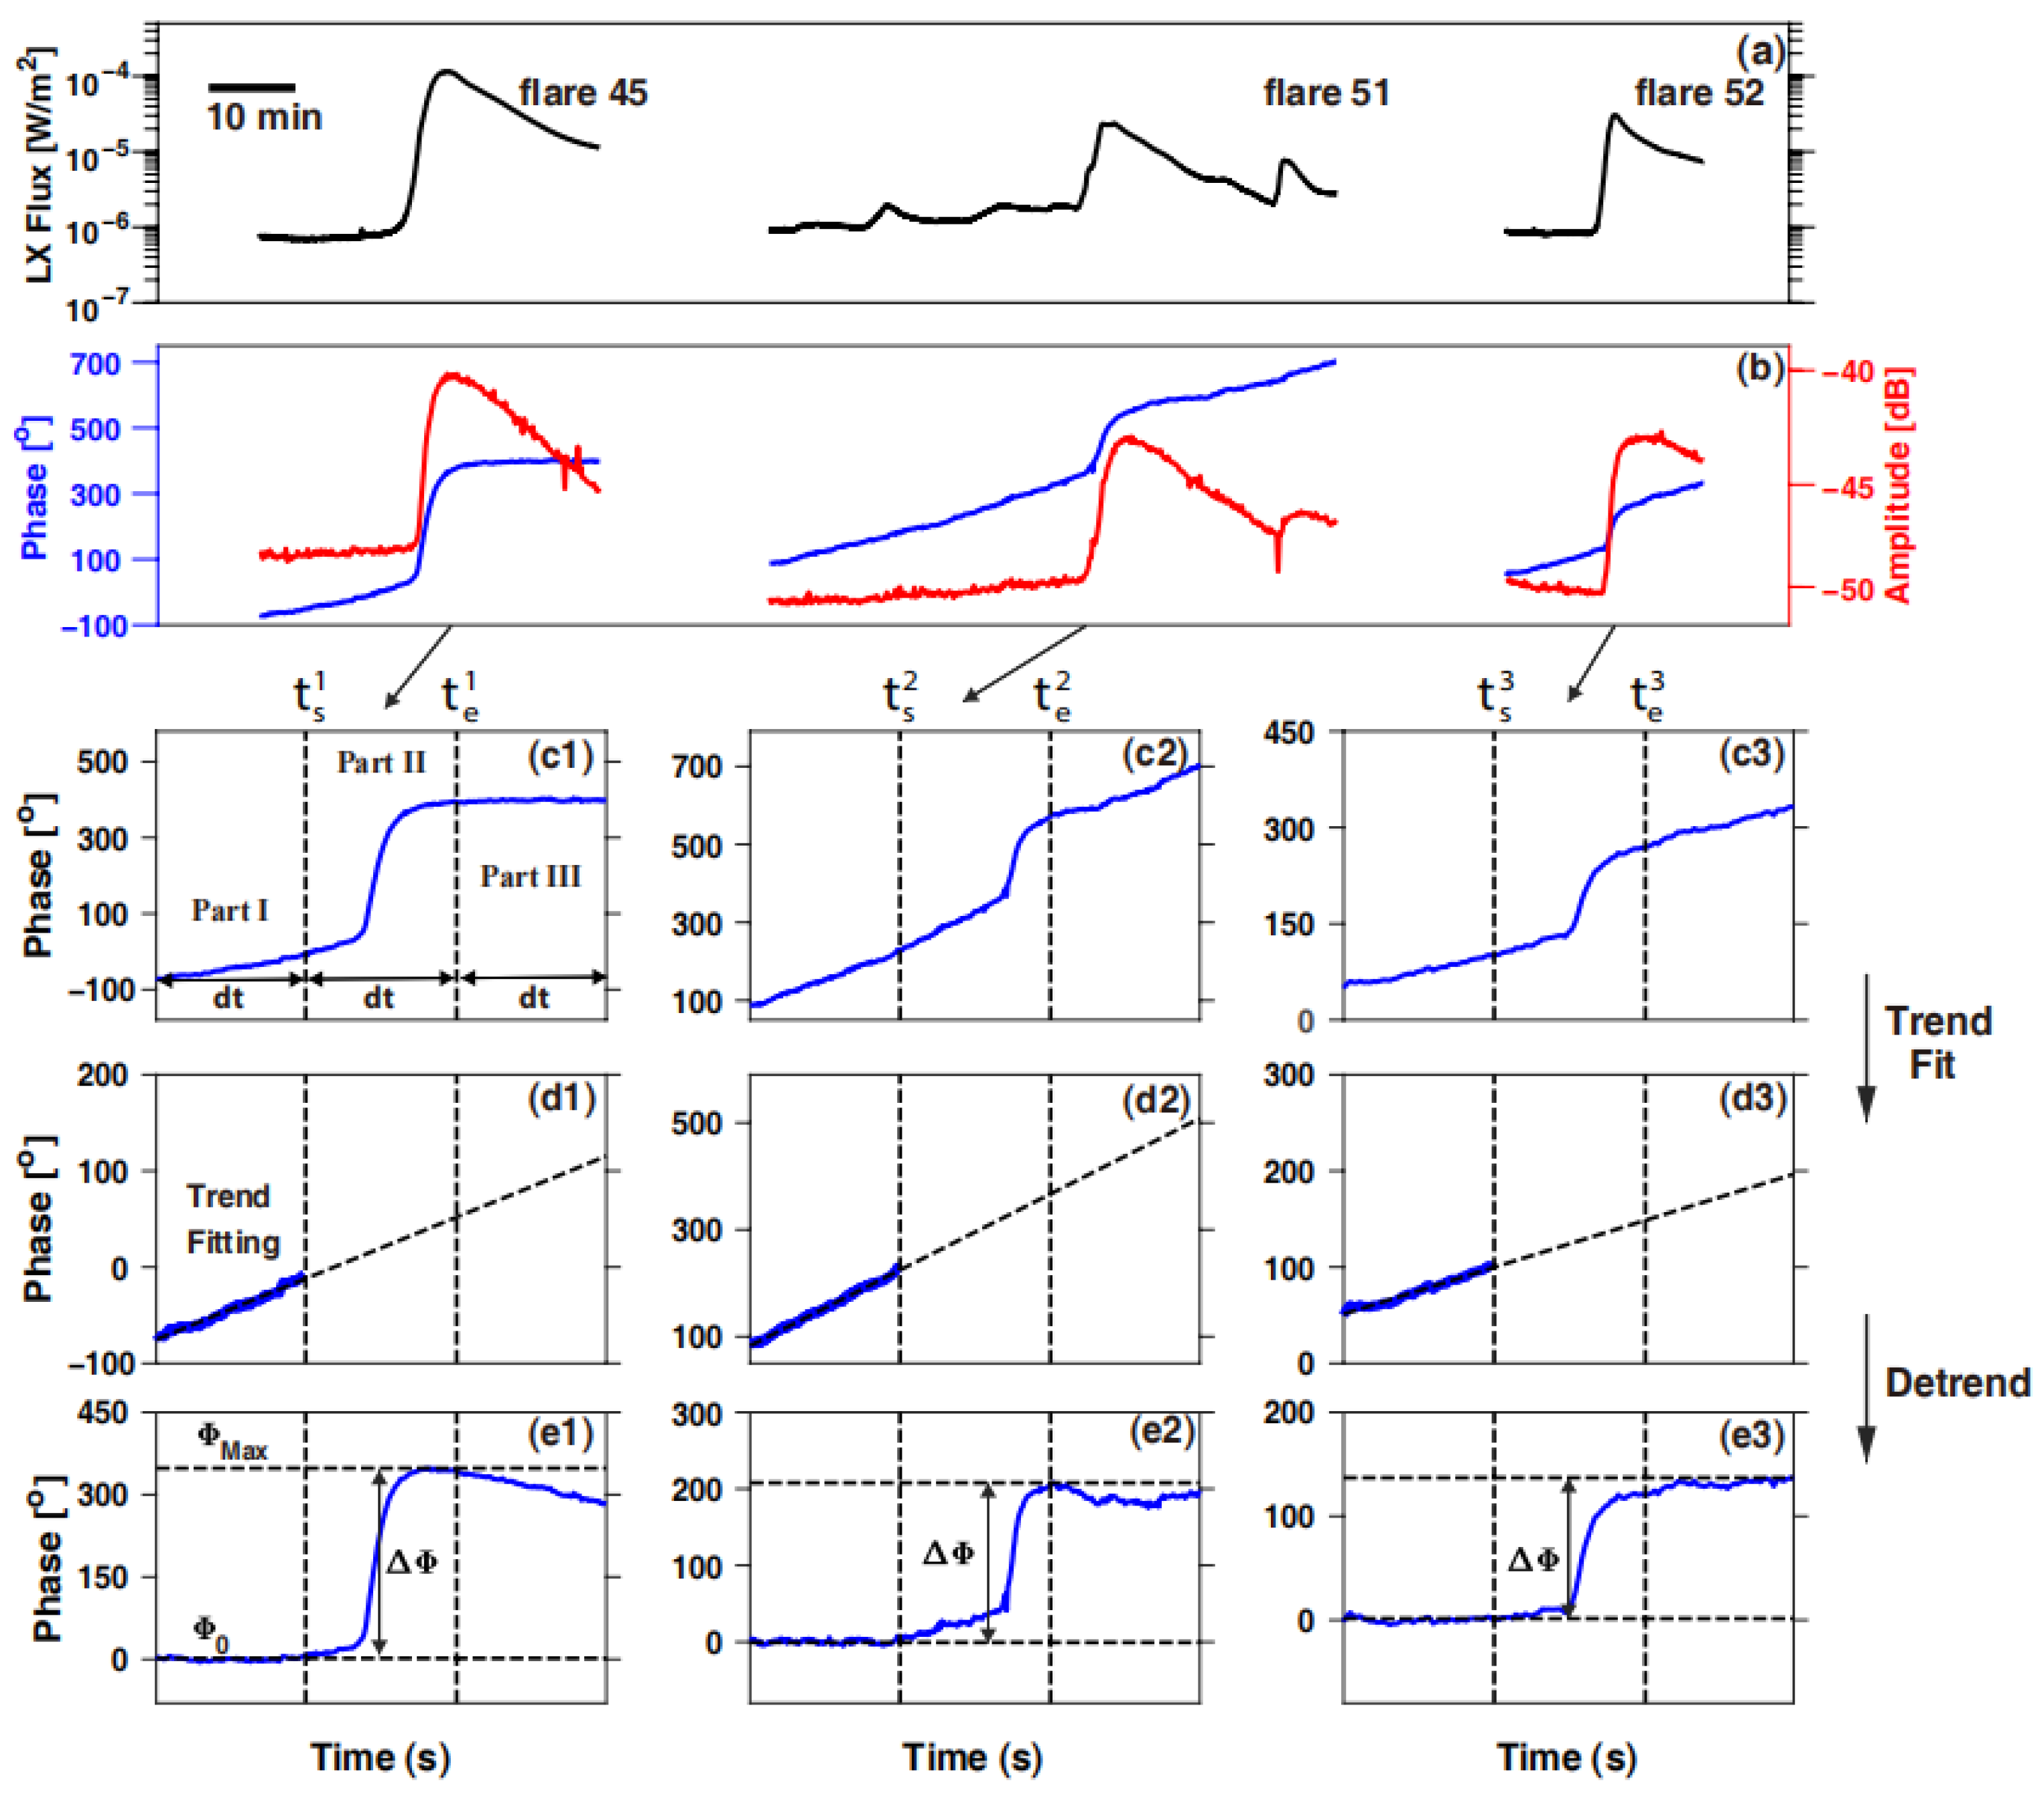
After identifying the start and end times of all flare events, we further process the VLF data collected during each flare event. During quiet-time conditions, measurements of VLF transmitter signals exhibit typical diurnal changes. Moreover, the phase of transmitter signals has long been known to be unstable for some transmitters [44,53]. In this scenario, a constant phase drift can sometimes be found in the demodulated VLF data. To investigate the effects of solar flares, it is necessary to calculate the net change caused by solar flares and remove the background variation. Specifically, we first calculate the net change in the VLF signals by determining the background variation and then removing it from the VLF measurements during solar flares (we refer to this as the ‘detrending’ process hereafter). We use three representative solar flare events to showcase this data processing procedure, as shown in Figure 3. Note that George et al. [41] pointed out that the phase change can be used to more accurately nowcast solar flares, as compared to the amplitude change. Because of this, Belcher et al. [42] concentrated on using phase data to nowcast solar flares. However, since our goal is to examine the nowcasting capability of VLF measurements from day–night mixed paths, we quantify the relation between the flux of flare X-rays and the maximum change in both the amplitude and phase for the sake of completeness.
Figure 3a shows the X-ray fluxes from GOES 16 during three representative solar flare events, while Figure 3b shows the corresponding amplitude and phase measurements of the VLF signals from the HWU transmitter. Each event has a different duration, and the length of a 10 min interval is illustrated in the upper left corner of Figure 3a. Detailed information on each flare event, including the start, peak, end time, and intensity, is listed in Table S1 in the Supporting Information. It is clear in Figure 3a,b that the VLF signals, including both the amplitude and phase, closely follow those of the X-ray fluxes during solar flares. Moreover, the magnetic field anomaly in South Atlantic regions can also influence the propagation of VLF signals, especially those of the transmitters in North America. Therefore, it is necessary to remove the background trend and calculate the net effects in terms of the VLF measurement changes caused by solar flares.
A detrending procedure is applied to each event in order to obtain the perturbation in VLF measurements caused by solar flares. This procedure for flare event 45 is shown in Figure 3(c1), (d1) and (e1), specifically in three steps. First, as illustrated in Figure 3(c1), the duration of each flare event dt = te − ts is calculated based on the X-ray flux, where te and ts denote the end and start times of the solar flare event, as determined using the criteria explained in Section 2.2. The phase and amplitude data during the period of [ts − dt, te + dt] are used for calculating the background trend and divided into three parts: Part I [ts − dt, ts], Part II [ts, te], and Part III [te, te + dt], as marked in Figure 3(c1). It is clear in Figure 3(c1–c3) that the background trend can be well fitted using a linear function.
Second, we calculate the background trend by fitting the phase change in Part I using a linear function. Finally, the phase change caused by solar flares is obtained by subtracting the background trend from the raw phase measurements in Part II. The phase maximum change ΔΦ explicitly corresponds to the difference between the peak and start times of the solar flares. The same procedure is applied to the amplitude data, and a similar illustration is shown in Figure S1 in the Supporting Information.
However, this method is not applicable to flare events without a clear response, which need to be excluded for the sake of analysis. To determine whether the VLF signals exhibit a clear response to solar flare events, the correlation coefficients between the X-ray flux and the phase/amplitude of the VLF data are calculated. Specifically, the VLF data and X-ray fluxes between ts and te, and between ts − dt and te + dt are used, and we calculate four correlation coefficients between the VLF data and the X-ray fluxes for each event (two parameters and two time segments). We label the above-mentioned 62 flare events as either ‘response’ or ‘no response’ using these coefficients. The ‘response’ events are those with three or more correlation coefficients larger than 0.85, whereas for ‘no response’ events, the corresponding number is only two or less.

3. Analysis Results

3.1. The Effects of the Solar Zenith Angle

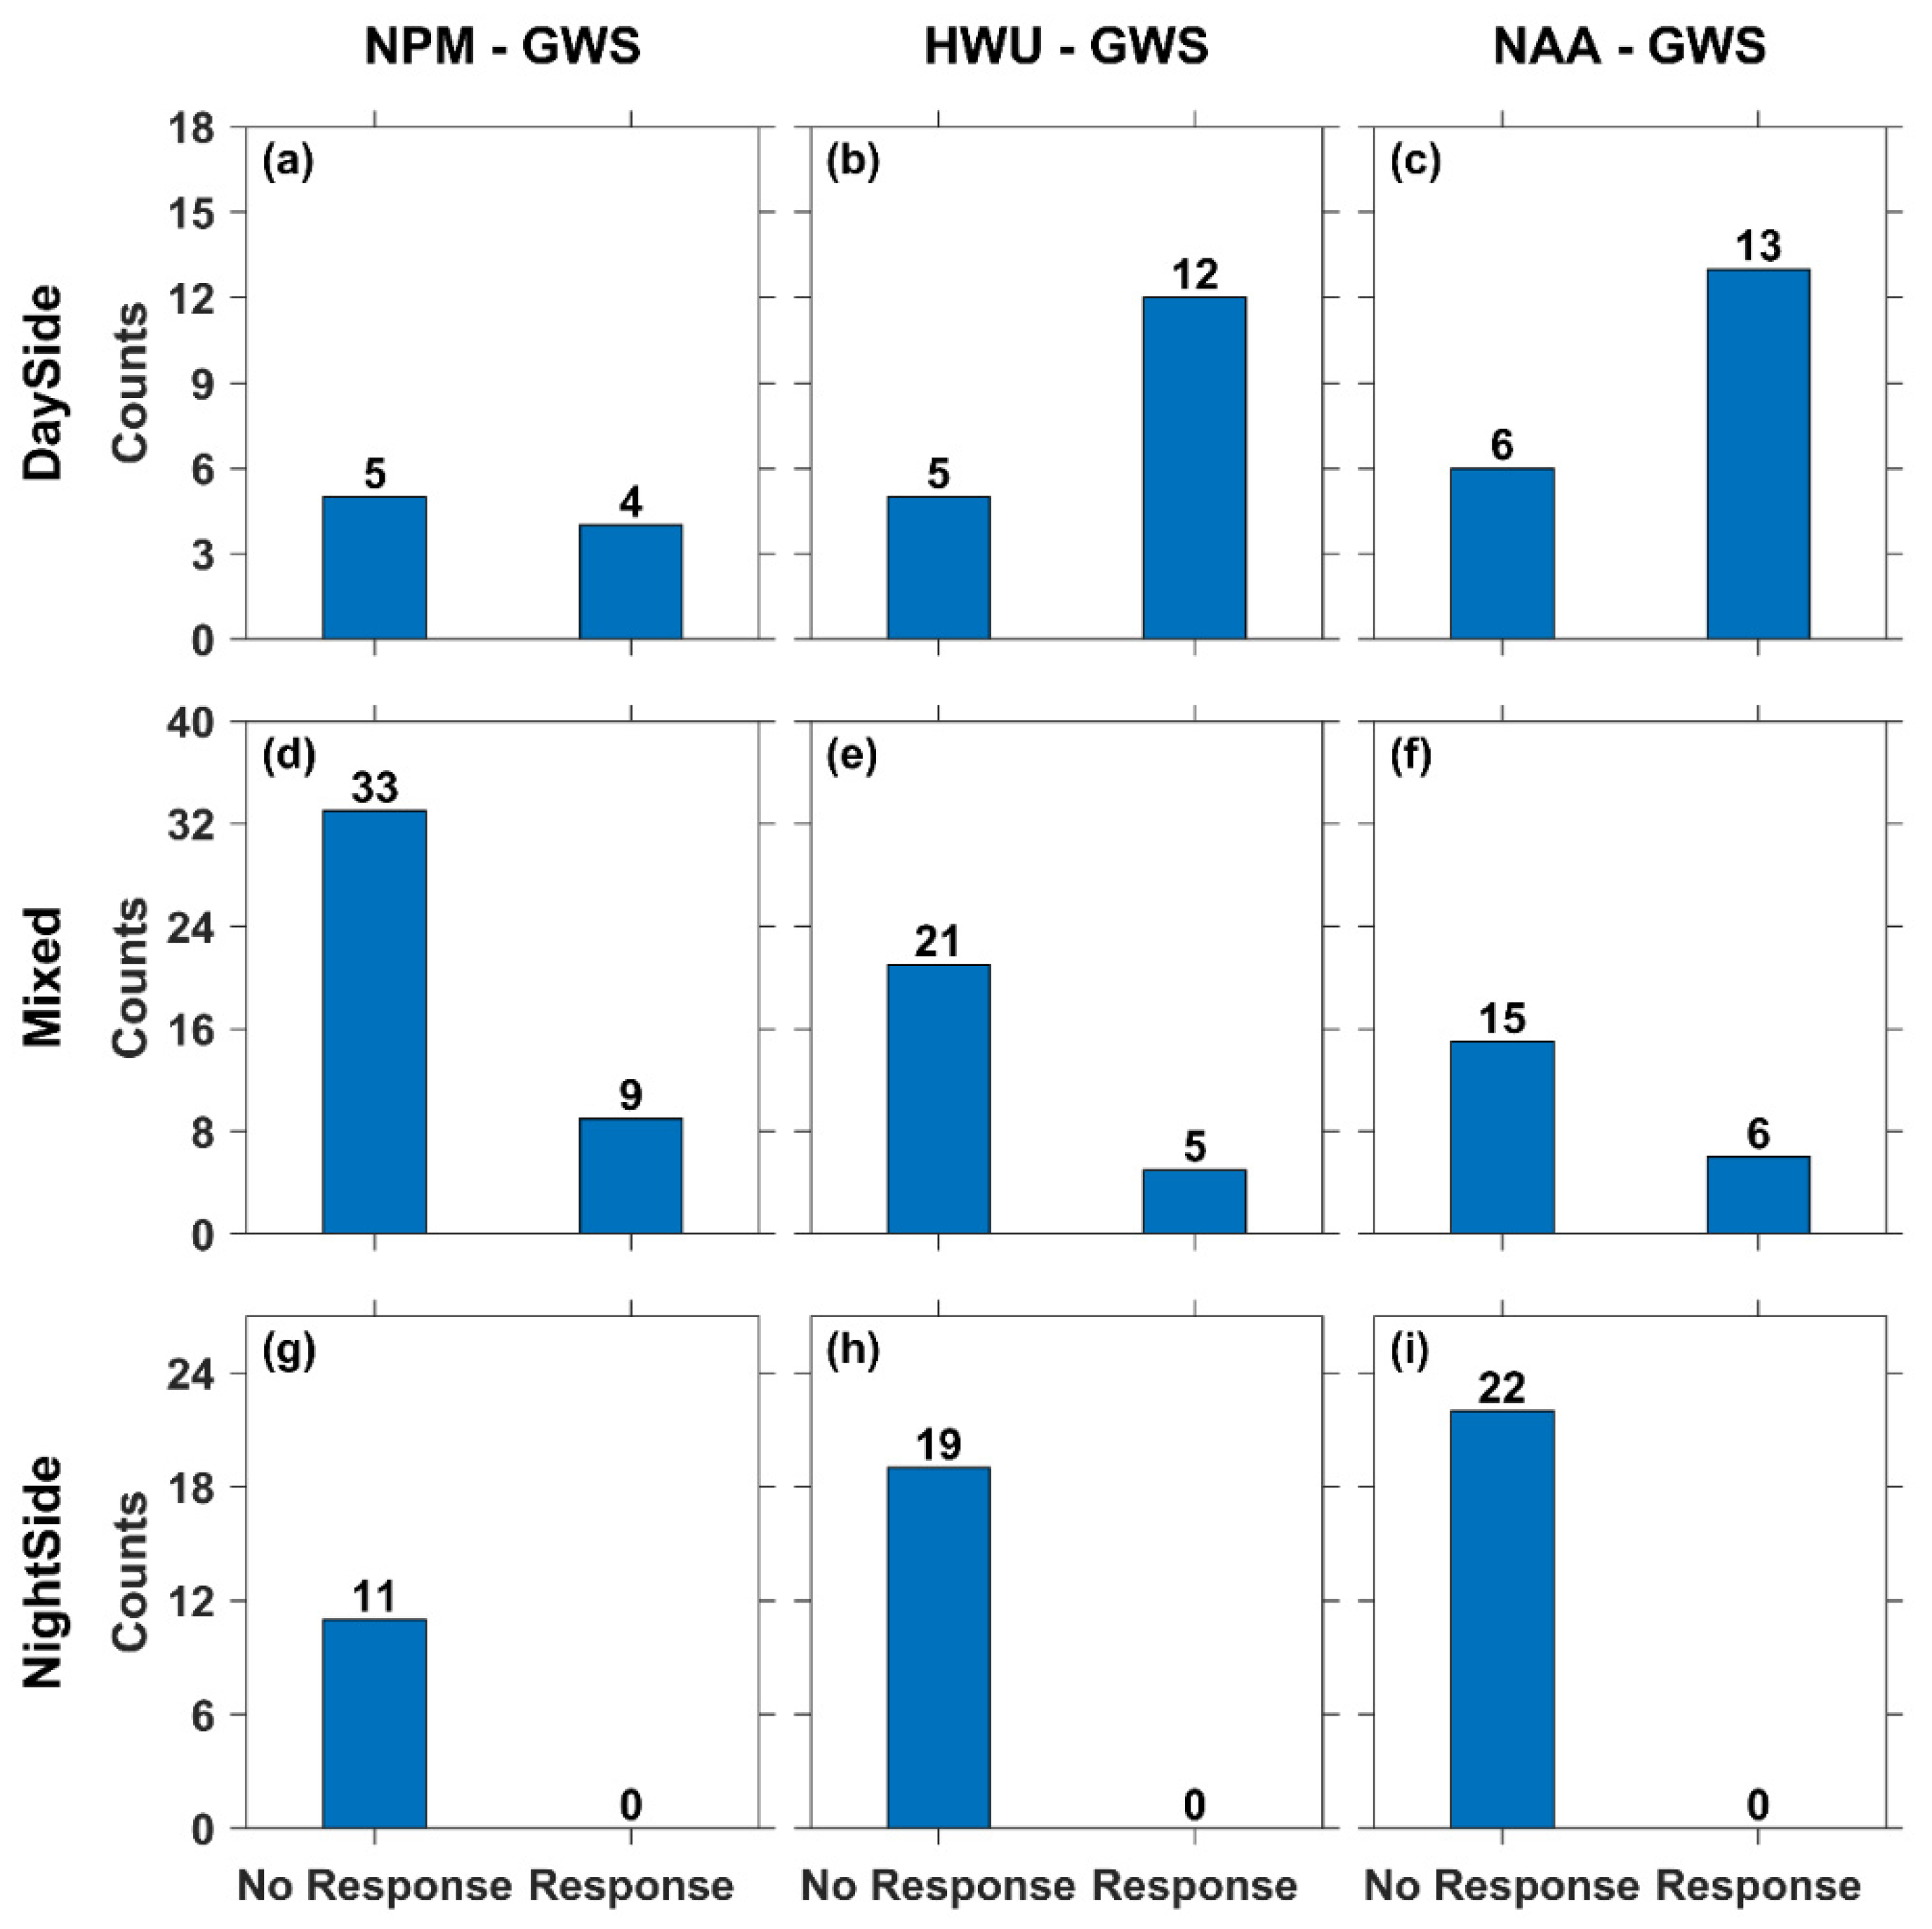
Before analyzing the solar flare effects, we first examine the dependence of the VLF response on the solar zenith angle (SZA). Figure 4 displays the total number of events measured at the GWS with and without a clear response to solar flares for the different VLF transmitters. Based on the SZA of each transmitter–receiver path, the VLF measurements are classified into three groups: (1) dayside paths, along which the SZAs at the transmitter, the receiver, and the middle point during the whole solar flare event are less than 87° (referred to as dayside paths hereafter); (2) nightside paths, where the SZAs at these locations are greater than 93° (referred to as nightside paths hereafter); and (3) day–night mixed paths, which include all the events that are not included in the first two groups (referred to as mixed paths hereafter).
Because the three paths, that is, the NPM-GWS, HWU-GWS, and NAA-GWS paths, have wide coverage in longitude, they can be well classified into dayside, nightside, and mixed conditions, with a statistically significant number of events classified under each condition. As shown in Figure 4, since the NPM-GWS path covers a wider range in longitude, this path has more events classified into the group of day–night mixed conditions, followed by the HWU-GWS path, whereas the event count distribution is nearly even for the NAA-GWS path. Figure 4 also provides information about the ratio between the ‘response’ and ‘no response’ events for the different paths. It is not unexpected that we obtain more ‘response’ events for the dayside paths compared to for the mixed paths, as well as no ‘response’ events for the nightside paths.
To further examine the relation between the VLF response and the SZA, the SZA at the peak time of each solar flare and at the middle point of each path is further calculated. This SZA value is regarded as representative of the given transmitter–receiver path, following that defined in George et al. [41] and Belcher et al. [42]. Figure 5 shows the total number of ‘response’ and ‘no response’ events versus the SZA at the middle point of the different VLF propagation paths. The bars in blue and orange in Figure 5 mark events with and without a clear response to solar flares, respectively. The SZAs at the middle point of the NPM-GWS path are mostly between 30° and 165°, while the SZAs for the HWU-GWS and NAA-GWS paths are slightly larger, ranging from 15° to 180°. We emphasize that there is only one clear response case with SZA ≥ 90° for the NPM-GWS path, as shown in Figure S2 in the Supporting Information, and there is no response event with SZA ≥ 90° for the other paths. It is possible that, for the event with a clear response with SZA ≥ 90°, a part of the path is under daytime conditions. In addition, it is worth noting that, since the corresponding phase measurements of this event are unreliable compared with the others, we can exclude it when we analyze the solar flare effects on the change in the VLF amplitude and phase for the mixed paths. The HWU-GWS path also covers a wide range in longitude, and, thus, we find several events with clear responses when the SZA is close to 90°. However, the NAA-GWS path is almost north–south oriented, the corresponding VLF measurements are severely affected by the SZAs, and we find no event with a ‘response’ when the SZA is close to 90°.
It is evidenced in Figure 5 that the number of events with SZA < 90° is roughly equal to that with SZA ≥ 90°, while the SZA for all events with a clear VLF response is less than 90°. Additionally, for the events with SZAs smaller than 90°, the ratio between ‘response’ and ‘no response’ events decreases significantly as the SZA becomes closer to 90°. This finding is in line with the fact that the X-ray fluxes of solar flares can only ionize the hemisphere illuminated by sunlight, and a clear VLF response can only be found for the dayside and mixed paths. Moreover, this finding also agrees with the dependence of the VLF change on the SZA reported in Kumar and Kumar [44]. As such, we use the dayside and mixed paths to examine the relation between the solar X-rays and VLF phase change, as shown in the following.

3.2. Solar Flare Effects on Dayside Paths

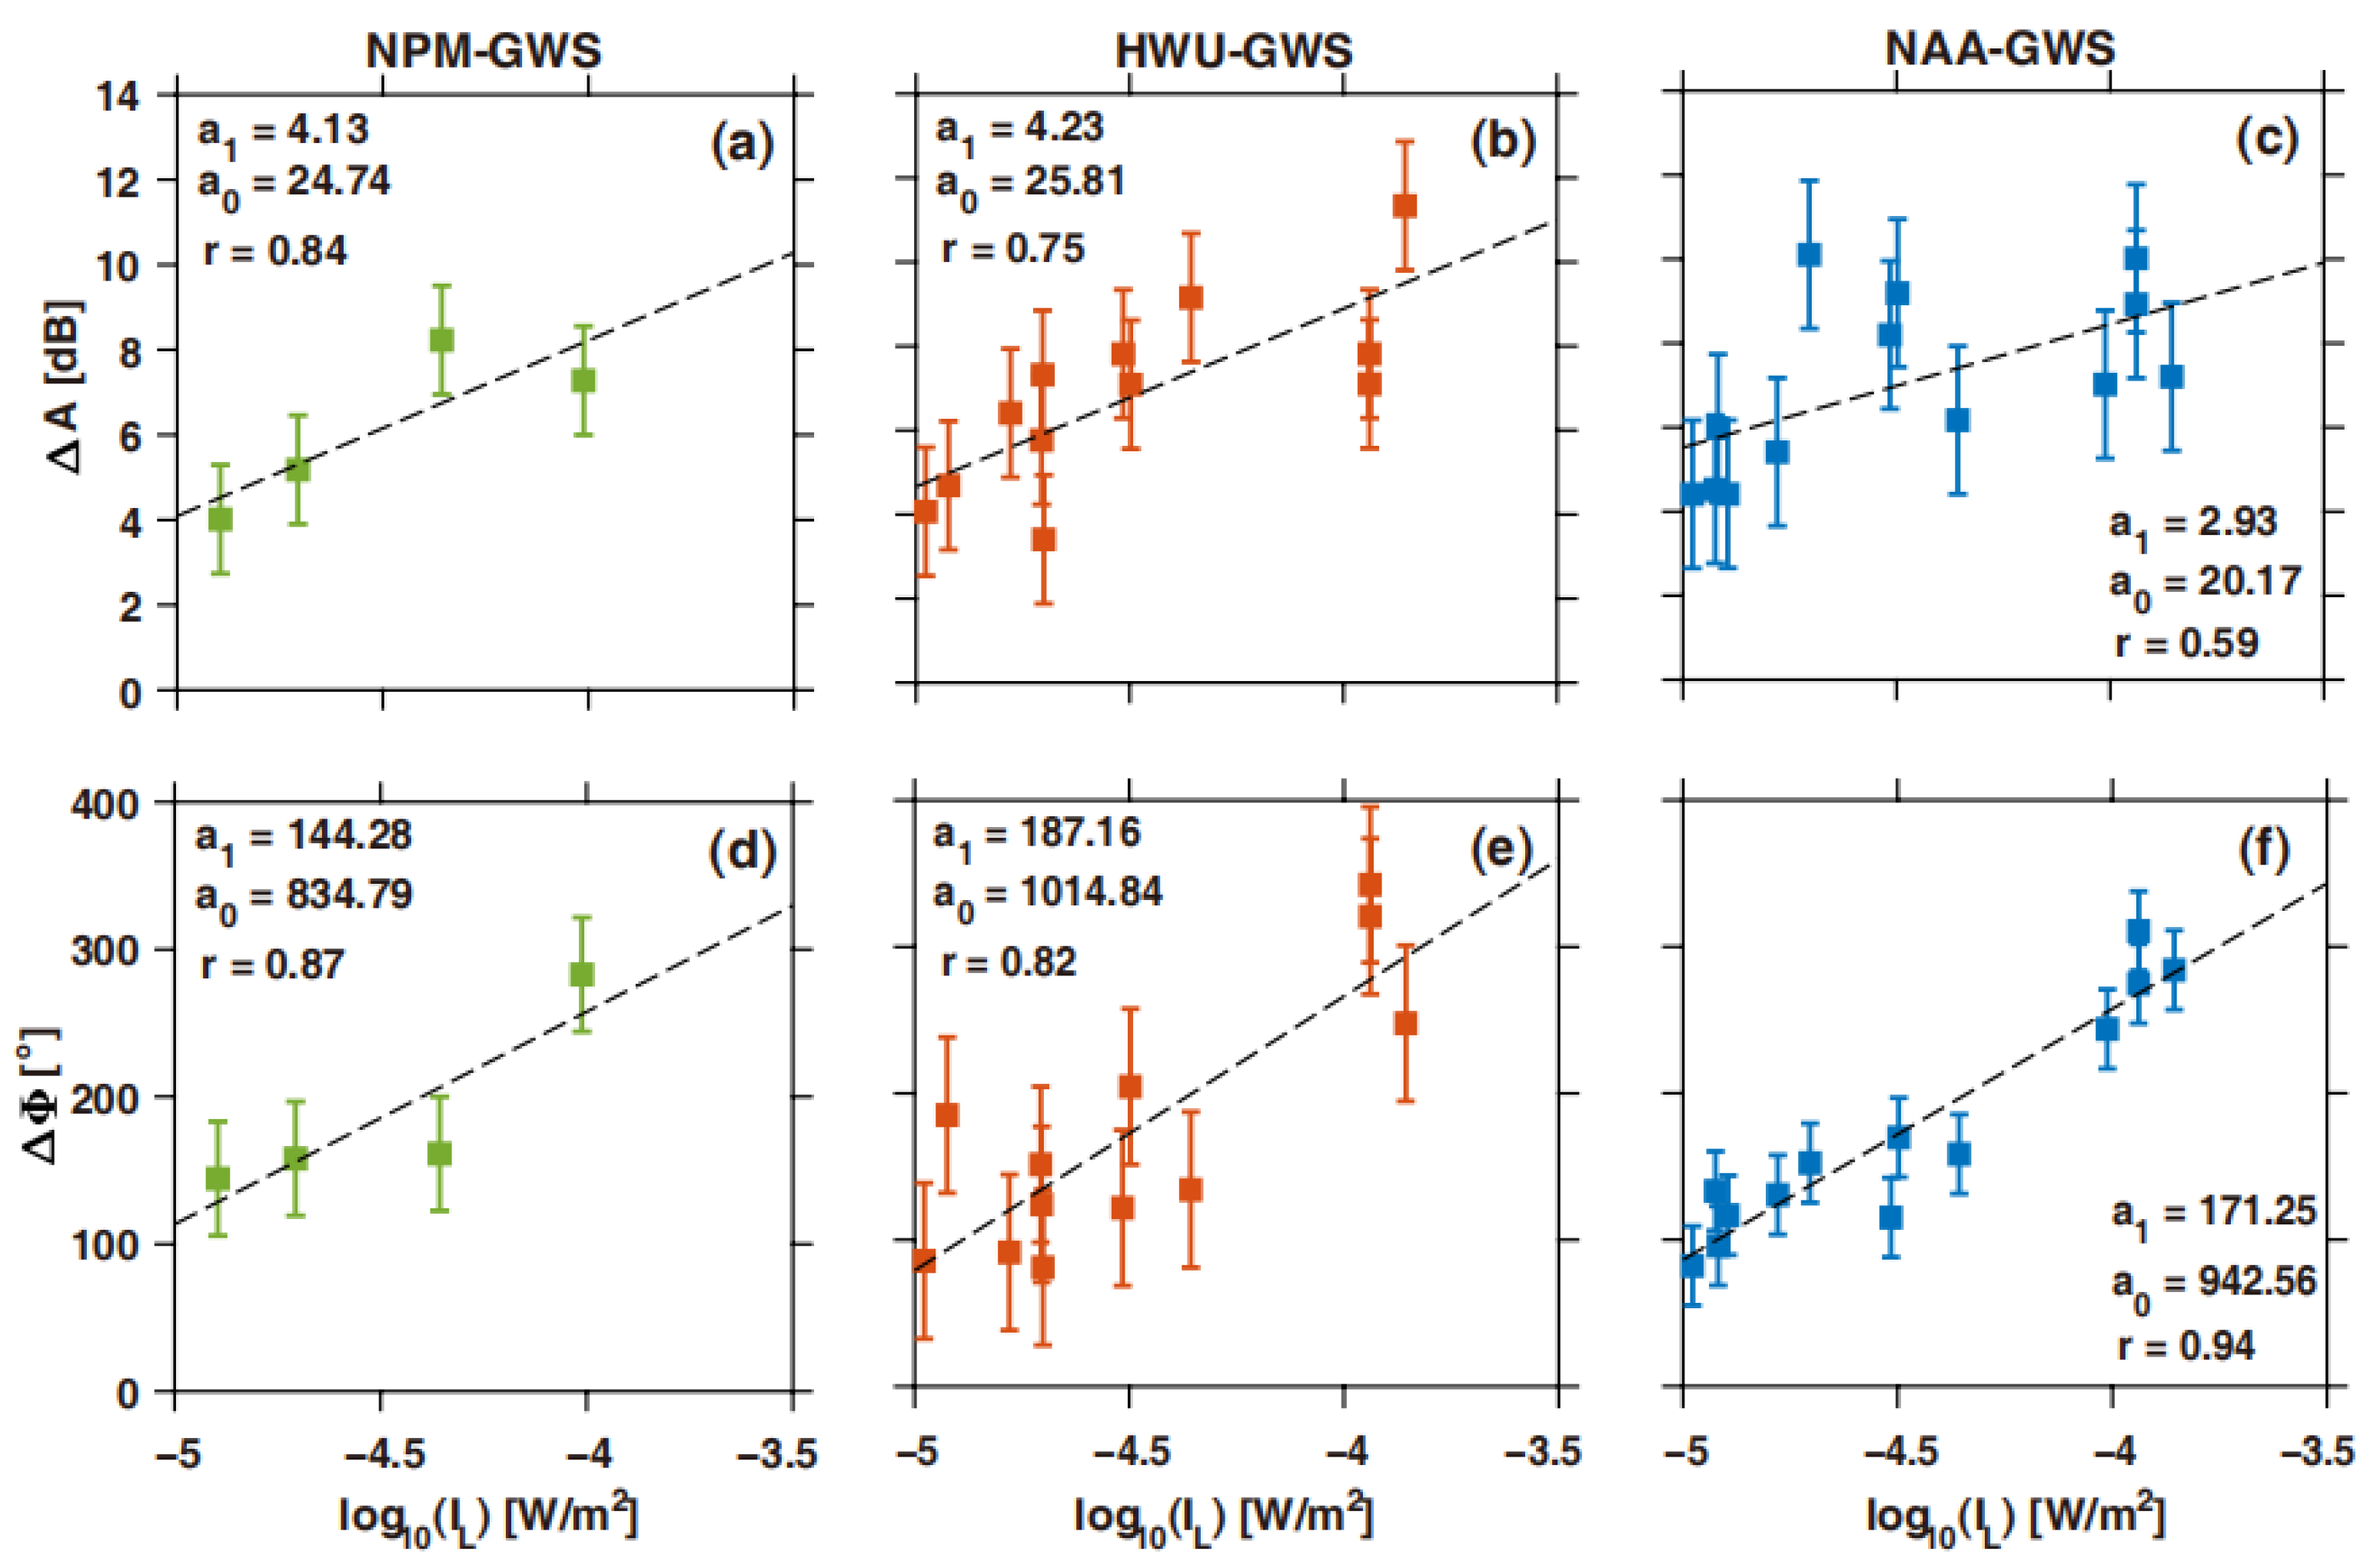
Figure 6 shows the VLF amplitude maximum change (Figure 6a–c) and phase maximum change (Figure 6d–f) versus the X-ray fluxes from GOES 16 for different dayside paths. The black dashed lines in each panel show the linear regression results obtained using the following functions: Δ A = a 1 log 10 ( I L ) + a 0 and Δ Φ = a 1 log 10 ( I L ) + a 0 , where IL represents the X-ray flux in the long-wavelength range. The curve-fitting coefficients a1 and a0 are listed in the top-left corner of each subplot. For the different dayside paths, both the phase and amplitude maximum changes are linearly correlated with the logarithm of the X-ray fluxes. Compared with the amplitude results, the phase response to solar flares on the dayside paths is more prominent, consistent with George et al. [41]. In addition, the curve-fitting coefficients are different for the different VLF propagation paths. The linear regression coefficients found for the amplitude data of the NPM-GWS path are close to those of the HWU-GWS path but different from those of the NAA-GWS path. The coefficients for the phase response are found to be different for the three paths. We further estimate the accuracy of the maximum change in the measured VLF amplitude and phase. The results show that the accuracy values of the amplitude of the three paths are 1.28 dB, 1.53 dB, and 1.76 dB, and those of the phase are 38.72°, 53.13°, and 27.06°, respectively, as shown by the error bars in Figure 6. The linear correlation coefficients (r) for the amplitude data of the three paths are 0.84, 0.75, and 0.59, respectively, while those for the phase data are 0.87, 0.82, and 0.94, as listed in the corner of each subplot.
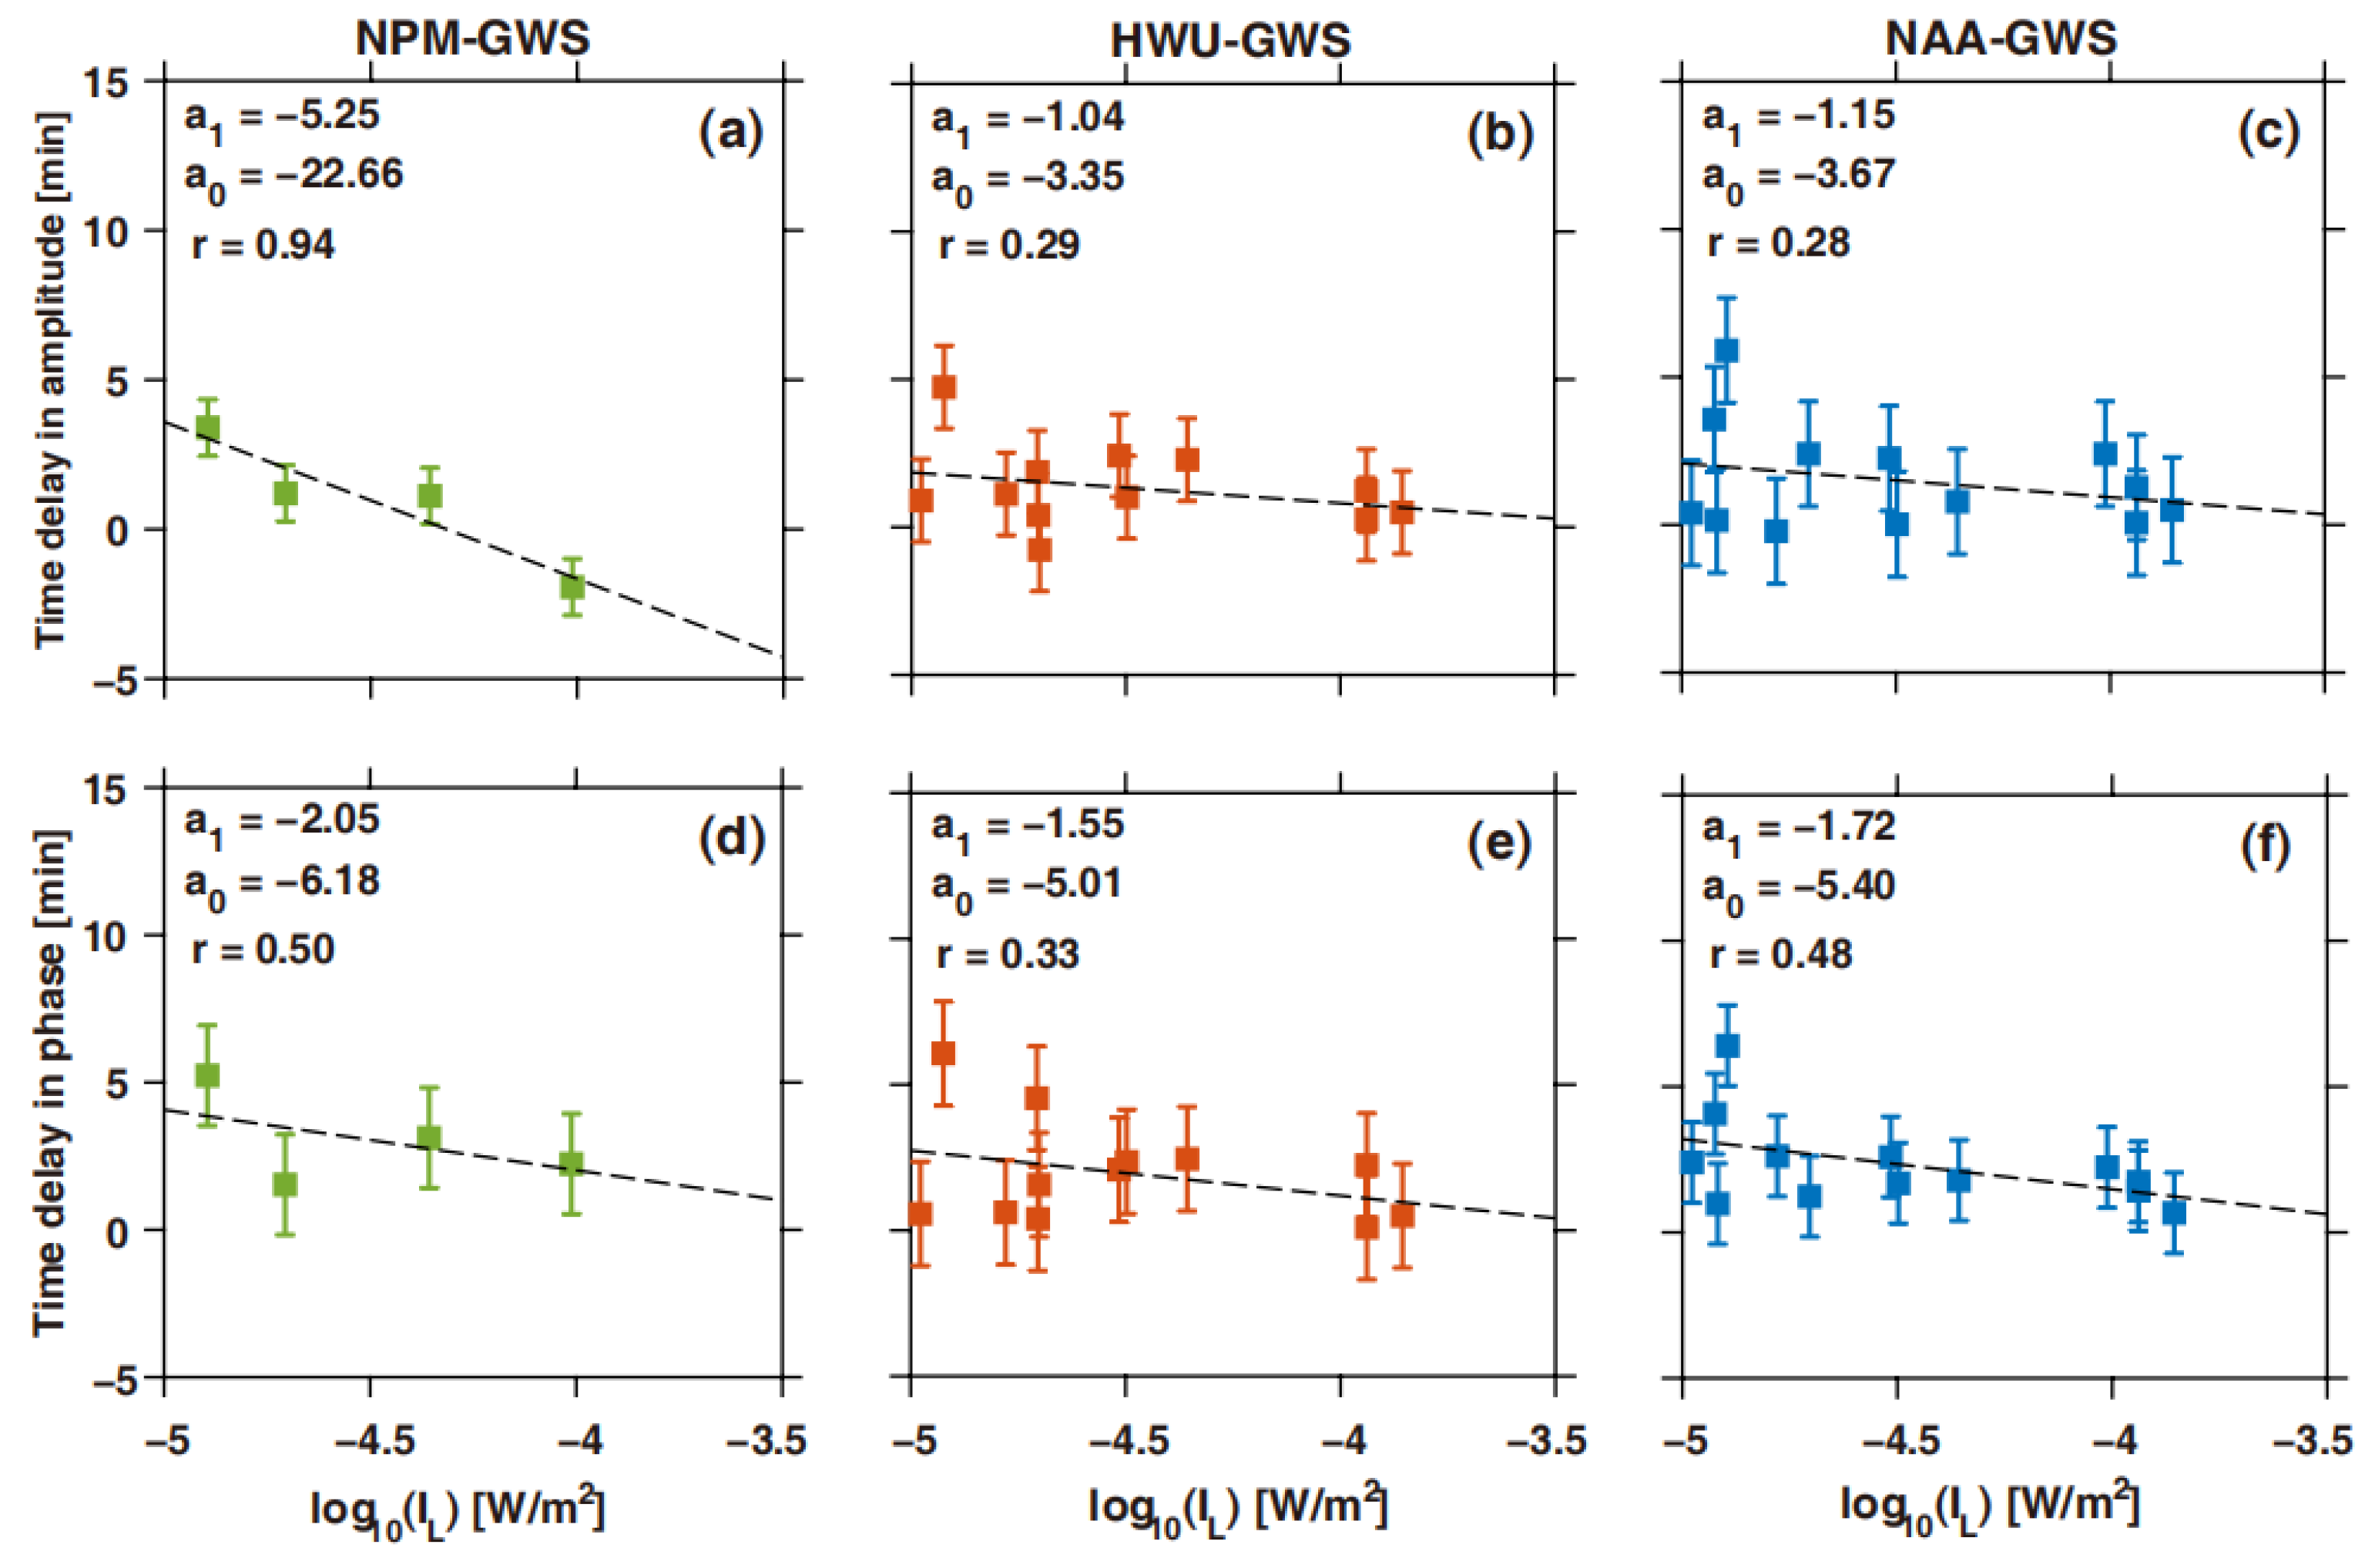
Similar to Figure 6, Figure 7 shows the time delay between the VLF response and solar X-rays for the dayside paths versus the maximum X-ray flux. Following the definition provided by Žigman et al. [35], the delay is obtained by calculating the time difference between the peak of the X-ray fluxes and the peak of the VLF change in amplitude or phase. The time delay obtained using the amplitude and phase is shown in Figure 7a–c and Figure 7d–f, respectively. For the NPM-GWS, HWU-GWS, and NAA-GWS paths, the accuracy values of the time delay in the amplitude of the three paths are 0.94 min, 1.40 min, and 1.78 min, while those of the phase are 1.70 min, 1.79 min, and 1.38 min, respectively. In addition, the linear correlation coefficients for the time delay in the amplitude are 0.94, 0.29, and 0.28, respectively, and the corresponding values in the phase are 0.50, 0.33, and 0.48. As shown in Figure 7, the time delay between the VLF signals (in both the amplitude and phase) and solar flares is mostly several minutes, with the mean values being 2.26 and 1.35 min, and the median values being 2.08 and 1.12 min, respectively. In several cases, the peak time of the VLF change is found to be earlier than that of the flare X-rays, which is numerical due to the detrending method. The detrending method cannot always determine the real peak if the amplitude/phase values at several neighboring time bins are similar, and the peak time obtained after the detrending procedure can sometimes be earlier than the true peak. Because of this, the time delay in several cases is found to be negative, and we emphasize that these values are not physical.
The time delay in both the phase and amplitude becomes shorter with increasing X-ray fluxes. The curve-fitting results show good agreements between the HWU-GWS and NAA-GWS paths, while the results of the NPM-GWS path are different, especially the results obtained using the amplitude data. However, only four events are analyzed for the NPM-GWS path, and this effect needs to be further examined using measurements during more solar flare events.
The above analysis results for the dayside paths demonstrate that the VLF response to solar flares is highly dependent on the magnitude of the solar flares. The perturbations in the phase and amplitude are positively correlated with the logarithm of the X-ray fluxes. There is, in general, a delay of several minutes between the incidence of solar X-rays and the response in VLF signals due to the chemical reactions in the D-region ionosphere [35,43,44], and the delay time tends to decrease with increasing solar X-ray fluxes.

3.3. Solar Flare Effects on Mixed Paths

In addition to dayside paths, we studied the VLF response to solar flares for day–night mixed paths. Figure 8 and Figure 9 show similar results to Figure 6 and Figure 7, respectively, but they were obtained using the VLF measurements from mixed paths.
Figure 8 shows the VLF measurement maximum change versus the fluxes of solar X-rays for the mixed propagation paths. The data points marked using the red circles in Figure 8a,d are excluded from the linear regression analysis since the corresponding phase measurements are unreliable, with them being noticeably different from the other events. Figure S2 in the Supporting Information provides detailed phase and amplitude measurements for this event. The overall VLF response is similar to that of the daytime paths, and it is also positively correlated with the logarithm of the X-ray fluxes. Compared with the results of the dayside paths, the VLF response along the NPM-GWS and NAA-GWS paths is smaller for flare classes lower than M1.0, and it increases more rapidly with the magnitude of the solar X-rays. The accuracy values of the amplitude of the two paths are 1.13 dB and 1.63 dB, and those of the phase are 38.73° and 28.18°, respectively. The linear correlation coefficients for the amplitude of the two paths are 0.78 and 0.81, respectively, while those for the phase are 0.80 and 0.95. The results of the HWU-GWS path also show smaller responses to ~M1.0-class solar flares, but they increase less significantly with the X-ray fluxes compared to the daytime paths. The VLF response of the HWU signal is the weakest among the three mixed paths. For this path, the amplitude and phase accuracy values are 1.65 dB and 61.87°, respectively, while the linear correlation coefficients for the amplitude and phase are 0.78 and 0.77, respectively.
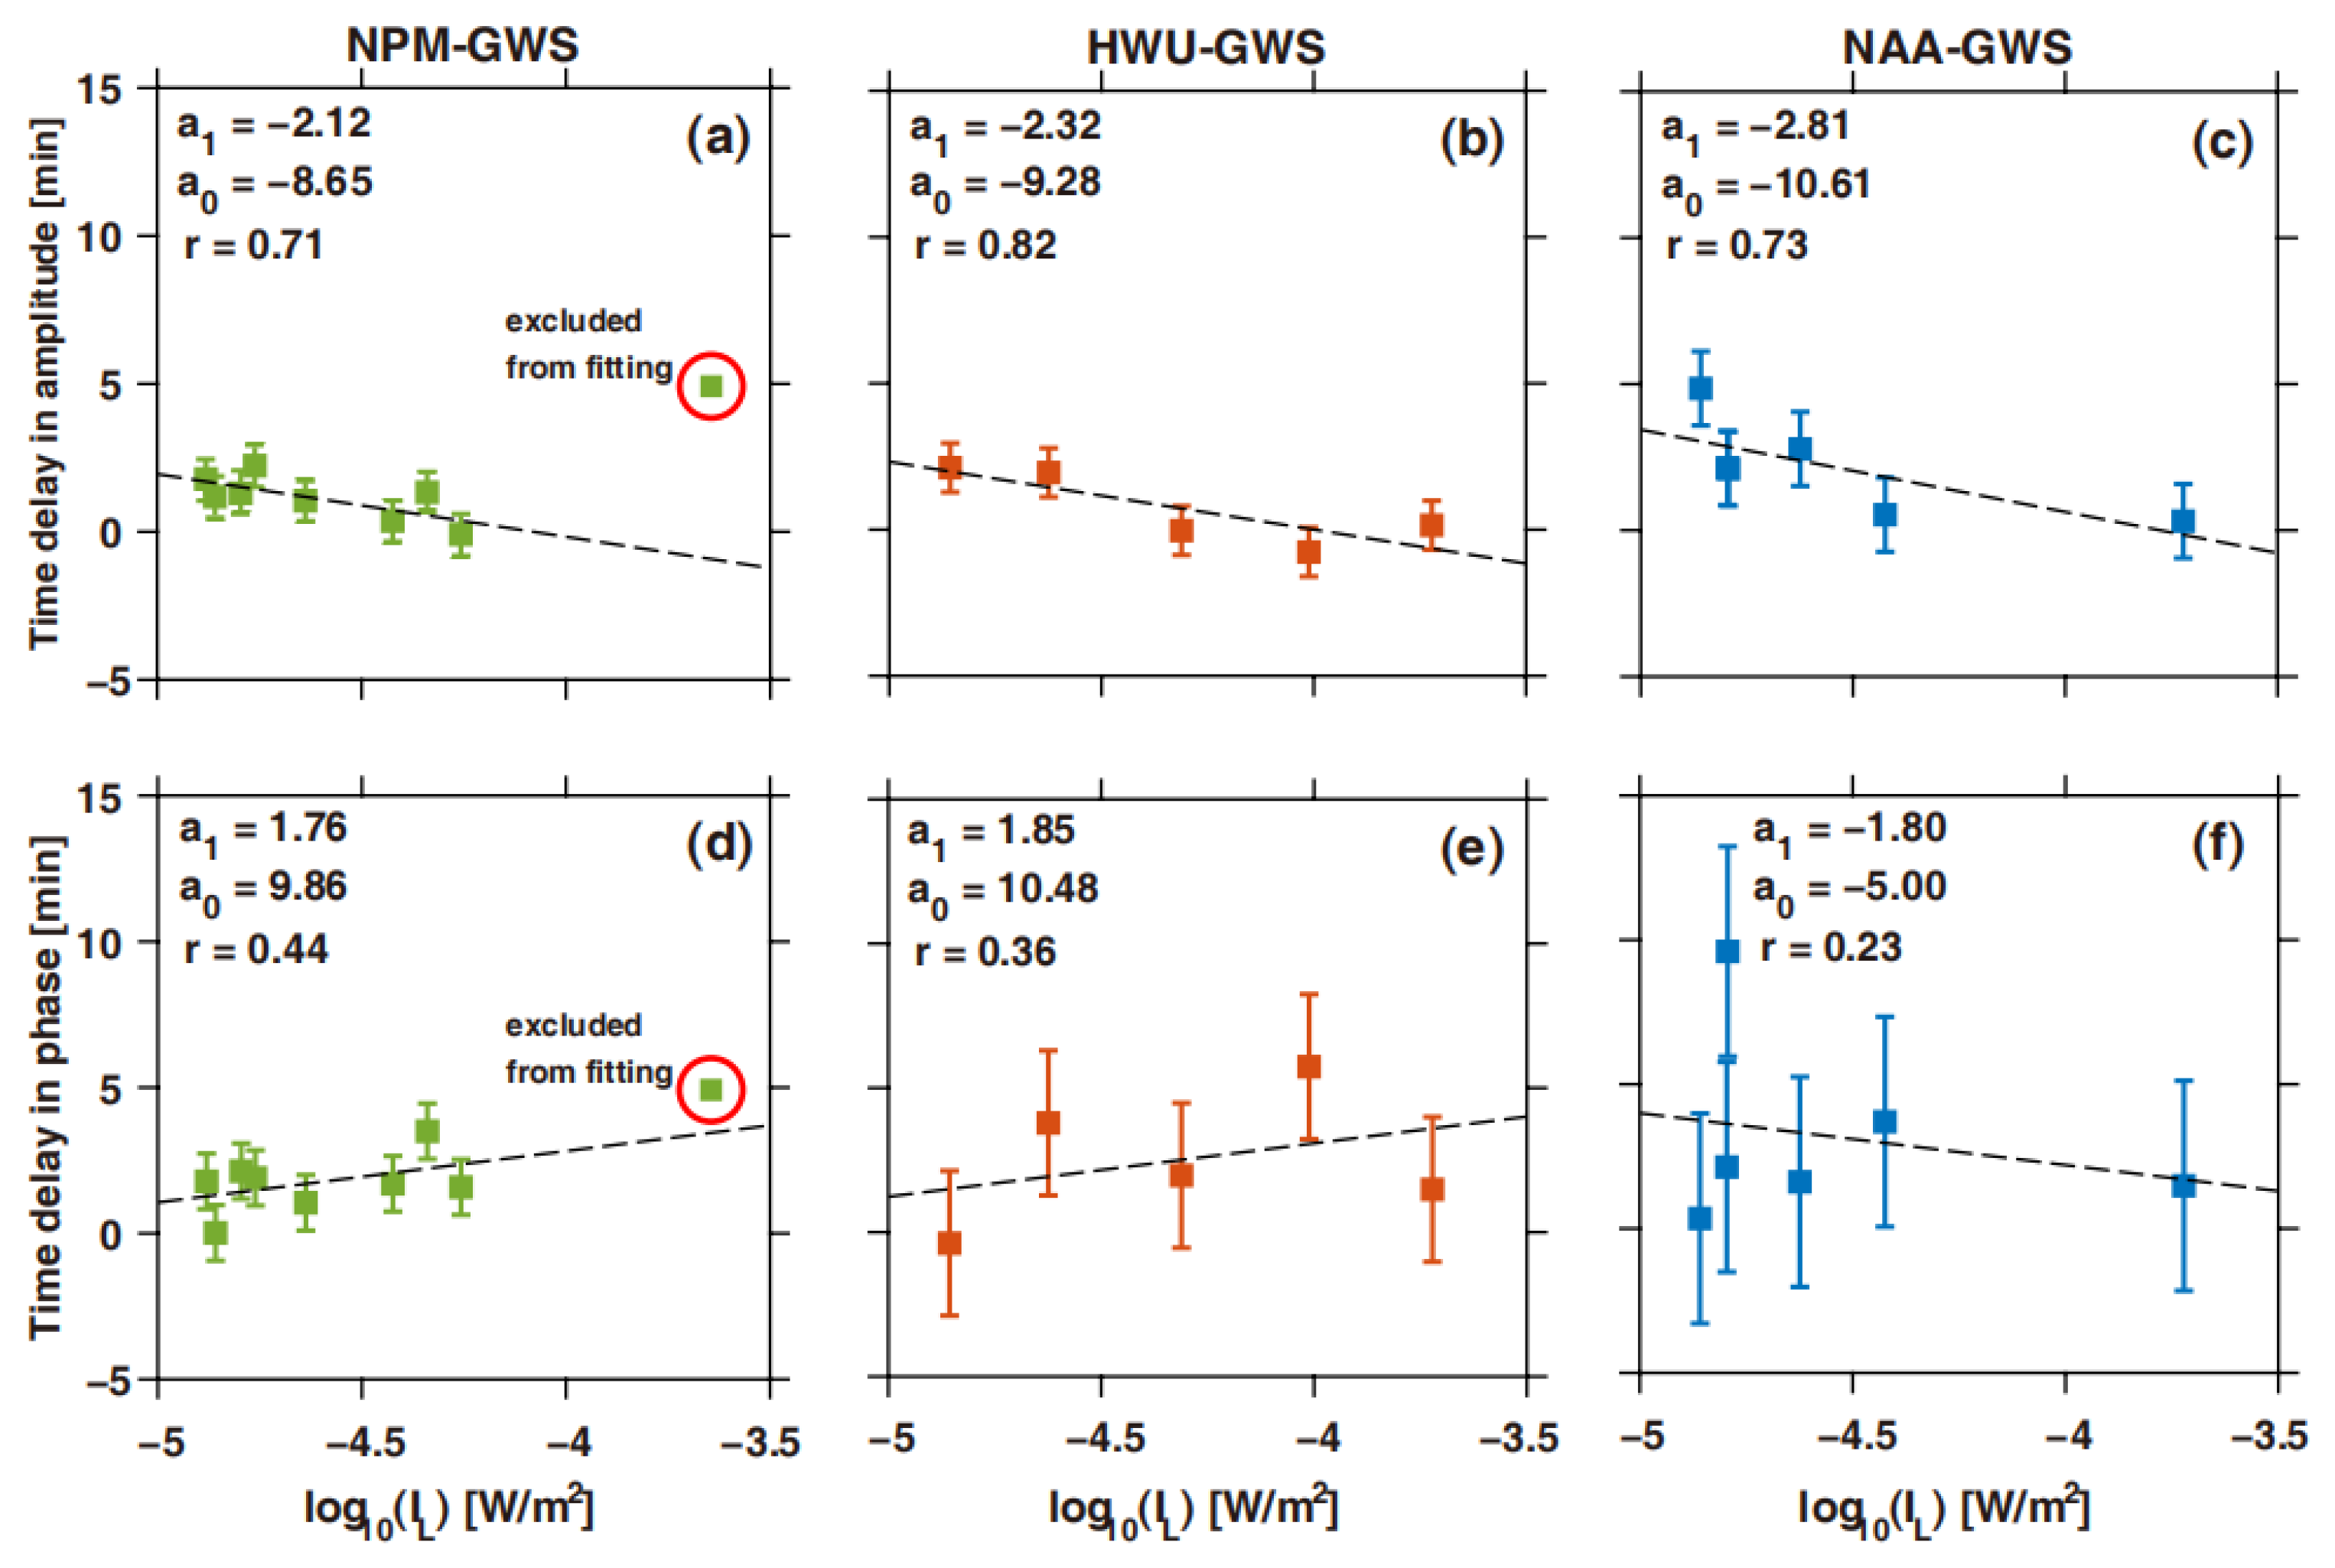
Similar to Figure 7, Figure 9 shows the time delay between the VLF response and solar flares versus the logarithm of the X-ray fluxes for the different propagation paths. For the same reason as Figure 8a,d, the data points marked using the red circles in Figure 9a,d are also excluded from the linear regression analysis. The time delay of the mixed paths is notably different. For the NAA-GWS path, the time delay in both the phase and amplitude is inversely correlated with the maximum X-ray flux. The accuracy values of the time delay in the amplitude and phase are 1.27 min and 3.64 min, and the linear correlation coefficients are 0.73 and 0.23, respectively. As for the NPM-GWS path, the accuracy values of the time delay in the amplitude and phase are 0.56 min and 0.95 min, respectively. Moreover, the time delay in the amplitude is negatively correlated with the X-ray fluxes, with a linear correlation coefficient of 0.71, while the time delay in the phase is positively correlated with the X-ray flux, with a linear correlation coefficient of 0.44. For the HWU-GWS path, the accuracy values of the time delay in the amplitude and phase are 0.84 min and 2.51 min, respectively. The results show a similar relationship between the time delay and the maximum X-ray flux to the NPM-GWS path, but the linear correlation coefficients for the time delay in the amplitude and phase are 0.82 and 0.36, respectively.

4. Discussion

Using the VLF data collected by our VLF receiver in Antarctica during 56 M- and 6 X-class solar flares, we analyzed the perturbations and time delay of the VLF signals for dayside, nightside, and mixed paths. Moreover, we examined the relationship between the VLF maximum change and the fluxes of flare X-rays using both amplitude and phase data. The linear regression coefficients between the VLF maximum change and X-ray fluxes were calculated. The VLF response to solar flares was extensively investigated, but only by using measurements from the dayside paths. It is from this perspective that we investigated the day–night mixed paths in this study.
Our findings are, in general, consistent with those of previous studies [35,41,42,43,44]. Based on the VLF measurements along the NPM-Scott propagation path during 10 X-class flares, George et al. [41] found that the logarithm of the peak X-ray fluxes versus the VLF amplitude and phase maximum change can be best fitted using regression coefficients of 0.243 and 6.54 × 10⁻³, respectively. However, we mainly analyzed the VLF amplitude and phase maximum change versus the X-ray fluxes, and these coefficients above corresponded to slopes of ~4.13 and ~144.28 for the results shown in Figure 6a and Figure 6d in this study, respectively, which are reasonably close to our findings, even though different detectors were used. The good agreements obtained validate the nowcasting technique developed by George et al. [41] and Belcher et al. [42].
Although we did not specifically calculate the VLF change for different SZA values, we found that the ratio between the ‘response’ and ‘no response’ events decreased as the SZA became closer to 90° (Figure 5), which is consistent with that reported in Kumar and Kumar [44]. The time delays between the solar flares and VLF response that we found for 62 flare events were, on average, 2.26 and 1.35 min, as determined from phase and amplitude data, respectively. These values are consistent with the 1–7 min reported by Žigman et al. [35], 1.5 min reported by Hayes et al. [43], and 0.5–5 min reported by Kumar and Kumar [44].
Moreover, Lotz and Cliverd [56] revealed that the length of VLF propagation paths could lead to differences in the phase perturbations on dayside propagation paths. We compared the curve-fitting results of the phase change for dayside paths (Figure 6d–f). Following the approach described in Lotz and Clilverd [56], the propagation path distance can be normalized using the wavelength, for example, D/λ = Df/v, where D is the great circle distance of the propagation path, λ is the wavelength, f is the frequency, and v is the speed, corresponding to ~ 2.70 × 10 11 / v for the NPM transmitter, ~ 3.33 × 10 11 / v for the HWU transmitter, and ~ 2.95 × 10 11 / v for the NAA transmitter, respectively. Given the same speed, the ratio of the normalized wavelength (D/λ) was found to be 0.81 between NPM and HWU, and 0.89 between NAA and HWU. Both values are close to the curve-fitting results shown in Figure 6: the ratios of the slopes were 0.77 between NPM and HWU, and 0.91 between NAA and HWU. However, the phase perturbations along the mixed paths were more complicated due to the SZA effects.
While a linear function was used to approximate the background phase and amplitude change during the detrending process, it should be noted that the true variation in the VLF amplitude and phase can be more complicated, especially under sunrise/sunset conditions. It is also because of the detrending method that, in some cases, we found that the peak of the VLF change occurred even before the peak of the X-ray fluxes. Therefore, it is more desirable to calculate the background VLF signal using data collected a day before and after the solar flares. However, the VLF data collected before and after the solar flares were not always stable with good signal-to-noise ratios for the events analyzed in the present study. This approach may, in turn, contaminate the calculation of the net effects caused by solar flares and was not adopted in this study.
In this study, the VLF response along three different paths was analyzed, including one north–south oriented path (NAA-GWS) and two obliquely oriented paths (NPM-GWS and HWU-GWS). However, we have a VLF receiver installed in Suizhou, China, and the propagation of the VLF signals from the JJI transmitter to Suizhou is almost east–west oriented. Moreover, the time difference between this path and the GWS-NAA path is almost 12 h. Our next study will include the solar flare measurements in Suizhou and conduct a comparison with the other VLF propagation paths.

5. Conclusions

In this study, we analyze the VLF measurements during 62 M- and X-class solar flares that occurred between March and May of 2022. Using the SZAs of different propagation paths, we study the VLF response to solar flares for dayside, nightside, and mixed paths. The relationship between the VLF maximum change and flare X-ray fluxes is quantified and compared with that in previous studies in order to reexamine the capability of the VLF technique to nowcast solar flares. The major conclusions of this study are as follows:
(1)
For the dayside paths, the time delay between the maxima of a solar flare and the VLF maximum change can vary by several minutes, and it is negatively correlated with the fluxes of flare X-rays. As for the mixed paths, the time delay for the NAA-GWS path is always inversely correlated with the maximum X-ray flux of the associated solar flares, while the time delay in the phase for the NPM-GWS and HWU-GWS paths has positive correlations.
(2)
The VLF response in both the amplitude and phase is linearly proportional to the logarithm of the flare X-ray fluxes for the day–night mixed propagation paths. The curve-fitting coefficients between the VLF maximum change and flare X-rays for the NPM-GWS and NAA-GWS paths during the day–night mixed conditions are found to be larger than those of the dayside conditions, in contrast to the HWU-GWS path.
(3)
The curve-fitting coefficients are found to be consistent with those reported in George et al. [41] for the dayside paths. However, these coefficients are notably different for the day–night mixed paths, suggesting the need to update the previously developed nowcasting technique for day–night mixed propagation paths.

Supplementary Materials

The following supporting information can be downloaded at: https://www.mdpi.com/article/10.3390/rs16122092/s1, Table S1: The start time, end time, peak time, and peak values of the solar flares identified in this study. The time format is mm-dd/HH: MM: SS; Figure S1: Same as in Figure 2 in the main text, except for the detrending process for amplitude perturbations; Figure S2: The detrended phase and amplitude variations of NPM transmitter signals in the solar flare event marked by red circles in Figure 8 in the main text.

Author Contributions

Data curation, X.G., S.W., R.Z. and W.X.; methodology, X.G., R.Z., S.W. and W.X.; validation, S.W., W.X., W.C., J.F., H.X. and W.M.; investigation, W.X., X.G., Y.P., B.L., F.H., X.C. and H.H.; writing—original draft preparation, X.G., S.W., R.Z. and W.X.; writing—review and editing, X.G., W.X., S.W., Z.H. and B.N.; project administration, X.G., W.X., S.W. and B.N.; funding acquisition, X.G., B.N. and W.X. All authors have read and agreed to the published version of the manuscript.

Funding

This work was supported by the National Natural Science Foundation of China (Grant Nos. 42025404, 42188101, 41874195, 42274205, and 42130210), the National Key R&D Program of China (Grant No. 2022YFF0503700), the B-type Strategic Priority Program of the Chinese Academy of Sciences (Grant No. XDB41000000), and the open fund of Hubei Luojia Laboratory (Grant No. 220100051), and the Tencent Xplorer prize. The authors acknowledge the project of Ground-based Space Environment Monitoring Network (Chinese Meridian Project II), the Chinese National Antarctic Research Expedition, for the support upon the VLF wave detection program at the GWS, and the 985 funded project of Wuhan University.

Data Availability Statement

The processed VLF data and code used to generate the plots reported in this paper are available at https://doi.org/10.6084/m9.figshare.21647171.v1 (accessed on 20 February 2024). More VLF data recorded at the GWS can be obtained after a request is made to Xudong Gu ([email protected]).

Acknowledgments

We are grateful to the editor and anonymous reviewers for their assistance in evaluating this paper.

Conflicts of Interest

The authors declare no conflicts of interest.

References

  1. Inan, U.S.; Cummer, S.A.; Marshall, R.A. A survey of ELF and VLF research on lightning-ionosphere interactions and causative discharges. J. Geophys. Res. 2010, 115, A00E36. [Google Scholar] [CrossRef]
  2. Clilverd, M.A.; Rodger, C.J.; Thomson, N.R.; Lichtenberger, J.; Steinbach, P.; Cannon, P.; Angling, M.J. Total solar eclipse effects on VLF signals: Observations and modeling. Radio Sci. 2001, 36, 773–788. [Google Scholar] [CrossRef]
  3. Pal, S.; Chakrabarti, S.K.; Mondal, S.K. Modeling of sub-ionospheric VLF signal perturbations associated with total solar eclipse, 2009 in Indian subcontinent. Adv. Space Res. 2012, 50, 196–204. [Google Scholar] [CrossRef]
  4. Xu, W.; Marshall, R.A. Characteristics of energetic electron precipitation estimated from simulated bremsstrahlung X-ray distributions. J. Geophys. Res. Space Phys. 2019, 124, 2831–2843. [Google Scholar] [CrossRef]
  5. Cheng, W.; Xu, W.; Gu, X.; Wang, S.; Wang, Q.; Ni, B.; Lu, Z.; Xiao, B.; Meng, X. A Comparative Study of VLF Transmitter Signal Measurements and Simulations during Two Solar Eclipse Events. Remote Sens. 2023, 15, 3025. [Google Scholar] [CrossRef]
  6. Basak, T.; Hobara, Y.; Pal, S.; Nakamura, T.; Izutsu, J.; Minatohara, T. Modeling of Solar Eclipse effects on the sub-ionospheric VLF/LF signals observed by multiple stations over Japan. Adv. Space Res. 2024, 73, 736–746. [Google Scholar] [CrossRef]
  7. Thomson, N.R.; Clilverd, M.A. Solar flare induced ionospheric D-region enhancements from VLF amplitude observations. J. Atmos. Sol.-Terr. Phys. 2001, 63, 1729–1737. [Google Scholar] [CrossRef]
  8. Singh, A.K.; Singh, A.K.; Singh, R.; Singh, R.P. Solar flare induced D-region ionospheric perturbations evaluated from VLF measurements. Astrophys. Space Sci. 2014, 350, 1–9. [Google Scholar] [CrossRef]
  9. Bouderba, Y.; NaitAmor, S.; Tribeche, M. Study of the solar flares effect on VLF radio signal propagating along NRK-ALG path using LWPC code. J. Geophys. Res. 2016, 121, 6799–6807. [Google Scholar] [CrossRef]
  10. Xu, W.; Marshall, R.A.; Kero, A.; Turunen, E.; Drob, D.; Sojka, J.; Rice, D. VLF measurements and modeling of the D-region response to the 2017 total solar eclipse. IEEE Trans. Geosci. Remote Sens. 2019, 57, 7613–7622. [Google Scholar] [CrossRef]
  11. Gu, X.; Luo, F.; Peng, R.; Li, G.; Chen, H.; Wang, S.; Yi, J.; Li, Z.; Ni, B.; Zhao, Z.; et al. Response characteristics of very low frequency signals from JJI transmitter to solar flare events. Chin. J. Geophys. 2021, 64, 1508–1517. (In Chinese) [Google Scholar] [CrossRef]
  12. Greatorex, H.; Milligan, R.; Chamberlin, P. Observational Analysis of Lyα Emission in Equivalent-magnitude Solar Flares. Astrophys. J. 2023, 954, 120. [Google Scholar] [CrossRef]
  13. Moler, W.F. VLF propagation effects of a D-region layer produced by cosmic rays. J. Geophys. Res. 1960, 65, 1459–1468. [Google Scholar] [CrossRef]
  14. Kolarski, A.; Veselinović, N.; Srećković, V.; Mijić, Z.; Savić, M.; Dragić, A. Impacts of Extreme Space Weather Events on September 6, 2017 on Ionosphere and Primary Cosmic Rays. Remote Sens. 2023, 15, 1403. [Google Scholar] [CrossRef]
  15. Marshall, R.A.; Xu, W.; Sousa, A.; McCarthy, M.; Millan, R. X-ray signatures of lightning-induced electron precipitation. J. Geophys. Res. Space Phys. 2019, 124, 10230–10245. [Google Scholar] [CrossRef]
  16. Xu, W.; Marshall, R.A.; Kero, A.; Sousa, A. Chemical response of the upper atmosphere due to lightning-induced electron precipitation. J. Geophys. Res. Atmos. 2021, 126, e2021JD034914. [Google Scholar] [CrossRef]
  17. Chand, A.; Kumar, A.; Kumar, S. VLF and Ionospheric D-Region Perturbations Associated With WWLLN-Detected Lightning in the South Pacific Region. J. Geophys. Res. Space Phys. 2023, 128, e2022JA030964. [Google Scholar] [CrossRef]
  18. Tomicic, M.; Chanrion, O.; Farges, T.; Mlynarczyk, J.; Kolmašová, I.; Soula, S.; Lapierre, J.; Köhn, C.; Neubet, T. Observations of Elves and Radio Wave Perturbations by Intense Lightning. J. Geophys. Res. Atmos. 2023, 128, e2022JD036541. [Google Scholar] [CrossRef]
  19. Ni, B.; Hua, M.; Gu, X.; Fu, S.; Xiang, Z.; Cao, X.; Ma, X. Artificial modification of Earth’s radiation belts by ground-based very-low-frequency (VLF) transmitters. Sci. China Earth Sci. 2022, 65, 391–413. [Google Scholar] [CrossRef]
  20. Hu, J.; Xiang, Z.; Ma, X.; Liu, Y.; Dong, J.; Guo, D.; Ni, B. Long-Term Variations of Energetic Electrons Scattered by Signals From the North West Cape Transmitter. Space Weather 2024, 22, e2023SW003827. [Google Scholar] [CrossRef]
  21. Chen, Z.; Xie, T.; Li, H.; Ouyang, Z.; Deng, X. The Global Variation of Low Ionosphere Under Action of Energetic Electron Precipitation. J. Geophys. Res. Space Phys. 2023, 128, e2023JA031930. [Google Scholar] [CrossRef]
  22. Wait, J.R.; Spies, K.P. Characteristics of the Earth-Ionosphere Waveguide for VLF Radio Waves; Note 300; NBS Tech.: Boulder, CO, USA, 1964. [Google Scholar]
  23. Cummer, S.A.; Inan, U.S.; Bell, T.F. Ionospheric D region remote sensing using vlf radio atmospherics. Radio Sci. 1998, 33, 1781–1792. [Google Scholar] [CrossRef]
  24. Han, F.; Cummer, S.A. Midlatitude daytime D region ionosphere variations measured from radio atmospherics. J. Geophys. Res. 2010, 115, A10314. [Google Scholar] [CrossRef]
  25. Xu, W.; Marshall, R.A.; Bortnik, J.; Bonnell, J.W. An electron density model of the D-and E-region ionosphere for transionospheric VLF propagation. J. Geophys. Res. Space Phys. 2021, 126, e2021JA029288. [Google Scholar] [CrossRef]
  26. Rodger, C.J.; Enell, C.-F.; Turunen, E.; Clilverd, M.A.; Thomson, N.R.; Verronen, P.T. Lightning-driven inner radiation belt energy deposition into the atmosphere: Implications for ionisation-levels and neutral chemistry. Ann. Geophys. 2007, 25, 1745–1757. [Google Scholar] [CrossRef]
  27. Inan, U.S.; Lehtinen, N.G.; Moore, R.C.; Hurley, K.; Boggs, S.; Smith, D.M.; Fishman, G.J. Massive disturbance of the daytime lower ionosphere by the giant γ-ray flare from magnetar SGR 1806-20. Geophys. Res. Lett. 2007, 34, L08103. [Google Scholar] [CrossRef]
  28. Grubor, D.P.; Šulić, D.M.; Žigman, V. Classification of X-ray solar flares regarding their effects on the lower ionosphere electron density profile. Ann. Geophys. 2008, 26, 1731–1740. [Google Scholar] [CrossRef]
  29. Raulin, J.-P.; Bertoni, F.C.P.; Gavilán, H.R.; Guevara-Day, W.; Rodriguez, R.; Fernandez, G.; Correia, E.; Kaufmann, P.; Pacini, A.; Stekel, T.R.C.; et al. Solar flare detection sensitivity using the South America VLF Network (SAVNET). J. Geophys. Res. 2010, 115, A07301. [Google Scholar] [CrossRef]
  30. Šulić, D.M.; Srećković, V.A. A comparative study of measured amplitude and phase perturbations of VLF and LF radio signals induced by solar flares. Serb. Astron. J. 2014, 188, 45–54. [Google Scholar] [CrossRef]
  31. Neal, J.J.; Rodger, C.J.; Clilverd, M.A.; Thomson, N.R.; Raita, T.; Ulich, T. Long-term determination of energetic electron precipitation into the atmosphere from AARDDVARK subionospheric VLF observations. J. Geophys. Res. Space Phys. 2015, 120, 2194–2211. [Google Scholar] [CrossRef]
  32. Mitra, A.P. Ionospheric Effects of Solar Flares; D. Reidel: Boston, MA, USA, 1974; Volume 46. [Google Scholar]
  33. Xiong, B.; Wan, W.; Liu, L.; Withers, P.; Zhao, B.; Ning, B.; Wei, Y.; Le, H.; Ren, Z.; Chen, Y.; et al. Ionospheric response to the X-class solar flare on September 7 2005. J. Geophys. Res. 2011, 116, A11317. [Google Scholar] [CrossRef]
  34. Qian, L.; Wang, W.; Burns, A.G.; Chamberlin, P.C.; Solomon, S.C. Responses of the thermosphere and ionosphere system to concurrent solar flares and geomagnetic storms. J. Geophys. Res. Space Phys. 2020, 125, e2019JA027431. [Google Scholar] [CrossRef]
  35. Žigman, V.; Grubor, D.; Šulić, D. D-region electron density evaluated from VLF amplitude time delay during X-ray solar flares. J. Atmos. Sol.-Terr. Phys. 2007, 69, 775–792. [Google Scholar] [CrossRef]
  36. Xu, W.; Gu, X.; Ni, B.; Wang, S.; Yang, Z.; Cheng, W.; Hu, Z.; He, F.; Li, B.; Chen, X.; et al. Measurements and Modeling of the Responses of VLF Transmitter Signals to X-Class Solar Flares at the Great Wall Station in Antarctica. Space Weather 2023, 21, e2022SW003249. [Google Scholar] [CrossRef]
  37. Gu, X.; Yi, J.; Wang, S.; Hu, Z.; Xu, W.; Ni, B.; Li, B.; He, F.; Chen, X.; Hu, H. Comparison of VLF Signal Responses to Solar Flares along Daytime and Nighttime Propagation Paths. Remote Sens. 2023, 15, 1018. [Google Scholar] [CrossRef]
  38. McRae, W.M.; Thomson, N.R. Solar flare induced ionospheric D-region enhancements from VLF phase and amplitude observations. J. Atmos. Sol.-Terr. Phys. 2004, 66, 77–87. [Google Scholar] [CrossRef]
  39. Žigman, V.; Dominique, M.; Grubor, D.; Rodger, C.; Clilverd, M. Lower-ionosphere electron density and effective recombination coefficients from multi-instrument space observations and ground VLF measurements during solar flares. J. Atmos. Sol.-Terr. Phys. 2023, 247, 106074. [Google Scholar] [CrossRef]
  40. Wenzel, D.; Jakowski, N.; Berdermann, J.; Mayer, C.; Valladares, C.; Heber, B. Global Ionospheric Flare Detection System (GIFDS). J. Atmos. Sol.-Terr. Phys. 2016, 138–139, 233–242. [Google Scholar] [CrossRef]
  41. George, H.E.; Rodger, C.J.; Clilverd, M.A.; Cresswell-Moorcock, K.; Brundell, J.B.; Thomson, N.R. Developing a Nowcasting Capability for X-Class Solar Flares Using VLF Radiowave Propagation Changes. Space Weather 2019, 17, 1783–1799. [Google Scholar] [CrossRef]
  42. Belcher, S.R.G.; Clilverd, M.A.; Rodger, C.J.; Cook, S.; Thomson, N.R.; Brundell, J.B.; Raita, T. Solar flare X-ray impacts on long subionospheric VLF paths. Space Weather 2021, 19, e2021SW002820. [Google Scholar] [CrossRef]
  43. Hayes, L.A.; Gallagher, P.T.; McCauley, J.; Dennis, B.R.; Ireland, J.; Inglis, A. Pulsations in the Earth’s lower ionosphere synchronized with solar flare emission. J. Geophys. Res. Space Phys. 2017, 122, 9841–9847. [Google Scholar] [CrossRef]
  44. Kumar, A.; Kumar, S. Solar flare effects on D-region ionosphere using VLF measurements during low-and high-solar activity phases of solar cycle 24. Earth Planets Space 2018, 70, 29. [Google Scholar] [CrossRef]
  45. Chen, Y.; Yang, G.; Ni, B.; Zhao, Z.; Gu, X.; Zhou, C.; Wang, F. Development of ground-based elf/vlf receiver system in wuhan and its first results. Adv. Space Res. 2016, 57, 1871–1880. [Google Scholar] [CrossRef]
  46. Gu, X.; Chen, H.; Wang, S.; Lu, Z.; Ni, B.; Li, G.; Cheng, W. Extraction of Alpha transmitter signals from single-station observations using the direction-finding method. Sci. China Technol. Sci. 2022, 65, 1727–1737. [Google Scholar] [CrossRef]
  47. Gu, X.; Li, G.; Pang, H.; Wang, S.; Ni, B.; Luo, F.; Peng, R.; Chen, L. Statistical analysis of very low frequency atmospheric noise caused by the global lightning using ground-based observations in China. J. Geophys. Res. Space Phys. 2021, 126, e2020JA029101. [Google Scholar] [CrossRef]
  48. Gu, X.; Peng, R.; Wang, S.; Ni, B.; Luo, F.; Li, G.; Li, Z. Responses of the very low frequency transmitter signals during the solar eclipse on December 26, 2019 over a North-South propagation path. IEEE Trans. Geosci. Remote Sens. 2022, 60, 2000207. [Google Scholar] [CrossRef]
  49. Chen, Y.; Ni, B.; Gu, X.; Zhao, Z.; Yang, G.; Zhou, C.; Zhang, Y. First observations of low latitude whistlers using whu ELF/VLF receiver system. Sci. China Technol. Sci. 2017, 60, 166–174. [Google Scholar] [CrossRef]
  50. Wang, S.; Gu, X.; Luo, F.; Peng, R.; Chen, H.; Li, G.; Ni, B.; Zhao, Z.; Yuan, D. Observations and analyses of the sunrise effect for NWC VLF transmitter signals. Chin. J. Geophys. 2020, 63, 4300–4311. (In Chinese) [Google Scholar]
  51. Wang, S.; Ni, B.; Gu, X.; Lin, R.; Li, G.; Luo, F.; Peng, R.; Chen, H. Sunrise effect of very-low-frequency JJI transmitter signal propagating over an east-west path. Chin. J. Geophys. 2022, 65, 145–156. (In Chinese) [Google Scholar]
  52. Pasupathy, S. Minimum shift keying: A spectrally efficient modulation. IEEE Commun. Mag. 1979, 17, 14–22. [Google Scholar] [CrossRef]
  53. Gross, N.C.; Cohen, M.B.; Said, R.K.; Gołkowski, M. Polarization of Narrowband VLF Transmitter Signals as an Ionospheric Diagnostic. J. Geophys. Res. Space Phys. 2018, 123, 901–917. [Google Scholar] [CrossRef]
  54. Gu, X.; Wang, Q.; Ni, B.; Xu, W.; Wang, S.; Yi, J.; Hu, Z.; Li, B.; He, F.; Chen, X.; et al. First results of the wave measurements by the WHU VLF wave detection system at the Chinese Great Wall station in Antarctica. J. Geophys. Res. Space Phys. 2022, 127, e2022JA030784. [Google Scholar] [CrossRef]
  55. Veronig, A.; Temmer, M.; Hanslmeier, A.; Otruba, W.; Messerotti, M. Temporal aspects and frequency distributions of solar soft X-ray flares. Astron. Astrophys. 2002, 382, 1070–1080. [Google Scholar] [CrossRef]
  56. Lotz, S.I.; Clilverd, M.A. Demonstrating the use of a class of min-max smoothers for D region event detection in narrow band VLF phase. Radio Sci. 2019, 54, 233–244. [Google Scholar] [CrossRef]
Figure 1. The great circle paths between our VLF receiver at the GWS in Antarctica and the NPM, NAA, and HWU transmitters. The VLF transmitters are marked as red triangles, while the pink circle denotes our VLF receiver at the GWS.
Remotesensing 16 02092 g001
Figure 2. The X-ray fluxes with wavelengths of 0.1 to 0.8 nm measured by XRS-B onboard GOESs 16 and 17 between March 28 and May 23 2022. The black and blue lines denote the measurements from GOESs 16 and 17, respectively. The red rectangular boxes highlight the M- and X-class solar flares. (ad) The X-ray fluxes from March 28 to April 11, April 11 to April 25, April 25 to May 9, and May 9 to 23.
Remotesensing 16 02092 g002
Figure 3. Illustration of the detrending process used in the present study to calculate the phase change caused by solar flares for three representative events. (a) The X-ray fluxes of flare event 45, 51 and 52. (b) The VLF measurements (phase and amplitude) during associated solar flares. (c1c3) The raw VLF phase including three time periods. (d1d3) The background trend fitted using a linear function. (e1e3) The phase net changes caused by associated solar flares.
Remotesensing 16 02092 g003
Figure 4. Event counts of different VLF transmitter signals with or without response to solar flares for the dayside (ac), day–night mixed (df), and nightside (gi) paths.
Remotesensing 16 02092 g004
Figure 5. Histogram showing the dependence of the event counts on the solar zenith angles for the NPM-GWS (a), HWU-GWS (b), and NAA-GWS (c) paths. The SZA at the middle point of the VLF propagation path during the maximum of solar flare events is used, following that defined in George et al. [41] and Belcher et al. [42]. Bars in blue and orange represent the number of events with and without responses to solar flares, respectively.
Remotesensing 16 02092 g005
Figure 6. Maximum change in the measured VLF (ac) amplitude and (df) phase versus the logarithm of the peak X-ray fluxes of the associated solar flares for dayside propagation paths.
Remotesensing 16 02092 g006
Figure 7. Time delay in (ac) amplitude and (df) phase versus the logarithm of the peak X-ray fluxes of the associated solar flares for dayside propagation paths.
Remotesensing 16 02092 g007
Figure 8. Maximum change in the measured VLF (ac) amplitude and (df) phase versus the logarithm of the peak X-ray fluxes of the associated solar flares obtained using VLF measurements from mixed paths.
Remotesensing 16 02092 g008
Figure 9. Time delay in (ac) amplitude and (df) phase versus the logarithm of the peak X-ray fluxes of the associated solar flares obtained using VLF measurements from mixed paths.
Remotesensing 16 02092 g009
Table 1. Transmitter location, midpoint location, path length, and transmitter frequency of NPM- GWS, NAA-GWS, and HWU-GWS.
Path NameTransmitter LocationMidpoint LocationPath LengthFrequency
NPM-GWS21.42°N, 158.15°W28.12°S, 129.91°W~12.6 Mm21.4 kHz
NAA-GWS44.64°N, 67.28°W8.81°S, 63.99°W~11.9 Mm24.0 kHz
HWU-GWS46.71°N, 1.25°E8.89°S, 22.55°W~13.2 Mm21.75 kHz
Disclaimer/Publisher’s Note: The statements, opinions and data contained in all publications are solely those of the individual author(s) and contributor(s) and not of MDPI and/or the editor(s). MDPI and/or the editor(s) disclaim responsibility for any injury to people or property resulting from any ideas, methods, instructions or products referred to in the content.