Article

Global Inversion of Lunar Surface Oxides by Adding Chang’e-5 Samples

1
School of Earth Sciences and Resources, China University of Geosciences, Beijing 100083, China
2
Beijing Key Laboratory of Development and Research for Land Resources Information, Beijing 100083, China
*
Author to whom correspondence should be addressed.
Remote Sens. 2024, 16(10), 1812; https://doi.org/10.3390/rs16101812
Submission received: 7 April 2024 / Revised: 11 May 2024 / Accepted: 18 May 2024 / Published: 20 May 2024
(This article belongs to the Special Issue Planetary Geologic Mapping and Remote Sensing II)

Abstract

:
The chemical distribution on the lunar surface results from the combined effects of both endogenic and exogenic geological processes. Exploring global maps of chemical composition helps to gain insights into the compositional variation among three major geological units, unraveling the geological evolution of the Moon. The existing oxide abundance maps were obtained from spectral images of remote sensing and geochemical data from samples returned by Apollo and Luna, missing the chemical characteristics of the Moon’s late critical period. In this study, by adding geochemical data from Chang’e (CE)-5 lunar samples, we construct inversion models between the Christiansen feature (CF) and oxide abundance of lunar samples using the particle swarm optimization–extreme gradient boosting (PSO-XGBoost) algorithm. Then, new global oxide maps (Al2O3, CaO, FeO, and MgO) and Mg# with the resolution of 32 pixels/degree (ppd) were produced, which reduced the space weathering effect to some extent. The PSO-XGBoost models were compared with partial least square regression (PLSR) models and four previous results, indicating that PSO-XGBoost models possess the capability to effectively describe nonlinear relationships between CF and oxide abundance. Furthermore, the average contents of our results and the Diviner results for 21 major maria demonstrate high correlations, with R2 of 0.95, 0.82, 0.95, and 0.86, respectively. In addition, a new Mg# map was generated, which reveals different magmatic evolutionary processes in the three geologic units.

1. Introduction

Al, Ca, Fe, and Mg, as major components of lunar regolith, reflect a variety of complex geological processes, including volcanism and impact events, providing insight into the petrological characteristics and geological evolution of the Moon. Although chemical abundance within lunar samples can be assessed through laboratory measurements, the limited geochemical information from lunar samples represents only a small range of their composition [1,2,3]. It is not yet possible to gain an overall understanding of the compositional distribution across the Moon through limited sample data.
Nowadays, remote sensing techniques, including high-energy and optical techniques, such as Lunar Prospector (LP) gamma ray spectroscopy (GRS) data [4,5,6,7], LP neutron spectroscopy data [8,9,10,11,12], Clementine ultraviolet/visible (UV/VIS) data [1,13,14,15], Lunar Reconnaissance Orbiter wide angle camera (WAC) ultraviolet/visible (UV/VIS) data [16], KAGUYA multiband imager (MI) data [2,17,18,19,20] and Chang’e-1 (CE-1) interference imaging spectrometer (IIM) data [3,21,22,23,24], are widely used in oxide abundance inversion on the lunar surface. Compared with high-energy techniques, optical techniques offer the advantage of higher resolution, which has led to their predominant use for lunar surface oxide abundance inversion in existing studies [13,22]. However, they also present some problems that need to be considered. (1) Sensitivity of visible near-infrared (VNIR) data: Only Fe and Ti, as transition metals, possess the ability for ligand field transitions that have absorption diagnostic features in the visible to near-infrared range [25,26,27]. Previous models for FeO and TiO2 have relied on reflectance and a two-band ratio targeting the 1 micron iron band [15]. (2) Limitations of previous models: The use of band ratio methods, which rely on only two bands to describe the non-linear relationship between reflectance and oxide abundance, has limited capability in accurately estimating oxide content [23]. The accuracy of oxide content estimation is highly dependent on the inversion model [3,23]. (3) Photometric effects on reflectance values: Differences in solar elevation angle at different times of the lunar day result in varying terrain shadow effects, which have an impact on the reflectance of the lunar surface and consequently increase the uncertainty in oxide content inversion [28]. Additionally, the topographic effects also contribute to lower coverage in optical images [23], particularly in polar regions [3,23].
To overcome these problems, many studies have turned their attention to thermal infrared (TIR) remote sensing [28,29,30,31,32,33,34]. The thermal infrared spectra of silicate minerals exhibit a prominent emissivity maximum near 8 μm, known as the Christiansen feature (CF). The CF can be used as an indicator for identifying the composition of silicate minerals, such as plagioclase, pyroxene, and olivine [35], compensating for the limitations of visible and NIR remote sensing [36]. Additionally, the wavelength position of the CF is closely related to the degree of polymerization of silicate minerals and the content of cations in the minerals [29,37,38]. Therefore, the CF map derived by Lucey et al. [32], with the correction of space weathering effects and a resolution of 32 pixels/degree (ppd), provides a different perspective for quantitative inversion of oxide abundance on the lunar surface.
In addition to remote sensing data, geochemical information from returned lunar samples and in situ measurements are also the basis of compositional inversion, providing a reliable ground truth for compositional modeling of the lunar surface. The lunar regolith samples used in previous studies were obtained from six Apollo and three Luna missions, which represent chemical features only from 3.1–4.3 Ga [39,40], missing the later stage of lunar evolution. In November 2020, the Chang’e-5 (CE-5) mission returned lunar regolith samples from the Mons Rümker in the northern Oceanus Procellarum (43.06°N, 51.92°W), with a radiometric age of 2.0 Ga [41,42,43]. The CE-5 sample represents the youngest volcanic eruption, and its inclusion holds significant importance in updating the lunar surface oxide maps.
The distribution of oxides on the lunar surface exhibits significant heterogeneity, which is particularly evident in samples from the highlands and maria, with corresponding differences in the number of samples from these regions [7]. This heterogeneity, combined with the inconsistency in sample quantities, imposes potential limitations in predicting using single-model algorithms. However, ensemble machine learning algorithms can help alleviate these limitations by integrating multiple models to improve the accuracy and robustness of predictions [44]. Among these, the extreme gradient boosting (XGBoost) algorithm, as an efficient integrated learning technique, has demonstrated excellent performance in several fields [45,46,47]. Meanwhile, the partial least squares regression (PLSR) algorithm, as a well-established linear regression analysis method, is particularly suitable for datasets in which the number of predictor variables is larger than the number of observed samples, and it has been widely used in soil spectral analysis [48,49,50]. Therefore, we choose the results of the PLSR model as the control group for the XGBoost model, aiming to explore the feasibility of machine learning algorithms to estimate the abundance of oxides and improve the accuracy of the inversion results.
Given the above limitations and challenges, this study aims to (1) employ the particle swarm optimization–extreme gradient boosting (PSO-XGBoost) algorithm to construct inversion models for exploring updated maps of oxide (Al2O3, CaO, FeO, and MgO) abundance, (2) evaluate the predictive accuracy of our model in comparison to the PLSR model and other previous work, (3) investigate the new Mg# map that delineates the lunar surface into three geological units (maria, highlands, and SPA basin) with distinct Mg# features, and discuss the differences in the magmatic processes undergone in these units. According to the results, the oxide distribution maps in this work provide valuable data support for understanding the geological evolution of the Moon.

2. Data

2.1. Christiansen Feature
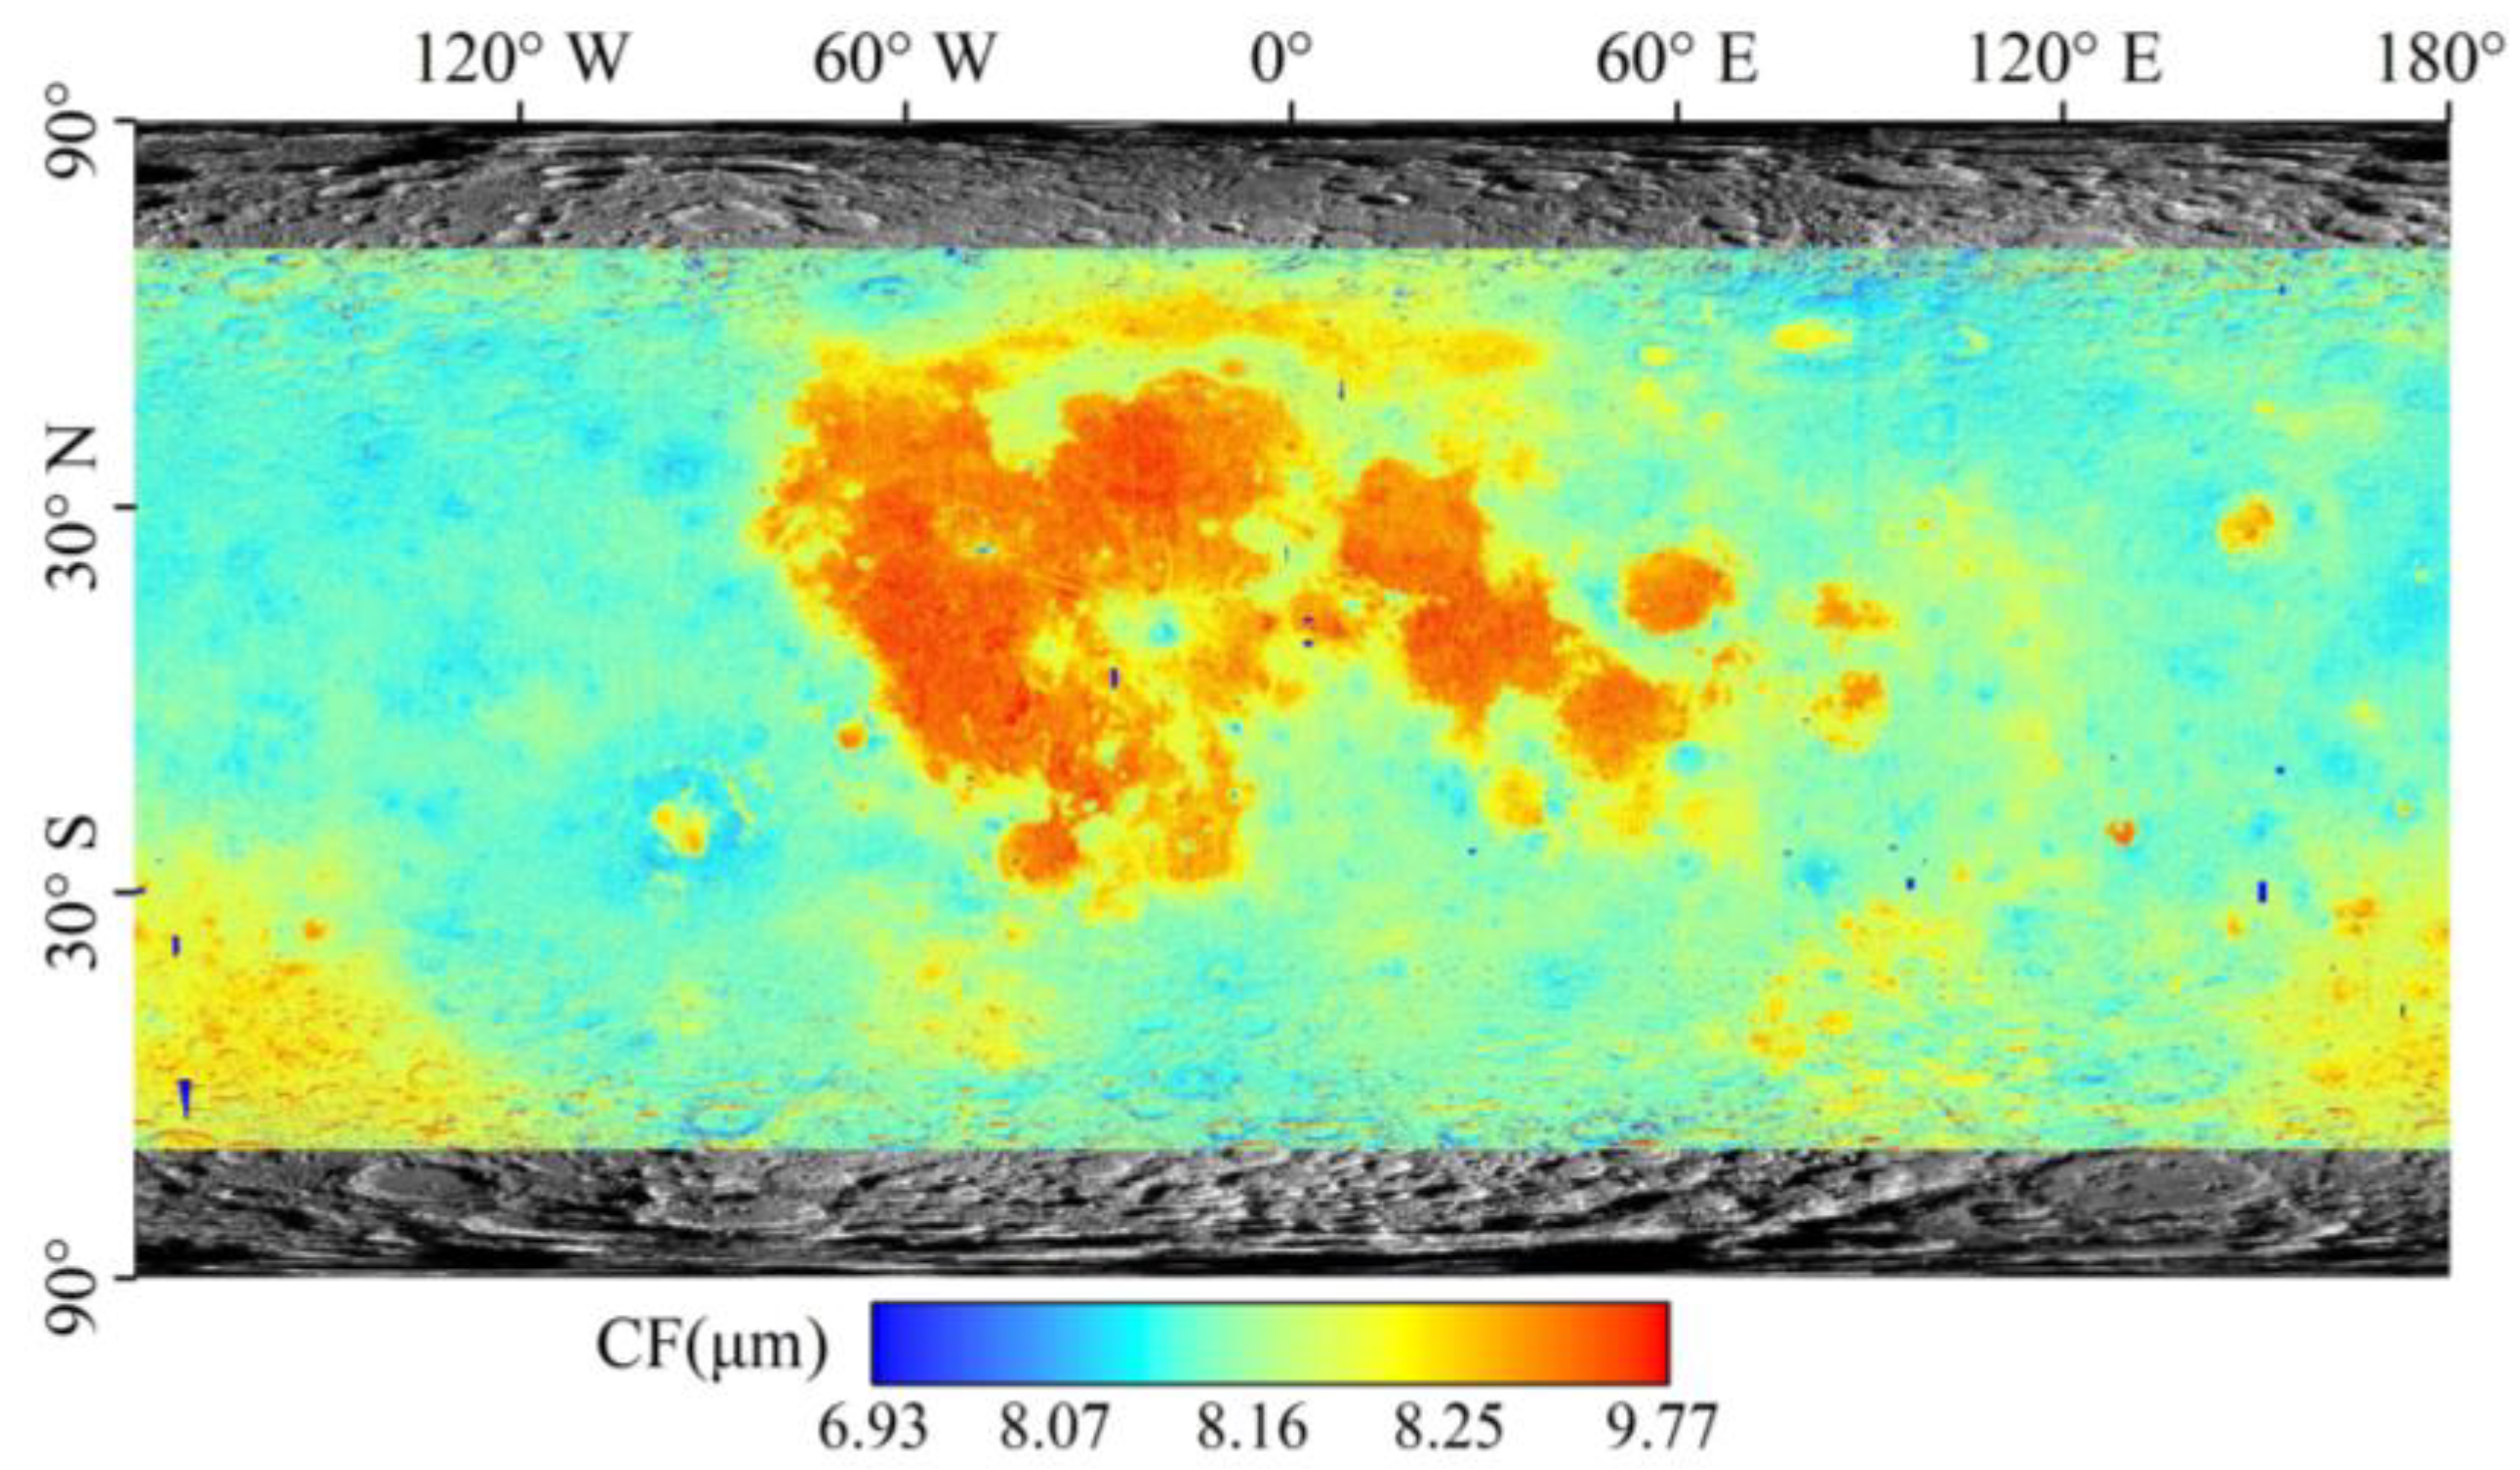
CF refers to the phenomenon in the spectra of silicate samples involving a strong minimum reflectance and maximum emission near 8 μm [35]. The CF feature is mainly related to the Si-O stretching vibrations in the crystals. Although fine grain sizes characteristic of lunar soil can somewhat suppress the spectral contrast of vibrational features [51], the CF and its wavelength sensitivity to composition still persist, making the CF important in lunar remote sensing [32]. Plagioclase, pyroxene, olivine, and ilmenite are the major minerals on the Moon, all of which, except for ilmenite, are silicate minerals and exhibit distinctly different CF values. Among them, the CF values of plagioclase, pyroxene, and olivine are 7.84 μm, 8.25 μm, and 8.67 μm, respectively [31].

2.2. Diviner CF Map

Diviner is a nine-channel radiometer carried on the Lunar Reconnaissance Orbiter (LRO) satellite, with a wavelength range from ultraviolet to far-infrared, approximately 0.35–400 μm [52,53]. Diviner’s three narrow channels near 8 μm were utilized to estimate the spectral position of maximum emission, known as CF [33]. The CF maps were based on three-point spectral data from Diviner and there are uncertainties relating to those CF positions based on the position of the Diviner spectral filters. Recently, Lucey et al. [32] corrected the effects of space weathering and generated a new CF map with a resolution of 32 ppd (948 m/pixel at the equator), providing strong support for chemical (Al2O3, CaO, FeO, and MgO) inversion (Figure 1).

2.3. Lunar Sampling Sites

Lunar sample data are the basis of compositional inversion and also the standard of model accuracy evaluation. In this study, forty-nine lunar samples from the Apollo, Luna, and Chang’e projects [3,19,20,28] were utilized to represent the ground truth of oxide content (Table 1). Additionally, the CF value of CE-5 was extracted based on the criteria stated by Ma et al. [28] and the other CF values were derived from Ma et al. [28].

3. Methods

3.1. Oxide Inversion Model

We used PSO-XGBoost and PLSR algorithms to construct mathematical models for describing the relationship between the four oxide contents and CF values. The XGBoost algorithm is one of the supervised machine learning models proposed by Chen and Guestrin [44] and is essentially a gradient boosting decision tree (GBDT) model. The fundamental idea of the XGBoost algorithm is to integrate multiple weak estimators into a strong estimator [54], demonstrating excellent performance in parallel computing efficiency, handling missing values, controlling overfitting, and predicting generalization ability [55,56].
There are two important parameters in the XGBoost model: n_estimators and learning_rate. The n_estimators parameter represents the number of trees built during training. The larger the n_estimators value, the better is the learning capacity of the model and the easier is the overfitting. The other parameter is learning_rate, also known as shrinkage, which controls the iteration rate and can be used to prevent overfitting. After each iteration, the XGBoost algorithm determines the weights of new features to control the weights of the subtrees and mitigate overfitting [47].
The PSO algorithm, proposed by J. Kennedy and R. Eberhart [57], is a stochastic search algorithm based on collective collaboration, which was developed through simulating the foraging behavior of birds [57,58]. In the PSO algorithm, each potential solution is called a particle [54] and consists of the velocity vector and geometric position vector [59]. The core of the PSO algorithm is to update the velocity and position of the particles, enabling the continuous search for the optimal solution within the search space [60]. The PSO algorithm helps to find the optimal combination of parameters which can improve the performance of the XGBoost model.
In addition, the PLSR algorithm is a linear regression model proposed by de Jong [61]. The core idea of PLSR is to find a new space that can simultaneously explain the variation in both the predictor and response variables [62]. In the PLSR model, coefficients and intercepts are two important parameters. PLSR simplifies the model by extracting latent variables and captures the relationships between variables through coefficients and intercepts, thereby enhancing the model’s predictive power.

3.2. Model Parameters and Evaluation Index

In this study, the oxide abundances and CF values of 49 lunar samples were input into the PSO-XGBoost and PLSR algorithms to construct oxide inversion models. To ensure the training effectiveness of the designed oxide inversion models, it was necessary to optimize relevant parameters of the models. In each oxide model constructed by the PSO-XGBoost algorithm, the optimal values of two hyperparameters were obtained through iteratively updating the location vectors and velocity vectors of the PSO (Table 2). The optimal parameters of the oxide model based on the PLSR algorithm are shown in Table 3. Based on these optimal parameters, the functional relationships between CF values and oxide abundances were constructed. In addition, random sampling was adopted to select 80% of the 49 lunar samples (39 samples) as the training set and 20% of the 49 samples (10 samples) as the testing set.
To assess the performance of the oxide inversion models, the determination coefficient (R2) and the root mean square error (RMSE) were utilized as evaluation indicators and calculated as follows:
R 2 = 1 i = 1 m ( c i ˇ c i ) 2 i = 1 m ( c i c i ¯ ) 2
R M S E = i = 1 m ( c i ˇ c i ) 2 n
where c i ˇ , c i and c i ¯ denote the true, predicted, and mean values of the i t h sample, respectively, and n denotes the number of samples.
Finally, the corrected CF values of the Moon (70°N/S) were used as input for predicting, and the Al2O3, CaO, FeO and MgO abundances of the Moon (70°N/S) were output, respectively.

4. Results

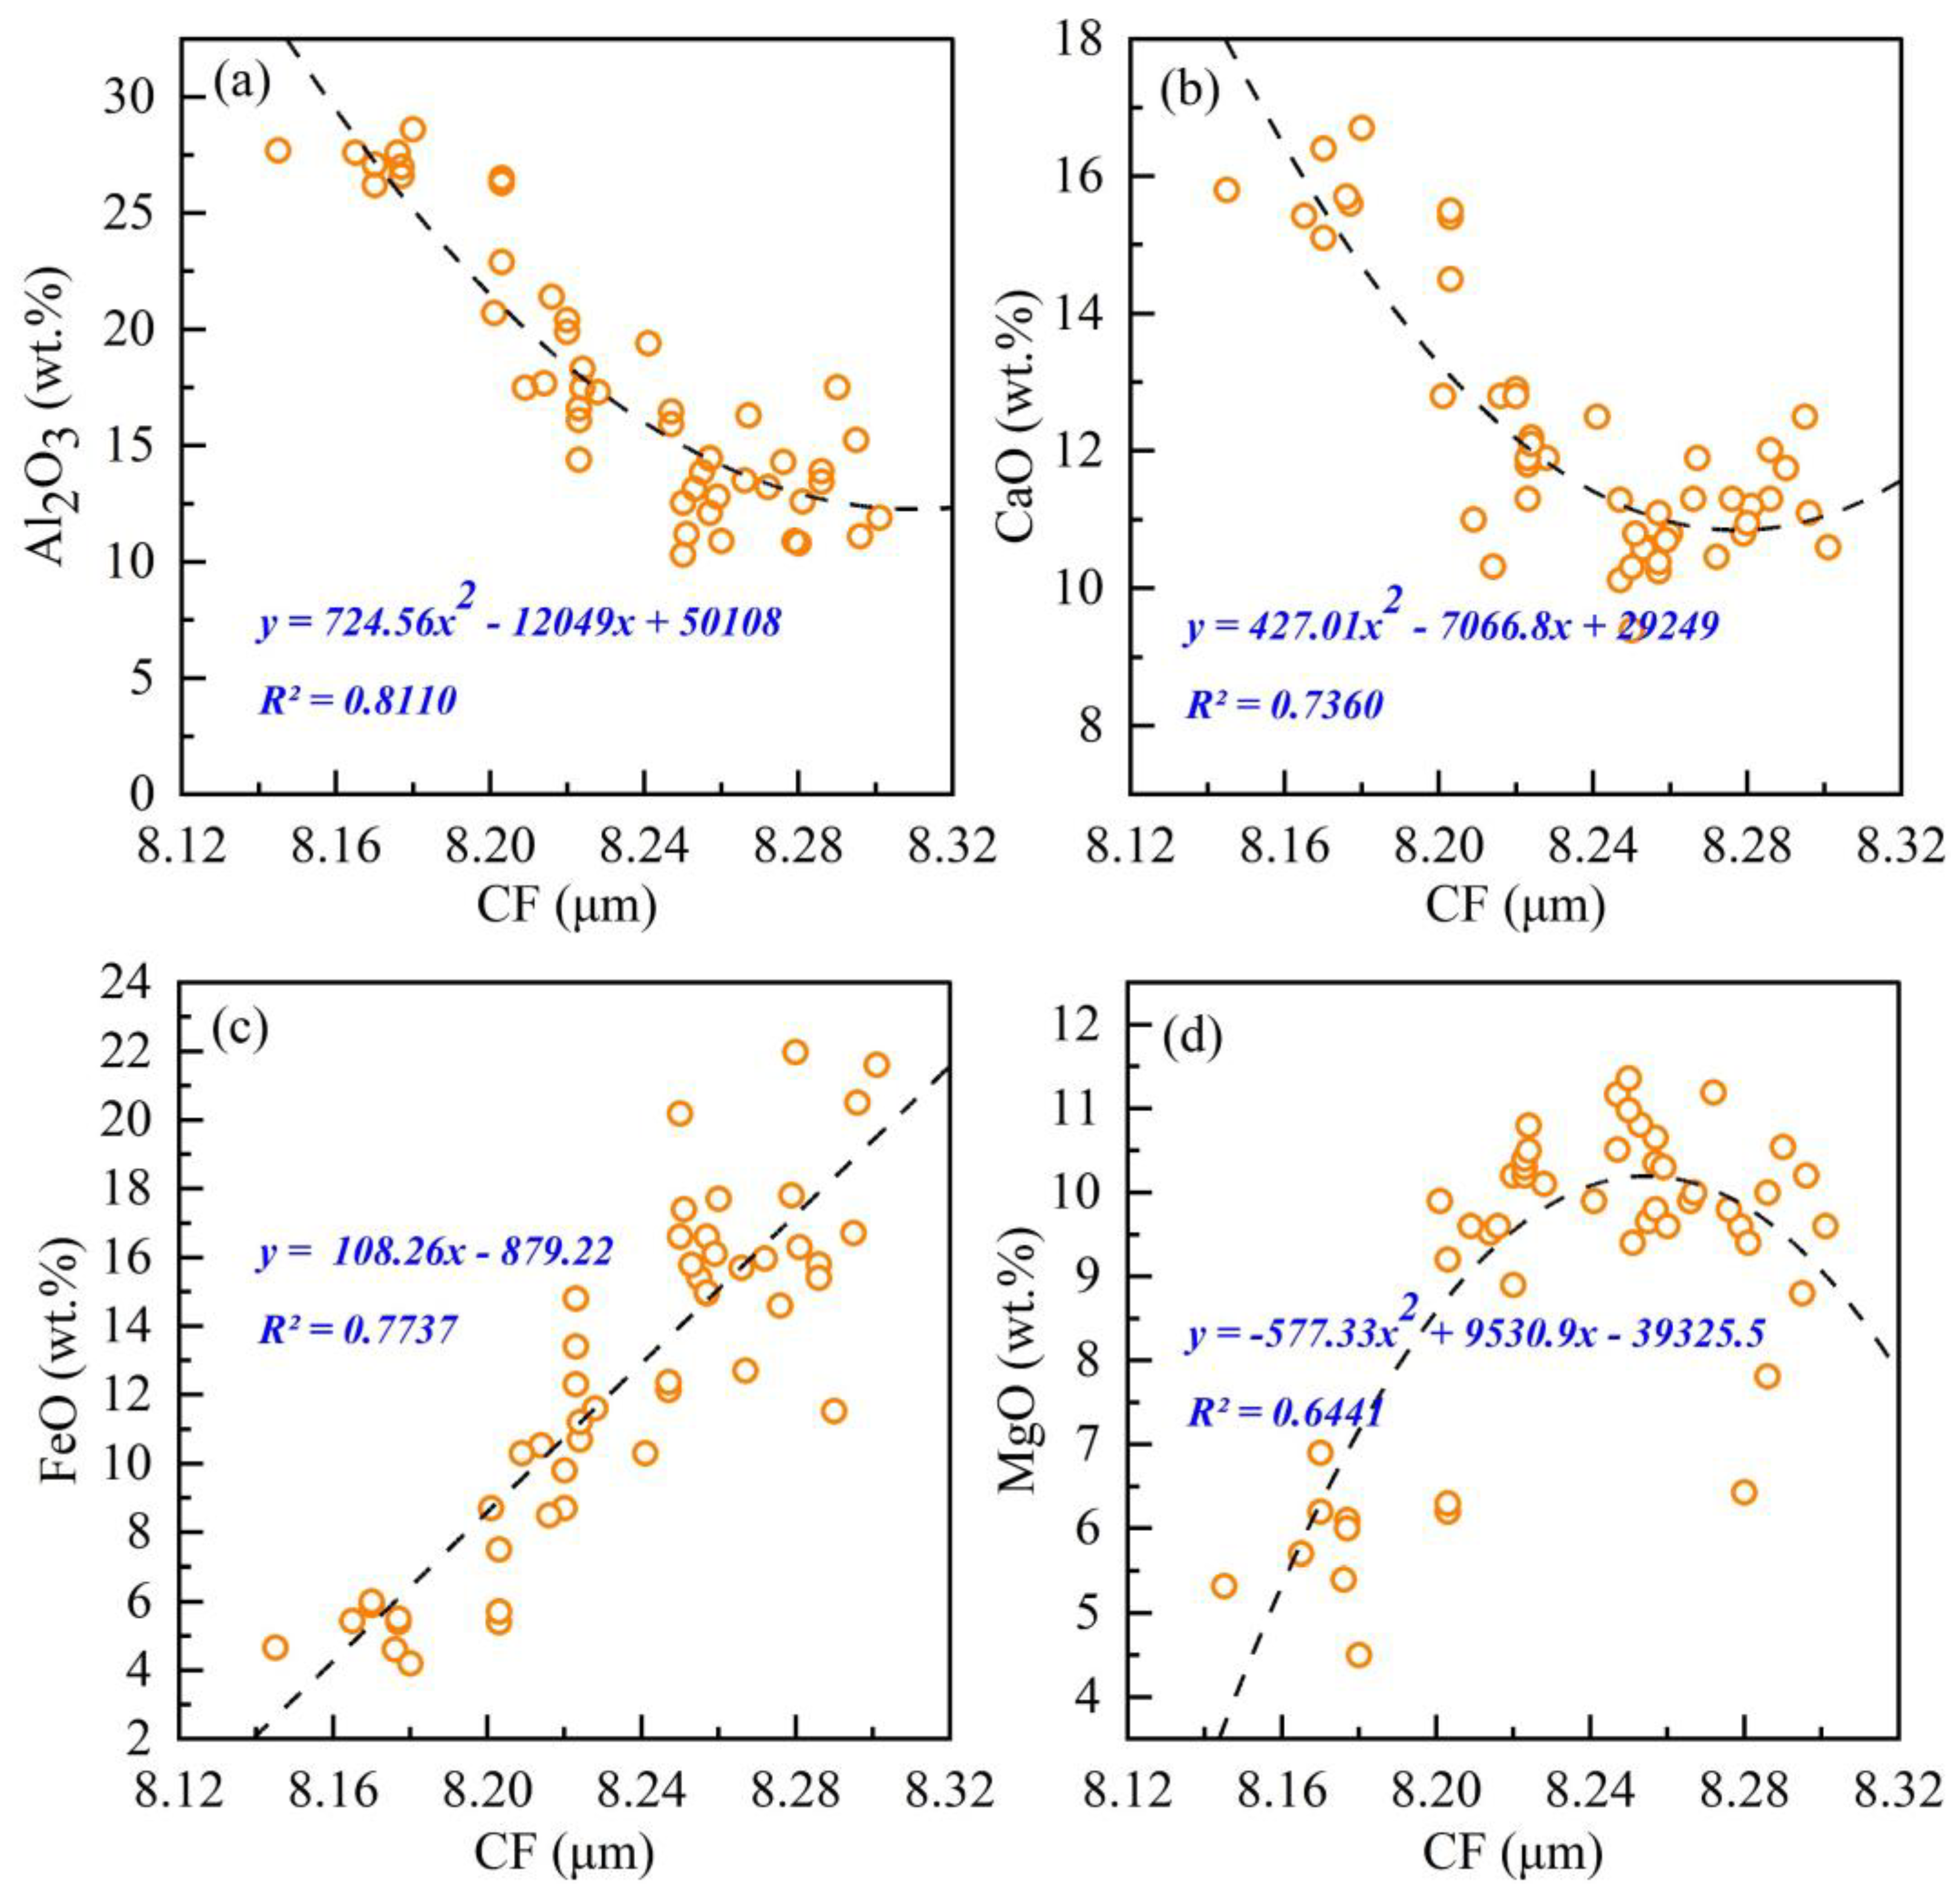
4.1. Correlation Coefficients between Oxides and CF Values

Correlation analysis of CF values and oxide abundances at 49 sampling sites showed high Pearson correlation coefficients (Figure 2). In general, Al2O3 and CaO exhibited negative correlation with CF values, whereas FeO and MgO demonstrated positive correlation. Among them, the linear correlation between CF values and FeO abundance was 0.7737, and the nonlinear correlation between CF values and abundance of oxides (Al2O3, CaO, and MgO) were maintained at 0.8110, 0.7360, and 0.6641, respectively. However, the relationship between CF values and oxide content was not always univariate linear regression. For some oxides (e.g., Al2O3, CaO, and MgO), it was difficult to describe their complex relationship with CF values using traditional univariate regression.

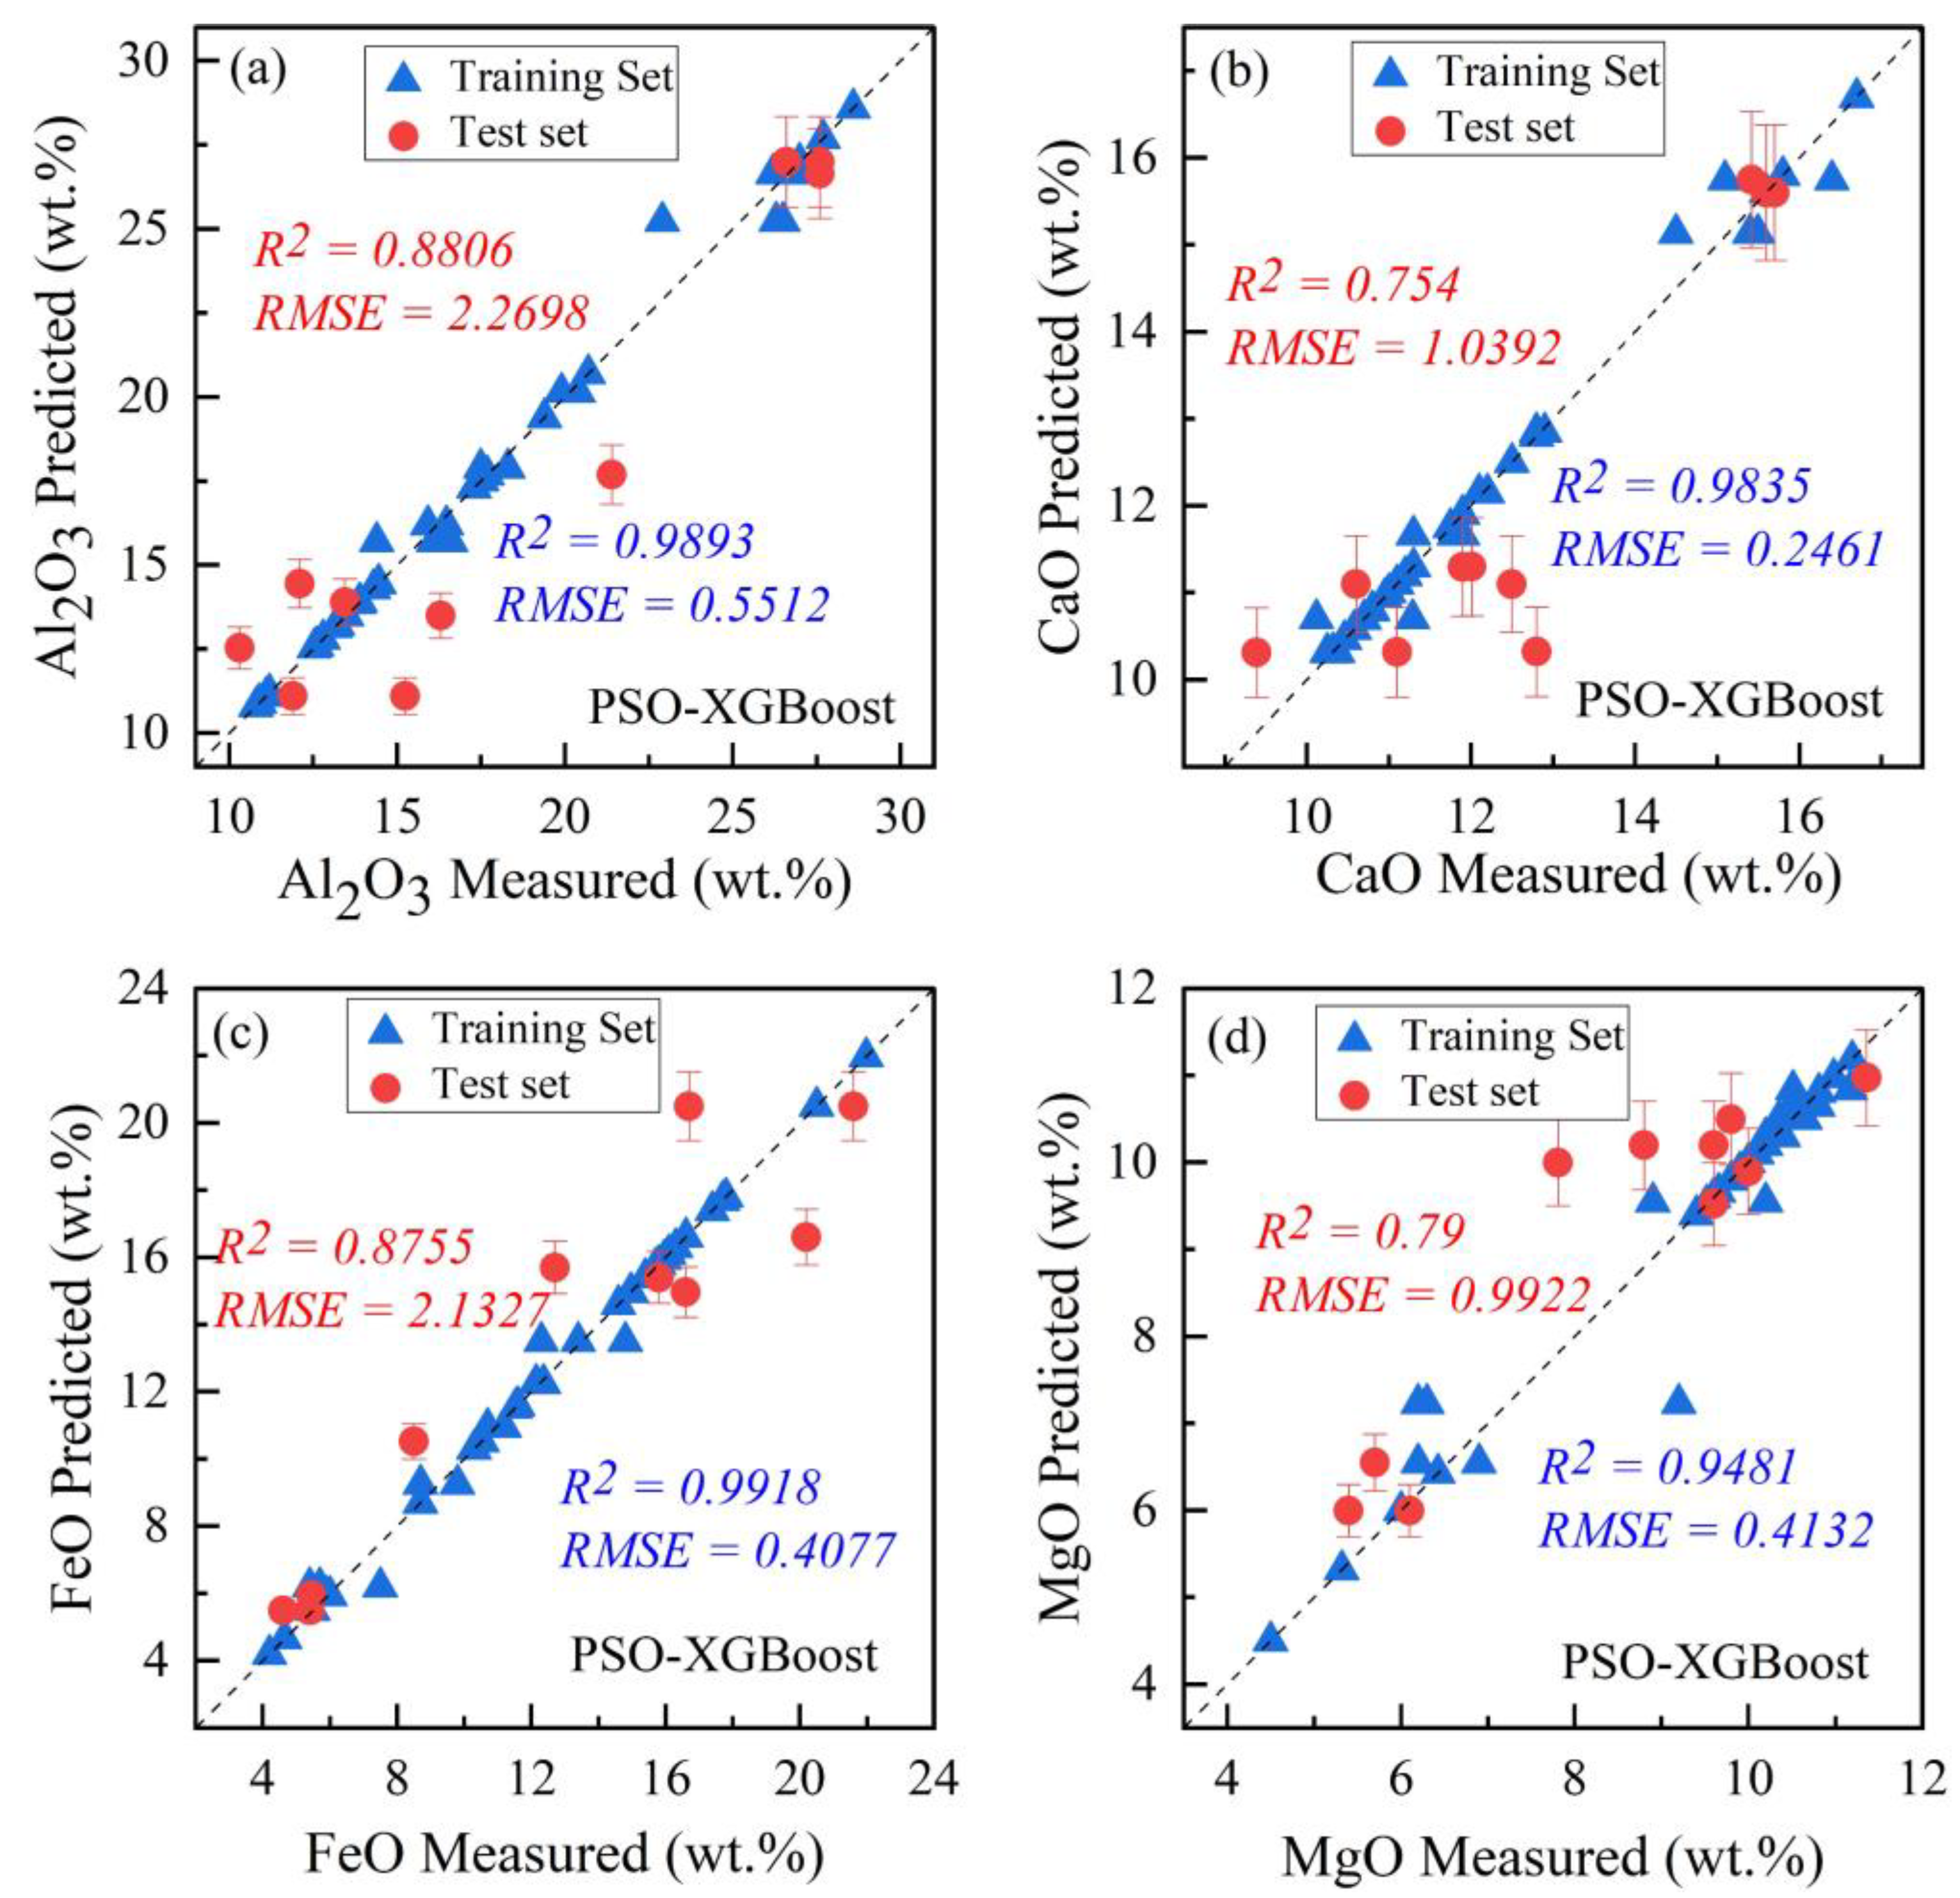
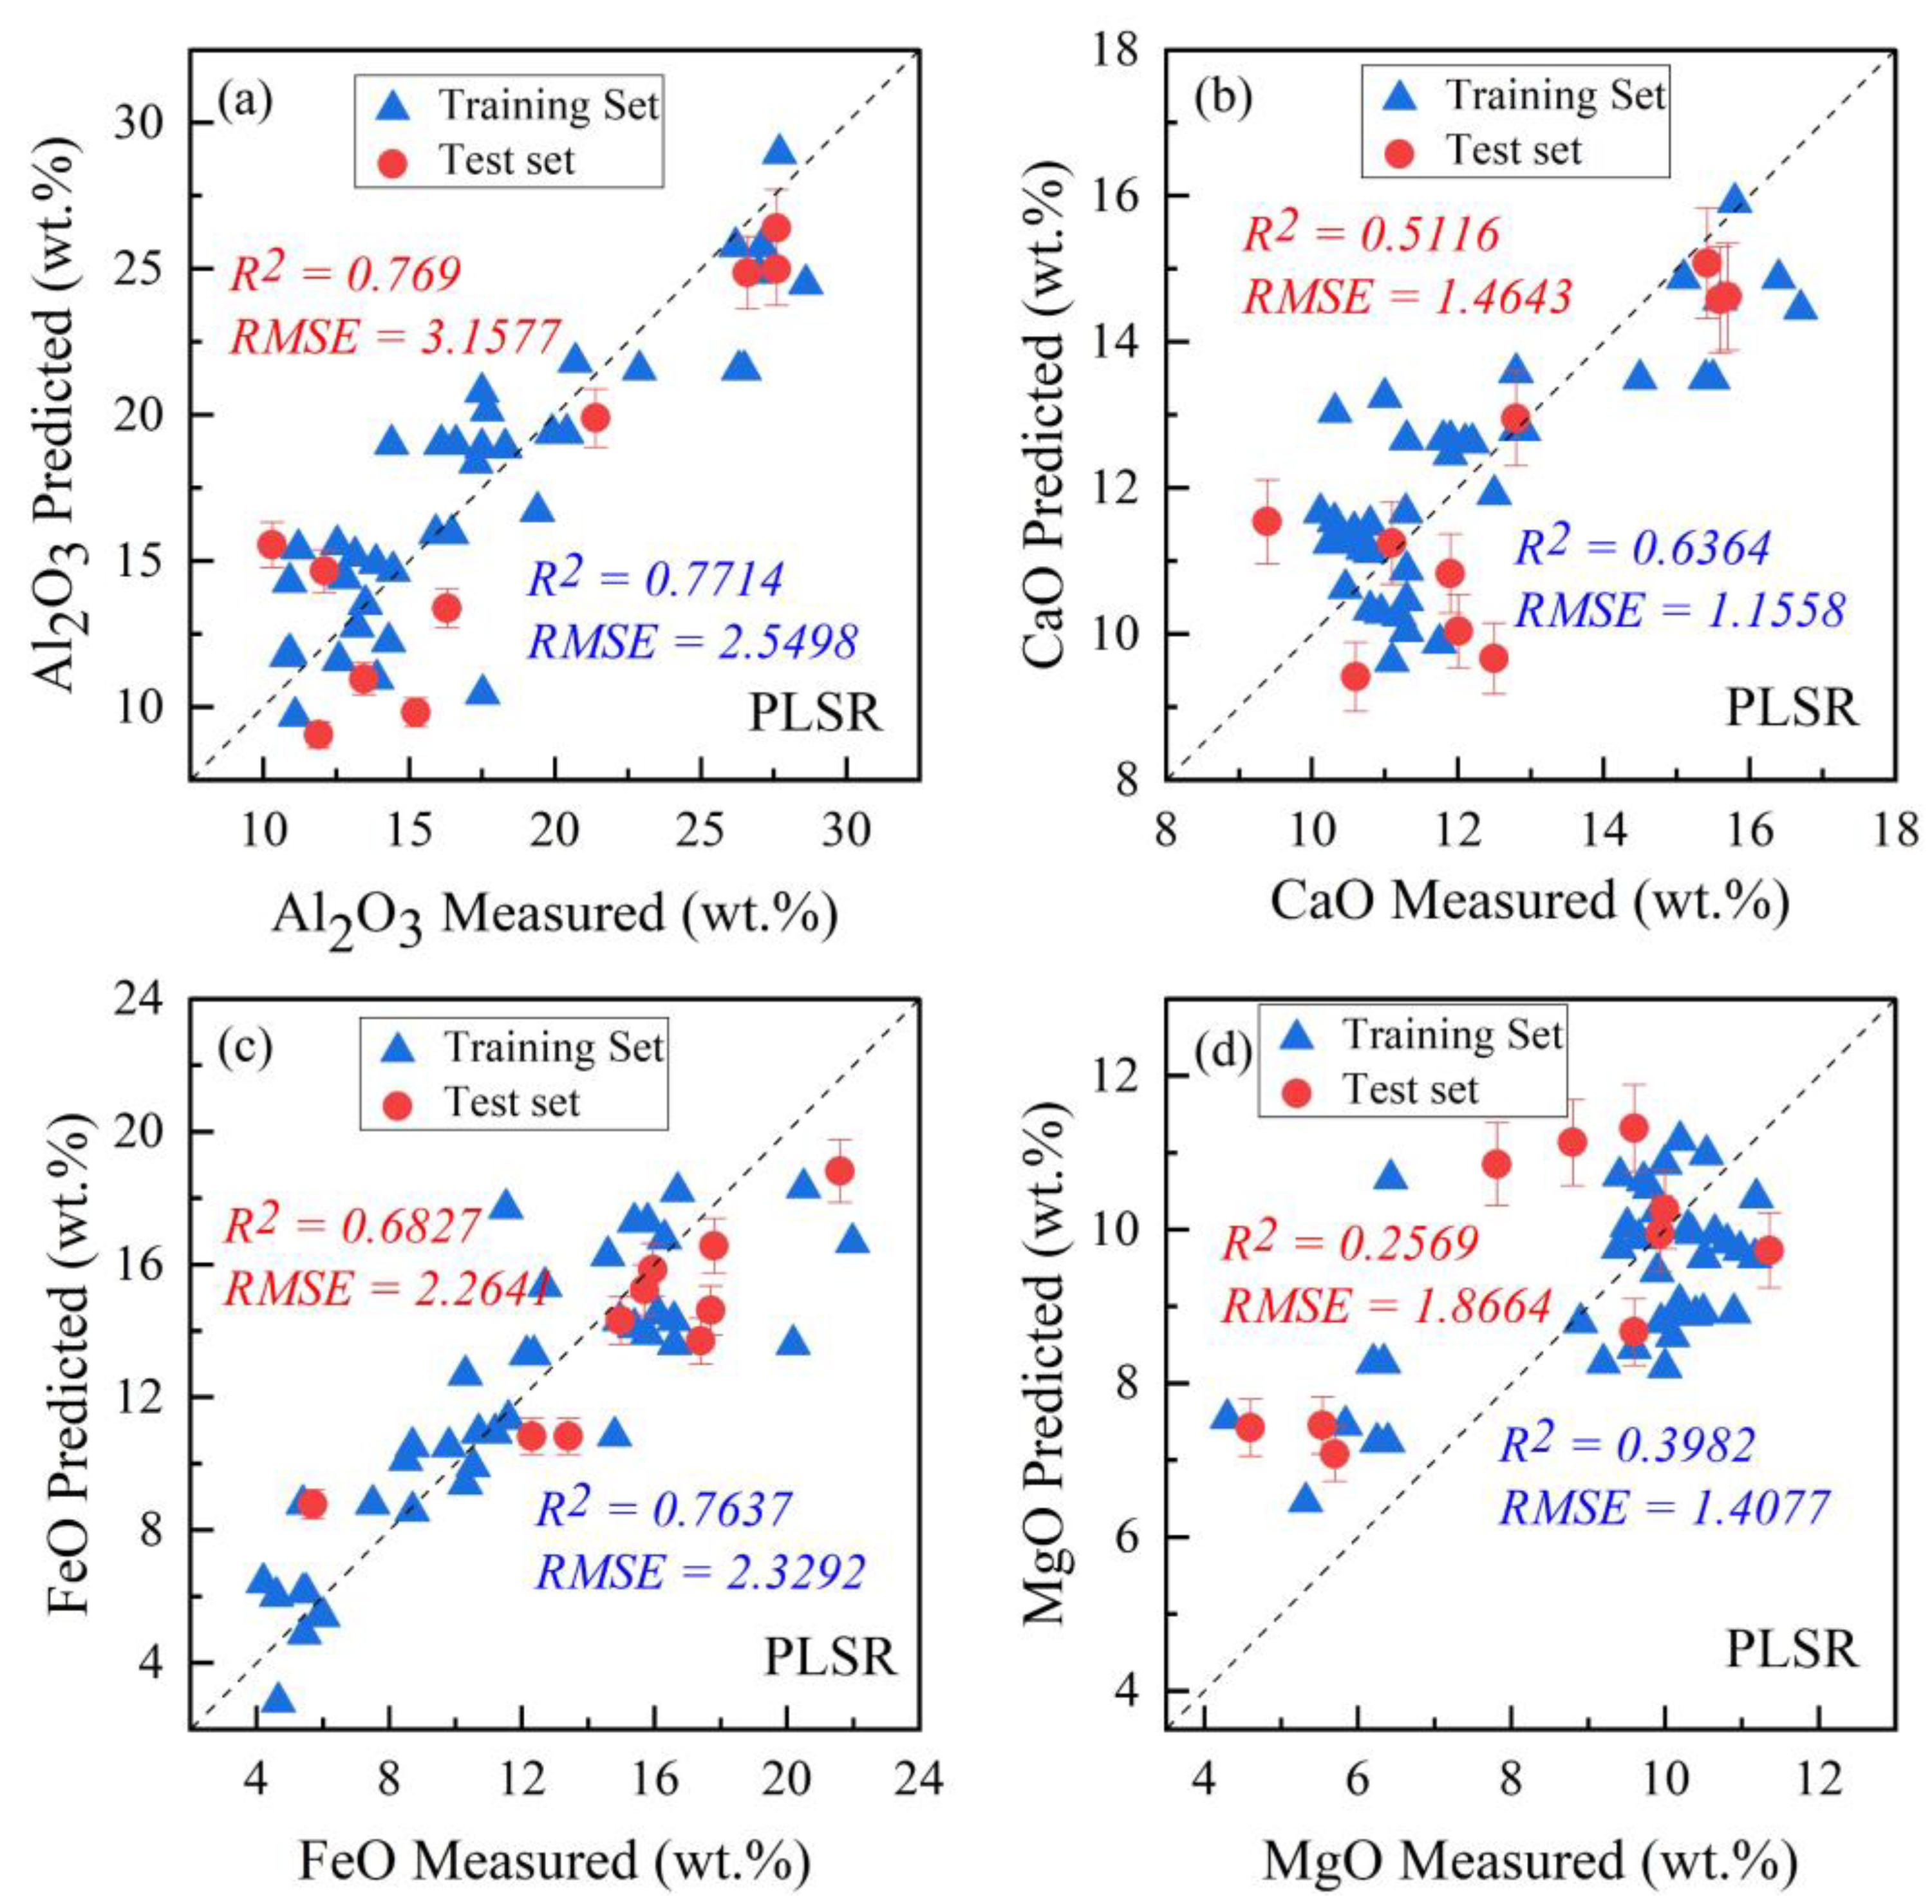
4.2. Model Accuracy Evaluation

The prediction accuracies of the PSO-XGBoost models are shown in Figure 3. The R2 values of the oxide (Al2O3, CaO, FeO, and MgO) abundance prediction models were 0.8806, 0.754, 0.8755, and 0.79, respectively, all greater than 0.75. The RMSE for these predictive models was also notably low, at 2.2698, 1.0392, 2.1327, and 0.9922. In contrast, the PLSR models (Figure 4), while possessing some predictive capability, demonstrate slightly inferior R2 values of 0.769, 0.5116, 0.6827, and 0.2569, and relatively higher RMSE values of 3.1577, 1.4643, 2.2641, and 1.8664, respectively. Therefore, compared with the PLSR model, the PSO-XGBoost model demonstrated superior performance in capturing nonlinear relationships, enabling it to provide more precise predictions of oxide abundance.

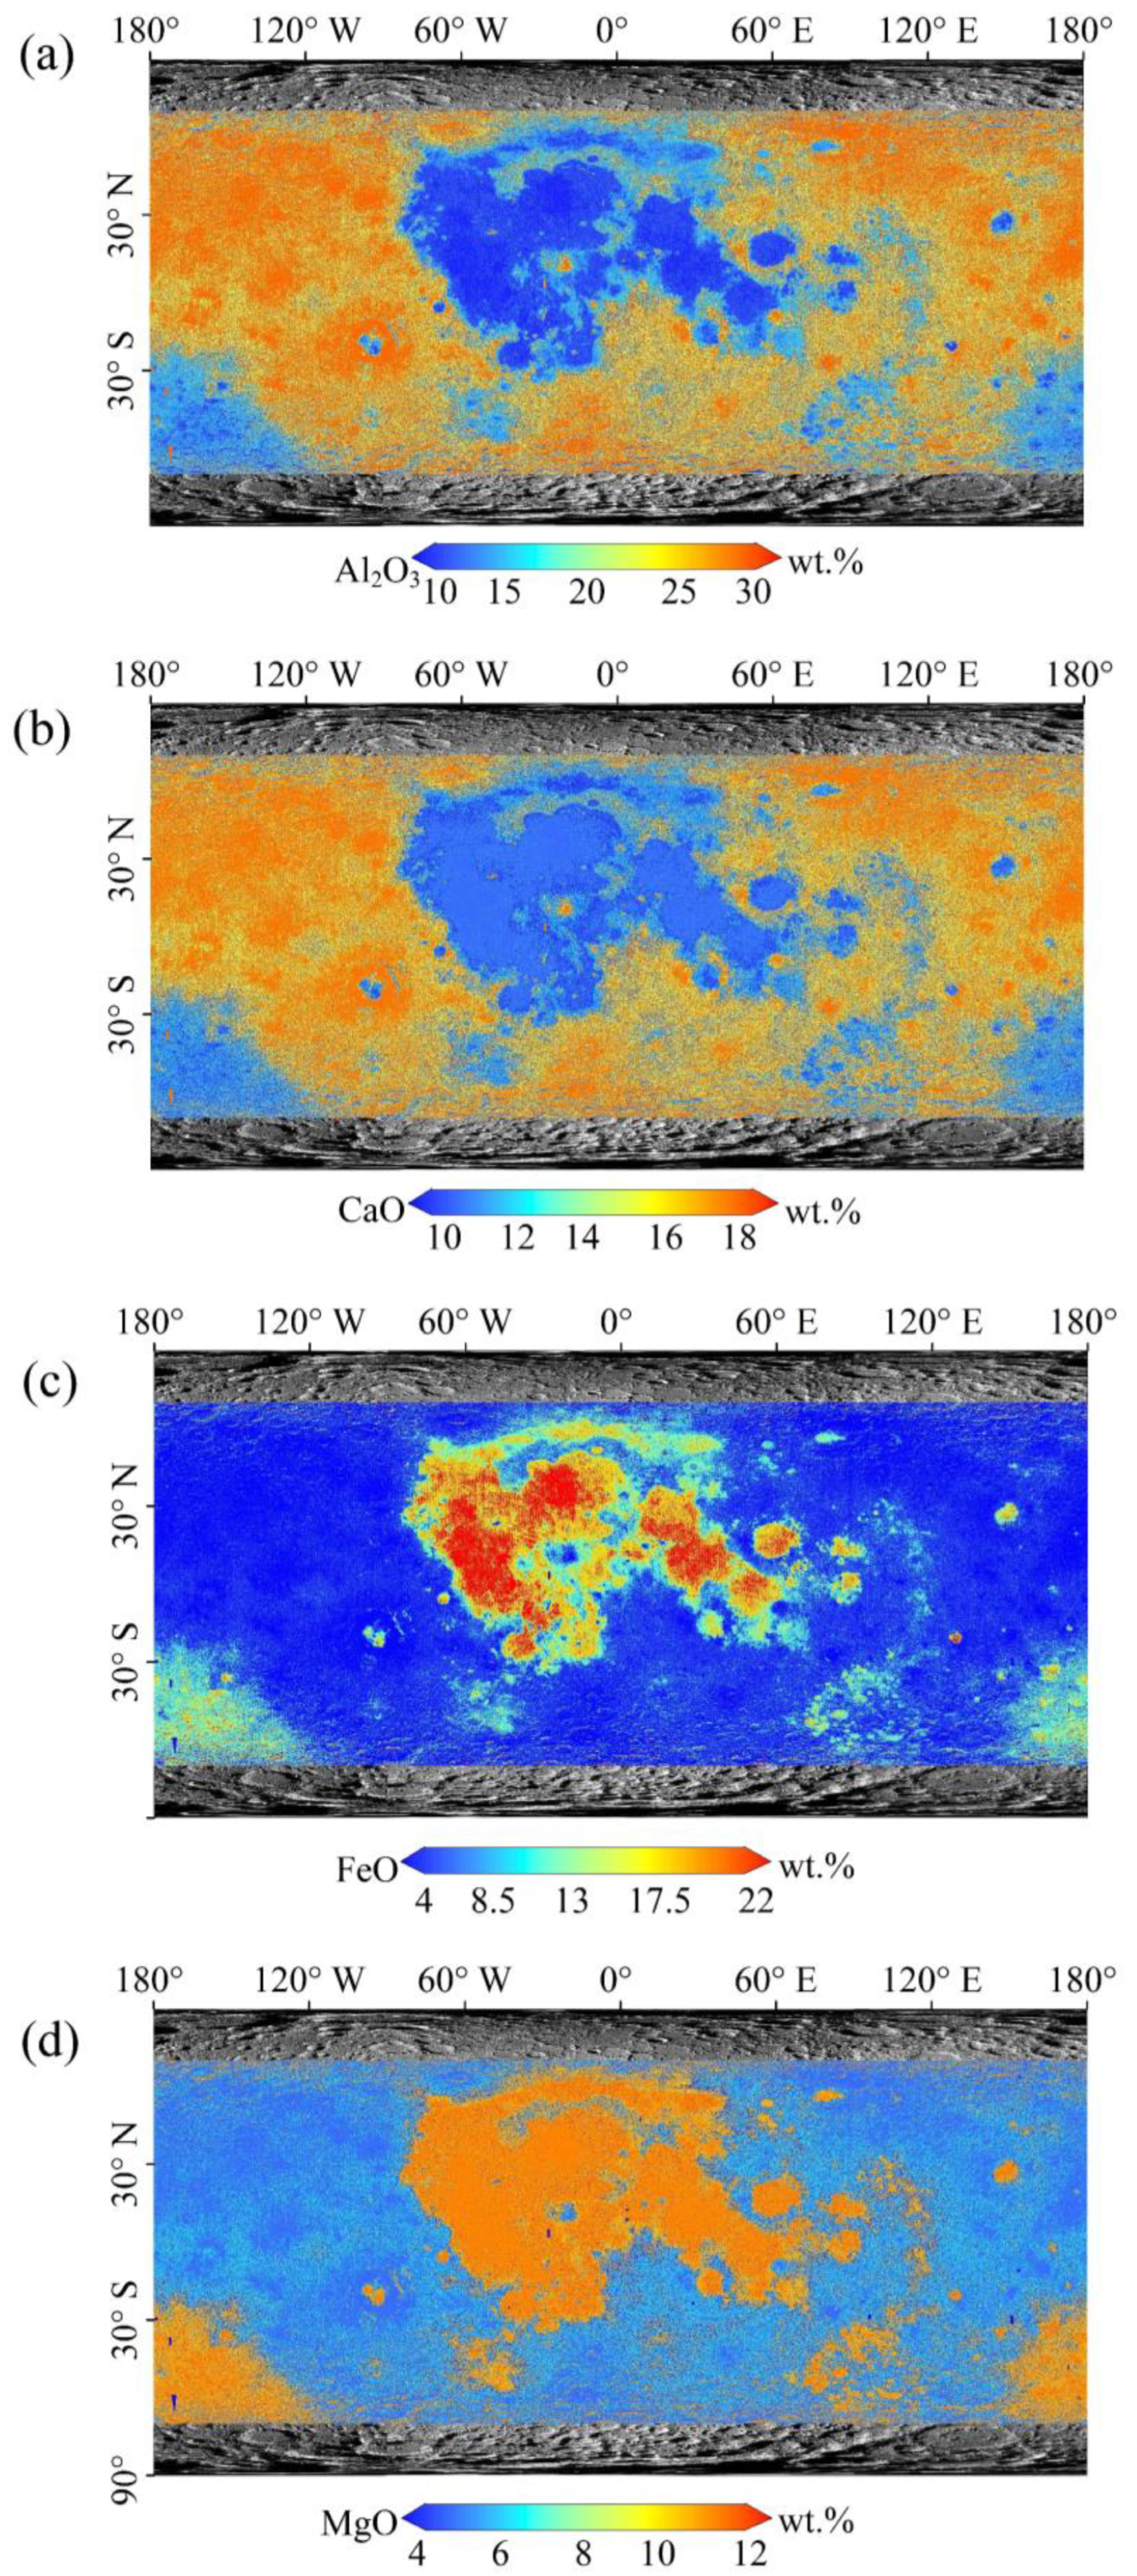
4.3. Global Maps of Oxides

The global distribution maps of the four oxides’ abundances with a resolution of 32 ppd were derived from the CF map based on the PSO-XGBoost model, as shown in Figure 5. From a global perspective, the average abundances of Al2O3, CaO, FeO, and MgO were 23.63 wt.%, 14.42 wt.%, 7.78 wt.%, and 7.14 wt.% respectively, and the standard deviations of Al2O3, CaO, FeO, and MgO were 5.64, 2.10, 4.47 and 2.15 (Table 4). Among them, the highest average of Al2O3 across the global Moon indicates that Al2O3 is present in a relatively significant proportion in the lunar oxides. Additionally, standard deviation is a statistical measure that quantifies the amount of variation or dispersion in a set of values, and the highest standard deviation of Al2O3 implies significant differences in Al2O3 abundance between different regions on the lunar surface.

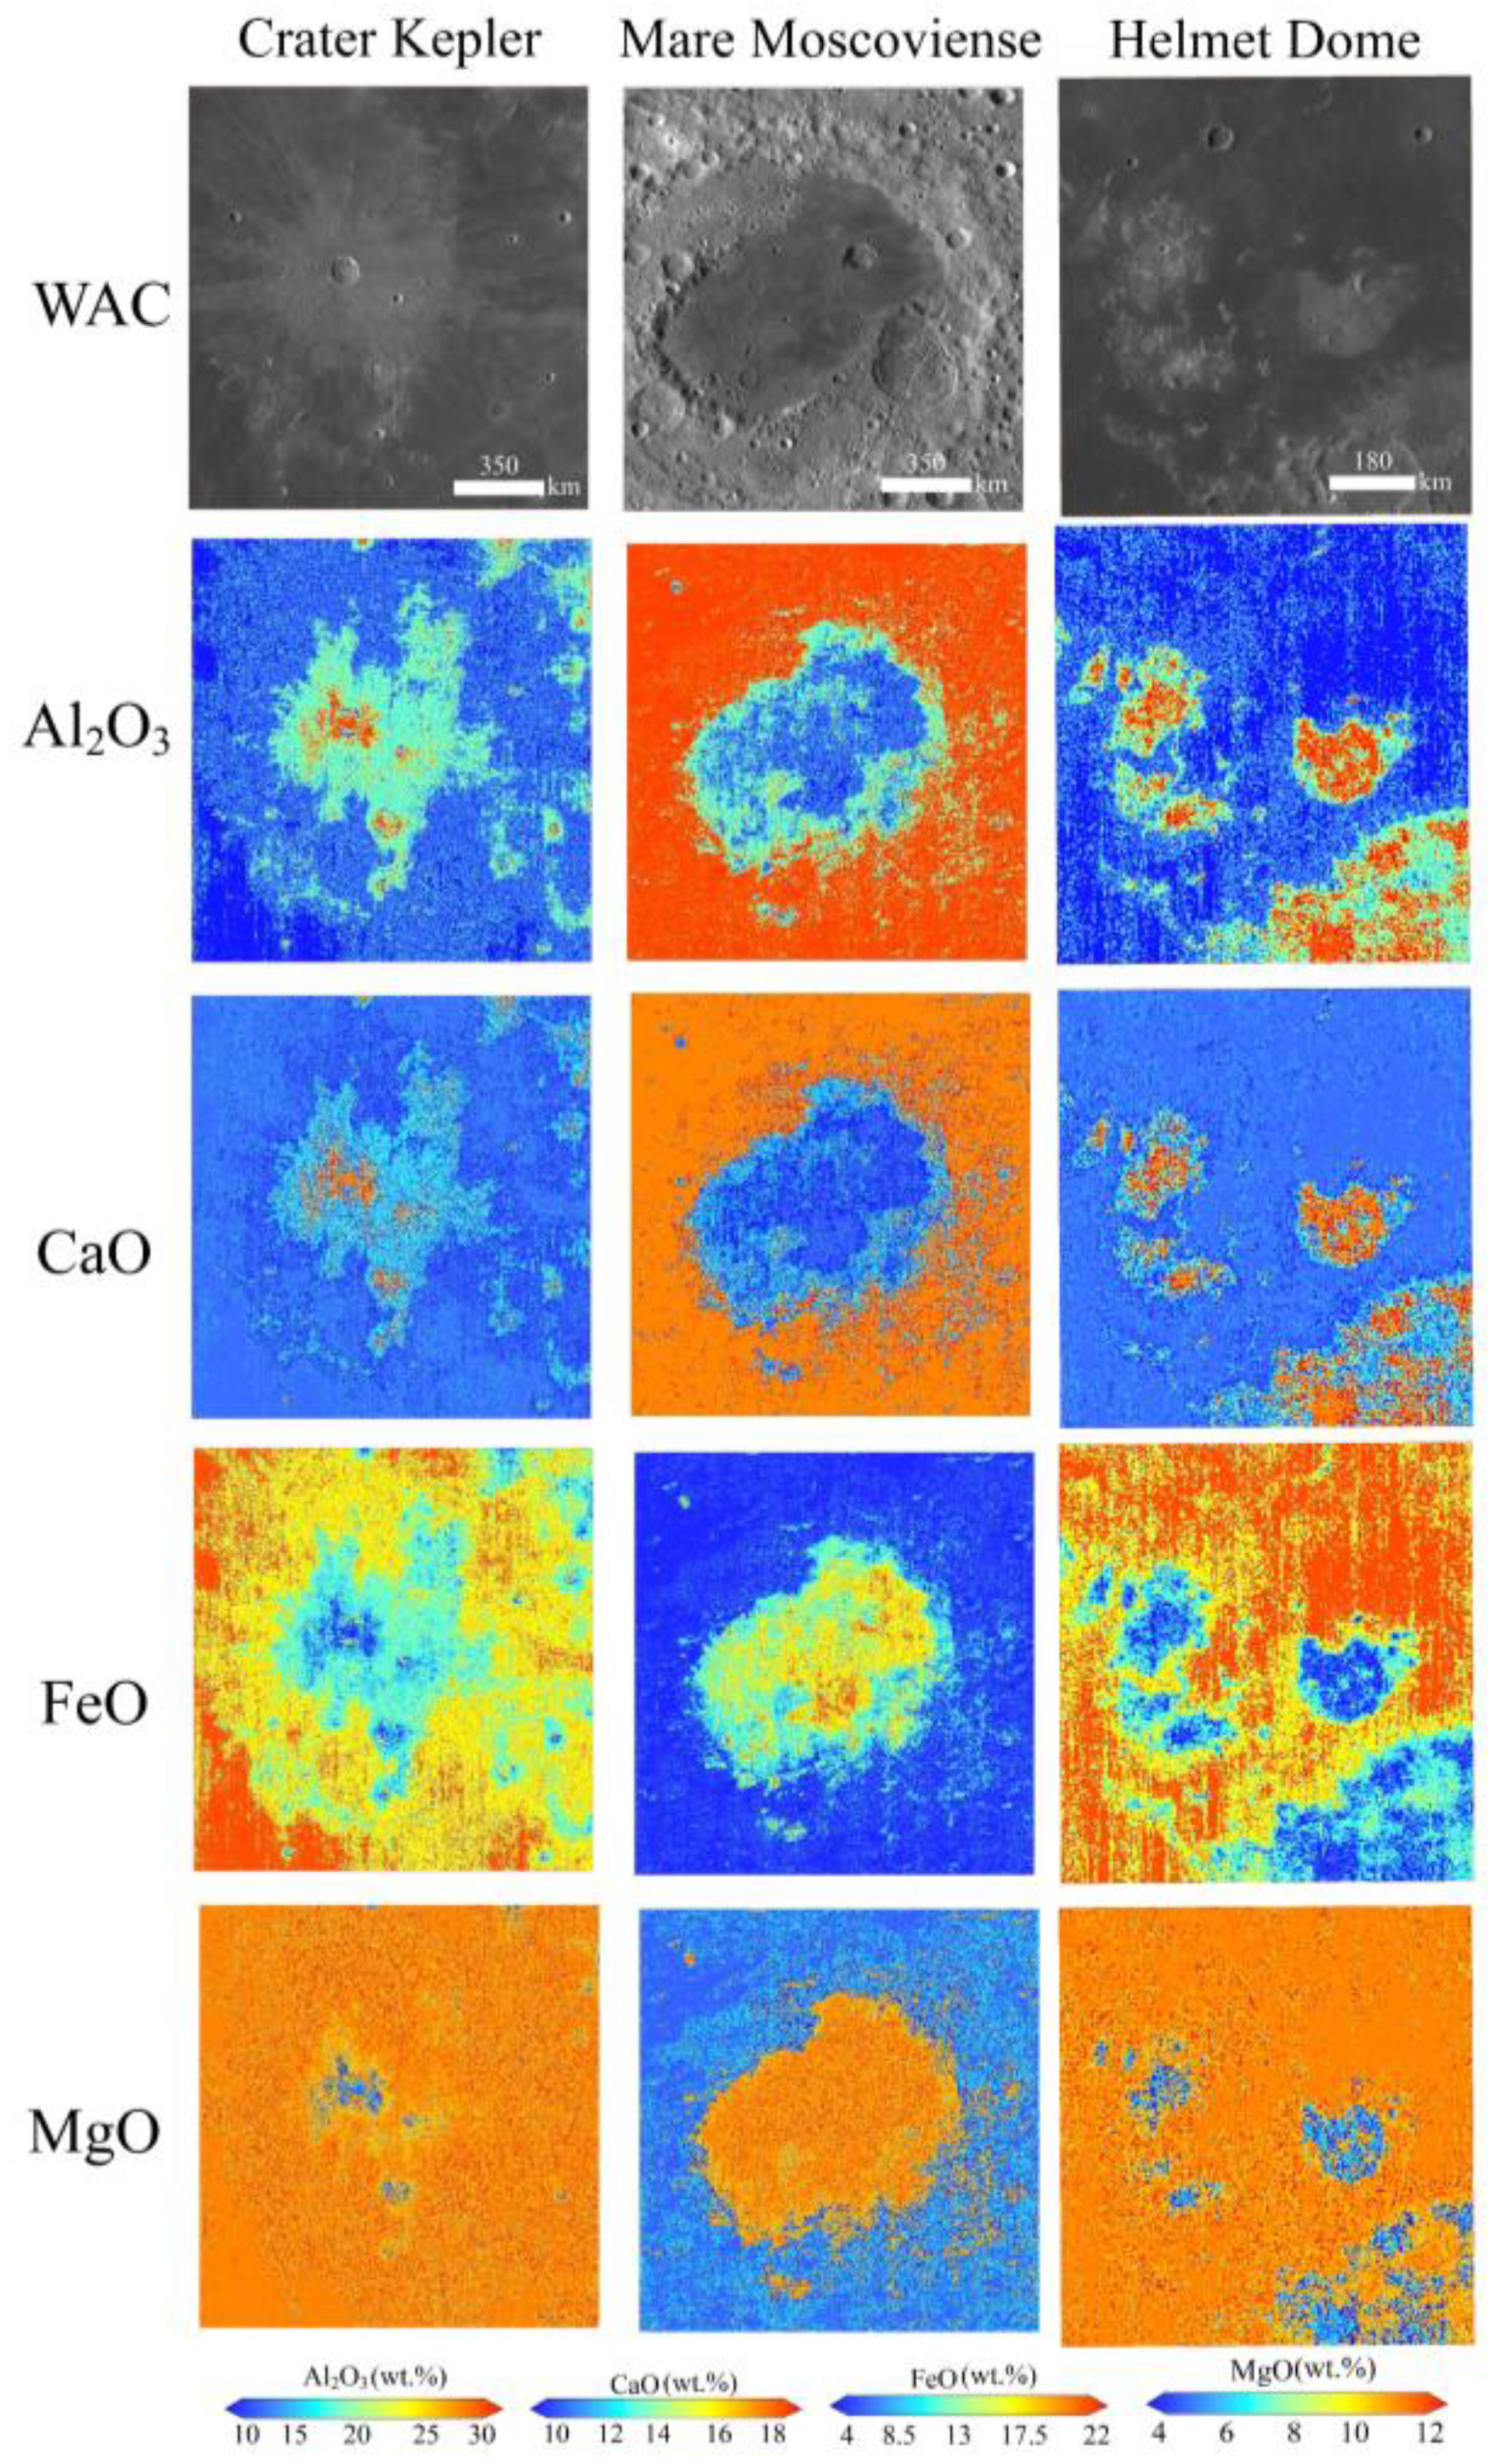
4.4. Three Geological Units and Interesting Regions of Chemical Abundances

As shown in Table 4, the four oxides’ average abundance in the Moon (70°N/S) and the SPA basin follows the order Al2O3 > CaO > FeO > MgO. In maria, the order of four oxides average abundance is FeO > Al2O3 > CaO > MgO, while the order of the four oxides’ average abundance in the highlands is Al2O3 > CaO > MgO > FeO. The average abundances of Al2O3 (25.66 wt.%) and CaO (15.12 wt.%) in the highlands are higher than (Al2O3: 14.71 wt.% and CaO: 11.45 wt.%) in maria, while the average abundances of FeO (6.16 wt.%) and MgO (6.46 wt.%) in the highlands are lower than in the maria (FeO: 15.09 wt.% and MgO: 9.88 wt.%). MgO exhibited the lowest average abundance among these four oxides in maria and the SPA basin, and the average FeO content was the lowest in the highlands. In the SPA basin, the average contents of each oxide were intermediate between the maria and highlands.
The average and STD of the four oxides’ abundances in the major lunar maria are shown in Table 5. Except for the lowest value of Ca, which is in Mare Spumans, the maximum and minimum values of the other oxides are in Mare Australe and Mare Tranquillitatis. Among the 21 major maria, the STD values of Al2O3 and FeO abundances are larger than those of CaO and MgO content, indicating large changes in the distribution of Al2O3 and FeO abundances, especially in Mare Orientale.
The compositional distributions of three interesting regions are shown in Figure 6. The oxide compositions are inconsistent within and around the Kepler impact crater. The high Al2O3 and CaO contents inside the Kepler crater are similar to those in the highlands, which may be due to the exposure of plagioclase material after the impact broke through the mare basalt. The higher FeO content in the interior of the Moscoviense Basin was formed by the filling of the basin with iron-and titanium-rich basaltic magma after its formation. In addition, the composition of the Helmet dome is relatively similar to the highland material, with higher Al2O3 and CaO and lower FeO and MgO.

5. Discussion

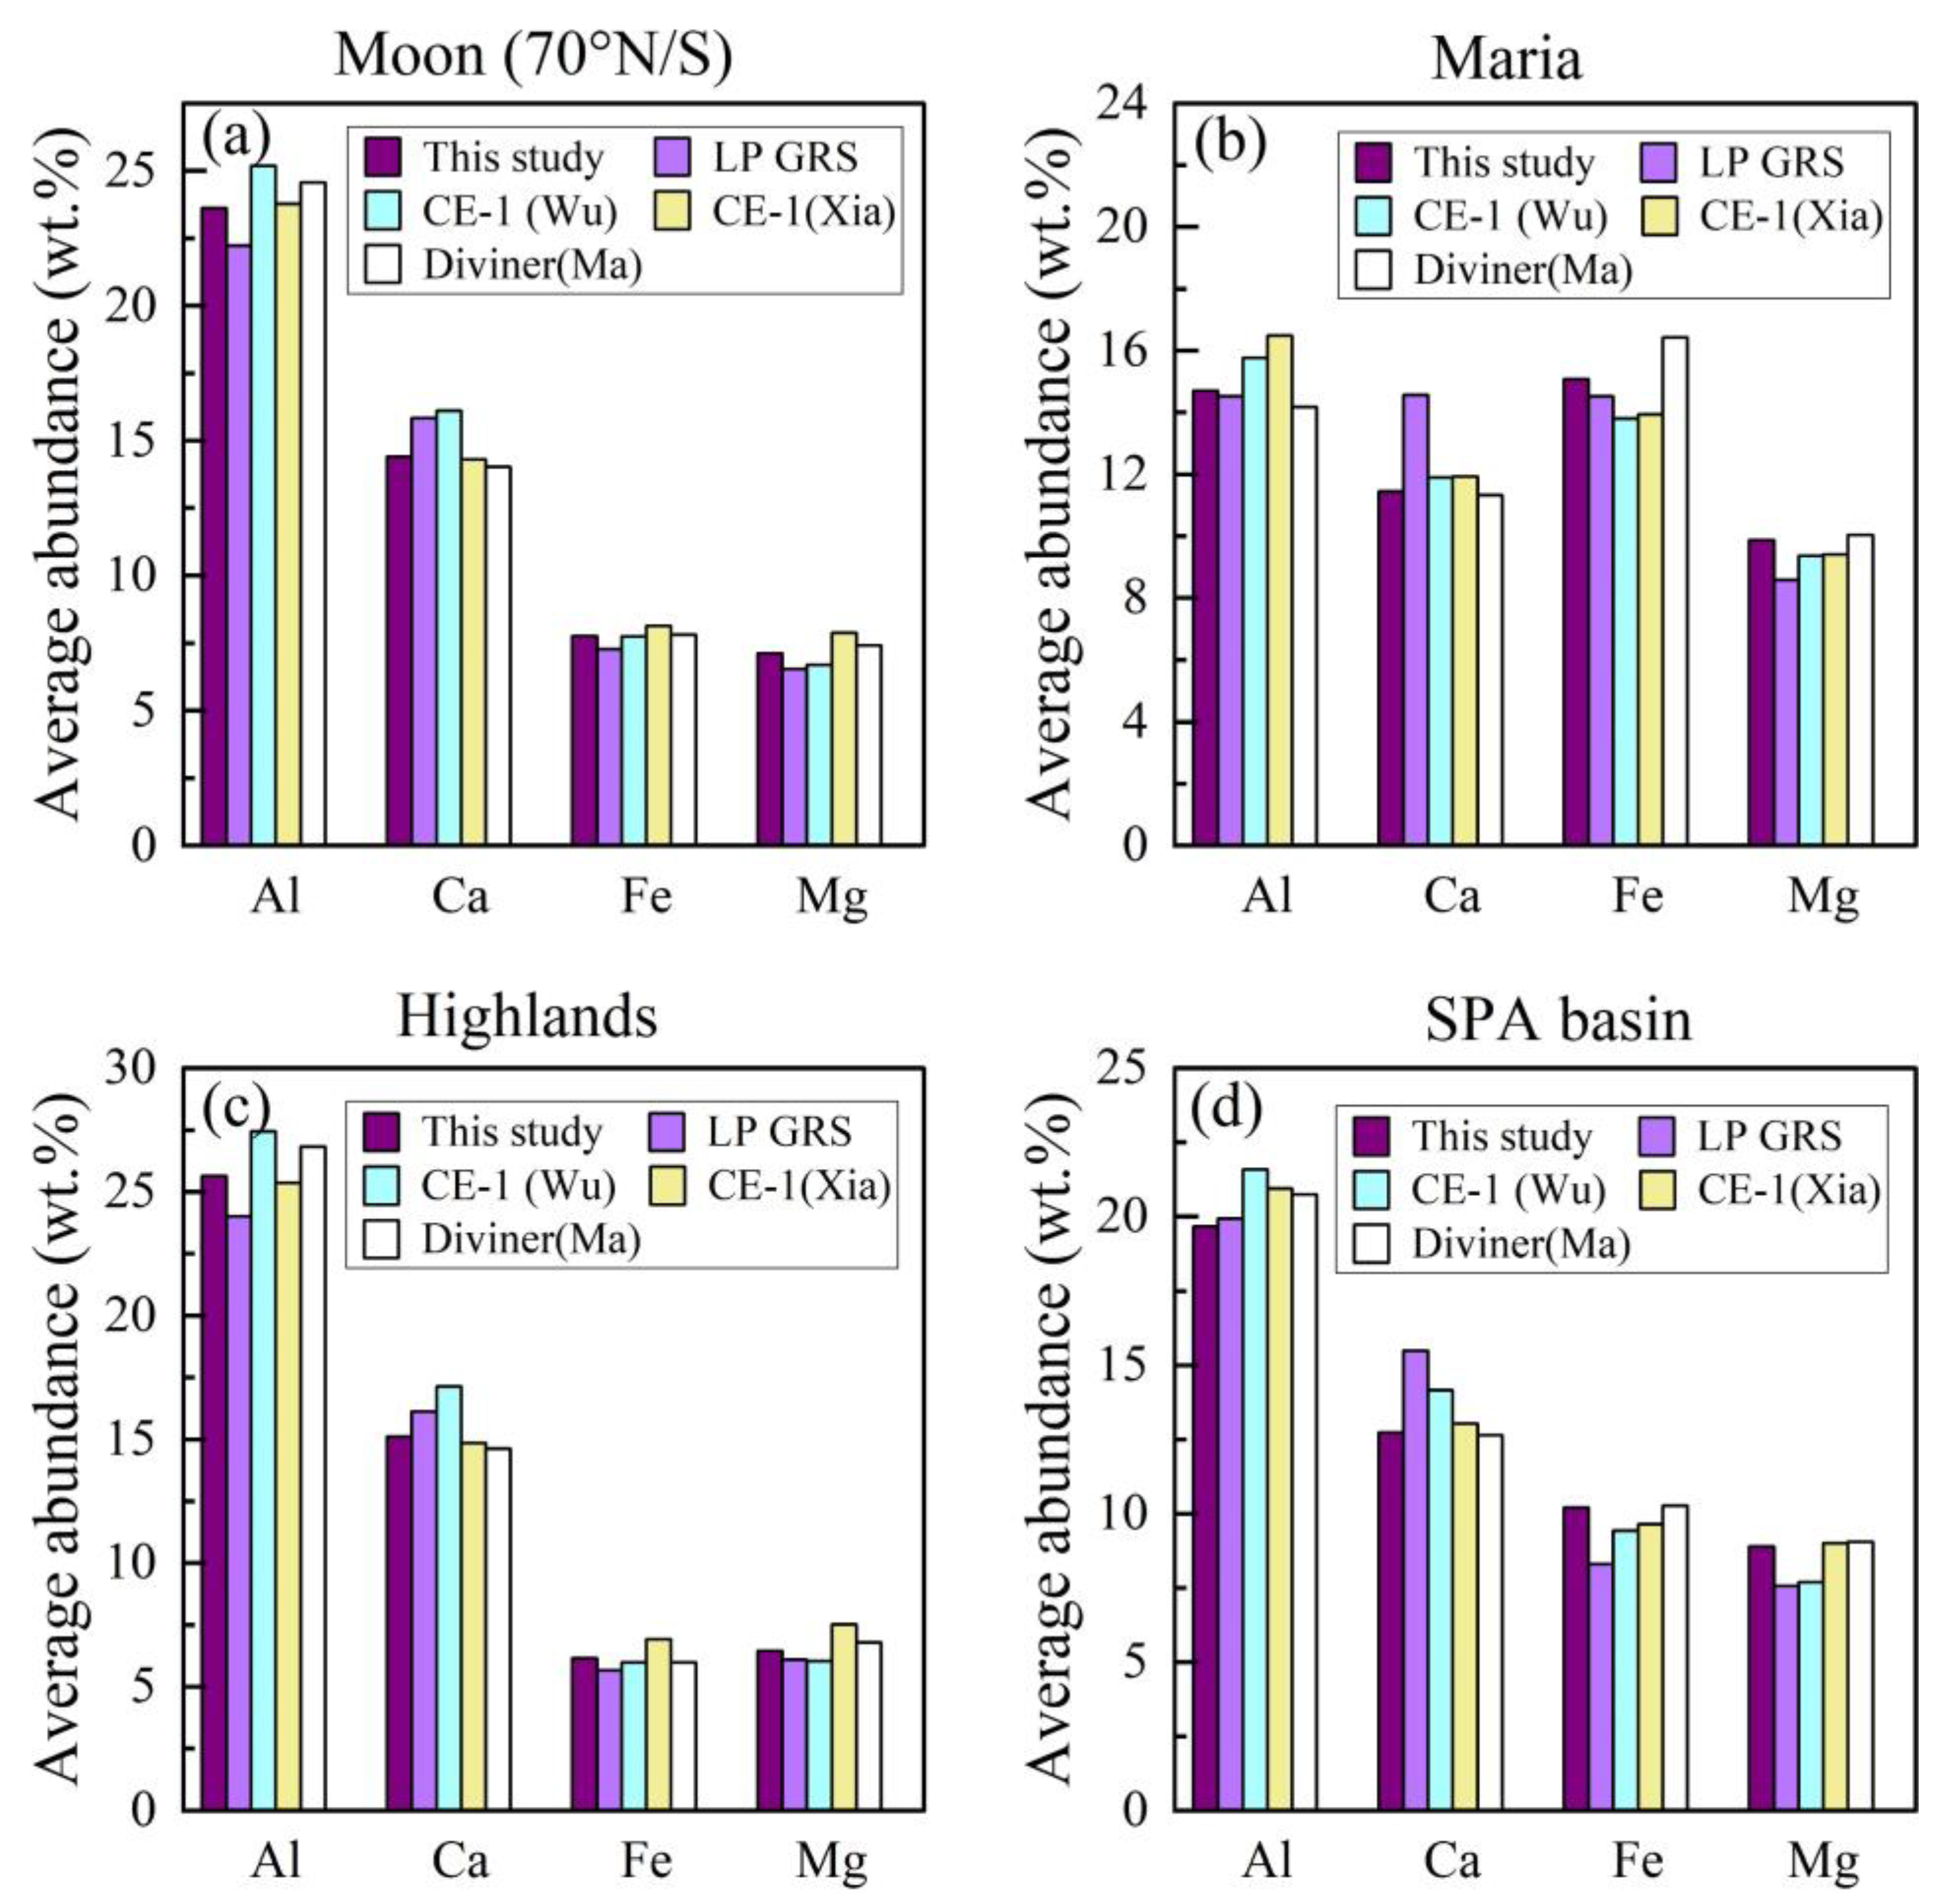
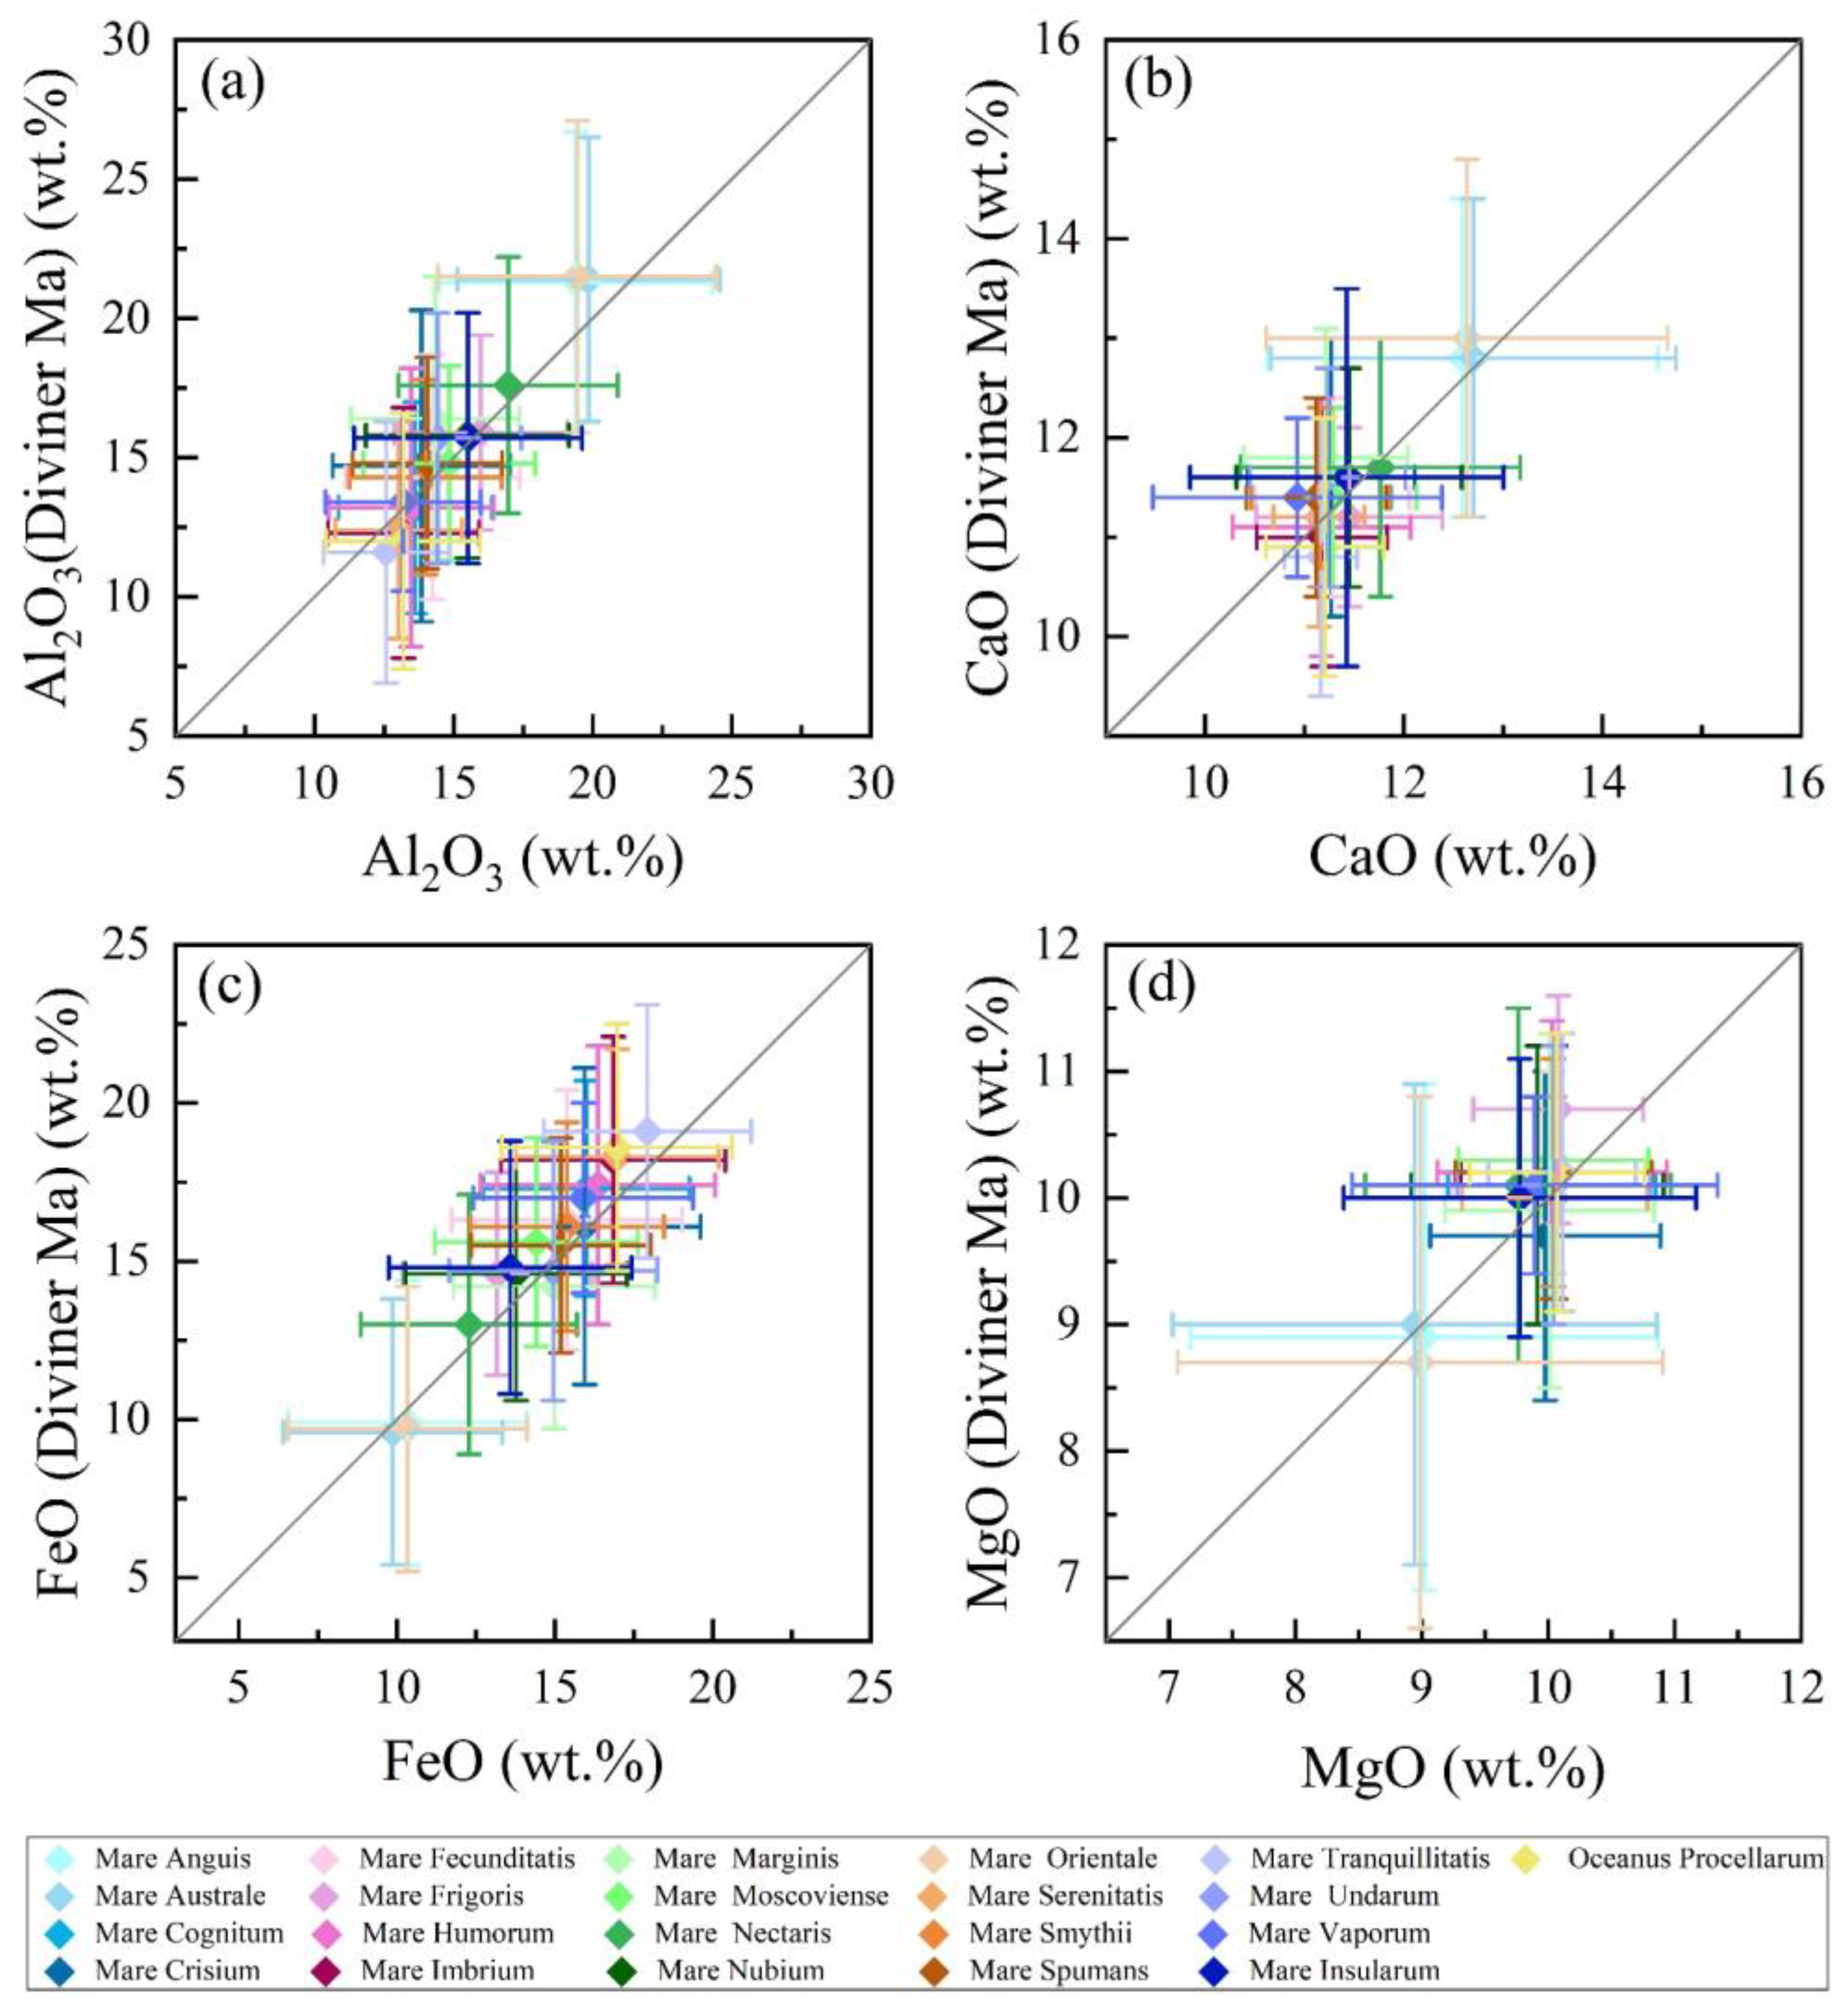
5.1. Comparison with Previous Studies

The four oxides’ distributions were estimated using LP GRS [7], CE-1 IIM (~200 m/pixel) [3,23], and LRO Diviner (32 ppd) data [28]. Based on the global maps of the four oxides, their average content in the Moon (70°N/S) and its different terrains can be obtained (Figure 7). Figure 8 illustrates the spatial distribution of maria, highlands, and SPA basin. Based on the boundaries of different terrains, bar charts (Figure 7) were produced for comparative analysis by extracting the oxide abundances for the different geological units (global, maria, highlands, and SPA basin).
The average abundances of the four oxides in this study fell between the ranges of the other inversion results (Figure 7). For the Moon (70°N/S), the smallest differences of average abundances in Al2O3, CaO, FeO, and MgO were 0.16, 0.10, 0.03, and 0.29, respectively. Apart from CaO derived from LP GRS in maria and the SPA basin and FeO obtained from Diviner in maria, the average abundance of inversion results in this study was similar to the other results, especially those from CE-1 [23] and Diviner [28], which showed the closest resemblance. Relatively significant differences in levels of CaO in maria and the SPA basin were observed between this study and LP GRS, which may be due to the different resolution. The LP GRS and the Diviner data exhibit different spatial resolution, implying a variance in their capacity to discern the smallest pixels. Data characterized by a lower resolution may not adequately capture the fine-scale characteristics observable within higher resolution datasets, which could lead to the neglect of subtle variations in the CaO distribution. Despite the differences in their absolute abundances, the trends in their relative abundances are consistent.
We compared the average and standard deviation of oxide abundance in 21 major maria with previous work conducted by Ma et al. [28], and the scatter plots with error bars for the four oxide abundances are shown in Figure 9. For the four oxides (Al2O3, CaO, FeO, and MgO), the average contents determined through this study and the LRO Diviner maps [28] in each maria demonstrated a relatively proximity to the 1:1 line, with R2 values of 0.95, 0.82, 0.95 and 0.86, respectively.

5.2. Implications of the Mg# Map

For the four major oxides estimated in this study, the Mg# (Mg# = mole percent MgO/(MgO + FeO)) was obtained with a resolution of 32 ppd. The global distribution of Mg# is shown in Figure 10, and exhibits an obvious trichotomy. The average Mg# values across the Moon (70°N/S) and in the three geological units (maria, highlands, and SPA basin) were 0.50, 0.41, 0.52, and 0.48, which are close to the multiband imager (MI) Mg# values [19] of 0.53, 0.40, 0.58, and 0.46, respectively. The average Mg# value in the highlands was higher than in the maria, which is consistent with the fact that FeO was higher than MgO in the maria regions, while MgO was higher than FeO in the highland regions [3]. In addition, the regions with low Mg# values in the new Mg# map correspond to the distribution of mare basalts on the Moon [63], which indicates that mare basalts exhibit low Mg#.
Mg# is an important indicator in lunar petrology for studying the compositional variation during magma crystallization [28,59], and a higher Mg# value represents an earlier magma ocean event with more primitive materials [2]. The different Mg# values observed in these three geological units are similar to those described by Otake et al. [2], indicating that they have undergone different magma evolution processes resulting in the lava flow filling with diverse composition and minerals [2,64]. Therefore, the maria have undergone a higher degree of evolution, primarily crystallized from the iron- and magnesium-rich magma, while the formation of the highlands marks the early stages of the lunar magma crystallization process, formed by the crystallization of relatively primitive magma.

5.3. Limitations and Prospects

The limited quantity of lunar samples poses an obstacle to compositional modelling. A total of 49 samples were utilized, including the Apollo and Luna missions, CE-3 in situ measurements, and the CE-5 mission, all of which were distributed in the low-latitude regions on the lunar near side, except for the CE-5 samples. Moreover, the small sample size and limited geographic coverage led to limitations in both quantity and spatial distribution, resulting in uncertainties in the prediction results. It is hoped that more samples can be obtained in the future, especially from the lunar far side and high-latitude regions, which is expected to improve the accuracy of the inversion results.
The study of minerals through spectral features, particularly the CF, has a long history in planetary science. Indeed, the CF has demonstrated capability in identifying silicate minerals and estimating lunar surface composition [29,30,52]. However, both space weathering and viewing geometry influence the CF values. Recently, Greenhagen et al. [31] performed terrain-dependent photometric correction to map the latest -normalized-to-equatorial-noon (NEN) CF map. Meanwhile, Lucey et al. [32] corrected the effects of space weathering to generate a new surface optical maturity parameter (OMAT) CF map. With the advancement of remote sensing technology, exploring new methods to mitigate the effects of space weathering and viewing geometry can help to reduce the uncertainty of inversion results.
In addition, machine learning and deep learning algorithms can be further applied to lunar oxide inversion. In this paper, the PSO-XGBoost algorithm was used to predict the abundance of oxides with satisfactory results, although there is still space for further improvement.

6. Conclusions

Based on previous lunar samples, this study incorporated samples from the CE-5 mission to produce the new maps of oxide abundance and Mg# on the lunar surface. Except for FeO, the oxide (Al2O3, CaO, and MgO) abundances exhibited complex nonlinear relationships with CF values, making the PSO-XGBoost model a better choice for inversion. The higher R2 values and lower RMSE in this study indicate the satisfactory performance and generalization ability of the models. The distinctive distribution of oxides and Mg# across the three geological units indicate differences in the source of the magma, resulting in mare basalts with different composition. Incorporating data from the Chang’e-5 mission has supplemented and refined our understanding of the Moon’s late-stage magmatic activities, enabling updating of the lunar oxide distribution maps.

Author Contributions

Conceptualization, S.W. and J.C.; methodology, S.W.; software, S.W.; validation, S.W., J.C. and C.X.; formal analysis, S.W.; resources, C.Z. and Y.P.; data curation, S.W., J.C. and C.X.; writing—original draft preparation, S.W.; writing—review and editing, S.W., J.C. and C.X.; visualization, S.W., C.Z. and Y.P.; supervision, S.W. and J.C.; funding acquisition, J.C. All authors have read and agreed to the published version of the manuscript.

Funding

This research was funded by the Geological Survey Project of China Geological Survey, grant number DD20221645.

Data Availability Statement

The corrected CF map was provided by Lucey et al. and is available at https://doi.org/10.5281/zenodo.4558194 (accessed on 23 February 2021).

Conflicts of Interest

The authors declare no conflicts of interest.

References

  1. Lucey, P.G.; Taylor, G.J.; Malaret, E. Abundance and Distribution of Iron on the Moon. Science 1995, 268, 1150–1153. [Google Scholar] [CrossRef] [PubMed]
  2. Otake, H.; Ohtake, M.; Hirata, N. Lunar Iron and Titanium Abundance Algorithms Based on SELENE (KAGUYA) Multiband Imager Data. In Proceedings of the 43rd Annual Lunar and Planetary Science Conference, Woodlands, TX, USA, 19–23 March 2012. [Google Scholar]
  3. Wu, Y. Major Elements and Mg# of the Moon: Results from Chang’E-1 Interference Imaging Spectrometer (IIM) Data. Geochim. Cosmochim. Acta 2012, 93, 214–234. [Google Scholar] [CrossRef]
  4. Lawrence, D.J.; Feldman, W.C.; Barraclough, B.L.; Binder, A.B.; Elphic, R.C.; Maurice, S.; Miller, M.C.; Prettyman, T.H. Thorium Abundances on the Lunar Surface. J. Geophys. Res. Planets 2000, 105, 20307–20331. [Google Scholar] [CrossRef]
  5. Lawrence, D.J.; Feldman, W.C.; Barraclough, B.L.; Binder, A.B.; Elphic, R.C.; Maurice, S.; Miller, M.C.; Prettyman, T.H. High Resolution Measurements of Absolute Thorium Abundances on the Lunar Surface. Geophys. Res. Lett. 1999, 26, 2681–2684. [Google Scholar] [CrossRef]
  6. Lawrence, D.J.; Feldman, W.C.; Barraclough, B.L.; Binder, A.B.; Elphic, R.C.; Maurice, S.; Thomsen, D.R. Global Elemental Maps of the Moon: The Lunar Prospector Gamma-Ray Spectrometer. Science 1998, 281, 1484–1489. [Google Scholar] [CrossRef] [PubMed]
  7. Prettyman, T.H.; Hagerty, J.J.; Elphic, R.C.; Feldman, W.C.; Lawrence, D.J.; McKinney, G.W.; Vaniman, D.T. Elemental Composition of the Lunar Surface: Analysis of Gamma Ray Spectroscopy Data from Lunar Prospector. J. Geophys. Res. Planets 2006, 111, E12007. [Google Scholar] [CrossRef]
  8. Elphic, R.C.; Lawrence, D.J.; Feldman, W.C.; Barraclough, B.L.; Gasnault, O.M.; Maurice, S.; Lucey, P.G.; Blewett, D.T.; Binder, A.B. Lunar Prospector Neutron Spectrometer Constraints on TiO2. J. Geophys. Res. Planets 2002, 107, 8-1–8-9. [Google Scholar] [CrossRef]
  9. Elphic, R.C.; Lawrence, D.J.; Feldman, W.C.; Barraclough, B.L.; Maurice, S.; Binder, A.B.; Lucey, P.G. Lunar Rare Earth Element Distribution and Ramifications for FeO and TiO2: Lunar Prospector Neutron Spectrometer Observations. J. Geophys. Res. Planets 2000, 105, 20333–20345. [Google Scholar] [CrossRef]
  10. Elphic, R.C.; Lawrence, D.J.; Feldman, W.C.; Barraclough, B.L.; Maurice, S.; Binder, A.B.; Lucey, P.G. Lunar Fe and Ti Abundances: Comparison of Lunar Prospector and Clementine Data. Science 1998, 281, 1493–1496. [Google Scholar] [CrossRef]
  11. Feldman, W.C.; Lawrence, D.J.; Elphic, R.C.; Vaniman, D.T.; Thomsen, D.R.; Barraclough, B.L.; Maurice, S.; Binder, A.B. Chemical Information Content of Lunar Thermal and Epithermal Neutrons. J. Geophys. Res. Planets 2000, 105, 20347–20363. [Google Scholar] [CrossRef]
  12. Feldman, W.C.; Barraclough, B.L.; Maurice, S.; Elphic, R.C.; Lawrence, D.J.; Thomsen, D.R.; Binder, A.B. Major Compositional Units of the Moon: Lunar Prospector Thermal and Fast Neutrons. Science 1998, 281, 1489–1493. [Google Scholar] [CrossRef] [PubMed]
  13. Gillis, J.J.; Jolliff, B.L.; Korotev, R.L. Lunar Surface Geochemistry: Global Concentrations of Th, K, and FeO as Derived from Lunar Prospector and Clementine Data. Geochim. Cosmochim. Acta 2004, 68, 3791–3805. [Google Scholar] [CrossRef]
  14. Gillis, J.J.; Jolliff, B.L.; Elphic, R.C. A Revised Algorithm for Calculating TiO2 from Clementine UVVIS Data: A Synthesis of Rock, Soil, and Remotely Sensed TiO2 Concentrations. J. Geophys. Res. Planets 2003, 108, 5009. [Google Scholar] [CrossRef]
  15. Lucey, P.G.; Blewett, D.T.; Jolliff, B.L. Lunar Iron and Titanium Abundance Algorithms Based on Final Processing of Clementine Ultraviolet-Visible Images. J. Geophys. Res. 2000, 105, 20297–20305. [Google Scholar] [CrossRef]
  16. Sato, H.; Robinson, M.S.; Lawrence, S.J.; Denevi, B.W.; Hapke, B.; Jolliff, B.L.; Hiesinger, H. Lunar Mare TiO2 Abundances Estimated from UV/Vis Reflectance. Icarus 2017, 296, 216–238. [Google Scholar] [CrossRef]
  17. Lemelin, M.; Lucey, P.G.; Song, E.; Taylor, G.J. Lunar Central Peak Mineralogy and Iron Content Using the Kaguya Multiband Imager: Reassessment of the Compositional Structure of the Lunar Crust: LUNAR CENTRAL PEAK MINERALOGY AND IRON. J. Geophys. Res. Planets 2015, 120, 869–887. [Google Scholar] [CrossRef]
  18. Qiu, D.; Li, F.; Yan, J.; Gao, W.; Chong, Z. Machine Learning for Inversing FeO and TiO2 Content on the Moon: Method and Comparison. Icarus 2022, 373, 114778. [Google Scholar] [CrossRef]
  19. Yang, C.; Zhang, X.; Bruzzone, L.; Liu, B.; Liu, D.; Ren, X.; Benediktsson, J.A.; Liang, Y.; Yang, B.; Yin, M.; et al. Comprehensive Mapping of Lunar Surface Chemistry by Adding Chang’e-5 Samples with Deep Learning. Nat. Commun. 2023, 14, 7554. [Google Scholar] [CrossRef] [PubMed]
  20. Zhang, L.; Zhang, X.; Yang, M.; Xiao, X.; Qiu, D.; Yan, J.; Xiao, L.; Huang, J. New Maps of Major Oxides and Mg # of the Lunar Surface from Additional Geochemical Data of Chang’E-5 Samples and KAGUYA Multiband Imager Data. Icarus 2023, 397, 115505. [Google Scholar] [CrossRef]
  21. Sun, L.; Ling, Z.; Zhang, J.; Li, B.; Chen, J.; Wu, Z.; Liu, J. Lunar Iron and Optical Maturity Mapping: Results from Partial Least Squares Modeling of Chang’E-1 IIM Data. Icarus 2016, 280, 183–198. [Google Scholar] [CrossRef]
  22. Wu, S.; Chen, J.; Li, L.; Zhang, C.; Huang, R.; Zhang, Q. Quantitative Inversion of Lunar Surface Chemistry Based on Hyperspectral Feature Bands and Extremely Randomized Trees Algorithm. Remote Sens. 2022, 14, 5248. [Google Scholar] [CrossRef]
  23. Xia, W.; Wang, X.; Zhao, S.; Jin, H.; Chen, X.; Yang, M.; Wu, X.; Hu, C.; Zhang, Y.; Shi, Y.; et al. New Maps of Lunar Surface Chemistry. Icarus 2019, 321, 200–215. [Google Scholar] [CrossRef]
  24. Yan, B.; Xiong, S.Q.; Wu, Y.; Wang, Z.; Dong, L.; Gan, F.; Yang, S.; Wang, R. Mapping Lunar Global Chemical Composition from Chang’E-1 IIM Data. Planet. Space Sci. 2012, 67, 119–129. [Google Scholar] [CrossRef]
  25. Burns, R.G. Mineralogical Applications of Crystal Field Theory, 2nd ed.; Cambridge University Press: Cambridge, UK, 1993; ISBN 978-0-521-43077-7. [Google Scholar]
  26. Jaumann, R. Spectral-Chemical Analysis of Lunar Surface Materials. J. Geophys. Res. Planets 1991, 96, 22793–22807. [Google Scholar] [CrossRef]
  27. Pieters, C. Statistical Analysis of the Links among Lunar Mare Soil Mineralogy, Chemistry, and Reflectance Spectra. Icarus 2002, 155, 285–298. [Google Scholar] [CrossRef]
  28. Ma, M.; Li, B.; Chen, S.; Lu, T.; Lu, P.; Lu, Y.; Jin, Q. Global Estimates of Lunar Surface Chemistry Derived from LRO Diviner Data. Icarus 2022, 371, 114697. [Google Scholar] [CrossRef]
  29. Allen, C.C.; Greenhagen, B.T.; Donaldson Hanna, K.L.; Paige, D.A. Analysis of Lunar Pyroclastic Deposit FeO Abundances by LRO Diviner. J. Geophys. Res. Planets 2012, 117, E00H28. [Google Scholar] [CrossRef]
  30. Donaldson Hanna, K.L.; Greenhagen, B.T.; Patterson, W.R.; Pieters, C.M.; Mustard, J.F.; Bowles, N.E.; Paige, D.A.; Glotch, T.D.; Thompson, C. Effects of Varying Environmental Conditions on Emissivity Spectra of Bulk Lunar Soils: Application to Diviner Thermal Infrared Observations of the Moon. Icarus 2017, 283, 326–342. [Google Scholar] [CrossRef]
  31. Greenhagen, B.T.; Lucey, P.G.; Wyatt, M.B.; Glotch, T.D.; Allen, C.C.; Arnold, J.A.; Bandfield, J.L.; Bowles, N.E.; Hanna, K.L.D.; Hayne, P.O.; et al. Global Silicate Mineralogy of the Moon from the Diviner Lunar Radiometer. Science 2010, 329, 1507–1509. [Google Scholar] [CrossRef]
  32. Lucey, P.G.; Greenhagen, B.; Donaldson Hanna, K.; Bowles, N.; Flom, A.; Paige, D.A. Christiansen Feature Map From the Lunar Reconnaissance Orbiter Diviner Lunar Radiometer Experiment: Improved Corrections and Derived Mineralogy. J. Geophys. Res. Planets 2021, 126, e2020JE006777. [Google Scholar] [CrossRef]
  33. Lucey, P.G.; Greenhagen, B.T.; Song, E.; Arnold, J.A.; Lemelin, M.; Hanna, K.D.; Bowles, N.E.; Glotch, T.D.; Paige, D.A. Space Weathering Effects in Diviner Lunar Radiometer Multispectral Infrared Measurements of the Lunar Christiansen Feature: Characteristics and Mitigation. Icarus 2017, 283, 343–351. [Google Scholar] [CrossRef]
  34. Bian, C.; Zhang, K.; Wu, Y.; Wu, S.; Lu, Y.; Shi, H.; Li, H.; Zhao, D.; Duan, Y.; Zhao, L.; et al. Mapping the Spatial Distributions of Oxide Abundances and Mg# on the Lunar Surface Using Multi-Source Data and a New Ensemble Learning Algorithm. Planet. Space Sci. 2024, 245, 105894. [Google Scholar] [CrossRef]
  35. Conel, J.E. Infrared Emissivities of Silicates: Experimental Results and a Cloudy Atmosphere Model of Spectral Emission from Condensed Particulate Mediums. J. Geophys. Res. 1969, 74, 1614–1634. [Google Scholar] [CrossRef]
  36. Kusuma, K.N.; Sebastian, N.; Murty, S.V.S. Geochemical and Mineralogical Analysis of Gruithuisen Region on Moon Using M3 and DIVINER Images. Planet. Space Sci. 2012, 67, 46–56. [Google Scholar] [CrossRef]
  37. Logan, L.M.; Hunt, G.R.; Salisbury, J.W.; Balsamo, S.R. Compositional Implications of Christiansen Frequency Maximums for Infrared Remote Sensing Applications. J. Geophys. Res. 1973, 78, 4983–5003. [Google Scholar] [CrossRef]
  38. Salisbury, J.W.; Hunt, G.R.; Logan, L.M. Infrared Spectra of Apollo 16 Fines. Lunar Planet. Sci. Conf. Proc. 1973, 4, 3191. [Google Scholar]
  39. Nyquist, L.E.; Bogard, D.D.; Chi-Yu, S. Radiometric Chronology of the Moon and Mars. In The Century of Space Science; Bleeker, J.A.M., Geiss, J., Huber, M.C.E., Eds.; Springer: Dordrecht, The Netherlands, 2001; pp. 1325–1376. ISBN 978-94-010-0320-9. [Google Scholar]
  40. Taylor, L.A.; Shervais, J.W.; Hunter, R.H.; Shih, C.-Y.; Bansal, B.M.; Wooden, J.; Nyquist, L.E.; Laul, L.C. Pre-4.2 AE Mare-Basalt Volcanism in the Lunar Highlands. Earth Planet. Sci. Lett. 1983, 66, 33–47. [Google Scholar] [CrossRef]
  41. Che, X.; Nemchin, A.; Liu, D.; Long, T.; Wang, C.; Norman, M.D.; Joy, K.H.; Tartese, R.; Head, J.; Jolliff, B.; et al. Age and Composition of Young Basalts on the Moon, Measured from Samples Returned by Chang’e-5. Science 2021, 374, 887–890. [Google Scholar] [CrossRef] [PubMed]
  42. Li, Q.-L.; Zhou, Q.; Liu, Y.; Xiao, Z.; Lin, Y.; Li, J.-H.; Ma, H.-X.; Tang, G.-Q.; Guo, S.; Tang, X.; et al. Two-Billion-Year-Old Volcanism on the Moon from Chang’e-5 Basalts. Nature 2021, 600, 54–58. [Google Scholar] [CrossRef]
  43. Qian, Y.; She, Z.; He, Q.; Xiao, L.; Wang, Z.; Head, J.W.; Sun, L.; Wang, Y.; Wu, B.; Wu, X.; et al. Mineralogy and Chronology of the Young Mare Volcanism in the Procellarum-KREEP-Terrane. Nat. Astron. 2023, 7, 287–297. [Google Scholar] [CrossRef]
  44. Chen, T.; Guestrin, C. XGBoost: A Scalable Tree Boosting System. In Proceedings of the 22nd ACM SIGKDD International Conference on Knowledge Discovery and Data Mining, San Francisco, CA, USA, 13–17 August 2016; Association for Computing Machinery: New York, NY, USA, 2016; pp. 785–794. [Google Scholar]
  45. Khan, R.M.; Salehi, B.; Niroumand-Jadidi, M.; Mahdianpari, M. Mapping Water Clarity in Small Oligotrophic Lakes Using Sentinel-2 Imagery and Machine Learning Methods: A Case Study of Canandaigua Lake in Finger Lakes, New York. IEEE J. Sel. Top. Appl. Earth Obs. Remote Sens. 2024, 17, 4674–4688. [Google Scholar] [CrossRef]
  46. Zhao, X.; Xia, N.; Xu, Y.; Huang, X.; Li, M. Mapping Population Distribution Based on XGBoost Using Multisource Data. IEEE J. Sel. Top. Appl. Earth Obs. Remote Sens. 2021, 14, 11567–11580. [Google Scholar] [CrossRef]
  47. Zhang, Q.; Chen, J.; Xu, H.; Jia, Y.; Chen, X.; Jia, Z.; Liu, H. Three-Dimensional Mineral Prospectivity Mapping by XGBoost Modeling: A Case Study of the Lannigou Gold Deposit, China. Nat. Resour. Res. 2022, 31, 1135–1156. [Google Scholar] [CrossRef]
  48. Ashourloo, D.; Aghighi, H.; Matkan, A.A.; Mobasheri, M.R.; Rad, A.M. An Investigation Into Machine Learning Regression Techniques for the Leaf Rust Disease Detection Using Hyperspectral Measurement. IEEE J. Sel. Top. Appl. Earth Obs. Remote Sens. 2016, 9, 4344–4351. [Google Scholar] [CrossRef]
  49. Vohland, M.; Harbich, M.; Ludwig, M.; Emmerling, C.; Thiele-Bruhn, S. Quantification of Soil Variables in a Heterogeneous Soil Region With VIS–NIR–SWIR Data Using Different Statistical Sampling and Modeling Strategies. IEEE J. Sel. Top. Appl. Earth Obs. Remote Sens. 2016, 9, 4011–4021. [Google Scholar] [CrossRef]
  50. Zhang, Y.; Liang, S.; Sun, G. Forest Biomass Mapping of Northeastern China Using GLAS and MODIS Data. IEEE J. Sel. Top. Appl. Earth Obs. Remote Sens. 2014, 7, 140–152. [Google Scholar] [CrossRef]
  51. Lyon, R.J.P. Analysis of Rocks by Spectral Infrared Emission (8 to 25 Microns). Econ. Geol. 1965, 60, 715–736. [Google Scholar] [CrossRef]
  52. Paige, D.A.; Foote, M.C.; Greenhagen, B.T.; Schofield, J.T.; Calcutt, S.; Vasavada, A.R.; Preston, D.J.; Taylor, F.W.; Allen, C.C.; Snook, K.J.; et al. The Lunar Reconnaissance Orbiter Diviner Lunar Radiometer Experiment. Space Sci. Rev. 2010, 150, 125–160. [Google Scholar] [CrossRef]
  53. Williams, J.-P.; Paige, D.A.; Greenhagen, B.T.; Sefton-Nash, E. The Global Surface Temperatures of the Moon as Measured by the Diviner Lunar Radiometer Experiment. Icarus 2017, 283, 300–325. [Google Scholar] [CrossRef]
  54. Liu, B.; Rostamian, A.; Kheirollahi, M.; Mirseyed, S.F.; Mohammadian, E.; Golsanami, N.; Liu, K.; Ostadhassan, M. NMR Log Response Prediction from Conventional Petrophysical Logs with XGBoost-PSO Framework. Geoenergy Sci. Eng. 2023, 224, 211561. [Google Scholar] [CrossRef]
  55. Chen, M.; Liu, Q.-Y.; Chen, S.; Liu, Y.; Zhang, C.; Liu, R. XGBoost-Based Algorithm Interpretation and Application on Post-Fault Transient Stability Status Prediction of Power System. IEEE Access 2019, 7, 13149–13158. [Google Scholar] [CrossRef]
  56. Osman, A.A.A.; Ahmed, A.N.; Chow, M.F.; Huang, Y.F.; El-Shafie, A. Extreme Gradient Boosting (Xgboost) Model to Predict the Groundwater Levels in Selangor Malaysia. Ain Shams Eng. J. 2021, 12, 1545–1556. [Google Scholar] [CrossRef]
  57. Kennedy, J.; Eberhart, R. Particle Swarm Optimization. In Proceedings of the ICNN’95—International Conference on Neural Networks, Perth, WA, Australia, 27 November–1 December 1995; Volume 4, pp. 1942–1948. [Google Scholar]
  58. Zhu, H.; Wang, Y.; Wang, K.; Chen, Y. Particle Swarm Optimization (PSO) for the Constrained Portfolio Optimization Problem. Expert Syst. Appl. 2011, 38, 10161–10169. [Google Scholar] [CrossRef]
  59. Wang, X.; Zhang, J.; Ren, H. Lunar Surface Chemistry Observed by the KAGUYA Multiband Imager. Planet. Space Sci. 2021, 209, 105360. [Google Scholar] [CrossRef]
  60. Dhanarajan, G.; Mandal, M.; Sen, R. A Combined Artificial Neural Network Modeling–Particle Swarm Optimization Strategy for Improved Production of Marine Bacterial Lipopeptide from Food Waste. Biochem. Eng. J. 2014, 84, 59–65. [Google Scholar] [CrossRef]
  61. de Jong, S. SIMPLS: An Alternative Approach to Partial Least Squares Regression. Chemom. Intell. Lab. Syst. 1993, 18, 251–263. [Google Scholar] [CrossRef]
  62. Li, L. Partial Least Squares Modeling to Quantify Lunar Soil Composition with Hyperspectral Reflectance Measurements. J. Geophys. Res. 2006, 111, E04002. [Google Scholar] [CrossRef]
  63. Morota, T.; Haruyama, J.; Ohtake, M.; Matsunaga, T.; Honda, C.; Yokota, Y.; Kimura, J.; Ogawa, Y.; Hirata, N.; Demura, H.; et al. Timing and Characteristics of the Latest Mare Eruption on the Moon. Earth Planet. Sci. Lett. 2011, 302, 255–266. [Google Scholar] [CrossRef]
  64. Green, D.H. Experimental Testing of “Equilibrium” Partial Melting of Peridotite under Water-Saturated, High-Pressure Conditions. Can. Mineral. 1976, 14, 255–268. [Google Scholar]
Figure 1. The corrected CF map derived by Lucey et al. [32].
Remotesensing 16 01812 g001
Figure 2. Linear or nonlinear relationships between (a) Al2O3, (b) CaO, (c) FeO, and (d) MgO and the CF values for 49 lunar sampling points.
Remotesensing 16 01812 g002
Figure 3. Scatter plots of the measured and predicted values for (a) Al2O3, (b) CaO, (c) FeO, and (d) MgO from PSO-XGBoost models. Error bars represent 95% confidence intervals around the oxides’ predicted values.
Remotesensing 16 01812 g003
Figure 4. Scatter plots of the measured and predicted values for (a) Al2O3, (b) CaO, (c) FeO, and (d) MgO from PLSR models.
Remotesensing 16 01812 g004
Figure 5. Global distribution maps of (a) Al2O3, (b) CaO, (c) FeO and (d) MgO abundances.
Remotesensing 16 01812 g005
Figure 6. The LRO WAC and compositional distributions of three interesting regions including the Kepler crater (8.1°N, 38.0°W), Mare Moscoviense (148°E, 27°N), and the Helmet dome (16.6°S, 31.4°W).
Remotesensing 16 01812 g006
Figure 7. Average abundances of four oxides in the (a) Moon (70°N/S), (b) maria, (c) highlands, and (d) SPA basin, according to five sets of results.
Remotesensing 16 01812 g007
Figure 8. Sketch map showing the locations of the three geological units (maria are marked in blue, highlands are marked in orange, and the SPA basin is identified in green).
Remotesensing 16 01812 g008
Figure 9. Scatter plot with error bars for (a) Al2O3 (b) CaO (c) FeO and (d) MgO abundances from Ma et al. [28] and this study, for 21 major maria. Error bar indicates the standard deviation.
Remotesensing 16 01812 g009
Figure 10. Mg# map across the Moon (70°N/S).
Remotesensing 16 01812 g010
Table 1. Four oxide (Al2O3, CaO, FeO, and MgO) contents and CF positions of 49 lunar sampling sites. Abundances are shown in wt.%, and CF values are shown in μm.
SiteAl2O3CaOFeOMgOCF
A1113.4512.0115.807.818.286
A1213.8610.5815.409.668.255
A14-LM17.6910.3210.539.528.214
A14-Cone17.5011.0010.309.608.209
A15-LM14.4510.2514.9510.658.257
A15-S113.1510.5815.7910.818.253
A15-S217.5211.7511.5210.548.290
A15-S413.2210.4615.9611.198.272
A15-S616.4711.2912.1410.518.247
A15-S715.9210.1212.3711.178.247
A15-S814.4610.3814.9810.358.257
A15-S912.5410.3116.6110.988.250
A15-S9a10.319.3920.1911.368.250
A16-LM27.6015.425.445.708.165
A16-S126.6015.605.406.108.177
A16-S227.0015.605.506.008.177
A16-S427.6015.704.605.408.176
A16-S526.2015.105.906.208.170
A16-S627.1016.406.006.908.170
A16-S826.5015.405.406.208.203
A16-S926.3015.505.706.308.203
A16-S1128.6016.704.204.508.180
A16-S1327.7015.804.665.328.145
A17-LM12.1011.1016.609.808.257
A17-S110.9010.8017.809.608.279
A17-S220.7012.808.709.908.201
A17-S320.4012.908.7010.208.220
A17-S510.9010.8017.709.608.260
A17-S618.3012.2010.7010.808.224
A17-S717.3011.9011.6010.108.228
A17-S816.6011.8012.3010.208.223
A17-S913.9011.3015.4010.008.286
A17-LRV112.6011.2016.309.408.281
A17-LRV216.1011.9013.4010.308.223
A17-LRV314.4011.3014.8010.408.223
A17-LRV4/S2a21.4012.808.509.608.216
A17-LRV519.9012.809.808.908.220
A17-LRV619.4012.5010.309.908.241
A17-LRV712.8010.7016.1010.308.259
A17-LRV813.5011.3015.709.908.266
A17-LRV914.3011.3014.609.808.276
A17-LRV1017.5012.1011.2010.508.224
A17-LRV1116.3011.9012.7010.008.267
A17-LRV1211.2010.8017.409.408.251
Luna1615.2412.5016.708.808.295
Luna2022.9014.507.509.208.203
Luna2411.1011.1020.5010.208.296
CE-311.9010.6021.609.608.301
CE-510.8010.9022.206.488.280
Table 2. Optimal values of parameters for four major oxides based on the PSO-XGBoost algorithm.
ParametersAl2O3CaOFeOMgO
n_estimators582518530584
learning_rate0.10.10.10.1
Table 3. Optimal values of parameters for four major oxides based on the PLSR algorithm.
ParametersAl2O3CaOFeOMgO
intercept1067.8859355.0624−831.7237−247.5031
coefficient−127.5548−41.6391102.463431.1801
Table 4. Average (AVG) and standard deviation (STD) values for the abundance of four oxides and Mg# in maria, highlands, and SPA basin (wt.%).
GlobalMariaHighlandsSPA
AVGSTDAVGSTDAVGSTDAVGSTD
Al2O323.635.6414.713.9825.663.8619.805.18
CaO14.422.1011.451.1815.121.6612.742.20
FeO7.784.4715.094.316.162.6410.013.98
MgO7.142.159.881.106.461.808.812.04
Mg#0.505.650.416.770.522.900.485.40
Table 5. The AVG and STD of oxide abundances in major lunar maria (wt.%).
MareAl2O3CaOFeOMgO
AVGSTDAVGSTDAVGSTDAVGSTD
Mare Anguis19.394.9112.591.9710.343.779.021.85
Mare Australe19.854.7212.702.049.873.478.941.91
Mare Cognitum13.622.7711.160.7116.003.2610.030.82
Mare Crisium13.843.1911.270.8415.943.679.980.91
Mare Fecunditatis14.243.1311.280.7815.383.6510.020.78
Mare Frigoris15.973.1211.450.9413.182.9910.080.67
Mare Humorum13.472.9711.170.8916.363.7010.030.91
Mare Imbrium13.192.7111.180.6616.853.5510.060.75
Mare Marginis14.343.0311.210.8314.983.1910.010.83
Mare Moscoviense14.843.0811.290.8414.413.2110.040.75
Mare Nectaris16.963.9511.761.4112.283.429.761.21
Mare Nubium15.493.6611.451.1313.773.519.911.00
Mare Orientale19.445.0112.642.0210.343.798.991.92
Mare Serenitatis13.022.2911.150.4616.973.2010.050.73
Mare Smythii13.992.7311.160.6915.393.0610.040.78
Mare Spumans14.052.6911.120.7015.192.8510.040.78
Mare Tranquillitatis12.572.2611.160.3717.933.2810.110.58
Mare Undarum14.423.0111.230.7814.953.2910.040.76
Mare Vaporum13.182.7910.931.4615.903.489.891.45
Mare Insularum15.514.1011.431.5813.593.849.771.39
Oceanus Procellarum13.192.7711.210.6016.973.6510.070.69
Disclaimer/Publisher’s Note: The statements, opinions and data contained in all publications are solely those of the individual author(s) and contributor(s) and not of MDPI and/or the editor(s). MDPI and/or the editor(s) disclaim responsibility for any injury to people or property resulting from any ideas, methods, instructions or products referred to in the content.

