Abstract
A systematic analysis of the spatiotemporal evolution patterns and factors influencing ecological land (EL) can support the optimization of EL protection policies and ensure the stability of regional ecosystems. Based on remote sensing data, using the gravity center shift model, the landscape pattern index, and the equivalent factor method, the characteristics of EL evolution in the Beijing–Tianjin–Hebei (BTH) region from 1980 to 2020 were analyzed. A fixed-effects model was used to quantitatively explore the factors influencing EL evolution and heterogeneity analysis. The results are as follows: (1) The EL area exhibited a trend of initial decrease followed by a subsequent increase during the study period. The most significant area transfer occurred between cropland and EL, but, after the 21st century, the proportion of area transfer between construction land and EL noticeably increased. (2) The compactness and fragmentation of EL showed a certain spatiotemporal stability, but the spatial distribution of compactness and fragmentation hot and cold spots exhibited significant differences. The fragmentation hot spots mainly displayed a strip distribution, while those of compactness showed a clustered distribution. (3) Although the ecosystem service value in the BTH region demonstrated dynamic “M”-shaped changes, the distribution of hot and cold spots still exhibited spatial stability. Regulating services consistently occupied a higher proportion of the sub-service functions, while cultural services still needed further enhancement. (4) Factors influencing the evolution of areas and values demonstrated similarities. The landscape was significantly influenced by construction land, showing a non-linear “U”-shaped relationship with fragmentation. Different economic development gradients and altitudes exhibited differentiated characteristics in terms of their influencing factors. This study provides scientific support for dynamically and precisely adjusting governmental EL management policies, contributing to the sustainable development of regional socio-economics.
1. Introduction
Transforming Our World: the 2030 Agenda for Sustainable Development, issued by the United Nations in 2015, serves as the guiding framework for global sustainable development initiatives [1]. Among the 17 Sustainable Development Goals (SDGs) outlined in this agenda, 12 are directly or indirectly related to the ecological environment, with a particular emphasis on the protection of forest, wetland, and so on [2]. As the Ecological Civilization Construction Strategy becomes implemented in China, there is an urgent demand for coordinated efforts to achieve high-quality economic development alongside a pristine ecological environment [3].
At present, the definition and classification system of ecological land (EL) exhibits diverse characteristics [4], and scholars have approached its delineation from various perspectives. There is a consensus within the academic community regarding the significant ecological benefits generated by EL and its crucial role in preserving ecosystem stability [5]. This recognition underscores its profound impact on achieving sustainable socio-economic development at the regional level [6,7]. However, the rapid advancement of urbanization and industrialization has significantly increased the demand for construction land, resulting in continuous encroachment upon EL [8]. According to a report by the Food and Agriculture Organization of the United Nations (FAO), approximately 178 million hectares of forest were lost globally between 1990 and 2020, equivalent to three times the size of France (https://news.un.org/zh/story/2020/07/1062651, accessed on 10 February 2024). This extensive loss of EL poses a severe threat to the harmonious coexistence of humanity and nature [9]. In China, EL protection faces significant challenges. From 1990 to 2010, several regions experienced a reduction in EL area, including the Beijing–Tianjin–Hebei (BTH) region [10]. Particularly in the first decade of the 21st century, there was a significant decrease in EL area in the BTH region, posing a significant threat to the regional ecosystem. However, since 2010, there has been some improvement in the reduction in EL, with an increase in forest area. Yet, the grassland area continues to decrease, especially around the cropland [11], highlighting the need to address the fluctuating changes in EL and their impact on the regional ecosystem.
Given the importance and vulnerability of EL, strengthening its protection and management has become a focal point for governments and the academic community. Example of this, at the governmental or international organization level, are various initiatives, such as the designation of February 2nd as World Wetlands Day by the United Nations General Assembly in August 2012, the EU Deforestation Regulation (EUDR) adopted by the European Union in June 2023 (https://www.europarl.europa.eu/doceo/document/TA-9-2022-0311_EN.html, accessed on 10 February 2024), and the implementation of the Wetland Protection Law by the Chinese government starting from 1 June 2022, providing strong institutional frameworks for EL protection. In the academic community, studies have focused on various aspects of EL, including its spatiotemporal evolution and driving factors [6,8,12]. These studies have analyzed the spatiotemporal evolution patterns of EL at global, national, and regional scales and explored the impact mechanisms of socio-economic factors and natural endowments. These analyses not only establish a theoretical foundation for future studies but also provide support and a reference for governments worldwide in their efforts to carry out EL protection work.
The majority of existing studies on EL has focused on city scales, such as Lanzhou [13], Guangzhou [14], Shenzhen [6], and Xi’an [12]. However, there is an urgent appeal for the exploration of EL at the regional level. In the background of regional integration and development, changes in the spatial layout and scale of various land use types are inevitable [13,15]. Exploration at the regional scale can contribute to the systematic protection of EL and the holistic functioning of ecosystems within regions. The BTH region, as a typical representative of regional coordinated development in northern China, has undergone significant changes in land use structure during its rapid integration and development process [16]. It has become one of the regions with the greatest ecological pressure and most complex environmental issues, constraining its sustainable development [17]. Compared to urban clusters in southern China such as the Yangtze River Delta and the Guangdong–Hong Kong–Macao Greater Bay Area, the arid climate in the BTH region poses severe challenges to the protection of EL. Therefore, exploring EL in the BTH region can provide a scientific basis for the development of regional land space and EL protection, which has significant practical significance. Many studies have explored and assessed the ecosystem in the BTH region, such as Liu et al., who analyzed the changes in ecosystem services in the region since the beginning of the 21st century at both grid and county scales [18], and Shen et al., who examined the relationships among six ecosystem services in the region in 2015 [19]. However, these studies overlooked the attention and analysis of the long-term multidimensional dynamic evolution of regional EL. As a crucial factor in regulating regional ecosystems, the dynamic changes in EL directly impact the stability of the ecosystem. Furthermore, while some studies have identified the driving factors of EL evolution, most of them only consider the factors influencing area evolution [6]. Other dimensions, such as landscape and function evolution, are neglected. This hinders the systematic analysis and examination of EL evolution, thereby limiting the decision-making reference and practical application value of study results. Lastly, heterogeneity analyses have not been mentioned in previous studies. It cannot help in clarifying the differential characteristics of the influencing factors under different economic development and natural resource endowments.
This study focuses on the BTH region and explores the heterogeneity of EL evolution patterns and driving factors (Figure 1). The main objectives of this study are as follows: (1) Analysis of the spatiotemporal evolution characteristics of EL in the BTH region over a long time series from a multidimensional perspective, considering area, landscape, and function. (2) Comprehensive and systematic identification of the factors influencing EL evolution, with a particular emphasis on quantifying the impact of cropland and construction land on EL evolution. (3) Conducting a heterogeneity analysis based on economic development gradients and altitude gradients to provide differentiated and targeted policy recommendations for EL protection. This study provides decision support and a scientific basis for optimizing EL protection management policies and identifying and resolving risks and threats faced by EL. The ultimate goal is to ensure the balance and stability of regional ecosystems and the sustainable development of socio-economic systems.
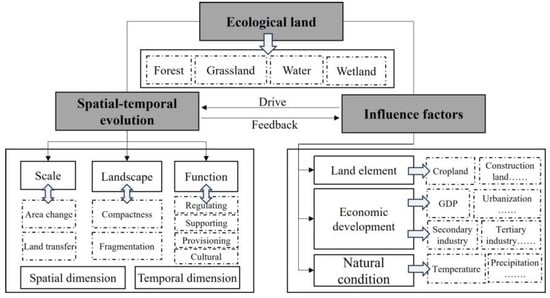
Figure 1.
Study framework.
The consideration of exploring the spatiotemporal evolution characteristics of EL from the area, landscape, and function dimensions is driven by their interconnectedness. Changes in one dimension often indicate corresponding changes in the others. As a fundamental change in EL, alterations in its area inevitably lead to changes in its spatial form. For instance, the expansion of construction land or the construction of transportation networks not only result in changes in scale but also exacerbate its fragmented state. Additionally, reductions in the area of EL lead to declines in regional ecosystem service functions, as supported by research [20]. Changes in landscape patterns also imply simultaneous changes in the scale and function of EL. A study has shown that the higher the degree of aggregation or dispersion of EL, the stronger its ecological service functions [21]. Similarly, when the service functions of EL decrease, it indicates that the scale and landscape form are subject to reduction and destruction. Moreover, analyzing the evolution characteristics of the scale, landscape, and function dimensions enables a comprehensive examination of regional EL in terms of quantity, form, and quality. This helps practitioners systematically understand the evolution characteristics of EL in the BTH region and has a stronger practical significance for guiding the protection of the spatial pattern of regional EL.
2. Literature Review
2.1. Connotation Analysis of EL
Clarifying and distinguishing the concepts and classification systems of EL is essential to avoid identification errors and ensure the accuracy of conclusions. However, there is still no unified consensus on the connotation of EL in existing studies. On one hand, many scholars use terms such as urban green spaces and blue-green infrastructure [22,23,24], which primarily serve to meet the material and spiritual demands of urban residents for a better ecological environment [25]. These concepts focus on promoting social equity and regulating urban microclimates but have limitations in improving the balance of ecosystems at larger spatial scales, such as urban agglomerations. On the other hand, Chinese scholars often use the concept of EL in their studies. This concept can be divided into broad and narrow connotations, with the main controversy revolving around whether to include cropland and unused land in EL. The broad connotation of EL refers to the collective term for all land use types with ecological benefits, including forest, grassland, water, unused land, and cropland [26]. The narrow connotation of EL refers to a collection of land use types primarily focused on ecological service functions, mainly including forest, grassland, wetland, and water [14].
This study defines EL from the perspective of its core function. Land is an integrated functional system with production, living, and ecological functions. EL plays a predominantly natural ecological function, including forest land, grassland, water, and wetland. The exclusion of cropland and unused land is justified for the following reasons: Firstly, since the beginning of the 21st century, China has experienced a significant increase in population, leading to an elevated strategic position of food security. Cropland increasingly emphasizes its role in ensuring national food security by emphasizing its social security attributes. Therefore, cropland mainly serves the function of food production and should not be included in the category of EL. Additionally, the long-term application of fertilizers and pesticides, as well as land fragmentation issues, have negative impacts on the ecological environment [6]. Therefore, this study excludes cropland from EL. Secondly, compared to wetland, other unused lands such as desert and barren land have relatively lower ecosystem service functions [27,28]. Hence, they should be excluded from EL.
2.2. Study on the Spatiotemporal Evolution and Driving Factors of EL
Recognizing the importance of EL in maintaining the balance of ecosystems, existing studies have explored various dimensions beyond the conceptual understanding of EL [8,12].
At the spatial scale, the area loss of EL has been well documented, with evidence of a loss of 800,000 km2 of forest globally from 1960 to 2019 [29,30]. As for China, the area of EL exhibits fluctuating and slightly shrinking trends at both national and city levels [14]. There is an interactive relationship between forest, grassland, and other land types [31]. Although studies have explored EL at municipal spatial scales [7], there has been relatively little investigation at the regional level. This gap hinders the provision of decision support for regional integrated conservation and management efforts. In terms of evolution dimensions, previous studies have analyzed the evolution of EL from single dimensions, such as area and morphology [6], and further summarized the evolutionary patterns [32]. While some studies have focused on the evolutionary patterns of EL, most scholars have only analyzed it from a single dimension, limiting the systematic understanding and examination of regional EL evolution. This cannot capture the comprehensive characteristics of regional EL evolution.
Moreover, studies have also focused on the driving factors of EL evolution [33,34]. Among them, socio-economic development and the intensity of human activities are primary factors leading to the reduction in and fragmentation of EL [32]. For instance, research on the fragmentation of forest land in the BTH region indicates a non-linear relationship between forest fragmentation and per capita GDP [35]. Additionally, socio-economic factors significantly impact the functionality of EL. Liu’s single-factor analysis focusing on the BTH region suggests that socio-economic factors, such as the GDP, have a significant negative impact on ecosystem services [18]. Shen’s study further demonstrates that population density and distance from built-up areas also play a crucial role in the stability of ecosystems in the BTH region [19]. In the background of rapid urbanization, the expansion demand for construction land encroaches upon EL, leading to intense conflicts with ecosystem protection [36,37]. Additionally, activities such as excessive logging, overgrazing, deforestation, and land reclamation threaten and degrade EL [7].
Furthermore, natural environmental factors also influence the scale and morphology of EL evolution [38,39]. For example, the arid climate in northwest China inhibits vegetation growth [40]. Water and soil erosion in the Loess Plateau region led to the degradation of forest and grassland from 1990 to 2015 [41]. As for the BTH region, research utilizing factor detection methods indicates that slope, landform, and soil type have the strongest explanatory power for the stability of EL, highlighting the significant influence of natural factors on its evolution [42]. Additionally, Xie’s empirical findings using a logistic model suggest that landform type, slope, and other natural factors significantly affect the probability of forest and grassland conversion to other land types in the BTH region [43].
It is undeniable that, with the advancement of urbanization, the conflict between EL and cropland and construction land becomes increasingly prominent [16]. For example, Italy witnessed a shift from expanding cropland by encroaching on grassland before World War II to a rapid expansion of EL and construction land after the war [44]. In China, nearly 13% of land experienced land use transitions from 2000 to 2020, with much of it involving conversions between EL and cropland [26]. Additionally, regional studies such as those focusing on the Mekong Delta, the American Midwest, and China’s Xiong’an New Area have explored land use transition relationships and characteristics [45,46]. Therefore, construction land and cropland have an important impact on the evolution of EL, so it is essential to include them in discussions of the influencing factors.
3. Study Area, Methods, and Materials
3.1. Study Area
The BTH region is an important part of China’s core economic zone, accounting for 8.29% of the national GDP in 2023 (Figure 2). According to the statistics from the Third National Land Survey reported in 2020, the total area of EL in this region accounts for about half of the total land area, far exceeding that of cropland and construction land. It is evident that the ecological resources in this region are abundant, and it should be a highland for the ecological functional benefits in China. However, with the rapid advancement of urbanization, the region is facing severe ecological environmental problems, becoming a major obstacle to advancing the process of regional sustainable development [15,47]. Therefore, exploring EL in the BTH region is crucial for optimizing the ecological security pattern of the national territory and provides a strong basis for enhancing regional habitat quality.
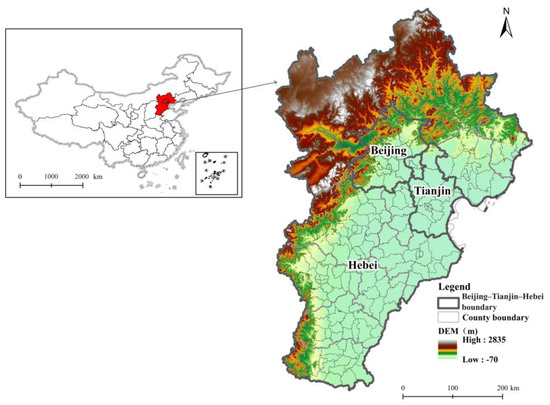
Figure 2.
Study area.
3.2. Study Methods
3.2.1. Gravity Center Shift Model
The gravity center shift model can reflect the spatiotemporal evolution of EL. By linking the direction and distance of gravity shifts with regional socio-economic development trends and local policies, it can better reveal the spatiotemporal trajectory of EL evolution. The calculation formula is as follows:
In the equation, are the latitude and longitude coordinates of the gravity center of EL in year, respectively; are the latitude and longitude coordinates of the gravity center of the th county, respectively; is the value of the indicators of EL in the th county in year; is the total of the study sample; is the distance of the center of gravity offset from year to year; is the coefficient of the latitude and longitude trans-planar distances and takes the value of 111.111; are the coordinates of the center of gravity in the year and year.
3.2.2. Calculation of Landscape Morphology Indicators
This study attempts to characterize the spatial landscape of EL in terms of the fragmentation level and compactness level of EL patches, because these two indicators affect the material and energy cycles of ecosystems and, thus, determine the stability of ecosystems [48,49]. The characterization of these two indicators can provide more guiding suggestions for the protection of EL. The formula is as follows:
where is the fragmented EL patch area; and is the total EL area.
where is the total number of patch types, is the number of neighboring patches of patch that are of the same type as , is the theoretical maximum of the number of neighboring patches that are of the same type as this patch, and is the proportion of patches of type in the landscape that do not undergo aggregation.
3.2.3. Equivalent Factor Method
The functional value approach has drawbacks due to the complex calculation process and the challenge of unifying the parameters and evaluation methods [50]. In contrast, the equivalent factor method requires less data and is easy to calculate, which makes it especially suitable for accounting for ecosystem service values at the regional scale. Therefore, this study calculated the ecosystem service value of this region, combined with previous studies [50]. The specific steps are as follows:
First, the value of one standard unit of ecosystem service value-equivalent factor and its correction were calculated.
In the equation, is the value of the ecosystem services of a standard equivalent in the th year (CNY/hm2); , , , and are the percentages of the sown area of the four main grain types of crops in the th year, respectively; , , , and are the average prices per unit area of major grain crops in the th year (CNY/hm2), respectively; is the retail price index of food commodities in the th year based on 1980; and n is the research time point.
Second, the basic equivalent and correction of ecosystem service value per unit area are determined.
is the equivalent factor of unit area value of the ecosystem service function of class in the year of a certain ecosystem in the d region. represents the value-equivalent factor corresponding to the functions of such ecosystems providing food production, climate regulation, environment purification, nutrient cycling, and aesthetic landscapes. represents water resources’ supply and hydrological regulation services. represents the value-equivalent factor corresponding to the soil conservation function provided by the ecosystem. , , and represent the spatiotemporal regulatory factors of NPP, precipitation, and soil conservation simulation in the th year of region d, respectively. , , and are the average annual NPP (t/hm2), average annual precipitation (mm/hm2), and average annual soil conservation simulation (t/hm2) of area d in the th year. , , and indicate the average annual NPP, average annual rainfall, and average simulated soil conservation per unit area in the th year nationwide.
Finally, the ecosystem service value of the county administrative region was calculated.
is the ecosystem service value per unit area of the th land type; is the value equivalent of the th type of ecosystem service of a certain land type; is the standard equivalent amount of the ecosystem service value; is the th type of the ecosystem service value; is the th type of the ecosystem service value per unit area of the th land type; is the area of the th land type (hm2); is the total ecosystem service value of a county; and represents the total ecosystem service value per unit area of the th land type.
3.2.4. Two-Way Fixed-Effects Model
To identify the multidimensional spatiotemporal factors influencing EL evolution, this study employs the two-way fixed-effects model specified by the following formula:
In the equation, is the index of the spatiotemporal evolution of EL in each dimension for the th county unit in th year; is the potential driving variables for each category; is the individual effect that does not vary with time heterogeneity; is the temporal effect that does not vary with individual heterogeneity; is the random error term; is the constant term; and is the coefficient of each potential driving variable.
3.3. Study Materials
Remote sensing monitoring data sets of China’s national land use and cover change (CNLUCC) were obtained from the Data Center for Resource and Environmental Sciences, Chinese Academy of Sciences. Data were obtained for 5 different years (1980, 1990, 2000, 2010, and 2020), with a spatial resolution of 30 m. The comprehensive evaluation accuracy of the first class of land use types, such as cropland and grassland, was >93%, and the comprehensive evaluation accuracy of the second class of land use types, such as paddy land and dry land, was >90% [51]. The county-level annual average temperature and precipitation data were derived from 1 km resolution monthly temperature raster grids and precipitation raster grids published by the National Tibetan Plateau Data Center (https://data.tpdc.ac.cn/, accessed on 10 February 2024), integrated with administrative boundary data [52]. Terrain data were sourced from the Earth Science Data website of the National Aeronautics and Space Administration. These were obtained using spaceborne thermal emission and a reflection radiometer and had a high vertical accuracy of up to 20 m and a horizontal accuracy of 30 m. We merged them with administrative boundary data to obtain county-level digital elevation model (DEM) data [53]. Data on the planting area and total output of grain crops were extracted from the China Agricultural Statistical Yearbook; the average price of grain crops per unit area was sourced from the Compilation of National Agricultural Cost–benefit Data; and the grain commodity retail price index was obtained from the China Urban (Town) Life and Price Yearbook. Socio-economic data such as the GDP, the tertiary and quaternary industry output value, and the registered population were sourced from the China County Statistical Yearbook and various municipal statistical yearbooks. Missing values were handled using two strategies to enhance the accuracy of the study results. For counties with few missing values, data were supplemented through local government work reports or other sources, while missing data which would have been difficult to obtain were supplemented using interpolation. Counties with a large number of missing values across all periods were excluded to avoid bias.
The “Literature Review” Section has already summarized and analyzed the influencing factors of EL evolution. The influencing factors selected in this study were determined based on existing studies, focusing on three dimensions: land elements, economic development, and resource endowment (Table 1). The economic development dimension included indicators such as the urbanization rate, the per capita GDP, the proportion of secondary and tertiary industries to the GDP, and the road network density [32,54]. The resource endowment dimension comprised variables such as the annual average precipitation and the annual average temperature [31]. In addition, we also considered the impact of land elements on the evolution of EL use. In the land elements’ dimension, variables such as the per capita cropland area, the per capita construction land area, and the per capita unused land area were selected.

Table 1.
Descriptive statistics of variables.
4. Results
4.1. Multidimensional Spatiotemporal Evolution of EL in BTH Region
4.1.1. Area Dimension
From Figure 3, it can be observed that the area of EL in the BTH region was consistently decreasing before 2010, with a particularly significant loss between 2000 and 2010. During this period, the level of urbanization in the BTH region was also in a stage of rapid development, especially in Beijing and Tianjin, where the pace of urbanization far exceeded that of the periods from 1990 to 2000 and from 2010 to 2020. The expansion of construction land driven by urbanization demands led to a significant encroachment and loss of EL. Additionally, as important destinations for population influx, the sharp increase in the number of migrants to Beijing generated substantial pressure on the protection of EL due to the resulting housing demand. However, since around 2010, there has been an increasing trend, reaching approximately 100,000 km2 by 2020. In 2012, China proposed the strategy of Ecological Civilization Construction, which strengthened the management and restoration of EL, leading to significant protection achievements [54]. In contrast, unused land and cropland have been continuously decreasing, with cropland experiencing significant losses since the beginning of the 21st century. The expansion of construction land has been synchronous with the development of urbanization in China. In the early 21st century, the rapid development of urbanization led to a substantial expansion of construction land, encroaching on cropland and EL. Subsequently, the concept of “new-type urbanization” was proposed, advocating for intensive and low-carbon urbanization, which then limited the disorderly expansion of construction land.
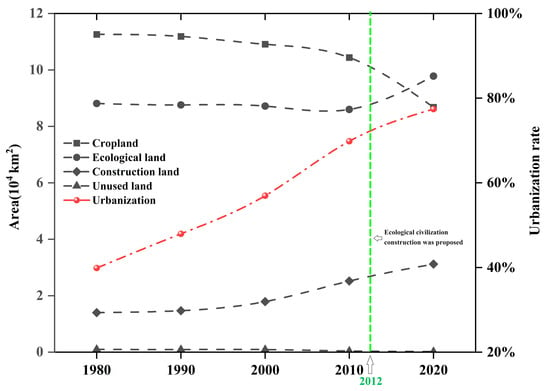
Figure 3.
Evolution trend of the ecological land area.
As for the transfer of EL, both the outflow and inflow showed temporal non-stationarity. Regarding the outflow (Figure 4a), from 1980 to 2020, EL mainly converted into cropland and construction land. The area converted into cropland gradually decreased, with a reduction of nearly 20% during the study period, while the area converted into construction land gradually increased, accounting for over 45% in 2020. Regarding the inflow (Figure 4b), the single inflow from cropland in the early stages of the study period shifted to a dual inflow from both cropland and construction land. Before the 21st century, the inflow of EL mainly came from cropland, accounting for over 90%. However, in the 21st century, the emphasis on cropland protection weakened the area of cropland converted into EL. The proportion of construction land converted into EL significantly increased, becoming the second-largest inflow of EL. The diversification trend of inflows can, to some extent, reduce the risk of large-scale loss of EL. From the trend of EL transfer, it can be observed that, under the dual pressures of food security and ecological protection, the mutual transfer effect between EL and cropland in the BTH region is gradually weaken. Especially since the beginning of the 21st century, as a major agricultural province, Hebei has implemented stricter cropland protection policies to restrict the outflow of cropland. Furthermore, efforts have been made to optimize the spatial layout and ecologically restore inefficient and highly polluted construction land into EL. Consequently, there has been a significant increase in the proportion of construction land converted into EL during this period. According to statistics, as of 2020, Hebei has restored and greened open-pit mines covering an area of up to 16,593 hectares, significantly improving the regional ecological environment quality (http://www.xinhuanet.com/politics/2021-08/15/c_1127761960.htm, accessed on 10 February 2024).
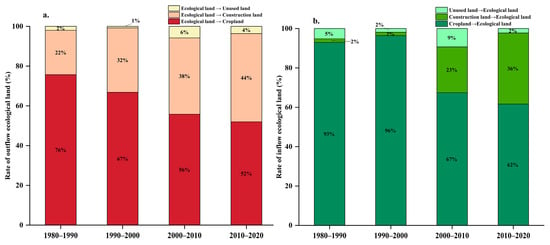
Figure 4.
Characteristics of ecological land transfer: (a) the outflow of ecological land; (b) the inflow of ecological land.
As for spatial distribution, there is a certain spatial stability in the high-value and low-value of EL (Figure 5). The high-value areas are mainly concentrated in the Yanshan Mountains and the Bashang Plateau, with the EL areas in most counties exceeding 2000 km2. The low-value areas are primarily concentrated in the North China Plain, where the EL areas in various counties are consistently below 500 km2. Additionally, counties located in the Taihang Mountains form a transitional zone, with EL areas falling between the high-value and low-value areas. It is evident that terrain and topography have a significant impact on the distribution of EL. Generally, mountainous regions act as natural protective barriers for forests due to their complex terrain, resulting in relatively minor fluctuations in the EL area, thereby maintaining these areas as high-value zones.
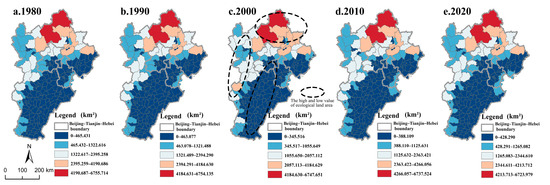
Figure 5.
Spatial distribution of ecological land: (a) Spatial distribution of ecological land, 1980; (b) Spatial distribution of ecological land, 1990; (c) Spatial distribution of ecological land, 2000; (d) Spatial distribution of ecological land, 2010; (e) Spatial distribution of ecological land, 2020.
From the spatial distribution characteristics of EL transfer, it is observed that the spatial hot spots of EL transfer gradually increase (Figure 6). Before the year 2000, the inflow and outflow of EL mainly occurred in Beijing and Tianjin but did not exhibit significant clustering characteristics. However, entering the 21st century, the intensification of human activities led to an increase in the spatial hot spots of EL transfer, accompanied by clustering characteristics. Beijing and Tianjin, as well as Zhangjiakou city and Cangzhou city in the Hebei province, have experienced noticeable changes in EL transfer. Among them, the Binhai New Area and the Caofeidian District in Tianjin, as well as Shangyi County and the Xuanhua District in Zhangjiakou, are important aggregation points. During the period from 2010 to 2020, a large amount of construction land near the coastline in Tianjin was converted into EL. Government planning and control measures played a crucial role in this process. During this period, Tianjin successively issued the “Tianjin Marine Functional Zoning (2011–2020)” and the “Tianjin Marine Main Functional Zone Planning”, which proposed optimizing development areas, limiting development areas, controlling the scale of reclamation, and strengthening ecological restoration and protection. It is evident that planning control, with its coercive and restrictive force, has become an essential means and tool for ensuring the stability of regional ecological systems.
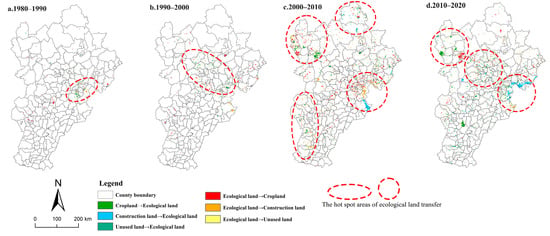
Figure 6.
Spatial distribution of ecological land transfer: (a) Spatial characteristics of ecological land transfers, 1980–1990; (b) Spatial characteristics of ecological land transfers, 1990–2000; (c) Spatial characteristics of ecological land transfers, 2000–2010; (d) Spatial characteristics of ecological land transfers, 2010–2020.
Overall, during the period from 1980 to 2020, most counties were facing the risk of EL reduction, with the threats and instability in the southeastern part of the area further intensifying (Figure 7). Firstly, the counties experiencing area loss were mainly concentrated in the Bashang Plateau region and along the Taihang Mountain, with the area centroid showing a tendency to shift towards the southeast. Although the reduction in EL area in these two areas was less than 50%, as high-value areas in the regional distribution of EL, the changes in their area undoubtedly had a significant impact on the health and stability of the regional ecosystem. Therefore, necessary measures should be taken to prevent a further loss of EL area in this region. Secondly, areas with significant fluctuations in EL area were mainly located in the North China Plain region. On the one hand, due to its flat terrain, human activities have a more pronounced impact on EL, leading to fluctuations in the EL area. On the other hand, the area of EL in the North China Plain region was much lower than that in the Bashang Plateau and Taihang Mountains, making it more susceptible to spatial fluctuations in EL area.
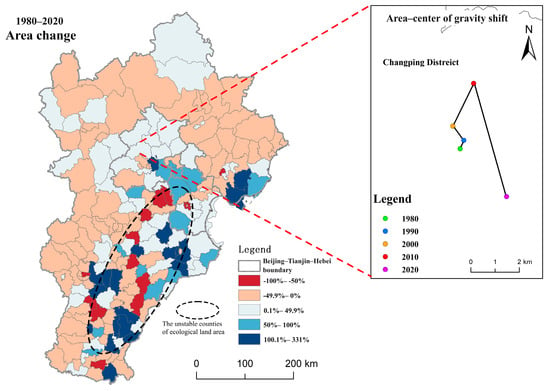
Figure 7.
Spatial distribution and gravity center shift of ecological land area.
4.1.2. Landscape Dimension
In terms of the landscape dimension, the compactness of EL exhibited a certain level of temporal stability, while the fragmentation showed dynamic fluctuations after entering the 21st century (Figure 8). Firstly, the compactness of EL remained around 0.6 across all time periods, with Beijing’s EL compactness being slightly higher at 0.69 compared to Tianjin and the Hebei province. Secondly, before the year 2000, the fragmentation of EL in the region showed a relatively stable trend similar to compactness. However, after entering the 21st century, the fragmentation of EL exhibited a pattern of “initial decrease-followed by increase”.
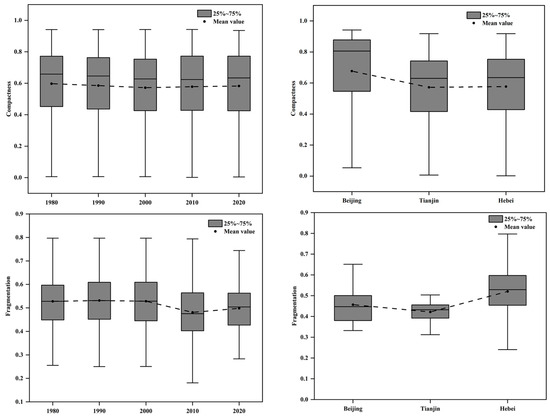
Figure 8.
The changing characteristics of the landscape of ecological land.
From the spatial evolution of the landscape, the fragmentation and compactness of EL exhibited differentiated evolving characteristics (Figure 9). On one hand, the cold–hot spots of EL in the BTH region mainly exhibited a strip-like distribution. The hot spots were concentrated in the northern and western regions, while the cold spots were primarily located in the southeastern region. Considering the distribution of EL area in the region, there were large areas of EL in the southwest. Construction activities, especially linear development projects such as road networks, may have led to the extensive fragmentation of patches, posing a high risk of fragmentation for the region. Conversely, the low-fragmentation aggregation zones in the southeastern region may have been attributed more to the smaller baseline of EL area. On the other hand, unlike the distribution pattern of fragmentation, the compactness hot and cold–hot spots were mainly characterized by a clustered distribution with a concentric, decreasing pattern. The cold spots were concentrated in the southern parts of Tianjin and Beijing, as well as in the northern parts of Langfang city in the Hebei province. The hot spots were mainly located in Cangzhou city and Hengshui city in the southeastern part of the region before 2000. Subsequently, they shifted westward, with their main distribution in Zhangjiakou city and Shijiazhuang city by 2010.
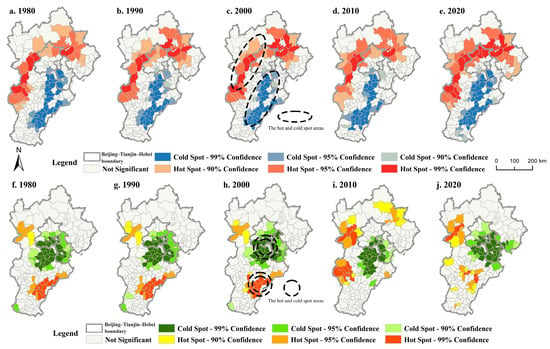
Figure 9.
Distribution of cold and hot spots in the ecological land landscape. (a–e) Distribution of fragmentation hot and cold spots in the ecological land; (f–j) Distribution of compactness hot and cold spots in the ecological land. Figure (a–e) show the fragmentation cold–hot spots, and (f–j) show the compactness cold–hot spots.
On the whole, from 1980 to 2020, most counties experienced a “dual decrease” in both compactness and fragmentation (Figure 10). The counties with increased compactness were mainly distributed in the northern part of the region, including Chengde city and Zhangjiakou city. The counties with increased fragmentation were mainly concentrated in Beijing, as well as Baoding city, Shijiazhuang city, and Xingtai city in the southern part of the region. It is evident that future efforts in EL protection need to continue focusing on enhancing compactness while limiting the increase in fragmentation. This aims to achieve the dual-optimization goal of reducing fragmentation and increasing compactness in the EL landscape, ensuring the smooth flow of material and energy in the ecosystem. Regarding the centroid displacement, the trend of compactness primarily showed a significant northward shift, spanning across two counties. In contrast, fragmentation exhibited a westward shift from 1980 to 2020, indicating an increasingly severe fragmentation issue in the western part of the region.
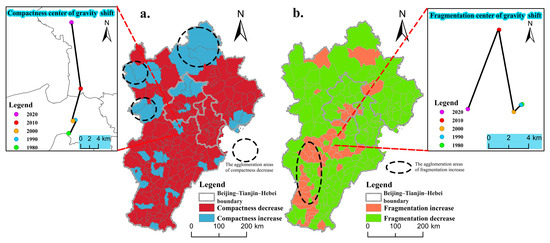
Figure 10.
Spatial distribution and gravity center shift of the ecological land landscape, 1980–2020: (a) Distribution of compactness and gravity shift in the ecological land, 1980–2020; (b) Distribution of fragmentation and gravity shift in the ecological land 1980–2020.
4.1.3. Function Dimension
From the perspective of the function dimension, whether at the provincial or county level, the ecosystem service value exhibited a dynamic “M”-shaped trend, with peaks in 1990 and 2010. The fluctuations before 2000 were more pronounced (Figure 11). The trend of the ecosystem service value in the Hebei province was higher than that of Beijing and Tianjin, occupying an overwhelmingly dominant position. It is evident that the fluctuation in the ecosystem service value in the Hebei province played a crucial role in maintaining the balance of the regional ecosystem, directly influencing the overall trend of value change. In contrast, Beijing and Tianjin, as directly administered municipalities in China, faced limitations in urban functional positioning and the urban scale, making it difficult to reserve sufficient space for the restoration and expansion of EL. Therefore, the ecosystem service value in these cities remained at a relatively low level, with minimal fluctuations.
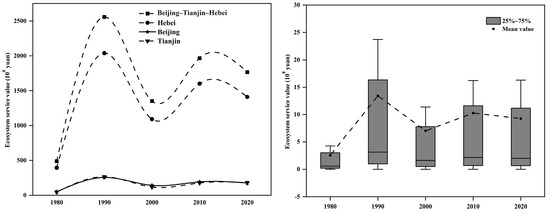
Figure 11.
Temporal evolution characteristic of the ecosystem service value.
Furthermore, among the various ecosystem service functions, there were significant differences in the ecosystem service values of different functions (Figure 12). The regulating function consistently occupied a dominant position in the BTH region, with its proportion exceeding 60% at all time points, particularly close to 90% in Tianjin. Additionally, the supporting function also accounted for a certain proportion, with proportions exceeding 20% in all regions except for Tianjin. In contrast, the proportion of the cultural service function in the BTH region remained relatively low at all time points, consistently below 6%, much lower than the other three service functions. With the steady development of the socio-economy and increasing living standards, there is an urgent need to satisfy the public’s demand for cultural and recreational activities. EL, as a place for leisure, recreation, and social interaction, plays an important role in enhancing public well-being and life satisfaction [20,55]. Clearly, there is still a gap in the cultural service function in the ecosystem service of the BTH region. Therefore, in future EL protection and management processes, it is necessary to strengthen the cultural service function.
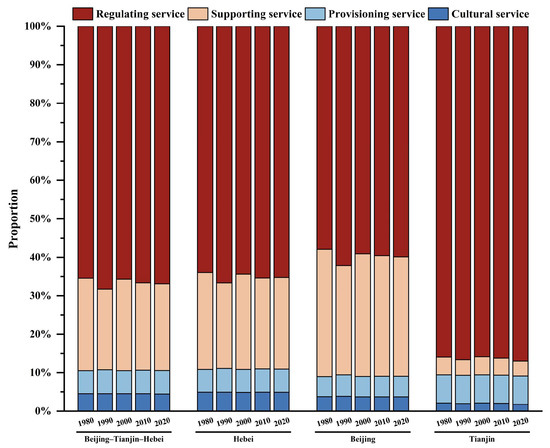
Figure 12.
The proportion of the various ecosystem service functions.
In terms of spatial evolution, the spatial evolution characteristics of the ecosystem service values in the BTH region were similar to the spatial patterns in terms of scale, exhibiting a certain degree of spatial stability (Figure 13). The hot spots were mainly concentrated in the northern part of the region, including the Yanshan Mountains and the Bashang Plateau. The cold spots were mainly located in the southeastern part, specifically in the North China Plain, with a noticeable gradient of concentric decrease in the cold spots’ intensity.
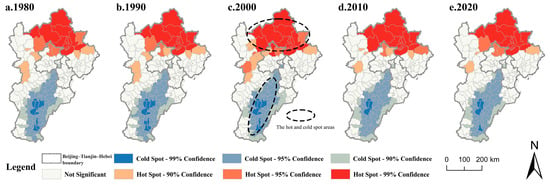
Figure 13.
Spatial distribution of the cold and hot spots of the ecosystem service value: (a) Spatial distribution of the cold and hot spots,1980; (b) Spatial distribution of the cold and hot spots, 1990; (c) Spatial distribution of the cold and hot spots, 2000; (d) Spatial distribution of the cold and hot spots, 2010; (e) Spatial distribution of the cold and hot spots, 2020.
4.2. Analysis of Factors Influencing the Multidimensional Evolution of EL
Table 2 presents the regression results for the factors influencing the evolution of EL in various dimensions. From the analysis of landscape evolution, it became evident that the expansion of construction land had a non-linear relationship with the fragmentation of EL. In light of this, this study added a quadratic term variable for construction land in Model (3) to verify the existence of this relationship. Specifically, in the dimension of the land elements, cropland had a significant negative impact on the area and function of EL, but it did not have a significant influence on compactness and fragmentation in the landscape. As for the BTH region, cropland was primarily situated in the southeastern North China Plain, where there was a paucity of extensive EL patches. The compensatory balance of cropland was more prone to infringe upon minor EL patches, potentially diminishing EL area and function. Conversely, the expansion of cropland exhibited a more regular pattern and did not precipitate the fragmentation of large EL masses. Hence, its influence on the EL landscape could be deemed insignificant. Construction land had a significant negative impact on all dimensions, and our empirical results also indicated a non-linear “U-shaped” relationship between construction land and fragmentation. Unlike cropland, the expansion of construction land was characterized by a greater degree of uncertainty. It not only led to the encroachment on the EL area and the consequent degradation of ecological services but also had substantial implications for the landscape.

Table 2.
Empirical results of the multidimensional evolution of ecological land.
Furthermore, urbanization, GDP, road network density, and the proportion of the secondary industry all had significant negative impacts on the scale and function of EL, while they had a significant positive impact on fragmentation in the landscape. The impact of road network density on the fragmentation of EL requires significant attention. Given that road network planning often features strip-like construction, the development process inevitably fragments EL patches, thereby exerting a substantial influence on landscape morphology. Unlike other regions, the BTH region, as a typical representative of regional coordinated development, exhibited a more-networked characteristic in its transportation infrastructure. Especially since 2014, the region has been comprehensively advancing the integrated construction of the transportation network, aiming to promote coordinated socio-economic development through unified planning. Consequently, the road network density in the BTH region has a significant positive impact on the level of EL fragmentation. Road network density and the development of the tertiary industry also have significant impacts on the compactness of EL. It is evident that socio-economic development indeed imposes certain pressure and challenges on the evolution of EL in various dimensions. Precipitation and temperature significantly affect the area, function, and compactness of EL.
4.3. Heterogeneity Analysis of Factors Influencing EL Evolution
To further explore the heterogeneity characteristics of the influencing factors, this study utilized the natural breakpoint method to divide the per capita GDP and DEM of the BTH region in 2020. Specifically, the per capita GDP was divided into three gradients of low, medium, and high economic development, with thresholds set at 41,716 CNY and 102,826 CNY. The DEM was divided into low-altitude counties and high-altitude counties, using 58.96 m as the threshold.
Table 3 presents the results of the influencing factors under different economic development gradients. It can be observed that, in regions with low economic development levels, cropland has a significant impact on the evolution of EL. In counties with lower levels of economic development, the growth momentum of the secondary and tertiary industries is often slower, while the primary industry grows more rapidly. As a result, the expansion of construction land is relatively slower, and the impact of cropland expansion on EL becomes more pronounced, as exemplified by counties in Hebei which are not part of a city district.

Table 3.
Empirical results of the influencing factors under the economic development gradient.
However, with economic development, the impact of construction land on the evolution of EL becomes more pronounced. In counties with a moderate economic development level, construction land has a significant negative impact on the area and fragmentation of EL. In counties with a high level of economic development, construction land has a significant negative impact on the area, function, and compactness of EL, while exerting a positive impact on fragmentation. This implies that a higher per capita construction land area leads to lower area, function, and compactness of EL and higher fragmentation. For instance, in the districts and counties of Beijing and Tianjin, where the level of economic development is relatively high, the demand for construction land is correspondingly greater. Against this backdrop, the threat that construction land poses to EL across various dimensions is more severe, and its impact significantly exceeds that of cropland.
Additionally, urbanization, GDP, road network density, and the proportion of the secondary industry have more pronounced effects on the evolution of EL in counties with a higher economic development level. Overall, counties with a higher economic development level have a greater number of influencing factors affecting the evolution of EL. Therefore, these areas require a more systematic consideration and the balancing of various influencing factors in the process of EL protection and management.
Table 4 presents the estimated results of the influencing factors under different altitudes. It is evident that the impacts of cropland and construction land in low-altitude counties are much higher than those in high-altitude counties. The primary reason is that low-altitude counties are mainly located in the North China Plain, one of China’s major grain-producing areas. The high demand for cropland expansion and production in these areas aims to ensure the stability and security of regional and national grain supplies, inevitably leading to the loss of EL. The impact of construction land in low-altitude counties is consistent with the results obtained in Table 3. Furthermore, construction land has a “U-shaped” impact on the fragmentation of EL in low-altitude counties. This suggests that, in low-altitude regions, construction land initially has a negative impact on the fragmentation of EL. However, when construction land increases to a certain threshold, a further expansion of construction land leads to increased fragmentation. In high-altitude counties, the functional value of EL is more sensitive to the expansion of construction land.

Table 4.
Empirical results of the influencing factors under the altitude gradient.
Additionally, socio-economic development factors such as urbanization and the GDP have strong impacts in both low-altitude and high-altitude counties, while road network density and the proportion of the secondary industry have significant effects in high-altitude counties. Compared to low-altitude counties, the planning and layout of regional road networks, as well as the optimization and upgrading of industrial structure, play a crucial role in the protection of EL in high-altitude counties. As for natural endowments, temperature and precipitation do not exhibit significant differences in their impacts on the evolution of EL.
5. Discussion
5.1. Multidimensional Effects of Cultivated Land and Construction Land on the EL
The rapid development of socio-economics propels the process of land use transformation, and the interaction between EL and other land types is a crucial component of land use transition. Existing studies have indicated that the rapid expansion of construction land is one of the primary causes of EL loss [56]. However, the study obtained from Table 2 suggests that, compared to construction land, cropland has a stronger impact on the area of EL. This result may stem from the direct impact of cropland expansion due to agricultural production needs and the indirect impact of construction land expansion leading to cropland supplementation [30].
On the one hand, in recent years, China’s strategic emphasis on food security has been increasingly elevated. In this context, the demand for food production has been greatly mobilized, leading to the protection and expansion of cropland, consequently resulting in the loss of EL. On the other hand, China’s policy of balancing the proportion of cropland also indirectly contributes to the reduction in EL [8]. To mitigate the uncontrolled expansion of construction land at the expense of cropland, China implemented the cropland balance policy in 1997. The main content of this policy is that, for every unit of cropland occupied during construction development, an equivalent amount of cropland of comparable quantity and quality must be replenished by the local government. Under this policy constraint, reduced cropland is often compensated by encroaching on the EL space, thereby indirectly leading to the large-scale loss of EL, a point also supported by previous studies [28,30].
Moreover, numerous studies have indicated that the landscape pattern has a significant impact on the spatial flow of material resources [49]. Changes in the landscape pattern of EL inevitably affect the stability of ecosystems. For example, a higher degree of fragmentation leads to a lower material energy flow, posing greater threats to ecosystems [48]. The results of this study demonstrate that, in the BTH region, the fragmentation of EL exhibited a trend of initial decline followed by an increase over time in the 21st century. It is speculated that the emergence of this evolution characteristic was due to the differentiated expansion patterns of construction land, which led to two modes of loss for EL: the “absorption of small internal patches” and the “fragmentation of large surrounding patches”. Consequently, the fragmentation of EL showed an increasing trend. Specifically, after the turn of the 21st century, the rapid advancement of urbanization in China resulted in the substantial expansion of construction land. Initially, to reduce expansion costs and enhance efficiency, local governments tended to adopt strategies such as nearby or internal expansion, prioritizing the absorption of small, fragmented patches surrounding or surrounded by construction land. This expansion pattern led to the reduction in the fragmentation of EL within the region. However, as the fragmented EL patches were absorbed, further urbanization would have led to the destruction of larger-scale EL patches in the suburbs, thereby increasing the fragmentation of EL within the region. Additionally, with the continuous improvement of transportation networks, road expansion inevitably divides EL patches. These two modes of EL loss and changes in fragmentation can be illustrated through Figure 14.
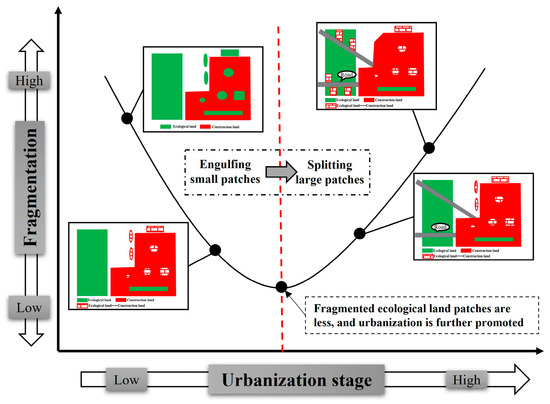
Figure 14.
Change trend in the fragmentation of ecological land in the process of urbanization.
5.2. The Differentiation Characteristics of Influencing Factors under Different Conditions
Section 4.3 reveals that the influencing factors exhibited heterogeneous characteristics under different conditions. This provides valuable reference and support for carrying out differentiated policies of EL protection and management. Specifically, in terms of economic gradients, the EL in counties at medium-to-low levels of economic development is more influenced by cropland than by construction land. As one of China’s major grain-producing areas, the protection of cropland is crucial for ensuring food security in the North China region. Therefore, counties prioritize the protection of cropland, which unavoidably affects the area and landscape of EL during reclamation. Consequently, in counties at medium-to-low levels of economic development, particular attention should be paid to the balance between cropland and EL. In comparison, in counties with a high level of economic development, construction land plays a significant role in influencing the evolution of EL. The rapid and unregulated expansion of construction land is a prominent feature of many highly economically developed regions. In the context of strict institutional constraints on cropland occupation, EL becomes a primary supplementary source for the expansion of construction land. It leads to ecological degradation and intensifies land use conflicts, thus affecting regional sustainable development.
Additionally, the impacts of the GDP, secondary industry structure, and road network density on EL in counties with a high level of economic development should not be overlooked. On one hand, counties with better economic development generally exhibit a stronger human activity intensity, which may increase the intensity and speed of EL development during the construction process [32,33]. On the other hand, counties with a high level of economic development have a far more advanced construction of transportation networks compared to those with a low development level. The high density of road networks not only strengthens human construction and development capabilities but also leads to the extensive fragmentation of EL patches, thereby increasing the landscape fragmentation of EL.
From the perspective of different altitudes, the influencing factors in high-altitude counties are more numerous than those in low-altitude counties, indicating that the protection of EL in the former faces multidimensional threats and challenges. On one hand, the transformation of land use in low-altitude counties is more closely linked to socio-economic activities, giving rise to diverse land use demands during economic development. This intensifies the intensity of land use transformation, making the interaction between construction land, cropland, and EL more pronounced, thereby impacting the evolution of EL in various dimensions. Meanwhile, the “U”-shaped relationship between construction land and EL fragmentation still exists. On the other hand, the influence of various socio-economic development factors remains significant. Counties with low altitudes are less affected by topography when planning road networks. This provides opportunities to avoid encroachment on EL and reduce damage to ecosystems, but empirical results indicate that the intensification of multidimensional destruction is also strengthened with the increase in road network density, especially in terms of functional value and landscape form. In contrast to low-altitude counties, the impact of land use transformation on the evolution of EL is relatively small in high-altitude counties. However, economic development factors should be given sufficient attention. Particularly, the construction of road networks in high-altitude counties not only increases the fragmentation of EL but also encroaches upon EL during the construction process, leading to its reduction in area.
5.3. Policy Suggestions for EL Protection and Management in BTH Region
Based on the results, the following suggestions for EL protection are proposed. Firstly, each county should formulate scientifically reasonable land use control measures to minimize the encroachment and loss of EL. Meanwhile, under the dual strategic background of food security and ecological civilization construction, achieving a dynamic balance between cropland and EL in the future is crucial for the region’s social stability and sustainable economic development. Each county should determine the dynamic threshold for the balance between cropland and EL based on regional integration development and be vigilant against policies such as cropland occupation–compensation balance that may excessively encroach upon EL.
Secondly, the BTH region should establish systematic policies for integrated EL protection. As a typical representative of regional coordinated development, the BTH region needs to strengthen the coordinated protection of the ecological system while promoting economic integration. The results of our study indicate that, although there was a significant increase in area from 2010 to 2020, the fragmentation of landscape morphology remains unresolved and shows a trend of deterioration. Despite the issuance of relevant policy documents in recent years, such as the Three-Year Afforestation Action Plan for the Coordinated Development of Beijing–Tianjin–Hebei, only Tianjin has actually implemented related work. Therefore, there is still an urgent need to establish systematic policies for the regional coordinated protection of EL.
Finally, it is essential to establish a differentiated policy framework for EL protection. Empirical results demonstrate that the factors influencing EL evolution vary across different counties. Therefore, a unitary policy for EL protection is not advisable. Tailored policies should be adopted according to local conditions. For instance, in counties with a high level of economic development, a comprehensive policy approach should be implemented. This involves controlling the supply of construction land, the rational planning of transportation networks, and so on to effectively promote EL protection efforts. In counties with a high altitude, the development of secondary industries poses a significant obstacle to EL protection. Therefore, efforts should be made to promote industrial transformation and upgrading. Relying on the local natural resource endowment, the development of eco-tourism, eco-lodging, and other green economy initiatives can be pursued to mitigate the adverse impacts on EL and ecosystems.
5.4. Limitations and Prospects
This study has several limitations that warrant consideration. Firstly, there is room for improvement in data accuracy. The resolution of the data used in this study was 30 m, which may have resulted in difficulties in identifying small-scale EL patches. Consequently, exploring regional-scale spatial dimensions of EL evolution may have some degrees of error. The future availability of long-term, high-resolution remote sensing data will provide robust support for optimizing research in this field. Secondly, due to limitations in accessing policy and planning documents, these factors were not included in the empirical study of the influencing factors. In addition to socio-economic statistics and natural environmental data, integrating policy and planning data into quantitative models to investigate the mechanisms of EL evolution is of importance.
6. Conclusions
This study utilizes land use classification raster data from five research time points, spanning from 1980 to 2020, to analyze the multidimensional spatiotemporal evolution characteristics of EL and its influencing factors in the BTH region. The following conclusions have been drawn: (1) EL in the BTH region exhibited a trend of “initial decline followed by subsequent improvement” from 1980 to 2020, with significant differences in the fluctuation magnitude before and after the year 2000. The main sources of outflow from EL were primarily cropland and construction land, while the inflows mainly came from cropland. (2) Throughout the study period, EL demonstrated a certain degree of spatiotemporal stability in terms of compactness and fragmentation. However, there were significant differences in the spatial distribution of hot spots. The fragmentation hot spots primarily exhibited a strip-like distribution, whereas the compactness ones showed clustering. (3) Although the ecosystem service value in the region followed an “M”-shaped dynamic trend during the study period, the distribution of hot–cold spots exhibited some spatial stability. Additionally, the regulatory services consistently accounted for a high proportion of sub-service functions. (4) The factors influencing EL evolution revealed similarities in the area and function dimensions. However, the landscape was unaffected by cropland but influenced by construction land, and fragmentation exhibited a non-linear “U”-shaped relationship with construction land. Furthermore, under different levels of economic development and altitudes, the factors influencing each dimension showed distinct characteristics. Analyzing the spatiotemporal evolution characteristic and factors influencing EL can provide support and a scientific basis for optimizing regional EL protection policies, thereby facilitating the stability of regional ecosystems and sustainable socio-economic development.
Author Contributions
Conceptualization, X.W. and Z.Z.; methodology, X.W and Z.X.; software, X.W. and Z.X.; validation, J.H.; writing—original draft preparation, X.W.; writing—review and editing, X.W.; visualization, X.W.; supervision, Z.Z.; project administration, Z.Z.; and funding acquisition, Z.Z. All authors have read and agreed to the published version of the manuscript.
Funding
This study was financially supported by the National Natural Science Foundation of China (No. 42077433) and the National Social Science Foundation of China (NO. 21AZD041).
Data Availability Statement
The data are freely available upon request.
Acknowledgments
We thank all the editors and anonymous reviewers for their valuable comments.
Conflicts of Interest
The authors declare no conflicts of interest.
References
- Xu, Z.; Peng, J.; Liu, Y.; Qiu, S.; Zhang, H.; Dong, J. Exploring the Combined Impact of Ecosystem Services and Urbanization on SDGs Realization. Appl. Geogr. 2023, 153, 102907. [Google Scholar] [CrossRef]
- Wood, S.L.R.; Jones, S.K.; Johnson, J.A.; Brauman, K.A.; Chaplin-Kramer, R.; Fremier, A.; Girvetz, E.; Gordon, L.J.; Kappel, C.V.; Mandle, L.; et al. Distilling the Role of Ecosystem Services in the Sustainable Development Goals. Ecosyst. Serv. 2018, 29, 70–82. [Google Scholar] [CrossRef]
- Fan, Y.; Fang, C.; Zhang, Q. Coupling Coordinated Development between Social Economy and Ecological Environment in Chinese Provincial Capital Cities-Assessment and Policy Implications. J. Clean. Prod. 2019, 229, 289–298. [Google Scholar] [CrossRef]
- Yu, F.; Li, X.; Zhang, L.; Xu, W.; Fu, R.; Wang, H. Study of ecological land in China: Conception, classification, and spatial-temporal pattern. Acta Ecol. Sin. 2015, 35, 4931–4943. (In Chinese) [Google Scholar]
- Huang, J.; Wang, X.; Zhang, D.; Zhang, Z.; Yan, J.; Xia, F. Trade-Offs under Pressure? Development of Urban Green Space under Economic Growth and Governance. J. Clean. Prod. 2023, 427, 139261. [Google Scholar] [CrossRef]
- Peng, J.; Zhao, M.; Guo, X.; Pan, Y.; Liu, Y. Spatial-Temporal Dynamics and Associated Driving Forces of Urban Ecological Land: A Case Study in Shenzhen City, China. Habitat Int. 2017, 60, 81–90. [Google Scholar] [CrossRef]
- Huang, J.; Zhang, D.; Zhang, Z.; Kong, W.; Yan, J.; Xia, F. Trapped in Dilemma: Inverted N-Shaped EKC Evidence of Economic Growth and Ecological Land in a Spatial Spillover Perspective. Appl. Geogr. 2023, 161, 103145. [Google Scholar] [CrossRef]
- Kong, X.; Fu, M.; Zhao, X.; Wang, J.; Jiang, P. Ecological Effects of Land-Use Change on Two Sides of the Hu Huanyong Line in China. Land Use Policy 2022, 113, 105895. [Google Scholar] [CrossRef]
- Wang, H.; Zhang, C.; Yao, X.; Yun, W.; Ma, J.; Gao, L.; Li, P. Scenario Simulation of the Tradeoff between Ecological Land and Farmland in Black Soil Region of Northeast China. Land Use Policy 2022, 114, 105991. [Google Scholar] [CrossRef]
- Liu, J.; Liu, Y.; Li, Y. Classification evaluation and spatial-temporal analysis of “production-living-ecological” spaces in China. Acta Geogr. Sin. 2017, 72, 1290–1304. (In Chinese) [Google Scholar]
- Zhao, L.; Su, M.; Wang, X.; Li, X.; Chang, X.; Zhang, P. Spatial–Temporal Evolution and Prediction of Habitat Quality in Beijing–Tianjin–Hebei Region Based on Land Use Change. Land 2023, 12, 667. [Google Scholar] [CrossRef]
- Dang, H.; Li, J. The Integration of Urban Streetscapes Provides the Possibility to Fully Quantify the Ecological Landscape of Urban Green Spaces: A Case Study of Xi’an City. Ecol. Indic. 2021, 133, 108388. [Google Scholar] [CrossRef]
- Liu, J.; Xiao, B.; Jiao, J.; Li, Y.; Wang, X. Modeling the Response of Ecological Service Value to Land Use Change through Deep Learning Simulation in Lanzhou, China. Sci. Total Environ. 2021, 796, 148981. [Google Scholar] [CrossRef]
- Zhang, Y.; Hu, Y.; Zhuang, D. A Highly Integrated, Expansible, and Comprehensive Analytical Framework for Urban Ecological Land: A Case Study in Guangzhou, China. J. Clean. Prod. 2020, 268, 122360. [Google Scholar] [CrossRef]
- Fu, J.; Zhang, Q.; Wang, P.; Zhang, L.; Tian, Y.; Li, X. Spatio-Temporal Changes in Ecosystem Service Value and Its Coordinated Development with Economy: A Case Study in Hainan Province, China. Remote Sens. 2022, 14, 970. [Google Scholar] [CrossRef]
- Yang, Y.; Bao, W.; Liu, Y. Coupling Coordination Analysis of Rural Production-Living-Ecological Space in the Beijing-Tianjin-Hebei Region. Ecol. Indic. 2020, 117, 106512. [Google Scholar] [CrossRef]
- Bao, W.; Yang, Y.; Zou, L. How to Reconcile Land Use Conflicts in Mega Urban Agglomeration? A Scenario-Based Study in the Beijing-Tianjin-Hebei Region, China. J. Environ. Manag. 2021, 296, 113168. [Google Scholar] [CrossRef]
- Liu, J.; Pei, X.; Zhu, W.; Jiao, J. Understanding the Intricate Tradeoffs among Ecosystem Services in the Beijing-Tianjin-Hebei Urban Agglomeration across Spatiotemporal Features. Sci. Total Environ. 2023, 898, 165453. [Google Scholar] [CrossRef]
- Shen, J.; Li, S.; Liu, L.; Liang, Z.; Wang, Y.; Wang, H.; Wu, S. Uncovering the Relationships between Ecosystem Services and Social-Ecological Drivers at Different Spatial Scales in the Beijing-Tianjin-Hebei Region. J. Clean. Prod. 2021, 290, 125193. [Google Scholar] [CrossRef]
- Ernstson, H. The Social Production of Ecosystem Services: A Framework for Studying Environmental Justice and Ecological Complexity in Urbanized Landscapes. Landsc. Urban Plan. 2013, 109, 7–17. [Google Scholar] [CrossRef]
- Prato, T. Modeling Ecological Impacts of Landscape Change. Environ. Model. Softw. 2005, 20, 1359–1363. [Google Scholar] [CrossRef]
- Puppim De Oliveira, J.A.; Bellezoni, R.A.; Shih, W.; Bayulken, B. Innovations in Urban Green and Blue Infrastructure: Tackling Local and Global Challenges in Cities. J. Clean. Prod. 2022, 362, 132355. [Google Scholar] [CrossRef]
- Kumar, P.; Druckman, A.; Gallagher, J.; Gatersleben, B.; Allison, S.; Eisenman, T.S.; Hoang, U.; Hama, S.; Tiwari, A.; Sharma, A.; et al. The Nexus between Air Pollution, Green Infrastructure and Human Health. Environ. Int. 2019, 133, 105181. [Google Scholar] [CrossRef]
- Demuzere, M.; Orru, K.; Heidrich, O.; Olazabal, E.; Geneletti, D.; Orru, H.; Bhave, A.G.; Mittal, N.; Feliu, E.; Faehnle, M. Mitigating and Adapting to Climate Change: Multi-Functional and Multi-Scale Assessment of Green Urban Infrastructure. J. Environ. Manag. 2014, 146, 107–115. [Google Scholar] [CrossRef]
- Wolch, J.R.; Byrne, J.; Newell, J.P. Urban Green Space, Public Health, and Environmental Justice: The Challenge of Making Cities ‘Just Green Enough’. Landsc. Urban Plan. 2014, 125, 234–244. [Google Scholar] [CrossRef]
- Wang, Y.; Zhao, X.; Zuo, L.; Zhang, Z.; Wang, X.; Yi, L.; Liu, F.; Xu, J. Spatial Differentiation of Land Use and Landscape Pattern Changes in the Beijing–Tianjin–Hebei Area. Sustainability 2020, 12, 3040. [Google Scholar] [CrossRef]
- Rojas, O.; Soto, E.; Rojas, C.; López, J.J. Assessment of the Flood Mitigation Ecosystem Service in a Coastal Wetland and Potential Impact of Future Urban Development in Chile. Habitat Int. 2022, 123, 102554. [Google Scholar] [CrossRef]
- Liu, Y.; Li, J.; Sun, C.; Wang, X.; Tian, P.; Chen, L.; Zhang, H.; Yang, X.; He, G. Thirty-Year Changes of the Coastlines, Wetlands, and Ecosystem Services in the Asia Major Deltas. J. Environ. Manag. 2023, 326, 116675. [Google Scholar] [CrossRef]
- Winkler, K.; Fuchs, R.; Rounsevell, M.; Herold, M. Global Land Use Changes Are Four Times Greater than Previously Estimated. Nat. Commun. 2021, 12, 2501. [Google Scholar] [CrossRef]
- Van Vliet, J. Direct and Indirect Loss of Natural Area from Urban Expansion. Nat. Sustain. 2019, 2, 755–763. [Google Scholar] [CrossRef]
- Wang, D.; Fu, J.; Xie, X.; Ding, F.; Jiang, D. Spatiotemporal Evolution of Urban-Agricultural-Ecological Space in China and Its Driving Mechanism. J. Clean. Prod. 2022, 371, 133684. [Google Scholar] [CrossRef]
- Feng, R.; Wang, F.; Wang, K.; Xu, S. Quantifying Influences of Anthropogenic-Natural Factors on Ecological Land Evolution in Mega-Urban Agglomeration: A Case Study of Guangdong-Hong Kong-Macao Greater Bay Area. J. Clean. Prod. 2021, 283, 125304. [Google Scholar] [CrossRef]
- Sun, B.; Li, Z.; Gao, W.; Zhang, Y.; Gao, Z.; Song, Z.; Qin, P.; Tian, X. Identification and Assessment of the Factors Driving Vegetation Degradation/Regeneration in Drylands Using Synthetic High Spatiotemporal Remote Sensing Data—A Case Study in Zhenglanqi, Inner Mongolia, China. Ecol. Indic. 2019, 107, 105614. [Google Scholar] [CrossRef]
- López-Barrera, F.; Manson, R.H.; Landgrave, R. Identifying Deforestation Attractors and Patterns of Fragmentation for Seasonally Dry Tropical Forest in Central Veracruz, Mexico. Land Use Policy 2014, 41, 274–283. [Google Scholar] [CrossRef]
- Deng, D.; Dong, J.; Zhang, Y.; Liang, W.; Liu, K.; Li, L. Analysis of the environmental Kuznets curve for forest fragmentation: The case of Beijing-Tianjin-Hebei region in China. For. Policy Econ. 2023, 151, 102970. [Google Scholar] [CrossRef]
- Qiu, J. China Faces up to “terrible” State of Its Ecosystems. Nature 2011, 471, 19–20. [Google Scholar] [CrossRef] [PubMed]
- Puskás, N.; Abunnasr, Y.; Naalbandian, S. Assessing Deeper Levels of Participation in Nature-Based Solutions in Urban Landscapes—A Literature Review of Real-World Cases. Landsc. Urban Plan. 2021, 210, 104065. [Google Scholar] [CrossRef]
- Nassauer, J.I.; Raskin, J. Urban Vacancy and Land Use Legacies: A Frontier for Urban Ecological Research, Design, and Planning. Landsc. Urban Plan. 2014, 125, 245–253. [Google Scholar] [CrossRef]
- Guo, L.; Shan, N.; Zhang, Y.; Sun, F.; Liu, W.; Shi, Z.; Zhang, Q. Separating the Effects of Climate Change and Human Activity on Water Use Efficiency over the Beijing-Tianjin Sand Source Region of China. Sci. Total Environ. 2019, 690, 584–595. [Google Scholar] [CrossRef]
- Mao, D.; Wang, Z.; Wu, B.; Zeng, Y.; Luo, L.; Zhang, B. Land Degradation and Restoration in the Arid and Semiarid Zones of China: Quantified Evidence and Implications from Satellites. Land Degrad. Dev. 2018, 29, 3841–3851. [Google Scholar] [CrossRef]
- Ren, Y.; Lü, Y.; Fu, B.; Comber, A.; Li, T.; Hu, J. Driving Factors of Land Change in China’s Loess Plateau: Quantification Using Geographically Weighted Regression and Management Implications. Remote Sens. 2020, 12, 453. [Google Scholar] [CrossRef]
- Li, T.; Jia, B.Q.; Liu, W.R.; Zhang, Q.M. Spatial pattern of ecological land stability analysis and influencing factor in Beijing-Tianjin-Hebei Region. Acta Ecol. Sin. 2022, 42, 9927–9944. [Google Scholar]
- Xie, H. Analysis of Regionally Ecological Land Use and Its Influencing Factors Based on a Logistic Regression Model in the Beijing-Tianjin-Hebei Region, China. Resour. Sci. 2011, 33, 2063–2070. (In Chinese) [Google Scholar]
- Niedertscheider, M.; Erb, K. Land System Change in Italy from 1884 to 2007: Analysing the North–South Divergence on the Basis of an Integrated Indicator Framework. Land Use Policy 2014, 39, 366–375. [Google Scholar] [CrossRef]
- Nguyen, H.H.; Dargusch, P.; Moss, P.; Aziz, A.A. Land-Use Change and Socio-Ecological Drivers of Wetland Conversion in Ha Tien Plain, Mekong Delta, Vietnam. Land Use Policy 2017, 64, 101–113. [Google Scholar] [CrossRef]
- Drummond, M.A.; Auch, R.F.; Karstensen, K.A.; Sayler, K.L.; Taylor, J.L.; Loveland, T.R. Land Change Variability and Human–Environment Dynamics in the United States Great Plains. Land Use Policy 2012, 29, 710–723. [Google Scholar] [CrossRef]
- Lu, Z.; Zhang, Z. Dynamics of Territorial Spatial Pattern and Landscape Impact under Different Economic Gradients: A Case Study of the Beijing-Tianjin-Hebei (BTH) Region, China. Sustainability 2023, 15, 259. [Google Scholar] [CrossRef]
- Li, D.; Yang, Y.; Xia, F.; Sun, W.; Li, X.; Xie, Y. Exploring the Influences of Different Processes of Habitat Fragmentation on Ecosystem Services. Landsc. Urban Plan. 2022, 227, 104544. [Google Scholar] [CrossRef]
- Li, Y.; Liu, W.; Feng, Q.; Zhu, M.; Yang, L.; Zhang, J.; Yin, X. The Role of Land Use Change in Affecting Ecosystem Services and the Ecological Security Pattern of the Hexi Regions, Northwest China. Sci. Total Environ. 2023, 855, 158940. [Google Scholar] [CrossRef] [PubMed]
- Xie, G.; Zhang, C.; Zhen, L.; Zhang, L. Dynamic Changes in the Value of China’s Ecosystem Services. Ecosyst. Serv. 2017, 26, 146–154. [Google Scholar] [CrossRef]
- Lian, Z.; Feng, X. Urban Green Space Pattern in Core Cities of the Greater Bay Area Based on Morphological Spatial Pattern Analysis. Sustainability 2022, 14, 12365. [Google Scholar] [CrossRef]
- Peng, S. High-Spatial-Resolution Monthly Temperatures Dataset over China during 1901–2017. Earth Syst. Sci. Data 2019, 11, 1931–1946. [Google Scholar] [CrossRef]
- Niu, L.; Zhang, Z.; Liang, Y.; van Vliet, J. Spatiotemporal Patterns and Drivers of the Urban Air Pollution Island Effect for 2273 Cities in China. Environ. Int. 2024, 184, 108455. [Google Scholar] [CrossRef]
- Zhang, X.; Fan, H.; Sun, L.; Liu, W.; Wang, C.; Wu, Z.; Lv, T. Identifying Regional Eco-Environment Quality and Its Influencing Factors: A Case Study of an Ecological Civilization Pilot Zone in China. J. Clean. Prod. 2024, 435, 140308. [Google Scholar] [CrossRef]
- Astell-Burt, T.; Hartig, T.; Putra, I.G.N.E.; Walsan, R.; Dendup, T.; Feng, X. Green Space and Loneliness: A Systematic Review with Theoretical and Methodological Guidance for Future Research. Sci. Total Environ. 2022, 847, 157521. [Google Scholar] [CrossRef] [PubMed]
- Yang, Z.; Sun, C.; Ye, J.; Gan, C.; Li, Y.; Wang, L.; Chen, Y. Spatio-Temporal Heterogeneity of Ecological Quality in Hangzhou Greater Bay Area (HGBA) of China and Response to Land Use and Cover Change. Remote Sens. 2022, 14, 5613. [Google Scholar] [CrossRef]
Disclaimer/Publisher’s Note: The statements, opinions and data contained in all publications are solely those of the individual author(s) and contributor(s) and not of MDPI and/or the editor(s). MDPI and/or the editor(s) disclaim responsibility for any injury to people or property resulting from any ideas, methods, instructions or products referred to in the content. |
© 2024 by the authors. Licensee MDPI, Basel, Switzerland. This article is an open access article distributed under the terms and conditions of the Creative Commons Attribution (CC BY) license (https://creativecommons.org/licenses/by/4.0/).